global m&a market review - bloomberg … volume and adviser market share for any regional...
TRANSCRIPT

GLOBALM&A MARKET REVIEWFINANCIAL RANKINGS
2016

CONTENTS
1. Introduction2. Global M&A Heat Map3. Global M&A Regional Review4. Global M&A League Tables5. Americas M&A Regional Review6. Americas M&A League Tables8. EMEA M&A Regional Review9. EMEA M&A League Tables12. APAC M&A Regional Review13. APAC M&A League Tables16. Disclaimer
DATA SUBMISSIONS AND QUERIES
Contact Phone Email
North America Meaghan Burke +1-646-324-1537 [email protected]
EMEA Madeeha Ahmad +44-20-3525-3754 [email protected]
Asia Pacific Ee Wen Tay +65-6231-3404 [email protected]
General M&A queries may be submitted to: [email protected], [email protected], [email protected]
The Bloomberg M&A Advisory League Tables are the definitive publication of M&A advisory rankings. The tables represent the top financial and legal advisors across a broad array of deal types, regions, and industry sectors. The rankings data is comprised of mergers, acquisitions, divestitures, spin-offs, debt-for-equity-swaps, joint ventures, private placements of common equity and convertible securities, and the cash injection component of recapitalization according to Bloomberg standards.
Bloomberg M&A delivers real-time coverage of the M&A market from nine countries around the world. We provide a global perspective and local insight into unique deal structures in various markets through a network of over 800 financial and legal advisory firms, ensuring an accurate reflection of key market trends. Our quarterly league table rankings are a leading benchmark for legal and financial advisory performance, and our Bloomberg Brief newsletter provides summary highlights of weekly M&A activity and top deal trends.
Visit {NI LEAG CRL <GO>} to download copies of the final release and a full range of market specific league table results. On the web, visit: http://www.bloomberg.com/professional/solutions/investment-banking/.
Due to the dynamic nature of the Professional Service product, league table rankings may vary between this release and data found on the Bloomberg Professional Service.
2016
GLOBAL M&A FINANCIAL ADVISORY RANKINGS
©2016 Bloomberg Finance L.P. All rights reserved.
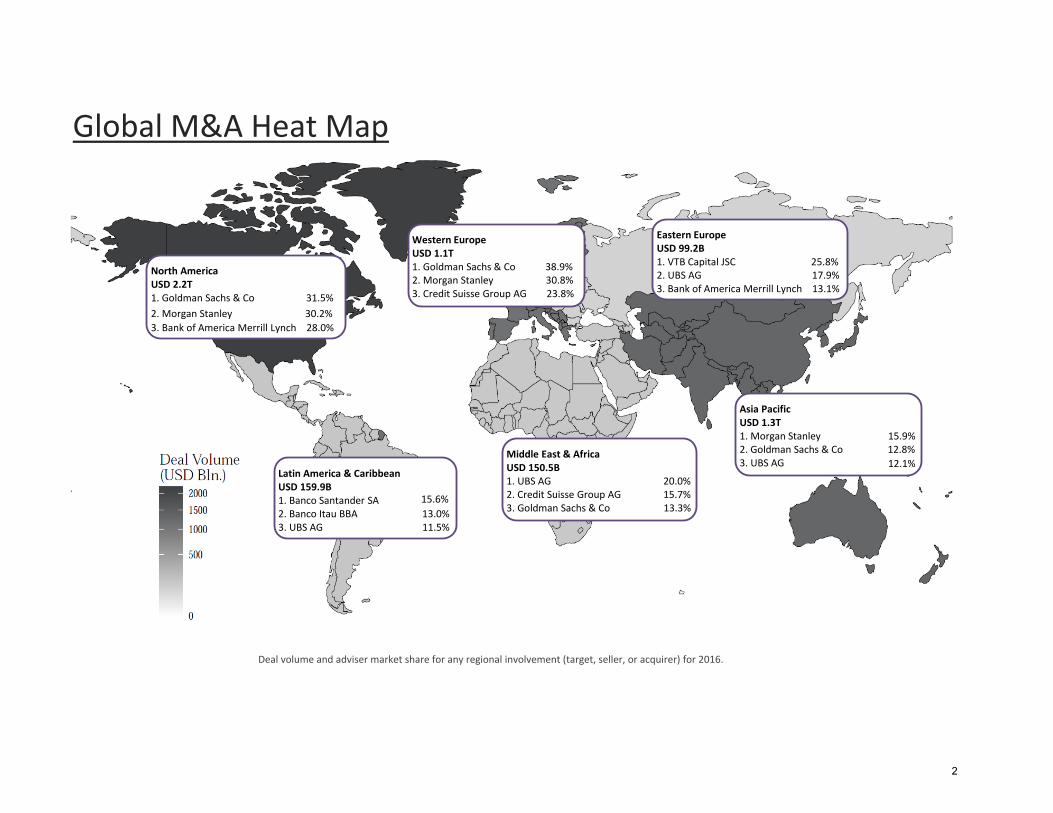
Global M&A Heat Map
Deal volume and adviser market share for any regional involvement (target, seller, or acquirer) for 2016.
Eastern EuropeUSD 99.2B1. VTB Capital JSC 25.8%2. UBS AG 17.9%3. Bank of America Merrill Lynch 13.1%
Asia PacificUSD 1.3T1. Morgan Stanley 15.9%2. Goldman Sachs & Co 12.8%3. UBS AG 12.1%
Western EuropeUSD 1.1T1. Goldman Sachs & Co 38.9%2. Morgan Stanley 30.8%3. Credit Suisse Group AG 23.8%
Latin America & CaribbeanUSD 159.9B1. Banco Santander SA 15.6%
2. Banco Itau BBA 13.0%3. UBS AG 11.5%
Middle East & AfricaUSD 150.5B1. UBS AG 20.0%2. Credit Suisse Group AG 15.7%3. Goldman Sachs & Co 13.3%
North AmericaUSD 2.2T1. Goldman Sachs & Co 31.5%
2. Morgan Stanley 30.2%
3. Bank of America Merrill Lynch 28.0%
2

Date
Total Value
(Mln.)
Amount
(Bln.) % of Total
% YoY
Change
Number of deals 39,664 Financial $696.4 19.1% -15.3%
Volume (Bln.) $3,591.0 Consumer Non-cyclical $568.2 15.6% -38.6%
Avg Deal Size (Mln.) $90.5 Communications $415.0 11.4% -5.0%
Consumer Cyclical $360.2 9.9% 14.5%
Energy $357.2 9.8% -3.7%
Goldman Sachs & Co Technology $346.6 9.5% 0.4%
Number of deals 309 Industrial $338.4 9.3% -23.4%
Volume (Bln.) $876.3 Basic Materials $321.5 8.8% 50.2%
Avg Deal Size (Bln.) $2.8 Utilities $202.5 5.6% 87.9%
Diversified $39.7 1.1% -46.0%
Amount
(Bln.)
% Change
Deal Count
% Change
Volume
Company Takeover $2,269.7 -0.5% -12.3%
Cross Border $1,584.9 2.5% -0.3%
Private Equity $735.6 -1.9% -9.4%
Asset Sale $566.2 5.7% -13.8%
Tender Offer $335.3 3.2% 55.5%
Venture Capital $115.0 -5.8% -2.7%
Spin-off $68.4 -5.3% -35.2%
Minority Purchase $390.2 2.1% 4.4%
Majority Purchase $268.9 -0.9% 17.8%
Quarterly Volume represents any involvement (target, seller, or acquirer).
Deal Type
Global M&A: Deal Type Breakdown
Sunoco Logistics Partners LP
-
10/22/2016 $107,130.8
5/18/2016 $65,695.7Monsanto Co Bayer AG -
2/3/2016
Top Adviser
$46,311.7Syngenta AG China National Chemical Corp -
-Energy Transfer Partners LP
10/21/2016 $58,256.1
11/21/2016 $51,381.6
Reynolds American Inc British American Tobacco PLC
Global M&A: Industry Breakdown
Glo
bal
M&
A R
evie
w |
20
16
Global M&A Regional Review Global M&A: Premium Breakdown
Global M&A: Highlights of 2016
Summary IndustryAcquirerTarget Seller
Time Warner Inc AT&T Inc -
Global M&A: Quarterly Volume
0
2,000
4,000
6,000
8,000
10,000
12,000
$0
$200
$400
$600
$800
$1,000
$1,200
$1,400
2011 Q4 2012 Q4 2013 Q4 2014 Q4 2015 Q4 2016 Q4
Volume $(Bln.) Deal Count
18%
29%44%
5%2% 2%
0-10%
10-25%
25-50%
50-75%
75-100%
100%+
• Global merger and acquisition activity reached $3.6 trillion, representing a 10.5% decrease year-on-year. October deal-making reached a record high monthly volume of $505.8 billion. AT&T Inc’s acquisition of Time Warner Inc for $107.1 billion was the largest deal for both the month and year.
• The financial sector continued to be the most targeted with $696.4 billion in announced transactions,accounting for 19.1% of the total global volume for the year. The basic materials sector experienced the most growth with $321.5 billion in deal activity, a 51.3% increase from 2015. Bayer AG’s announced bid for Monsanto Co contributed $65.7 billion to the basic materials sector’s total.
• Deals with announced transaction values of over $1.0 billion accounted for 63.8% of the total deal activity in 2016. The consumer, non-cyclical sector was the most sought-after for mega-deals, contributing $357.5 billion to the total volume.
3
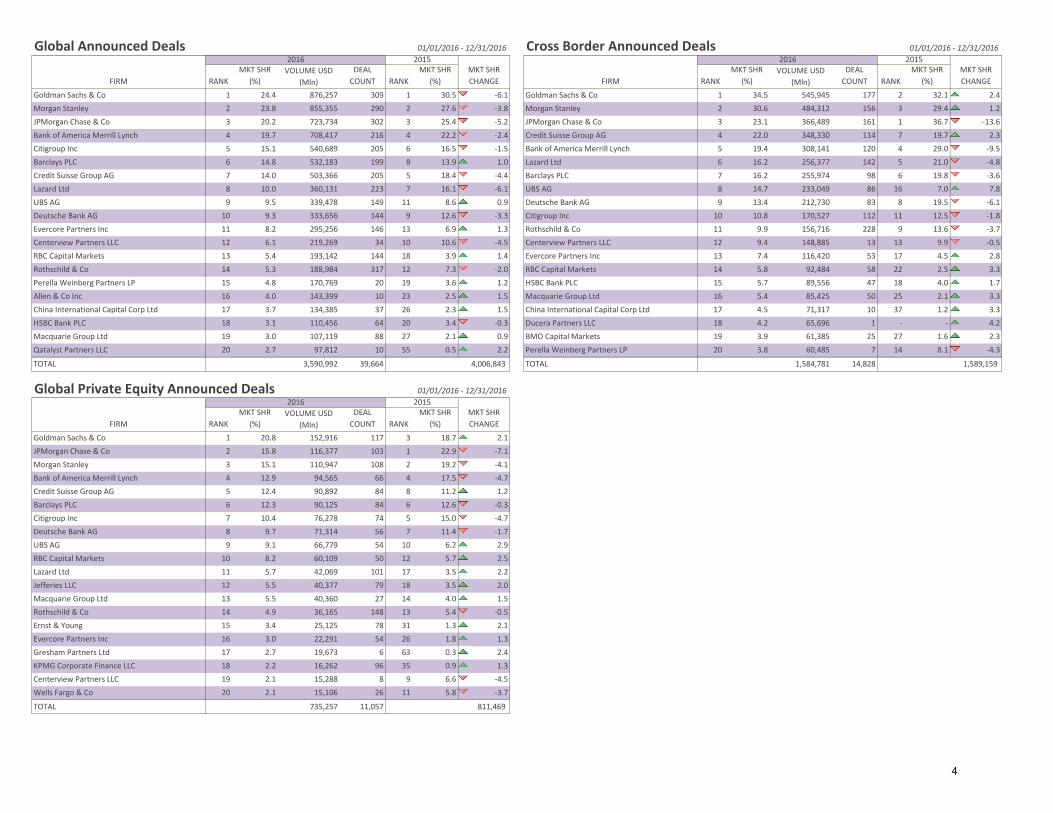
Global Announced Deals 01/01/2016 - 12/31/2016 Cross Border Announced Deals 01/01/2016 - 12/31/2016
Goldman Sachs & Co 1 24.4 876,257 309 1 30.5 -6.1 Goldman Sachs & Co 1 34.5 545,945 177 2 32.1 2.4
Morgan Stanley 2 23.8 855,355 290 2 27.6 -3.8 Morgan Stanley 2 30.6 484,312 156 3 29.4 1.2
JPMorgan Chase & Co 3 20.2 723,734 302 3 25.4 -5.2 JPMorgan Chase & Co 3 23.1 366,489 161 1 36.7 -13.6
Bank of America Merrill Lynch 4 19.7 708,417 216 4 22.2 -2.4 Credit Suisse Group AG 4 22.0 348,330 114 7 19.7 2.3
Citigroup Inc 5 15.1 540,689 205 6 16.5 -1.5 Bank of America Merrill Lynch 5 19.4 308,141 120 4 29.0 -9.5
Barclays PLC 6 14.8 532,183 199 8 13.9 1.0 Lazard Ltd 6 16.2 256,377 142 5 21.0 -4.8
Credit Suisse Group AG 7 14.0 503,366 205 5 18.4 -4.4 Barclays PLC 7 16.2 255,974 98 6 19.8 -3.6
Lazard Ltd 8 10.0 360,131 223 7 16.1 -6.1 UBS AG 8 14.7 233,049 86 16 7.0 7.8
UBS AG 9 9.5 339,478 149 11 8.6 0.9 Deutsche Bank AG 9 13.4 212,730 83 8 19.5 -6.1
Deutsche Bank AG 10 9.3 333,656 144 9 12.6 -3.3 Citigroup Inc 10 10.8 170,527 112 11 12.5 -1.8
Evercore Partners Inc 11 8.2 295,256 146 13 6.9 1.3 Rothschild & Co 11 9.9 156,716 228 9 13.6 -3.7
Centerview Partners LLC 12 6.1 219,269 34 10 10.6 -4.5 Centerview Partners LLC 12 9.4 148,885 13 13 9.9 -0.5
RBC Capital Markets 13 5.4 193,142 144 18 3.9 1.4 Evercore Partners Inc 13 7.4 116,420 53 17 4.5 2.8
Rothschild & Co 14 5.3 188,984 317 12 7.3 -2.0 RBC Capital Markets 14 5.8 92,484 58 22 2.5 3.3
Perella Weinberg Partners LP 15 4.8 170,769 20 19 3.6 1.2 HSBC Bank PLC 15 5.7 89,556 47 18 4.0 1.7
Allen & Co Inc 16 4.0 143,399 10 23 2.5 1.5 Macquarie Group Ltd 16 5.4 85,425 50 25 2.1 3.3
China International Capital Corp Ltd 17 3.7 134,385 37 26 2.3 1.5 China International Capital Corp Ltd 17 4.5 71,317 10 37 1.2 3.3
HSBC Bank PLC 18 3.1 110,456 64 20 3.4 -0.3 Ducera Partners LLC 18 4.2 65,696 1 - - 4.2
Macquarie Group Ltd 19 3.0 107,119 88 27 2.1 0.9 BMO Capital Markets 19 3.9 61,385 25 27 1.6 2.3
Qatalyst Partners LLC 20 2.7 97,812 10 55 0.5 2.2 Perella Weinberg Partners LP 20 3.8 60,485 7 14 8.1 -4.3
TOTAL 3,590,992 39,664 TOTAL 1,584,781 14,828
Global Private Equity Announced Deals 01/01/2016 - 12/31/2016
Goldman Sachs & Co 1 20.8 152,916 117 3 18.7 2.1
JPMorgan Chase & Co 2 15.8 116,377 103 1 22.9 -7.1
Morgan Stanley 3 15.1 110,947 108 2 19.2 -4.1
Bank of America Merrill Lynch 4 12.9 94,565 66 4 17.5 -4.7
Credit Suisse Group AG 5 12.4 90,892 84 8 11.2 1.2
Barclays PLC 6 12.3 90,125 84 6 12.6 -0.3
Citigroup Inc 7 10.4 76,278 74 5 15.0 -4.7
Deutsche Bank AG 8 9.7 71,314 56 7 11.4 -1.7
UBS AG 9 9.1 66,779 54 10 6.2 2.9
RBC Capital Markets 10 8.2 60,109 50 12 5.7 2.5
Lazard Ltd 11 5.7 42,069 101 17 3.5 2.2
Jefferies LLC 12 5.5 40,377 79 18 3.5 2.0
Macquarie Group Ltd 13 5.5 40,360 27 14 4.0 1.5
Rothschild & Co 14 4.9 36,165 148 13 5.4 -0.5
Ernst & Young 15 3.4 25,125 78 31 1.3 2.1
Evercore Partners Inc 16 3.0 22,291 54 26 1.8 1.3
Gresham Partners Ltd 17 2.7 19,673 6 63 0.3 2.4
KPMG Corporate Finance LLC 18 2.2 16,262 96 35 0.9 1.3
Centerview Partners LLC 19 2.1 15,288 8 9 6.6 -4.5
Wells Fargo & Co 20 2.1 15,106 26 11 5.8 -3.7
TOTAL 735,257 11,057
1,589,159
FIRM
2016 2015MKT SHR
CHANGE
FIRM
RANK
MKT SHR
(%)VOLUME USD
(Mln)
DEAL
COUNT RANK
MKT SHR
(%)
4,006,843
2015MKT SHR
CHANGERANK
MKT SHR
(%)VOLUME USD
(Mln)
DEAL
COUNT RANK
MKT SHR
(%) RANK
2016 2015MKT SHR
CHANGE FIRM
2016MKT SHR
(%)VOLUME USD
(Mln)
DEAL
COUNT RANK
MKT SHR
(%)
811,469
4
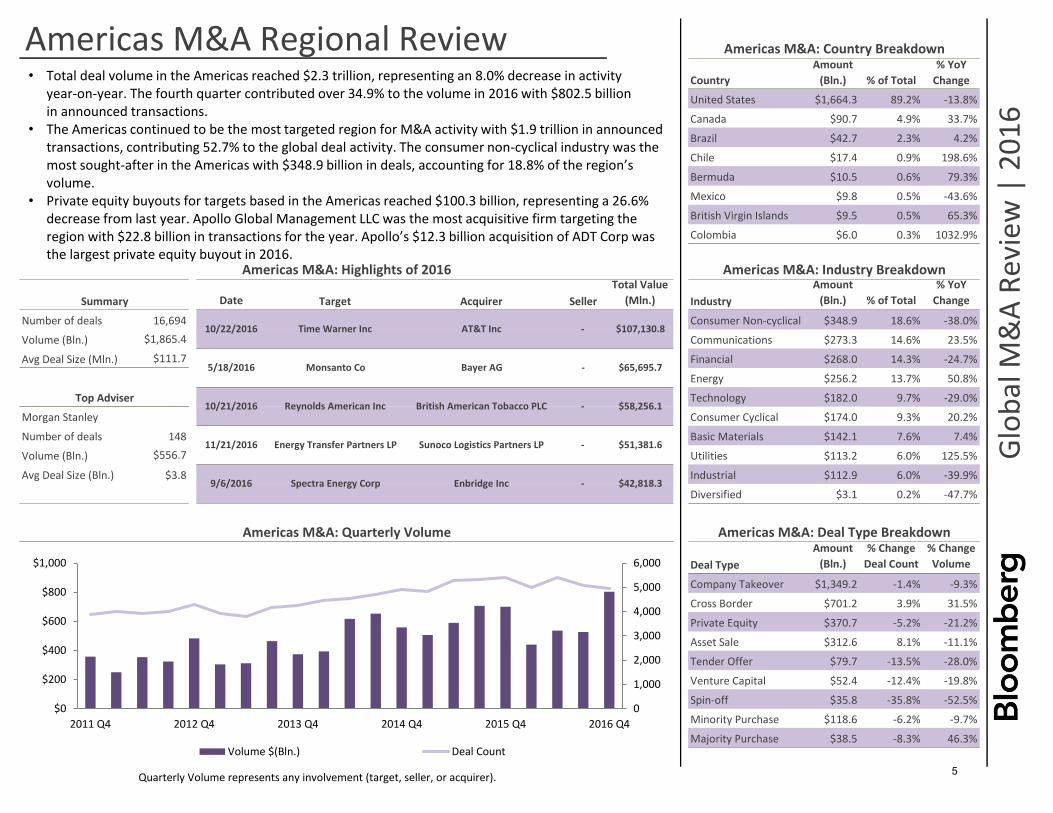
Country
United States $1,664.3 89.2% -13.8%
Canada $90.7 4.9% 33.7%
Brazil $42.7 2.3% 4.2%
Chile $17.4 0.9% 198.6%
Bermuda $10.5 0.6% 79.3%
Mexico $9.8 0.5% -43.6%
British Virgin Islands $9.5 0.5% 65.3%
Colombia $6.0 0.3% 1032.9%
Date
Total Value
(Mln.)
Amount
(Bln.) % of Total
% YoY
Change
Number of deals 16,694 Consumer Non-cyclical $348.9 18.6% -38.0%
Volume (Bln.) $1,865.4 Communications $273.3 14.6% 23.5%
Avg Deal Size (Mln.) $111.7 Financial $268.0 14.3% -24.7%
Energy $256.2 13.7% 50.8%
Technology $182.0 9.7% -29.0%
Morgan Stanley Consumer Cyclical $174.0 9.3% 20.2%
Number of deals 148 Basic Materials $142.1 7.6% 7.4%
Volume (Bln.) $556.7 Utilities $113.2 6.0% 125.5%
Avg Deal Size (Bln.) $3.8 Industrial $112.9 6.0% -39.9%
Diversified $3.1 0.2% -47.7%
Amount
(Bln.)
% Change
Deal Count
% Change
Volume
Company Takeover $1,349.2 -1.4% -9.3%
Cross Border $701.2 3.9% 31.5%
Private Equity $370.7 -5.2% -21.2%
Asset Sale $312.6 8.1% -11.1%
Tender Offer $79.7 -13.5% -28.0%
Venture Capital $52.4 -12.4% -19.8%
Spin-off $35.8 -35.8% -52.5%
Minority Purchase $118.6 -6.2% -9.7%
Majority Purchase $38.5 -8.3% 46.3%
Quarterly Volume represents any involvement (target, seller, or acquirer).
Americas M&A: Quarterly Volume Americas M&A: Deal Type Breakdown
Deal Type
9/6/2016 Spectra Energy Corp Enbridge Inc - $42,818.3
11/21/2016 Energy Transfer Partners LP Sunoco Logistics Partners LP - $51,381.6
Amount
(Bln.) % of Total
% YoY
Change
Top Adviser10/21/2016 Reynolds American Inc British American Tobacco PLC - $58,256.1
5/18/2016 Monsanto Co Bayer AG - $65,695.7
Glo
bal
M&
A R
evi
ew |
20
16
10/22/2016 Time Warner Inc AT&T Inc - $107,130.8
Americas M&A Regional Review Americas M&A: Country Breakdown
Americas M&A: Highlights of 2016
Summary Target Acquirer Seller Industry
Americas M&A: Industry Breakdown
0
1,000
2,000
3,000
4,000
5,000
6,000
$0
$200
$400
$600
$800
$1,000
2011 Q4 2012 Q4 2013 Q4 2014 Q4 2015 Q4 2016 Q4
Volume $(Bln.) Deal Count
• Total deal volume in the Americas reached $2.3 trillion, representing an 8.0% decrease in activity year-on-year. The fourth quarter contributed over 34.9% to the volume in 2016 with $802.5 billion in announced transactions.
• The Americas continued to be the most targeted region for M&A activity with $1.9 trillion in announcedtransactions, contributing 52.7% to the global deal activity. The consumer non-cyclical industry was themost sought-after in the Americas with $348.9 billion in deals, accounting for 18.8% of the region’svolume.
• Private equity buyouts for targets based in the Americas reached $100.3 billion, representing a 26.6%decrease from last year. Apollo Global Management LLC was the most acquisitive firm targeting theregion with $22.8 billion in transactions for the year. Apollo’s $12.3 billion acquisition of ADT Corp wasthe largest private equity buyout in 2016.
5
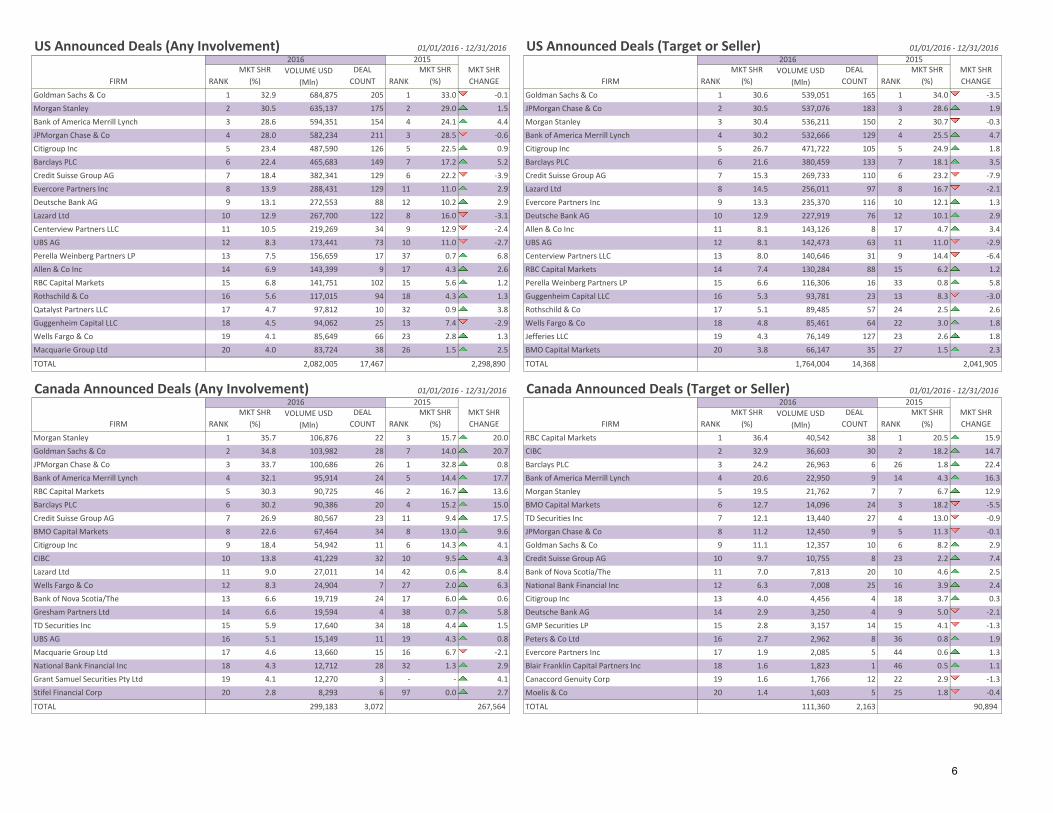
US Announced Deals (Any Involvement) 01/01/2016 - 12/31/2016 US Announced Deals (Target or Seller) 01/01/2016 - 12/31/2016
Goldman Sachs & Co 1 32.9 684,875 205 1 33.0 -0.1 Goldman Sachs & Co 1 30.6 539,051 165 1 34.0 -3.5
Morgan Stanley 2 30.5 635,137 175 2 29.0 1.5 JPMorgan Chase & Co 2 30.5 537,076 183 3 28.6 1.9
Bank of America Merrill Lynch 3 28.6 594,351 154 4 24.1 4.4 Morgan Stanley 3 30.4 536,211 150 2 30.7 -0.3
JPMorgan Chase & Co 4 28.0 582,234 211 3 28.5 -0.6 Bank of America Merrill Lynch 4 30.2 532,666 129 4 25.5 4.7
Citigroup Inc 5 23.4 487,590 126 5 22.5 0.9 Citigroup Inc 5 26.7 471,722 105 5 24.9 1.8
Barclays PLC 6 22.4 465,683 149 7 17.2 5.2 Barclays PLC 6 21.6 380,459 133 7 18.1 3.5
Credit Suisse Group AG 7 18.4 382,341 129 6 22.2 -3.9 Credit Suisse Group AG 7 15.3 269,733 110 6 23.2 -7.9
Evercore Partners Inc 8 13.9 288,431 129 11 11.0 2.9 Lazard Ltd 8 14.5 256,011 97 8 16.7 -2.1
Deutsche Bank AG 9 13.1 272,553 88 12 10.2 2.9 Evercore Partners Inc 9 13.3 235,370 116 10 12.1 1.3
Lazard Ltd 10 12.9 267,700 122 8 16.0 -3.1 Deutsche Bank AG 10 12.9 227,919 76 12 10.1 2.9
Centerview Partners LLC 11 10.5 219,269 34 9 12.9 -2.4 Allen & Co Inc 11 8.1 143,126 8 17 4.7 3.4
UBS AG 12 8.3 173,441 73 10 11.0 -2.7 UBS AG 12 8.1 142,473 63 11 11.0 -2.9
Perella Weinberg Partners LP 13 7.5 156,659 17 37 0.7 6.8 Centerview Partners LLC 13 8.0 140,646 31 9 14.4 -6.4
Allen & Co Inc 14 6.9 143,399 9 17 4.3 2.6 RBC Capital Markets 14 7.4 130,284 88 15 6.2 1.2
RBC Capital Markets 15 6.8 141,751 102 15 5.6 1.2 Perella Weinberg Partners LP 15 6.6 116,306 16 33 0.8 5.8
Rothschild & Co 16 5.6 117,015 94 18 4.3 1.3 Guggenheim Capital LLC 16 5.3 93,781 23 13 8.3 -3.0
Qatalyst Partners LLC 17 4.7 97,812 10 32 0.9 3.8 Rothschild & Co 17 5.1 89,485 57 24 2.5 2.6
Guggenheim Capital LLC 18 4.5 94,062 25 13 7.4 -2.9 Wells Fargo & Co 18 4.8 85,461 64 22 3.0 1.8
Wells Fargo & Co 19 4.1 85,649 66 23 2.8 1.3 Jefferies LLC 19 4.3 76,149 127 23 2.6 1.8
Macquarie Group Ltd 20 4.0 83,724 38 26 1.5 2.5 BMO Capital Markets 20 3.8 66,147 35 27 1.5 2.3
TOTAL 2,082,005 17,467 TOTAL 1,764,004 14,368
Canada Announced Deals (Any Involvement) 01/01/2016 - 12/31/2016 Canada Announced Deals (Target or Seller) 01/01/2016 - 12/31/2016
Morgan Stanley 1 35.7 106,876 22 3 15.7 20.0 RBC Capital Markets 1 36.4 40,542 38 1 20.5 15.9
Goldman Sachs & Co 2 34.8 103,982 28 7 14.0 20.7 CIBC 2 32.9 36,603 30 2 18.2 14.7
JPMorgan Chase & Co 3 33.7 100,686 26 1 32.8 0.8 Barclays PLC 3 24.2 26,963 6 26 1.8 22.4
Bank of America Merrill Lynch 4 32.1 95,914 24 5 14.4 17.7 Bank of America Merrill Lynch 4 20.6 22,950 9 14 4.3 16.3
RBC Capital Markets 5 30.3 90,725 46 2 16.7 13.6 Morgan Stanley 5 19.5 21,762 7 7 6.7 12.9
Barclays PLC 6 30.2 90,386 20 4 15.2 15.0 BMO Capital Markets 6 12.7 14,096 24 3 18.2 -5.5
Credit Suisse Group AG 7 26.9 80,567 23 11 9.4 17.5 TD Securities Inc 7 12.1 13,440 27 4 13.0 -0.9
BMO Capital Markets 8 22.6 67,464 34 8 13.0 9.6 JPMorgan Chase & Co 8 11.2 12,450 9 5 11.3 -0.1
Citigroup Inc 9 18.4 54,942 11 6 14.3 4.1 Goldman Sachs & Co 9 11.1 12,357 10 6 8.2 2.9
CIBC 10 13.8 41,229 32 10 9.5 4.3 Credit Suisse Group AG 10 9.7 10,755 8 23 2.2 7.4
Lazard Ltd 11 9.0 27,011 14 42 0.6 8.4 Bank of Nova Scotia/The 11 7.0 7,813 20 10 4.6 2.5
Wells Fargo & Co 12 8.3 24,904 7 27 2.0 6.3 National Bank Financial Inc 12 6.3 7,008 25 16 3.9 2.4
Bank of Nova Scotia/The 13 6.6 19,719 24 17 6.0 0.6 Citigroup Inc 13 4.0 4,456 4 18 3.7 0.3
Gresham Partners Ltd 14 6.6 19,594 4 38 0.7 5.8 Deutsche Bank AG 14 2.9 3,250 4 9 5.0 -2.1
TD Securities Inc 15 5.9 17,640 34 18 4.4 1.5 GMP Securities LP 15 2.8 3,157 14 15 4.1 -1.3
UBS AG 16 5.1 15,149 11 19 4.3 0.8 Peters & Co Ltd 16 2.7 2,962 8 36 0.8 1.9
Macquarie Group Ltd 17 4.6 13,660 15 16 6.7 -2.1 Evercore Partners Inc 17 1.9 2,085 5 44 0.6 1.3
National Bank Financial Inc 18 4.3 12,712 28 32 1.3 2.9 Blair Franklin Capital Partners Inc 18 1.6 1,823 1 46 0.5 1.1
Grant Samuel Securities Pty Ltd 19 4.1 12,270 3 - - 4.1 Canaccord Genuity Corp 19 1.6 1,766 12 22 2.9 -1.3
Stifel Financial Corp 20 2.8 8,293 6 97 0.0 2.7 Moelis & Co 20 1.4 1,603 5 25 1.8 -0.4
TOTAL 299,183 3,072 TOTAL 111,360 2,163
FIRM
2016 2015MKT SHR
CHANGE FIRM
2016 2015MKT SHR
CHANGERANK
MKT SHR
(%)VOLUME USD
(Mln)
DEAL
COUNT RANK
MKT SHR
(%) RANK
MKT SHR
(%)VOLUME USD
(Mln)
DEAL
COUNT RANK
MKT SHR
(%)
RANK
MKT SHR
(%)VOLUME USD
(Mln)
DEAL
COUNT RANK
MKT SHR
(%) RANK
MKT SHR
(%)
DEAL
COUNT RANK
MKT SHR
(%)FIRM
2016 2015MKT SHR
CHANGE FIRM
2016 2015
VOLUME USD
(Mln)
MKT SHR
CHANGE
2,298,890 2,041,905
267,564 90,894
6
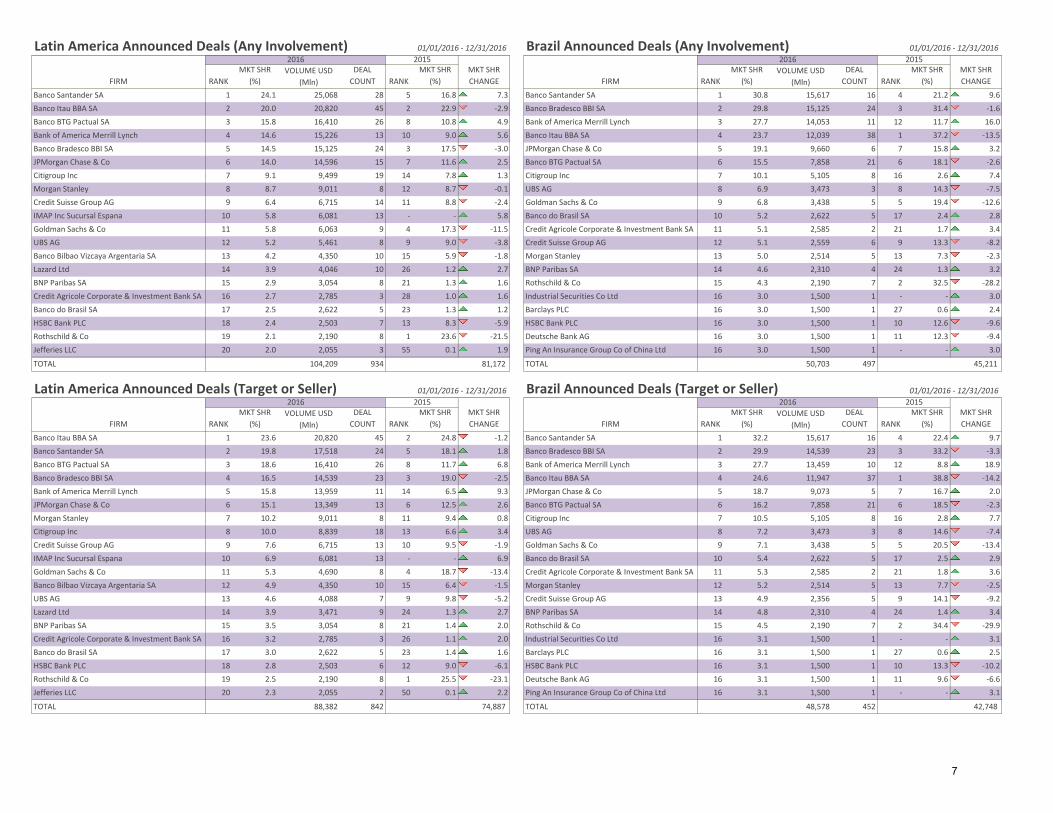
Latin America Announced Deals (Any Involvement) 01/01/2016 - 12/31/2016 Brazil Announced Deals (Any Involvement) 01/01/2016 - 12/31/2016
Banco Santander SA 1 24.1 25,068 28 5 16.8 7.3 Banco Santander SA 1 30.8 15,617 16 4 21.2 9.6
Banco Itau BBA SA 2 20.0 20,820 45 2 22.9 -2.9 Banco Bradesco BBI SA 2 29.8 15,125 24 3 31.4 -1.6
Banco BTG Pactual SA 3 15.8 16,410 26 8 10.8 4.9 Bank of America Merrill Lynch 3 27.7 14,053 11 12 11.7 16.0
Bank of America Merrill Lynch 4 14.6 15,226 13 10 9.0 5.6 Banco Itau BBA SA 4 23.7 12,039 38 1 37.2 -13.5
Banco Bradesco BBI SA 5 14.5 15,125 24 3 17.5 -3.0 JPMorgan Chase & Co 5 19.1 9,660 6 7 15.8 3.2
JPMorgan Chase & Co 6 14.0 14,596 15 7 11.6 2.5 Banco BTG Pactual SA 6 15.5 7,858 21 6 18.1 -2.6
Citigroup Inc 7 9.1 9,499 19 14 7.8 1.3 Citigroup Inc 7 10.1 5,105 8 16 2.6 7.4
Morgan Stanley 8 8.7 9,011 8 12 8.7 -0.1 UBS AG 8 6.9 3,473 3 8 14.3 -7.5
Credit Suisse Group AG 9 6.4 6,715 14 11 8.8 -2.4 Goldman Sachs & Co 9 6.8 3,438 5 5 19.4 -12.6
IMAP Inc Sucursal Espana 10 5.8 6,081 13 - - 5.8 Banco do Brasil SA 10 5.2 2,622 5 17 2.4 2.8
Goldman Sachs & Co 11 5.8 6,063 9 4 17.3 -11.5 Credit Agricole Corporate & Investment Bank SA 11 5.1 2,585 2 21 1.7 3.4
UBS AG 12 5.2 5,461 8 9 9.0 -3.8 Credit Suisse Group AG 12 5.1 2,559 6 9 13.3 -8.2
Banco Bilbao Vizcaya Argentaria SA 13 4.2 4,350 10 15 5.9 -1.8 Morgan Stanley 13 5.0 2,514 5 13 7.3 -2.3
Lazard Ltd 14 3.9 4,046 10 26 1.2 2.7 BNP Paribas SA 14 4.6 2,310 4 24 1.3 3.2
BNP Paribas SA 15 2.9 3,054 8 21 1.3 1.6 Rothschild & Co 15 4.3 2,190 7 2 32.5 -28.2
Credit Agricole Corporate & Investment Bank SA 16 2.7 2,785 3 28 1.0 1.6 Industrial Securities Co Ltd 16 3.0 1,500 1 - - 3.0
Banco do Brasil SA 17 2.5 2,622 5 23 1.3 1.2 Barclays PLC 16 3.0 1,500 1 27 0.6 2.4
HSBC Bank PLC 18 2.4 2,503 7 13 8.3 -5.9 HSBC Bank PLC 16 3.0 1,500 1 10 12.6 -9.6
Rothschild & Co 19 2.1 2,190 8 1 23.6 -21.5 Deutsche Bank AG 16 3.0 1,500 1 11 12.3 -9.4
Jefferies LLC 20 2.0 2,055 3 55 0.1 1.9 Ping An Insurance Group Co of China Ltd 16 3.0 1,500 1 - - 3.0
TOTAL 104,209 934 TOTAL 50,703 497
Latin America Announced Deals (Target or Seller) 01/01/2016 - 12/31/2016 Brazil Announced Deals (Target or Seller) 01/01/2016 - 12/31/2016
Banco Itau BBA SA 1 23.6 20,820 45 2 24.8 -1.2 Banco Santander SA 1 32.2 15,617 16 4 22.4 9.7
Banco Santander SA 2 19.8 17,518 24 5 18.1 1.8 Banco Bradesco BBI SA 2 29.9 14,539 23 3 33.2 -3.3
Banco BTG Pactual SA 3 18.6 16,410 26 8 11.7 6.8 Bank of America Merrill Lynch 3 27.7 13,459 10 12 8.8 18.9
Banco Bradesco BBI SA 4 16.5 14,539 23 3 19.0 -2.5 Banco Itau BBA SA 4 24.6 11,947 37 1 38.8 -14.2
Bank of America Merrill Lynch 5 15.8 13,959 11 14 6.5 9.3 JPMorgan Chase & Co 5 18.7 9,073 5 7 16.7 2.0
JPMorgan Chase & Co 6 15.1 13,349 13 6 12.5 2.6 Banco BTG Pactual SA 6 16.2 7,858 21 6 18.5 -2.3
Morgan Stanley 7 10.2 9,011 8 11 9.4 0.8 Citigroup Inc 7 10.5 5,105 8 16 2.8 7.7
Citigroup Inc 8 10.0 8,839 18 13 6.6 3.4 UBS AG 8 7.2 3,473 3 8 14.6 -7.4
Credit Suisse Group AG 9 7.6 6,715 13 10 9.5 -1.9 Goldman Sachs & Co 9 7.1 3,438 5 5 20.5 -13.4
IMAP Inc Sucursal Espana 10 6.9 6,081 13 - - 6.9 Banco do Brasil SA 10 5.4 2,622 5 17 2.5 2.9
Goldman Sachs & Co 11 5.3 4,690 8 4 18.7 -13.4 Credit Agricole Corporate & Investment Bank SA 11 5.3 2,585 2 21 1.8 3.6
Banco Bilbao Vizcaya Argentaria SA 12 4.9 4,350 10 15 6.4 -1.5 Morgan Stanley 12 5.2 2,514 5 13 7.7 -2.5
UBS AG 13 4.6 4,088 7 9 9.8 -5.2 Credit Suisse Group AG 13 4.9 2,356 5 9 14.1 -9.2
Lazard Ltd 14 3.9 3,471 9 24 1.3 2.7 BNP Paribas SA 14 4.8 2,310 4 24 1.4 3.4
BNP Paribas SA 15 3.5 3,054 8 21 1.4 2.0 Rothschild & Co 15 4.5 2,190 7 2 34.4 -29.9
Credit Agricole Corporate & Investment Bank SA 16 3.2 2,785 3 26 1.1 2.0 Industrial Securities Co Ltd 16 3.1 1,500 1 - - 3.1
Banco do Brasil SA 17 3.0 2,622 5 23 1.4 1.6 Barclays PLC 16 3.1 1,500 1 27 0.6 2.5
HSBC Bank PLC 18 2.8 2,503 6 12 9.0 -6.1 HSBC Bank PLC 16 3.1 1,500 1 10 13.3 -10.2
Rothschild & Co 19 2.5 2,190 8 1 25.5 -23.1 Deutsche Bank AG 16 3.1 1,500 1 11 9.6 -6.6
Jefferies LLC 20 2.3 2,055 2 50 0.1 2.2 Ping An Insurance Group Co of China Ltd 16 3.1 1,500 1 - - 3.1
TOTAL 88,382 842 TOTAL 48,578 452
FIRM
2016 2015MKT SHR
CHANGE FIRM
2016 2015MKT SHR
CHANGERANK
MKT SHR
(%)VOLUME USD
(Mln)
DEAL
COUNT RANK
MKT SHR
(%) RANK
MKT SHR
(%)VOLUME USD
(Mln)
DEAL
COUNT RANK
MKT SHR
(%)
81,172 45,211
74,887 42,748
FIRM
2016 2015MKT SHR
CHANGE FIRM
2016 2015MKT SHR
CHANGERANK
MKT SHR
(%)VOLUME USD
(Mln)
DEAL
COUNT RANK
MKT SHR
(%) RANK
MKT SHR
(%)VOLUME USD
(Mln)
DEAL
COUNT RANK
MKT SHR
(%)
7
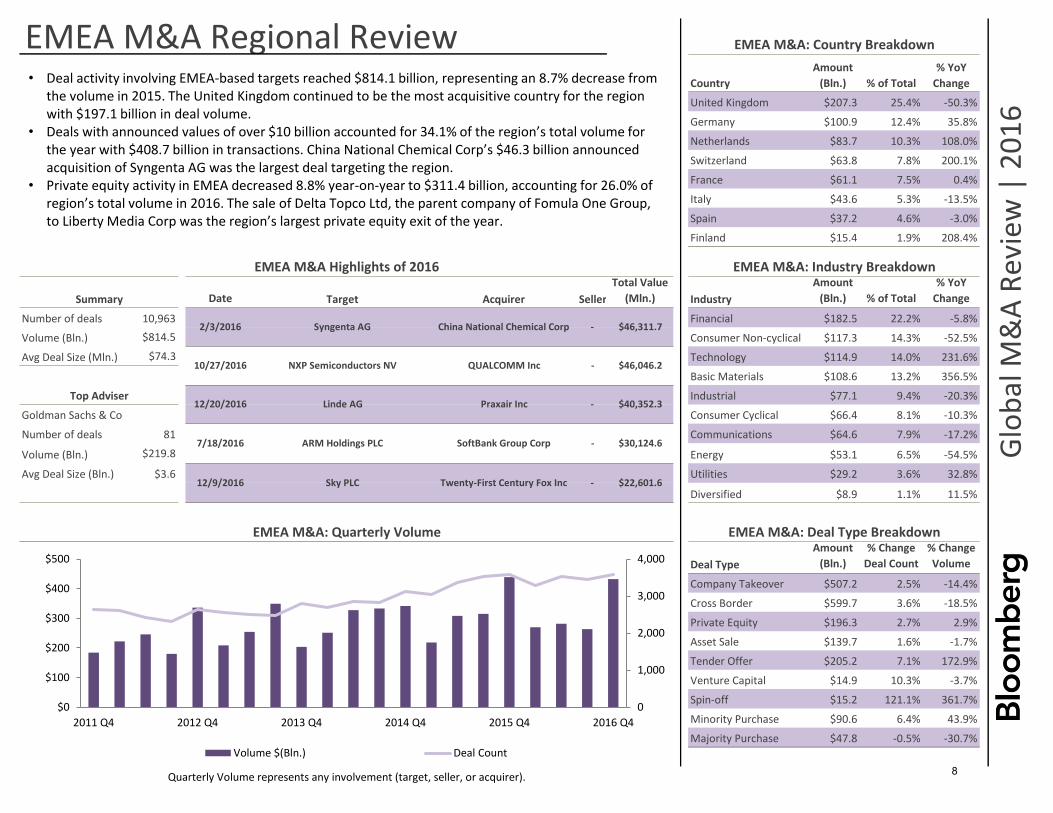
Country
United Kingdom $207.3 25.4% -50.3%
Germany $100.9 12.4% 35.8%
Netherlands $83.7 10.3% 108.0%
Switzerland $63.8 7.8% 200.1%
France $61.1 7.5% 0.4%
Italy $43.6 5.3% -13.5%
Spain $37.2 4.6% -3.0%
Finland $15.4 1.9% 208.4%
Date
Total Value
(Mln.)
Amount
(Bln.) % of Total
% YoY
Change
Number of deals 10,963 Financial $182.5 22.2% -5.8%
Volume (Bln.) $814.5 Consumer Non-cyclical $117.3 14.3% -52.5%
Avg Deal Size (Mln.) $74.3 Technology $114.9 14.0% 231.6%
Basic Materials $108.6 13.2% 356.5%
Industrial $77.1 9.4% -20.3%
Goldman Sachs & Co Consumer Cyclical $66.4 8.1% -10.3%
Number of deals 81 Communications $64.6 7.9% -17.2%
Volume (Bln.) $219.8 Energy $53.1 6.5% -54.5%
Avg Deal Size (Bln.) $3.6 Utilities $29.2 3.6% 32.8%
Diversified $8.9 1.1% 11.5%
Amount
(Bln.)
% Change
Deal Count
% Change
Volume
Company Takeover $507.2 2.5% -14.4%
Cross Border $599.7 3.6% -18.5%
Private Equity $196.3 2.7% 2.9%
Asset Sale $139.7 1.6% -1.7%
Tender Offer $205.2 7.1% 172.9%
Venture Capital $14.9 10.3% -3.7%
Spin-off $15.2 121.1% 361.7%
Minority Purchase $90.6 6.4% 43.9%
$47.8 -0.5% -30.7%
EMEA M&A: Industry Breakdown
Amount
(Bln.) % of Total
% YoY
Change
SoftBank Group Corp
EMEA M&A: Quarterly Volume EMEA M&A: Deal Type Breakdown
Deal Type
12/9/2016 Sky PLC Twenty-First Century Fox Inc - $22,601.6
$46,311.7
- $30,124.6
Top Adviser12/20/2016 Linde AG Praxair Inc - $40,352.3
10/27/2016 NXP Semiconductors NV QUALCOMM Inc - $46,046.2
7/18/2016 ARM Holdings PLC
Quarterly Volume represents any involvement (target, seller, or acquirer).
Glo
bal
M&
A R
evi
ew |
20
16
Majority Purchase
EMEA M&A Regional Review EMEA M&A: Country Breakdown
EMEA M&A Highlights of 2016
Summary Target Acquirer Seller Industry
2/3/2016 Syngenta AG China National Chemical Corp -
0
1,000
2,000
3,000
4,000
$0
$100
$200
$300
$400
$500
2011 Q4 2012 Q4 2013 Q4 2014 Q4 2015 Q4 2016 Q4
Volume $(Bln.) Deal Count
• Deal activity involving EMEA-based targets reached $814.1 billion, representing an 8.7% decrease fromthe volume in 2015. The United Kingdom continued to be the most acquisitive country for the regionwith $197.1 billion in deal volume.
• Deals with announced values of over $10 billion accounted for 34.1% of the region’s total volume for the year with $408.7 billion in transactions. China National Chemical Corp’s $46.3 billion announced acquisition of Syngenta AG was the largest deal targeting the region.
• Private equity activity in EMEA decreased 8.8% year-on-year to $311.4 billion, accounting for 26.0% ofregion’s total volume in 2016. The sale of Delta Topco Ltd, the parent company of Fomula One Group,to Liberty Media Corp was the region’s largest private equity exit of the year.
8
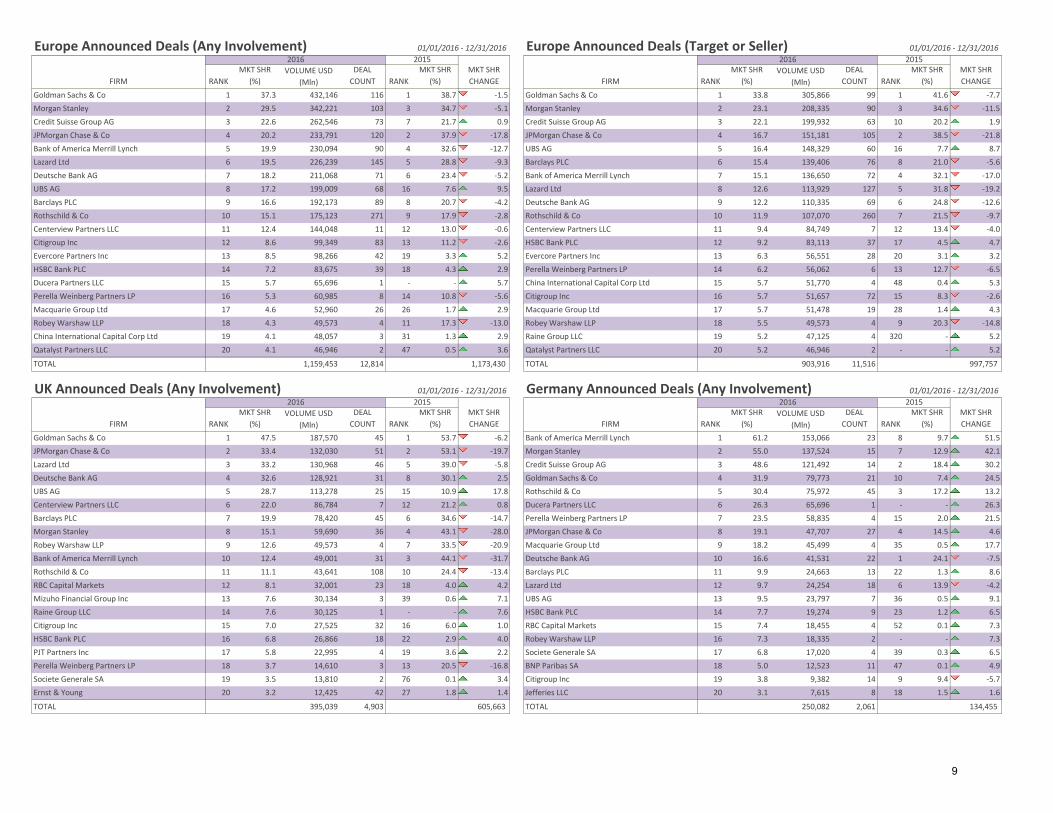
Europe Announced Deals (Any Involvement) 01/01/2016 - 12/31/2016 Europe Announced Deals (Target or Seller) 01/01/2016 - 12/31/2016
Goldman Sachs & Co 1 37.3 432,146 116 1 38.7 -1.5 Goldman Sachs & Co 1 33.8 305,866 99 1 41.6 -7.7
Morgan Stanley 2 29.5 342,221 103 3 34.7 -5.1 Morgan Stanley 2 23.1 208,335 90 3 34.6 -11.5
Credit Suisse Group AG 3 22.6 262,546 73 7 21.7 0.9 Credit Suisse Group AG 3 22.1 199,932 63 10 20.2 1.9
JPMorgan Chase & Co 4 20.2 233,791 120 2 37.9 -17.8 JPMorgan Chase & Co 4 16.7 151,181 105 2 38.5 -21.8
Bank of America Merrill Lynch 5 19.9 230,094 90 4 32.6 -12.7 UBS AG 5 16.4 148,329 60 16 7.7 8.7
Lazard Ltd 6 19.5 226,239 145 5 28.8 -9.3 Barclays PLC 6 15.4 139,406 76 8 21.0 -5.6
Deutsche Bank AG 7 18.2 211,068 71 6 23.4 -5.2 Bank of America Merrill Lynch 7 15.1 136,650 72 4 32.1 -17.0
UBS AG 8 17.2 199,009 68 16 7.6 9.5 Lazard Ltd 8 12.6 113,929 127 5 31.8 -19.2
Barclays PLC 9 16.6 192,173 89 8 20.7 -4.2 Deutsche Bank AG 9 12.2 110,335 69 6 24.8 -12.6
Rothschild & Co 10 15.1 175,123 271 9 17.9 -2.8 Rothschild & Co 10 11.9 107,070 260 7 21.5 -9.7
Centerview Partners LLC 11 12.4 144,048 11 12 13.0 -0.6 Centerview Partners LLC 11 9.4 84,749 7 12 13.4 -4.0
Citigroup Inc 12 8.6 99,349 83 13 11.2 -2.6 HSBC Bank PLC 12 9.2 83,113 37 17 4.5 4.7
Evercore Partners Inc 13 8.5 98,266 42 19 3.3 5.2 Evercore Partners Inc 13 6.3 56,551 28 20 3.1 3.2
HSBC Bank PLC 14 7.2 83,675 39 18 4.3 2.9 Perella Weinberg Partners LP 14 6.2 56,062 6 13 12.7 -6.5
Ducera Partners LLC 15 5.7 65,696 1 - - 5.7 China International Capital Corp Ltd 15 5.7 51,770 4 48 0.4 5.3
Perella Weinberg Partners LP 16 5.3 60,985 8 14 10.8 -5.6 Citigroup Inc 16 5.7 51,657 72 15 8.3 -2.6
Macquarie Group Ltd 17 4.6 52,960 26 26 1.7 2.9 Macquarie Group Ltd 17 5.7 51,478 19 28 1.4 4.3
Robey Warshaw LLP 18 4.3 49,573 4 11 17.3 -13.0 Robey Warshaw LLP 18 5.5 49,573 4 9 20.3 -14.8
China International Capital Corp Ltd 19 4.1 48,057 3 31 1.3 2.9 Raine Group LLC 19 5.2 47,125 4 320 - 5.2
Qatalyst Partners LLC 20 4.1 46,946 2 47 0.5 3.6 Qatalyst Partners LLC 20 5.2 46,946 2 - - 5.2
TOTAL 1,159,453 12,814 TOTAL 903,916 11,516
UK Announced Deals (Any Involvement) 01/01/2016 - 12/31/2016 Germany Announced Deals (Any Involvement) 01/01/2016 - 12/31/2016
Goldman Sachs & Co 1 47.5 187,570 45 1 53.7 -6.2 Bank of America Merrill Lynch 1 61.2 153,066 23 8 9.7 51.5
JPMorgan Chase & Co 2 33.4 132,030 51 2 53.1 -19.7 Morgan Stanley 2 55.0 137,524 15 7 12.9 42.1
Lazard Ltd 3 33.2 130,968 46 5 39.0 -5.8 Credit Suisse Group AG 3 48.6 121,492 14 2 18.4 30.2
Deutsche Bank AG 4 32.6 128,921 31 8 30.1 2.5 Goldman Sachs & Co 4 31.9 79,773 21 10 7.4 24.5
UBS AG 5 28.7 113,278 25 15 10.9 17.8 Rothschild & Co 5 30.4 75,972 45 3 17.2 13.2
Centerview Partners LLC 6 22.0 86,784 7 12 21.2 0.8 Ducera Partners LLC 6 26.3 65,696 1 - - 26.3
Barclays PLC 7 19.9 78,420 45 6 34.6 -14.7 Perella Weinberg Partners LP 7 23.5 58,835 4 15 2.0 21.5
Morgan Stanley 8 15.1 59,690 36 4 43.1 -28.0 JPMorgan Chase & Co 8 19.1 47,707 27 4 14.5 4.6
Robey Warshaw LLP 9 12.6 49,573 4 7 33.5 -20.9 Macquarie Group Ltd 9 18.2 45,499 4 35 0.5 17.7
Bank of America Merrill Lynch 10 12.4 49,001 31 3 44.1 -31.7 Deutsche Bank AG 10 16.6 41,531 22 1 24.1 -7.5
Rothschild & Co 11 11.1 43,641 108 10 24.4 -13.4 Barclays PLC 11 9.9 24,663 13 22 1.3 8.6
RBC Capital Markets 12 8.1 32,001 23 18 4.0 4.2 Lazard Ltd 12 9.7 24,254 18 6 13.9 -4.2
Mizuho Financial Group Inc 13 7.6 30,134 3 39 0.6 7.1 UBS AG 13 9.5 23,797 7 36 0.5 9.1
Raine Group LLC 14 7.6 30,125 1 - - 7.6 HSBC Bank PLC 14 7.7 19,274 9 23 1.2 6.5
Citigroup Inc 15 7.0 27,525 32 16 6.0 1.0 RBC Capital Markets 15 7.4 18,455 4 52 0.1 7.3
HSBC Bank PLC 16 6.8 26,866 18 22 2.9 4.0 Robey Warshaw LLP 16 7.3 18,335 2 - - 7.3
PJT Partners Inc 17 5.8 22,995 4 19 3.6 2.2 Societe Generale SA 17 6.8 17,020 4 39 0.3 6.5
Perella Weinberg Partners LP 18 3.7 14,610 3 13 20.5 -16.8 BNP Paribas SA 18 5.0 12,523 11 47 0.1 4.9
Societe Generale SA 19 3.5 13,810 2 76 0.1 3.4 Citigroup Inc 19 3.8 9,382 14 9 9.4 -5.7
Ernst & Young 20 3.2 12,425 42 27 1.8 1.4 Jefferies LLC 20 3.1 7,615 8 18 1.5 1.6
TOTAL 395,039 4,903 TOTAL 250,082 2,061
FIRM
2016 2015MKT SHR
CHANGE FIRM
2016 2015MKT SHR
CHANGERANK
MKT SHR
(%)VOLUME USD
(Mln)
DEAL
COUNT RANK
MKT SHR
(%) RANK
MKT SHR
(%)VOLUME USD
(Mln)
DEAL
COUNT RANK
MKT SHR
(%)
FIRM
2016 2015MKT SHR
CHANGE FIRM
2016 2015MKT SHR
CHANGERANK
MKT SHR
(%)VOLUME USD
(Mln)
DEAL
COUNT RANK
MKT SHR
(%) RANK
MKT SHR
(%)VOLUME USD
(Mln)
DEAL
COUNT RANK
MKT SHR
(%)
1,173,430 997,757
605,663 134,455
9
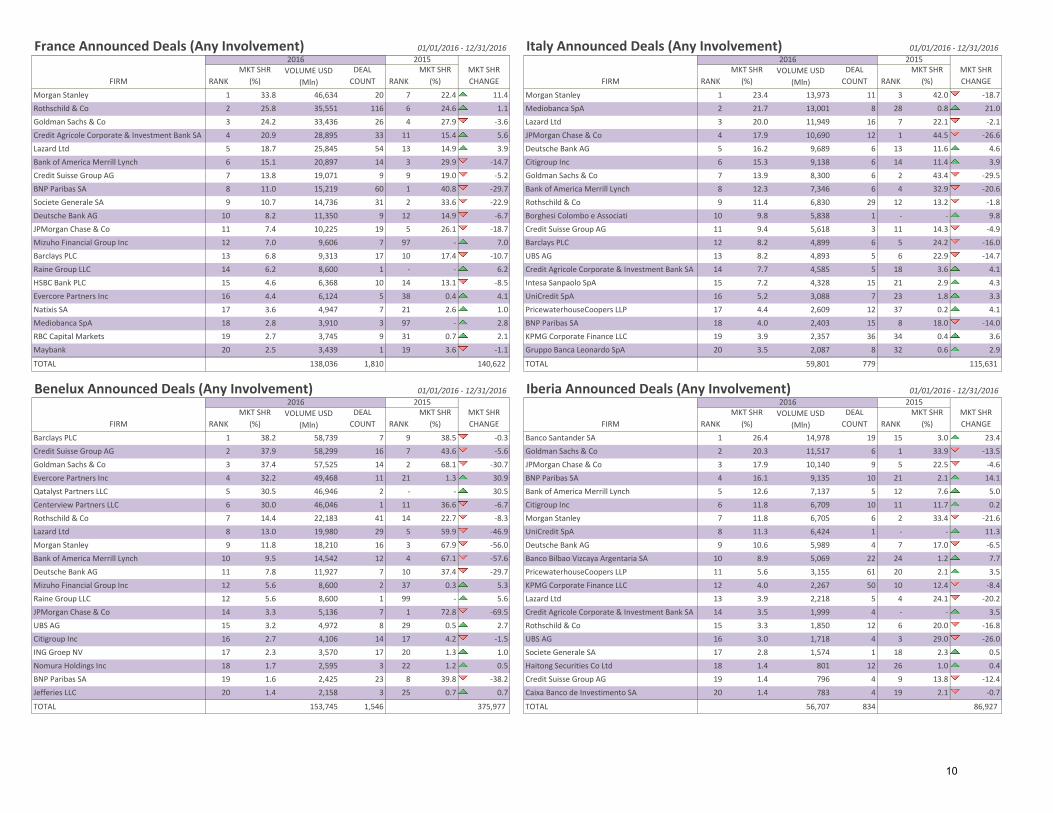
France Announced Deals (Any Involvement) 01/01/2016 - 12/31/2016 Italy Announced Deals (Any Involvement) 01/01/2016 - 12/31/2016
Morgan Stanley 1 33.8 46,634 20 7 22.4 11.4 Morgan Stanley 1 23.4 13,973 11 3 42.0 -18.7
Rothschild & Co 2 25.8 35,551 116 6 24.6 1.1 Mediobanca SpA 2 21.7 13,001 8 28 0.8 21.0
Goldman Sachs & Co 3 24.2 33,436 26 4 27.9 -3.6 Lazard Ltd 3 20.0 11,949 16 7 22.1 -2.1
Credit Agricole Corporate & Investment Bank SA 4 20.9 28,895 33 11 15.4 5.6 JPMorgan Chase & Co 4 17.9 10,690 12 1 44.5 -26.6
Lazard Ltd 5 18.7 25,845 54 13 14.9 3.9 Deutsche Bank AG 5 16.2 9,689 6 13 11.6 4.6
Bank of America Merrill Lynch 6 15.1 20,897 14 3 29.9 -14.7 Citigroup Inc 6 15.3 9,138 6 14 11.4 3.9
Credit Suisse Group AG 7 13.8 19,071 9 9 19.0 -5.2 Goldman Sachs & Co 7 13.9 8,300 6 2 43.4 -29.5
BNP Paribas SA 8 11.0 15,219 60 1 40.8 -29.7 Bank of America Merrill Lynch 8 12.3 7,346 6 4 32.9 -20.6
Societe Generale SA 9 10.7 14,736 31 2 33.6 -22.9 Rothschild & Co 9 11.4 6,830 29 12 13.2 -1.8
Deutsche Bank AG 10 8.2 11,350 9 12 14.9 -6.7 Borghesi Colombo e Associati 10 9.8 5,838 1 - - 9.8
JPMorgan Chase & Co 11 7.4 10,225 19 5 26.1 -18.7 Credit Suisse Group AG 11 9.4 5,618 3 11 14.3 -4.9
Mizuho Financial Group Inc 12 7.0 9,606 7 97 - 7.0 Barclays PLC 12 8.2 4,899 6 5 24.2 -16.0
Barclays PLC 13 6.8 9,313 17 10 17.4 -10.7 UBS AG 13 8.2 4,893 5 6 22.9 -14.7
Raine Group LLC 14 6.2 8,600 1 - - 6.2 Credit Agricole Corporate & Investment Bank SA 14 7.7 4,585 5 18 3.6 4.1
HSBC Bank PLC 15 4.6 6,368 10 14 13.1 -8.5 Intesa Sanpaolo SpA 15 7.2 4,328 15 21 2.9 4.3
Evercore Partners Inc 16 4.4 6,124 5 38 0.4 4.1 UniCredit SpA 16 5.2 3,088 7 23 1.8 3.3
Natixis SA 17 3.6 4,947 7 21 2.6 1.0 PricewaterhouseCoopers LLP 17 4.4 2,609 12 37 0.2 4.1
Mediobanca SpA 18 2.8 3,910 3 97 - 2.8 BNP Paribas SA 18 4.0 2,403 15 8 18.0 -14.0
RBC Capital Markets 19 2.7 3,745 9 31 0.7 2.1 KPMG Corporate Finance LLC 19 3.9 2,357 36 34 0.4 3.6
Maybank 20 2.5 3,439 1 19 3.6 -1.1 Gruppo Banca Leonardo SpA 20 3.5 2,087 8 32 0.6 2.9
TOTAL 138,036 1,810 TOTAL 59,801 779
Benelux Announced Deals (Any Involvement) 01/01/2016 - 12/31/2016 Iberia Announced Deals (Any Involvement) 01/01/2016 - 12/31/2016
Barclays PLC 1 38.2 58,739 7 9 38.5 -0.3 Banco Santander SA 1 26.4 14,978 19 15 3.0 23.4
Credit Suisse Group AG 2 37.9 58,299 16 7 43.6 -5.6 Goldman Sachs & Co 2 20.3 11,517 6 1 33.9 -13.5
Goldman Sachs & Co 3 37.4 57,525 14 2 68.1 -30.7 JPMorgan Chase & Co 3 17.9 10,140 9 5 22.5 -4.6
Evercore Partners Inc 4 32.2 49,468 11 21 1.3 30.9 BNP Paribas SA 4 16.1 9,135 10 21 2.1 14.1
Qatalyst Partners LLC 5 30.5 46,946 2 - - 30.5 Bank of America Merrill Lynch 5 12.6 7,137 5 12 7.6 5.0
Centerview Partners LLC 6 30.0 46,046 1 11 36.6 -6.7 Citigroup Inc 6 11.8 6,709 10 11 11.7 0.2
Rothschild & Co 7 14.4 22,183 41 14 22.7 -8.3 Morgan Stanley 7 11.8 6,705 6 2 33.4 -21.6
Lazard Ltd 8 13.0 19,980 29 5 59.9 -46.9 UniCredit SpA 8 11.3 6,424 1 - - 11.3
Morgan Stanley 9 11.8 18,210 16 3 67.9 -56.0 Deutsche Bank AG 9 10.6 5,989 4 7 17.0 -6.5
Bank of America Merrill Lynch 10 9.5 14,542 12 4 67.1 -57.6 Banco Bilbao Vizcaya Argentaria SA 10 8.9 5,069 22 24 1.2 7.7
Deutsche Bank AG 11 7.8 11,927 7 10 37.4 -29.7 PricewaterhouseCoopers LLP 11 5.6 3,155 61 20 2.1 3.5
Mizuho Financial Group Inc 12 5.6 8,600 2 37 0.3 5.3 KPMG Corporate Finance LLC 12 4.0 2,267 50 10 12.4 -8.4
Raine Group LLC 12 5.6 8,600 1 99 - 5.6 Lazard Ltd 13 3.9 2,218 5 4 24.1 -20.2
JPMorgan Chase & Co 14 3.3 5,136 7 1 72.8 -69.5 Credit Agricole Corporate & Investment Bank SA 14 3.5 1,999 4 - - 3.5
UBS AG 15 3.2 4,972 8 29 0.5 2.7 Rothschild & Co 15 3.3 1,850 12 6 20.0 -16.8
Citigroup Inc 16 2.7 4,106 14 17 4.2 -1.5 UBS AG 16 3.0 1,718 4 3 29.0 -26.0
ING Groep NV 17 2.3 3,570 17 20 1.3 1.0 Societe Generale SA 17 2.8 1,574 1 18 2.3 0.5
Nomura Holdings Inc 18 1.7 2,595 3 22 1.2 0.5 Haitong Securities Co Ltd 18 1.4 801 12 26 1.0 0.4
BNP Paribas SA 19 1.6 2,425 23 8 39.8 -38.2 Credit Suisse Group AG 19 1.4 796 4 9 13.8 -12.4
Jefferies LLC 20 1.4 2,158 3 25 0.7 0.7 Caixa Banco de Investimento SA 20 1.4 783 4 19 2.1 -0.7
TOTAL 153,745 1,546 TOTAL 56,707 834
RANK
MKT SHR
(%)
FIRM
2016 2015
RANK
FIRM RANK
MKT SHR
(%)VOLUME USD
(Mln)
DEAL
COUNT RANK
MKT SHR
(%) RANK
MKT SHR
(%)
FIRM
2016 2015MKT SHR
CHANGERANK
MKT SHR
(%)VOLUME USD
(Mln)
DEAL
COUNT RANK
MKT SHR
(%)
MKT SHR
(%)VOLUME USD
(Mln)
DEAL
COUNT RANK
MKT SHR
(%)
2016 2015MKT SHR
CHANGE FIRM
2016
VOLUME USD
(Mln)
DEAL
COUNT
140,622 115,631
375,977 86,927
MKT SHR
CHANGE
2015MKT SHR
CHANGE
10
Nordic Announced Deals (Any Involvement) 01/01/2016 - 12/31/2016 Eastern Europe Announced Deals (Any Involvement) 01/01/2016 - 12/31/2016
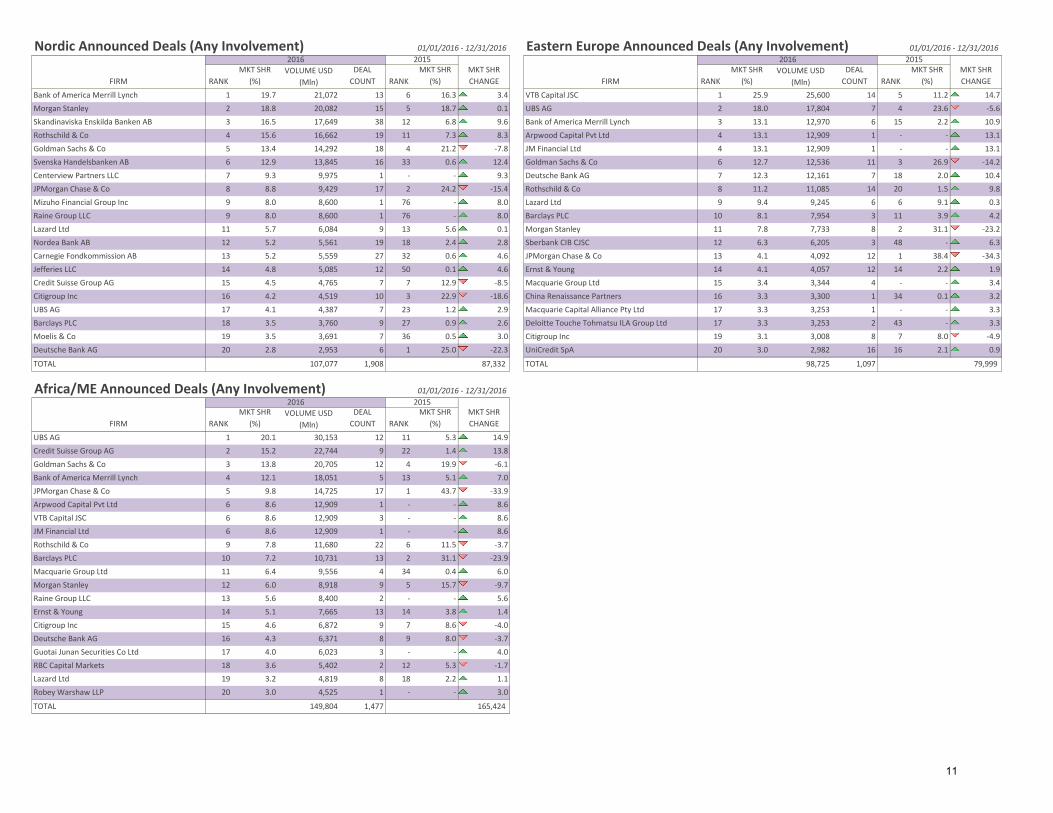
Bank of America Merrill Lynch 1 19.7 21,072 13 6 16.3 3.4 VTB Capital JSC 1 25.9 25,600 14 5 11.2 14.7
Morgan Stanley 2 18.8 20,082 15 5 18.7 0.1 UBS AG 2 18.0 17,804 7 4 23.6 -5.6
Skandinaviska Enskilda Banken AB 3 16.5 17,649 38 12 6.8 9.6 Bank of America Merrill Lynch 3 13.1 12,970 6 15 2.2 10.9
Rothschild & Co 4 15.6 16,662 19 11 7.3 8.3 Arpwood Capital Pvt Ltd 4 13.1 12,909 1 - - 13.1
Goldman Sachs & Co 5 13.4 14,292 18 4 21.2 -7.8 JM Financial Ltd 4 13.1 12,909 1 - - 13.1
Svenska Handelsbanken AB 6 12.9 13,845 16 33 0.6 12.4 Goldman Sachs & Co 6 12.7 12,536 11 3 26.9 -14.2
Centerview Partners LLC 7 9.3 9,975 1 - - 9.3 Deutsche Bank AG 7 12.3 12,161 7 18 2.0 10.4
JPMorgan Chase & Co 8 8.8 9,429 17 2 24.2 -15.4 Rothschild & Co 8 11.2 11,085 14 20 1.5 9.8
Mizuho Financial Group Inc 9 8.0 8,600 1 76 - 8.0 Lazard Ltd 9 9.4 9,245 6 6 9.1 0.3
Raine Group LLC 9 8.0 8,600 1 76 - 8.0 Barclays PLC 10 8.1 7,954 3 11 3.9 4.2
Lazard Ltd 11 5.7 6,084 9 13 5.6 0.1 Morgan Stanley 11 7.8 7,733 8 2 31.1 -23.2
Nordea Bank AB 12 5.2 5,561 19 18 2.4 2.8 Sberbank CIB CJSC 12 6.3 6,205 3 48 - 6.3
Carnegie Fondkommission AB 13 5.2 5,559 27 32 0.6 4.6 JPMorgan Chase & Co 13 4.1 4,092 12 1 38.4 -34.3
Jefferies LLC 14 4.8 5,085 12 50 0.1 4.6 Ernst & Young 14 4.1 4,057 12 14 2.2 1.9
Credit Suisse Group AG 15 4.5 4,765 7 7 12.9 -8.5 Macquarie Group Ltd 15 3.4 3,344 4 - - 3.4
Citigroup Inc 16 4.2 4,519 10 3 22.9 -18.6 China Renaissance Partners 16 3.3 3,300 1 34 0.1 3.2
UBS AG 17 4.1 4,387 7 23 1.2 2.9 Macquarie Capital Alliance Pty Ltd 17 3.3 3,253 1 - - 3.3
Barclays PLC 18 3.5 3,760 9 27 0.9 2.6 Deloitte Touche Tohmatsu ILA Group Ltd 17 3.3 3,253 2 43 - 3.3
Moelis & Co 19 3.5 3,691 7 36 0.5 3.0 Citigroup Inc 19 3.1 3,008 8 7 8.0 -4.9
Deutsche Bank AG 20 2.8 2,953 6 1 25.0 -22.3 UniCredit SpA 20 3.0 2,982 16 16 2.1 0.9
TOTAL 107,077 1,908 TOTAL 98,725 1,097
Africa/ME Announced Deals (Any Involvement) 01/01/2016 - 12/31/2016
UBS AG 1 20.1 30,153 12 11 5.3 14.9
Credit Suisse Group AG 2 15.2 22,744 9 22 1.4 13.8
Goldman Sachs & Co 3 13.8 20,705 12 4 19.9 -6.1
Bank of America Merrill Lynch 4 12.1 18,051 5 13 5.1 7.0
JPMorgan Chase & Co 5 9.8 14,725 17 1 43.7 -33.9
Arpwood Capital Pvt Ltd 6 8.6 12,909 1 - - 8.6
VTB Capital JSC 6 8.6 12,909 3 - - 8.6
JM Financial Ltd 6 8.6 12,909 1 - - 8.6
Rothschild & Co 9 7.8 11,680 22 6 11.5 -3.7
Barclays PLC 10 7.2 10,731 13 2 31.1 -23.9
Macquarie Group Ltd 11 6.4 9,556 4 34 0.4 6.0
Morgan Stanley 12 6.0 8,918 9 5 15.7 -9.7
Raine Group LLC 13 5.6 8,400 2 - - 5.6
Ernst & Young 14 5.1 7,665 13 14 3.8 1.4
Citigroup Inc 15 4.6 6,872 9 7 8.6 -4.0
Deutsche Bank AG 16 4.3 6,371 8 9 8.0 -3.7
Guotai Junan Securities Co Ltd 17 4.0 6,023 3 - - 4.0
RBC Capital Markets 18 3.6 5,402 2 12 5.3 -1.7
Lazard Ltd 19 3.2 4,819 8 18 2.2 1.1
Robey Warshaw LLP 20 3.0 4,525 1 - - 3.0
TOTAL 149,804 1,477
FIRM
DEAL
COUNT RANK
MKT SHR
(%)
MKT SHR
(%) RANK
MKT SHR
(%)VOLUME USD
(Mln)
DEAL
COUNTRANK
MKT SHR
CHANGE
2016 2015MKT SHR
CHANGERANK
MKT SHR
(%)VOLUME USD
(Mln)
RANK
MKT SHR
(%)FIRM
2016 2015MKT SHR
CHANGE FIRM
2016 2015
RANK
MKT SHR
(%)VOLUME USD
(Mln)
DEAL
COUNT
87,332 79,999
165,424
11
Date
Total Value
(Mln.)
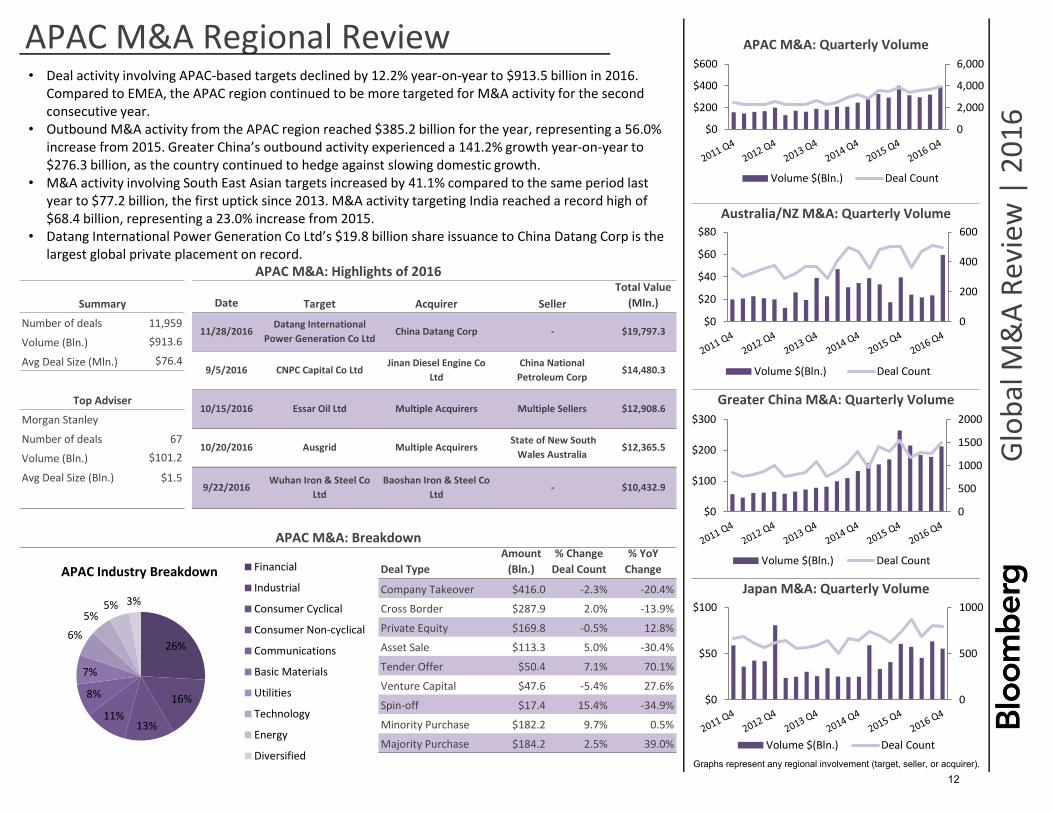
Number of deals 11,959
Volume (Bln.) $913.6
Avg Deal Size (Mln.) $76.4
Morgan Stanley
Number of deals 67
Volume (Bln.) $101.2
Avg Deal Size (Bln.) $1.5
Deal Type
Amount
(Bln.)
% Change
Deal Count
% YoY
Change
Company Takeover $416.0 -2.3% -20.4%
Cross Border $287.9 2.0% -13.9%
Private Equity $169.8 -0.5% 12.8%
Asset Sale $113.3 5.0% -30.4%
Tender Offer $50.4 7.1% 70.1%
Venture Capital $47.6 -5.4% 27.6%
Spin-off $17.4 15.4% -34.9%
Minority Purchase $182.2 9.7% 0.5%
Majority Purchase $184.2 2.5% 39.0%
Graphs represent any regional involvement (target, seller, or acquirer).
CNPC Capital Co Ltd
Japan M&A: Quarterly Volume
$10,432.99/22/2016Wuhan Iron & Steel Co
Ltd
Baoshan Iron & Steel Co
Ltd-
-
China National
Petroleum Corp
APAC M&A: Breakdown
Greater China M&A: Quarterly Volume
10/20/2016 Ausgrid Multiple Acquirers State of New South
Wales Australia $12,365.5
Top Adviser10/15/2016 Essar Oil Ltd Multiple Acquirers Multiple Sellers $12,908.6
9/5/2016
$19,797.3
Jinan Diesel Engine Co
Ltd$14,480.3
APAC M&A Regional Review
Glo
bal
M&
A R
evi
ew |
20
16
APAC M&A: Quarterly Volume
Australia/NZ M&A: Quarterly Volume
APAC M&A: Highlights of 2016
Summary Target Acquirer Seller
11/28/2016Datang International
Power Generation Co LtdChina Datang Corp
26%
16%
13%11%
8%
7%
6%
5%5% 3%
APAC Industry Breakdown Financial
Industrial
Consumer Cyclical
Consumer Non-cyclical
Communications
Basic Materials
Utilities
Technology
Energy
Diversified
0
2,000
4,000
6,000
$0
$200
$400
$600
Volume $(Bln.) Deal Count
0
200
400
600
$0
$20
$40
$60
$80
Volume $(Bln.) Deal Count
0
500
1000
1500
2000
$0
$100
$200
$300
Volume $(Bln.) Deal Count
0
500
1000
$0
$50
$100
Volume $(Bln.) Deal Count
• Deal activity involving APAC-based targets declined by 12.2% year-on-year to $913.5 billion in 2016.Compared to EMEA, the APAC region continued to be more targeted for M&A activity for the secondconsecutive year.
• Outbound M&A activity from the APAC region reached $385.2 billion for the year, representing a 56.0%increase from 2015. Greater China’s outbound activity experienced a 141.2% growth year-on-year to$276.3 billion, as the country continued to hedge against slowing domestic growth.
• M&A activity involving South East Asian targets increased by 41.1% compared to the same period lastyear to $77.2 billion, the first uptick since 2013. M&A activity targeting India reached a record high of$68.4 billion, representing a 23.0% increase from 2015.
• Datang International Power Generation Co Ltd’s $19.8 billion share issuance to China Datang Corp is thelargest global private placement on record.
12
APAC Ex-Japan Announced Deals (Any Involvement) 01/01/2016 - 12/31/2016 APAC Ex-Japan Announced Deals (Target or Seller) 01/01/2016 - 12/31/2016
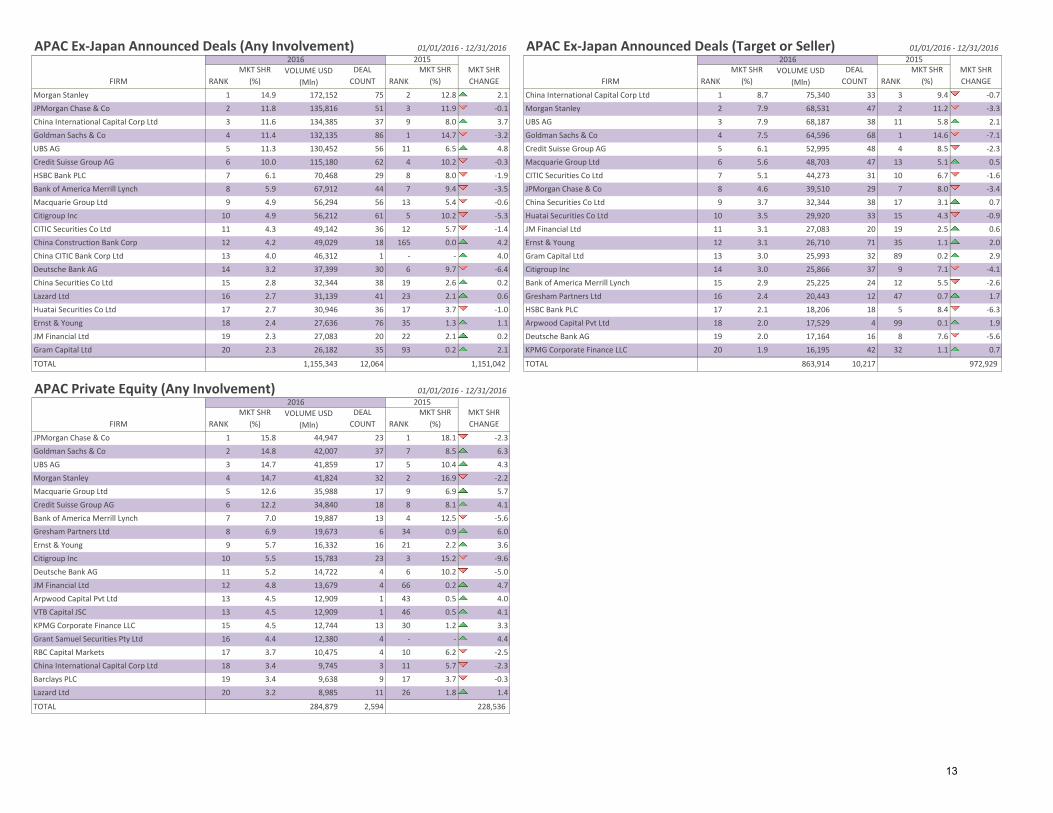
Morgan Stanley 1 14.9 172,152 75 2 12.8 2.1 China International Capital Corp Ltd 1 8.7 75,340 33 3 9.4 -0.7
JPMorgan Chase & Co 2 11.8 135,816 51 3 11.9 -0.1 Morgan Stanley 2 7.9 68,531 47 2 11.2 -3.3
China International Capital Corp Ltd 3 11.6 134,385 37 9 8.0 3.7 UBS AG 3 7.9 68,187 38 11 5.8 2.1
Goldman Sachs & Co 4 11.4 132,135 86 1 14.7 -3.2 Goldman Sachs & Co 4 7.5 64,596 68 1 14.6 -7.1
UBS AG 5 11.3 130,452 56 11 6.5 4.8 Credit Suisse Group AG 5 6.1 52,995 48 4 8.5 -2.3
Credit Suisse Group AG 6 10.0 115,180 62 4 10.2 -0.3 Macquarie Group Ltd 6 5.6 48,703 47 13 5.1 0.5
HSBC Bank PLC 7 6.1 70,468 29 8 8.0 -1.9 CITIC Securities Co Ltd 7 5.1 44,273 31 10 6.7 -1.6
Bank of America Merrill Lynch 8 5.9 67,912 44 7 9.4 -3.5 JPMorgan Chase & Co 8 4.6 39,510 29 7 8.0 -3.4
Macquarie Group Ltd 9 4.9 56,294 56 13 5.4 -0.6 China Securities Co Ltd 9 3.7 32,344 38 17 3.1 0.7
Citigroup Inc 10 4.9 56,212 61 5 10.2 -5.3 Huatai Securities Co Ltd 10 3.5 29,920 33 15 4.3 -0.9
CITIC Securities Co Ltd 11 4.3 49,142 36 12 5.7 -1.4 JM Financial Ltd 11 3.1 27,083 20 19 2.5 0.6
China Construction Bank Corp 12 4.2 49,029 18 165 0.0 4.2 Ernst & Young 12 3.1 26,710 71 35 1.1 2.0
China CITIC Bank Corp Ltd 13 4.0 46,312 1 - - 4.0 Gram Capital Ltd 13 3.0 25,993 32 89 0.2 2.9
Deutsche Bank AG 14 3.2 37,399 30 6 9.7 -6.4 Citigroup Inc 14 3.0 25,866 37 9 7.1 -4.1
China Securities Co Ltd 15 2.8 32,344 38 19 2.6 0.2 Bank of America Merrill Lynch 15 2.9 25,225 24 12 5.5 -2.6
Lazard Ltd 16 2.7 31,139 41 23 2.1 0.6 Gresham Partners Ltd 16 2.4 20,443 12 47 0.7 1.7
Huatai Securities Co Ltd 17 2.7 30,946 36 17 3.7 -1.0 HSBC Bank PLC 17 2.1 18,206 18 5 8.4 -6.3
Ernst & Young 18 2.4 27,636 76 35 1.3 1.1 Arpwood Capital Pvt Ltd 18 2.0 17,529 4 99 0.1 1.9
JM Financial Ltd 19 2.3 27,083 20 22 2.1 0.2 Deutsche Bank AG 19 2.0 17,164 16 8 7.6 -5.6
Gram Capital Ltd 20 2.3 26,182 35 93 0.2 2.1 KPMG Corporate Finance LLC 20 1.9 16,195 42 32 1.1 0.7
TOTAL 1,155,343 12,064 TOTAL 863,914 10,217
APAC Private Equity (Any Involvement) 01/01/2016 - 12/31/2016
JPMorgan Chase & Co 1 15.8 44,947 23 1 18.1 -2.3
Goldman Sachs & Co 2 14.8 42,007 37 7 8.5 6.3
UBS AG 3 14.7 41,859 17 5 10.4 4.3
Morgan Stanley 4 14.7 41,824 32 2 16.9 -2.2
Macquarie Group Ltd 5 12.6 35,988 17 9 6.9 5.7
Credit Suisse Group AG 6 12.2 34,840 18 8 8.1 4.1
Bank of America Merrill Lynch 7 7.0 19,887 13 4 12.5 -5.6
Gresham Partners Ltd 8 6.9 19,673 6 34 0.9 6.0
Ernst & Young 9 5.7 16,332 16 21 2.2 3.6
Citigroup Inc 10 5.5 15,783 23 3 15.2 -9.6
Deutsche Bank AG 11 5.2 14,722 4 6 10.2 -5.0
JM Financial Ltd 12 4.8 13,679 4 66 0.2 4.7
Arpwood Capital Pvt Ltd 13 4.5 12,909 1 43 0.5 4.0
VTB Capital JSC 13 4.5 12,909 1 46 0.5 4.1
KPMG Corporate Finance LLC 15 4.5 12,744 13 30 1.2 3.3
Grant Samuel Securities Pty Ltd 16 4.4 12,380 4 - - 4.4
RBC Capital Markets 17 3.7 10,475 4 10 6.2 -2.5
China International Capital Corp Ltd 18 3.4 9,745 3 11 5.7 -2.3
Barclays PLC 19 3.4 9,638 9 17 3.7 -0.3
Lazard Ltd 20 3.2 8,985 11 26 1.8 1.4
TOTAL 284,879 2,594
2015MKT SHR
(%)VOLUME USD
(Mln)
DEAL
COUNT RANK
MKT SHR
(%) RANK
MKT SHR
(%)VOLUME USD
(Mln)
FIRM
2016 2015MKT SHR
CHANGE
1,151,042
FIRM
2016 2015MKT SHR
CHANGE FIRM
2016
RANK
RANK
MKT SHR
(%)VOLUME USD
(Mln)
DEAL
COUNT RANK
MKT SHR
(%)
972,929
228,536
MKT SHR
CHANGE
DEAL
COUNT RANK
MKT SHR
(%)
13
AU & NZ Announced Deals (Any Involvement) 01/01/2016 - 12/31/2016 Japan Announced Deals (Any Involvement) 01/01/2016 - 12/31/2016
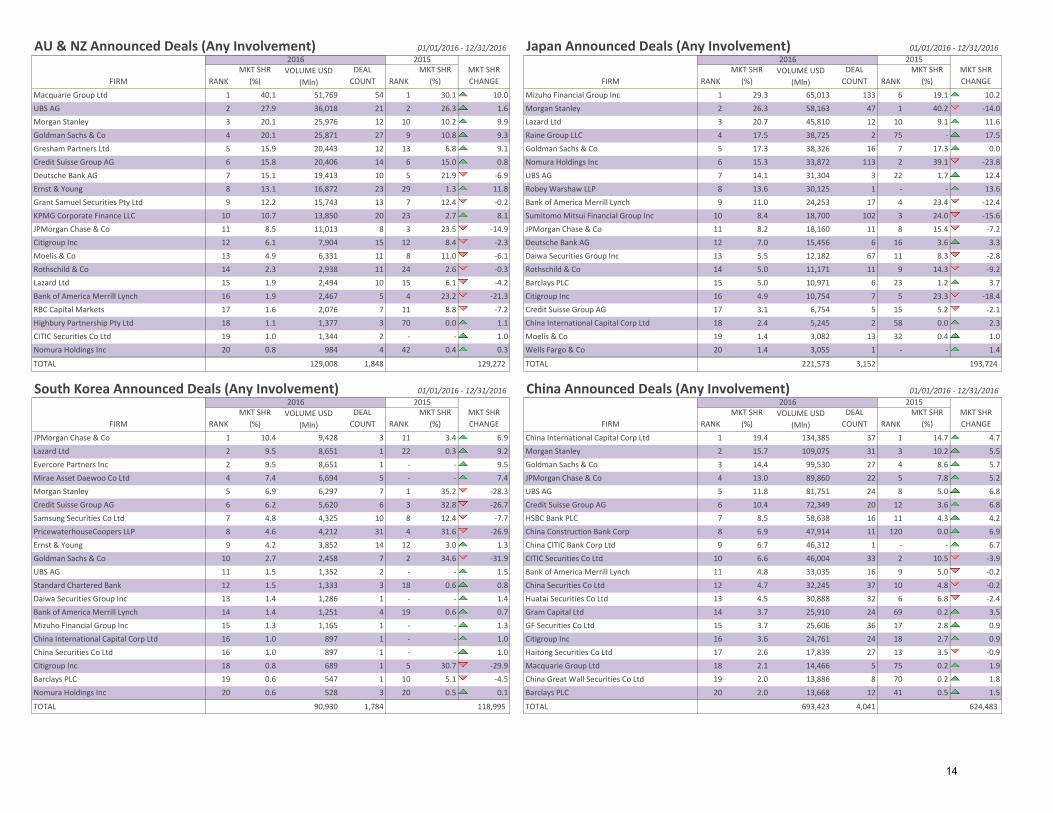
Macquarie Group Ltd 1 40.1 51,769 54 1 30.1 10.0 Mizuho Financial Group Inc 1 29.3 65,013 133 6 19.1 10.2
UBS AG 2 27.9 36,018 21 2 26.3 1.6 Morgan Stanley 2 26.3 58,163 47 1 40.2 -14.0
Morgan Stanley 3 20.1 25,976 12 10 10.2 9.9 Lazard Ltd 3 20.7 45,810 12 10 9.1 11.6
Goldman Sachs & Co 4 20.1 25,871 27 9 10.8 9.3 Raine Group LLC 4 17.5 38,725 2 75 - 17.5
Gresham Partners Ltd 5 15.9 20,443 12 13 6.8 9.1 Goldman Sachs & Co 5 17.3 38,326 16 7 17.3 0.0
Credit Suisse Group AG 6 15.8 20,406 14 6 15.0 0.8 Nomura Holdings Inc 6 15.3 33,872 113 2 39.1 -23.8
Deutsche Bank AG 7 15.1 19,413 10 5 21.9 -6.9 UBS AG 7 14.1 31,304 3 22 1.7 12.4
Ernst & Young 8 13.1 16,872 23 29 1.3 11.8 Robey Warshaw LLP 8 13.6 30,125 1 - - 13.6
Grant Samuel Securities Pty Ltd 9 12.2 15,743 13 7 12.4 -0.2 Bank of America Merrill Lynch 9 11.0 24,253 17 4 23.4 -12.4
KPMG Corporate Finance LLC 10 10.7 13,850 20 23 2.7 8.1 Sumitomo Mitsui Financial Group Inc 10 8.4 18,700 102 3 24.0 -15.6
JPMorgan Chase & Co 11 8.5 11,013 8 3 23.5 -14.9 JPMorgan Chase & Co 11 8.2 18,160 11 8 15.4 -7.2
Citigroup Inc 12 6.1 7,904 15 12 8.4 -2.3 Deutsche Bank AG 12 7.0 15,456 6 16 3.6 3.3
Moelis & Co 13 4.9 6,331 11 8 11.0 -6.1 Daiwa Securities Group Inc 13 5.5 12,182 67 11 8.3 -2.8
Rothschild & Co 14 2.3 2,938 11 24 2.6 -0.3 Rothschild & Co 14 5.0 11,171 11 9 14.3 -9.2
Lazard Ltd 15 1.9 2,494 10 15 6.1 -4.2 Barclays PLC 15 5.0 10,971 6 23 1.2 3.7
Bank of America Merrill Lynch 16 1.9 2,467 5 4 23.2 -21.3 Citigroup Inc 16 4.9 10,754 7 5 23.3 -18.4
RBC Capital Markets 17 1.6 2,076 7 11 8.8 -7.2 Credit Suisse Group AG 17 3.1 6,754 5 15 5.2 -2.1
Highbury Partnership Pty Ltd 18 1.1 1,377 3 70 0.0 1.1 China International Capital Corp Ltd 18 2.4 5,245 2 58 0.0 2.3
CITIC Securities Co Ltd 19 1.0 1,344 2 - - 1.0 Moelis & Co 19 1.4 3,082 13 32 0.4 1.0
Nomura Holdings Inc 20 0.8 984 4 42 0.4 0.3 Wells Fargo & Co 20 1.4 3,055 1 - - 1.4
TOTAL 129,008 1,848 TOTAL 221,573 3,152
South Korea Announced Deals (Any Involvement) 01/01/2016 - 12/31/2016 China Announced Deals (Any Involvement) 01/01/2016 - 12/31/2016
JPMorgan Chase & Co 1 10.4 9,428 3 11 3.4 6.9 China International Capital Corp Ltd 1 19.4 134,385 37 1 14.7 4.7
Lazard Ltd 2 9.5 8,651 1 22 0.3 9.2 Morgan Stanley 2 15.7 109,075 31 3 10.2 5.5
Evercore Partners Inc 2 9.5 8,651 1 - - 9.5 Goldman Sachs & Co 3 14.4 99,530 27 4 8.6 5.7
Mirae Asset Daewoo Co Ltd 4 7.4 6,694 5 - - 7.4 JPMorgan Chase & Co 4 13.0 89,860 22 5 7.8 5.2
Morgan Stanley 5 6.9 6,297 7 1 35.2 -28.3 UBS AG 5 11.8 81,751 24 8 5.0 6.8
Credit Suisse Group AG 6 6.2 5,620 6 3 32.8 -26.7 Credit Suisse Group AG 6 10.4 72,349 20 12 3.6 6.8
Samsung Securities Co Ltd 7 4.8 4,325 10 8 12.4 -7.7 HSBC Bank PLC 7 8.5 58,638 16 11 4.3 4.2
PricewaterhouseCoopers LLP 8 4.6 4,212 31 4 31.6 -26.9 China Construction Bank Corp 8 6.9 47,914 11 120 0.0 6.9
Ernst & Young 9 4.2 3,852 14 12 3.0 1.3 China CITIC Bank Corp Ltd 9 6.7 46,312 1 - - 6.7
Goldman Sachs & Co 10 2.7 2,458 7 2 34.6 -31.9 CITIC Securities Co Ltd 10 6.6 46,004 33 2 10.5 -3.9
UBS AG 11 1.5 1,352 2 - - 1.5 Bank of America Merrill Lynch 11 4.8 33,035 16 9 5.0 -0.2
Standard Chartered Bank 12 1.5 1,333 3 18 0.6 0.8 China Securities Co Ltd 12 4.7 32,245 37 10 4.8 -0.2
Daiwa Securities Group Inc 13 1.4 1,286 1 - - 1.4 Huatai Securities Co Ltd 13 4.5 30,888 32 6 6.8 -2.4
Bank of America Merrill Lynch 14 1.4 1,251 4 19 0.6 0.7 Gram Capital Ltd 14 3.7 25,910 24 69 0.2 3.5
Mizuho Financial Group Inc 15 1.3 1,165 1 - - 1.3 GF Securities Co Ltd 15 3.7 25,606 36 17 2.8 0.9
China International Capital Corp Ltd 16 1.0 897 1 - - 1.0 Citigroup Inc 16 3.6 24,761 24 18 2.7 0.9
China Securities Co Ltd 16 1.0 897 1 - - 1.0 Haitong Securities Co Ltd 17 2.6 17,839 27 13 3.5 -0.9
Citigroup Inc 18 0.8 689 1 5 30.7 -29.9 Macquarie Group Ltd 18 2.1 14,466 5 75 0.2 1.9
Barclays PLC 19 0.6 547 1 10 5.1 -4.5 China Great Wall Securities Co Ltd 19 2.0 13,886 8 70 0.2 1.8
Nomura Holdings Inc 20 0.6 528 3 20 0.5 0.1 Barclays PLC 20 2.0 13,668 12 41 0.5 1.5
TOTAL 90,930 1,784 TOTAL 693,423 4,041118,995 624,483
FIRM
2016 2015MKT SHR
CHANGE FIRM
2016 2015MKT SHR
CHANGERANK
MKT SHR
(%)VOLUME USD
(Mln)
DEAL
COUNT RANK
MKT SHR
(%) RANK
MKT SHR
(%)VOLUME USD
(Mln)
DEAL
COUNT RANK
MKT SHR
(%)
DEAL
COUNT RANK
MKT SHR
(%) RANK
MKT SHR
(%)VOLUME USD
(Mln)
DEAL
COUNT RANK
MKT SHR
(%)
129,272 193,724
FIRM
2016 2015MKT SHR
CHANGE FIRM
2016 2015MKT SHR
CHANGERANK
MKT SHR
(%)VOLUME USD
(Mln)
14
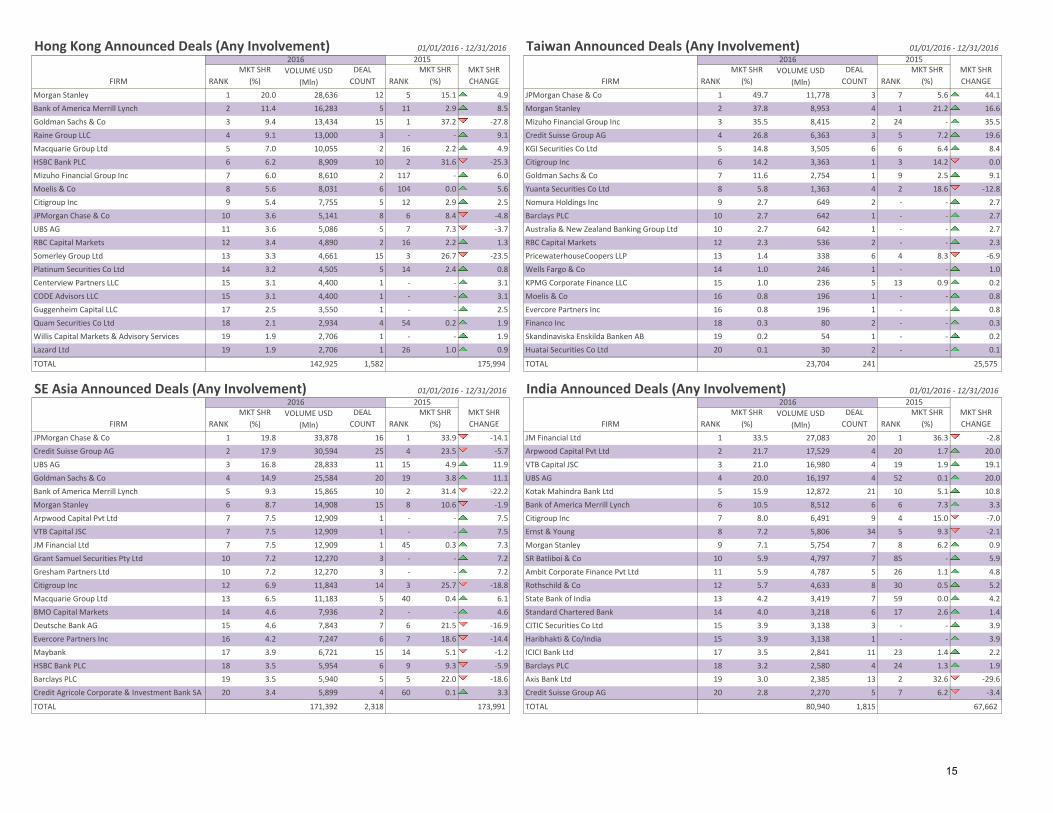
Hong Kong Announced Deals (Any Involvement) 01/01/2016 - 12/31/2016 Taiwan Announced Deals (Any Involvement) 01/01/2016 - 12/31/2016
Morgan Stanley 1 20.0 28,636 12 5 15.1 4.9 JPMorgan Chase & Co 1 49.7 11,778 3 7 5.6 44.1
Bank of America Merrill Lynch 2 11.4 16,283 5 11 2.9 8.5 Morgan Stanley 2 37.8 8,953 4 1 21.2 16.6
Goldman Sachs & Co 3 9.4 13,434 15 1 37.2 -27.8 Mizuho Financial Group Inc 3 35.5 8,415 2 24 - 35.5
Raine Group LLC 4 9.1 13,000 3 - - 9.1 Credit Suisse Group AG 4 26.8 6,363 3 5 7.2 19.6
Macquarie Group Ltd 5 7.0 10,055 2 16 2.2 4.9 KGI Securities Co Ltd 5 14.8 3,505 6 6 6.4 8.4
HSBC Bank PLC 6 6.2 8,909 10 2 31.6 -25.3 Citigroup Inc 6 14.2 3,363 1 3 14.2 0.0
Mizuho Financial Group Inc 7 6.0 8,610 2 117 - 6.0 Goldman Sachs & Co 7 11.6 2,754 1 9 2.5 9.1
Moelis & Co 8 5.6 8,031 6 104 0.0 5.6 Yuanta Securities Co Ltd 8 5.8 1,363 4 2 18.6 -12.8
Citigroup Inc 9 5.4 7,755 5 12 2.9 2.5 Nomura Holdings Inc 9 2.7 649 2 - - 2.7
JPMorgan Chase & Co 10 3.6 5,141 8 6 8.4 -4.8 Barclays PLC 10 2.7 642 1 - - 2.7
UBS AG 11 3.6 5,086 5 7 7.3 -3.7 Australia & New Zealand Banking Group Ltd 10 2.7 642 1 - - 2.7
RBC Capital Markets 12 3.4 4,890 2 16 2.2 1.3 RBC Capital Markets 12 2.3 536 2 - - 2.3
Somerley Group Ltd 13 3.3 4,661 15 3 26.7 -23.5 PricewaterhouseCoopers LLP 13 1.4 338 6 4 8.3 -6.9
Platinum Securities Co Ltd 14 3.2 4,505 5 14 2.4 0.8 Wells Fargo & Co 14 1.0 246 1 - - 1.0
Centerview Partners LLC 15 3.1 4,400 1 - - 3.1 KPMG Corporate Finance LLC 15 1.0 236 5 13 0.9 0.2
CODE Advisors LLC 15 3.1 4,400 1 - - 3.1 Moelis & Co 16 0.8 196 1 - - 0.8
Guggenheim Capital LLC 17 2.5 3,550 1 - - 2.5 Evercore Partners Inc 16 0.8 196 1 - - 0.8
Quam Securities Co Ltd 18 2.1 2,934 4 54 0.2 1.9 Financo Inc 18 0.3 80 2 - - 0.3
Willis Capital Markets & Advisory Services 19 1.9 2,706 1 - - 1.9 Skandinaviska Enskilda Banken AB 19 0.2 54 1 - - 0.2
Lazard Ltd 19 1.9 2,706 1 26 1.0 0.9 Huatai Securities Co Ltd 20 0.1 30 2 - - 0.1
TOTAL 142,925 1,582 TOTAL 23,704 241
SE Asia Announced Deals (Any Involvement) 01/01/2016 - 12/31/2016 India Announced Deals (Any Involvement) 01/01/2016 - 12/31/2016
JPMorgan Chase & Co 1 19.8 33,878 16 1 33.9 -14.1 JM Financial Ltd 1 33.5 27,083 20 1 36.3 -2.8
Credit Suisse Group AG 2 17.9 30,594 25 4 23.5 -5.7 Arpwood Capital Pvt Ltd 2 21.7 17,529 4 20 1.7 20.0
UBS AG 3 16.8 28,833 11 15 4.9 11.9 VTB Capital JSC 3 21.0 16,980 4 19 1.9 19.1
Goldman Sachs & Co 4 14.9 25,584 20 19 3.8 11.1 UBS AG 4 20.0 16,197 4 52 0.1 20.0
Bank of America Merrill Lynch 5 9.3 15,865 10 2 31.4 -22.2 Kotak Mahindra Bank Ltd 5 15.9 12,872 21 10 5.1 10.8
Morgan Stanley 6 8.7 14,908 15 8 10.6 -1.9 Bank of America Merrill Lynch 6 10.5 8,512 6 6 7.3 3.3
Arpwood Capital Pvt Ltd 7 7.5 12,909 1 - - 7.5 Citigroup Inc 7 8.0 6,491 9 4 15.0 -7.0
VTB Capital JSC 7 7.5 12,909 1 - - 7.5 Ernst & Young 8 7.2 5,806 34 5 9.3 -2.1
JM Financial Ltd 7 7.5 12,909 1 45 0.3 7.3 Morgan Stanley 9 7.1 5,754 7 8 6.2 0.9
Grant Samuel Securities Pty Ltd 10 7.2 12,270 3 - - 7.2 SR Batliboi & Co 10 5.9 4,797 7 85 - 5.9
Gresham Partners Ltd 10 7.2 12,270 3 - - 7.2 Ambit Corporate Finance Pvt Ltd 11 5.9 4,787 5 26 1.1 4.8
Citigroup Inc 12 6.9 11,843 14 3 25.7 -18.8 Rothschild & Co 12 5.7 4,633 8 30 0.5 5.2
Macquarie Group Ltd 13 6.5 11,183 5 40 0.4 6.1 State Bank of India 13 4.2 3,419 7 59 0.0 4.2
BMO Capital Markets 14 4.6 7,936 2 - - 4.6 Standard Chartered Bank 14 4.0 3,218 6 17 2.6 1.4
Deutsche Bank AG 15 4.6 7,843 7 6 21.5 -16.9 CITIC Securities Co Ltd 15 3.9 3,138 3 - - 3.9
Evercore Partners Inc 16 4.2 7,247 6 7 18.6 -14.4 Haribhakti & Co/India 15 3.9 3,138 1 - - 3.9
Maybank 17 3.9 6,721 15 14 5.1 -1.2 ICICI Bank Ltd 17 3.5 2,841 11 23 1.4 2.2
HSBC Bank PLC 18 3.5 5,954 6 9 9.3 -5.9 Barclays PLC 18 3.2 2,580 4 24 1.3 1.9
Barclays PLC 19 3.5 5,940 5 5 22.0 -18.6 Axis Bank Ltd 19 3.0 2,385 13 2 32.6 -29.6
Credit Agricole Corporate & Investment Bank SA 20 3.4 5,899 4 60 0.1 3.3 Credit Suisse Group AG 20 2.8 2,270 5 7 6.2 -3.4
TOTAL 171,392 2,318 TOTAL 80,940 1,815
RANK
MKT SHR
(%)FIRM
2016 2015MKT SHR
CHANGE FIRM
2016 2015
RANK
MKT SHR
(%)VOLUME USD
(Mln)
DEAL
COUNT RANK
MKT SHR
(%) RANK
MKT SHR
(%)VOLUME USD
(Mln)
FIRM
2016 2015MKT SHR
CHANGE FIRM
2016 2015MKT SHR
CHANGERANK
MKT SHR
(%)VOLUME USD
(Mln)
DEAL
COUNT RANK
MKT SHR
(%) RANK
MKT SHR
(%)VOLUME USD
(Mln)
DEAL
COUNT RANK
MKT SHR
(%)
175,994 25,575
173,991 67,662
MKT SHR
CHANGE
DEAL
COUNT
15
Bloomberg League Criteria
Announced Global League Tables are based upon announced total values, unless otherwise stated in the title. Non-US dollar values are
converted to US dollars at the time of announcement.
Credit will be given to transactions in which Bloomberg classifies as mergers, acquisitions, divestitures, self-tenders, or spin-offs.
Regional and industry League Tables will be based on the country of risk and industry of the ultimate publicly traded parent of a privately held company where applicable.
Advisors to any member of an investor group, consortium, or joint venture are eligible for full credit.
Advisory fees hold no weight over advisory credit.
General Database Criteria
A transaction is considered to have been announced upon the release of terms offered by the acquirer, and acknowledgement of the offer by
the target company.
Deals that are considered to be in proposed status will not be granted credit.
Full versions of Bloomberg’s League Tables Standards & Guidelines can be accessed on Bloomberg Professional:
{LPHP MA:0:1 2841628<GO>}.
Bloomberg L.P. reserves the right of final decision concerning league eligibility and requires adequate documentation for the same. Bloomberg L.P. and its suppliers believe the information herein was obtained from reliable sources, but they do not guarantee its accuracy. Neither the information nor the opinion expressed constitutes a solicitation of the purchase or sale of securities or commodities. Due to the dynamic nature of the Professional Service product, League Table rankings may vary between the quarterly/year-end publications and data found on the Bloomberg Professional Service.
16