global liquidity and cross-border bank flows · hosted by the de nederlandsche bank ... global...
TRANSCRIPT

Economic Policy 63rd Panel Meeting
Hosted by the De Nederlandsche Bank Amsterdam, 22-23 April 2016
The organisers would like to thank De Nederlandsche Bank for their support. The views expressed in this paper are those of the author(s) and not those of the supporting organization.
Global Liquidity and Cross-Border Bank Flows
Eugenio Cerutti (International Monetary Fund) Stijn Claessens (Federal Reserve Board)
Lev Ratnovski (International Monetary Fund)

Global Liquidity and Cross-Border Bank Flows
Eugenio Cerutti, Stijn Claessens, and Lev Ratnovski1
March 15, 2016
Prepared for April 2016, 63rd Economic Policy Panel meeting in Amsterdam
Abstract
The literature traditionally uses US monetary and financial factors as indicators of global financial conditions. This paper explores whether similar European factors also need to be considered when studying the behavior of cross-border bank flows. Using a longer time series and broader country sample than previous studies, we confirm that flows vary with uncertainty (VIX), US monetary policy (real interest rate and term spread), and US exchange rate (REER). In contrast to the existing literature, we find that US bank conditions are insignificant in explaining flows outside the global financial crisis. European bank conditions (euro area and UK large bank leverage or TED spreads) are, however, important throughout the 2000s, even outside the crisis. Taken together, our results suggest that global financial conditions are best captured by US monetary conditions and exchange rate dynamics, and European bank conditions. This finding is consistent with the important role of European banks in intermediating cross-border credit, including dollar-denominated credit.
JEL Classification: F21, F34, G15, G18, G21, G28. Keywords: Global Liquidity, International Banking, European Banks, Capital Flows
1 We thank Olivier Blanchard and Hyun Song Shin for useful discussions; Thomas Glaessner, Anastasia Kartasheva, Philip Lane, Jose Manuel Marques Sevillano, Robert McCauley, Steven Ongena, Alessandro Rebucci, Adrian van Rixtel, Bin Zhang, participants of the CEPR-EC-FRBNY conference “Macroeconomic Policy Mix in the Transatlantic Economy,” Magyar Nemzeti Bank-CEPR-Zurich-ROF conference “The Changing Role of Central Banks Post-Crisis,” ECB concluding conference of the Macroprudential Research Network, CBI-Trinity College tenth workshop “Macroeconomic of Global Interdependence,” IMF-FRB workshop on “International Dimensions of Monetary and Financial Policies”, BIS-DNB-Bundesbank-ROF network meeting on “Global Financial Interconnectedness”, the Bank of Spain session at LACEA congress (Santa Cruz), participants of seminars at IMF and Bank of England, the Editor and the three referees, and IMF colleagues for very useful comments on earlier versions of this paper. Yangfan Sun and Kelly Posenau provided excellent research assistance. All errors are ours. Cerutti and Ratnovski are with the International Monetary Fund; Claessens is with the Federal Reserve Board, CEPR and University of Amsterdam. This paper reflects the views of the authors, not those of the FRB or the IMF or IMF policy. An earlier version of the paper was published as IMF Working Paper 14/69 “Global Liquidity and the Drivers of Cross-Border Bank Flows”. Contacts: [email protected]; [email protected]; [email protected].

2
1. Introduction The financial cycle is increasingly global (Rey, 2013; Obstfeld, 2015). Figure 1 panel A illustrates this by plotting rolling 5-year correlations between credit growth in key financial centers – US, UK, euro area and Japan – and that in the rest of the world. It shows that the co-movement in credit growth across countries has increased markedly since the late 1990s. This greater synchronicity likely reflects in part deeper real economic integration of countries, as captured by the expansion of international trade, as well as deeper financial integration, as illustrated by the growth in cross-border bank claims, at least until the global financial crisis (Figure 1 panel B). Figure 1: Global financial conditions in an integrated global economy Panel A: Financial cycle more correlated
Rolling 5-year average correlations between total credit growth in the US, UK, euro area and Japan and the rest of the world. Source: BIS and authors’ calculations.
Panel B: Deeper real and financial integration
The share of trade and cross-border claims relative to GDP. Source: BIS, IMF, and authors’ calculations.
These commonalities give rise to the question what factors best capture the global nature of financial conditions. The literature has traditionally viewed economic and financial conditions in the United States (US) as good indicators of global financial conditions. Specifically, Forbes and Warnock (2012) and Rey (2013) relate global liquidity to investors’ uncertainty and risk aversion, as captured by the US VIX. Bruno and Shin (2015a) link global financial conditions to banks’ risk attitudes and funding conditions as proxied by the leverage of US broker-dealers. Bruno and Shin (2015b) emphasize US monetary conditions – the Fed Funds rate. And Bruno and Shin (2015b), McCauley et al. (2015) and Avdjiev et al. (2015) highlight the importance of the US dollar exchange rate as another factor behind global liquidity.2
2 Calvo et al. (1996) were the first to articulate the importance of global “push” factors, as opposed to country-specific “pull” factors, for cross-border capital flows, focusing on the US interest rate as an important factor. A number of papers have since used this push vs. pull distinction.

3
The purpose of this paper is to explore in detail and for the first time whether conditions in Europe can also usefully identify global financial conditions. (Europe includes here both the euro area and the UK, but we analyze the two separately.)3 There are good reasons to believe that conditions in Europe might be important indicators. Figure 2 panels A and B show that, since the mid-1980s, euro area and UK banks have provided more cross-border credit than US banks have, with the share of cross-border credit provided by euro area banks increasing, at least until the global financial crisis.4 Also, cross-border credit by euro area banks appears more volatile, which, given its magnitude, suggests that it might be a key factor in global financial conditions. Figure 2: The importance of European banks in providing cross-border credit Panel A: Cross-border claims on all countries, by origin, nominal
Panel B: Cross-border claims on all countries, by origin, share of total
Panel C: Cross-border claims on Asian countries, by origin, share of total
Panel D: Cross-border claims on Western Hemisphere, by origin, share of total
Furthermore, cross-border credit provided by euro area and UK banks is important across the globe – i.e., not just for borrowers in Central and Eastern Europe. Figure 2 panels C and D 3 We also considered conditions in Japan, but these were not robust in explaining variations in global financial conditions, in part given Japan’s own, long-lasting banking crisis and limited variation in its interest rates. To save space, the results for Japan are therefore not presented here, but are available in the working paper version (IMF WP/14/69). 4 All figures exclude claims on other financial centers (US, euro area, UK and Japan) and off-shore financial centers. That implies that within-euro area credit is also excluded.

4
show that, while Japanese banks provide much of the cross-border credit to Asia and US banks to Western Hemisphere, European banks were a key source of credit for countries in both Asia and the Western Hemisphere, especially in the 2000s. Europe’s role in cross-border credit has been noticed in the literature: Shin (2012) highlights the role of European banks in allocating US dollar funds to Asian borrowers. To study the importance of Europe for global financial conditions, our paper examines the relationships between key US and European financial and monetary indicators on the one hand, and global financial conditions, captured by changes in cross-border bank claims, on the other hand, while controlling for borrower-demand related factors. Bank claims are typically the most important form of non-FDI cross-border financing. Over the period of analysis, banks flows represented over 40% of total non-FDI flows to emerging market economies, and 80% of non-FDI flows to developing economies (Milesi-Ferretti and Tille, 2011; IMF, 2011). Periods of increasing cross-border claims indicate more favorable global financial conditions, while periods of decreasing claims indicate tighter financial conditions. We use the data on cross-border bank claims from a comprehensive source: the Locational dataset of the Bank of International Settlements’ International Banking Statistics (BIS IBS). The dataset and its benefits, such as the ability of using exchange rate adjusted flows and distinguishing between flows to banks and flows to non-banks, are described in Section 2. We start the analysis by replicating results of earlier studies on the relationship between cross-border bank flows and US economic and financial conditions. We find that cross-border flows decline with a higher US VIX (commonly used as a proxy for investor uncertainty and risk aversion); 5 increase with greater US broker-dealers’ leverage and decline with a higher US TED spread (two measures commonly used for bank funding conditions and bank risk attitudes); increase with higher US short-term real interest rates and decline with higher US term spreads (two measures of monetary conditions); 6 and decline with more US dollar appreciation (captured by the real effective exchange rate, REER; a measure related to the foreign borrowers’ ability to repay in US dollars). These results are in line with many existing findings on US factors of global financial conditions (e.g., McGuire and Tarashev, 2008; Avdjiev et al., 2012; Forbes and Warnock, 2012; Rey, 2013; Turner 2014; Bruno and Shin, 2015a,b; Cerutti, 2015; McCauley et al., 2015; Burger et al., 2015).
5 VIX is an options-based measure of expected financial markets volatility. The literature suggests that VIX may be partly endogenous to macroeconomic fundamentals and the monetary policy stance (Bekaert et al., 2013), and in principle can be decomposed into uncertainty and risk aversion components (Bollerslev et al., 2009). Exploring the endogeneity and decomposition of VIX is beyond the scope of this paper. 6 See Altunbas et al. (2014), Borio and Zhu (2012), Jimenez et al. (2014), Bruno and Shin (2015b) for a discussion of the link between monetary policy and bank risk-taking. The importance of term spread for cross-border flows is also consistent with a theoretical channel where banks borrow short-term and lend long-term, making their domestic investment opportunities less profitable when the yield curve is flatter. This in turn may trigger banks’ search for yield, including in cross-border activities.

5
We then expand on these earlier studies. Foremost, we consider the relationships between cross-border bank flows and economic and financial conditions in not only the US, but also in Europe – distinguishing the UK and the euro zone. We compare these findings with those based on US conditions only, and examine which measures of US and European conditions perform best in explaining cross-border bank flows. In addition, we consider how the relative importance of conditions in US and Europe varies over time. Specifically, we investigate the 2001-06, pre-crisis and 2010-14, post-crisis periods to understand whether the benchmark results obtained for the 2001-14 sample are driven exclusively by the crisis experience or hold also in ‘normal times’. And we study cross-border flows to bank and to non-bank (usually, non-financial corporate) borrowers. Our key results are as follows. - In terms of monetary policy (real rate and term spread) and exchange rate (REER)
indicators, US variables are consistently statistically and economically the most significant indicators of global financial conditions. Equivalent European variables are largely insignificant on their own and completely so when conducting a “horse-race” between US and European variables. This importance of US price effects is consistent with the US dollar being the dominant currency in cross-border lending and in line with the focus of existing studies on US monetary policy and exchange rate as determinants of global financial conditions. While the US monetary policy variables are somewhat less robust outside the crisis period, and the VIX loses much significance, they still dominate the European equivalents in terms of statistical significance and economic importance.
- For bank conditions, we find that US variables – broker-dealer leverage and TED spreads
– lose much of their significance in explaining cross-border bank flows outside the crisis period. In contrast, European bank conditions maintain their statistical significance even outside the crisis period, and have greater economic importance than the equivalent US variables (when those are significant). The result on the importance of European bank conditions for global cross-border bank flows is novel, and consistent with the large role of European banks in cross-border intermediation (Shin, 2012, Rey, 2013). As such, we extend the literature by showing that European bank conditions are an important indicator of global financial conditions, an often ignored fact.
Having established the main results on the importance of European bank conditions for cross-border flows, we engage in a number of robustness tests. These include comparing the statistical and economic significance of US and European monetary policy and bank conditions in explaining cross-border flows in univariate analyses (to deal with possible collinearities) and running a multivariate “horse-race” that gauges which combinations of US and European variables display most explanatory power. These tests show consistently that European bank conditions are at least as important, and often more important, correlates of global cross-border flows than US bank conditions are, especially outside the crisis period. In

6
another robustness check, we obtain similar results when considering cross-border flows to Asian and Western Hemisphere countries only, confirming that our results on the importance of European bank conditions are not driven by regional flows to Central and Eastern Europe. And we verify that most of our results hold not only for cross-border flows to banks, but also for flows to non-banks. To sum up, we show that the ‘push’ factors of global financial conditions are best captured by US monetary policy and exchange rate conditions, and European (euro area and UK) bank conditions. The result that US price variables are an important factor of global financial conditions is consistent with the large use of the US dollar in international claims and explains the frequent focus on US monetary conditions. The result that European bank conditions are important has multiple surveillance and policy implications. It helps to better identify the factors behind global financial conditions, to point towards cross-border vulnerabilities that might be related to European bank conditions, and (if one takes a causal view) to better assess the cross-border ramifications of policies that affect European banks. Our results are subject to the usual caveats of similar aggregate studies (such as Bruno and Shin 2015a; Avdjiev et al., 2012, etc.). While it is natural to think of economic and financial conditions in ‘financial center’ economies as exogenous drivers of cross-border bank flows, our aggregate-level analysis cannot formally reject reverse causation.7 Yet, the consistency of our results suggests that reverse causation is unlikely. For example, we find that US monetary policy conditions relate to cross-border flows to Latin America and Asia. It seems unlikely that US monetary policy is endogenous to such flows, particularly since we control for economic conditions in borrowing countries (which could be a common driving factor). The same applies to the fact that European bank conditions relate to cross-border bank flows to Asia and Latin America: it is hard to see how such flows can drive European bank conditions once we control for economic conditions in borrowing countries. Another limitation of our analysis is that our various US and European conditions might be not independent, but affect each other (e.g., US bank conditions might affect European banks and vice-versa; or US monetary policy may affect US banks’ conditions). With our data and analyses, we again cannot claim exogeneity and independence of the conditions in individual ‘financial center’ economies. Instead, we interpret our results as identifying a more complete set of indicators of global financial conditions, leaving causality and exogeneity tests to future research.
7 Better identification could be achieved through a difference-in-difference estimation using bilateral data, taking advantage of differences across multiple lenders, as in Cerutti and Claessens (2016), but bilateral locational data on cross-border claims is not public. Our paper aims to offer best possible estimates based on publicly available data.

7
The paper proceeds as follows. Section 2 describes the data and the empirical methodology. Section 3 presents the main analysis. We start with the benchmark results on US factors of global financial conditions. We then present results on European factors of global financial conditions, and compare them with respective US factors, both including and outside the crisis period. Section 4 offers robustness tests. Section 5 concludes. 2. Data and Empirical Strategy This section documents the data and describes the empirical methodology. The three key sets of data are the BIS IBS Locational data on cross-border bank claims on other countries’ banks and non-banks over 1990-2014 for a set of major ‘borrower’ economies that we use to capture global financial conditions; data on economic and financial conditions in ‘financial center’ economies (US, euro area, and UK) that we use as candidate indicators of global financial conditions; and data on borrower countries’ economic conditions that we use to control for demand factors. All these data are obtained on a quarterly basis. Data
We use data on cross-border bank claims from the Bank of International Settlements’ International Banking Statistics (BIS IBS). The BIS IBS comprises two datasets, the Locational and the Consolidated banking statistics. Both datasets capture the liabilities (loans, securities, and other claims) of domestic borrowers to foreign banks for the worlds’ largest banking systems. The difference between the two datasets is how they deal with balance sheets of foreign-controlled entities. Locational data is residence-based: locally-incorporated banks in the reporting country record their positions on an unconsolidated basis, including positions vis-à-vis their own affiliates in other countries (corresponding to traditional balance-of-payments accounting). For example, Locational data include a liability of a subsidiary of a foreign bank towards its parent. Consolidated data track banks’ worldwide consolidated gross claims and other exposures to individual countries, where banks net out intergroup positions and consolidate positions across offices worldwide. For example, Consolidated data report the liabilities of domestic firms to domestic subsidiaries of foreign banks, but not the liabilities of subsidiaries of foreign banks towards their parents (see Cerutti et al., 2014, for more details on the BIS IBS data). Our analysis is based on Locational data since conceptually those data conform closest to the notion that conditions in specific ‘financial center’ countries might affect flows to other countries, including flows to local subsidiaries. In addition, the Locational data has other unique advantages. First, it offers a time series starting in 1990 to present, which is longer than the datasets used in most existing studies. (Consolidated data is only consistently available since the mid-2000s.) Second, Locational data offers the possibility to construct

8
exchange rate-adjusted series.8 Adjusted series better capture actual choices to change cross-border positions, as opposed to unadjusted US dollars claims series, used in most other studies, which are affected by exchange rate movements, and thus reflect not only the net effects of loans extended and repaid over the period (excluding intra-period flows). We collect these data for the liabilities of 77 countries (58 borrowing countries when excluding US, euro area and UK) vis-à-vis the banking systems in the three financial centers.9 We also differentiate between liabilities of banks and non-banks in these countries. Figure 3 panel A shows the currency breakdown of cross-border bank claims over the sample period. It shows that about a half of total cross-border claims is denominated in US dollars, and another half in other currencies.10 Since exchange rates among the major creditor countries, including the three ‘financial center’ economies studied here, fluctuated considerably during the period studied (for example, the dollar to the British pound exchange rate moved between 1.4. and 2.1 $/£), differences between the changes in exchange rate adjusted and unadjusted claims can be large. Figure 3 panel B highlights the differences in the dynamics of the changes in cross-border claims when measured with and without exchange rate adjustments. Many observations deviate substantially from the 45 degree line. This means that exchange rate variations can lead to spurious changes in the unadjusted cross-border claims, as these are not associated with changes in non-US dollar underlying positions. Moreover, the average slope is shallower than the 45 degree line. So using the exchange rate unadjusted flows would systematically imply somewhat larger changes in cross-border claims than when using adjusted flows. Finally, as noted, the dataset distinguishes cross-border claims on banks from those on non-banks (which largely means non-financial corporations; cf. Chung et al., 2015). Figure 3 panels C and D contrasts the evolution of cross-border claims on banks with those on non-banks. It highlights that the shares of various ‘financial center’ economies were not identical for claims on banks and on non-banks, and have varied differently over time. This breakdown allows for robustness checks that explore whether global financial conditions explain flows to banks in the same way as they do flows to non-banks. A priori we expect that conditions within ‘financial centers’ might have a weaker relationship with flows to non-
8 Locational data series publicly available from the BIS consist of (non-adjusted) stock of claims and exchange rate adjusted flows. Taking the latest stock figures as a baseline, we derive exchange-rated-adjusted stocks for each quarter using the exchange-rate-adjusted flows. 9 As compared to, for example, 46 countries in Bruno and Shin (2015a) and 37 in Rey (2013). 10 Note that the share of US-based banks in cross-border claims (Figure 2, panel B) is much smaller than the share of US dollar-denominated claims (Figure 3, panel A), consistent with the fact that much of dollar-denominated claims originates from banks outside the US. McCauley et al. (2015) show that dollar credit to non-financial borrowers outside the US was about $8 trillion in 2014, exceeding its euro and yen counterparts, at $2.5 trillion and $0.6 trillion, respectively. Moreover, euro denominated credit is concentrated in the euro area’s neighbors.

9
banks than with those to banks.11 Figure 3: Currency and sector breakdowns of cross-border claims Panel A: Cross-border claims, by currency, share of total
Panel B: Changes in cross-border claims, adjusted vs. unadjusted for exchange rate movements
Panel C: Cross-border claims on banks, by origin, share of total claims on banks
Panel D: Cross-border claims on non-banks, by origin, share of total claims on non-banks
We next collect data on those economic and financial conditions in the US, euro area and UK which the literature has suggested might relate to global cross-border bank flows. Specifically, we collect for each of the three economies the stock option market derived implied volatility (VIX), bank leverage (broker dealer leverage for the US and the leverage of large, systemically important banks in the euro area and UK), TED spread (3 month interbank rate minus 3 month government bond yield), term spread (10 year minus 3 month government bond yields), real policy rate (deflated with CPI), real effective exchange rates, and the growth rates of M2. The sources of these measures are summarized in Table 1, presented separately for the US, UK and euro area.
11 For example, from the analysis of the composition of cross-border banking flows in Cerutti et al (2015), we know that cross-border syndicated loans to non-banks tend to have longer maturities than other cross-border claims (e.g., intragroup bank lending), and so might be less affected by short-term changes in pull factors.

10
Most of these measures are standard and obtained from the usual sources. One that deserves some discussion is bank leverage. Bank leverage has been used in the literature to proxy for financial intermediaries’ funding conditions (higher leverage indicating greater ease of funding) and risk attitudes (higher leverage indicating risk-on attitudes). For the US, the literature has traditionally used the leverage of broker-dealers, a subset of US financial intermediaries. Broker-dealer leverage is thought to be more reflective of fluctuations in US financial conditions compared to the leverage of traditional commercial banks, because broker-dealers are more reliant on market-based sources of funding and can expand their assets more rapidly (Adrian and Shin, 2010). As such, the literature interprets US broker-dealer leverage as a proxy for wider financial conditions, and has found a close relationship between broker-dealers’ leverage and cross-border bank flows (Bruno and Shin, 2015a). In Europe, broker-dealers play a smaller role in financial intermediation than in the US. Also, European broker-dealers are usually part of a larger banking group, rather than standalone entities, consistent with the universal banking model practiced there. Consequently, for the euro area and UK instead of broker-dealer leverage, we use the leverage of large banks, specifically those that are on the FSB list of globally systemically important banks (FSB, 2014). The reason is that these large banks – similar to US broker-dealers – are more reliant on market-based funding and more engaged in market-based financial intermediation than smaller European banks are. So their leverage may proxy better European bank funding conditions and risk attitudes. Since large bank leverage is a different (if conceptually close) measure of bank leverage than broker-dealer leverage, we check that our results are robust to using large bank leverage (rather than broker-dealers’ leverage) for US too.12 Lastly, in terms of borrower countries’ conditions, we include a number of variables standard in the capital flows literature. We use lagged GDP growth rate and inflation to control for credit demand, and the difference between the local and international interest rates to control for the price determinants of demand for cross-border credit. We also include country fixed effects, thus capturing any time-invariant factors that may drive differences in capital flows across countries. Table 1 contains the definitions and sources of all variables. Table 2 provides summary statistics and correlation matrixes. Panel A shows the large variation in cross-border flows. Panel B shows, besides the raw statistics of the explanatory variables, the correlations for the respective factors across the three ‘financial centers’. Interestingly, there are high correlations across ‘financial centers’ for some variables (such as the VIX), moderate for others (TED spreads), and relatively low for some others (notably, US broker-dealer leverage
12 Systemically important banks that we considered were: BBVA, BNP Paribas, Commerzbank, Crédit Agricole, Dexia, Deutsche Bank, ING, Santander, Société Generale, and Unicredit for euro area; Barclays, HSBC, and Royal Bank of Scotland for UK; and, in the robustness test, Bank of America, Citigroup, Goldman Sachs, JPMorgan Chase, Morgan Stanley, Bank of New York Mellon, State Street, and Wells Fargo for US.

11
with euro area and UK bank leverage). Real exchange rates are, unsurprisingly, negatively correlated with each other. The fact that some of these correlations are low suggests that the European variables may contain information that, at a minimum, is complementary to the information in respective US conditions. The evolution of these indicators is graphically depicted in Annex A. It shows again that some of the series (especially VIX) are highly correlated across ‘financial centers’, while others (notably bank leverage) are not. Table 2 Panel C provides the correlations between the various US factors. It shows that the US measures are largely uncorrelated with each other, with the exception of the level of the interest rate and the term spread, which are unsurprisingly negatively correlated. (Similar correlation patterns hold for euro area and UK, but are not reported.) Finally, Table 3 provides the list of countries, as well as their regional classification used in robustness tests. Empirical specification
The base estimation consists of a panel regression with country fixed effects and standard errors clustered at the borrower country level:
jtjttjjt tionsenterCondiFinancialCorsDemandFactL 24,10
where the dependent variable ∆Ljt is the quarterly difference in the log of the exchange rate adjusted stock of cross-border claims on (liabilities of) a borrower country j at time t; DemandFactorsjt are the proxies for country j domestic demand for cross-border funding at time t, with a lag; FinancialCenterConditionst is the set of US (or euro area, or UK) economic and financial variables – candidate indicators of global financial conditions; γj are country fixed effects; and εj,t is the error term.13 We use two dependent variables, ∆Ljt: cross-border claims on the banking sector of country j, and cross-border claims on the non-bank sector of country j. For simplicity, we use the terms “flows” to banks and non-banks as short hand for the changes in exchange rate adjusted stocks of cross-border claims. 3. US and European factors of global financial conditions
We can now present our empirical results. We first discuss the base regression that explores US factors associated with cross-border bank flows for the longest available period, 1990-2014. We then address the so far unexplored question whether conditions in other ‘financial center’ economies – in our case, euro area and the UK – might also be important in terms of their associations with cross-border flows. We also consider different time periods.
13 In addition to the specification with contemporaneous ‘push’ factors, we tested all regressions using specifications with push factors lagged 4 quarters, and found that the results to be robust (not reported).
12
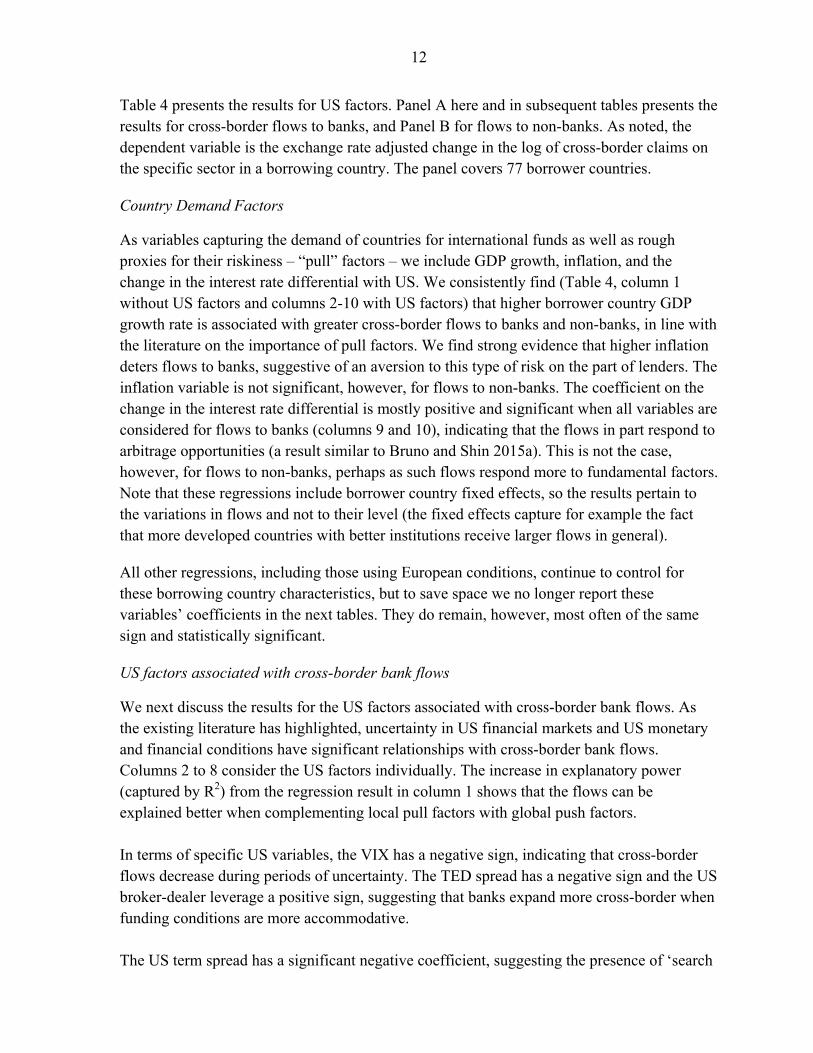
Table 4 presents the results for US factors. Panel A here and in subsequent tables presents the results for cross-border flows to banks, and Panel B for flows to non-banks. As noted, the dependent variable is the exchange rate adjusted change in the log of cross-border claims on the specific sector in a borrowing country. The panel covers 77 borrower countries.
Country Demand Factors
As variables capturing the demand of countries for international funds as well as rough proxies for their riskiness – “pull” factors – we include GDP growth, inflation, and the change in the interest rate differential with US. We consistently find (Table 4, column 1 without US factors and columns 2-10 with US factors) that higher borrower country GDP growth rate is associated with greater cross-border flows to banks and non-banks, in line with the literature on the importance of pull factors. We find strong evidence that higher inflation deters flows to banks, suggestive of an aversion to this type of risk on the part of lenders. The inflation variable is not significant, however, for flows to non-banks. The coefficient on the change in the interest rate differential is mostly positive and significant when all variables are considered for flows to banks (columns 9 and 10), indicating that the flows in part respond to arbitrage opportunities (a result similar to Bruno and Shin 2015a). This is not the case, however, for flows to non-banks, perhaps as such flows respond more to fundamental factors. Note that these regressions include borrower country fixed effects, so the results pertain to the variations in flows and not to their level (the fixed effects capture for example the fact that more developed countries with better institutions receive larger flows in general).
All other regressions, including those using European conditions, continue to control for these borrowing country characteristics, but to save space we no longer report these variables’ coefficients in the next tables. They do remain, however, most often of the same sign and statistically significant.
US factors associated with cross-border bank flows
We next discuss the results for the US factors associated with cross-border bank flows. As the existing literature has highlighted, uncertainty in US financial markets and US monetary and financial conditions have significant relationships with cross-border bank flows. Columns 2 to 8 consider the US factors individually. The increase in explanatory power (captured by R2) from the regression result in column 1 shows that the flows can be explained better when complementing local pull factors with global push factors. In terms of specific US variables, the VIX has a negative sign, indicating that cross-border flows decrease during periods of uncertainty. The TED spread has a negative sign and the US broker-dealer leverage a positive sign, suggesting that banks expand more cross-border when funding conditions are more accommodative. The US term spread has a significant negative coefficient, suggesting the presence of ‘search

13
for yield’ incentives in globally active banks: when US domestic longer-term investment opportunities are less attractive relative to banks’ shorter-term funding costs, cross-border flows increase. The US real short-term interest rate has a significant positive sign, indicating that during less favorable economic conditions – when interest rates are lower – global banks tend to lend less cross-border. This is consistent with Correa et al. (2015) who also find that, controlling for demand conditions in recipient countries, cross-border bank flows increase with tighter monetary policy in source countries. The result suggests that the view that low interest rates correspond to increased bank risk-taking does not apply to cross-border bank flows over this longer period. Rather the fact that rates on their own are positively related to flows suggests that favorable US economic conditions, which induce less accommodative monetary policy, are conducive to cross-border flows. We also find that changes in US REER and M2 are negatively associated with cross-border bank flows. These may represent the effects of a flight to quality to the US. During the risk-off episodes, the dollar appreciates and the demand for US safe assets increases, boosting REER and M2, while cross-border flows decline. For the REER, the negative sign may also reflect greater concerns about borrower creditworthiness, because a stronger dollar implies weaker balance sheets of dollar-funded foreign borrowers. While this REER result is similar to Bruno and Shin (2015a) and McCauley et al. (2015), we show that it is robust to using exchange-rate adjusted changes in bank claims, important given that exchange rate movements themselves can drive much of the reported change in unadjusted claims. Since the correlations among most individual US factors are relatively moderate (except for that between the policy rate and the term spread, see Table 2, Panel C), we can run regressions that include most drivers simultaneously (columns 9-10). The “pull” factors as well as various US conditions – TED spread, broker-dealer leverage, the term spread, and the REER – remain significantly associated with cross-border flows to banks and non-banks. The VIX, M2 growth, and real interest rates are statistically significant in most but not all specifications across banks and non-bank flows. The economic effects implied by the regression results are substantial. Based on the regression results in columns 2-7, an increase in VIX from its 25th to its 75th percentile is associated with 6.0% lower cross-border flows to banks; a similar increase in TED spreads with 3.5% lower flows; and a similar increase in broker-dealer leverage with 14.1% lower flows. This highlights the relative importance of US broker-dealer leverage in capturing conditions relevant for cross-border bank flows. An increase in the term spread, a reduction in the real interest rate, or an increase in REER from the respective 25th to 75th percentiles are each associated with 4.1%-7.6% higher cross-border flows to banks. This suggests that the US monetary policy stance and REER are as important for cross-border flows as market uncertainty or TED spreads are, but less important than bank conditions as captured by broker-dealer leverage. The economic effects of changes in US conditions on cross-border flows to non-banks have a slightly smaller magnitude.

14
European factors associated with global financial conditions, during the 2000s
So far we have followed the existing literature by considering US related factors of cross-border bank flows. We next move to the so far unexplored question whether euro area and UK monetary and financial conditions might also be important in terms of their association with cross-border flows. To answer this question, we use series for the euro area and UK that are similar to the US series used in Table 4. As noted, for the euro area and UK we use large banks’ leverage instead of broker-dealer leverage.
We focus this analysis on 2001-14, the period of major financial globalization. (We will later show regression results for the 2001-06 and 2010-14 subsamples that exclude the global financial crisis.) The regressions use a sample of borrower countries that excludes all euro area countries and UK, as well as US and Japan. This allows us to abstract from the impact of euro area and UK conditions on within-euro area cross-border flows (the euro area represents 16 borrower countries in the dataset), so as to capture true cross-border associations of the European ‘push’ factors. This means that, while Table 4 includes claims for 77 countries (all available borrower countries), all of the next regressions include at most 58 countries (excluding US, the euro area, UK, and Japan). Table 5 displays the regression results for the relationships between cross-border bank flows and the monetary and financial conditions in the US, euro area, and UK. Since the term spread and real interest rate within each of these countries are highly correlated, we cannot include them simultaneously. We therefore compare the explanatory power of these monetary policy variables separately. Panel A again reports the results for flows to banks and Panel B for flows to non-banks. As before, we find mixed evidence on the significance of the uncertainty variables. US VIX is rarely significant, and while euro area VIX is negatively associated with flows to both banks and non-banks, UK VIX is insignificant throughout. Our perhaps most interesting results are those on bank conditions. Although the US TED spread has a statistically significant negative association with flows to banks, the coefficients for the euro area and UK TED spreads are much larger (also compared to their standard deviations), hinting at a stronger economic impact. Similarly, US broker-dealer leverage is statistically significant only in specification (1), whereas euro area and UK large bank leverage are significant throughout and have larger coefficients (also compared to the differences in their standard deviations). These differences are similar for the flows to non-banks, where the euro area and UK TED spreads are statistically significant, but the US TED spread is not. Similarly, the euro area and UK bank leverage are consistently significant and have higher coefficients (also compared to their standard deviations) than US broker-dealer leverage. Together, these are first indications that European bank conditions may be better indicators of global financial conditions than US bank conditions are.

15
As a robustness check, specifications (3) and (4) use US large bank leverage (constructed similarly to European large bank leverage) instead of broker-dealer leverage. We find that US large bank leverage performs worse than broker-dealer leverage. It is insignificant in regressions for flows to banks, and has only one (marginally) significant coefficient for flows to non-banks. The fact that US large bank leverage is largely uninformative for global financial conditions is consistent with a relatively narrow role of commercial banks in US financial system, and confirms the focus of Adrian and Shin (2010) and Bruno and Shin (2015a) on US broker-dealer leverage as a measure of US financial conditions. In terms of monetary policy, while the US term spread and policy rate are significant in explaining flows both to banks and non-banks, neither the euro area nor the UK term spreads and policy rates display significant coefficients. This suggests that US monetary conditions are better indicators of global financial conditions for bank and non-bank borrowers than euro area or UK monetary conditions are, consistent with the dominant role of the US dollar as the numeraire currency for cross-border bank claims. For the REER variable, there is heterogeneity across the three countries. In contrast to the US REER, changes in the UK REER relate positively to cross-border flows, both to banks and non-banks. This might reflect the negative correlation between the US dollar and UK pound REERs, so that the relation of the UK REER with cross-border flows is simply a mirror of that of the US REER. The might also reflect the fact that UK exports a substantial volume of financial services, so its exchange rate appreciates during buoyant global financial conditions. Indeed, once we control for the US REER (not reported) or the fact that the UK REER sharply depreciated at the peak of the global financial crisis (next section), the UK REER becomes less or not statistically significant. This last explanation is also supported by the fact that the euro area REER, like the US one, is negatively related to flows to non-banks. Differences across the three economies also show up in the regression for M2 growth. In contrast to US M2 growth, UK M2 growth is positively related to cross-border flows, as is euro area M2 growth in one specification for non-banks (panel B column 5). This might be because the expansion of M2 in Europe implies an increase in bank deposits, hence stronger bank balance sheets and more cross-border flows. As such, the different signs may reflect the varying importance of financial center economies as ‘flight to safety’ destinations (US more important) and differences in how monetary aggregates relate to bank balance sheet strength (more so in bank-dominated euro area and UK). 2000s outside the crisis The analyses so far have included the global financial crisis period and its close aftermath. The correlations between various variables, both dependent and explanatory, might have been especially high during the crisis, and not representative of “normal” times. Also the behavior of banks may have been starkly different before, during, and after the crisis, given

16
the shocks, the needs for many banks in advanced countries to repair their balance sheets and profitability, and the string of new regulations and heightened supervisory scrutiny following the crisis. We therefore redo the regressions of Table 5 for the pre-crisis 2001-06 and the post-crisis 2010-14 periods, to see if results differ from those for the full 2001-14 period (which includes the 2007-09 financial crisis). Table 6 reports the regression results.14 A comparison of Tables 5 and 6 shows that the results for the full 2000-14 sample were, in effect, boosted by the global financial crisis. When the crisis period is omitted, fewer coefficients are statistically significant (of course, the number of observations also drops, by half or more). In particular, US bank conditions – broker-dealer leverage and TED spreads – are no longer significantly related to flows in all specifications and periods (for the flows to non-banks in 2010-14 US TED spread has a marginally significant, but with a positive, i.e. incorrect sign). Strikingly, and in contrast, many European bank conditions variables remain significantly associated with cross-border flows. Euro area and UK bank leverage are significantly related to cross-border flows to banks in 2001-06; as are euro area and UK TED spreads in 2010-14 (except in one specification). European bank conditions maintain their significance also for flows to non-banks in 2010-14 (although rarely so in 2001-06.) This suggests that European bank conditions retain their role as indicators of global financial conditions outside the global financial crisis period, in sharp contrast to US bank conditions. In terms of the other variables, the US term spread relates significantly to flows to non-banks in 2001-06, and the US real interest rate to flows to banks in 2010-14. European monetary policy variables are rarely and then only marginally statistically significant. So US monetary policy variables are better indicators of global financial conditions than European monetary policy variables are, also outside the crisis. The results on REER and M2 are consistent with those in Table 5 for 2001-14, but more muted.15 Relative explanatory power and economic significance of US and European bank conditions We have shown so far that whereas both US and European bank conditions are associated with cross-border bank flows in a time sample that includes the global financial crisis, US bank conditions lose their significance outside the crisis. In contrast, many European bank conditions remain significant outside the crisis. The reporting so far has focused on
14 The small drop in the number of countries in the 2001-06 and 2010-14 subsamples is driven by the fact that we are using an unbalanced panel. 15 We also explored what factors relate to global financial conditions in the 1990s – before the major financial globalization period (not reported). This shows that in the 1990s, UK TED spread and US broker-dealer leverage mattered for bank flows, and US broker-dealer leverage mattered for non-bank flows. Also, M2 growth in the euro and the UK appear to have played some role. Overall though, results suggest that US conditions were the dominant force behind global financial conditions in the 1990s, consistent with the lower importance of European banks at that time. Overall, given the relatively low significance of most ‘push’ variables, the regressions suggest that the push factors of global financial conditions gained in importance during the 2000s’ period of major financial globalization.

17
differences in statistical significance of European and US indicators. We now proceed to examine their relative explanatory power and economic significance. We start by comparing them in univariate regressions. We then conduct a multivariate “horse-race” between all US and European monetary policy and bank conditions to assess which set of variables (possibly combining those from various ‘financial center’ economies) has the highest explanatory power for cross-border flows. Table 7 shows the coefficients, statistical significance, and explanatory power of US, euro area and UK bank characteristics in “univariate” regressions where a single bank conditions variable is related to cross-border bank flows (controlling for borrower country demand factors and fixed effects). It shows that the bank conditions variables for the euro and UK are more pronounced in terms of coefficients’ statistical significance as well as overall explanatory power. Although the whole 2001-14 period (panel A columns 1-2), all US, euro area and UK bank conditions are statistically significant, the UK TED spread has the highest explanatory power as captured by R2. For the two sub-periods that exclude the financial crisis – 2001-06 and 2010-14 – some US bank characteristics lose statistical significance (columns 4 and 5) or even change sign (column 6), while many of the euro area and UK bank conditions remain statistically significant and achieve higher explanatory power than US bank conditions. Results are similar for flows to non-banks (panel B). The results of Table 7 can be used to compare the economic effects implied by the relationships between US and European bank conditions and cross-border flows. During 2001-14 (i.e., including the crisis years), an increase in the US TED spread from its 25th to 75th percentile is associated with 3.2% lower cross-border flows to banks, and a similar increase in the euro area and UK TED spreads with 4.3%-6.8% lower flows. A similar increase in euro area large bank leverage is associated with an increase in flows of 7.0%, but an increase of US broker-dealer leverage with a much larger increase, 16.8%. Interestingly, and consistent with the earlier results, the dominant economic effect of US broker-dealers’ leverage dissipates once the crisis years are excluded. For 2001-06, an increase in US broker-dealer leverage from its 25th to 75th percentile is associated with an increase in cross-border flows to banks of only 2.5%, while a similar increase in euro area or UK large bank leverage with a substantially larger increase of 9.8-10.5%. For TED spreads, UK conditions dominate as well. An increase in UK TED spread for 2001-06 from its 25th to 75th percentile is associated with a reduction in cross border bank flows by 6.6%, as opposed to the smaller 2.8% effect of an increase in US TED spread. As before, the results are consistent, but of smaller magnitude and significance for flows to non-banks. Taken together, the results suggest that, outside the crisis and in univariate regressions, European bank conditions have a stronger economic association with cross-border bank flows than US bank conditions do. Accordingly, European bank conditions might be better indicators of global financial conditions than US bank conditions are.

18
As a next exercise, we investigate the relative explanatory power of US and European monetary and financial conditions in multivariate regressions, which combine relevant variables from various ‘financial center’ economies so as to establish which combinations of coefficients deliver the highest explanatory power for cross-border bank flows. Specifically, we run a series of multivariate regressions where we allow for combining US, euro area and UK variables. Since we have quite a few variables, the number of possible multivariate regressions could be very large. We therefore focus on combinations within the subsets of relevant variables of most interest: monetary conditions, as they are most directly affected by policy, and bank conditions, since they, as shown, are most interesting in terms of the US vs. Europe comparison. The specific variables we consider are: the real interest rate or term spread, TED spread, and bank leverage, all for each of the three countries. Altogether, this means that we run 54 regressions. (That is, 6 possible monetary variables – interest rate or term spread for each of the three ‘financial center’ countries, 3 TED spread variables, and 3 bank leverage variables.) We then rank the regressions by explanatory power and compare the best explanatory power with that achieved when using only US variables. The regressions control (not reported) for US VIX, REER, and M2 growth as well as borrower country demand factors and fixed effects. The results are reported in Table 8. In terms of explanatory power, the “best” regression for flows to banks is the one with the US term spread, UK TED spread and UK leverage (panel A, top, row 1). The result based on US variables only (row 2, which replicates the regression results of Table 5, column 2) ranks 19 out of 54 in terms of overall R2. This relative ranking is even starker when we consider the 2001-06 period for flows to banks (panel A, bottom). For this period, the regression that uses US variables only ranks 45 out of 54. Including European bank conditions doubles the explanatory power compared to using only US variables. Whereas including European bank conditions helps boost explanatory power, European monetary conditions are not crucial. In both samples, the regression with the most explanatory power is based on US monetary policy variables and European bank conditions. The results for the flows to non-banks show a similar if somewhat less stark difference between the best regression and that one based on US variables only. We stop short of assessing whether the increases in R2 achieved when including European bank conditions are statistically significant (differences in R2, while showing consistent results, are admittedly small). Still, the results of the multivariate analysis are consistent with those from the univariate analysis in Table 7. The “horse-races” overall thus suggest that European bank conditions are at least as good, or possibly better, indicators of global financial conditions than US bank conditions, especially outside the financial crisis period. 4. Robustness: Flows to Asia and Western Hemisphere All results so far indicate that, in terms of factors related to global financial conditions, US monetary policy is more important than European monetary policy, but European bank conditions are more important than US bank conditions, especially outside the crisis. To

19
establish the robustness of this finding, we study whether the results on the importance of European bank conditions hold beyond the European region. The purpose is to abstract from cross-border flows to (non-euro area) Central and Easter Europe, a region that is directly much affected by economic and financial conditions in the euro area and UK. We therefore run the same univariate and multivariate comparisons as in Tables 7 and 8, but for bank flows to Asia and Western Hemisphere – the regions that are geographically and economically relatively more remote from Europe. We first check the importance of euro area and UK bank conditions for flows to Asia and Western Hemisphere in a “univariate” setting similar to Table 7. The results are reported in Table 9. As before, we focus on one explanatory variable at a time, while continuing to control for borrower country demand factors and fixed effects. Results confirm that European bank conditions have explanatory power beyond their own region, and again exceed, in statistical significance and explanatory power, the corresponding US factors. In particular, euro area and UK TED spreads have higher coefficients (adjusting for differences in standard deviations) and explanatory power for cross-border bank flows to Asia than the US TED spread does in 2001-14 (columns 1). Similarly, the UK TED spread is more important than the US TED spread for flows to Latin America. Also, euro area and UK bank leverage are significant and have relatively high explanatory power in 2001-06 for flows to Asia, and well as for flows to Latin America to non-banks, whereas US bank leverage is never statistically significant, except for non-bank flows to Latin America in 2001-14. We next examine whether euro area and UK bank conditions matter for cross-border bank flows to Asia and Western Hemisphere in a multivariate “horse-race” specification similar to Table 8. The results are reported in Table 10. Here, 5 out of the 8 regressions with the highest R2 are those based on US monetary policy factors, and for the other three cases the US monetary policy indicators are very close to the top regressions. This highlights the global importance of US monetary policy. At the same time, similar to before, European bank conditions win out in the “horse-race” with the equivalent US variables. The UK TED spread ranks first in 6 out of 8 regressions, and UK or euro area bank leverage in 5 out of 8 regressions. The regressions based on US variables rank worse and have lower R2 than regressions that allow for European bank conditions, especially outside the crisis period. Overall, we again obtain consistent results that highlight US monetary policy and European bank conditions as indicators of global financial conditions, even when focusing on flows to Asia and Latin America.
5. Conclusions, and Policy and Research Implications This paper extends traditional analysis of US factors of global financial conditions by considering whether euro area and UK factors also play a role. We start by replicating pre-existing findings on the association between US monetary and financial conditions and cross-border bank flows – a proxy for global financial conditions. We consider a number of US

20
‘push’ factors – financial market volatility (VIX), bank conditions (TED spread and broker-dealer leverage), monetary conditions (real short-term rate and term spread), and the real US dollar exchange rate, alongside borrower country-specific ‘pull’ factors. The results on these US factors are consistent with the earlier literature on push and pull factors (Calvo et al., 1996 and Chuhan et al., 1998) and recent work on common factors of capital flows (Rey, 2013 and Bruno and Shin, 2015a, 2015b). This paper then extends the literature by considering an important and so far unexplored question of whether European push factors are also important in terms of their association with cross-border flows. Indeed, in recent decades, the share of cross-border credit originating from the euro area and UK increased substantially, suggesting a growing global importance of conditions in those economies. Consistent with this prior, we find that euro area and UK bank conditions, captured by large banks’ leverage and TED spreads, also relate to cross-border bank flows and often with higher statistical and economic significance than the equivalent US conditions. Strikingly, US bank conditions lose significance in explaining cross-border flows outside the global financial crisis period, while euro area and UK bank conditions remain statistically significant and economically important in many specifications. Unlike bank condition variables, US monetary policy factors and the real exchange rate are dominant, compared to similar European variables, in almost all specifications. Taken together, our results suggest that ‘push' factors of global financial conditions are best captured by US monetary conditions and exchange rate dynamics, and by European (euro area and UK) bank conditions. The results are consistent with the important role of the US dollar in global cross-border banking (McCauley et al. 2015) and the large role of European banks in intermediating (dollar- and other denominated) cross-border credit (Shin, 2012). We do not claim to have documented causality in these results. Most conservatively, the associations we identify suggest that US monetary and exchange rate conditions and European bank conditions are good indicators of global financial conditions. Even this non-causal interpretation offers important implications for refining efforts in monitoring external conditions and developing early warning indicators, as it makes clear that these need to give a prominent role to European bank conditions. Acknowledging the important role of European bank conditions as an indicator may help to better understand the dynamics of global financial cycles, as well as to identify possible cross-border vulnerabilities. More generally, the paper highlights the association between the conditions of large, global banks and global financial conditions. As such, monitoring liquidity, funding, and credit conditions in large financial institutions, especially in Europe, can be critically important for capturing global financial vulnerabilities. Although we cannot formally reject it, the consistency of our results suggests that reverse causation is unlikely. For example, it is unlikely that US monetary policy or European bank conditions are endogenous to cross-border bank flows to Asia and Latin America, especially

21
once we control for economic growth in the borrowing countries. If one were thus to interpret (based on such qualitative economic arguments) our results with a degree of causality, then additional policy implications follow. For example, ignoring the importance of European bank conditions for cross-border credit might lead observers to understate the global implications of European financial stability policies. Also, a causal interpretation would call for stronger domestic and international policy responses to weaknesses in global banks, as that might have ramifications for global financial conditions. At the same time, because the US rather than European monetary policy remains key to global financial conditions, a causal interpretation would suggest that the spillovers from ECB’s unconventional monetary accommodation might be smaller than some anticipate given the still weak banking systems in the euro area. Our paper uses BIS IBS Locational data because it provides unique benefits in terms of length, breadth, and quality (including exchange rates adjustments), which makes it well suited for the purpose of this study. Going forward, the recent enhancements to BIS data offer further disaggregation (e.g. Locational statistics that reflect both the nationality of reporting banks and the residence of counterparty since 2012Q2) that could be used to assess whether domestically-funded claims of subsidiaries of foreign banks depend on conditions in financial centers (where many parent banks reside). Cetorelli and Goldberg (2012a and 2012b), using US supervisory data, already show that US monetary policy and parent bank financial conditions matter for US bank subsidiaries, even the domestically-funded ones. Furthermore, as Claessens and Van Horen (2015) highlight, although European banks have retreated following their expansion before the pre-global financial crisis period, they still have a large foreign presence in the form of subsidiaries. Therefore, there are reasons to believe that our findings on the importance of European bank conditions will also hold for lending by domestically-funded subsidiaries abroad. But this remains to be verified. Future research could use BIS data with bilateral and currency decompositions of flows (at the moment, this data is not publicly available).16 And research could consider whether the conditions of European banks remain relevant in the “second phase of global liquidity” (Shin, 2013) – the increase in recent years of funding of emerging market banks and corporations in bond market. (This might be the case to an extent that European banks hold or underwrite such bonds.) More generally, we envision that as the post-crisis enhancements to cross-border data are made effective, the analysis of bank flows and funding conditions and of their role in the transmission of conditions across countries can be enriched. Finally, the real economic implications of the various global conditions deserve more attention in light of the
16 Using the recently enhanced BIS IBS, Avdjiev and Takáts (2016) map the major currency networks in international banking and analyze dollar flows during the 2013 Fed taper tantrum. They show that the US dollar share accounted for nearly half of the explained variation in cross-border lending dynamics across lender-borrower pairs. These data are, however, not publicly available and are only available after Q2, 2012.

22
findings on how domestic financial conditions can affect real outcomes (Claessens et al. 2009).

23
References Adrian, T., and H. S. Shin, 2010, “Liquidity and leverage,” Journal of Financial
Intermediation, 19(3), 418-437.
Altunbas, Y., L. Gambacorta, and D. Marqués-Ibáñez., 2014, “Does monetary policy affect bank risk-taking?” International Journal of Central Banking, March, 10:1, 95-135.
Avdjiev, S., Z. Kuti, and E. Takáts, 2012, “The Euro area Crisis and Cross-border Bank Lending to Emerging Countries,” BIS Quarterly Review, December.
Avdjiev, S., R. McCauley and H.-S. Shin, 2015, “Breaking free of the triple coincidence in international finance,” BIS Working Paper 524.
Avdjiev, S. and E. Takáts, 2016, “Monetary policy spillovers and currency networks in cross-border bank lending,” BIS Working Papers 549.
Bekaert, G., M. Hoerova, M., and M. Lo Duca. 2013, “Risk, uncertainty and monetary policy,” Journal of Monetary Economics, 60 (7), 771-788.
Bollerslev, T., Tauchen, G., and Zhou, H., 2009. “Expected stock returns and variance risk premia,” Review of Financial Studies, 22(11), 4463-4492.
Borio, C. E. and H. Zhu, 2012. "Capital regulation, risk-taking and monetary policy: A missing link in the transmission mechanism?," Journal of Financial Stability, 8(4), 236-251.
Bruno, V. and H. S, Shin, 2015a, “Cross-Border Banking and Global Liquidity,” Review of Economic Studies, 82 (2), 535-564.
Bruno, V., and H. S. Shin, 2015b, “Capital Flows and the Risk-Taking Channel of Monetary Policy,” Journal of Monetary Economics, 71, 119–132.
Burger. J., R. Sengupta, F. Warnock, and V. Warnock, 2015, “US investment in global bonds: as the Fed pushes, some EMEs pull,” Economic Policy, 84, 731-766.
Calvo, G., L. Leiderman, and C. Reinhart. 1996. “Inflows of Capital to Developing Countries in the 1990s.” Journal of Economic Perspectives 10(2), 123-139.
Cerutti, E., 2015, “Drivers of cross-border banking exposures during the crisis,” Journal of Banking and Finance, 55, 340-357.
Cerutti. E., and S. Claessens, 2016, “The Great Cross-Border Bank Deleveraging: Supply Constraints and Intra-Group Frictions,” Review of Finance, forthcoming.
Cerutti, E., S. Claessens, and P. McGuire, 2014, “Systemic Risks in Global Banking: What Available Data can Tell Us and what More Data are Needed?” in M. K. Brunnermeier and A. Krishnamurthy eds., Systemic Risk and Macro Modeling. Chicago: NBER and University of Chicago Press, 235-260.

24
Cerutti, E., S. Claessens, and L. Ratnovski, 2014, “Global Liquidity and Drivers of Cross-Border Bank Flows,” IMF Working Paper 14/69.
Cerutti, E., G. Hale, and C. Minoiu, 2015, “Financial Crisis and the Composition of Cross-border Lending,” Journal of International Money and Finance, 52, 60-81.
Cetorelli, N., and L. Goldberg, 2012a, “Liquidity Management of US Global Banks: Internal Capital Markets in the Great Recession,” Journal of International Economics, 88, 299-311.
–––––, 2012b, “Banking Globalization and Monetary Transmission,” Journal of Finance, 67(5), 1811-1843.
Chuhan, P., Claessens, S., and N. Mamingi, 1998, “Equity and Bond Flows to Asia and Latin America. The Role of Global and Country Factors,” Journal of Development Economics, 55, 439-63.
Chung, K., J. E. Lee, E. Loukoianova, E., M. Park, and H. S, Shin, 2015, “Global liquidity through the lens of monetary aggregates,” Economic Policy, 82, 231-290
Claessens, S., M. A. Kose, and M. Terrones, 2009, “What Happens during Recessions, Crunches and Busts?,” Economic Policy, 60, 653-700.
Claessens, S. and N. van Horen, 2015, “The Impact of the Global Financial Crisis on Banking Globalization,” IMF Economic Review, 63(4), 868-918.
Correa, Ricardo, Teodora Paligorova, Horacio Sapienza, and Andrei Zlate. 2015, “Cross-Border Bank Flows and Monetary Policy,” Mimeo, Federal Reserve Board, Washington, D.C.
Forbes, K. J., and F. E. Warnock, 2012, “Capital flow waves: Surges, stops, flight, and retrenchment” Journal of International Economics, 88(2), 235-251.
FSB [Financial Stability Board], 2014, “2014 Update of List of Global Systemically Important Banks (G-SIBs)”
International Monetary Fund, 2011, International Capital Flows: Reliable or Fickle?, Chapter 4, World Economic Outlook, Washington, D.C.
Jiménez, G., S. Ongena, J.L. Peydró-Alcalde and J. Saurina, 2014. “Hazardous Times for Monetary Policy: What Do Twenty-Three Million Bank Loans Say About the Effects of Monetary Policy on Credit Risk?,” Econometrica, 82 (2), 463-505.
Obstfeld, M., 2015, “Trilemmas and Tradeoffs: Living with Financial Globalization,” BIS Working Papers, No 480, Basel.
McCauley, R. N., McGuire, P., and Sushko, V., 2015, “US Monetary Policy, Leverage and Offshore Dollar Credit,” Economic Policy, 82, 187-229.
McGuire, P., and N. Tarashev, 2008, “Bank Health and Lending to Emerging Markets,” BIS Quarterly Review, 67–80, December.

25
Milesi‐Ferretti, G.M. and C. Tille, 2011, “The great retrenchment: international capital flows during the global financial crisis,” Economic Policy, 66, 285-342.
Rey, H., 2013, “Dilemma not Trilemma: The global financial cycle and monetary policy independence,” in Proceedings of the Federal Reserve Bank of Kansas City Economic Symposium at Jackson Hole.
Shin, H.S., 2012 “Global Banking Glut and Loan Risk Premium” Mundell‐Fleming Lecture, IMF Economic Review 60 (2), 155‐192.
Shin, H.S., 2013. “The second phase of global liquidity and its impact on emerging economies.” Remarks at 2013 Federal Reserve Bank of San Francisco Asia Economic Policy Conference.
Turner, P., 2014. “The global long-term interest rate, financial risks and policy choices in EMEs,” BIS Working Papers no 441, February.

26
Table 1. Variable Definitions and Sources
Variables Definition Sources
Cross-border claims on banksLog Change in BIS Locational Cross-Border Claims on Banks (exchange rate adjusted)
BIS Locational statistics (Table 6)
Cross-border claims on non-banksLog Change in BIS Locational Cross-Border Claims on Non-Banks (exchange rate adjusted)
BIS Locational statistics (Table 6)
US VIX CBOE S&P500 Volatility Index Datastream
UK VIX FTSE 100 Volatility Index Datastream
EA VIX VDAX Volatility Index (new) Datastream
US TED spread 3-month TED spread (LIBOR - Treasury bill) Datastream
UK TED spread 3-month GBP LIBOR spread (LIBOR - Gilt) Datastream
EA TED spread 3-month Euro LIBOR spread (LIBOR - Govt. AAA bill) 1/ Datastream
US real policy rate Federal Funds Target Rate Haver
UK real policy rate UK Base Rate (Repo rate) Haver
EA real policy rate Euro Area Deposit facitlity rate Haver
US slope of yield crurve 10 year/3 month US Treasury yield spread Datastream
UK slope of yield curve 10 year/3 month UK government securities yield spread Datastream
EA slope of yield curve 10 year/3 month EA AAA Sovereign yield spread 1/ Datastream
US growth rate of M2 Growth rate of M2 in national currency IFTSTSUB
UK growth rate of M2 Growth rate of M2 in national currency IFTSTSUB
EU growth rate of M2 Growth rate of M2 in national currency IFTSTSUB
US broker-dealer leverage (Equity+Total Liabilities)/Equity US Flow of Funds
Large US banks leverage Total Assets/Equity Bankscope
Large UK banks leverage Total Assets/Equity Bankscope
Large EU banks leverage Total Assets/Equity Bankscope
Real GDP Growth Growth rate of real GDP WEO
Inflation Inflation IFTSTSUB and GDS
Interest rate Differential Difference between domestic rate and Fed funds rate IFTSTSUB
Dependent variables
Economic and financial conditions in financial center economies
Borrower countries economic conditions
Note: 1/ Data on Euro Government AAA 3-month bill is available since 2007, the period 1990-2006 is based on the 3 month French treasury bill rate.

27
Table 2. Summary Statistics and Correlations
Panel A - Summary Statistics for cross-border bank claims
Variable Obs Mean Median Std. Dev. Min Max
Log change in cross-border claims on banks 5766 1.65 1.22 12.35 -57.54 63.00
Log change in cross-border claims on non-banks 5713 1.65 1.23 8.25 -28.18 39.33
Panel B - Summary Statistics and Correlations for "Financial Center" variables
Summary Statistics Cross-Country Correlations
Variable Obs Mean Std. Dev. Min Max US UK EA
US VIX 99 19.90 7.52 11.15 45.45 1
UK VIX 59 20.40 8.78 9.87 46.08 0.93 1
EA VIX 63 25.17 10.15 11.94 57.67 0.89 0.96 1
US TED spread 100 0.56 0.52 -0.10 3.76 1
UK TED spread 98 0.53 0.58 -0.16 3.98 0.65 1
EA TED spread 100 0.28 0.31 -0.02 1.80 0.49 0.67 1
US broker-dealer leverage 100 32.56 7.08 21.14 46.25 1
UK large bank leverage 100 19.05 3.35 14.49 31.47 0.04 1
EA large bank leverage 100 24.51 2.86 19.29 31.34 0.41 0.86 1
US real policy rate 100 0.64 2.01 -3.65 4.04 1
UK real policy rate 100 2.26 2.97 -4.21 8.96 0.75 1
EA real policy rate 92 0.28 1.56 -2.51 3.71 0.74 0.73 1
US term spread 100 1.90 1.12 -0.47 3.66 1
UK term spread 100 0.88 1.51 -2.97 3.55 0.59 1
EA term spread 100 1.32 1.22 -1.99 3.41 0.19 0.62 1
US REER (growth rate) 96 -0.13 4.87 -9.74 11.82 1
UK REER (growth rate) 96 0.27 7.11 -21.81 18.14 -0.01 1
EA REER (growth rate) 96 -0.86 7.14 -24.36 14.21 -0.46 -0.38 1
US M2 (growth rate) 96 5.42 2.51 0.18 10.54 1
UK M2 (growth rate) 93 7.51 4.87 -3.35 17.68 0.04 1
EA M2 (growth rate) 96 5.71 2.40 1.43 10.51 0.22 0.49 1
Panel C - Correlation Matrix for US variables
VIXTED
spread
Broker-dealer
leverage
Federal Funds Rate
Term spread
REER (Growth
rate)
M2 (Growth
rate)
VIX 1
TED spread 0.41 1
Broker-dealer leverage -0.26 0.06 1
Real Federal Funds Rate -0.05 0.19 0.55 1
Term spread 0.18 -0.21 -0.52 -0.63 1
REER (Annual growth rate) 0.25 0.17 -0.06 0.39 -0.24 1.00
M2 (Annual growth rate) 0.48 0.32 -0.05 -0.09 -0.20 0.31 1.00

28
Table 3. List of countries
Asia Europe Western Hem. Other
Australia Austria Argentina Algeria
China Belgium Bolivia Bahrain
Hong Kong Bulgaria Brazil Côte d’Ivoire
India Croatia Canada Ghana
Indonesia Cyprus Chile Israel
Japan Czech Republic Colombia Jordan
Malaysia Denmark Guatemala Kuwait
New Zealand Estonia Jamaica Libya
Pakistan Finland Mexico Mauritius
Philippines France Panama Morocco
Singapore Germany Paraguay Oman
South Korea Greece Peru Qatar
Sri Lanka Hungary United States Saudi Arabia
Thailand Iceland Venezuela Senegal
Ireland South Africa
Italy Tunisia
Latvia
Lithuania
Luxembourg
Netherlands
Norway
Poland
Portugal
Romania
Russia
Slovak Republic
Slovenia
Spain
Sweden
Switzerland
Turkey
Ukraine
United Kingdom
Financial center' economies in italics
A total of 77 countries, or 58 excluding 'financial centers' (US, euro area, UK and Japan)

29
Table 4. Factors associated with cross-border bank flows, US factors, 1990-2014
Panel A. Log Change in BIS Locational Cross-Border Claims on Banks
1 2 3 4 5 6 7 8 9 10
GDP Growth (-1) 0.215*** 0.183*** 0.236*** 0.132** 0.179*** 0.200*** 0.227*** 0.231*** 0.157*** 0.161***
(0.0542) (0.0534) (0.0550) (0.0509) (0.0534) (0.0535) (0.0542) (0.0558) (0.0511) (0.0509)Inflation (-1) -0.0600** -0.0523** -0.0224 -0.0947*** -0.0688**-0.0765*** -0.0403 -0.0651** -0.0486* -0.0565**
(0.0278) (0.0257) (0.0285) (0.0275) (0.0268) (0.0270) (0.0285) (0.0263) (0.0249) (0.0255)-0.0190 0.0276 0.0391 -0.0114 -0.00783 -0.00905 -8.32e-05 0.0391 0.0921** 0.0770*
(0.0387) (0.0382) (0.0418) (0.0377) (0.0383) (0.0384) (0.0386) (0.0400) (0.0431) (0.0422)VIX -0.183*** -0.0110 -0.0444*
(0.0270) (0.0252) (0.0232)TED spread -1.821*** -1.440*** -1.233***
(0.384) (0.362) (0.368)Broker-dealer leverage 0.242*** 0.167*** 0.188***
(0.0357) (0.0360) (0.0378)Term spread -0.755*** -0.705***
(0.168) (0.156)Real Fed Funds rate 0.275*** 0.186
(0.0930) (0.113)REER change -0.275*** -0.227*** -0.223***
(0.0369) (0.0315) (0.0369)M2 growth -0.503*** -0.270*** -0.150
(0.110) (0.0972) (0.107)Country FE Y Y Y Y Y Y Y Y Y YObservations 5,761 5,761 5,761 5,761 5,761 5,761 5,761 5,761 5,761 5,761R-squared 0.007 0.020 0.013 0.026 0.012 0.009 0.020 0.016 0.045 0.043Number of countries 77 77 77 77 77 77 77 77 77 77Robust standard errors in parentheses
*** p<0.01, ** p<0.05, * p<0.1
Panel B. Log Change in BIS Locational Cross-Border Claims on non-banks
1 2 3 4 5 6 7 8 9 10
GDP Growth (-1) 0.209*** 0.188*** 0.218*** 0.152*** 0.173*** 0.193*** 0.214*** 0.216*** 0.154*** 0.158***
(0.0345) (0.0325) (0.0351) (0.0286) (0.0324) (0.0333) (0.0348) (0.0358) (0.0292) (0.0290)Inflation (-1) 0.00463 0.0106 0.0209 -0.0192 -0.00417 -0.0129 0.0137 0.00265 0.00383 -0.00336
(0.0184) (0.0183) (0.0188) (0.0175) (0.0180) (0.0180) (0.0183) (0.0186) (0.0170) (0.0170)
-0.0276 0.00304 -0.00222 -0.0226 -0.0167 -0.0172 -0.0192 -0.00110 0.0309 0.0200
(0.0340) (0.0339) (0.0350) (0.0329) (0.0330) (0.0334) (0.0341) (0.0346) (0.0357) (0.0348)VIX -0.122*** -0.0347**-0.0643***
(0.0165) (0.0152) (0.0155)TED spread -0.789*** -0.582** -0.439*
(0.234) (0.243) (0.246)Broker-dealer leverage 0.166*** 0.0994*** 0.110***
(0.0248) (0.0258) (0.0277)Term spread -0.756*** -0.612***
(0.107) (0.112)Real Fed Funds rate 0.295*** 0.215***
(0.0666) (0.0784)REER change -0.127*** -0.108*** -0.115***
(0.0235) (0.0220) (0.0238)M2 growth -0.234*** -0.107** 0.00941
(0.0539) (0.0513) (0.0503)Country FE Y Y Y Y Y Y Y Y Y YObservations 5,709 5,709 5,709 5,709 5,709 5,709 5,709 5,709 5,709 5,709R-squared 0.013 0.027 0.016 0.033 0.024 0.018 0.019 0.017 0.047 0.044Number of countries 77 77 77 77 77 77 77 77 77 77Robust standard errors in parentheses
*** p<0.01, ** p<0.05, * p<0.1
Change in Interest Rate Differential
Change in Interest Rate Differential

30
Table 5. Factors associated with cross-border bank flows, 2001-14
Panel A. Log Change in BIS Locational Cross-Border Claims on Banks
1 2 3 4 5 6 7 8
VIX 0.0239 -0.0509 0.0217 -0.0674** -0.0832***-0.0815*** 0.0742 0.0769
(0.0356) (0.0321) (0.0355) (0.0329) (0.0249) (0.0264) (0.0452) (0.0465)TED spread -1.914*** -1.518*** -1.934*** -1.545*** -4.208*** -4.095*** -6.157*** -6.230***
(0.502) (0.524) (0.505) (0.534) (1.079) (1.141) (0.965) (1.004)Bank leverage 0.0951* 0.0962 0.0493 -0.0567 0.577*** 0.524*** 0.534*** 0.512***
(0.0527) (0.0621) (0.106) (0.111) (0.162) (0.164) (0.117) (0.103)Term spread -1.339*** -1.726*** -0.114 0.145
(0.309) (0.272) (0.533) (0.355)Real interest rate 0.618** 0.992*** -0.460* -0.0969
(0.244) (0.189) (0.243) (0.170)REER change -0.334*** -0.350*** -0.380*** -0.444*** 0.0309 0.0420 0.170** 0.166**
(0.0612) (0.0792) (0.0645) (0.0767) (0.0552) (0.0552) (0.0724) (0.0699)M2 growth -0.395** -0.286 -0.357** -0.190 -0.115 0.0490 0.168** 0.186***
(0.164) (0.181) (0.163) (0.170) (0.211) (0.198) (0.0643) (0.0674)
Country FE Y Y Y Y Y Y Y YObservations 2,861 2,861 2,861 2,861 2,861 2,861 2,739 2,739R-squared 0.055 0.052 0.053 0.051 0.028 0.029 0.061 0.061Number of countries 58 58 58 58 58 58 58 58Robust standard errors in parentheses
*** p<0.01, ** p<0.05, * p<0.1
Regressions include controls for borrower countries (lag GDP growth, lag inflation, and change in interest rate differentia
1/ Bank leverage of G-SIB US banks (FSB definition) is used instead of the leverage of US Broker-dealers
Panel B. Log Change in BIS Locational Cross-Border Claims on Non-Banks
1 2 3 4 5 6 7 8
VIX -0.0251 -0.0799*** -0.0308 -0.0892***-0.0883***-0.0884*** -0.0354 -0.0379
(0.0264) (0.0223) (0.0275) (0.0223) (0.0194) (0.0195) (0.0295) (0.0300)TED spread -0.479 -0.308 -0.452 -0.272 -2.671*** -2.764*** -2.042*** -1.967***
(0.328) (0.321) (0.333) (0.332) (0.657) (0.677) (0.484) (0.496)Bank leverage 0.0891** 0.0405 0.165* 0.0600 0.248** 0.276*** 0.137** 0.156**
(0.0431) (0.0451) (0.0836) (0.0837) (0.101) (0.102) (0.0586) (0.0609)Term spread -0.968*** -1.265*** 0.142 -0.123
(0.280) (0.225) (0.318) (0.194)Real interest rate 0.793*** 0.880*** 0.241 0.0910
(0.169) (0.131) (0.202) (0.115)REER change -0.0797* -0.152*** -0.0970** -0.167*** -0.0492* -0.0551* 0.125** 0.127**
(0.0411) (0.0405) (0.0386) (0.0385) (0.0271) (0.0288) (0.0484) (0.0480)M2 growth -0.394*** -0.246** -0.362*** -0.217** 0.240* 0.128 0.224*** 0.205***
(0.0980) (0.0944) (0.0945) (0.0892) (0.140) (0.113) (0.0520) (0.0522)
Country FE Y Y Y Y Y Y Y YObservations 2,836 2,836 2,836 2,836 2,836 2,836 2,714 2,714R-squared 0.060 0.062 0.060 0.062 0.049 0.049 0.061 0.061Number of countries 58 58 58 58 58 58 58 58Robust standard errors in parentheses
*** p<0.01, ** p<0.05, * p<0.1
Regressions include controls for borrower countries (lag GDP growth, inflation, and change in interest rate differential)
1/ Bank leverage of G-SIB US banks (FSB definition) is used instead of the leverage of US broker-dealers
2001-14
US (alternative) 1/ UK
2001-14
US US (alternative) 1/ EA UK
EAUS

31
Table 6. Factors associated with cross-border bank flows, 2001-06 and 2010-14
Panel A. Log Change in BIS Locational Cross-Border Claims on Banks
1 2 3 4 5 6 7 8 9 10 11 12
VIX -0.0351 -0.166* 0.0529 0.0431 0.0881 0.0613 0.00930 0.0427 0.0575 0.0701 0.0807 0.130
(0.0646) (0.0927) (0.0425) (0.0399) (0.0631) (0.0629) (0.0771) (0.0726) (0.0715) (0.0747) (0.0869) (0.0927)TED spread -3.133 1.160 4.637 3.768 -5.653 -4.865 6.853 12.55 -4.085** -4.526** -9.415 -15.76***
(2.139) (3.699) (6.877) (6.699) (3.647) (3.665) (9.436) (9.970) (1.846) (1.707) (5.994) (4.139)Bank leverage -0.136 0.128 1.335*** 1.112** 0.464* 0.104 -0.321 -0.556 0.687 1.270* 0.540 2.606
(0.163) (0.318) (0.481) (0.522) (0.234) (0.278) (0.559) (0.462) (0.541) (0.687) (0.776) (1.703)Term spread -0.946 1.244 0.670 -0.728 0.950 0.805
(0.567) (0.852) (1.109) (1.835) (1.497) (1.151)Real interest rate -0.565 -0.768 -1.468* 3.686*** 0.920 2.248
(1.021) (0.516) (0.852) (1.324) (0.983) (1.992)REER change -0.122 -0.0823 0.0404 0.0741 -0.0576 -0.0362 -0.260* -0.795*** -0.0634 -0.0366 0.130 -0.125
(0.134) (0.139) (0.110) (0.111) (0.141) (0.142) (0.150) (0.240) (0.104) (0.0924) (0.126) (0.323)M2 growth 0.0189 -0.0332 -0.180 -0.265 0.344 0.393* -0.594* 0.432 -0.792 -0.665 -0.0591 -0.313
(0.295) (0.320) (0.464) (0.467) (0.240) (0.223) (0.329) (0.406) (0.569) (0.555) (0.158) (0.262)
Country FE Y Y Y Y Y Y Y Y Y Y Y YObservations 1,214 1,214 1,214 1,214 1,214 1,214 1,010 1,010 1,010 1,010 888 888R-squared 0.013 0.012 0.017 0.017 0.018 0.020 0.020 0.029 0.016 0.016 0.023 0.024Number of countries 55 55 55 55 55 55 56 56 56 56 56 56Robust standard errors in parentheses
*** p<0.01, ** p<0.05, * p<0.1
Regressions include controls for borrower countries (lag GDP growth, lag inflation, and change in interest rate differential)
Panel B. Log Change in BIS Locational Cross-Border Claims on Non-Banks
1 2 3 4 5 6 7 8 9 10 11 12
VIX -0.0699 -0.0905 -0.0504 -0.0437 -0.0197 -0.0166 -0.0808* -0.0733* 0.00791 0.00424 -0.0690 -0.0198
(0.0668) (0.0577) (0.0444) (0.0426) (0.0549) (0.0576) (0.0418) (0.0432) (0.0466) (0.0459) (0.0424) (0.0470)TED spread -0.884 -0.991 2.248 2.733 2.099 3.038 9.285* 9.890* -3.590*** -3.511*** 2.363 -4.841*
(1.449) (2.185) (4.895) (4.906) (2.540) (2.216) (5.082) (5.039) (1.192) (1.200) (2.967) (2.460)Bank leverage 0.00507 -0.0612 0.470 0.450 0.282 0.417** 0.0448 0.0575 0.567** 0.410 0.134 2.246***
(0.0802) (0.177) (0.290) (0.331) (0.174) (0.191) (0.276) (0.263) (0.281) (0.317) (0.314) (0.800)Term spread -1.004** -0.444 -0.810 -0.399 -0.173 1.102*
(0.452) (0.691) (0.910) (0.752) (0.863) (0.642)Real interest rate 0.824 -0.0398 0.250 0.480 -0.289 2.141*
(0.648) (0.426) (0.570) (0.602) (0.624) (1.075)REER change -0.0247 0.0296 -0.0180 -0.0428 0.193** 0.205** -0.180** -0.232** -0.0180 -0.0233 0.0703 -0.164
(0.0791) (0.0720) (0.0784) (0.0658) (0.0928) (0.0972) (0.0680) (0.112) (0.0683) (0.0578) (0.0977) (0.137)M2 growth -0.0990 -0.374* 0.0311 0.123 0.178 0.224* -0.455** -0.292 -0.501 -0.571 0.0703 -0.184
(0.195) (0.203) (0.357) (0.351) (0.137) (0.130) (0.203) (0.261) (0.328) (0.412) (0.113) (0.126)
Country FE Y Y Y Y Y Y Y Y Y Y Y YObservations 1,189 1,189 1,189 1,189 1,189 1,189 1,010 1,010 1,010 1,010 888 888R-squared 0.027 0.024 0.025 0.025 0.031 0.031 0.019 0.019 0.015 0.015 0.011 0.014Number of countries 55 55 55 55 55 55 56 56 56 56 56 56Robust standard errors in parentheses
*** p<0.01, ** p<0.05, * p<0.1
Regressions include controls for borrower countries (lag GDP growth, lag inflation, and change in interest rate differential)
UK
EA
2010-14
EA UK
2001-06 2010-14
US US
2001-06
UK
US EA UK US EA
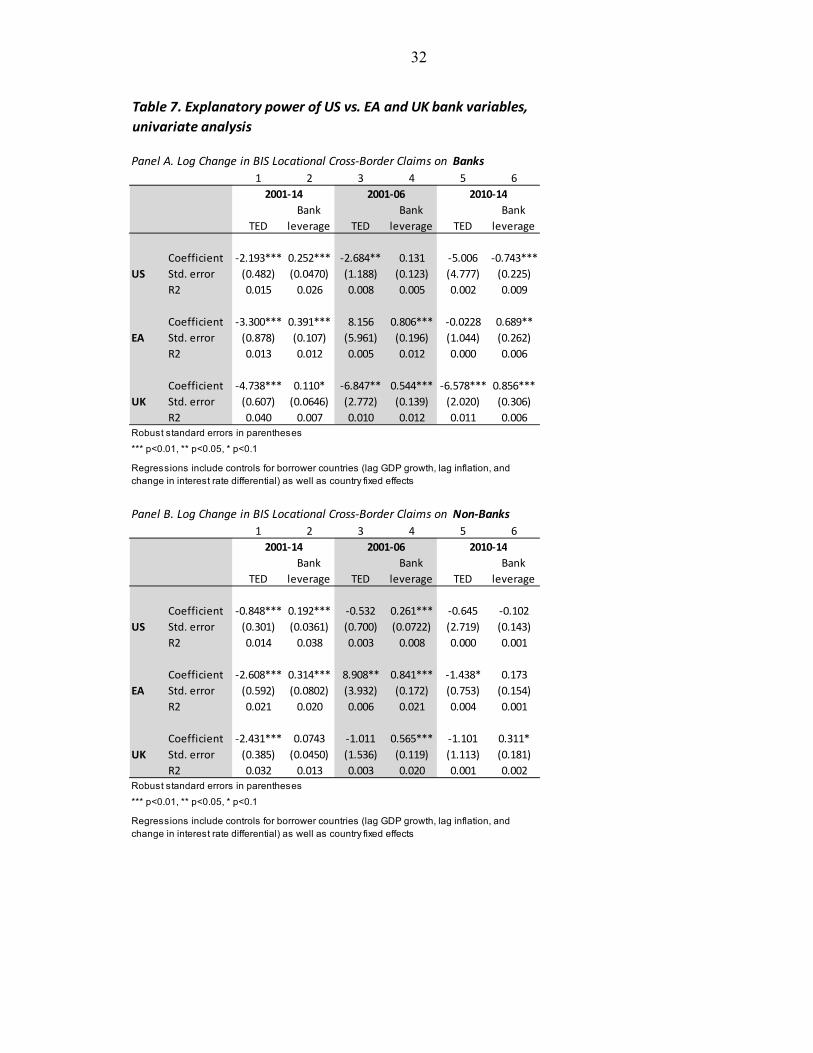
32
Panel A. Log Change in BIS Locational Cross-Border Claims on Banks
1 2 3 4 5 6
TED
Bank
leverage TED
Bank
leverage TED
Bank
leverage
Coefficient -2.193*** 0.252*** -2.684** 0.131 -5.006 -0.743***
US Std. error (0.482) (0.0470) (1.188) (0.123) (4.777) (0.225)
R2 0.015 0.026 0.008 0.005 0.002 0.009
Coefficient -3.300*** 0.391*** 8.156 0.806*** -0.0228 0.689**
EA Std. error (0.878) (0.107) (5.961) (0.196) (1.044) (0.262)
R2 0.013 0.012 0.005 0.012 0.000 0.006
Coefficient -4.738*** 0.110* -6.847** 0.544*** -6.578*** 0.856***
UK Std. error (0.607) (0.0646) (2.772) (0.139) (2.020) (0.306)
R2 0.040 0.007 0.010 0.012 0.011 0.006Robust standard errors in parentheses
*** p<0.01, ** p<0.05, * p<0.1
Panel B. Log Change in BIS Locational Cross-Border Claims on Non-Banks
1 2 3 4 5 6
TED
Bank
leverage TED
Bank
leverage TED
Bank
leverage
Coefficient -0.848*** 0.192*** -0.532 0.261*** -0.645 -0.102
US Std. error (0.301) (0.0361) (0.700) (0.0722) (2.719) (0.143)
R2 0.014 0.038 0.003 0.008 0.000 0.001
Coefficient -2.608*** 0.314*** 8.908** 0.841*** -1.438* 0.173
EA Std. error (0.592) (0.0802) (3.932) (0.172) (0.753) (0.154)
R2 0.021 0.020 0.006 0.021 0.004 0.001
Coefficient -2.431*** 0.0743 -1.011 0.565*** -1.101 0.311*
UK Std. error (0.385) (0.0450) (1.536) (0.119) (1.113) (0.181)
R2 0.032 0.013 0.003 0.020 0.001 0.002Robust standard errors in parentheses
*** p<0.01, ** p<0.05, * p<0.1
Regressions include controls for borrower countries (lag GDP growth, lag inflation, and change in interest rate differential) as well as country fixed effects
Table 7. Explanatory power of US vs. EA and UK bank variables,
univariate analysis
2001-14 2001-06 2010-14
2001-14 2001-06 2010-14
Regressions include controls for borrower countries (lag GDP growth, lag inflation, and change in interest rate differential) as well as country fixed effects

33
Panel A. Log Change in BIS Locational Cross-Border Claims on Banks
2001-14 Monetary TED Leverage R2
1 US spread UK UK 0.062
…
19 US spread US US 0.056
2001-06 Monetary TED Leverage R2
1 US rate UK EA 0.024
…
45 US spread US US 0.012
Panel B. Log Change in BIS Locational Cross-Border Claims on Non-Banks
2001-14 Monetary TED Leverage R2
1 US rate UK EA 0.066
…
6 US rate US US 0.065
2001-06 Monetary TED Leverage R2
1 UK spread US US 0.029
…
14 US spread US US 0.028
Table 8. Explanatory power of US vs. EA and UK
bank variables, multivariate analysis
Regressions include controls for borrower countries (lag GDP growth, lag inflation, and change in interest rate differential) as well as country fixed effects, US VIX, US REER and M2 growth.

34
Panel A. Log Change in BIS Locational Cross-Border Claims on Banks
1 2 3 4 5 6 7 8
TED
Bank
leverage TED
Bank
leverage TED
Bank
leverage TED
Bank
leverage
Coefficient -2.979*** 0.0597 -2.615* -0.117 -2.665** 0.138* 0.0562 0.0604
US Std. error (0.681) (0.0602) (1.203) (0.270) (1.114) (0.0703) (3.990) (0.273)
R2 0.041 0.014 0.010 0.006 0.014 0.011 0.003 0.003
Coefficient -5.313*** -0.0160 -5.850 1.001** -1.818 0.184 13.48 0.446
EA Std. error (1.431) (0.156) (11.92) (0.379) (1.291) (0.237) (16.19) (0.410)
R2 0.040 0.012 0.006 0.020 0.009 0.008 0.005 0.004
Coefficient -4.764*** -0.0379 -5.029 0.655** -6.623*** 0.199 -9.057 0.258
UK Std. error (0.878) (0.101) (3.562) (0.279) (1.603) (0.182) (12.70) (0.300)
R2 0.077 0.013 0.010 0.018 0.040 0.009 0.009 0.004Robust standard errors in parentheses
*** p<0.01, ** p<0.05, * p<0.1
Panel B. Log Change in BIS Locational Cross-Border Claims on Non-Banks
1 2 3 4 5 6 7 8
TED
Bank
leverage TED
Bank
leverage TED
Bank
leverage TED
Bank
leverage
Coefficient -2.197*** 0.0845 0.783 0.171 -0.544 0.0604** 2.292* 0.113
US Std. error (0.526) (0.0630) (1.404) (0.149) (0.496) (0.0226) (1.040) (0.134)
R2 0.024 0.012 0.025 0.026 0.022 0.024 0.017 0.009
Coefficient -4.131*** -0.0321 0.668 0.873** -0.405 0.221*** 6.991 0.719**
EA Std. error (1.016) (0.119) (8.493) (0.349) (0.790) (0.0653) (5.426) (0.248)
R2 0.025 0.007 0.024 0.035 0.021 0.026 0.010 0.028
Coefficient -3.866*** -0.0961 6.823 0.577** -1.552** 0.170*** 3.626 0.472**
UK Std. error (0.795) (0.0822) (3.934) (0.247) (0.703) (0.0478) (2.586) (0.167)
R2 0.054 0.008 0.033 0.034 0.031 0.027 0.013 0.026Robust standard errors in parentheses
*** p<0.01, ** p<0.05, * p<0.1
Table 9. Explanatory power of US vs. EA and UK bank variables, flows to Asia
and Latin America, univariate analysis
Regressions include controls for borrower countries (lag GDP growth, lag inflation, and change in interest rate differential) as well as country fixed effects
Regressions include controls for borrower countries (lag GDP growth, lag inflation, and change in interest rate differential) as well as country fixed effects
FLOWS TO ASIA FLOWS TO LATIN AMERICA
2001-14 2001-06
2001-14 2001-06
FLOWS TO LATIN AMERICAFLOWS TO ASIA
2001-14 2001-06
2001-14 2001-06

35
Panel A. Log Change in BIS Locational Cross-Border Claims on Banks
2001-14 Monetary TED Leverage R2 2001-14 Monetary TED Leverage R2
1 US rate UK US 0.106 1 UK rate UK UK 0.074
… …
15 US rate US US 0.097 16 US spread US US 0.052
2001-06 Monetary TED Leverage R2 2001-06 Monetary TED Leverage R2
1 US rate US EA 0.081 1 US rate UK EA 0.040
… …
42 US spread US US 0.053 21 US rate US US 0.025
Panel B. Log Change in BIS Locational Cross-Border Claims on Non-Banks
2001-14 Monetary TED Leverage R2 2001-14 Monetary TED Leverage R2
1 US rate UK US 0.109 1 UK rate UK UK 0.068
… …
2 US rate US US 0.108 11 US spread US US 0.062
2001-06 Monetary TED Leverage R2 2001-06 Monetary TED Leverage R2
1 US rate UK EA 0.096 1 EA rate US EA 0.062
… …
11 US rate US US 0.085 20 US spread US US 0.052
Table 10. Explanatory power of US vs. EA and UK bank variables, flows to Asia and Latin
America, multivariate analysis
Regressions include controls for borrower countries (lag GDP growth, lag inflation, and change in interest rate differential) as well as country fixed effects, US VIX, US REER and M2 growth.
FLOWS TO ASIA
FLOWS TO ASIA
FLOWS TO LATIN AMERICA
FLOWS TO LATIN AMERICA

36
Annex A. Time series charts of financial and economic conditions in “financial center economes”: US, euro area and UK