flows & liquidity
TRANSCRIPT

www.jpmorganmarkets.com
Global Asset Allocation15 April 2016
Flows & LiquidityThe most favorable bond demand/supply balance since 2009
Global Asset Allocation
Nikolaos Panigirtzoglou AC
(44-20) 7134-7815
J.P. Morgan Securities plc
Nandini Srivastava
(44-20) 7742-6183
J.P. Morgan Securities plc
Jigar Vakharia
(91-22) 6157-3281
J.P. Morgan India Private Limited
Mika Inkinen
(44-20) 7742 6565
J.P. Morgan Securities plc
See page 18 for analyst certification and important disclosures.
Figure 1: Global bond supplyNet bond issuance globally. $bn per annum at constant
(today’s) exchange rates. It excludes EM local debt. We
estimate a 15% reduction in global bond supply in 2016.
Source: Dealogic, Bloomberg, J.P. Morgan.
0
500
1000
1500
2000
2500
3000
3500
06 07 08 09 10 11 12 13 14 15 16
DM Govt
Spread product
Global bond supply was very weak during Q1 this year, especially compared to an exceptionally strong Q1 2015.
Equity market volatility had an impact on share buyback and M&A activities last quarter and given that these corporate activities are predominantly financed by debt, net bond issuance was also affected.
This drag on bond supply should fade going forward on improving equity and credit market conditions.
Spread product supply outside the US remains weak, failing to respond to strong QE purchases by the ECB or the BoJ.
Overall, we project a 15% reduction in global bond supply this year.
While we expect that SWFs will liquidate more fixed income mandates this year and commercial banks will offload more bonds (we believe mostly negatively yielding) to the ECB and the BoJ, the ECB's QE should more than offset these reductions in demand.
A fall in bond supply and a rise in bond demand create a significantly more favorable environment for bonds, the most favorable since 2009 on our estimates.
Global bond supply started the year on a very weak tone with materially lower net issuance for both dollar and non-dollar denominated debt.
Dealogic data show that net issuance of USD denominated bonds was only $185bn in the first quarter of 2016 vs. $378bn during the first quarter of 2015 and $239bn during the previous quarter i.e. Q4 2015. Net issuance of non-USD denominated bonds, excluding EM local debt, was only $113bn in the first quarter vs. $265bn during the first quarter of 2015 and $139bn during the previous quarter.
Have equity market volatility and global growth concerns taken their toll on bond issuance during Q1? Surely the trajectory for equity markets looked shakier after the January correction which reduced the appetite by companies to engage in debt-financed share buyback and M&A activities. Indeed,announced share buybacks totaled only $106bn in Q1 this year vs $230bn in Q1 2015 and $173bn in the previous quarter. The M&A pace of $700bn over the past quarter was also weak compared to a 2015 quarterly average of $1,180bn. So in all, we would note that equity market volatility had an impact on share buyback and M&A activities and given that these activities are predominantly financed by debt, debt issuance was also affected.
Click here to visit Flows & Liquidity Library in J.P. Morgan Markets.
This document is being provided for the exclusive use of [email protected].{[{QZ]*Owksv*O*nk!sn8uoyrkxoJp�8myw*;B9:>9<:;@}]}

2
Global Asset AllocationFlows & Liquidity
15 April 2016
Nikolaos Panigirtzoglou(44-20) [email protected]
Another factor we had previously identified as a source of weak bond supply was related to EM. Worries about Chinese and EM growth had made it more difficult for EM governments and companies to issue external debt which depressed overall issuance during last year. In particular, market pressures have been inducing non-financial corporates in EM to either repay or replace external debt with local debt or bank loans. This mechanically reduces our overall bond supply figures given that we exclude EM local debt and bank loans from our bond/supply demand analysis. This depressing factor faded somewhat over the past quarter but only slightly. EM external net bond issuance improved to $32bn in Q1 relative to $24bn in the previous quarter as worries about EM and China decreased. However, at $32bn, EM external net bond issuance in Q1 was less than half compared to the same quarter of 2015 ($70bn).
Another depressing factor for global bond issuance in the past was spread product supply outside the US. Spread product supply including agency debt weakened last year in both Japan and Euro area relative to 2014. The BoJ's and ECB's QE have not generated as much spread product issuance as we had hoped. Net issuance of spread product in Euro area and Japan totaled $34bn in Q1, an improvement from the very low level of $10bn seen in Q4 2015, but still 60% below the $102bn seen in Q1 2015.
Where does this leave us in terms of overall issuance?Adding DM government and spread product issuance and adjusting for currency changes which tend to influence the dollar value of non-USD issuance, we arrive at total net bond issuance of $300bn in Q1 attoday's exchange rates vs. $640bn in Q1 2015 and vs. $379bn in Q4 2015. I.e. Q1 issuance was less than half that seen during the same quarter of last year. But as we explained above Q1 issuance was at least partly depressed by reduced equity buyback and M&A activity and subdued EM external debt issuance. Both of these drags are likely to normalize over the coming quarters on better equity market and EM credit conditions. In addition the yoy comparison for Q1 is exaggerated by an exceptionally strong Q1 in 2015. The yoy comparisons will mechanically look better vs. the last three quarters of 2015.
As a result, full year issuance should be around 10% to 20% below the 2015 level. As a base case we project a 15% reduction in global bond supply this year.
Figure 1 depicts net global bond supply across time. It excludes EM local debt. Net bond supply is expressed in $bn per annum, at constant (today's) exchange rates all the way back to 2006. In this way we avoid distortions to issuance volumes arising from currency swings that mechanically alter the dollar value of non-USD issuance. The reduction we project for this year is once again led by government bond supply. Indeed, Figure 1 shows that net bond issuance has been drifting lower steadily since
2013 led by lower government deficits. Spread product supply has been increasing instead, preventing overall bond supply from falling as fast as government bond supply. On our projections for 2016 we expect a stable spread product supply, failing to offset the reduction in government bond supply.
What about demand? Official sector demand had been the biggest negative surprise of last year. Severe FX reserve depletion by China coupled with slower accumulation by other EM countries meant that overall FX reserve accumulation was negative in the last three quarters of 2015 with an additional big decline seen in Q1 this year. We estimate that foreign official institutions sold more than $240bn of bonds in 2015 vs. buying of more than $250bn in 2014. We project selling of close to $380bn this year. Of this, $140bn stems from SWFs of oil producing countries which are more likely to liquidate fixed income mandates this year after liquidating mostly equity mandates last year and at the beginning of this year. The remaining $240bn stems from FX reserve managers of non-oil producing countries, mostly China. However, more than half of this $240bn is driven by Q1 and reserve depletion in China, which is projected to slow significantly over the coming quarters.
We argued before that when thinking about overall bond demand and supply there are offsets to FX reserve depletion via 1) lower bond supply, as EM sovereigns and corporates repay external debt and 2) a potential increase in bond buying by commercial banks. As capital flees EM economies, these commercial banks are recipients of excess dollar deposits which are typically invested in short-dated government bonds. Indeed, US commercial banks have increased their holdings of US government-related securities over the past eight months following selling in previous months. Since last August, US commercial banks bought $122bn of bonds following selling of $24bn in June and July 2015. Using this monthly pace of purchase of $15bn per month seen since last August, we estimate US commercial bank bond buying of around $180bn for 2016.
In contrast, European and Japanese banks sold bonds to the ECB and the BoJ via QE programs, and this selling is likely to intensify this year given an expansion of ECB's QE. Last year, Japanese and European banks sold $470bn of bonds, an increase in selling of $240bn vs. 2014, in response to an increase in QE by $460bn in 2015 vs. 2014. Using the same sensitivity, we estimate that these Japanese and European banks would sell an extra $170bn of bonds in response to an increase in QE by $340bn this year. This extra $170bn should push the bond selling by European and Japanese bonds to $640bn during 2016. Subtracting from this the projected $180bn buying by US banks; we arrive at total selling by G4 commercial banks of $460bn for 2016.
This document is being provided for the exclusive use of [email protected].{[{QZ]*Owksv*O*nk!sn8uoyrkxoJp�8myw*;B9:>9<:;@}]}

3
Global Asset AllocationFlows & Liquidity
15 April 2016
Nikolaos Panigirtzoglou(44-20) [email protected]
Bond buying by G4 pension funds and insurance companies has been relatively steady at just above $450bn per annum over the last couple of years and we assume the same for this year.
Retail investors slowed their bond fund purchases during 2015 year to $260bn vs. $500bn in 2014. We project stronger demand for bond funds this year driven by a more benign credit cycle relative to last year. Most bond funds invest in corporate bonds and therefore the state of the credit cycle is a key determinant of demand. Taking an average of the previous two years point to bond fund demand of $380bn for this year.
G4 central bank demand looks set to increase this year driven by ECB's increase in the pace of purchases to €80bn per month from €60bn last year. This is the most significant demand change we envisage for this year (Figure 2). In Figure 2, similar to what we did with our estimates of bond supply and the other components of demand, we convert all previous years' G4 central bank demand (i.e. bond purchases related to QE programs) and retail investors' demand (i.e. bond fund purchases) to today's exchange rates. Coupled with a projected reduction in bond supply into 2016, we see a significant improvement in the balance between bond supply and demand this year vs. 2015 (Figure 3). The previous deterioration in the balance between bond supply and demand seen in 2015 is expected to more than reverse in 2016.
In all, we project that a fall in bond supply and a rise in bond demand led by ECB's QE, together create a significantly more favorable environment for bonds this year, the most favorable since 2009.
Figure 2: Global bond demandAnnual flow in $bn at constant (today’s) exchange rates by investor type.
2016 projections are explained in the text.
Source: Central bank sources, ICI, Bloomberg, IMF and J.P. Morgan calculations.
Figure 3: Annual change in the balance between supply and demandChange in excess bond supply in $bn per annum in the left axis calculated as
the difference between changes in global bond supply and changes in global bond demand as explained in the text. It includes our 2016 estimate. The
2008 and 2010 figures are capped at -/+800bn to improve chart visualization.
Right axis shows the annual change of the yield on the Barcap Global Agg
index in %.
Source: Bloomberg and J.P. Morgan calculations.
-1000
0
1000
2000
3000
4000
5000
06 07 08 09 10 11 12 13 14 15 16
G4 central banks Foreign officialG4 commercial banks Bond funds/RetailPension/Insurance Total
-0.90
-0.60
-0.30
0.00
0.30
0.60
0.90
-800
-400
0
400
800
07 08 09 10 11 12 13 14 15 16
Excess supply change
Yield change
This document is being provided for the exclusive use of [email protected].{[{QZ]*Owksv*O*nk!sn8uoyrkxoJp�8myw*;B9:>9<:;@}]}

4
Global Asset AllocationFlows & Liquidity
15 April 2016
Nikolaos Panigirtzoglou(44-20) [email protected]
Fund Flow Monitor
Table A1: Weekly flow monitor
$bn, Includes US domiciled Mutual Fund flows from ICI with a one week lag and globally domiciled ETF flows from Bloomberg. We exclude China On-
shore funds from our analysis. Current week data only includes ETF flows.
Source: Bloomberg, ICI, J.P. Morgan
Chart A1: Fund flow indicator
Difference between flows into Equity and Bond funds: $bn per week.
Flow includes US domiciled Mutual Fund and globally domiciled ETF flows.
Current week data only includes ETF flows. We exclude China On-shore funds from our analysis. The thin blue line shows the 4-week average of this
difference. Dotted lines are mean ±1 StDev of blue line. The thick black line
shows a smoothed version of the same series. The smoothing is done using
a Hodrick-Prescott filter with a Lambda parameter of 100.
Source: Bloomberg, ICI, J.P. Morgan
Chart A2: Global equity & bond fund flows
$bn per year of Net Sales, i.e. includes net new sales + reinvested dividends
for MF and ETFs. Flows are from ICI (worldwide data up to Q4’15) and data
since then up to now is combination of monthly and weekly data from ICI,
EFAMA and ETF flows are from Bloomberg. YTD 2016 are estimates.
Source: Bloomberg, ICI, EFAMA, J.P. Morgan
Table A2: Equity and Bond issuance
$bn, Equity supply and corporate announcements are based on announced
deals, not completed. M&A is announced deal value and Buybacks are announced transactions. Y/Y change is change in YTD announcements over
the same period last year. More details on net bond issuances in Chart A31.
Source: Bloomberg, Dealogic, Thomson Reuters, J.P. Morgan
Table A3: Trading turnover monitor
Volumes are monthly and Turnover ratio is annualized (monthly trading volume annualised divided by the amount outstanding). USTs are primary
dealer transactions in all US government securities. JGBs are OTC volumes
in all Japanese government securities. Bunds, Gold, Oil and Copper are futures. Gold includes Gold ETFs. Min-Max chart is based on Turnover ratio.
For Bunds and Commodities, futures trading volumes are used while the
outstanding amount is proxied by open interest. The diamond reflects the latest turnover observation. The thin blue line marks the distance between
the min and max for the complete time series since Jan-2005 onwards. Y/Y
change is change in YTD notional volumes over the same period last year.
Source: Bloomberg, Federal Reserve, Trace, Japan Securities Dealer Association, WFE, J.P.
Morgan. * Data with one month lag
MF & ETF Flows 13-Apr 4 wk avg 13 wk avg 2015 avg
All Equity -2.43 -1.5 -0.4 2.6
All Bond 1.59 4.9 4.3 0.8
US Equity 2.02 0.6 -0.4 -2.2
Intl. Equity -4.45 -1.6 0.4 4.8
Taxable Bonds 1.66 3.8 3.2 0.4
Municipal Bonds -0.07 1.1 1.1 0.4
-20
-15
-10
-5
5
10
15
20
25
Feb-07 Aug-08 Feb-10 Aug-11 Feb-13 Aug-14 Feb-16
0
Last observation: 13-Apr-16
588
452
-210
219 225
182
580
478 438
-14
119100
-172
673
503
282
849
196
512
280
43
-300
0
300
600
900
06 07 08 09 10 11 12 13 14 15 16
Equity funds Bond funds
YTD
Equity Supply 15-Apr 4 wk avg 13 wk avg y/y chng
Global IPOs 0.1 0.8 1.3 -38%
Secondary Offerings 3.3 7.1 8.1 25%
Corporate announcements
M&A - Global 12.2 26.5 51.1 -20%
- US Target 4.8 10.7 23.5 -17%
- Non-US Target 7.4 15.7 27.6 -22%
US buy backs 1.6 1.2 5.2 -67%
Non-US buybacks 0.0 0.3 3.1 -4%
Net bond issuance Mar-16 3 mth avg YTD avg y/y chng
USD 15 62 62 -51%
Non-USD -56 38 38 -57%
As of Mar-16 MIN MAX Turnover ratio Vol (tr) y/y chng
Equities
EM Equity 5.0 $2.8 -24%
DM Equity 1.4 $5.0 2%
Govt Bonds
USTs 16.8 $12.5 9%
JGBs* 11.5 ¥874 -3%
Bunds 1.5 €5.9 11%
Credit
US HG 0.9 $0.4 9%
US HY 1.4 $0.2 15%
US Convertibles 2.7 $0.0 -2%
Commodities
Gold 67.2 $0.7 22%
Oil 95.9 $1.2 -42%
Copper 6.8 $0.7 -23%
This document is being provided for the exclusive use of [email protected].{[{QZ]*Owksv*O*nk!sn8uoyrkxoJp�8myw*;B9:>9<:;@}]}

5
Global Asset AllocationFlows & Liquidity
15 April 2016
Nikolaos Panigirtzoglou(44-20) [email protected]
ETF Flow Monitor (as of Apr 13th)
Chart A3: Global Cross Asset ETF Flows
Cumulative flow into ETFs as a % of AUM
Source: J.P. Morgan. Bloomberg
Chart A4: Bond ETF Flows
Cumulative flow into bond ETFs as a % of AUM
Source: J.P. Morgan. Bloomberg
Chart A5: Global Equity ETF Flows
Cumulative flow into global equity ETFs as a % of AUM
Source: J.P. Morgan. Bloomberg
Note: We exclude China On-shore ETFs, we deduct the BoJ buying of ETFs and include one leveraged ETF in Japan (1570 JP, which is the biggest) in
our ETF flow monitor (Chart A3 and Chart A5).
Chart A6: Equity Sectoral and Regional ETF Flows
Rolling 3 month and 12 month change in cumulative flows as a % of AUM.
Both sorted by 12 month change
Source: J.P. Morgan. Bloomberg
-5%
0%
5%
10%
15%
20%
25%
30%
Jan-15 Apr-15 Jul-15 Oct-15 Jan-16 Apr-16
Equity
Bonds
Commodity
-5%
0%
5%
10%
15%
20%
25%
30%
Jan-15 Apr-15 Jul-15 Oct-15 Jan-16 Apr-16
EM
Global HY
Global HG ex-EM
-10%
0%
10%
20%
30%
40%
50%
Jan-15 Apr-15 Jul-15 Oct-15 Jan-16 Apr-16
EM
US
WE
Japan
-60%
-50%
-40%
-30%
-20%
-10%
0%
10%
20%
30%
40%
3M 12M
US Sectors
-60%
-40%
-20%
0%
20%
40%
3M 12M
EM Countries
This document is being provided for the exclusive use of [email protected].{[{QZ]*Owksv*O*nk!sn8uoyrkxoJp�8myw*;B9:>9<:;@}]}
6
Global Asset AllocationFlows & Liquidity
15 April 2016
Nikolaos Panigirtzoglou(44-20) [email protected]
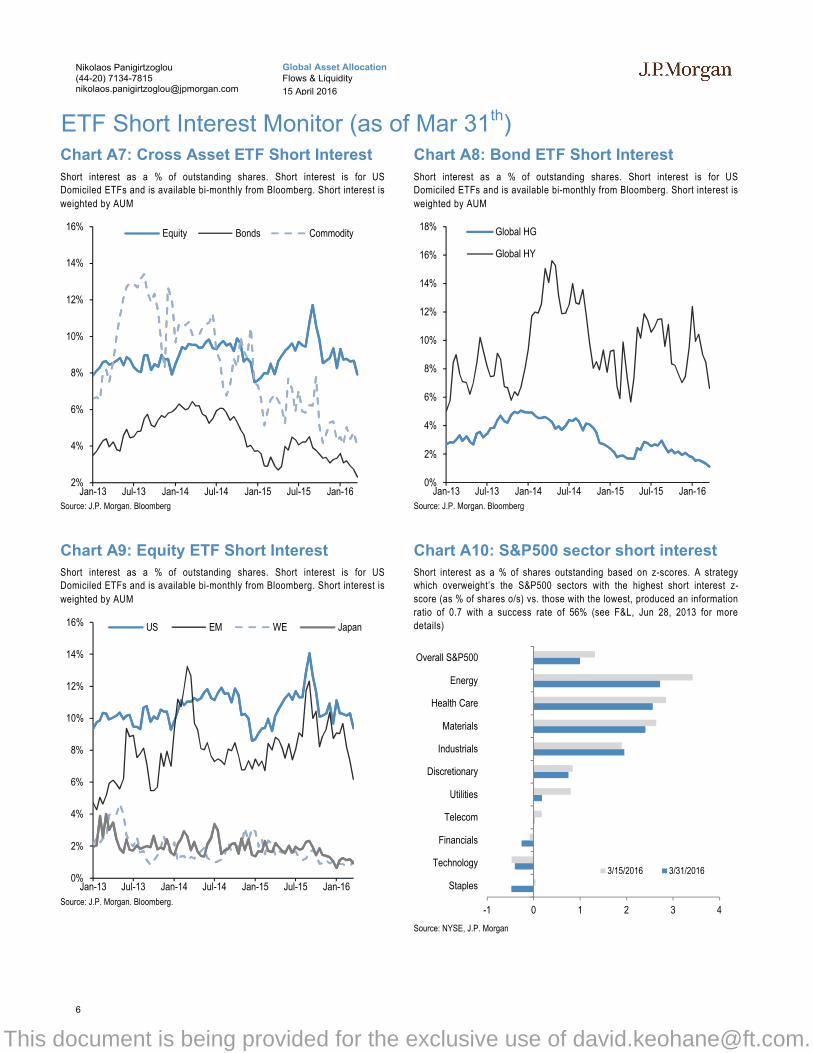
ETF Short Interest Monitor (as of Mar 31th)Chart A7: Cross Asset ETF Short Interest
Short interest as a % of outstanding shares. Short interest is for US Domiciled ETFs and is available bi-monthly from Bloomberg. Short interest is
weighted by AUM
Source: J.P. Morgan. Bloomberg
Chart A8: Bond ETF Short Interest
Short interest as a % of outstanding shares. Short interest is for US Domiciled ETFs and is available bi-monthly from Bloomberg. Short interest is
weighted by AUM
Source: J.P. Morgan. Bloomberg
Chart A9: Equity ETF Short Interest
Short interest as a % of outstanding shares. Short interest is for US Domiciled ETFs and is available bi-monthly from Bloomberg. Short interest is
weighted by AUM
Source: J.P. Morgan. Bloomberg.
Chart A10: S&P500 sector short interest
Short interest as a % of shares outstanding based on z-scores. A strategy which overweight’s the S&P500 sectors with the highest short interest z-
score (as % of shares o/s) vs. those with the lowest, produced an information
ratio of 0.7 with a success rate of 56% (see F&L, Jun 28, 2013 for more
details)
Source: NYSE, J.P. Morgan
2%
4%
6%
8%
10%
12%
14%
16%
Jan-13 Jul-13 Jan-14 Jul-14 Jan-15 Jul-15 Jan-16
Equity Bonds Commodity
0%
2%
4%
6%
8%
10%
12%
14%
16%
18%
Jan-13 Jul-13 Jan-14 Jul-14 Jan-15 Jul-15 Jan-16
Global HG
Global HY
0%
2%
4%
6%
8%
10%
12%
14%
16%
Jan-13 Jul-13 Jan-14 Jul-14 Jan-15 Jul-15 Jan-16
US EM WE Japan
-1 0 1 2 3 4
Staples
Technology
Financials
Telecom
Utilities
Discretionary
Industrials
Materials
Health Care
Energy
Overall S&P500
3/15/2016 3/31/2016
This document is being provided for the exclusive use of [email protected].{[{QZ]*Owksv*O*nk!sn8uoyrkxoJp�8myw*;B9:>9<:;@}]}

7
Global Asset AllocationFlows & Liquidity
15 April 2016
Nikolaos Panigirtzoglou(44-20) [email protected]
Chart A11: Option skew monitor
Skew is the difference between the implied volatility of out-of-the-money
(OTM) call options and put options. A positive skew implies more demand for calls than puts and a negative skew, higher demand for puts than calls. It can
therefore be seen as an indicator of risk perception in that a highly negative
skew in equities is indicative of a bearish view. The chart shows z-score of the skew, i.e. the skew minus a rolling 2-year avg skew divided by a rolling
two-year standard deviation of the skew. A negative skew on iTraxx Main
means investors favor buying protection, i.e. a short risk position. A positive
skew for the Bund reflects a long duration view, also a short risk position.
Source: Bloomberg, J.P. Morgan
Chart A12: Market health map
Each of the six axes corresponds to a key indicator for markets. The position
of the blue line on each axis shows how far the current observation is from the extremes at either end of the scale. The dotted line shows the same but
at the beginning of 2012 for comparison. For example, a reading at the
centre for value would mean that risky assets are the most expensive they have ever been while a reading at the other end of the axis would mean they
are the cheapest they have ever been. See explanation on the right for each
indicator. Overall, the larger the blue area within the hexagon, the better for
risky markets.
Explanation of Market health map: All variables are expressed as the percentile of the distribution that the observation falls into. I.e. a reading in the middle of
the axis means that the observation falls exactly at the median of all historical observations. Value: The slope of the risk-return tradeoff line calculated across USTs, US HG and HY corporate bonds and US equities (see GMOS p. 6, Loeys et al, Jul 6 2011 for more details). Positions: Difference between net spec
positions on US equities and 10yr UST. See Chart A18. Flow momentum: The difference between flows into equity funds (incl. ETFs) and flows into bond funds.
Chart A1. We then smooth this using a Hodrick-Prescott filter with a lambda parameter of 100. We then take the weekly change in this smoothed series as shown in Chart A1. Economic momentum: The 2-month change in the global manufacturing PMI. (See REVISITING: Using the Global PMI as trading signal, Nikolaos
Panigirtzoglou, Jan 2012). Equity price momentum: The 6-month change in the S&P500 equity index.
Credit growth
Chart A13: Credit creation in the G4
Rolling sum of 4 quarter credit creation as % of GDP. Credit creation
includes both bank loans as well as net debt issuance by non financial
corporations and households. Last obs. is for Q3’15.
Source: Central bank, BIS, ICI, Barcap, Bloomberg, IMF and J.P. Morgan calculations
Chart A14: Credit creation in EM
Rolling sum of 4 quarter credit creation as % of GDP. Credit creation includes both bank loans as well as net debt issuance by non financial
corporations and households. Last obs. is for Q3’15.
Source: Central bank, BIS, ICI, Barcap, Bloomberg, IMF and J.P. Morgan calculations
-2.0 -1.5 -1.0 -0.5 0.0 0.5 1.0 1.5 2.0 2.5
S&P500
German Bund
Crude
iTraxx Main
EURUSD
Gold
13-Apr-2016
07-Apr-2016
PositionsInversed
FlowsEconomic
momentum
Equity price momentum
Value
-10%
-5%
0%
5%
10%
15%
Mar-02 Mar-04 Mar-06 Mar-08 Mar-10 Mar-12 Mar-14
G4 ex Euro
Euro area
-5%
5%
15%
25%
35%
45%
Mar-01 Mar-03 Mar-05 Mar-07 Mar-09 Mar-11 Mar-13 Mar-15
EM ex ChinaChinaG4
This document is being provided for the exclusive use of [email protected].{[{QZ]*Owksv*O*nk!sn8uoyrkxoJp�8myw*;B9:>9<:;@}]}

8
Global Asset AllocationFlows & Liquidity
15 April 2016
Nikolaos Panigirtzoglou(44-20) [email protected]
Spec position monitorsChart A15: Weekly Spec Position MonitorNet spec positions are the number of long contracts minus the number of
short using CFTC futures only data. This net position is then converted to a USD amount by multiplying by the contract size and then the corresponding
futures price. To proxy for speculative investors, commodity positions use the
managed money category, while the other assets use the non-commercial category. We then scale the net positions by open interest. The chart shows
the z-score of these net positions, i.e. the current net position divided by the
open interest, minus the average over the whole sample divided by the standard deviation of the weekly positions over the whole sample. US rates is
a duration-weighted composite of the individual UST series excluding the
Eurodollar contract. Brent positions are with one week lag. The sample starts
on the 13th of June 2006.
Source: Bloomberg, CFTC, J.P. Morgan
Chart A16: Spec position indicator on US equities
CFTC spec positions in US equity futures (in $bn).The US equity is an
aggregate of the S&P500, Dow Jones, NASDAQ and their Mini index.
Source: CFTC, Bloomberg and J.P. Morgan
Chart A17: Spec position indicator on Risky vs. Safe currencies
Difference between net spec positions on risky & safe currenciesNet spec position is calculated in USD across 5 "risky" and 3 "safe"
currencies (safe currencies also include Gold). These positions are then
scaled by open interest and we take an average of "risky" and "safe" assets to create two series. The chart is then simply the difference between the
"risky" and "safe" series. The final series shown in the chart below is
demeaned using data since 2006. The risky currencies are: AUD, NZD, CAD,
RUB, MXN and BRL. The safe currencies are: JPY, CHF and Gold.
Source: CFTC, J.P. Morgan
Chart A18: Spec position indicator on US equities vs. 10yr UST
Difference between net spec positions on US equities & 10yr USTSimilar to Chart A17, this indicator is derived by the difference between total
CFTC spec positions in US equity futures (in $bn) scaled by open interest (in $bn) minus a 10yr UST futures and scaled by open interest. The US equity is
an aggregate of the S&P500, Dow Jones, NASDAQ and their Mini index.
Source: CFTC, Bloomberg and J.P. Morgan
-3.0 -2.0 -1.0 0.0 1.0 2.0 3.0
Corn
Wheat
US 5YRUS Rates (ex. ED)
US 2YR
MXN
3M Eurodollars
BRL
NZD
GBP
US 10YR
EUR
US Equities
CAD
AUDUSD
WTI
VIX
Copper
RUB
Gold
CHF
Nikkei
Silver
JPY
US T-Bonds
Brent
29-Mar 16
05-Apr 16
Standard devations from mean weekly position
-30
-20
-10
0
10
20
30
40
Jan-13 Jun-13 Nov-13 Apr-14 Sep-14 Feb-15 Jul-15 Dec-15
Latest observation 05-Apr-16
-0.6
-0.4
-0.2
0.0
0.2
0.4
0.6
0.8
07 08 09 10 11 12 13 14 15 16
Last observation: 5-Apr-16
-30%
-20%
-10%
0%
10%
20%
30%
93 96 99 02 05 08 11 14
Last observation: 5-Apr-16
This document is being provided for the exclusive use of [email protected].{[{QZ]*Owksv*O*nk!sn8uoyrkxoJp�8myw*;B9:>9<:;@}]}

9
Global Asset AllocationFlows & Liquidity
15 April 2016
Nikolaos Panigirtzoglou(44-20) [email protected]
Mutual fund and hedge fund betas
Chart A19: Equity beta of US balanced mutual funds
Rolling 21-day equity betas based on a univariate regression of the daily
returns of our balanced mutual fund return index to the daily returns of the S&P 500. Our balanced mutual fund index includes the top 20 US-based
active funds by assets that have existed since 2006. It excludes tracker funds
and funds with a low tracking error.
Source: Bloomberg, Barcap, J.P. Morgan
Chart A20: Equity beta of CTAs and Risk Parity funds
Rolling 21-day equity betas based on a univariate regression of the daily
returns of the HFRX Systematic Diversified CTA Index and our Risk Parity
fund return index to the daily returns of the S&P 500.
Source: Bloomberg, Barcap, J.P. Morgan.
Chart A21: Equity beta of Equity L/S and Macro Discretionary
Rolling 21-day equity beta. The Equity L/S hedge fund and Macro
Discretionary hedge fund equity beta is based on univariate regression of
their daily returns to returns on the S&P500.
Source: Datastream, Barcap, Bloomberg, J.P. Morgan.
Chart A22: Currency hedge fund USD exposure
The rolling 21-day beta of the Barclay Hedge FX index with the JPM USD
tradable index vs. the net spec position in the USD as reported by the CFTC.
Spec is the non-commercial category from the CFTC. Net spec position
below is with one week’s lag.
Source: CFTC, Barclay, Datastream, Bloomberg J.P. Morgan
0.50
0.55
0.60
0.65
0.70
0.75
Jan-14 May-14 Sep-14 Jan-15 May-15 Sep-15 Jan-16
Last observation: 14-Apr-16
-0.6
-0.3
0.0
0.3
0.6
0.9
-0.1
0.0
0.1
0.2
0.3
0.4
0.5
0.6
Jan-14 May-14 Sep-14 Jan-15 May-15 Sep-15 Jan-16
Last observation: 14-Apr-16
CTAs
Risk Parity Funds
-0.2
0.0
0.2
0.4
0.6
0.8
Jan-14 May-14 Sep-14 Jan-15 May-15 Sep-15 Jan-16
Last observation:
Equity L/S HF: beta to the S&P500
Macro Discretionary HF: beta to the S&P500
13-Apr-16
-2.0
-1.5
-1.0
-0.5
0.0
0.5
1.0
1.5
2.0
-50
-40
-30
-20
-10
0
10
20
30
40
50
07 08 09 10 11 12 13 14 15 16
HF beta to the JPM USD tradable Index
Net spec positions in the USD
Latest observation: 12-Apr-16
This document is being provided for the exclusive use of [email protected].{[{QZ]*Owksv*O*nk!sn8uoyrkxoJp�8myw*;B9:>9<:;@}]}

10
Global Asset AllocationFlows & Liquidity
15 April 2016
Nikolaos Panigirtzoglou(44-20) [email protected]
Corporate activity
Chart A23: G4 non-financial corporate capex and cash flow as % of GDP
% of GDP, G4 includes the US, the UK, the Euro area and Japan. Last
observation as of Q3 2015.
Source: ECB, BOJ, BOE, Federal Reserve flow of funds
Chart A24: G4 non-financial corporate sector net debt and equity issuance
$tr per quarter, G4 includes the US, the UK, the Euro area and Japan. Last
observation as of Q3 2015.
Source: ECB, BOJ, BOE, Federal Reserve flow of funds
Chart A25: Global M&A and LBO
$tr. YTD 2016 as of Apr 15. M&A and LBOs are announced.
Source: Reuters ThomsonOne, J.P. Morgan
Chart A26: US and non-US share buybacks
$tr, YTD 2016 as of Apr 15. Buybacks are announced.
Source: Reuters ThomsonOne, J.P. Morgan
7.5
8.0
8.5
9.0
9.5
10.0
10.5
11.0
11.5
12.0
95 97 99 01 03 05 07 09 11 13 15
G4 Capex
G4 Cash flow
-1.0
-0.5
0.0
0.5
1.0
1.5
2.0
98 00 02 04 06 08 10 12 14
Thou
sand
s
G4 net debt issuance
G4 net equity issuance
0.0
0.1
0.2
0.3
0.4
0.5
0.6
0.7
0.8
0.0
0.5
1.0
1.5
2.0
2.5
3.0
3.5
4.0
4.5
05 06 07 08 09 10 11 12 13 14 15 16
M&A ex-LBO (lhs)
LBO (rhs)
YTD
0.0
0.1
0.2
0.3
0.4
0.5
0.6
0.7
0.8
05 06 07 08 09 10 11 12 13 14 15 16
Non-US buybacks
US buybacks
YTD
This document is being provided for the exclusive use of [email protected].{[{QZ]*Owksv*O*nk!sn8uoyrkxoJp�8myw*;B9:>9<:;@}]}

11
Global Asset AllocationFlows & Liquidity
15 April 2016
Nikolaos Panigirtzoglou(44-20) [email protected]
Pension fund and insurance company flows
Chart A27: G4 pension funds and insurance companies equity and bond flows
Equity and bond buying in $bn per quarter. G4 includes the US, the UK, Euro
area and Japan. Last observation is Q4 2015
Source: ECB, BOJ, BOE, Federal Reserve flow of funds.
Chart A28: G4 pension funds and insurance companies equity and bond levels
Equity and bond as % of total assets per quarter. G4 includes the US, the
UK, Euro area and Japan. Last observation is Q4 2015.
Source: ECB, BOJ, BOE, Federal Reserve flow of funds
Chart A29: Pension fund deficits
US$bn. For US, funded status of the 100 largest corporate defined benefit
pension plans, from Milliman. For UK, funded status of the defined benefit
schemes eligible for entry to the Pension Protection Fund, converted to US$
at today’s exchange rates. Last obs. is Mar’16 for UK and Feb'16 for US.
Source: Milliman, UK Pension Protection Fund, J.P. Morgan
Chart A30: G4 pension funds and insurance companies cash and alternatives levels
Cash and alternative investments as % of total assets per quarter. G4
includes the US, the UK, Euro area and Japan. Last observation is Q4 2015.
Source: ECB, BOJ, BOE, Federal Reserve flow of funds
-150
-100
-50
0
50
100
150
200
250
300
350
Mar-99 Mar-02 Mar-05 Mar-08 Mar-11 Mar-14
Bonds
Equities
20%
25%
30%
35%
40%
45%
50%
55%
Jun-99 Jun-02 Jun-05 Jun-08 Jun-11 Jun-14
Bonds
Equities
-600
-500
-400
-300
-200
-100
0
100
200
300
Jan-10 Jan-11 Jan-12 Jan-13 Jan-14 Jan-15 Jan-16
UK
US
0%
5%
10%
15%
20%
25%
30%
Mar-99 Mar-02 Mar-05 Mar-08 Mar-11 Mar-14
Cash
Alternatives
This document is being provided for the exclusive use of [email protected].{[{QZ]*Owksv*O*nk!sn8uoyrkxoJp�8myw*;B9:>9<:;@}]}

12
Global Asset AllocationFlows & Liquidity
15 April 2016
Nikolaos Panigirtzoglou(44-20) [email protected]
Funding market monitor
Table A4: Bank deposits and ECB reliance
Deposits are non-seasonally adjusted Euro area non-bank, non-government deposits as of February 2016. We take total deposits (item 2.2.3. in MFI balance sheets minus “deposits from other financial institutions”, which includes deposits from securitized vehicles and financial holding corporations among others. We
also subtract repos (item 2.2.3.4) from the total figures to give a cleaner picture of deposits outside interbank borrowing. ECB borrowing and Target 2 balances
are latest available. ECB borrowing is gross borrowing from regular MROs and LTROs. The Chart shows the evolution of Target 2 balance for Spain and Italy along with government bond spreads. The shaded area denotes the period between May 2011 and Aug 2012 when convertibility risk premia were elevated due to
Greece exit fears.
Source: Bloomberg, ECB, National Central Banks, J.P. Morgan Source: Bloomberg, National Central Banks, J.P. Morgan
Chart A31: USD and Non-USD net bond issuances
Gross issuance minus redemptions in $bn per month. Non-USD issuance
includes bonds issued in EUR, GBP and JPY. Non-USD bond issuance is converted to USD at today’s exchange rate through the full historical period.
In this way net bond issuance fluctuations are unaffected by currency
changes. Our bond issuance figures include Government as well as non-Government bonds issued globally, excluding short-term debt (maturity less
than 1-year) and self-funded issuance (where the issuing bank is the only
book runner).Last observation is Mar 2016
Source: Dealogic, J.P. Morgan
Chart A32: Global government bonds with negative yields
In $tr., Amount outstanding of bonds trading with negative yield within the
JPM Global Government Bond Index (JPM GBI Broad Index). Converted to
USD at today’s exchange rate.
Source: ECB, J.P. Morgan.
€bn Target 2 bal. Target 6m chng ECB borrowing Depo 3m chng Depo 12m chng
Austria -38 -4 16 2.2% 1.9%
Belgium -16 -11 8 0.2% 4.4%
Cyprus 2 1 1 1.5% 6.0%
Finland 58 29 1 6.7% 10.1%
France -68 -11 84 1.6% 4.9%
Germany 605 44 45 0.2% 2.4%
Greece -95 6 36 0.9% -13.3%
Ireland 1 7 10 0.1% 1.6%
Italy -263 -28 151 1.7% 3.3%
Luxembourg 147 31 3 0.8% -0.3%
Netherlands 59 4 15 0.5% 0.8%
Portugal -67 -7 25 0.3% 3.8%
Spain -263 -34 131 0.1% 0.8%
0.5
1.5
2.5
3.5
4.5
5.5
-800
-700
-600
-500
-400
-300
-200
-100
0
100
Jan-11 Jan-12 Jan-13 Jan-14 Jan-15 Jan-16
Spanish and Italian Target2
10y Spanish and Italian govt spread vs Bunds
-200
-150
-100
-50
0
50
100
150
200
250
Jan-13 Jul-13 Jan-14 Jul-14 Jan-15 Jul-15 Jan-16
USD Issuances
NON-USD Issuances 0.0
1.0
2.0
3.0
4.0
5.0
6.0
7.0
8.0
Jul-14 Nov-14 Mar-15 Jul-15 Nov-15 Mar-16
Last Observation: $6.9tr. as of 14-Apr.
This document is being provided for the exclusive use of [email protected].{[{QZ]*Owksv*O*nk!sn8uoyrkxoJp�8myw*;B9:>9<:;@}]}

13
Global Asset AllocationFlows & Liquidity
15 April 2016
Nikolaos Panigirtzoglou(44-20) [email protected]
Japanese flows and positions
Chart A33: Tokyo Stock Exchange margin trading: total buys minus total sells
In bn of shares. Topix on right axis.
Source: Tokyo Stock Exchange, J.P. Morgan
Chart A34: Domestic retail flows
In JPY tr. Retail flows are from Tokyo stock exchange.
Source: TSE, J.P. Morgan calculations
Chart A35: Japanese equity buying by foreign investors. Japanese investors' buying of foreign bonds
$bn, 4 week moving average.
Source: Japan MoF, J.P. Morgan
Chart A36: Overseas CFTC spec positions
CFTC positions are in $bn.
Source: Bloomberg, CFTC, J.P. Morgan calculations.
500
1000
1500
2000
2500
3000
3500
0.0
1.0
2.0
3.0
4.0
5.0
6.0
89 92 95 98 01 04 07 10 13
buys minus sells
Topix
Last observation: 14-Apr-16
-0.8
-0.6
-0.4
-0.2
0.0
0.2
0.4
12 13 14 15 16
Japanese retail flow (4 wk avg.)
Last observation: 5-Apr-16
-10
-5
0
5
10
15
12 13 14 15 16
Foreign investors' buying of Japanese equities
Japanese investors' buying of foreign bonds
Last observation: 9-Apr-16
-1.5
-1.0
-0.5
0.0
0.5
1.0
1.5
-20
-15
-10
-5
0
5
10
15
20
12 13 14 15 16
Nikkei Spec position
CFTC JPY/USD net spec positions
Last observation: 5-Apr-16
This document is being provided for the exclusive use of [email protected].{[{QZ]*Owksv*O*nk!sn8uoyrkxoJp�8myw*;B9:>9<:;@}]}

14
Global Asset AllocationFlows & Liquidity
15 April 2016
Nikolaos Panigirtzoglou(44-20) [email protected]
Commodity flows and positions
Chart A37: Gold spec positions
$bn. CFTC net long minus short position in futures for the Managed Money
category.
Source: CFTC, Bloomberg, J.P. Morgan.
Chart A38: Gold ETFs
Mn troy oz. Physical gold held by all gold ETFs globally.
Source: Bloomberg, J.P. Morgan.
Chart A39: Oil spec positions
Net spec positions divided by open interest. CFTC futures positions for WTI
and Brent are net long minus short for the Managed Money category. Brent
positions are with one week lag.
Source: CFTC, Bloomberg, J.P. Morgan
Chart A40: Energy equity ETF flows
Cumulative flow energy equity ETFs as a % of AUM. MLP refers to the
Alerian MLP ETF
Source: CFTC, Bloomberg, J.P. Morgan
-5
0
5
10
15
20
25
30
35
40
Jun-06 Dec-07 Jun-09 Dec-10 Jun-12 Dec-13 Jun-15
Last observation: 5-Apr-16
0
10
20
30
40
50
60
70
80
90
Nov-03 Nov-05 Nov-07 Nov-09 Nov-11 Nov-13 Nov-15
Last observation: 13-Apr-16
0%
5%
10%
15%
20%
25%
Jan-12 Jan-13 Jan-14 Jan-15 Jan-16
Brent WTI
Last observation: 5-Apr-16
-10%
0%
10%
20%
30%
40%
50%
60%
70%
Jan-14 May-14 Sep-14 Jan-15 May-15 Sep-15 Jan-16
Energy ex MLP
MLP
Last observation: 13-Apr-16
This document is being provided for the exclusive use of [email protected].{[{QZ]*Owksv*O*nk!sn8uoyrkxoJp�8myw*;B9:>9<:;@}]}

15
Global Asset AllocationFlows & Liquidity
15 April 2016
Nikolaos Panigirtzoglou(44-20) [email protected]
This page has been left intentionally blank
This document is being provided for the exclusive use of [email protected].{[{QZ]*Owksv*O*nk!sn8uoyrkxoJp�8myw*;B9:>9<:;@}]}

16
Global Asset AllocationFlows & Liquidity
15 April 2016
Nikolaos Panigirtzoglou(44-20) [email protected]
This page has been left intentionally blank
This document is being provided for the exclusive use of [email protected].{[{QZ]*Owksv*O*nk!sn8uoyrkxoJp�8myw*;B9:>9<:;@}]}

17
Global Asset AllocationFlows & Liquidity
15 April 2016
Nikolaos Panigirtzoglou(44-20) [email protected]
This page has been left intentionally blank
This document is being provided for the exclusive use of [email protected].{[{QZ]*Owksv*O*nk!sn8uoyrkxoJp�8myw*;B9:>9<:;@}]}

18
Global Asset AllocationFlows & Liquidity
15 April 2016
Nikolaos Panigirtzoglou(44-20) [email protected]
Disclosures
Analyst Certification: The research analyst(s) denoted by an “AC” on the cover of this report certifies (or, where multiple research analysts are primarily responsible for this report, the research analyst denoted by an “AC” on the cover or within the document individually certifies, with respect to each security or issuer that the research analyst covers in this research) that: (1) all of the views expressed in this report accurately reflect his or her personal views about any and all of the subject securities or issuers; and (2) no part of any of the research analyst's compensation was, is, or will be directly or indirectly related to the specific recommendations or views expressed by the research analyst(s) in this report. For all Korea-based research analysts listed on the front cover, they also certify, as per KOFIA requirements, that their analysis was made in good faith and that the views reflect their own opinion, without undue influence or intervention.
Important Disclosures
Company-Specific Disclosures: Important disclosures, including price charts and credit opinion history tables, are available for compendium reports and all J.P. Morgan–covered companies by visiting https://jpmm.com/research/disclosures, calling 1-800-477-0406, or e-mailing [email protected] with your request. J.P. Morgan’s Strategy, Technical, and Quantitative Research teams may screen companies not covered by J.P. Morgan. For important disclosures for these companies, please call 1-800-477-0406 or e-mail [email protected].
Explanation of Emerging Markets Sovereign Research Ratings System and Valuation & Methodology:Ratings System: J.P. Morgan uses the following issuer portfolio weightings for Emerging Markets sovereign credit strategy: Overweight (over the next three months, the recommended risk position is expected to outperform the relevant index, sector, or benchmark credit returns); Marketweight (over the next three months, the recommended risk position is expected to perform in line with the relevant index, sector, or benchmark credit returns); and Underweight (over the next three months, the recommended risk position is expected to underperform the relevant index, sector, or benchmark credit returns). NR is Not Rated. In this case, J.P. Morgan has removed the rating for this security because of either legal, regulatory or policy reasons or because of lack of a sufficient fundamental basis. The previous rating no longer should be relied upon. An NR designation is not a recommendation or a rating. NC is Not Covered. An NC designation is not a rating or a recommendation. Recommendations will be at the issuer level, and an issuer recommendation applies to all of the index-eligible bonds at the same level for the issuer. When we change the issuer-level rating, we are changing the rating for all of the issues covered, unless otherwise specified. Ratings for quasi-sovereign issuers in the EMBIG may differ from the ratings provided in EM corporate coverage.Valuation & Methodology: For J.P. Morgan's Emerging Markets Sovereign Credit Strategy, we assign a rating to each sovereign issuer (Overweight, Marketweight or Underweight) based on our view of whether the combination of the issuer’s fundamentals, market technicals, and the relative value of its securities will cause it to outperform, perform in line with, or underperform the credit returns of the EMBIGD index over the next three months. Our view of an issuer’s fundamentals includes our opinion of whether the issuer is becoming more or less able to service its debt obligations when they become due and payable, as well as whether its willingness to service debt obligations is increasing or decreasing.
Analysts' Compensation: The research analysts responsible for the preparation of this report receive compensation based upon various factors, including the quality and accuracy of research, client feedback, competitive factors, and overall firm revenues.
Other Disclosures
J.P. Morgan ("JPM") is the global brand name for J.P. Morgan Securities LLC ("JPMS") and its affiliates worldwide. J.P. Morgan Cazenove is a marketing name for the U.K. investment banking businesses and EMEA cash equities and equity research businesses of JPMorgan Chase & Co. and its subsidiaries.
Options related research: If the information contained herein regards options related research, such information is available only to persons who have received the proper option risk disclosure documents. For a copy of the Option Clearing Corporation's Characteristics and Risks of Standardized Options, please contact your J.P. Morgan Representative or visit the OCC's website at http://www.optionsclearing.com/publications/risks/riskstoc.pdf
Legal Entities Disclosures U.S.: JPMS is a member of NYSE, FINRA, SIPC and the NFA. JPMorgan Chase Bank, N.A. is a member of FDIC. U.K.: JPMorgan Chase N.A., London Branch, is authorised by the Prudential Regulation Authority and is subject to regulation by the Financial Conduct Authority and to limited regulation by the Prudential Regulation Authority. Details about the extent of our regulation by the Prudential Regulation Authority are available from J.P. Morgan on request. J.P. Morgan Securities plc (JPMS plc) is a member of the London Stock Exchange and is authorised by the Prudential Regulation Authority and regulated by the Financial Conduct Authority and the Prudential Regulation Authority. Registered in England & Wales No. 2711006. Registered Office 25 Bank Street, London, E14 5JP. South Africa: J.P. Morgan Equities South Africa Proprietary Limited is a member of the Johannesburg Securities Exchange and is regulated by the Financial Services Board. Hong Kong: J.P. Morgan Securities (Asia Pacific) Limited (CE number AAJ321) is regulated by the Hong Kong Monetary Authority and the Securities and Futures Commission in Hong Kong and/or J.P. Morgan Broking (Hong Kong) Limited (CE number AAB027) is regulated by the Securities and Futures Commission in Hong Kong. Korea: This material is issued and distributed in Korea by or through J.P. Morgan Securities (Far East) Limited, Seoul Branch, which is a member of the Korea Exchange(KRX) and is regulated by the Financial
This document is being provided for the exclusive use of [email protected].{[{QZ]*Owksv*O*nk!sn8uoyrkxoJp�8myw*;B9:>9<:;@}]}

19
Global Asset AllocationFlows & Liquidity
15 April 2016
Nikolaos Panigirtzoglou(44-20) [email protected]
Services Commission (FSC) and the Financial Supervisory Service (FSS). Australia: J.P. Morgan Australia Limited (JPMAL) (ABN 52 002 888 011/AFS Licence No: 238188) is regulated by ASIC and J.P. Morgan Securities Australia Limited (JPMSAL) (ABN 61 003 245 234/AFS Licence No: 238066) is regulated by ASIC and is a Market, Clearing and Settlement Participant of ASX Limited and CHI-X. Taiwan: J.P.Morgan Securities (Taiwan) Limited is a participant of the Taiwan Stock Exchange (company-type) and regulated by the Taiwan Securities and Futures Bureau. India: J.P. Morgan India Private Limited (Corporate Identity Number - U67120MH1992FTC068724), having its registered office at J.P. Morgan Tower, Off. C.S.T. Road, Kalina, Santacruz - East, Mumbai – 400098, is registered with Securities and Exchange Board of India (SEBI) as a ‘Research Analyst’ having registration number INH000001873. J.P. Morgan India Private Limited is also registered with SEBI as a member of the National Stock Exchange of India Limited (SEBI Registration Number - INB 230675231/INF 230675231/INE 230675231) and Bombay Stock Exchange Limited (SEBI Registration Number - INB 010675237/INF 010675237). Telephone: 91-22-6157 3000, Facsimile: 91-22-6157 3990 and Website: www.jpmipl.com. For non local research reports, this material is not distributed in India by J.P. Morgan India Private Limited. Thailand: This material is issued and distributed in Thailand by JPMorgan Securities (Thailand) Ltd., which is a member of the Stock Exchange of Thailand and is regulated by the Ministry of Finance and the Securities and Exchange Commission and its registered address is 3rd Floor, 20 North Sathorn Road, Silom, Bangrak, Bangkok 10500. Indonesia: PT J.P. Morgan Securities Indonesia is a member of the Indonesia Stock Exchange and is regulated by the OJK a.k.a. BAPEPAM LK. Philippines: J.P. Morgan Securities Philippines Inc. is a Trading Participant of the Philippine Stock Exchange and a member of the Securities Clearing Corporation of the Philippines and the Securities Investor Protection Fund. It is regulated by the Securities and Exchange Commission. Brazil: Banco J.P. Morgan S.A. is regulated by the Comissao de Valores Mobiliarios (CVM) and by the Central Bank of Brazil. Mexico: J.P. Morgan Casa de Bolsa, S.A. de C.V., J.P. Morgan Grupo Financiero is a member of the Mexican Stock Exchange and authorized to act as a broker dealer by the National Banking and Securities Exchange Commission. Singapore: This material is issued and distributed in Singapore by or through J.P. Morgan Securities Singapore Private Limited (JPMSS) [MCI (P) 193/03/2016 and Co. Reg. No.: 199405335R] which is a member of the Singapore Exchange Securities Trading Limited and is regulated by the Monetary Authority of Singapore (MAS) and/or JPMorgan Chase Bank, N.A., Singapore branch (JPMCB Singapore) which is regulated by the MAS. This material is provided in Singapore only to accredited investors, expert investors and institutional investors, as defined in Section 4A of the Securities and Futures Act, Cap. 289. Recipients of this document are to contact JPMSS or JPMCB Singapore in respect of any matters arising from, or in connection with, the document. Japan: JPMorgan Securities Japan Co., Ltd. and JPMorgan Chase Bank, N.A., Tokyo Branch are regulated by the Financial Services Agency in Japan. Malaysia: This material is issued and distributed in Malaysia by JPMorgan Securities (Malaysia) Sdn Bhd (18146-X) which is a Participating Organization of Bursa Malaysia Berhad and a holder of Capital Markets Services License issued by the Securities Commission in Malaysia. Pakistan: J. P. Morgan Pakistan Broking (Pvt.) Ltd is a member of the Karachi Stock Exchange and regulated by the Securities and Exchange Commission of Pakistan. Saudi Arabia: J.P. Morgan Saudi Arabia Ltd. is authorized by the Capital Market Authority of the Kingdom of Saudi Arabia (CMA) to carry out dealing as an agent, arranging, advising and custody, with respect to securities business under licence number 35-07079 and its registered address is at 8th Floor, Al-Faisaliyah Tower, King Fahad Road, P.O. Box 51907, Riyadh 11553, Kingdom of Saudi Arabia. Dubai: JPMorgan Chase Bank, N.A., Dubai Branch is regulated by the Dubai Financial Services Authority (DFSA) and its registered address is Dubai International Financial Centre - Building 3, Level 7, PO Box 506551, Dubai, UAE.
Country and Region Specific Disclosures U.K. and European Economic Area (EEA): Unless specified to the contrary, issued and approved for distribution in the U.K. and the EEA by JPMS plc. Investment research issued by JPMS plc has been prepared in accordance with JPMS plc's policies for managing conflicts of interest arising as a result of publication and distribution of investment research. Many European regulators require a firm to establish, implement and maintain such a policy. This report has been issued in the U.K. only to persons of a kind described in Article 19 (5), 38, 47 and 49 of the Financial Services and Markets Act 2000 (Financial Promotion) Order 2005 (all such persons being referred to as "relevant persons"). This document must not be acted on or relied on by persons who are not relevant persons. Any investment or investment activity to which this document relates is only available to relevant persons and will be engaged in only with relevant persons. In other EEA countries, the report has been issued to persons regarded as professional investors (or equivalent) in their home jurisdiction. Australia: This material is issued and distributed by JPMSAL in Australia to "wholesale clients" only. This material does not take into account the specific investment objectives, financial situation or particular needs of the recipient. The recipient of this material must not distribute it to any third party or outside Australia without the prior written consent of JPMSAL. For the purposes of this paragraph the term "wholesale client" has the meaning given in section 761G of the Corporations Act 2001. Germany: This material is distributed in Germany by J.P. Morgan Securities plc, Frankfurt Branch and J.P.Morgan Chase Bank, N.A., Frankfurt Branch which are regulated by the Bundesanstalt für Finanzdienstleistungsaufsicht. Hong Kong: The 1% ownership disclosure as of the previous month end satisfies the requirements under Paragraph 16.5(a) of the Hong Kong Code of Conduct for Persons Licensed by or Registered with the Securities and Futures Commission. (For research published within the first ten days of the month, the disclosure may be based on the month end data from two months prior.) J.P. Morgan Broking (Hong Kong) Limited is the liquidity provider/market maker for derivative warrants, callable bull bear contracts and stock options listed on the Stock Exchange of Hong Kong Limited. An updated list can be found on HKEx website: http://www.hkex.com.hk. Japan: There is a risk that a loss may occur due to a change in the price of the shares in the case of share trading, and that a loss may occur due to the exchange rate in the case of foreign share trading. In the case of share trading, JPMorgan Securities Japan Co., Ltd., will be receiving a brokerage fee and consumption tax (shouhizei) calculated by multiplying the executed price by the commission rate which was individually agreed between JPMorgan Securities Japan Co., Ltd., and the customer in advance. Financial Instruments Firms: JPMorgan Securities Japan Co., Ltd., Kanto Local Finance Bureau (kinsho) No. 82 Participating Association / Japan Securities Dealers Association, The Financial Futures Association of Japan, Type II Financial Instruments Firms Association and Japan Investment Advisers Association. Korea: This report may have been edited or contributed to from time to time by affiliates of J.P. Morgan Securities (Far East) Limited, Seoul Branch. Singapore: As at the date of this report, JPMSS is a designated market maker for certain structured warrants listed on the Singapore Exchange where the underlying securities may be the securities discussed in this report. Arising from its role as designated market maker for such structured warrants, JPMSS may conduct hedging activities in respect of such underlying securities and hold or have an interest in such underlying securities as a result. The updated list of structured warrants for which JPMSS acts as designated market maker may be found on the website of the Singapore Exchange Limited: http://www.sgx.com.sg. In addition, JPMSS and/or its affiliates may also have an interest or holding in any of the securities discussed in this report – please see the Important Disclosures section above. For securities where the holding is 1% or greater, the holding may be found in the Important Disclosures section above. For all other securities mentioned in this report, JPMSS and/or its affiliates may have a holding of less than 1% in such securities and may trade them in ways different from those discussed in this report. Employees of JPMSS and/or its affiliates not involved in the preparation of this report may have investments in the securities (or derivatives of such securities) mentioned in this report and may trade them in ways different from those discussed in this report. Taiwan: This material is issued and distributed in Taiwan by J.P. Morgan Securities (Taiwan) Limited. India: For private circulation only, not for sale. Pakistan: For private circulation only, not for sale. New Zealand: This material is issued and distributed by JPMSAL in New Zealand only to persons whose principal business is the investment of money or who, in the course of and for the purposes of their business, habitually invest money. JPMSAL does not issue or distribute this material to
This document is being provided for the exclusive use of [email protected].{[{QZ]*Owksv*O*nk!sn8uoyrkxoJp�8myw*;B9:>9<:;@}]}
20
Global Asset AllocationFlows & Liquidity
15 April 2016
Nikolaos Panigirtzoglou(44-20) [email protected]
members of "the public" as determined in accordance with section 3 of the Securities Act 1978. The recipient of this material must not distribute it to any third party or outside New Zealand without the prior written consent of JPMSAL. Canada: The information contained herein is not, and under no circumstances is to be construed as, a prospectus, an advertisement, a public offering, an offer to sell securities described herein, or solicitation of an offer to buy securities described herein, in Canada or any province or territory thereof. Any offer or sale of the securities described herein in Canada will be made only under an exemption from the requirements to file a prospectus with the relevant Canadian securities regulators and only by a dealer properly registered under applicable securities laws or, alternatively, pursuant to an exemption from the dealer registration requirement in the relevant province or territory of Canada in which such offer or sale is made. The information contained herein is under no circumstances to be construed as investment advice in any province or territory of Canada and is not tailored to the needs of the recipient. To the extent that the information contained herein references securities of an issuer incorporated, formed or created under the laws of Canada or a province or territory of Canada, any trades in such securities must be conducted through a dealer registered in Canada. No securities commission or similar regulatory authority in Canada has reviewed or in any way passed judgment upon these materials, the information contained herein or the merits of the securities described herein, and any representation to the contrary is an offence. Dubai: This report has been issued to persons regarded as professional clients as defined under the DFSA rules. Brazil: Ombudsman J.P. Morgan: 0800-7700847 / [email protected].
General: Additional information is available upon request. Information has been obtained from sources believed to be reliable but JPMorgan Chase & Co. or its affiliates and/or subsidiaries (collectively J.P. Morgan) do not warrant its completeness or accuracy except with respect to any disclosures relative to JPMS and/or its affiliates and the analyst's involvement with the issuer that is the subject of the research. All pricing is as of the close of market for the securities discussed, unless otherwise stated. Opinions and estimates constitute our judgment as of the date of this material and are subject to change without notice. Past performance is not indicative of future results. This material is not intended as an offer or solicitation for the purchase or sale of any financial instrument. The opinions and recommendations herein do not take into account individual client circumstances, objectives, or needs and are not intended as recommendations of particular securities, financial instruments or strategies to particular clients. The recipient of this report must make its own independent decisions regarding any securities or financial instruments mentioned herein. JPMS distributes in the U.S. research published by non-U.S. affiliates and accepts responsibility for its contents. Periodic updates may be provided on companies/industries based on company specific developments or announcements, market conditions or any other publicly available information. Clients should contact analysts and execute transactions through a J.P. Morgan subsidiary or affiliate in their home jurisdiction unless governing law permits otherwise.
"Other Disclosures" last revised April 09, 2016.
Copyright 2016 JPMorgan Chase & Co. All rights reserved. This report or any portion hereof may not be reprinted, sold or redistributed without the written consent of J.P. Morgan. #$J&098$#*P
This document is being provided for the exclusive use of [email protected].{[{QZ]*Owksv*O*nk!sn8uoyrkxoJp�8myw*;B9:>9<:;@}]}