global economic prospects january 2012 middle … economic prospects january 2012 middle east &...
TRANSCRIPT

Global Economic Prospects January 2012 Middle East & North Africa Annex
Overview
The dramatic political changes in the Middle
East and North Africa of the last year have
disrupted economic activity substantially, but
selectively across the region. The area is now
facing two sets of tensions and
uncertainties―the more important of which is
continuing domestic disturbance and local
challenges affecting countries already taking
steps toward political and economic reform (and
for countries in internal conflict). At the same
time a deteriorating external environment
(largely in Europe) is amplifying adverse effects
on goods trade, commodity prices, tourism and
other critical export receipts. Though several
countries in the region—including Tunisia,
Morocco, and Jordan—appeared to be on the
cusp of positive or improved growth in late
2011, the onset of financial crisis in the high-
income countries may come to delay that event.
For the developing net-oil importing countries as
a group, initial conditions going into the current
period of turmoil are weak: including a lack of
meaningful fiscal space, dampened economic
activity, depletion of reserves and continuing
social tensions in several countries. Developing
oil exporters (if not in internal conflict) are better
situated to withstand the brunt of the crisis, on
the assumption that oil prices do not fall
substantially in the face of declining demand.
Domestic challenges are difficult and
widespread. Ten months after the Arab Spring,
political unrest and political economy issues
continue to determine in good part economic
policies and prospects for growth. Though
elections held in Egypt, Tunisia and Morocco
went smoothly, a degree of underlying
dissension remains. A failure to achieve political
and macroeconomic stability would extend
uncertainties, keeping investment and economic
activity at low levels for several countries,
potentially for an extended period of time.
Underlying demographic pressures remain
unabated as well, and with prospects of slower
gains in employment ahead, this becomes
another area of uncertainty and vulnerability.
The Middle East and North Africa is
prospectively entering a ―third‖ crisis episode in
succession, following on the ―great recession‖,
and importantly for the region, the ―food price‖
crisis of 2007-08, under which substantial hikes
in grains prices took a toll on terms of trade for
all countries in the region. To a degree, today‘s
weak fiscal positions in a number of oil
importing countries, which will play a role in
developments over the next two years, have their
source in that period.
The region will feel the bulk of effects of slower
European—and global—growth largely through
the trade channel, notably oil but also
manufactured goods, rather than the financial
channel, given relatively weak links in this area.
On balance, with the already difficult conditions
being experienced by many countries in the
region because of recent output disruptions, a
global downturn will be felt more severely now
than in 2008-09, when economic growth in the
region was relatively robust.
Middle East and North Africa Region
Figure MNA.1 "Snap-back" dynamics affect industrial
production in Egypt and Tunisia
Source: National Agencies through Thomson-Reuters Data-
stream
-40
0
40
80
120
160
200
-40
-30
-20
-10
0
10
20
30
40
50
2009M01 2009M06 2009M11 2010M04 2010M09 2011M02 2011M07
Tunisia [L] Jordan [L] Egypt [R]
industrial production, ch% 3m/3m saar
1

Global Economic Prospects January 2012 Middle East & North Africa Annex
GDP for the developing countries of the Middle
East and North Africa region1 is estimated to
have increased 1.7 percent in 2011, down from
the 3.6 percent gain of 2010 (table MNA.1).
Growth is likely to remain subdued in 2012 (2.3
percent), as external conditions join uncertain or
adverse developments on the domestic side to
make recovery more difficult—in particular
constraining a needed pick-up in investment
outlays. Growth is expected to rise to 3.2 percent
by 2013, as FDI and investment finally revive,
traditional revenue streams (tourism and
remittances) begin to normalize, and civil unrest
in several countries is assumed to be resolved.
Growth in 2012 is projected to be subdued in
both oil exporters (partly reflecting weaker oil
prices) and oil importers – many of which
(Morocco, Tunisia, Egypt) have very close
economic ties to high-income Europe, and others
(Jordan and Lebanon) with closer links to the
Gulf Cooperation Council (GCC) GCC
economies.
Recent developments
One source of strength in the broader Middle
East and North Africa economy is the large oil
and natural gas windfalls being generated by the
region‘s exporters. This has provided substantial
funding for exporters to support subsidies and
job creation programs as well as infrastructure-
related projects which have served to quell a
good portion of social uncertainty in these
countries as a group. The developing oil
exporters and the high-income GCC economies
benefitted substantially from the rise in oil prices
of 2010 and the first half of 2011, and several
(e.g. Saudi Arabia, Kuwait) have increased
production on the margin to cover for the earlier
loss of Libyan crude oil on the market.
Overall Middle East and North Africa
hydrocarbon revenues totaled $785 billion in
2011 with the developing oil economies
(Algeria, Iran, Syria and Yemen) absorbing $50
Table MNA.1 Middle East and North Africa forecast summary
Source: World Bank.
Est.
98-07a2008 2009 2010 2011 2012 2013
GDP at market prices (2005 US$) b 4.2 4.1 4.0 3.6 1.7 2.3 3.2
GDP per capita (units in US$) 2.7 2.4 2.3 1.9 0.1 0.7 1.6
PPP GDP c 4.3 4.1 4.0 3.7 1.6 2.2 3.2
Private consumption 4.4 5.2 5.0 3.8 1.7 2.8 3.6
Public consumption 3.2 8.6 7.0 4.0 9.7 7.8 6.2
Fixed investment 6.0 7.6 2.9 1.8 -0.4 3.0 5.0
Exports, GNFS d 5.2 4.6 -6.3 3.0 -1.4 1.3 3.0
Imports, GNFS d 7.1 11.4 -1.8 2.7 1.1 4.2 5.8
Net exports, contribution to growth -0.2 -2.2 -1.7 0.1 -0.9 -1.0 -1.0
Current account bal/GDP (%) 7.5 7.4 -0.7 2.8 3.7 2.4 1.1
GDP deflator (median, LCU) 4.7 14.6 2.0 9.6 7.5 8.5 6.0
Fiscal balance/GDP (%) -1.0 -0.3 -3.4 -2.9 -2.6 -2.3 -2.1
Memo items: GDP
MENA Geographic Region e 3.8 4.7 1.9 3.3 2.4 3.2 3.8
Resource poor- Labor abundant 4.1 6.6 5.9 4.5 1.8 3.4 4.6
Resource rich- Labor abundant 4.2 2.6 2.3 2.1 0.1 2.2 3.0
Selected GCC Countries f 3.4 5.3 -0.5 3.3 4.6 3.7 4.5
Egypt g 4.3 7.5 4.9 5.1 1.8 3.8 0.7
Iran 4.9 2.3 3.5 3.2 2.5 2.7 3.1
Algeria 3.5 2.4 2.4 1.8 3.0 2.7 2.9
(annual percent change unless indicated otherwise)
a. Growth rates over intervals are compound average; growth contributions, ratios and the
GDP deflator are averages.
b. GDP measured in constant 2005 U.S. dollars.
c. GDP measured at PPP exchange rates.
d. Exports and imports of goods and non-factor services (GNFS).
e. Geographic region includes high-income countries: Bahrain, Kuwait, Oman and Saudi
Arabia.
f. Selected GCC Countries: Bahrain, Kuwait, Oman and Saudi Arabia.
g. Egypt growth presented on Fiscal Year basis.
h. Forecast.
Forecast
2

Global Economic Prospects January 2012 Middle East & North Africa Annex
billion of the $200 billion increase in the year
(figure MNA.2). While fiscal positions in these
countries remain sustainable (0.6 percent of
GDP for developing oil exporters and 12 percent
for the GCC economies), should oil prices
decline sharply, governments could be forced to
cut into spending in a pro-cyclical manner.
Several of the net oil-importing developing
countries―Egypt, Tunisia, Jordan and Morocco
―saw declines in industrial output or GDP
during the first quarter of 2011, which impaired
business and household sentiment after a period
of greater ebullience. These led to a near-
collapse in investment and sharp falloff in
consumer and government spending. GDP
contracted by more than 6 percent in the first
quarter of 2011 (q/q) (25.8 percent annualized
pace in Egypt and 24.2 percent in Tunisia) due in
large measure to dislocations and disturbances of
the initial weeks of protests. As the situation on
the ground began to stabilize, GDP snapped
back, placing Egypt‘s decline for the first three
quarters of 2011 at a much more moderate 1.2
percent (saar), with similar outturns for Tunisia.
GDP declines were less dramatic for countries
not experiencing large protest movements. In
Jordan for example, GDP dropped by 1.3 percent
(q/q) in the first quarter and 0.7 percent in the
second (or 5.2 and 2.7 at an annual rate).
Morocco‘s GDP advanced at a strong 4.2 percent
clip during the second quarter (saar). And
through Lebanon does not publish quarterly
GDP, coincident indicators dropped 12 percent
between late 2010 and August 2011.
Data on industrial production suggest that
Tunisia and Egypt have taken a very hard hit
from residual domestic unrest, uncertainties over
political outcomes and the onset of financial
turmoil in Europe. In Jordan, after an initial post
-crisis spurt, production dropped from a 44
percent annual gain in the three-months ending
June to decline of 5 percent in the third quarter.
In Egypt production snapped back sharply to 180
percent annualized during the second quarter,
only to fall to a 40 percent decline in the
following quarter. And in Tunisia, developments
have been similar, though much less volatile,
with production standing some 6 percent higher
during the third quarter vis-à-vis the second
(figure MNA.1 earlier).
Unemployment in Egypt jumped from 8.9
percent in December 2010 to 11.8 percent by
June 2011. Economic turbulence has taken a toll
on confidence within and outside of the region,
in particular increasing the already high risk
aversion of international investors. Indeed,
spreads on regional sovereign debt stand higher
than those of any other developing region at the
moment.
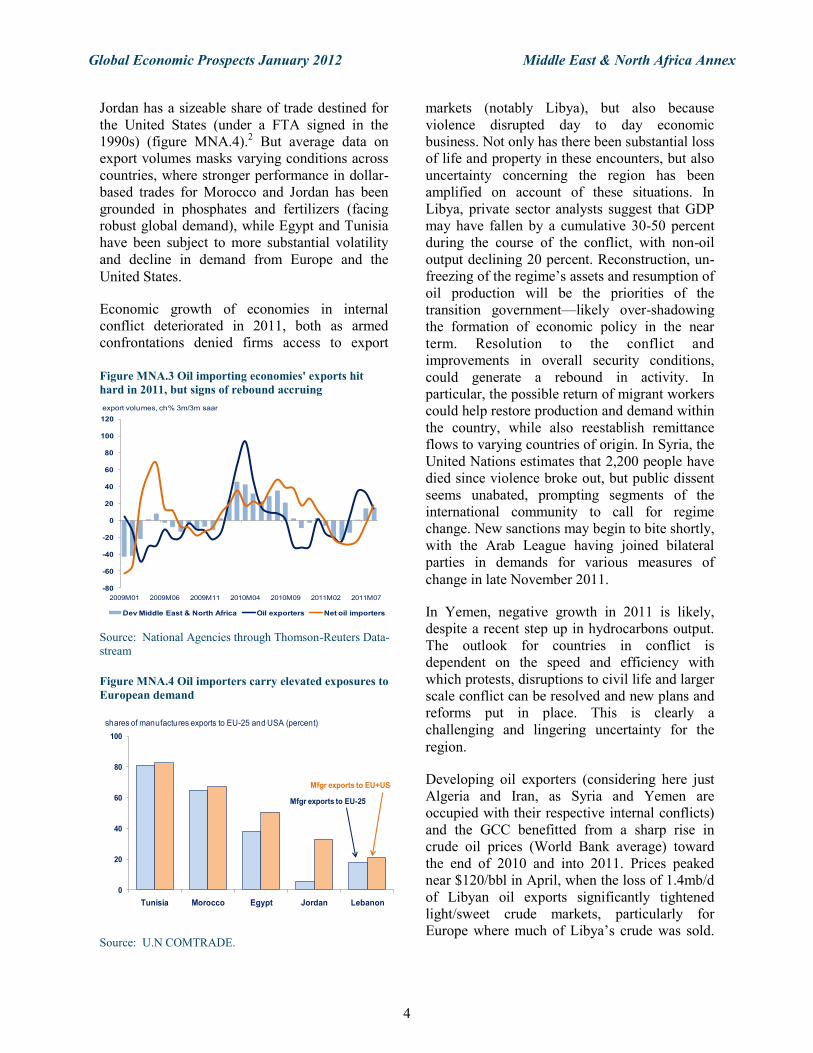
Merchandise export volume growth was weak all
year (particularly for the oil-importing countries
of the region), reflecting the influence of the
broader disruptions linked to the Arab Spring,
the less direct influence of the Tohoku
earthquake in Japan; and most recently the
financial turmoil in Europe and associated weak
import demand. Still, recent export performance
shows improvement, on the grounds of stronger
oil exports, up 14 percent as of August (saar) as
well as a fillip for net oil importers, pushing
goods exports to a 17 percent annual pace in the
same month, led by strong gains in phosphates
from Morocco and Jordan (figure MNA.3).
The net oil importers are particularly vulnerable
to changes in European import demand. Tunisia
ships fully 80 percent of its manufactured goods
exports to the EU-25, Morocco more than 65
percent and Egypt almost 40 percent. In contrast
Figure MNA.2 Oil exporters enjoy windfall $785 billion
in 2011 revenues
Source: U.N COMTRADE, IEA, OPEC.
0
100
200
300
400
500
600
700
800
2006 2007 2008 2009 2010 2011
GCC
Developing exporters
3
Global Economic Prospects January 2012 Middle East & North Africa Annex
Jordan has a sizeable share of trade destined for
the United States (under a FTA signed in the
1990s) (figure MNA.4).2 But average data on
export volumes masks varying conditions across
countries, where stronger performance in dollar-
based trades for Morocco and Jordan has been
grounded in phosphates and fertilizers (facing
robust global demand), while Egypt and Tunisia
have been subject to more substantial volatility
and decline in demand from Europe and the
United States.
Economic growth of economies in internal
conflict deteriorated in 2011, both as armed
confrontations denied firms access to export
markets (notably Libya), but also because
violence disrupted day to day economic
business. Not only has there been substantial loss
of life and property in these encounters, but also
uncertainty concerning the region has been
amplified on account of these situations. In
Libya, private sector analysts suggest that GDP
may have fallen by a cumulative 30-50 percent
during the course of the conflict, with non-oil
output declining 20 percent. Reconstruction, un-
freezing of the regime‘s assets and resumption of
oil production will be the priorities of the
transition government—likely over-shadowing
the formation of economic policy in the near
term. Resolution to the conflict and
improvements in overall security conditions,
could generate a rebound in activity. In
particular, the possible return of migrant workers
could help restore production and demand within
the country, while also reestablish remittance
flows to varying countries of origin. In Syria, the
United Nations estimates that 2,200 people have
died since violence broke out, but public dissent
seems unabated, prompting segments of the
international community to call for regime
change. New sanctions may begin to bite shortly,
with the Arab League having joined bilateral
parties in demands for various measures of
change in late November 2011.
In Yemen, negative growth in 2011 is likely,
despite a recent step up in hydrocarbons output.
The outlook for countries in conflict is
dependent on the speed and efficiency with
which protests, disruptions to civil life and larger
scale conflict can be resolved and new plans and
reforms put in place. This is clearly a
challenging and lingering uncertainty for the
region.
Developing oil exporters (considering here just
Algeria and Iran, as Syria and Yemen are
occupied with their respective internal conflicts)
and the GCC benefitted from a sharp rise in
crude oil prices (World Bank average) toward
the end of 2010 and into 2011. Prices peaked
near $120/bbl in April, when the loss of 1.4mb/d
of Libyan oil exports significantly tightened
light/sweet crude markets, particularly for
Europe where much of Libya‘s crude was sold.
Figure MNA.4 Oil importers carry elevated exposures to
European demand
Source: U.N COMTRADE.
0
20
40
60
80
100
Tunisia Morocco Egypt Jordan Lebanon
Mfgr exports to EU-25
Mfgr exports to EU+US
shares of manufactures exports to EU-25 and USA (percent)
Figure MNA.3 Oil importing economies' exports hit
hard in 2011, but signs of rebound accruing
Source: National Agencies through Thomson-Reuters Data-
stream
-80
-60
-40
-20
0
20
40
60
80
100
120
2009M01 2009M06 2009M11 2010M04 2010M09 2011M02 2011M07
Dev Middle East & North Africa Oil exporters Net oil importers
export volumes, ch% 3m/3m saar
4

Global Economic Prospects January 2012 Middle East & North Africa Annex
Subsequently prices eased, mainly because of
slowing global growth (global oil consumption
increased only 1/mbd in 2011), but also
reflecting a drawdown on International Energy
Association strategic reserves and rising
production outside of OPEC.
GDP in Algeria is estimated to have increased by
3 percent in 2011, on high oil prices and strong
advances in the non-oil sector. Oil and gas
revenues jumped 25 percent, reaching $44
billion (or 26 percent of GDP), part of which the
government used to raise public-sector wages,
support employment and housing, and to
mitigate the pressure on living standards from
escalating food and fuel prices. The increased
expenditures amounted to some 0.6 percent of
GDP in 2011, and with a fiscal deficit of 1.1
percent of GDP are unlikely to be sustainable
unless the price of oil remains at today‘s high
levels.
In Iran, despite the introduction of international
sanctions, rising oil prices and a good crop
helped to support growth of about 2.5 percent in
calendar year 2011. A revision to the system of
subsidies and cash transfers to better balance
reimbursements and fiscal accounts has been
looked upon favorably by outside analysts. But
severe difficulties in the non-oil sector
(manufacturing and services) persist.
As is the case with the oil-importing economies,
the developing oil exporters (Iran excluded) have
strong export links with the European Union,
notably Syria, with 80 percent of fuels shipments
destined for the EU-25, and Algeria, where
substantial movements of natural gas and oil
through pipeline and ships comprise 48 percent
of hydrocarbons shipments; the United States
absorbs another 30 percent of the country‘s
output (figure MNA.5).
Figure MNA.6 highlights the sources of the 2010
and 2011 increase in revenues for oil exporters
in the larger geographic region (including the
GCC countries): in 2010 production increased
moderately and the global oil price rose by $18/
bbl; and in 2011, regional production increased
by about 28kbl/d, together with a $24/bbl rise in
price. Still, fiscal vulnerability has increased as a
consequence of the substantial buildup in
spending packages implemented in the last three
years. In particular, the fiscal break-even oil
price—price levels that ensure that fiscal
accounts are in balance at a given level of
spending—have been trending up for most
countries, and are gradually approaching the spot
market price.
Tourism, migrant remittances and capital flows
are important sources of income and foreign
currency in the region, particularly for the net oil
importers. In Egypt for example, during 2010
(before the ―Arab Spring‖), tourism revenues
amounted to about $12.2 billion or 5.6 percent of
Figure MNA.6 Oil output gains and higher prices lead
to 2011 windfall
Source: International Emergy Agency, World Bank.
50
60
70
80
90
100
110
0
4
8
12
16
20
24
2007 2008 2009 2010 2011
Production DEV-X [L] Production GCC [L] Oil price [R]
output mbbl/d oil price, $/bbl
Figure MNA.5 Dev oil exporters reliant on Europe and
USA
Source: U.N COMTRADE.
0
20
40
60
80
100
Syria Algeria Iran
shares of fuels exports to EU-25 and USA (percent)
Fuels exports to EU+US
Fuels exports to EU-25
5

Global Economic Prospects January 2012 Middle East & North Africa Annex
GDP; for Tunisia and Jordan the figures were
$2.6 billion (5.7 percent of GDP) and $4 billion
(14.8 percent), respectively.
The decline in tourism arrivals to the region has
been unprecedented, according to estimates from
the United Nation‘s World Tourism
Organization (UNWTO). Syria was hardest hit
(figure MNA.7), with the number of visitors
dropping by 80 percent in 2011, followed by
Jordan (57 percent), Tunisia (55 percent) and
Egypt (30 percent).3 UNWTO estimates that
arrivals to Morocco increased as visitors chose it
over some of its less stable neighbors. Once
more, the underlying cause of the falloff in
tourism is deep uncertainty about the set of
domestic conditions across the region.
In contrast, migrant remittances held up
relatively well in 2011, increasing by some 2.6
percent. While weaker conditions in European
labor markets would have been expected to
reduce income transfers to home countries
notably in the Maghreb) data suggest that the
dollar value of these flows increased by $500
million for Morocco, a like amount in Egypt, and
$100 million in Lebanon. Jordan and Tunisia
suffered only moderate declines. The increase in
flows likely reflects a conscious effort by
expatriates to increase support during the
political difficulties faced by these countries. At
the same time oil revenues have powered the
GCC economies to robust GDP gains in 2011,
helping to underpin activity, employment and
remittance outflows (figure MNA.8).
Table MNA.2 Foreign Direct Investment flows, 2007 through 2011(e)
Source: UNCTAD, International Investment database (update November 2011).
2007 2008 2009 2010e 2011f FDI Inflows $bn Egypt 11.57 9.50 6.71 6.38 2.22 Lebanon 3.37 4.33 4.80 4.98 3.96 Tunisia 1.62 2.78 1.69 1.51 1.12 Morocco 2.80 2.48 1.95 1.30 1.09 Jordan 2.62 2.83 2.43 1.70 1.16 Total 22.00 21.90 17.59 15.86 9.56 ch% -2.1 -0.4 -19.7 -9.8 -39.7 FDI outflows $bn Saudi Arabia -0.1 3.49 2.18 3.91 4.10 Kuwait 9.78 9.09 8.64 2.07 1.00 UAE 14.58 15.82 2.72 2.01 1.81 Qatar 5.16 6.03 11.58 1.86 1.49 Bahrain 1.69 1.62 -1.79 0.33 -0.1 Total 31.12 36.54 23.40 10.51 8.64 ch% 52.3 17.4 -36.0 -55.1 -17.8
Figure MNA.7 The falloff in tourism--key factor in
lower growth
Source: U.N. World Tourism Organization; World Bank
estimates.
20
40
60
80
100
120
140
160
180
2007 2008 2009 2010 2011
Morocco Tunisia Egypt
Jordan Syria 2007=100
Tourist arrivals, index 2007=100
Figure MNA.8 Remittances have held up better than
expected
Source: World Bank.
0
5,000
10,000
15,000
20,000
25,000
2007 2008 2009 2010 e 2011 f
Egypt Morocco Jordan Lebanon Tunisia
Worker remittances, USD, millions
6

Global Economic Prospects January 2012 Middle East & North Africa Annex
External capital flows to developing countries in
the region declined sharply during the course of
the year, with FDI (mainly from the GCC) down
nearly 40 percent, while equity and bond flows
are estimated to have dropped in the third and
fourth quarters to levels only half as high as in
2010. However, official aid from the GCC and
others is restoring a good portion of (and in
some cases more than 100 percent of) lost
liquidity to several economies in the region –
and helping some of the transitioning economies
to meet fiscal shortfalls (box MNA.1).
Capital flows, aside from foreign direct
investment, have traditionally been small in the
developing Middle East and North Africa region,
though equity inflows into Egypt, Lebanon and
Morocco, and bond issuance by Tunisia and
Lebanon had built some momentum before the
global financial crisis of 2009. Accompanying
the notable decline in FDI during 2010 and
2011, net portfolio equity investment dropped
effectively to nil in 2010 and $500 million
during 2011 (table MNA.3). However, net
private debt flows rose from $2.3 billion in 2010
to $4.8 billion in 2011 due to increased bank
borrowing.
Moreover, bond spreads for Tunisia, Lebanon
and Egypt have widened, and banking sector
balance sheets in some countries are expected to
deteriorate. It is likely that under baseline
conditions, the transitioning economies will
require extensive external financing in 2012,
which the International Monetary Fund places at
some $50 billion.4
Inflation eases on international developments
and government intervention A stabilization, and
subsequent modest decline in world food prices
contributed to ease inflationary pressures in the
region over the course of 2011. Regional food
Box MNA.1 FDI links and aid flows: developing MENA and the GCC
This year‘s fall off in FDI extends a medium-term trend that began in 2009. Flows to developing Middle East and
North African (MENA) economies dropped by 40 percent in 2011, on the heels of a cumulative 25 percent decline
over 2009 and 2010—notably for Egypt (65 percent in 2011) and Jordan (30 percent). On the ―investor side‖, from
GCC members UAE, Qatar and Kuwait investment abroad has fallen sharply, by 18 percent during 2011, on the
heels of a 70 percent retrenchment over 2009-10. Part of this earlier decline is related to the restructuring of bal-
ance sheets in the wake of the financial crisis in Dubai (table MNA.2).
A downward trend is in force for both inflows and outflows –increasing amounts of which had been directed at the
developing MENA region from the GCC. This development will take some time to turn around, as though GCC
economies are enjoying strong oil windfalls and boosting non-oil growth through government outlays, recovery in
FDI will require a rebuilding of confidence in FDI destination countries, so that for the near-term, investment out-
lays in the region may be difficult to restart.
A counterpoint to this trend is recent GCC actions in Morocco. Despite the uncertain domestic and external envi-
ronments facing countries in the region, Morocco (the economy is experiencing solid growth of late), has been the
beneficiary of several GCC investment proposals related to development projects (Qatar and Kuwait), and notably
in new tourism facilities (UAE and others at $2.5 billion).
Following several years of reduced aid flows during the early 2000s, 2011 saw a surge in donor flows from Arab
nations. Saudi Arabia and other GCC members stepped up aid to the developing countries of MENA in an effort to
ensure that transitioning and other economies in the region are able to respond to demands for change.
Overall, aid from Saudi Arabia and the GCC for developing MENA is expected to reach $15 billion for 2012-
2015, with the bulk to be furnished by Saudi Arabia. The aid should enable Egypt, Jordan, and to a lesser degree,
Morocco, to shore up balance sheets and increase subsidies to ameliorate food price and other pressures on the
population. Jordan is likely to benefit the most, having already been recipient of a $400 million cash grant from
Saudi Arabia; and another $1 billion came through on July 28, 2011.
The GCC has also established a new Development Program to support Bahrain and Oman, the two GCC countries
which experienced protests and popular calls for reform. The program should provide $10 billion in investment
funding over ten years, focused on housing and infrastructure, and akin in function to earlier EU Cohesion Funds.
7

Global Economic Prospects January 2012 Middle East & North Africa Annex
prices were rising at a 20 percent annualized
pace in the first quarter – pushed by rising
international food prices. However, as global
prices stabilized and even declined, the pace of
regional food inflation eased to an 8 percent
annualized pace as of July (latest data available).
Inflation is a particular worry for developing oil
exporting countries, where for Algeria and Iran it
exceeds 10 percent (at seasonally adjusted
annualized rates, or ―saar‖).5 In net oil importing
countries a combination of very weak growth
and food and fuel subsidies have attenuated
inflationary pressures, although at large
budgetary cost in most cases (figure MNA.9).
Inflation has fallen in Egypt from a peak of 20
percent in October 2010 to 4.6 percent as of
October 2011, and in Jordan from 11.3 percent
during the final quarter of 2010 to 2 percent by
October. Iran has made important efforts to
reform its income support system away from
subsidies and toward better targeted social safety
nets, and this has brought down the pace of price
Figure MNA.9 Subsidies work to reduce inflation for oil
importers
Source: World Bank.
-5
0
5
10
15
20
Jan-09 May-09 Sep-09 Jan-10 May-10 Sep-10 Jan-11 May-11 Sep-11
Egypt Jordan Tunisia
Headline CPI, ch%, 3m/3m saar
Figure MNA.10 Iran's reform program dominates oil-
exporter CPI landscape
Source: World Bank.
-5
0
5
10
15
20
25
30
35
Jan-09 May-09 Sep-09 Jan-10 May-10 Sep-10 Jan-11 May-11 Sep-11
GCC Algeria Iran
Headline CPI, ch%, 3m/3m saar
Table MNA.3 Net capital flows to Middle East and North Africa
Source: World Bank.
Net capital flows to MENA
$ billions
2004 2005 2006 2007 2008 2009 2010 2011e 2012f 2013f
Current account balance 0.1 19.9 30.6 24.3 19.2 -20.8 -9.6 39.8 27.8 13.6
as % of GDP 0.0 3.6 4.8 3.2 2.1 -2.3 -0.9 3.4 2.2 1.0
Financial flows:
Net private and official inflows 12.9 19.4 14.5 28.5 19.7 28.3 25.4 24.6
Net private inflows (equity+private debt) 16.4 22.5 25.7 27.4 21.5 25.9 24.2 23.3 15.1 22.2
..Net private inflows (% GDP) 3.4 4.1 4.0 3.6 2.3 2.8 2.4 2.0 1.2 1.6
Net equity inflows 10.4 19.2 28.2 25.5 29.6 27.3 22.7 19.0 13.9 19.9
..Net FDI inflows 9.7 16.8 27.2 27.6 29.2 26.1 22.7 19.0 13.9 19.9
..Net portfolio equity inflows 0.7 2.4 1.0 -2.1 0.4 1.2 0.0 0.5 0.6 1.0
Net debt flows -8.1 0.8 -16.8 79.2 59.0 51.5 70.5
..Official creditors -3.4 -3.2 -11.3 1.1 -1.8 2.4 1.2 1.3
....World Bank -0.6 0.0 -0.8 1.0 -0.3 0.9 0.8 0.5
....IMF -0.5 -0.7 -0.2 -0.1 -0.1 -0.1 0.0 0.0
....Other official -2.3 -2.4 -10.3 0.2 -1.4 1.6 0.4 0.8
..Private creditors 6.0 3.4 -2.5 1.9 -8.2 -1.4 1.5 4.3 1.2 2.3
....Net M-L term debt flows 2.7 3.1 -1.7 -1.6 -4.0 -3.0 0.4 2.3
......Bonds 2.8 2.5 0.8 0.7 -0.8 0.1 3.2 1.8
......Banks 0.0 1.3 -1.3 -1.3 -1.8 -2.1 -1.9 0.5
......Other private 0.0 -0.8 -1.2 -1.1 -1.3 -0.9 -0.8 0.0
....Net short-term debt flows 3.2 0.3 -0.8 3.5 -4.2 1.6 1.1 2.0
Balancing item /a 1.7 -0.3 -7.2 -4.8 4.5 16.7 8.3 -65.8
Change in reserves (- = increase) -14.7 -38.9 -37.8 -48.0 -43.4 -24.2 -24.1 1.4
Memorandum items
Migrant remittances /b 23.2 25.1 26.5 32.1 36.0 33.6 34.7 35.6 37.4 39.4Source: The World Bank
Note :
e = estimate, f = forecast
/a Combination of errors and omissions and transfers to and capital outflows from developing countries.
/b Migrant remittances are defined as the sum of workers‘ remittances, compensation of employees, and migrant transfers
8

Global Economic Prospects January 2012 Middle East & North Africa Annex
changes into a range of 15-20 percent. Further
pursuance of these reforms will need to be made
to bring Iran‘s inflation solidly into single digits
(figure MNA.10).
Policy developments
Fiscal policy has been strongly expansionary in
much of the region; for example, fiscal deficits
of the net oil importers rose to 7.3 percent of
GDP in 2011 from 6.2 percent in 2010 and 4.4
percent in 2007, before the financial crisis
(figure MNA.11 and table MNA.4). In several
countries with declining fiscal space, including
Jordan and Morocco, expansion of social
programs in response to popular demand has
occurred at the expense of public investment
programs. A sharp decline in revenues among
the oil importing countries is mainly cyclical in
nature, but the increase in social spending and
transfers has a large permanent (structural)
component and will be difficult to maintain. And
the fiscal deficit of countries in conflict
ballooned in 2011 to 6.5 percent of GDP,
exacerbated by the need to procure supplies,
weapons and etc., for armed forces involved in
the conflicts.
There is a clear medium term shift in monetary
policy toward loosening, as evidenced by
reductions in policy rates across all groups for
which data exist. The more impressive
compression of interest rates has occurred
among the oil importers (150 basis points (bps)
between 2007 and 2011), with larger countries
averaging closer to 200 bps. GCC rates are
exceptionally low, but have also registered a
reduction of some 165 bps. Lower inflation
(regardless how measured), weaker growth and a
Figure MNA.11 Fiscal costs are substantial
Source: World Bank.
-8
-7
-6
-5
-4
-3
-2
-1
0
1
2
Net oil importers Conflict countries Other DEV Oil excl conflict countries
2009 2010 2011 2012 2013
fiscal balance as a share of GDP, %
Table MNA.4 Economic outturns and policy developments 2011
Source: World Bank.
Fiscal balance
%GDP
Reserves in
months of
imports
Policy interest
rate (basis
points)
Headline CPI,
ch% 3m/3m
saar
CAB %GDP
2007 2011 2007 2011 /* 2007 2011 /* 2007 2011 /* 2007 2011
Net oil importers -4.4 -7.3 8.3 8.4 7.50 6.00 12.5 2.5 -5.2 -5.6
Egypt -7.8 -9.5 10.0 5.5 10.28 8.25 18.3 4.8 0.5 1.8
Tunisia -0.7 -5.1 4.6 4.7 5.25 3.50 4.9 5.1 -3.8 -5.8
Jordan -4.1 -5.7 5.3 7.0 6.70 4.50 13.9 4.1 -9.3 -8.5
Morocco 0.2 -5.5 8.8 6.0 3.32 3.25 3.8 -3.0 -0.1 -6.7
Lebanon -9.6 -5.5 12.7 18.6 12.00 10.00 3.4 -1.8 -9.1 -20.6
Conflict -0.3 -6.5 10.6 5.2 …. …. …. …. -2.0 1.5
Syria 2.7 -7.1 9.6 7.3 ….. ….. ….. ….. 0.1 -2.2
Yemen -3.2 -8.0 11.5 3.1 ….. ….. ….. ….. -4.1 9.6
DEVOil-X 4.5 0.9 23.1 25.2 …. …. 15.9 15.8 14.3 8.5
Algeria 9.1 -1.1 35.0 37.9 ….. ….. 4.4 14.5 20.2 10.8
Iran 0.0 2.8 11.2 12.5 ….. ….. 25.6 17.0 8.5 8.9
GCC 19.3 8.5 12.0 10.0 3.00 1.35 10.0 6.8 26.2 24.4
Saudi Arabia 35.4 11.7 31.9 27.3 5.07 2.00 9.9 7.6 27.8 20.6
Kuwait 19.9 17.2 5.3 7.0 1.00 0.75 10.6 4.2 40.5 33.5
Bahrain 4.9 -2.4 4.1 3.5 2.19 0.50 3.5 6.0 10.2 5.9
Oman 17.2 7.6 6.4 5.7 3.70 2.00 12.5 6.2 8.3 11.0
9
Global Economic Prospects January 2012 Middle East & North Africa Annex
foreseen need to loosen financial conditions with
tougher economic times on the horizon has
yielded an acceleration in policy interest rate
cuts within the region. A notable exception, once
more, is Egypt, which on November 30, 2011
raised its benchmark policy rate by a full 100
basis points to 9.25 percent, the first tightening
move for the country since 2008, to ease
pressure on the pound amid tense political
conditions.
In aggregate, developing countries of the region
saw an increase in current account surplus
positions from $27 billion in 2010 to $41 billion
in 2011, due in the main to higher revenues for
oil exporters. This enabled a modest build up of
reserves of some $2.4 billion (Iran not included
in this tally). In contrast, the oil importers saw
their reserves fall by 17 percent ($13 billion) to
$67 billion, though at 6.4 months of imports and
200 percent of short-term capital and maturing
debt, they remain ample at present. The notable
exception is Egypt, where capital outflow and
pressure on the exchange rate compelled
authorities to draw some $11 billion of the $13
total in reserves for the oil-importing group to
support the pound. This represents 4.5 percent of
Egypt‘s GDP leaving reserves representing just
4.8 months of imports.
On balance, with the already difficult conditions
being experienced by many countries in the
region because of recent uprisings, a global
downturn will be felt more severely now than in
2008-09, when economic growth in the region
was relatively robust.
Medium-term outlook
Even if the external environment for growth
were not as sobering as it is, the ongoing
political tensions in the region would likely have
constrained outturns over the next few years.
Though the negative economic effects of the
acute phase of transition may have begun to pass
for Egypt, Tunisia, and Libya, they may continue
to weigh on growth in Syria and Yemen. In the
projections outlined below, intra-country
conflicts are assumed to stabilize in one form or
another during the course of 2012, so that the
impact of this year‘s disruptions on economic
activity begins to wane by 2013. Reduced
political instability could be accompanied by an
improved business climate, higher investment
and stronger FDI flows– all contributing to
improved economic conditions.
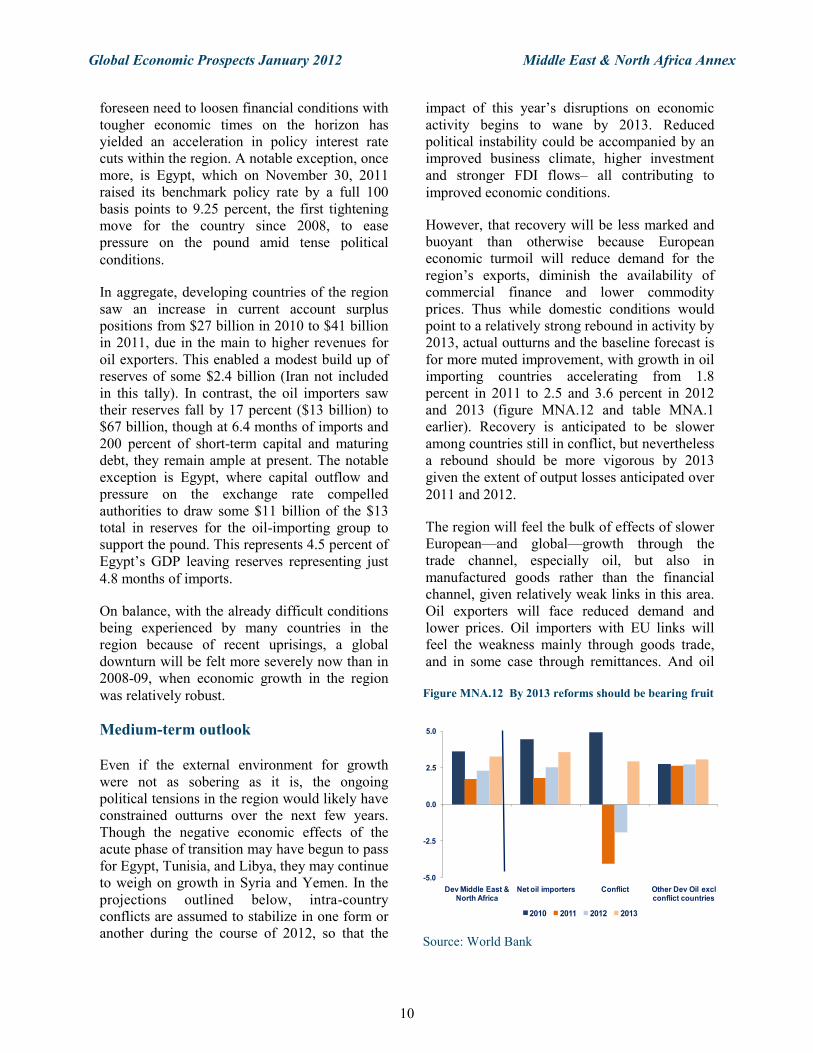
However, that recovery will be less marked and
buoyant than otherwise because European
economic turmoil will reduce demand for the
region‘s exports, diminish the availability of
commercial finance and lower commodity
prices. Thus while domestic conditions would
point to a relatively strong rebound in activity by
2013, actual outturns and the baseline forecast is
for more muted improvement, with growth in oil
importing countries accelerating from 1.8
percent in 2011 to 2.5 and 3.6 percent in 2012
and 2013 (figure MNA.12 and table MNA.1
earlier). Recovery is anticipated to be slower
among countries still in conflict, but nevertheless
a rebound should be more vigorous by 2013
given the extent of output losses anticipated over
2011 and 2012.
The region will feel the bulk of effects of slower
European—and global—growth through the
trade channel, especially oil, but also in
manufactured goods rather than the financial
channel, given relatively weak links in this area.
Oil exporters will face reduced demand and
lower prices. Oil importers with EU links will
feel the weakness mainly through goods trade,
and in some case through remittances. And oil
Figure MNA.12 By 2013 reforms should be bearing fruit
Source: World Bank
-5.0
-2.5
0.0
2.5
5.0
Dev Middle East & North Africa
Net oil importers Conflict Other Dev Oil excl conflict countries
2010 2011 2012 2013
10

Global Economic Prospects January 2012 Middle East & North Africa Annex
importers with GCC links (Jordan, Lebanon)
will be more shielded, but will still feel indirect
effects from lower activity in the GCC.
Prospects for a return to the growth rates that
Egypt and Tunisia experienced in the previous
decade are slim over the period through 2013,
with weak European demand and necessary
fiscal consolidation (given weak external
financing conditions) expected to weigh on
growth. Nonetheless, GDP gains for these
countries are expected to improve from 0.3
percent in 2011 to 3.1 percent by 2013—still
well below potential and trend growth rates,
implying an output gap of close to 5 percent of
GDP in 2013. Morocco and Jordan have been
less affected by protest. Implementation of select
reforms in both countries, and the holding of
parliamentary elections (Morocco) have been
important elements in tying social fabric tighter.
Growth in Morocco is projected to slow to 4
percent in 2012 from a 4.3 percent gain in 2011,
reflecting weaker European demand; but gains
are expected to strengthen to 4.2 percent by 2013
as global recovery emerges. Jordan is anticipated
to follow a similar growth path, but at a slower
pace, with GDP expanding 1.7 percent in 2012,
and accelerating to 3 percent by 2013, restrained
to a degree by still lackluster exports to the
United States, offset by stronger conditions
among the GCC economies at that time (table
MNA.5).
For developing countries in conflict, here Syria
and Yemen, ongoing social and military
disruptions are expected to continue to weigh on
activity during 2012, but as conditions stabilize,
growth should pick up to a 2.9 percent pace by
2013. And for the remaining developing oil
exporters, Algeria and Iran, growth is projected
to pick-up modestly from 2.7 percent in 2011 to
3 percent by 2013. Slow growth reflects in part
moribund export market growth, weakening
revenues as oil prices ease and continued high
leakage in the form of imports as populations
continue to spend oil revenues in the form of
government transfers or subsidies. Offsetting
external drag, stronger developments in non-oil
sectors should help to underpin GDP gains―on
outlays of planned large-scale social and
infrastructure projects with lifespan extending 3
to 5 years.
Risks and vulnerabilities
Extreme uncertainties face the region, in having
to address both the continuing threats of protest
and slower movement on political economy
reforms, at the same time as facing a real crisis
in the Euro Area. Within the Middle East and
North Africa, an important risk is that armed
violence in countries– notably Syria and Yemen
– is not resolved in 2012. A differentiating factor
between Yemen and Syria at this juncture is the
existence of a ‗road map‘ for the former in the
form of the GCC-inspired Transition Agreement
of November 23, with which a large part of
society appears to be willing to work with. But,
should unsettled conditions extend for a longer
period despite bilateral and multilateral
diplomatic efforts to bring conflicts to closure,
uncertainty will continue to cloud the region,
likely restraining an anticipated rebound in
activity in 2013.
The Middle East and North Africa is highly
exposed to an exacerbation of the European
crisis, with strong and broad links through trade,
tourism arrivals, migrant remittances, and to a
lesser degree, finance.6 With the advent of the
―Arab Spring‖, policy decision making had
become exceptionally more difficult. And
policies may now have to shift once more to
fend off the adverse effects stemming from the
situation in Europe and potential alternate
courses toward eventual closure of the crisis
there—though room for maneuver is slim for oil-
importers (and some oil exporters) in the region.
As a major trading partner for Europe, exports
would be directly affected, while a serious crisis
in Europe would likely also be accompanied by a
significant tightening of global financial
conditions and importantly a drop in commodity
prices – potentially placing strains on countries
with large fiscal and current account deficits
(though the distinct mix of oil exporters and oil
and food importers in the region would yield
mixed results for terms of trade and fiscal
effects—positive for the transitioning
11

Global Economic Prospects January 2012 Middle East & North Africa Annex
economies, not favorable for the developing oil
exporters).
On the fiscal side, oil-importers within the
region might see fiscal shortfalls increase
substantially in the case of a significant
slowdown; while oil exporters would be affected
by both weaker demand but also lower revenues
due to lower prices. Assuming that financial
shortfalls can be met through international
capital markets GDP impacts could range
between -0.8 and -1.2 for oil importers and -0.2
and -0.6 percent for oil exporters. If financing is
not forthcoming, countries where current
accounts and government deficits are expected to
deteriorate most sharply could be forced to cut
more deeply into spending (additional fiscal
shortfalls could exceed 3 percent of GDP in
Egypt, Jordan and Tunisia).
And countries with high-levels of indebtedness
would be particularly vulnerable to a tightening
of international credit conditions. Lebanon could
be exposed to this channel because of relatively
high external financing needs (reflecting short-
and medium-term debt repayments and and/or
large current account deficits).
On balance, risks are to the downside for the
region, given the extensive exposures of so many
Table MNA.5 Middle East and North Africa forecast summary
Source: World Bank.
Est.
98-07a2008 2009 2010 2011 2012 2013
Algeria
GDP at market prices (2005 US$) b 3.5 2.4 2.4 1.8 3.0 2.7 2.9
Current account bal/GDP (%) 28.9 20.0 0.1 8.1 10.8 8.9 6.3
Egypt, Arab Rep.
GDP at market prices (2005 US$) c 4.3 7.5 4.9 5.1 1.8 3.8 0.7
Current account bal/GDP (%) 0.9 -0.9 -2.0 1.6 1.8 1.8 1.6
Iran, Islamic Rep.
GDP at market prices (2005 US$) b 4.9 2.3 3.5 3.2 2.5 2.7 3.1
Current account bal/GDP (%) 10.3 15.2 4.6 6.5 8.9 6.6 4.2
Iraq
GDP at market prices (2005 US$) b 9.5 4.2 0.8 9.6 12.6 10.2
Current account bal/GDP (%) 19.2 -13.8 -3.2 -1.5 -4.5 6.0
Jordan
GDP at market prices (2005 US$) b 5.6 7.6 5.5 2.3 2.5 1.7 3.0
Current account bal/GDP (%) -2.3 -9.0 -4.4 -4.8 -8.5 -6.9 -5.2
Lebanon
GDP at market prices (2005 US$) b 2.8 9.3 8.5 7.0 3.0 3.8 4.4
Current account bal/GDP (%) -17.5 -13.6 -19.7 -20.9 -20.6 -17.2 -14.6
Morocco
GDP at market prices (2005 US$) b 3.7 5.6 4.8 3.7 4.3 4.0 4.2
Current account bal/GDP (%) 1.4 -5.2 -5.4 -4.3 -6.7 -7.3 -6.7
Syrian Arab Republic
GDP at market prices (2005 US$) b 3.3 4.5 6.0 3.2 -3.0 -1.5 2.5
Current account bal/GDP (%) 3.0 0.1 -2.3 5.1 -2.2 -5.0 -7.0
Tunisia
GDP at market prices (2005 US$) b 4.5 4.6 3.1 3.0 -0.5 2.5 3.2
Current account bal/GDP (%) -2.8 -4.2 -2.7 -4.6 -5.8 -5.8 -6.0
Yemen, Rep.
GDP at market prices (2005 US$) b 3.5 3.6 3.8 8.0 -6.0 -2.6 3.6
Current account bal/GDP (%) 2.5 -4.6 -8.3 7.6 9.6 5.5 2.4
(annual percent change unless indicated otherwise)
World Bank forecasts are frequently updated based on new information and changing (global)
circumstances. Consequently, projections presented here may differ from those contained in
other Bank documents, even if basic assessments of countries’ prospects do not significantly
differ at any given moment in time.
Djibouti, Libya, West Bank and Gaza are not forecast owing to data limitations.
a. Growth rates over intervals are compound average; growth contributions, ratios and the
GDP deflator are averages.
b. GDP measured in constant 2005 U.S. dollars.
c. Egypt growth presented on Fiscal Year basis.
d. Forecast.
Forecast
12

Global Economic Prospects January 2012 Middle East & North Africa Annex
countries to Europe and a dependence on
commodity prices. Countries will need to take
decisive action to formulate a broad reform
agenda—aimed at fostering inclusive growth—
while maintaining economic stability, to build
confidence, anchor expectations and reap the
longer- term benefits of the historical
transformation.
Notes:
1 The low and middle income countries of the
region included in this report are Algeria, the
Arab Republic of Egypt, the Islamic
Republic of Iran, Jordan, Lebanon, Morocco,
the Syrian Arab Republic, Tunisia and
Yemen. Data is unfortunately insufficient for
the inclusion of Djibouti, Iraq, Libya and the
West Bank and Gaza. The high-income
economies included here are Bahrain,
Kuwait, Oman and Saudi Arabia. Data is
insufficient for the inclusion of Qatar and the
United Arab Emirates. The group of
developing oil exporters includes Algeria,
the Islamic Republic of Iran, the Syrian Arab
Republic and Yemen. The diversified
economies of the region (net oil importers—
with Egypt included in this group due to the
smaller share of hydrocarbons in its export
mix), can be usefully segmented into two
groups: those with strong links to the GCC
(Jordan and Lebanon), and those with tight
ties to the European Union (the Arab
Republic of Egypt, Morocco and Tunisia).
Further groups of interest are the Resource-
poor-labor abundant countries: Egypt,
Jordan, Lebanon, Morocco and Tunisia; and
Resource-rich labor abundant economies:
Algeria, Iran, the Syrian Arab Republic, and
the Republic of Yemen.
2 It should be noted, that in contrast with, for
example, the East Asia and Pacific region,
the share of exports in GDP for the oil
importing economies of the MENA region is
quite small, which would have the effect of
mitigating adverse impacts on growth
attendant with slower goods shipments to
Europe.
3 ―UNWTO Tourism Barometer‖. United
Nations World Tourism Organization.
November, 2011. Madrid.
4 Regional Economic Outlook. ―Middle East
and Central Asia‖. World Economic and
Financial Surveys. October, 2011.
Washington DC. The International Monetary
Fund.
5 Inflation rates are here expressed at
seasonally adjusted annualized rates or
―saar‖. That is, a ratio of rolling three-month
moving averages of consumer price indexes
is raised to the fourth power (so at ―quarterly
rates‖). This provides a clearer view of
current developments and potential turning
points for the data series contrasted with
―year over year‘ growth rates—especially
avoiding biases of exceptionally high or low
base period values. A warning that readers
may find the CPI figures as ―out of line‖
with the more-broadly used y/y measure.
6 In 2008 roughly half of oil importer‘s
merchandise exports were sent to EU
markets, contrasted with 65 percent in 1998.
And migrant remittances from expatriate
workers in Europe are much larger for
Morocco and Tunisia than for other MENA
countries—data for 2000 suggests that about
75 percent of Morocco and Tunisia‘s
immigrants settle in the EU, contrasted with
10 percent for Egypt.
13