growth and social development in africa in 2008 and ... · development in africa in 2008 and...
TRANSCRIPT
41
Africa’s growth remains
highly vulnerable to external shocks
2Growth and Social Development in Africa in 2008 and Prospects for 2009Economic performance in Africa slowed in 2008 and is projected to slow further
in 2009. Africa’s economic downturn is spurred by the financial turmoil that originated in the USA and affected most countries of the world. For the continent as a whole, despite this decline, fiscal and current account balances have improved and domestic savings and investment rates increased. However, with high average fuel and food prices in 2008, Africa’s average inflation rate rose significantly, threatening macroeconomic stability and food security in many countries.
The continent needs short-term measures to address the expected adverse conse-quences of the global financial crisis and food shortages, as well as long-term meas-ures to accelerate and sustain the growth needed to achieve meaningful economic and social development in the future. Also, economic performance in Africa, driven mainly by revenues from oil and mineral exports in resource-rich countries, conceals considerable variation across countries and remains insufficient for Africa to meet the MDGs. In particular, Africa has to strengthen efforts to promote gender equality and women empowerment as factors that are strongly correlated with other social development goals.
2.1 Growth performance
2.1.1 Africa’s growth slows down in 2008
Economic growth in Africa slowed to 5.1 per cent in 2008, down from 6.0 per cent in 2007.1 Despite the deceleration, growth remains strong in view of the global economic slowdown ignited by the global financial turmoil. The main fac-tors underpinning the continent’s growth in 2008 are high commodity demand and prices, continued sound macroeconomic management and commitment to economic reforms, increased domestic investment and productivity, recent debt write-offs, private capital flows, increasing non-fuel exports and consolidation of peace in various parts of the continent.
1 All the growth and inflation data are from UN-DESA (2008a), November, except for data for Swaziland and Seychelles, which come from the Economist Intelligence Unit (EIU, 2008).
42 Economic Report on Africa 2009 Developing African Agriculture Through Regional Value Chains
Commodity revenue a key
driver of growth in 2008
Improved governance and institutional environment, including long-term planning and monitoring and evaluation, have also boosted opportunities for private sector development and growth in many countries such as Botswana, Nigeria, Rwanda and Tanzania. However, aid and other capital inflows are likely to decline as a result of the severe world financial crisis and recession in major donor/development partner countries.
Commodity revenue, especially from oil, was the key driver of economic growth in Africa in 2008. Oil-exporting African countries contributed 53.3 per cent and 61.4 per cent to the continent’s total GDP and GDP growth rate in 2008, respectively. Despite the recent global slowdown, oil-exporting African economies sustained a relatively high growth rate (5.9 per cent) in 2008, thanks mainly to high oil prices (figure 2.1). Although oil and other commodity prices are expected to fall in the aftermath of the financial crisis and reduced global demand, they are likely to remain high by historical standards.
The lower average growth rate in Africa in 2008 is mainly the result of a notable slowdown in GDP growth in oil-importing countries, from 5 per cent in 2007 to 4.4 per cent in 2008. This downturn emanated mainly from the increased energy and food costs that resulted in larger import bills, but also from the effect of the financial crisis in the form of lower export demand and revenue.
Growth analysis confirms that African economies are more susceptible to fluctua-tions in commodity prices than the direct effects of fluctuations in global financial markets (IMF 2008). The direct and second-round effects of the financial crunch and recession in industrial countries on Africa are likely to intensify in 2009 (see chapter 2). In terms of volume, African exports of goods and services grew at 13 per annum between 2006 and 2008 compared to a 6.6 per cent growth in imports over the same period. In terms of value, the respective growth rates were 8.1 per cent and 4.2 per cent. This partly explains the low rate of growth in the continent’s terms of trade of 1.4 per cent annually in 2006-2008.

43Growth and Social Development in Africa in 2008 and Prospects for 2009
Growth rates drop further
below the level needed for
achieving the MDGs
Figure 2.1Growth in Africa, oil vs. non-oil economies, 2006-2008 (%)
0
1
2
3
4
5
6
7
8
AfricaNon-oil countriesOil-rich countries
200820072006
Source: UN-DESA, November, (2008a).
Overall, growth in Africa plunged further below the 7 per cent average rate required for achieving the MDGs. More important, the number of oil-importing African countries achieving a growth rate of 7 per cent or more has consistently declined over the last 3 years. Also, gains in the continent’s per capita income are modest. Accordingly, it is not surprising that recent estimates show that the poverty rate in sub-Saharan African (SSA) countries in 2005 was the same as the rate of 50 per cent in 1981. The number of poor people has actually doubled over the same period (Ravallion and Chen 2008).
As in the rest of the world, both oil-importing and oil-exporting African countries have experienced notable increases in inflation rates in 2008. Inflationary pressure complicates macroeconomic management and threatens recent achievements in the areas of growth and macroeconomic stability, particularly in oil-importing coun-tries. Consolidating improved macroeconomic management and mobilizing long-term, non-debt generating resources is essential for the continent to diversify exports and sustain high growth.
In addition to generally low savings and investment rates in many African countries, incentives for diversification have lessened as high commodity prices, more aid and stronger capital inflows strengthened exchange rates over the last few years (Com-mission on Growth and Development 2008). This trend is likely to be halted or reversed in most Africa countries as commodity prices decline in 2009.
44 Economic Report on Africa 2009 Developing African Agriculture Through Regional Value Chains
Africa needs more effective
strategies for greater integration with the
global economy
African governments must formulate growth-oriented long-term strategies under-pinned by prudent macroeconomic policies, including competitive exchange rates. These strategies should also foster public investment in education, technology and infrastructure and be based on effective industrial policies. The continent also needs strategies to “facilitate integration with the global economy; densification of people and activities; and policies that encourage self-discovery of products in which Africa can create comparative advantages” (ibid, p. 72).
High average energy and food prices in 2008 contributed to food shortages and the rising poverty rates in Africa, especially in the Horn of Africa, West Africa and in conflict countries in general. Africa imports a significant percentage of its food from other regions and poor households spend more than 50 per cent of their income on food. In addition to external support, oil-importing African countries need sound domestic policies to mitigate the economic and social impact of high energy and food prices (see chapter 3).
The international community has the obligation to increase emergency aid, espe-cially to conflict countries and drought-stricken areas. Domestic policies may include reduction of import tariffs and domestic taxes on food, as well as cash transfers. In the medium to long term, African countries have to invest more in agriculture and increase productivity through use of better seeds, more fertilizer, and better methods of cultivation and irrigation, among other policy tools (see part II).
Table 2.1Distribution of growth performance in Africa, 2006-2008 (53 countries)
GDP growth rate 2006 2007 2008
Oil Non-oil Oil Non-oil Oil Non-oil
Less than 3% 5 7 4 10 2 7
Between 3% and 5% 1 11 2 8 3 14
Greater than 5% and less than 7% 4 14 2 15 3 17
7% or more 3 8 5 7 4 2
Total 13 40 13 40 13 40
Source: UN-DESA, November (2008a).
2.1.2 Economic performance varied across subregions and countries
GDP growth decelerated in three of the five subregions of the continent in 2008 (table 2.2). West and Central Africa grew at 5.4 and 4.9 per cent in 2008, com-pared with 5.2 and 3.9 per cent in 2007, respectively. In 2008, GDP growth rates decreased in North Africa (to 5.4 per cent), East Africa (5.7 per cent) and Southern

45Growth and Social Development in Africa in 2008 and Prospects for 2009
East Africa continues to lead
in terms of growth performance
Africa (4.2 per cent). High commodity demand and prices are still among the key factors supporting growth in all African subregions.
Table 2.2Subregional growth performance, 2006-2008 ( per cent)
2006 2007 2008
East Africa 6.2 6.3 5.7
Southern Africa 6.1 6.2 4.2
North Africa 5.8 5.9 5.4
West Africa 4.6 5.2 5.4
Central Africa 1.8 3.9 4.9
Africa 5.7 6.0 5.1
Source: UN-DESA, November (2008a).
Despite the slowdown, East Africa maintained the highest growth on the continent over 2006-2008. Again, Ethiopia led the subregion with an 8.0 per cent real GDP growth rate in 2008, followed by DRC (7.2), Tanzania (6.8 per cent), Seychelles (6.2 per cent), Uganda (6.0 per cent), Rwanda (5.8 per cent), Madagascar (5.2 per cent), and Burundi and Djibouti (5.0 per cent each). Growth plummeted in Kenya from 6.1 per cent to 3.5 per cent, due largely to post-elections violence and a sharp fall in tourism. Growth remained weak in Eritrea (1.0 per cent) owing to poor rainfall, weak agricultural production and a poor business environment. Political instability disrupted tourism and FDI inflows as well as overall growth in the Comoros (0.5 per cent).
Growth factors in East Africa included expansion in agriculture, horticulture, and services, especially finance, telecommunications and construction. The subregion also benefited from healthy inflows of aid and strong growth in tourism and FDI. However, growth in some East African countries such as Uganda remains constrained by infrastructure bottlenecks, especially energy and transportation.
High oil revenues and tourism receipts continued to boost growth in North Africa. Egypt grew at 6.5 per cent, followed by Libya (6.2 per cent), the Sudan (6.0 per cent), Morocco (5.1 per cent) and Tunisia (4.8 per cent). Economic growth recov-ered markedly in Mauritania (from 1 per cent in 2007 to 4.2 per cent in 2008), but declined in Algeria (from 4.6 per cent to 3.3 per cent). Besides the strong rise in oil and mineral exports that boosted both public and private consumption in most North African countries, that subregion saw a rebound in agricultural output as well as a construction boom due to high demand for tourism and residential buildings. Growth slowed in Tunisia owing to food and oil costs and weaker EU demand for exports, and in the Sudan due to declining oil production.

46 Economic Report on Africa 2009 Developing African Agriculture Through Regional Value Chains
Non-commodity sectors are
expanding in many African
countries
In West Africa, GDP growth was strong in most countries, thanks to accelerated recovery in Liberia (8.0 per cent), increased oil production and prices and growth in non-oil sectors in Nigeria (6.1 per cent each), high FDI inflows and remittances in Cape Verde (5.8 per cent), and expansion in mining activity in Sierra Leone (5.8 per cent), Ghana (6.0 per cent) and Burkina Faso (4.3 per cent). Growth in construction and tourism together with high public spending underpinned high growth in the Gambia (5.8 per cent). Growth also remained high in Benin (4.7 per cent) with a recovery in re-export activity, cotton production and strong growth in construction.
Strong activity in the mining and service sectors, among other factors, has supported growth in Senegal (4.6 per cent), and the Niger (4.0 per cent), whereas growth in Mali (3.9 per cent) benefited from fast expansion in the non-mining sector. Eco-nomic performance was relatively weak in other countries of the subregion. Guinea-Bissau grew at 3.3 per cent thanks to a recovery in agricultural output and rising donor support, Togo at 2.9 per cent due to growth in cotton production and in manufacturing and services. Recovery in the oil sector and peace dividends under-pinned a 2.8 per cent growth in Cote d’Ivoire in 2008, while political upheavals condemned Guinea to a 2.0 per cent growth rate.
Economic performance in Central Africa accelerated from 3.9 per cent in 2007 to 4.9 per cent in 2008, thanks largely to increased public investment in infrastruc-ture in Equatorial Guinea (9.0 per cent), significant expansion in oil production and activity in the non-oil sector in Republic of Congo (7.8 per cent), and Gabon (3.9 per cent). Growth also remained high in Sao Tome and Principe (5.3 per cent) despite delays in the disbursement of some donor funds and the impact of high inflation and energy costs.
Growth improved in Central African Republic (to 4.4 per cent) with the resump-tion of donor support and the improved political situation, and in Cameroon (to 3.9 per cent) as a result of developments in infrastructure and exploitation of natural resources. Despite improvement, Chad (1.0 per cent) remains the least performing country in the subregion as a result of political conflict and the erratic flow and management of oil revenue.
Southern Africa’s economic performance slowed from 6.2 per cent in 2007 to 4.2 per cent in 2008 as most of the larger economies posted lower growth rates. Despite deceleration, Angola maintained the highest growth rate in the subregion in 2008 (12.9 per cent), followed by Malawi (6.6 per cent), Botswana (6.5 per cent), Mozam-bique (6.2 per cent), Zambia (5.9 per cent), Mauritius (5.4 per cent), Lesotho (5.0 per cent), and Namibia (3.5 per cent). GDP growth slowed sharply in South Africa (from 5.1 per cent in 2007 to 3.1 per cent in 2008), and remained low in Swaziland (2.0 per cent), while Zimbabwe’s economy continued to contract (-4.5 per cent).
47Growth and Social Development in Africa in 2008 and Prospects for 2009
Least performing African
economies suffered from
political instability and/or external
shocks
Key growth factors in this subregion in 2008 comprise high oil and mineral prices and exports, rising crop output and growth in commerce, communications and transport. The key factors constraining growth include delays in donor funding (Malawi), global slowdown in demand (Zambia), power shortages, high interest rate and weaker global economic activity (South Africa), difficulties in the export manu-facturing industries (Swaziland), and political instability (Zimbabwe).
2.1.3 Top and bottom performers in 2008
As in previous years, the top performers in Africa are mainly resource-rich, recovery or high-aid recipient economies, while the least performers suffered from political instability and/or external shocks (figure 2.2). Only 6 of the top performing econo-mies in 2007 are ranked in the 11 top performers of 2008. Among these, in addition to oil, only Egypt has a relatively diversified economy. This underscores the fragility of growth on the continent and the inability of most African countries to accelerate and sustain growth.
Five countries (Zimbabwe, the Comoros, Chad, Somalia and Eritrea) have remained on the list of least performing economies over the past 5 years. Eritrea suffered from weak agricultural production and a poor business environment. Political instability, among other factors, dampened growth in Chad, the Comoros, Guinea, Somalia, and Zimbabwe. Thus, improvement in the political situation is essential for these countries if they are to reverse the tide of low and declining economic performance. At the same time, diversification of sources of growth and exports is a must for both top performers and least performers, in order to accelerate and sustain growth and to achieve their social objectives.

48 Economic Report on Africa 2009 Developing African Agriculture Through Regional Value Chains
Figure 2.2Top and bottom performers in Africa in 2008 (% annual growth)
-6 -3 0 3 6 9 12 15
Angola
Equatorial Guinea
Liberia
Ethiopia
Congo, Republic
Congo, DR
Tanzania
Malawi
Egypt
Botswana
Somalia
Guinea
Chad
Eritrea
Comoros
Zimbabwe
Source: UN-DESA, November (2008a).
2.1.4 Widening fiscal imbalances in oil-importing countries
High energy and food prices pushed the proportion of oil-importing countries with deficits from 76 per cent in 2007 to 86 per cent in 2008 (table 2.3). On average, these countries recorded a fiscal deficit of – 0.5 per cent of GDP.2 At the same time, while the number of oil-exporting African countries with fiscal surplus remained unchanged, their combined surplus amounted to 7.7 per cent of GDP in 2008 compared with 5.0 per cent in 2007.
The overall budget surplus of Africa in 2008 mainly reflects the position of oil-exporting countries. All 9 surplus countries on the continent in the last five years are oil or mineral-rich countries. On the other hand, with the exception of Egypt and Ghana that have invested substantively in infrastructure and human development, 2 Fiscal balance includes grants.

49Growth and Social Development in Africa in 2008 and Prospects for 2009
Most African countries continue
to sustain sound fiscal policies
all the largest deficit countries have been subjected to strong external shocks and/or political unrest.
Table 2.3Distribution of fiscal deficits in Africa in 2008 (42 countries)
Oil countries
Non-oil countries
Mineral-rich
Non-mineral-rich
Sub-Saharan Countries
Countries with surpluses 8 4 2 2 10
Less than 5% 2 3 1 2 5
5% to 10% 0 1 1 0 1
More than 10% 6 0 0 0 4
Countries with deficits 5 25 8 17 26
Less than 5% 4 18 5 13 19
5% to 10% 1 5 2 3 5
More than 10% 0 2 1 1 2
Total number of countries
13 29 10 19 36
Source: UNECA calculations based on data from EIU, November 2008.
Note: Due to data limitations, only 42 countries are covered. The 11 excluded countries are Central African Repub-lic, Comoros, DRC, Djibouti, Guinea-Bissau, Liberia, Mali, Mauritania, Niger, Sierra Leone, and Somalia.
The fiscal deficits of oil-importing African countries seem to reflect a trend rather than a short-term phenomenon. Over 1998-2008, 93 per cent of these countries had budget deficits (table 2.4). However, for 79 per cent of these countries, the deficit has been less than 5 per cent of GDP, thanks to prudent fiscal management. Indeed, fiscal policy in many African countries has been effective in maintaining low budget deficits relative to GDP.
Fiscal prudence manifested itself in increased revenue from non-debt generating sources in line with the required increases in spending on infrastructure, espe-cially energy and roads, and social sectors. Sources of revenue increases include strong growth, rising exports, sale of public enterprises, widening of the tax base and improved tax collection. However, public spending has accelerated in 2008, with high energy and food prices leading to higher wages, and scaling up of public expenditure on infrastructure, energy subsidies and social security. The energy and food price effects came at a time when many countries were attempting to increase spending to strengthen institutional capacity, especially in relation to political and economic governance.
To maintain fiscal stability, many countries resorted to additional measures to curb public spending and finance their deficits. These included reduced expenditure on development projects as well as service delivery in some instances. Many SSA coun-tries relied on donor support, external non-debt generating or concessional borrow-ing as well as domestic borrowing to finance deficits. This highlights the need for

50 Economic Report on Africa 2009 Developing African Agriculture Through Regional Value Chains
Fiscal surplus increased in oil-rich African
economies in 2008
further debt relief as well as a scaling up of aid to these countries, in order to sustain the achievements they made in the last few years in terms of improved macroeco-nomic management and stability.
Table 2.4Distribution of fiscal deficits in Africa by resource group, 1998-2008 (average)
Oil countries
Non-oil countries
Mineral-richNon-
mineral-rich
Countries with surpluses 7 2 1 1
Less than 5% 1 1 0 1
5% to 10% 3 1 1 0
More than 10% 3 0 0 0
Countries with deficits 6 27 9 18
Less than 5% 5 23 7 16
5% to 10% 1 3 2 1
More than 10% 0 1 0 1
Total number of countries 13 29 10 19
Source: UNECA calculations based on data from EIU, November 2008.
Note: Due to data limitations, only 42 countries are covered. The 11 excluded countries are CAR, Comoros, DRC, Djibouti, Guinea-Bissau, Liberia, Mali, Mauritania, Niger, Sierra Leone, and Somalia.
2.1.5 Controlling inflation a concern for both oil-rich and non-oil economies
Inflation in Africa, excluding Zimbabwe, was 10.7 per cent in 2008, up from 6.4 per cent in 2007. Over 90 per cent of the 52 African countries with available data recorded a 5 per cent or more inflation rate in 2008, up from 60 per cent of them in 2007 (table 2.5). Only three countries (Central African Republic, Cote d’Ivoire, and the Comoros) had inflation rates of less than 5 per cent in 2008. Africa’s recent infla-tion has been mostly imported in the form of high energy and food prices associated with high global demand in the first half of 2008.
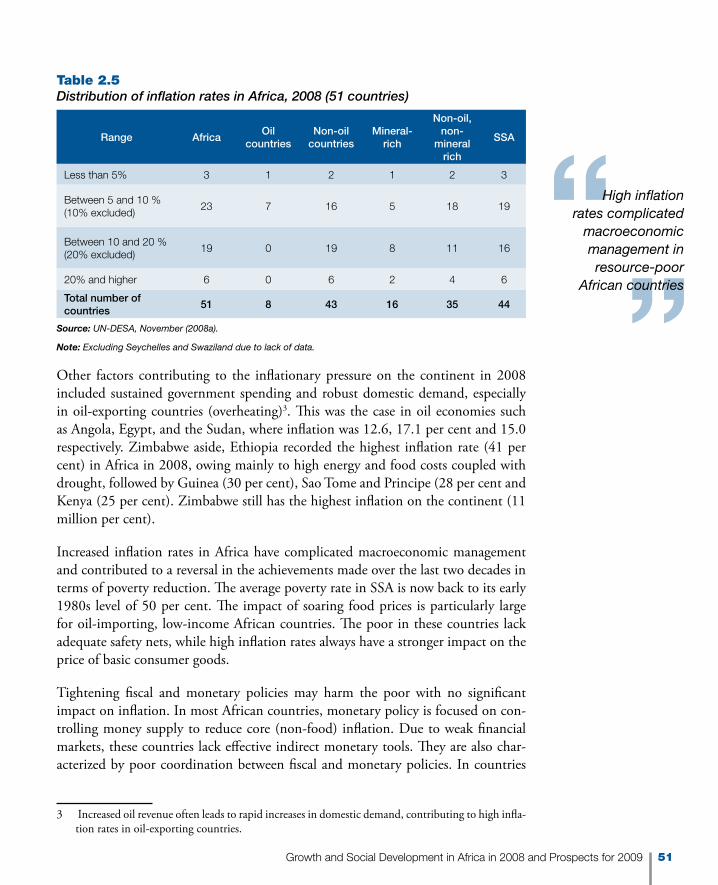
51Growth and Social Development in Africa in 2008 and Prospects for 2009
High inflation rates complicated
macroeconomic management in resource-poor
African countries
Table 2.5Distribution of inflation rates in Africa, 2008 (51 countries)
Range AfricaOil
countriesNon-oil
countriesMineral-
rich
Non-oil, non-
mineral rich
SSA
Less than 5% 3 1 2 1 2 3
Between 5 and 10 % (10% excluded)
23 7 16 5 18 19
Between 10 and 20 % (20% excluded)
19 0 19 8 11 16
20% and higher 6 0 6 2 4 6
Total number of countries
51 8 43 16 35 44
Source: UN-DESA, November (2008a).
Note: Excluding Seychelles and Swaziland due to lack of data.
Other factors contributing to the inflationary pressure on the continent in 2008 included sustained government spending and robust domestic demand, especially in oil-exporting countries (overheating)3. This was the case in oil economies such as Angola, Egypt, and the Sudan, where inflation was 12.6, 17.1 per cent and 15.0 respectively. Zimbabwe aside, Ethiopia recorded the highest inflation rate (41 per cent) in Africa in 2008, owing mainly to high energy and food costs coupled with drought, followed by Guinea (30 per cent), Sao Tome and Principe (28 per cent and Kenya (25 per cent). Zimbabwe still has the highest inflation on the continent (11 million per cent).
Increased inflation rates in Africa have complicated macroeconomic management and contributed to a reversal in the achievements made over the last two decades in terms of poverty reduction. The average poverty rate in SSA is now back to its early 1980s level of 50 per cent. The impact of soaring food prices is particularly large for oil-importing, low-income African countries. The poor in these countries lack adequate safety nets, while high inflation rates always have a stronger impact on the price of basic consumer goods.
Tightening fiscal and monetary policies may harm the poor with no significant impact on inflation. In most African countries, monetary policy is focused on con-trolling money supply to reduce core (non-food) inflation. Due to weak financial markets, these countries lack effective indirect monetary tools. They are also char-acterized by poor coordination between fiscal and monetary policies. In countries
3 Increased oil revenue often leads to rapid increases in domestic demand, contributing to high infla-tion rates in oil-exporting countries.

52 Economic Report on Africa 2009 Developing African Agriculture Through Regional Value Chains
High interest rates contribute to lower growth and
government revenue
where the financial markets are more sophisticated, governments have relied mainly on interest rates and Treasury Bill rates as the main monetary policy instruments.
For example, South Africa increased the repurchase (repo) rate by 50 basis points to 12 per cent in June 2008, raising the prime lending rate to 15.5 per cent. In Egypt, the overnight deposit and lending rates were also raised by 50 basis points to 11 and 13 per cent respectively in August 2008. High interest rates can have strong adverse effects on growth and, in turn, on government revenue.
Figure 2.3Ten highest and 5 lowest inflation countries in Africa in 2008 (%, excluding Zimbabwe)
0 10 20 30 40 50
Ethiopia
Guinea
Sao Tome and Prinicipe
Kenya
Somalia
Eritrea
Egypt
DRC
Ghana
Burundi
Tunisia
Morocco
Cote D'Ivoire
Comoros
Central African Republic
Source: UN-DESA, November 2008.
2.1.6 External balances worsened in most African countries in 2008
Despite their downward trend since the second half of 2008, high energy and food prices have resulted in rising current account deficits in 31 oil-importing African

53Growth and Social Development in Africa in 2008 and Prospects for 2009
Mounting threats to
current account sustainability in
oil-importing African economies
countries with available data. On average, current account deficit in these countries increased from –1.5 per cent of GDP in 2007 to –1.8 per cent in 2008. Despite rela-tively high donor support, current account deficits have also increased, though slightly, in landlocked African economies. Current account surpluses in oil-exporting countries increased from 10.7 per cent in 2007 to 15.9 per cent in 2008, thanks to high oil prices. Therefore, the overall current account position of the 42 African countries with available data, which shows a surplus of 2.6 per cent in 2008, is a reflection of the high revenues generated by oil-exporting countries (figure 2.4).
The data clearly show mounting threats to current account sustainability in oil-import-ing African countries. This, together with internal imbalances and inflationary pres-sure, pose risks to macroeconomic stability and growth prospects in these countries. In addition to rationalizing energy consumption, these countries should adopt strategies to diversify exports, promote tourism and attract remittances. In the short-term, how-ever, oil-importing African economies need more aid inflows to manage their external balances effectively. Meanwhile, oil exporters should devote a sizable proportion of their export earnings and accumulated reserves to boost public investment in infra-structure, human capital development and public service delivery.
Figure 2.4Current account balance in Africa by category, 2006-2008 (% of GDP)
-3
0
3
6
9
12
15
200820072006
Oil-importersOil-exportersLand lockedSSAAfrica
Source: UNECA calculations based on data from EIU, November 2008.
Note: Data cover only 42 African countries. The 11 excluded countries are: CAR, Comoros, DRC, Djibouti, Guinea-Bissau, Liberia, Mali, Mauritania, Niger, Sierra Leone, and Somalia.
54 Economic Report on Africa 2009 Developing African Agriculture Through Regional Value Chains
Many African currencies began to
depreciate against the US dollar in
late 2008
2.1.7 Exchange rates and international competitiveness
Based on nominal exchange rates, 18 of the 35 African currencies with available data appreciated against the US dollar in 2008, with 16 depreciating and one currency remaining unchanged. For the second consecutive year, the CFA, which is pegged to the Euro, appreciated substantially against the US dollar. In fact, many of the countries with strong primary commodity exports experienced currency apprecia-tion in 2008. Overvalued exchange rates can discourage non-commodity exports from Africa, resulting in reduced international competitiveness or the “Dutch Dis-ease” problem. However, many African currencies began to depreciate against the US dollar in late 2008.
In terms of real effective exchange rate (REER), 28 of the 38 African countries with available data experienced currency appreciation in 2008. However, only six countries recorded REER appreciation of more than 10 per cent and three countries had REER depreciation of more than 10 per cent. Kenya, Madagascar, Mauritius, Mozambique and Zambia were the five African countries with the highest REER appreciation rates in 2008. Burundi, Ghana, Namibia, Seychelles and Zimbabwe were the five countries with the highest depreciation rates. This shows that both resource-rich and non-resource-rich countries can be confronted with large REER depreciation or appreciation, mainly as a result of fluctuations in the domestic price level.4 High domestic prices as opposed to low prices cause the REER to appreciate, even if the nominal exchange rate is constant.
The main factors contributing to REER fluctuations - through the nominal exchange rate or the domestic price channels - are high commodity revenues and scaled-up expenditures, aid and other capital inflows, remittances and high earnings from tourism. Twelve of the 13 oil-exporting economies saw their REER appreciating in 2008. Maintaining competitive exchange rates, especially in oil-exporting countries, requires strategies to strengthen the supply side of the economy through increased public investment in infrastructure, education, skills development and technology.
Owing to high current account surpluses in oil-exporting African countries, the continent’s foreign exchange reserves continued to rise, from 32.6 per cent of GDP in 2007 to 34.5 per cent in 2008. Thirty-four of the 42 African countries with avail-able data maintained foreign exchange reserves of 10 per cent of GDP or more in 2008. The list of the top 10 African countries in terms of foreign exchange reserves as a ratio of GDP indicates that high reserves originate mainly from commodity
4 The REER index is defined as [Pd/Pf*NER], where Pd is the domestic price level, Pf is foreign (US) price level, NER is the official exchange rate expressed in terms of the domestic currency price of the US dollar (period average). Thus, REER represents the quantity of foreign goods that can be purchased with one unit of domestic goods.

55Growth and Social Development in Africa in 2008 and Prospects for 2009
Accumulated currency reserves should be used to
finance counter-cyclical measures
revenues and private capital flows and that none of these countries is a high aid-recipient country (figure 2.5).
Oil-exporting African economies need to coordinate fiscal and monetary policies closely to manage their foreign exchange reserves effectively and create a fiscal space for counter-cyclical interventions that can mitigate the impact of the global financial crisis. This will also help them to manage risks emanating from disruptive exchange rate volatility and inflationary pressure while at the same time spurring domestic investment for fast and sustained growth.
Figure 2.5Top 10 countries in terms of foreign reserve (% of GDP)
0 30 60 90 120 150
x2008
x2007
Libya
Algeria
Botswana
Lesotho
Nigeria
Equatorial Guinea
Congo, R
Angola
Morocco
Swaziland
20082007
Source: EIU, November 2008.
Note: Excluding the following countries due to lack of data: CAR, Comoros, DRC, Djibouti, Guinea-Bissau, Liberia, Mali, Mauritania, Niger, Sierra Leone, and Somalia
56 Economic Report on Africa 2009 Developing African Agriculture Through Regional Value Chains
Ineffective use of trade
for development reflects weak
productive capacity in Africa
2.1.8 Harnessing internal and external resources essential for Africa to boost domestic investment
As elaborated in chapter 3, Africa’s average gross domestic savings has increased from 21.8 per cent of GDP in 2004 to 26.3 in 2007. However, the domestic investment rate remained almost unchanged at around 22 per cent over the same period, far below the level required for achieving the MDGs. This partly reflects weaknesses in the domestic and regional financial markets and the inability, especially of oil-exporting countries, to use commodity revenues to boost domestic investment. Owing to low income, both domestic savings and investment rates are lower in oil-importing African countries compared with oil-exporters.
In addition to mobilizing more domestic resources, Africa needs to mobilize more non-debt generating external resources to boost domestic investment. As of July 2008, 19 African countries had received major reductions in official debt (United Nations 2008a). However, while Africa’s official debt declined, the debt owed to banks and other private creditors rose considerably such that overall debt remained high. ODA to Africa remains below the level of $72 billion per annum considered necessary for the continent to support the achievements of the MDGs (United Nations 2008a). Meanwhile, more needs to be done for the continent to improve aid quality and effec-tiveness and to enhance development through trade (see chapter 3).
The rather ineffective use of trade for development is a reflection of domestic supply constraints, including poor infrastructure, a weak human capital base, and such external trade constraints as the stalemate of the Doha Round of trade negotiations, and the disputed agricultural subsidies by the EU, US, Japan and Canada. Besides raising public and private investment in infrastructure - at some $52 billion annually - Africa needs substantial improvements in market access, as well as stronger regional market integration to enhance global competitiveness. Again, in face of the global financial turmoil and increasing uncertainties, African countries should continue to consolidate their recent economic reforms to create a business environment attrac-tive to private capital inflows.

57Growth and Social Development in Africa in 2008 and Prospects for 2009
Agriculture and services grew
at higher rates in 2008
2.2 Sectoral performance shows limited transformation of production structures
2.2.1 Growth of sectoral value added
In 2007, industry’s value added in Africa grew at a record rate of almost 8 per cent (figure 2.6).5 The manufacturing sector stands out with a rather impressive 9.6 per cent growth, which represents the highest growth rate since 2001 and the second highest growth rate since 1970. East and Southern Africa led this record performance, owing especially to the robust dynamics in mining and the recovery in construction and manufacturing. Somewhat less remarkable was the expansion of industry in the other subregions of the continent. In North Africa, manufacturing production slowed down after a sharp acceleration in 2006. Industry’s growth averaged 5.4 per cent, well below the peak in 2006.
In West Africa, the contribution of manufacturing turned positive after a year of stagnation, thus bringing industry’s growth up to 4.7 per cent. This is still rather low compared to the rates observed in the subregion at the beginning of the decade. Finally, in spite of the strong performance in manufacturing, industry grew by only 3.1 per cent in Central Africa, which denotes both the difficulties of the mining sub-sector in several countries and lack of progress in diversifying the range of industrial production.
The performance of agriculture was similar over the last three years. The value added of the sector grew by 3.2 per cent (figure 2.6 and table Ax.1), with none of the five subregions achieving growth above 5 per cent. In fact, North Africa even recorded a decline. The 2007 data must be put in the context of the disappointing long-term trends of the sector. Agricultural value-added growth in Africa has averaged around 3 per cent per year since 1961. Annual growth rates display rather sharp volatility, around a substantially flat historical trend, which means that the sector is structur-ally stagnating as a result of weak growth of productivity per worker. While value added per worker in absolute terms in Africa in 2005 (the latest available informa-tion) was higher than in South and East Asia and above the low-and-middle-income country average, its aggregate growth between 1985 and 2005 having been 38 per cent. This was marginally lower than average productivity growth in low-income countries (40 per cent) and significantly lower than growth in Latin America and the Caribbean (64 per cent) and East Asia (72 per cent). South Asia (41 per cent) also outperformed Africa over the past 20 years (see part II of this report for further discussion).
5 Throughout this section, 2007 yielded the latest available data for most African countries.

58 Economic Report on Africa 2009 Developing African Agriculture Through Regional Value Chains
Increasing share of industry
in Africa’s GDP
Finally, the services sector, the most dynamic sector in 2005 and 2006, grew at 6 per cent in 2007 (see figure 2.6). This growth rate is one of the highest since 1970. The performance of the sector was mostly homogenous across the subregions (table A1). The highest growth rate was observed in North Africa (7.6 per cent) and it was only 3 percentage points higher than the lowest growth rate, in West Africa (4.8 per cent). Data for the past five years indicate that services growth is probably more stable, both within and across countries, than growth in other sectors. This suggests progressive consolidation of performance in the services sector across the continent as a whole.
Figure 2.6Annual growth rate of value added of different sectors in Africa (%)
0
2
4
6
8
10
20062007
ManufacturingServicesAgricultureIndustry
Source: UNECA computations based on World Bank (2008).
2.2.2 Sectoral contribution to GDP and total value-added growth
Industry’s share in GDP continued to expand in 2007, reaching 32 per cent (figure 2.7 and table A2). Between 2002 and 2007, the share of industry went up by about 4 percentage points of GDP while the agricultural share dropped from 26.4 per cent to 22 per cent. This structural change is clearly evident in Central and West Africa, even though the share of industry somewhat declined in the latter between 2006 and 2007. This was due to the already noted difficulties of mining activities in some countries of the subregion. In East and North Africa, industrial share grew modestly between 2002 and 2007 and much of the decline in the share of agriculture was accounted for by the increase in the share of services. In South-

59Growth and Social Development in Africa in 2008 and Prospects for 2009
Services drive value-added
growth in East and North Africa
ern Africa, the share of agriculture was already very low in 2002 and it has declined only marginally since then.
By combining the data on sectoral growth and sectoral share of GDP, it is possi-ble to determine each sector’s contribution to total value-added growth6. In figure 2.7, each column represents the total value-added growth in a given country group (Africa or each of the five subregions) and the partition of this growth among the three sectors (for more detailed data see also table A3). The main predictable fact emerging from the chart is the small contribution of agriculture. This contribution ranges from practically 0 per cent in North Africa to a maximum of 1.4 per cent in West Africa. Industry and Services, on the other hand, contributed more than 2.5 per cent each on average. Services drive value-added growth in East and North Africa, while in Southern Africa it is the industry sector that provides the largest contribution.
Figure 2.7Contribution of different sectors to growth in value-added in 2007 (%)
0
1
2
3
4
5
6
7
8
ServicesAgricultureIndustry
Southern AfricaNorthern AfricaCentral AfricaWest AfricaEast AfricaAfrica
Source: ECA computations based on World Bank data (2008).
Sectoral contribution to growth in total value-added in Africa appears to be quite unbalanced. The only possible exception is West Africa, where the three sectors pro-vide roughly comparable contributions. In relatively fast-growing subregions such as North and Southern Africa, agriculture is almost entirely neglected. This is another indicator of the broader agricultural problem already noted under the previous head-ing “Growth of sectoral value added”.
6 Note that for each country grouping, total value-added growth in 2007 is not necessarily the same as the total GDP growth reported in section 2.1.

60 Economic Report on Africa 2009 Developing African Agriculture Through Regional Value Chains
Manufacturing remains marginal
in Africa
2.2.3 Sectoral dynamics and economic diversification
Between 1960 and 2007, the GDP share of agriculture value added in Africa decreased from 41 per cent to 22 per cent. At the same time, the GDP share of industry has increased from 17 per cent to 32 per cent, while the share of services has gone up from 42 per cent to 46 per cent. This structural change has not resulted in the type of economic diversification that is most needed to sustain growth and development in the long term. Indeed, indicators suggest that over time, the African productive structure has become less diversified (see UNECA 2007). The services and mining sector’s share increased considerably over the years at the expense of agriculture and other productive subsectors.
Indeed, the increase in industry’s share over the past four decades has been mostly driven by the expansion of mining while manufacturing has continued to play a rather marginal role. In fact, the GDP share of manufacturing value added increased from an average of 8.7 in 1960 to only 10.7 percent in 2007. The weak contribution of manufacturing has important consequences. First, the opportunities for techno-logical spillovers, productivity gains, and skills upgrade make the manufacturing sector a key driver of growth. Second, in the absence of a robust manufacturing sector, countries tend to depend heavily on primary commodity exports. Given the instability of international commodity prices, this means greater macroeconomic instability and output volatility.
Finally, when the industry sector mainly consists of mining activities, job creation in the economy is subdued and other sectors do not benefit from any significant trickle-down effects. It then follows that growth in mining is not redistributed to the rest of the economy, which in turn implies that the contribution of mining expan-sion to poverty reduction and social development is quite limited.
The key policy issue in this context is how to promote diversification for growth and development7. It is clear from the above discussion that the diversification proc-ess must lead to a recovery in agriculture and promotion of non-mining industrial activities, manufacturing in particular. Part II of ERA 2009 specifically deals with agriculture. The promotion of manufacturing and requires an increase in invest-ment, which in turn requires combined interventions of macroeconomic, industrial and financial policies. As discussed earlier in this chapter, macroeconomic stability and microeconomic reforms are essential for enhancing domestic investment and economic diversification. These should include efforts to strengthen the financial system to contribute effectively to domestic resource mobilization and the financing of profitable investments (see chapter 3).
7 See also UNECA (2007) for an extensive treatment of several of these issues.

61Growth and Social Development in Africa in 2008 and Prospects for 2009
Industrial policy essential
for economic diversification
in Africa
Regarding industrial policy, it is possible to draw some lessons from past experiences in Africa, Asia and Latin America (UNIDO 2004; Rodrik 2007). The most recent and successful industrialization episodes seem to emerge from a new approach that combines elements of import substitution and laissez faire, in the attempt to uncover where the most significant obstacles to restructuring lie and what type of interven-tions are required to remove them. Following this logic, industrial policy should be centred on two pillars. One is the provision of appropriate incentives to the private sector to invest and engage in new activities. These incentives can take various forms, including tax incentives and facilitated access to credit.
The other pillar is the establishment of mechanisms to evaluate the performance of firms receiving public support. Every publicly supported project needs to have a clear statement ex ante of what constitutes success and failure.8 Based on this statement, independent and competent authorities should regularly evaluate the performance of firms. Support should then be maintained only to successful firms. With this approach, the government does not have to “pick the winners” ex ante, as this is often the source of major distortions. Instead, new areas of comparative advantage self-select in response to the incentives provided by government and the systematic evaluation of their performance.
2.3 Trends in social development in Africa
2.3.1 Mixed progress towards achieving the MDGs
Progress towards meeting the targets of the MDGs has been mixed, with some noticeable gains in universal education but very limited headway on poverty and hunger eradication and on various health-related goals. Poverty rates continue to be stubbornly high in Central, East, South and West Africa, despite the impressive eco-nomic growth rates recorded in recent years (United Nations, 2008a). The propor-tion of the “working poor” decreased by only 4 per cent over the last decade, from 55.5 per cent in 1997 to 51.4 per cent in 2007. More worrisome, recent food and energy price increases, although easing, are still historically high, and are adversely affecting the poor and dimming the prospects of meaningful reduction of poverty and hunger in many African countries (UNECA, 2008a).
Achieving universal primary education is arguably the goal in which many Afri-can countries have made remarkable headway. Both gross primary enrolment and net primary enrolment are on the rise in a majority of countries, driven largely by
8 Possible benchmarks are the performance of firms in similar industries in neighbouring coun-tries and/or the performance of firms in international markets, as expressed for instance by export levels.

62 Economic Report on Africa 2009 Developing African Agriculture Through Regional Value Chains
Remarkable progress in
achieving universal primary education
a combination of strong government commitment and appropriate support from the donor community. However, while a majority of African countries are likely to achieve gender parity in primary education by 2015, very few countries have recorded similar progress in the areas of secondary and tertiary education. Further, progress in gender parity in decision-making has varied considerably across the con-tinent, despite inroads made in a number of countries.
Child mortality has not declined in 27 African countries (United Nations, 2008b), and preventable diseases and malnutrition are still the leading causes of this. Under-five mortality rate decreased slightly, from 185 per 1000 live births in 1990 to 165 live births in 2005 (UNICEF, 2008, UNECA, 2008b). Progress in combating HIV/AIDS, malaria and other diseases has generally been limited, despite the positive spots recorded in some countries. The highest HIV/AIDS prevalence rate is recorded in Southern Africa, where it often stands above 15 per cent, while the lowest rates are found in North Africa, with less than 1 per cent of the adult population affected.
One notable positive development in many countries has been the growing inte-gration of HIV/AIDS concerns into national development plans. As a result, the number of people who received anti-retroviral treatment (ART) in Central, East, South and West Africa increased from 100 000 in 2003 to 1.3 million in 2006 (UNICEF, 2008). The corresponding coverage of people who received treatment improved from 2 per cent in 2003 to 28 per cent in 2006. Although widening, cov-erage rate is still very low relative to demand. Tuberculosis incidence, prevalence and morbidity have not declined in the subregions, except in North Africa.
At the current trends, the prospects of meeting the goal on environmental sustain-ability also look daunting. Areas covered by forest have shrunk by 3 per cent in Cen-tral, East, South and West Africa. The proportion of people with access to safe drink-ing water and the percentage of people with improved sanitation have increased, although at a lower pace than what is required to achieve the targets set for 2015. Finally, as mentioned earlier in the area of developing a global partnership for devel-opment, aid flows to the continent remain below the levels pledged by donors and below the levels needed for Africa to bridge the domestic resource gap.
Slow progress towards achieving the MDGs is most pronounced for marginalized and vulnerable groups in African countries, including women, the aged, youth, people with disabilities, and indigenous people. The overall exclusion of these groups from society is reflected not only in their lower incomes and poorer outcomes in the labour market but also in terms of lower educational attainment rates, poor health status and under-representation in political processes and at policy- making levels. African women still experience the greatest forms of marginalization and exclusion from the benefits of recent growth recovery in Africa.
63Growth and Social Development in Africa in 2008 and Prospects for 2009
Steady progress towards
gender equality in most countries
Promoting gender equality and women’s empowerment in Africa
In recent decades, governments around the globe have increasingly answered the call to put gender equality and women’s empowerment at the centre of the develop-ment agenda. Recognizing that inclusive economic and social development cannot be achieved without tackling these issues, governments have made various commit-ments to achieving the goals of gender equality and women’s empowerment. At the global level, key commitments include MDG 3, the Convention on the Elimination of All Forms of Discrimination against Women (CEDAW), the Beijing Platform for Action (BPFA) and the International Conference on Population and Development (ICPD).
In addition, African member States have committed themselves to these goals through a range of AU Declarations, Plans of Action and policy frameworks. The main commitments are: the Protocol on the Rights of Women in Africa, which is a supplementary protocol to the African Charter on Human and People’s Rights; the Solemn Declaration on Gender Equality in Africa (SDGEA); the African Plan of Action to Accelerate Implementation of the Dakar and Beijing Platforms for Action for the Advancement of Women; and the Addis Ababa Declaration on Violence against Women.
Given the crosscutting nature of gender considerations, other sectoral AU commit-ments that are relevant to this area include the Abuja Declaration on HIV/AIDS, Tuberculosis and other Related Infectious Diseases, the Bamako Declaration on Reduction of Maternal and Neo-Natal Mortality, and the Maputo Plan of Action on Sexual and Reproductive Health and Rights, among others.
Looking at various dimensions of women’s economic and social development reveals that though some progress is being made in areas such as access to basic education, other barriers remain for women in Africa, particularly in terms of accessing post-primary education, and finding decent jobs. In this context, this section reviews progress in five key areas: education, health, HIV/AIDS, employment and participa-tion in political and decision-making processes.
Education
Inequalities in accessing education have been a traditional source of exclusion for women in Africa, leaving them with few opportunities to find a decent job, obtain credit and participate in public life. In recent years, considerable efforts have been made by African governments and development partners to increase girls’ access to primary school. In 2006, the ratio of girls to boys’ gross enrolment ratios in primary education reached 0.89 in SSA, while it stands at 0.93 in North Africa (United Nations 2008b). Girls’ gross primary enrolment ratio reached 91 per cent in 2006.

64 Economic Report on Africa 2009 Developing African Agriculture Through Regional Value Chains
North Africa has achieved
gender parity in tertiary education
As a result of improvements in access to primary education, literacy rates for women have been increasing, which is particularly evident in the case of the literacy rates of young women aged 15-24, vis-à-vis young men (figure 2.8). North Africa has achieved the strongest gains with young female literacy rates increasing by over 20 percentage points from the 1980s to 2007. At the same time, the literacy rate for young women in SSA increased from 58.6 per cent for the period 1985-1994 to 67.3 per cent in 2007. Despite this progress, the gap between the female and male literacy rates is not decreasing fast enough, especially in SSA, where the ratio of young female to male literacy rate has remained rather static over the last decade, at around 0.87 per cent.
Figure 2.8Literacy rates for young men and women (15-24 years) (%)
40
60
80
100
SSA_female
SSA_male
N Africa_female
N Africa_male
20071995-20041985-1994
Source: United Nations (2008b).
The latest figures also reveal that young girls’ access to post-primary education is not improving vis-à-vis the situation for boys. Indeed, gender parity has deteriorated at the secondary level in SSA where the gross enrolment ratio of girls to boys in secondary education decreased from 0.82 in 2000 to 0.80 in 2006 (United Nations 2008b). The gross enrolment ratio in secondary education for girls reached only 28 per cent. Far fewer African countries are making progress in achieving gender parity in tertiary education. The ratio of female to male tertiary enrolment ratios only reached 0.68 in SSA. In comparison, North Africa has achieved gender parity in enrolment in tertiary education (United Nations 2008b).

65Growth and Social Development in Africa in 2008 and Prospects for 2009
Women are more vulnerable to
infection by HIV/AIDS
Health
African women are vulnerable to a range of illnesses and afflictions. Young women in SSA aged 15 to 29 mostly die from HIV and AIDS followed by maternal com-plications, tuberculosis, and STDs excluding HIV and malaria.9 Maternal mortality continues to be a major challenge facing Africa. In 2005, there were 900 maternal deaths per 100,000 live births in SSA, barely down on the figure for 1990 (920 per 100,000). In contrast, the ratio in North Africa has dropped from 250 to 160 deaths per 100,000 live births (United Nations 2008b). One of the factors behind maternal mortality in Africa is the high rate of adolescent pregnancies.
In this respect, girls in SSA have the highest rates of early marriage and early moth-erhood, as well as the highest mortality rates for young mothers and their babies. Young teenagers in SSA are more vulnerable to becoming pregnant than in other subregions. It is encouraging that the adolescent birth rate in SSA fell from 130.6 births per 1,000 women aged 15-19 in 1990 to 118.9 in 2005 (United Nations 2008b).
Women, particularly young women, are more vulnerable to getting infected by HIV/AIDS, which stems from economic, social and cultural inequalities. In SSA, women bear the brunt of the epidemic, which is still increasing. According to UNAIDS figures, 61 per cent of persons living with HIV in this region are women (UNAIDS 2008a).
The United Nations Joint Programme on HIV and AIDS (UNAIDS) estimates that in 2007, 3.2 per cent of young women in SSA had the HIV virus compared to 1.1 per cent of young men (UNAIDS 2008b). This heightened vulnerability amongst young females is found throughout SSA but it is most pronounced in Southern Africa.
Women’s participation in the labour market and political and decision-making processes
Women continue to face considerable barriers in African labour markets as a result of lack of education, inadequate access to training, discrimination, and cultural atti-tudes about their role in the workplace. Official figures provided by the International Labour Organization (ILO) indicate that there is very little difference between the unemployment rates of adult women and men in SSA.10 In 2006, it was estimated that both female and male unemployment rates stood at 9.7 per cent.
9 WHO Revised Global Burden of Disease 2002 Estimates; Countries from the WHO-AFRO region – see www.afro.who.int/home/countryprofiles.html. The AFRO region includes all SSA countries, excluding Eritrea, Somalia, and Algeria.
10 See ILO, Key Indicators of the Labour Market, Version 5 CD-ROM.
66 Economic Report on Africa 2009 Developing African Agriculture Through Regional Value Chains
Increasing proportion of
women’s seats in SSA parliaments
Given the difficulties in measuring the rate of unemployment in Africa and the reality that most Africans cannot afford to remain unemployed11, it is crucial to rec-ognize women’s participation in the informal economy, where most African women are working, mostly in low paid and often dangerous jobs. Indeed, women are highly represented in the informal sector as employees, entrepreneurs or unpaid home-based workers (Chen 2001).
Political participation and representation is a cornerstone of democracy and is key to promoting inclusive development. In particular, women’s political representation in national parliaments is an important indicator of their capacity to influence deci-sion-making processes, including policies, strategies and resource allocation. With-out this representation, their issues and concerns tend to be overlooked. Between 2000 and 2008, the proportion of women’s seats in SSA parliaments has increased from an average of 13.5 per cent to 17.3 per cent, (up to 19.8 per cent in coun-tries that have introduced quotas). Globally, this is one of the higher figures and is considerably above the figure for North Africa, which reached 8.3 per cent in 2008 (United Nations 2008b).
Overcoming challenges to gender equality
The UNECA African Women’s Progress Scorecard (AWPS) shows that African coun-tries under review have met less than half of their commitments. AWPS measures policy performance regarding women’s advancement and empowerment and tracks government progress in ratifying, implementing and monitoring relevant conven-tions and documents on gender equality and women’s rights including CEDAW, the Women’s Protocol of the African Charter on Human and People’s Rights, the BPFA and the ICPD Plan of Action.
Most progress is being made in the social dimension, particularly in relation to com-mitments to health in the context of ICPD. More progress is needed in terms of commitments to women’s rights in the context of CEDAW, the African Women’s Rights Protocol and in the economic area, particularly with respect to increasing access to technology and land. In the political area, least progress is being made in relation to the commitment to United Nations Security Council resolution 1325, support for women quotas, and other affirmative action. Overall, the main challenge in Africa is lack of implementation of the commitments and policies, which is the result of inadequate will, capacity and resources. National and regional gender poli-cies and programmes remain grossly under-funded and under-staffed.
Therefore, in order to promote gender equality and women’s empowerment in Africa, governments and development partners need to focus on overcoming the
11 See ECA (2005) for more details.

67Growth and Social Development in Africa in 2008 and Prospects for 2009
Prospects for 2009 are constantly
revised downward
implementation gaps through capacity building and increased funding of policies and programmes. More specifically, African States need to establish gender-respon-sive public financial management systems, strengthen gender budget initiatives and take a multi-sectoral approach to the challenges facing women, including issues in the areas of education, health and employment. The international community should support African governments in their implementation of gender equality and empowerment commitments as contained in national development strategies, and integrate gender equality in aid policies and architecture.
2.4 Prospects for 2009: further slowdown
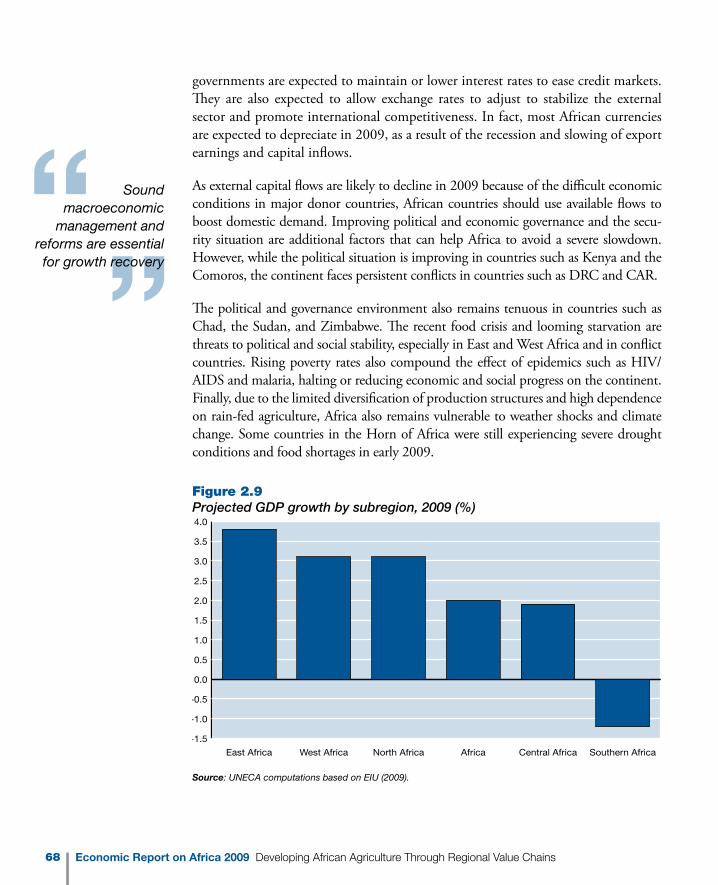
The real GDP growth rate in Africa is expected to fall to 2.0 per cent in 2009 from 5.1 per cent in 2008. Subregional growth rates in 2009 are projected to range from -1.2 per cent in Southern, to 1.9 per cent in Central Africa, 3.1 per cent in North Africa, 3.1 per cent in West Africa and 3.8 per cent in East Africa (figure 2.9). The continent’s prospects for 2009 are subject to strong uncertainties stemming mainly from the world financial crisis and the worsening global recession.
Based on its weak integration into the global financial system, the crisis was expected to have few direct effects on the continent. However, growth forecasts for all devel-oped and high-growth developing economies indicate a slow down in growth or recession in 2009, and a general fall in primary commodity demand and prices (UN-DESA 2008b). Accordingly, economic growth in Africa is expected to decline further in 2009 as export revenue decreases. In fact, economic developments in early 2009 suggest a deeper world economic recession than previously expected (United Nations 2009). Hence, the economic outlook for Africa in 2009 could be signifi-cantly worse than indicated in earlier projections.
The chances for growth rebound in Africa in 2009 are slim, and hinge on the ability of economic stimulus packages in developed countries to enhance not only domes-tic demand but also demand for commodity exports from Africa. Nevertheless, sustained economic reforms, easing inflation, domestic currency depreciation and efforts to revive domestic demand would contribute to a positive, albeit weaker, growth performance in Africa in 2009. Average inflation in Africa is also expected to ease in 2009, as oil and food prices decline. This decline can stimulate higher private consumption and investment demand in some countries.
Lower energy and food prices in 2009 should also ease the pressure on government budgets. This will support government efforts to consolidate effective macroeco-nomic management and institutional reforms, which should further stimulate pri-vate investment and growth on the continent. In line with global financial trends,
68 Economic Report on Africa 2009 Developing African Agriculture Through Regional Value Chains
Sound macroeconomic
management and reforms are essential for growth recovery
governments are expected to maintain or lower interest rates to ease credit markets. They are also expected to allow exchange rates to adjust to stabilize the external sector and promote international competitiveness. In fact, most African currencies are expected to depreciate in 2009, as a result of the recession and slowing of export earnings and capital inflows.
As external capital flows are likely to decline in 2009 because of the difficult economic conditions in major donor countries, African countries should use available flows to boost domestic demand. Improving political and economic governance and the secu-rity situation are additional factors that can help Africa to avoid a severe slowdown. However, while the political situation is improving in countries such as Kenya and the Comoros, the continent faces persistent conflicts in countries such as DRC and CAR.
The political and governance environment also remains tenuous in countries such as Chad, the Sudan, and Zimbabwe. The recent food crisis and looming starvation are threats to political and social stability, especially in East and West Africa and in conflict countries. Rising poverty rates also compound the effect of epidemics such as HIV/AIDS and malaria, halting or reducing economic and social progress on the continent. Finally, due to the limited diversification of production structures and high dependence on rain-fed agriculture, Africa also remains vulnerable to weather shocks and climate change. Some countries in the Horn of Africa were still experiencing severe drought conditions and food shortages in early 2009.
Figure 2.9Projected GDP growth by subregion, 2009 (%)
-1.5
-1.0
-0.5
0.0
0.5
1.0
1.5
2.0
2.5
3.0
3.5
4.0
Southern AfricaCentral AfricaAfricaNorth AfricaWest AfricaEast Africa
Source: UNECA computations based on EIU (2009).

69Growth and Social Development in Africa in 2008 and Prospects for 2009
Growth recovery requires
increased focus on infrastructure and
spending on the MDGs
2.5 Conclusions and policy recommendations
Economic performance in Africa continues to depend heavily on global commodity demand and prices due to limited transformation of production structures. How-ever, the GDP growth rate remained positive in 2008 at 5.1 per cent. While the continent is, to some extent, insulated from the direct impact of the recent global financial crisis, a global economic downturn or recession will have substantial effects on Africa through reduced capital inflows and lower demand and prices for primary commodity exports. Thus, Africa’s GDP growth is expected to fall further in 2009.
So far, high oil prices translated into high GDP growth rates as well as favourable internal and external balances in oil-exporting African countries. Currently, these countries contribute more than 60 per cent of the continent’s total GDP and average growth rates. On the other hand, oil-importing African countries are experiencing faster slow down in growth as well as mounting fiscal and current account deficits. However, the two groups of countries recorded high inflation rates in 2008, originat-ing largely from outside the continent. Indeed, high energy and food prices resulted in rising poverty rates in SSA and pose a serious threat to the recent achievements in social development in many countries.
As in previous years, economic performance varied considerably across countries and subregions and remains insufficient for Africa to make meaningful progress towards achieving the MDGs. Both short- and long-term responses are essential for Africa to meet the challenges of the food crisis, growth volatility and social development. In the short run, governments need greater policy flexibility as well as external support to combat food shortages through, for example, lower tariffs on food imports, sub-sidies and cash transfers to poor households. In the long-run, governments should invest more in agriculture and infrastructure - the main constraints on growth - especially energy, communication, roads and public service delivery in the areas of education and health. This, together with effective macroeconomic management and institutional reforms will stimulate private sector development and investment.
In particular, resource-rich African countries need to use commodity revenue and accumulated reserves from the commodity boom to enhance diversification of pro-duction structures and international competitiveness. First, this requires increased productivity-enhancing public investment, especially in infrastructure, technology and human capital development through education and technical training. Public investment in modern and rural infrastructure and education can support economic and social development in many different ways. It will assist the country to create a favourable environment for attracting increased FDI as well as domestic private investments that create jobs. This, together with the fact that public investment can

70 Economic Report on Africa 2009 Developing African Agriculture Through Regional Value Chains
Africa needs to build capacity
to promote innovative private
investment
also be an effective tool for redistributing commodity revenues will help to reduce poverty and promote political stability.
Second, commodity revenue should be employed to build capacity to promote inno-vative private investment. At the forefront of policy interventions in this regard must be industrial and trade strategies for encouraging allocation of the resources needed for stimulating diversification of exports away from primary commodities. These strategies should include measures to promote entrepreneurship and innova-tive private activities and to address market failures that arise from information and coordination externalities.
Promoting such activities requires government support to research and development, technical assistance, selective taxation, financing, regulation, networking and coordi-nation of investments to ensure complementarities. Regional integration and harmo-nization of economic policies should also support efforts towards diversification.
While overall human and social development remains low in Africa and achievements are mixed, the marginalized and vulnerable groups such as women, the aged, the youth and the disabled are still more affected than others. This calls for mainstreaming of the special needs of these groups into policymaking and implementation frameworks. Focusing on women as the largest marginalized group with the greatest economic potential and most important social role, this chapter argues for their empowerment through education, health services, employment and adequate representation in politi-cal and socio-economic legislative and decision-making institutions.

71Growth and Social Development in Africa in 2008 and Prospects for 2009
References
Chen, M.A., 2001. “Women in the informal sector: a global picture, the global movement”. SAIS Review, Winter-Spring 2001.
EIU, 2008. Online data. August (www.eiu.com).
________, 2009. Online Data. April (www.eiu.com).
Commission on Growth and Development, 2008. The Growth Report: Strategies for Sustained Growth and Inclusive Development. International Bank for Recon-struction and Development, World Bank, Washington, D.C.
IMF, 2008. Regional Economic Outlook: Sub-Saharan Africa. IMF, Washington, D.C., April
UNAIDS, 2008a. Regional fact sheet: key facts by region – 2007 AIDS Epidemic Update. UNAIDS, Geneva.
________, 2008b. Report on the Global AIDS Epidemic. UNAIDS, Geneva.
Ravallion, M. and S. Chen, 2008. The developing world is poorer than we thought, but no less successful in the fight against poverty, World Bank, Washington, D.C.
Rodrik, D., 2007.One Economics, Many Recipes: Globalization, Institutions and Economic Growth”. Princeton University Press.
UNECA, 2008a. Les Economies de l’Afrique Centrale, Bureau Sous-Regional pour l’Afrique Centrale. Yaounde, Cameroon.
________, 2008b. Assessing Progress towards Attaining the Millennium Develop-ment Goals in Africa 2008. Addis Ababa.
________, 2007. Economic Report on Africa 2007: Accelerating Africa’s Develop-ment Through Diversification. Addis Ababa, Ethiopia
UNIDO, 2004. “Industrial Development Report 2003/2004”. Vienna, Austria.
UN-DESA, 2008a. Africa database. United Nations, New York, November.
________, 2008. Global Development Assumptions, United Nations. New York. November.
72 Economic Report on Africa 2009 Developing African Agriculture Through Regional Value Chains
United Nations, 2009. The World Economic Situation and Prospects 2009, New York.
________, 2008a. Africa’s Development Needs: State of Implementation of Various Commitments, Challenges and the Way Forward. Secretary-General’s Report to the General Assembly, September, New York.
________, 2008b. The Millennium Development Goals Report 2008. New York.
UNICEF, 2008. The State of the World’s Children: Child Survival. New York.
World Bank, 2008. World Development Indicators, Washington D.C.

73Growth and Social Development in Africa in 2008 and Prospects for 2009
Appendix tables
Table A1Value added of different sectors (% of total GDP)
Simple averages Weighted averages
2002 2003 2004 2005 2006 2007 2002 2003 2004 2005 2006 2007
Industry
Africa 27.90 28.11 29.22 30.12 31.80 31.98 33.43 33.97 35.03 36.10 33.83 33.45
East Africa 18.36 18.29 18.82 18.34 18.18 18.93 17.31 17.42 17.85 17.58 17.61 18.01
West Africa 20.99 21.59 21.99 22.79 25.58 26.15 27.49 31.00 34.65 35.97 36.29 35.31
Central Africa 44.30 45.43 50.63 53.95 54.71 49.97 44.38 44.56 48.79 51.80 52.42 48.27
North Africa 32.10 32.04 33.87 35.37 34.06 33.31 36.68 37.58 38.71 40.13 34.05 32.60
Southern Africa 35.87 35.55 35.56 36.42 38.13 38.82 34.96 33.80 33.34 34.10 34.73 35.18
Agriculture
Africa 26.41 26.65 25.61 25.33 23.27 21.98 18.19 17.84 16.56 15.83 16.33 15.01
East Africa 31.38 31.57 31.40 31.68 30.47 27.49 36.64 36.53 36.67 36.99 36.99 32.21
West Africa 35.73 36.48 34.75 34.95 31.03 30.73 40.13 37.40 31.81 31.17 30.15 30.38
Central Africa 22.43 21.73 19.35 18.14 17.98 18.69 17.38 16.79 14.99 13.79 13.88 14.09
North Africa 20.19 20.41 19.21 17.58 17.26 16.08 15.88 16.05 15.15 13.87 15.59 14.20
Southern Africa 14.67 14.86 14.58 14.32 13.78 13.50 6.26 5.92 5.56 5.22 4.96 5.13
Services
Africa 45.46 45.24 45.17 44.51 44.78 45.94 48.33 48.19 48.41 48.07 49.84 51.53
East Africa 49.32 50.14 49.79 49.98 50.80 53.18 45.60 46.04 45.48 45.43 45.40 49.75
West Africa 43.27 41.94 43.26 42.11 43.39 43.09 32.37 31.60 33.53 32.83 33.56 34.31
Central Africa 33.28 32.84 30.02 27.91 27.30 31.34 38.24 38.65 36.22 34.41 33.70 37.64
North Africa 47.71 47.55 46.92 47.05 48.68 50.62 47.44 46.37 46.14 45.99 50.36 53.20
Southern Africa 49.46 49.59 49.86 49.26 48.09 47.68 58.79 60.29 61.10 60.68 60.31 59.69
Manufacturing
Africa 10.77 10.74 10.57 10.33 10.35 10.73 14.22 13.75 13.32 12.92 13.35 13.58
East Africa 8.73 8.52 8.59 8.26 8.02 8.43 8.67 8.57 8.56 8.44 8.25 8.81
West Africa 8.49 8.51 8.65 8.73 7.94 7.53 7.24 6.80 6.56 6.36 5.77 5.39
Central Africa 8.93 8.81 8.04 7.80 7.97 9.22 12.46 12.32 11.32 10.54 10.64 11.72
North Africa 12.78 12.33 12.00 11.56 12.24 12.68 15.38 14.60 14.18 13.71 15.66 15.84
Southern Africa 15.79 16.20 15.79 15.32 15.79 15.85 17.66 17.54 17.09 16.63 16.36 16.28
Source: UNECA computations based on World Bank (2008).

74 Economic Report on Africa 2009 Developing African Agriculture Through Regional Value Chains
Table A2Growth of value added of different sectors (%)
2002 2003 2004 2005 2006 2007
Industry
Africa 5.42 5.46 8.88 5.05 5.00 7.98
East Africa 2.91 5.02 5.27 4.09 6.10 13.54
West Africa 9.13 4.03 4.24 5.93 3.58 4.66
Central Africa 8.87 13.96 36.52 3.85 -0.64 3.13
North Africa 4.69 5.28 8.35 5.61 8.91 5.39
Southern Africa 3.26 3.72 5.61 5.31 6.06 10.11
Agriculture
Africa -0.41 4.26 2.71 3.38 3.86 3.24
East Africa 0.05 0.31 3.53 4.32 4.13 4.34
West Africa -3.30 7.39 3.38 5.59 3.82 4.66
Central Africa 2.95 2.42 2.13 5.78 2.46 3.27
North Africa -1.59 11.47 2.05 -0.17 9.66 -0.27
Southern Africa 1.11 2.05 1.70 0.80 1.41 2.73
Services
Africa 4.26 3.80 4.92 5.56 6.53 6.00
East Africa 2.85 4.30 5.05 7.39 8.15 6.86
West Africa 3.42 4.21 4.96 3.24 5.45 4.78
Central Africa 7.39 3.77 4.66 8.18 5.82 6.23
North Africa 4.06 5.46 4.93 6.04 8.27 7.56
Southern Africa 5.33 1.92 4.84 4.61 5.41 5.41
Manufacturing
Africa 5.00 2.76 5.16 4.67 4.60 9.56
East Africa 2.37 3.99 3.97 5.72 4.54 6.36
West Africa 9.40 0.09 6.41 3.48 0.27 4.32
Central Africa 11.85 2.36 9.21 12.79 2.97 25.06
North Africa 3.40 2.03 5.84 2.52 6.86 5.18
Southern Africa 2.00 4.50 3.36 2.79 6.78 10.74
Source: ECA computations based on World Bank (2008).
75Growth and Social Development in Africa in 2008 and Prospects for 2009
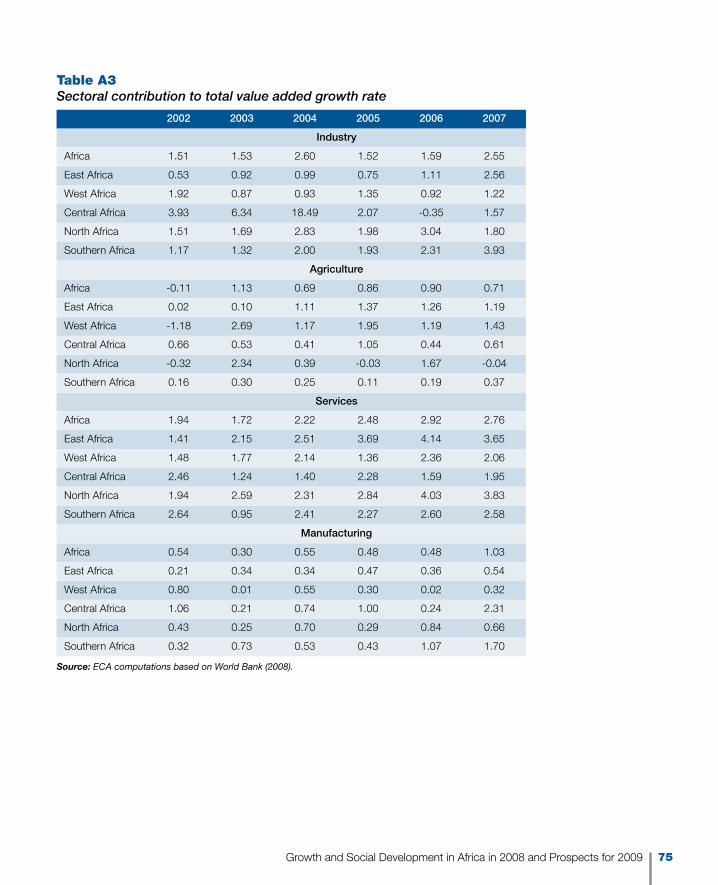
Table A3Sectoral contribution to total value added growth rate
2002 2003 2004 2005 2006 2007
Industry
Africa 1.51 1.53 2.60 1.52 1.59 2.55
East Africa 0.53 0.92 0.99 0.75 1.11 2.56
West Africa 1.92 0.87 0.93 1.35 0.92 1.22
Central Africa 3.93 6.34 18.49 2.07 -0.35 1.57
North Africa 1.51 1.69 2.83 1.98 3.04 1.80
Southern Africa 1.17 1.32 2.00 1.93 2.31 3.93
Agriculture
Africa -0.11 1.13 0.69 0.86 0.90 0.71
East Africa 0.02 0.10 1.11 1.37 1.26 1.19
West Africa -1.18 2.69 1.17 1.95 1.19 1.43
Central Africa 0.66 0.53 0.41 1.05 0.44 0.61
North Africa -0.32 2.34 0.39 -0.03 1.67 -0.04
Southern Africa 0.16 0.30 0.25 0.11 0.19 0.37
Services
Africa 1.94 1.72 2.22 2.48 2.92 2.76
East Africa 1.41 2.15 2.51 3.69 4.14 3.65
West Africa 1.48 1.77 2.14 1.36 2.36 2.06
Central Africa 2.46 1.24 1.40 2.28 1.59 1.95
North Africa 1.94 2.59 2.31 2.84 4.03 3.83
Southern Africa 2.64 0.95 2.41 2.27 2.60 2.58
Manufacturing
Africa 0.54 0.30 0.55 0.48 0.48 1.03
East Africa 0.21 0.34 0.34 0.47 0.36 0.54
West Africa 0.80 0.01 0.55 0.30 0.02 0.32
Central Africa 1.06 0.21 0.74 1.00 0.24 2.31
North Africa 0.43 0.25 0.70 0.29 0.84 0.66
Southern Africa 0.32 0.73 0.53 0.43 1.07 1.70
Source: ECA computations based on World Bank (2008).
