global air navigation services performance report … canso global air navigation services...
TRANSCRIPT

Global Air Navigation Services Performance Report 20162011 - 2015 ANSP Performance Results
Executive Summary
civil air navigation services organisation

The CANSO Global Air Navigation Services Performance Report 2016 is the collective effort of CANSO Member air navigation service providers (ANSP), which participate in this benchmarking effort on a voluntary basis, and covers data from the ANSPs’ 2015 fiscal years and trend data from 2011 - 2015.
Editorial TeamPaul Cripwell - NAV CANADA, Chair Global Benchmarking Workgroup (GBWG)Helios - CANSO Performance Benchmarking Project Team
ContributorsSiree Vatanavigkit, Aeronautical Radio of Thailand (AEROTHAI)Kunthinee Karunratanakul, Aeronautical Radio of Thailand (AEROTHAI)Krishnan Udayabhanu Rao, Airports Authority of India (AAI)Kanhaya Lal, Airports Authority of India (AAI)Nigel Fitzhardinge, Airways New ZealandSibusiso Nkabinde, Air Traffic & Navigation Services (ATNS)Rick Smith, Dubai Air Navigation Services (dans)Aleksandra Damsz, Federal Aviation Administration - Air Traffic Organization (FAA-ATO)Dina Dolan, Federal Aviation Administration - Air Traffic Organization (FAA-ATO)Christopher Gregg, Federal Aviation Administration - Air Traffic Organization (FAA-ATO)Kristin Stadum, Federal Aviation Administration - Air Traffic Organization (FAA-ATO)Yousef Bagis, General Authority of Civil Aviation (GACA)Diana Galgoczi, HungaroControlLivia Cseh, HungaroControlSigurleifur Kristjansson, ISAVIASusumu Hoshino, Japan Air Navigation Service (JANS)Ana Pinto, NAV PortugalMindaugas Gustys, SE Oro NavigacijaJeff Perchard, NAV CANADAAndrea Ivasivka, Civil Air Navigation Services Organisation (CANSO)
DisclaimerThis report has been compiled using data provided by the participating ANSPs. To facilitate comparability, data for each ANSP has been transformed to be consistent with standard definitions. The resulting data and comparisons have been produced solely for the use of ANSPs, and other interested parties, to assess and appraise performance in air navigation services (ANS) provision. It is not intended that the data from this report is used for any wider purpose, nor does the data provide a definitive assessment of any number, cost, time period or other metric relating to any ANSP’s process.
December 2016
Global ANS Performance Report 2016The ANSP View
2
Foreword
The 2016 report is the seventh annual Global Air Navigation Services Performance Report and covers the years 2011 to 2015. It marks the third year of our partnership with Helios, which has worked with CANSO to produce the report. The aim of this report is to help CANSO’s air navigation service provider (ANSP) Members measure their performance and benchmark it against their peers. The report gives a global picture of air traffic management (ATM) using metrics, such as the cost per IFR hour and the productivity of air traffic controllers (ATCOs).
The findings in this report show that some of the trends that were noted in last year’s report did not necessarily continue. Specifically, the majority of ANSPs saw an increase in their cost per IFR flight hour, whereas last year most ANSPs had seen this figure decrease. The main driver for this, and a key takeaway from this year’s report, is the significant number of participating ANSPs which saw an increase in their employment costs in 2015. Some 93 percent of the participating Members saw an increase in their “Unit ATCO in OPS employment cost”, compared to just 53 percent in 2014.
While employment costs increased, it is positive to note that 71 percent of participants managed an increase in ATCO productivity - IFR flight hours per ATCO in OPS hours – compared to just 53 percent in 2014. This was achieved in the context of a continued increase in traffic, with 83 percent of Members reporting an increase in continental IFR flight hours. This tallies with global data which, as last year, shows rising passenger numbers and airport movements. Passenger growth was especially strong, with all regions other than Africa recording growth of over five percent, contributing to a global increase of 6.4 percent.
To maximise the usefulness of the report, it is essential that it evolves and grows. The increasing number of trial metrics (metrics which will be included in the report if and when they have reached sufficient maturity and participation) and the inclusion of submissions from other CANSO workgroups are two of the ways that the report has sought to do this. The value of the report can be enhanced further by increasing participation. We therefore encourage all CANSO ANSP Members to participate, in some capacity, in future iterations of the report.
I would like to thank the CANSO Global Benchmarking Workgroup (GBWG) and Helios for their hard work, and especially all the participating CANSO Members, that made this report possible.
Jeff PooleDirector General CANSO
3
4 Published December 2016 Contents
© CANSO 2016
All rights reserved. No part of this publication may be reproduced, or transmitted in any form, without the prior permission of CANSO. www.canso.org
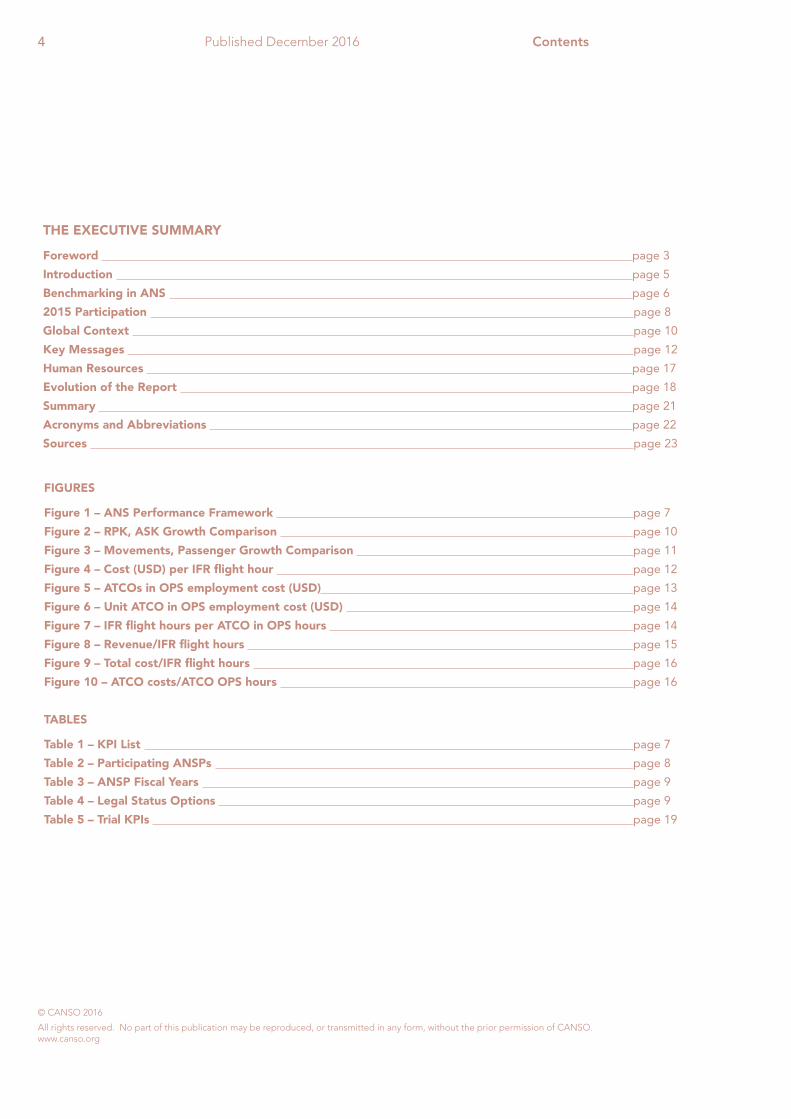
THE EXECUTIVE SUMMARY
Foreword page 3
Introduction page 5
Benchmarking in ANS page 6
2015 Participation page 8
Global Context page 10
Key Messages page 12
Human Resources page 17
Evolution of the Report page 18
Summary page 21
Acronyms and Abbreviations page 22
Sources page 23
FIGURES
Figure 1 – ANS Performance Framework page 7
Figure 2 – RPK, ASK Growth Comparison page 10
Figure 3 – Movements, Passenger Growth Comparison page 11
Figure 4 – Cost (USD) per IFR flight hour page 12
Figure 5 – ATCOs in OPS employment cost (USD) page 13
Figure 6 – Unit ATCO in OPS employment cost (USD) page 14
Figure 7 – IFR flight hours per ATCO in OPS hours page 14
Figure 8 – Revenue/IFR flight hours page 15
Figure 9 – Total cost/IFR flight hours page 16
Figure 10 – ATCO costs/ATCO OPS hours page 16
TABLES
Table 1 – KPI List page 7
Table 2 – Participating ANSPs page 8
Table 3 – ANSP Fiscal Years page 9
Table 4 – Legal Status Options page 9
Table 5 – Trial KPIs page 19
5
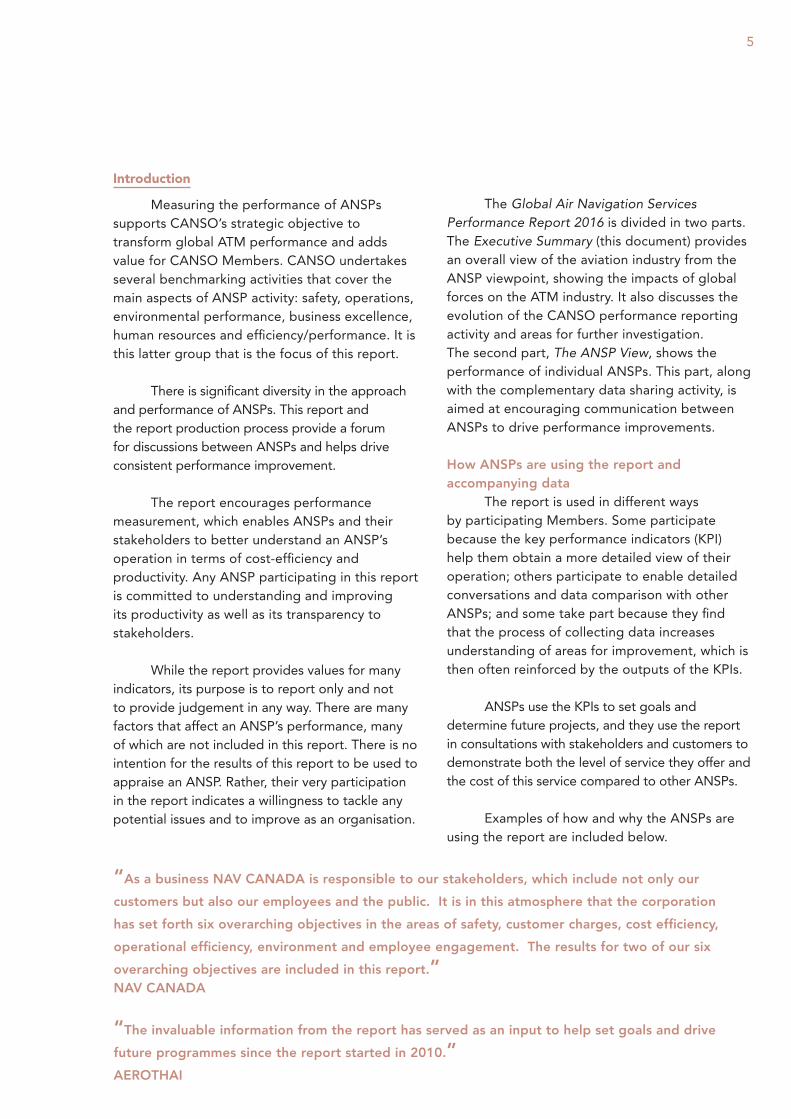
Introduction
Measuring the performance of ANSPs supports CANSO’s strategic objective to transform global ATM performance and adds value for CANSO Members. CANSO undertakes several benchmarking activities that cover the main aspects of ANSP activity: safety, operations, environmental performance, business excellence, human resources and efficiency/performance. It is this latter group that is the focus of this report.
There is significant diversity in the approach and performance of ANSPs. This report and the report production process provide a forum for discussions between ANSPs and helps drive consistent performance improvement.
The report encourages performance measurement, which enables ANSPs and their stakeholders to better understand an ANSP’s operation in terms of cost-efficiency and productivity. Any ANSP participating in this report is committed to understanding and improving its productivity as well as its transparency to stakeholders.
While the report provides values for many indicators, its purpose is to report only and not to provide judgement in any way. There are many factors that affect an ANSP’s performance, many of which are not included in this report. There is no intention for the results of this report to be used to appraise an ANSP. Rather, their very participation in the report indicates a willingness to tackle any potential issues and to improve as an organisation.
The Global Air Navigation Services Performance Report 2016 is divided in two parts. The Executive Summary (this document) provides an overall view of the aviation industry from the ANSP viewpoint, showing the impacts of global forces on the ATM industry. It also discusses the evolution of the CANSO performance reporting activity and areas for further investigation. The second part, The ANSP View, shows the performance of individual ANSPs. This part, along with the complementary data sharing activity, is aimed at encouraging communication between ANSPs to drive performance improvements.
How ANSPs are using the report and accompanying data
The report is used in different ways by participating Members. Some participate because the key performance indicators (KPI) help them obtain a more detailed view of their operation; others participate to enable detailed conversations and data comparison with other ANSPs; and some take part because they find that the process of collecting data increases understanding of areas for improvement, which is then often reinforced by the outputs of the KPIs.
ANSPs use the KPIs to set goals and determine future projects, and they use the report in consultations with stakeholders and customers to demonstrate both the level of service they offer and the cost of this service compared to other ANSPs.
Examples of how and why the ANSPs are using the report are included below.
“As a business NAV CANADA is responsible to our stakeholders, which include not only our
customers but also our employees and the public. It is in this atmosphere that the corporation
has set forth six overarching objectives in the areas of safety, customer charges, cost efficiency,
operational efficiency, environment and employee engagement. The results for two of our six
overarching objectives are included in this report.”NAV CANADA
“The invaluable information from the report has served as an input to help set goals and drive
future programmes since the report started in 2010.”AEROTHAI

Benchmarking in air navigation services
Benchmarking The goal of benchmarking – both within
this report, and as a practice in general – is to compare the business processes of one organisation with another. We use performance metrics to help build a comprehensive picture of industry best practices and results. Ideally, benchmarking should also allow for comparison between industries, although clearly there are aspects of the aviation industry that make it unique – for example air traffic control officer (ATCO) productivity is not something that can easily be compared across industries.
Benchmarking ANSPsIt is acknowledged that there is no
comparison to other industries in this report. Similarly, this report does not seek to compare the results of various ANSPs to a ‘best-in-class’. Rather, the focus of this report is to identify trends within the industry as well as acting as a launch pad for ANSP operational improvement by identifying areas of concern, providing initial guidance as to the source and providing a forum for ANSP discussion.
When benchmarking ANSPs, it is important to separate different areas of performance, while still acknowledging their interlinked nature. Each ANSP is trying to balance safety with the often-conflicting priorities of cost efficiency and capacity provision. While this report focuses on cost efficiency, it is recognised that each ANSP has other priorities and it is planned to include a more quantifiable picture of these areas in future versions of this report. The areas that are targeted for inclusion in future versions are safety, operations, and human resources.
Each ANSP is subject to a variety of local, regional and global factors – many of which are outside their control – which means that drawing conclusions from performance data for a particular year must be treated with caution. This report includes Purchasing Power Parity (PPP) as
6 Global ANS Performance Report 2016Executive Summary
one mechanism to allow for a more meaningful comparison of employment costs between countries. There are other limitations that should be considered when comparing performance including national regulations and investment.
Another method used to reduce the impact of external factors is through trend analysis. This reduces the emphasis on an individual ANSP’s performance in a single year and focuses on the changes over several years. These individual trends will show an overall trend for the performance of the industry, indicating in which direction the industry is moving overall. Clearly, the more ANSPs that participate in this activity, the more complete a reflection of the industry these trends will show, while removing the potentially skewing effects of outliers such as the impact of volcanic ash, industrial action, or major aviation incidents. Trend analysis primarily requires each ANSP to be consistent with its data collection for legitimate conclusions to be drawn, while there is more emphasis on accuracy when comparing individual ANSP performance. This is discussed in more detail in later sections of the report. The requirement for accuracy and consistency in data collection is emphasised to all ANSPs during the data submission process each year.
The key performance indicators (KPIs) in the report are all part of the CANSO ANS Performance Framework which is illustrated on the next page. This has been constant over the past versions of the report; however, as will be discussed later in this section, the GBWG has been working on expanding this framework.

7
Table 1: KPI List
Figure 1: ANS Performance Framework1
KPI Reason for tracking this KPI
1 To give an overview of the cost-efficiency of an ANSP
2A To look at the employment costs of each ANSP – a key driver in cost-efficiency
2B This couples with 2A to show the drivers behind changes in ATCO cost-efficiency
2CTo try to obtain a more complete picture of ANSP costs – 2C may be broken down into more level 3 indicators in future reports
3A This couples with 3B to show the drivers of changes in 2A
3BThis couples with 3A to show the drivers of changes in 2A, and with 3C to show the drivers of changes in 2B
3C This couples with 3B to show the drivers of changes in 2B
1 The change in 2C from last year’s report is not indicative of any new metrics in this year’s report. It shows the
intended breakdown of the 2C indicator into Level 3 KPIs, to be introduced in future reports.
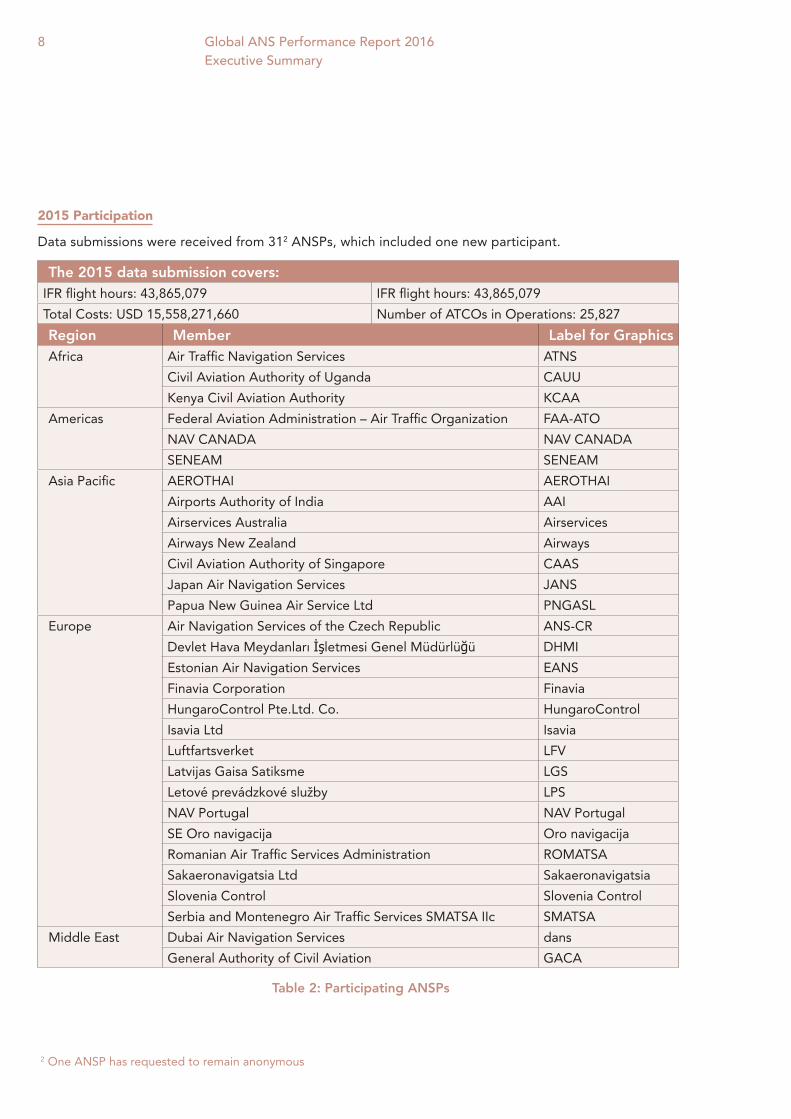
2 One ANSP has requested to remain anonymous
8 Global ANS Performance Report 2016Executive Summary
Region Member Label for GraphicsAfrica Air Traffic Navigation Services ATNS
Civil Aviation Authority of Uganda CAUU
Kenya Civil Aviation Authority KCAA
Americas Federal Aviation Administration – Air Traffic Organization FAA-ATO
NAV CANADA NAV CANADA
SENEAM SENEAM
Asia Pacific AEROTHAI AEROTHAI
Airports Authority of India AAI
Airservices Australia Airservices
Airways New Zealand Airways
Civil Aviation Authority of Singapore CAAS
Japan Air Navigation Services JANS
Papua New Guinea Air Service Ltd PNGASL
Europe Air Navigation Services of the Czech Republic ANS-CR
Devlet Hava Meydanları İşletmesi Genel Müdürlüğü DHMI
Estonian Air Navigation Services EANS
Finavia Corporation Finavia
HungaroControl Pte.Ltd. Co. HungaroControl
Isavia Ltd Isavia
Luftfartsverket LFV
Latvijas Gaisa Satiksme LGS
Letové prevádzkové služby LPS
NAV Portugal NAV Portugal
SE Oro navigacija Oro navigacija
Romanian Air Traffic Services Administration ROMATSA
Sakaeronavigatsia Ltd Sakaeronavigatsia
Slovenia Control Slovenia Control
Serbia and Montenegro Air Traffic Services SMATSA IIc SMATSA
Middle East Dubai Air Navigation Services dans
General Authority of Civil Aviation GACA
The 2015 data submission covers:IFR flight hours: 43,865,079 IFR flight hours: 43,865,079
Total Costs: USD 15,558,271,660 Number of ATCOs in Operations: 25,827
2015 Participation
Data submissions were received from 312 ANSPs, which included one new participant.
Table 2: Participating ANSPs
9
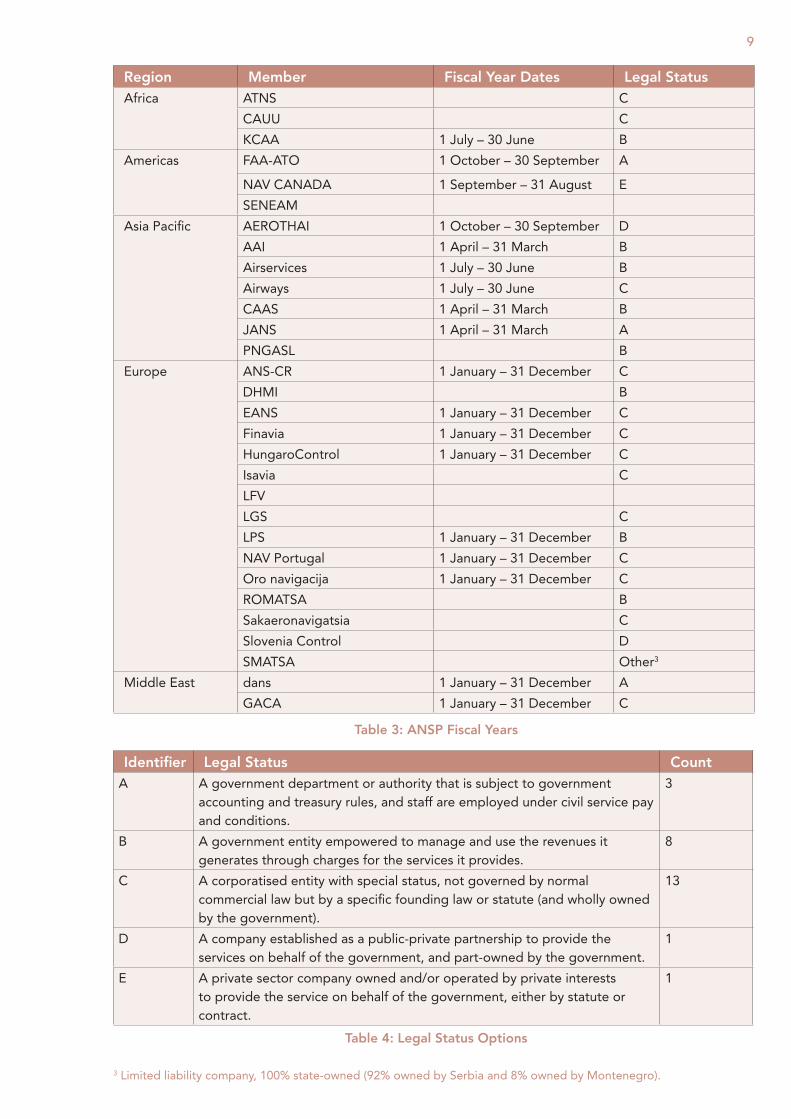
Table 3: ANSP Fiscal Years
Region Member Fiscal Year Dates Legal StatusAfrica ATNS C
CAUU C
KCAA 1 July – 30 June B
Americas FAA-ATO 1 October – 30 September A
NAV CANADA 1 September – 31 August E
SENEAM
Asia Pacific AEROTHAI 1 October – 30 September D
AAI 1 April – 31 March B
Airservices 1 July – 30 June B
Airways 1 July – 30 June C
CAAS 1 April – 31 March B
JANS 1 April – 31 March A
PNGASL B
Europe ANS-CR 1 January – 31 December C
DHMI B
EANS 1 January – 31 December C
Finavia 1 January – 31 December C
HungaroControl 1 January – 31 December C
Isavia C
LFV
LGS C
LPS 1 January – 31 December B
NAV Portugal 1 January – 31 December C
Oro navigacija 1 January – 31 December C
ROMATSA B
Sakaeronavigatsia C
Slovenia Control D
SMATSA Other3
Middle East dans 1 January – 31 December A
GACA 1 January – 31 December C
Identifier Legal Status CountA A government department or authority that is subject to government
accounting and treasury rules, and staff are employed under civil service pay and conditions.
3
B A government entity empowered to manage and use the revenues it generates through charges for the services it provides.
8
C A corporatised entity with special status, not governed by normal commercial law but by a specific founding law or statute (and wholly owned by the government).
13
D A company established as a public-private partnership to provide the services on behalf of the government, and part-owned by the government.
1
E A private sector company owned and/or operated by private interests to provide the service on behalf of the government, either by statute or contract.
1
Table 4: Legal Status Options
3 Limited liability company, 100% state-owned (92% owned by Serbia and 8% owned by Montenegro).

10 Global ANS Performance Report 2016Executive Summary
Global Context
The story of global aviation this year is complicated. While for the first time the number of passengers rose above 3.5 billion, there is some uncertainty due to fluctuating exchange rates and low oil prices, which have led to unease at the stability of the recovery that was discussed last year. This unease could explain the fact that, for the fourth consecutive year, Revenue Passenger Kilometres (RPK) grew at a faster rate than Available Seat Kilometres (ASK) leading to an all-time high passenger load factor of 80.4 percent as reported by the International Air Transport Association (IATA) – indicating that investment in extra capacity is not being made at the same rate that passenger load is increasing. There is only one region, the Middle East, where the capacity increase exceeded the growth in passenger traffic. It should be noted that, in all regions except Europe and Africa, seat capacity increased at a greater rate than last year.
The increase in passengers, represented here by the increase in RPK, is not as relevant for an ANSP as the increase in ASK – which is to say the increase in the number of flights and the increase in the size of aircraft – that an ANSP must account for. The increase in the number of passengers is of significantly greater interest to airlines and airports,
though, of course, increases in ASK necessitate an increase in the number of RPK and hence the number of movements.
In 2015, the average price of a barrel of jet fuel dropped from USD114.8 to USD66.7, resulting in a decrease in total expenditure of USD45 billion to USD181 billion. Airlines’ expenditure on fuel fell from 31.6 percent to 27.5 percent. However, the decline in jet fuel prices did not lead to profit increases across the industry, as the benefits were not felt across airlines and regions uniformly. There are several reasons for this; a significant one is the strength of the US dollar in 2015, especially against certain currencies from countries that export a significant amount of oil, such as Brazil and Russia. The relative exchange rates often offset the benefits, for the airlines, of the lower prices of oil.
That being said, 2015 was a record year for global airlines as they posted their strongest financial performance to date. The USD35.3 billion net after-tax profit that the industry generated was almost more than double that in 2014. The corresponding operating margin of 8.3 percent of revenue was also a record for the industry, up from 4.7 percent in 2014 and almost three times that achieved in 2012.
Figure 2: RPK, ASK Growth Comparison

11
Aviation plays a key role in the wider economy and is essential for both global trade and tourism. The lower transport costs and ever improving connectivity around the world have been significant boosts to these sectors. IATA has estimated that USD5.7 trillion of international trade was shipped by air in 2015. In addition, tourists travelling by air spent approximately USD620 billion in 2015. While these values are lower than 2014, it should be mentioned that the strong US Dollar is a significant factor.
Finally, the Air Transport Action Group’s (ATAG) 2016 publication Aviation: Benefits Beyond Borders states that global aviation supports 62.7 million jobs and generates USD2.7 trillion in gross domestic product (GDP). Not only does air transport provide significant economic benefits, it also plays a major role in business, as well as allowing people to travel for leisure, educational opportunities, immigration and cultural exchange. For example, 54 percent of international tourists – 35 percent of international trade by value – travel by air.
Airports Council International (ACI), which recorded information from 2,300 commercial airports across the six global regions, saw worldwide aircraft movements at these airports increase 2 percent in 2015 to 88.5 million, up from the 1.3 percent growth seen in 2014. This was primarily driven by large increases in movements in Asia Pacific and the Middle East. This continued a
trend noted in last year’s report that, despite the uncertainty created by falling oil prices, the growth of the aviation industry in these regions continues.
North America and Europe remained the largest traffic areas by movements, with Europe continuing to build on last year’s recovery and airport movements in North America rising after declining in 2014. In terms of passengers, the outlook was almost universally positive with a global increase of 6.4 percent. However, in contrast to the other regions, Africa experienced decreases in annual movements, while the number of passengers remained approximately constant. Reasons for this include the fact that several countries in the region have economies with decreasing oil revenues, and factors such as the Ebola epidemic and political unrest. The combination of these factors will have disrupted services and restricted airport development in the region, thus reducing the number of movements and passengers.
The figures described in this section will interest ANSPs, and while the headlines from the year will be the record load factors on aircraft, the increased profits for airlines and the record number of passengers, these do not directly impact ANSPs. In fact, ANSPs will see such a small relative change – in terms of movements – bearing in mind these record numbers. However, ANSPs will be significantly affected in the regions with the largest movement increases.
Figure 3: Movements, Passenger Growth Comparison
12 Global ANS Performance Report 2016Executive Summary
Key messages
Key messages from the ANSP viewAs may be expected, in a year marked
by a combination of rising passenger numbers, lower oil prices and economic uncertainty in many parts of the world, the metrics in the report, for the participating members, are mixed. There are several metrics where approximately half of the participating ANSPs have seen increases since last year while the other half of ANSPs have lower results. However, these can be compared to results from the previous year to see if the trends identified in the 2015 report have continued.
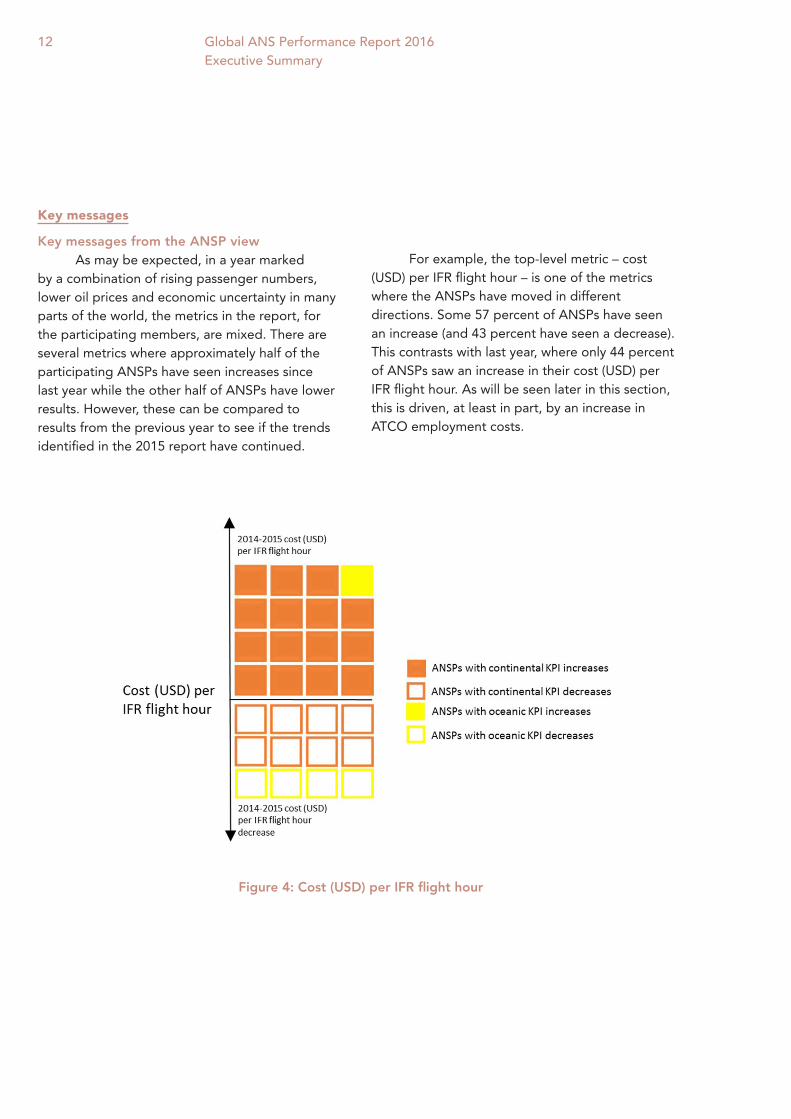
For example, the top-level metric – cost (USD) per IFR flight hour – is one of the metrics where the ANSPs have moved in different directions. Some 57 percent of ANSPs have seen an increase (and 43 percent have seen a decrease). This contrasts with last year, where only 44 percent of ANSPs saw an increase in their cost (USD) per IFR flight hour. As will be seen later in this section, this is driven, at least in part, by an increase in ATCO employment costs.
Figure 4: Cost (USD) per IFR flight hour

13
While there is significant variety in the overarching metric, ‘ATCOs in OPS employment cost per ATCO hour’ increased for all but three of the participating ANSPs. In fact, 64 percent of these ANSPs saw an increase in this metric of over 5 percent. This aptly demonstrates one of the key challenges faced by ANSPs, which is balancing the ‘Cost per IFR flight hour’ – which is affected by several external factors – with the fact that employment costs continue to rise.
One point of note to emerge from this year’s data is that ‘ATCOs in OPS employment costs per ATCO hour’, when converted using PPP, were within a single standard deviation of the mean for all but seven ANSPs and within 1.5 standard deviations for all but three. This demonstrates that, despite the fact the raw data seems to imply different levels of costs being faced; ATCO employment cost is an issue of a similar size and
scale for almost all the participating ANSPs. The full details of this can be found in The ANSP View in figures 5 and 6.
‘ATCOs in OPS employment cost per ATCO hour’ is calculated by dividing the ‘Unit ATCOs in OPS employment cost’ by the ‘Annual working hours per ATCOs in OPS’.
An examination of these metrics reveals the driving force behind the increase of the ‘ATCOs in employment cost per ATCO hour’. All but two of the participating ANSPs saw an increase in their ‘Unit ATCO in OPS employment cost (USD)’, whereas the results for ‘Annual Working hours per ATCO in operations’ were very divided. Some 44 percent of participants saw a decrease in the metric; 41 percent an increase; with the remaining ANSPs having no change at all. This drove the increases seen above.
Figure 5: ATCOs in OPS employment cost per ATCO hour
14 Global ANS Performance Report 2016Executive Summary
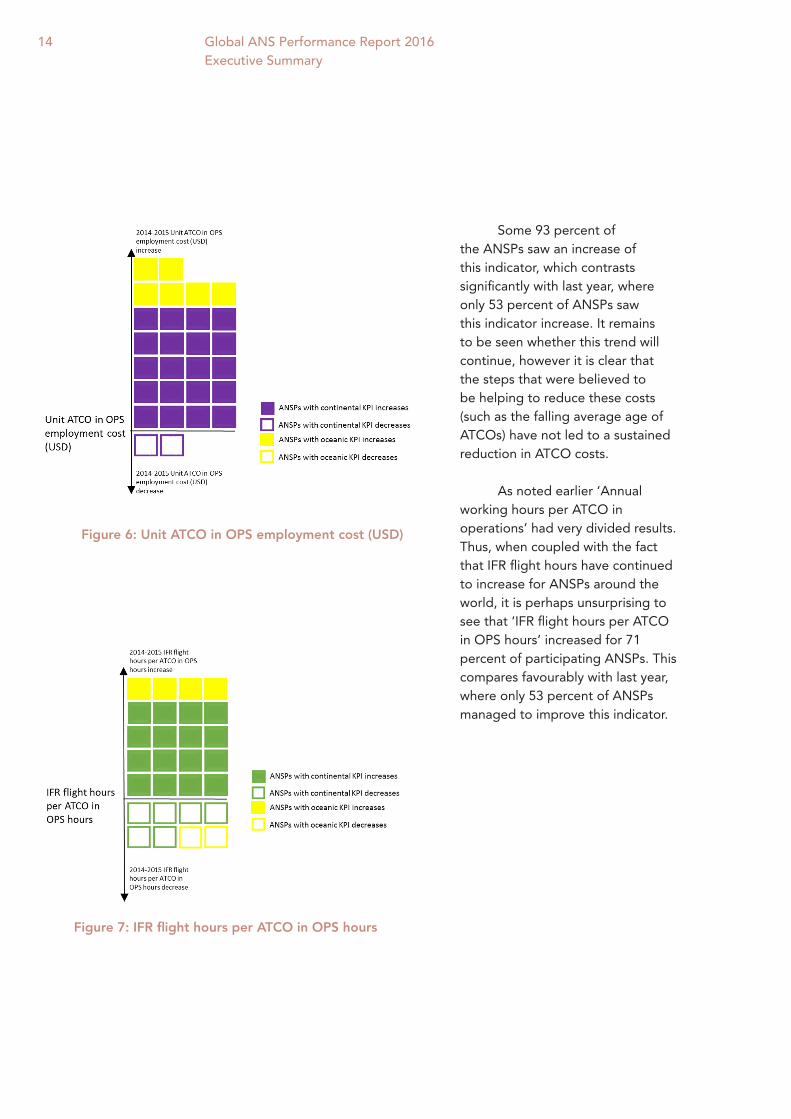
Some 93 percent of the ANSPs saw an increase of this indicator, which contrasts significantly with last year, where only 53 percent of ANSPs saw this indicator increase. It remains to be seen whether this trend will continue, however it is clear that the steps that were believed to be helping to reduce these costs (such as the falling average age of ATCOs) have not led to a sustained reduction in ATCO costs.
As noted earlier ‘Annual working hours per ATCO in operations’ had very divided results. Thus, when coupled with the fact that IFR flight hours have continued to increase for ANSPs around the world, it is perhaps unsurprising to see that ‘IFR flight hours per ATCO in OPS hours’ increased for 71 percent of participating ANSPs. This compares favourably with last year, where only 53 percent of ANSPs managed to improve this indicator.
Figure 6: Unit ATCO in OPS employment cost (USD)
Figure 7: IFR flight hours per ATCO in OPS hours
15
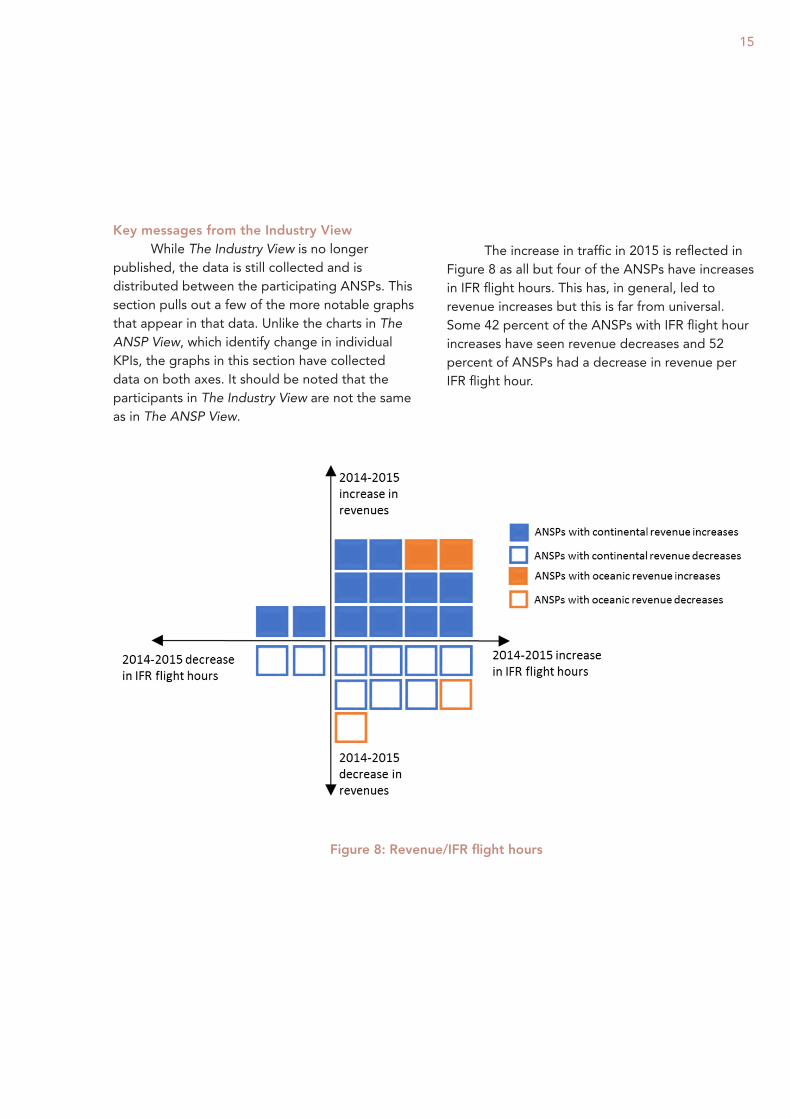
Key messages from the Industry ViewWhile The Industry View is no longer
published, the data is still collected and is distributed between the participating ANSPs. This section pulls out a few of the more notable graphs that appear in that data. Unlike the charts in The ANSP View, which identify change in individual KPIs, the graphs in this section have collected data on both axes. It should be noted that the participants in The Industry View are not the same as in The ANSP View.
The increase in traffic in 2015 is reflected in Figure 8 as all but four of the ANSPs have increases in IFR flight hours. This has, in general, led to revenue increases but this is far from universal. Some 42 percent of the ANSPs with IFR flight hour increases have seen revenue decreases and 52 percent of ANSPs had a decrease in revenue per IFR flight hour.
Figure 8: Revenue/IFR flight hours

Figure 9: Total cost/IFR flight hours)
16 Global ANS Performance Report 2016Executive Summary
Figure 9 and Figure 10 reinforce the picture we have from The ANSP View. The majority of ANSPs – 81 percent – have seen an increase in total costs and, although the large majority have seen this increase in the context of increasing IFR flight hours, 15 percent of ANSPs saw their total cost increase while their IFR flight hours decreased.
The total cost increase is driven, at least in part, by the fact that for the clear majority of ANSPs, ATCO costs continue to rise. In fact, the dataset provided to the ANSPs demonstrates that only two ANSPs decreased their ‘ATCO cost per ATCO in OPS hour’ between 2014 and 2015, and for 29 percent of ANSPs, ATCO costs have increased despite a reduction in ATCO OPS hours.
Figure 10: ATCO costs/ATCO OPS hours

17
Human Resources
The CANSO Human Resources Workgroup (HRWG) collects data and issues a report every two years. We are therefore including the findings from 2015 as no data collection took place in 2016.
Executive Summary The CANSO ATCO Remuneration and HR Metrics Report 2015 incorporates the results of the sixth
CANSO ATCO Remuneration Survey and the third Human Resources (HR) Metrics Survey. The full version of the report is provided to CANSO Members that provided data for the report. CANSO Members that did not provide data can obtain the de-identified summary version of the report.
The key results from the survey are as follows: — 21 ANSPs responded to the survey
— There is an increase in the number of ATCOs under the age of 30 and a decrease in the number of ATCOs over age 50
— The ratio of male to female ATCOs is 5:1
— The number of ATCOs employed in ANSPs ranged from 48 to 14,059 with an average ATCO headcount of 1,244
— 90 percent of respondents pay students while in training and the duration of training ranges from 10 to 44 months. The average failure rate is 30 percent
— Average ATCO salary is around 3.6 times higher than the average industrial wage
— There has been a reduction in the number of defined benefit pension schemes. In addition, employers’ pension contributions range from three percent to 100 percent
— There has been a reduction in the average pay of controllers, which may be driven in part by a change in profile of respondents to this study
— Average turnover of controllers in this study is 3.24% per annum
— Over half of respondents plan to increase pay in 2015
— Majority of respondents have a mandatory retirement age of 60
— Average annual leave for ATCOs is 32 days
— Average working week for ATCOs is 37.4 hours
— 38 percent of respondents have an income protection plan in place for ATCOs
— Between 3.5 percent and 15 percent of a controller’s time is spent on non-operational duties
18 Global ANS Performance Report 2016Executive Summary
Evolution of the report
Last year there were five areas identified as crucial to the future evolution of the report:
Consistency: The continued development of a consistent data set based on well understood and globally applicable data definitions.
Context: Understanding and, where possible, accounting for the impact of external factors in performance analysis.
Scope: Broadening the areas of performance covered in the report to include, for example, safety and flight efficiency. Ideally a complete picture of performance would also include factors that impact customers such as ANS charges and delay costs as well as predictability4.
Focus on key issues: Analysis of the key issues, for ANSPs across all five regions, in addition to the presentation of the data.
Participation: Greater participation allows more robust evaluation of industry trends and discussion of regional performance and its context. Increased participation also increases the value of the internal data-sharing activity between participants.
Since last year, the approach has been altered and there are now four key areas which are the focus for the evolution of the report in future years:
Consistency: The understanding of what it means to be consistent is crucial to the ongoing success of the report. There are two levels of consistency. The first is that an individual ANSP must be consistent with how it collects data, year-on-year; this will come from having a consistent set of data definitions and systems that collect and report the data which ensures the validity of the trend data in the latter section of the report. It is recognised that ANSPs may alter their internal data collection
methodologies from time to time. This may create a discontinuity in the report data and metrics and, where appropriate, the ANSP is requested to identify such a break and comment accordingly. The second is consistency of data collection between ANSPs; this is more difficult to achieve, especially given the fundamental differences between some ANSPs, their governance structure and the regulations under which they each operate. However, constant communication between the ANSPs, for example at the GBWG meetings, plays a key role in achieving this.
Depth: This replaces the ‘Context’ and ‘Focus on key issues’ areas from last year. It is important to increase the level of detail that is contained in the report and this will primarily be achieved by increasing the number of focussed KPIs. This should allow greater understanding of the drivers of the high-level trends, which in turn will drive the analysis and key messages of the report.
Scope: The overarching goal of this report is to provide an all-encompassing picture of global ANSPs. To achieve this, the scope of the report must be broader. This will require collaboration with the other CANSO workgroups and committees. For example, any section on safety would be produced by the Safety Standing Committee and its relevant workgroups.
Participation: For this report to be able to fulfil its aims it is crucial that Member participation is as high as possible. There are several levels of participation:
— Completing the data submission workbook each year
— Providing input to the Workgroup through comments on the report as well as any working documents from meetings, including the agenda and minutes
— Attendance at the biannual meetings; participation from all CANSO regions is encouraged
4 The importance of the ‘total economic’ view of ANS including all the impacts of costs and quality of service on users
is increasingly acknowledged within the industry.

19
It is important once engaged, that ANSPs receive the support and direction they require to accurately and comprehensively submit data. This must be provided by Members which act as mentors, and support from Helios. The benefits of higher participation are manifold, including making the output data more robust and the ability to produce more tailored analysis based, for example, on ANSP region or size.
A Word on TechnologyThere are currently no plans to include
separate technology metrics; however, the intention is to track the introduction of technologies to see if they have a notable impact on the metrics, for example the impact of remote air traffic control towers.
Aviation System Block UpgradesSince 2013, ICAO has implemented the
2013-2028 Global Air Navigation Plan (GANP). The GANP is a long-term plan for improving capacity, efficiency, and interoperability of global air navigation systems while also improving safety. GANP includes the Aviation System Block Upgrades (ASBU). The GANP itself is a high-
level plan that gives overall direction to the aviation industry, and the ASBU is a more detailed specification, in terms of blocks and modules, for states and regions to implement. Many countries and regions are investing in improvement programmes related to the ASBU, including SESAR in Europe, NextGen in the United States, CARATS in Japan and SIRIUS in Brazil. These programmes allow ANSPs to improve their capacity and efficiency and, in turn, productivity. However, there is a high initial cost for these projects. It will be interesting to follow both the costs of these projects, and their potential benefits.
New KPIsEach year the authors examine the available
data and metrics and determine if new key performance indicators (KPIs) are ready for the public report. For this year’s report, while new data has been collected in many areas, there are no new metrics that are sufficiently mature to be added to the report. All participating ANSPs will have access to the trial KPI data for their own review and analysis.
The additional trial KPIs that will be included in the next ANSP submission book are:
KPI Title Formula Reason for introduction
En-route ATCO productivity En-route IFR hours–––––––––––––––––––En-route ATCO hours
In the 2015 report ATCO productivity was discussed in some detail. These KPIs would allow analysis in greater detail, which would hopefully also allow ANSPs to make performance improvements by highlighting any areas of concern.
Approach5 ATCO productivity
Approach IFR hours–––––––––––––––––––
Approach ATCO hours
Approach ATCO productivity - movements
IFR movements–––––––––––––––––––
Approach ATCO hours
Tower ATCO productivity - movements
IFR movements–––––––––––––––––––Tower ATCO hours
5 Approach IFR hours is best calculated directly, but it is recognised that this is not always possible. An approved
alternate calculation was defined as multiplying the number of tower movements by 12.5 minutes. This value was
agreed upon at the April GBWG meeting in Bangkok, after a discussion on an approximation of the time each
tower movement was in approach between the present members. The en-route figure is calculated by subtracting
the Approach IFR hours from the Total IFR hours.
20 Global ANS Performance Report 2016Executive Summary
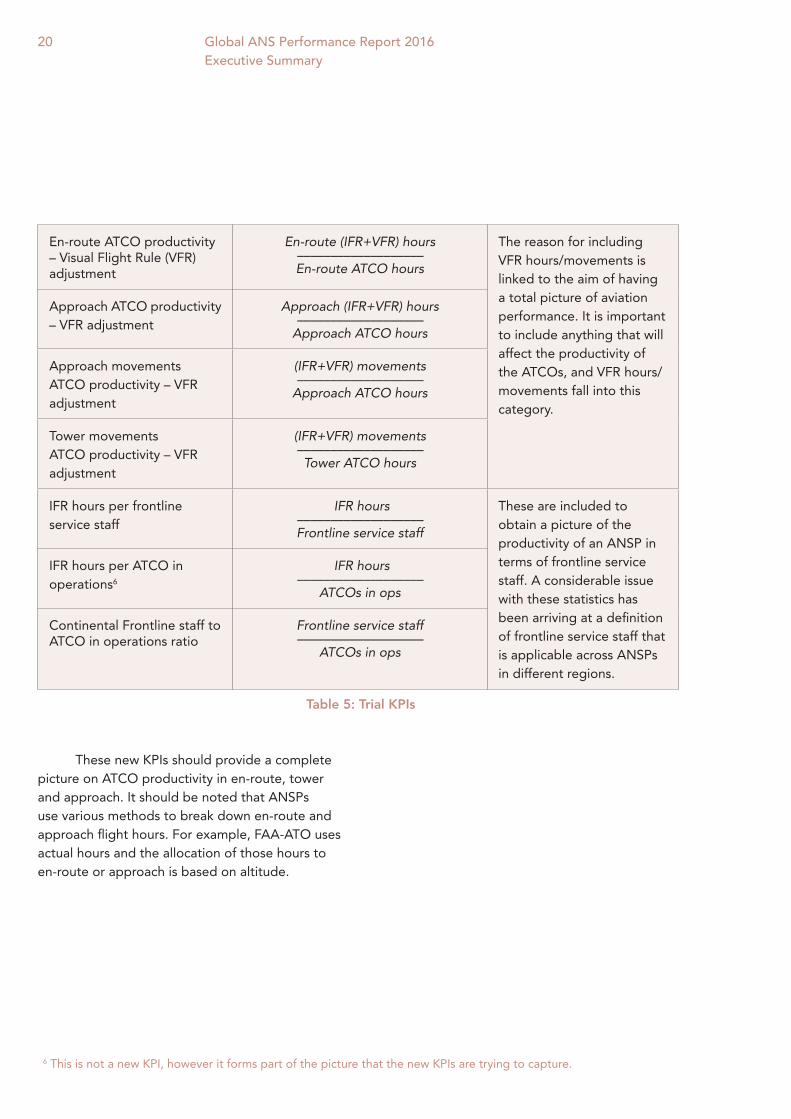
En-route ATCO productivity – Visual Flight Rule (VFR) adjustment
En-route (IFR+VFR) hours–––––––––––––––––––En-route ATCO hours
The reason for including VFR hours/movements is linked to the aim of having a total picture of aviation performance. It is important to include anything that will affect the productivity of the ATCOs, and VFR hours/movements fall into this category.
Approach ATCO productivity – VFR adjustment
Approach (IFR+VFR) hours–––––––––––––––––––
Approach ATCO hours
Approach movements ATCO productivity – VFR adjustment
(IFR+VFR) movements–––––––––––––––––––
Approach ATCO hours
Tower movements ATCO productivity – VFR adjustment
(IFR+VFR) movements–––––––––––––––––––Tower ATCO hours
IFR hours per frontline service staff
IFR hours–––––––––––––––––––Frontline service staff
These are included to obtain a picture of the productivity of an ANSP in terms of frontline service staff. A considerable issue with these statistics has been arriving at a definition of frontline service staff that is applicable across ANSPs in different regions.
IFR hours per ATCO in operations6
IFR hours–––––––––––––––––––
ATCOs in ops
Continental Frontline staff to ATCO in operations ratio
Frontline service staff–––––––––––––––––––
ATCOs in ops
These new KPIs should provide a complete picture on ATCO productivity in en-route, tower and approach. It should be noted that ANSPs use various methods to break down en-route and approach flight hours. For example, FAA-ATO uses actual hours and the allocation of those hours to en-route or approach is based on altitude.
Table 5: Trial KPIs
6 This is not a new KPI, however it forms part of the picture that the new KPIs are trying to capture.
21
Summary
This report examines the direction in which the ATM industry is moving, as well as identifying areas for concern or where improvements could be made, while providing a forum for discussion between participating ANSPs. It is still developing and evolving with each year’s edition to maximise its value to participating ANSPs and readers. This year we have chosen to revise the structure of the report, removing The Industry View section. The key messages of that data are instead highlighted in the Executive Summary, which is supported by The ANSP View, covering the collected data in greater detail. A full dataset is provided to the participating ANSPs.
2015 has not followed the same pattern as 2013 and 2014. The key trends of 2013 and 2014 were rising traffic and improved efficiency. While traffic has continued to rise, with 83 percent of participating ANSPs experienced an increase in traffic, this year 57 percent of ANSPs experienced an increase in cost per IFR flight hour – as opposed to last year where 56 percent of ANSPs reported a drop in this statistic. It seems clear that a major contributor to this increase is the continued rise in ATCO employment costs. This year 93 percent of ANSPs reported an increase in ‘Unit ATCO in OPS employment cost’.
However, to sound a more positive note, ATCO productivity (or more specifically ‘IFR flight hours per ATCO in OPS hour’) increased for a significant number (71 percent) of participating ANSPs. In addition, the fact that the number of ANSPs with increases in cost per IFR flight hour was so much smaller than the number which saw an increase in employment costs, indicates that there are several ANSPs which are improving their cost efficiency despite these costs.
The Members’ data are in line with the global trends showing rising passenger numbers
(+6.4 percent) and airport movements (+2.0 percent). While all regions, other than Africa, experienced growth of above five percent in terms of number of passengers, the increases, especially in terms of movements, were driven, to a large extent, by the continued growth in Asia Pacific and the Middle East.
Finally, it was a record-breaking year for the aviation industry in some respects as, for the first time the number of global passengers passed 3.5 billion, the load factor of aircrafts was above 80 percent and the airlines’ operating margin was above eight percent.

22 Global ANS Performance Report 2016Executive Summary
Acronyms and abbreviations
ACI Airports Council International
ANS Air navigation services
ANSP Air navigation service provider
APP Approach control
ASBU Aviation System Block Upgrades
ASK Available Seat Kilometres
ATAG Air Transport Action Group
ATCO Air traffic control officer
ATM Air traffic management
CAA Civil Aviation Authority
CANSO Civil Air Navigation Services Organisation
GANP Global Air Navigation Plan
GBWG Global Benchmarking Workgroup
GDP Gross domestic product
HR Human resources
HRWG Human Resources Workgroup
IATA International Air Transport Association
IFR Instrument Flight Rules
KPI Key performance indicator
PPP Purchasing power parity
RPK Revenue Passenger Kilometres
SESAR Single European Sky ATM Research
SSC Safety Standing Committee
TWR Tower control
USD United States Dollar
VFR Visual flight rules

23
Sources
iata.org/pressroom/facts_figures/fact_sheets/Documents/fact-sheet-industry-facts.pdf
iata.org/publications/Documents/iata-annual-review-2016.pdf
atag.org/facts-and-figures.html
aviationbenefits.org
aci.aero/News/Releases/Most-Recent/2016/09/09/Airports-Council-International-releases-2015-World-Airport-Traffic-Report-The-busiest-become-busier-the-year-of-the-international-hub-airport
canso.org/vision-2020
icao.int/publications/Documents/9750_4ed_en.pdf
icao.int/airnavigation/Documents/ASBU_2016-FINAL.pdf

Full Members - 89 — Aeronautical Radio of Thailand (AEROTHAI) — Aeroportos de Moçambique — Air Navigation and Weather Services,
CAA (ANWS) — Air Navigation Services Agency of Kosovo — Air Navigation Services of the Czech Republic
(ANS Czech Republic) — AirNav Indonesia — Air Traffic & Navigation Services (ATNS) — Airports and Aviation Services Limited (AASL) — Airports Authority of India (AAI) — Airports Fiji Limited — Airservices Australia — Airways New Zealand — Albcontrol — Austro Control — Avinor AS — AZANS Azerbaijan — Belgocontrol — Bulgarian Air Traffic Services Authority
(BULATSA) — CAA Uganda — Cambodia Air Traffic Services Co., Ltd. (CATS) — Civil Aviation Authority of Bangladesh (CAAB) — Civil Aviation Authority of Botswana — Civil Aviation Authority of Mongolia — Civil Aviation Authority of Nepal (CAAN) — Civil Aviation Authority of Singapore (CAAS) — Civil Aviation Authority of the Philippines — Civil Aviation Department (CAD Hong Kong) — Civil Aviation Regulatory Commission (CARC) — COCESNA — Croatia Control Ltd — DCA Myanmar — Department of Airspace Control (DECEA) — Department of Civil Aviation, Republic of Cyprus — DFS Deutsche Flugsicherung GmbH (DFS) — Dirección General de Control de Tránsito Aéreo
(DGCTA) — DSNA France — Dubai Air Navigation Services (DANS) — Dutch Caribbean Air Navigation Service Provider
(DC-ANSP) — ENAV S.p.A: Società Nazionale per l’Assistenza
al Volo — Empresa Argentina de Navegación (EANA) — ENAIRE — Estonian Air Navigation Services (EANS) — Federal Aviation Administration (FAA) — Finavia Corporation — General Authority of Civil Aviation (GACA) — Ghana Civil Aviation Authority (GCAA) — HungaroControl Pte. Ltd. Co. — Instituto Dominicano de Aviacion Civil (IDAC) — Israel Airports Authority (IAA) — Irish Aviation Authority (IAA) — ISAVIA Ltd — Japan Air Navigation Service (JANS) — Kazaeronavigatsia
CANSO Members
Membership list correct as of 19 December 2016. For the most up-to-date list and organisation profiles go to canso.org/canso-members
— Kenya Civil Aviation Authority (KCAA) — Latvijas Gaisa Satiksme (LGS) — Letové prevádzkové Služby Slovenskej Republiky,
Štátny Podnik — Luchtverkeersleiding Nederland (LVNL) — Luxembourg ANA — Maldives Airports Company Limited (MACL) — Malta Air Traffic Services (MATS) — National Airports Corporation Ltd. — National Air Navigation Services Company
(NANSC) — NATS UK — NAV CANADA — NAV Portugal — Naviair — Nigerian Airspace Management Agency (NAMA) — Office National de LÁviation Civile (OFNAC) — Office National Des Aéroports (ONDA) — ORO NAVIGACIJA, Lithuania — PNG Air Services Limited (PNGASL) — Polish Air Navigation Services Agency (PANSA) — Public Authority for Civil Aviation - Oman (PACA) — ROMATSA — Sakaeronavigatsia Ltd — SENEAM — Serbia and Montenegro Air Traffic Services
Agency (SMATSA) — Serco — skyguide — Slovenia Control — State Airports Authority & ANSP (DHMI) — Sudan Air Navigation Services Department — Swaziland Civil Aviation Authority — Tanzania Civil Aviation Authority — Trinidad and Tobago CAA — The LFV Group — Ukrainian Air Traffic Service Enterprise (UkSATSE) — U.S. DoD Policy Board on Federal Aviation — Viet Nam Air Traffic Management Corporation
(VATM)
Gold Associate Members - 11 — Anhui Sun Create Electronics Co., Ltd. — Boeing — FREQUENTIS AG — GroupEAD Europe S.L. — Harris Corporation — Inmarsat Plc — Leidos — Leonardo S.p.a. — NAVBLUE — Raytheon — Thales
Silver Associate Members - 68 — 42 Solutions B.V. — Adacel Inc. — Aeronav Inc. — Aireon
— Air Traffic Control Association (ATCA) — Airbus Defence and Space — ALES a.s. — Association Group of Industrial Companies
“TIRA” Corporation — ATAC — ATCA – Japan — ATECH Negócios em Tecnologia S/A — Aveillant — Aviation Advocacy Sarl — Aviation Data Communication Corp (ADCC) — ADB SAFEGATE — Avitech GmbH — Bayanat Engineering Group — Brüel & Kjaer EMS — CGH Technologies, Inc. — Comsoft GmbH — CSSI, Inc. — EIZO Technologies GmbH — European Satellite Services Provider (ESSP SAS) — Emirates — ENAC — Entry Point North — Era Corporation — Esterline — Etihad Airways — EvBase Technologies Inc. — Guntermann & Drunck GmbH — Helios — Honeywell International Inc. / Aerospace — IDS – Ingegneria Dei Sistemi S.p.A. — Indra Navia AS — Indra Sistemas — INECO — Integra A/S — Intelcan Technosystems Inc. — International Aero Navigation Systems Concern,
JSC — Jeppesen — JMA Solutions — Jotron AS — Kongsberg Defence & Aerospace AS — LAIC Aktiengesellschaft — LEMZ R&P Corporation — Lufthansa Systems FlightNav AG — MDA Systems Ltd. — Metron Aviation — Micro Nav Ltd — The MITRE Corporation – CAASD — MovingDot — NEC Corporation — NLR — Northrop Grumman — NTT Data Corporation — Project Loon — Rockwell Collins, Inc. — Rohde & Schwarz GmbH & Co. KG — Saab AB — Saab Sensis Corporation — Saudi Arabian Airlines — SENASA — SITA — Snowflake Software Ltd — STR-SpeechTech Ltd. — Tetra Tech AMT — Think Research Limited
CANSO – the Civil Air Navigation Services Organisation – is the global voice of air traffic management (ATM) worldwide. CANSO Members support over 85% of world air traffic. Members share information and develop new policies, with the ultimate aim of improving air navigation services (ANS) on the ground and in the air.
CANSO represents its Members’ views to a wide range of aviation stakeholders, including the International Civil Aviation Organization, where it has official Observer status. CANSO has an extensive network of Associate Members drawn from across the aviation industry. For more information on joining CANSO, visit canso.org/join-canso civil air navigation services organisation