glenmark pharmaceuticals limited stock idea …...glenmark pharmaceuticals limiteddhanuka agritech...
TRANSCRIPT

DHANUKA AGRITECH LTD. Glenmark Pharmaceuticals Limited
Glenmark Pharmaceuticals Limited STOCK IDEA
Pharmaceuticals Rating: Buy
Date Oct 13 ,2017 CMP (Rs.) 603 Target (Rs.) 749 Potential Upside 24% BSE Sensex 32432 NSE Nifty 10167
Scrip Code Bloomberg GNP IN Reuters GLEN.NS
BSE Group A BSE Code 532296 NSE Symbol GLENMARK Market Data Market Cap.(Rs. Cr)
17100 Equity Sh. Cap. (Rs) Cr)
10.0 52 Wk High/Low (Rs.)
993/567 Avg. Quarterly Volume
30931 Face Value (Rs.) 1 Shareholding Pattern (%)
Comparative Price Chart
Gaurav Jhanwar Research Analyst [email protected] Arun Gopalan Head – Research [email protected]
Glenmark is a leading research-driven, global and integrated pharmaceutical organization
committed to making a difference in patients’ lives. Glenmark is a USD 1.4 bn global pharma
organization with over 13,000 employees in 50 countries, deriving 70% of their revenues from
international markets. Their objective is to earn 30% of their revenues from specialty and
innovative products by 2025. Co plans to accelerate growth and profitability in various parts of
the business without departing from their sharp focus on the chosen therapy areas of oncology,
respiratory and dermatology. Their consolidated revenues in the FY 17 rose from Rs7649.60 to
9185.6 cr .Their net profit for FY17 was 1108 cr v/s 743 cr in FY 16.we believe FY18 and FY19
should be good for Glenmark With the bad patch in top line behind it, the company expects
EBITDA to grow at a CAGR of 8.5%. All the attributes, both internal and external, being
favorable, we believe Glenmark is poised for strong growth over the next 1-2 years.
Innovation, development of NBEs and NCEs hold the key to growth : Glenmark is actively engaged in the development of New Chemical Entities (NCEs) and New Biological Entities (NBEs), and has 7 novel molecules, 2 NCEs and 5 NBEs, in various stages of pre-clinical and clinical development. Glenmark has 7 outlicensing deals signed with Eli Lilly, Merck, Sanofi, Teijin Pharma and Forest Labs.They are likely to get USD 200+ mn of cash through outlicensing. Glenmark has 9 novel products in pipeline focused in the therapeutic areas of oncology, respiratory and dermatology. Glenmark has a facilty is US that supporting clinical development and 120 scientists researching new biological entities based in Switzerland and India respectively .Recently Glenmark has been granted final approval by the US FDA for Desonide Lotion and Rythmol SR Capsules.
Strategic presence in select geographies to open up opportunities : Glenmark has presence in niche segment in the US such as oral contraceptives, dermatology, which is relatively less crowded .In the US generics space, a lot of opportunities are panning out in the oral contraceptives and respiratory space. Glenmark has got licensed generic Seretide Accuhaler in Europe, a signficant step towards building a strong respiratory franchise in Europe. Currently their NME(Novel Molecular Entity pipeline) in early to mid stage of development that will move to advanced stage of development in next 3-5 years. In next 3-5 years company is expecting 80% of sales from USA, India, Europe and API region . We expect revenues to grow Rs. 10750 crore in FY19E.
Focus on specific therapy areas, new product launches to boost sales : Glenmark is a market leader in dermatology and improving its presence in therapies like respiratory, CVS, anti-infectives and even anti-diabetics. In FY17, Glenmark’s growth was 14% vis-à-vis International Pharma companies growth of 9% as per IMS MAT. It targets 10-12 new products launch in the US in FY18 which will increase sales in FY19-FY 20. Glenmark’s ground-breaking drug discovery effort is primarily focused in the areas of inflammation [asthma/COPD, rheumatoid arthritis etc.], metabolic disorders [diabetes, obesity, etc.] and pain [neuropathic pain and inflammatory pain]. Glenmark has a robust pipeline of 13 molecules in various stages of preclinical & clinical development,of these, 8 molecules are in clinical trials. These molecules are potential blockbusters with peak sales opportunity for each molecule in the range of $1 billion to $3 billion.. Although base business has seen pricing pressure, but new products launch with specific therapy will offset the impact and lead growth.
gZetia props up Q1FY18 revenues, eyes US$ 100 mn opportunity : Glenmark Pharma surprised positively in 1QFY18, with better-than-expected revenue from gZetia (FTF)(Rs2363cr), a healthy 15% growth in domestic formulations business(Rs.616 cr)despite GST related concerns and strong 16% growth in ROW .Management guides for 15% growth in India business and gross and EBITDA margins to be 70% and 22% respectively, despite a spike in R&D cost in 2QFY18.Management guide that it may file NDA by CY18-end, which may provide a potential opportunity of US$80-100mn on successful rollout in the US.
Valuation & Outlook: The Indian pharma sector’s valuation multiples have contracted over 25% over the past 2 years Moreover, earnings forecasts are accounting for most of the risks and challenges outlined. This, in our view, is an opportunity to buy stocks from a long term view. We expect earnings to pick up over the medium term, with PAT recording 8% CAGR over FY18-FY20, as companies move up the value chain, with a ramp-up in the launch of complex generics and specialty products, focus on growth in emerging and other developed markets and volume-driven growth in the attractive branded domestic market. At the CMP of Rs.603, the stock trades at 15.3 times FY17 EPS of Rs.39.3. We value the company at 15 x FY19E, EPS of Rs.49.9, indicating a target price of Rs.749, an upside of 24%.
Particulars Revenue (Rs. Cr)
EBITDA (Rs. Cr)
EBITDA (%)
PAT (Rs. Cr)
PATM (%)
EPS (Rs.)
BVPS (Rs.)
P/E (x)
P/BV (x)
EV/EBITDA (x)
FY15 6562.6 1214.3 18.5 209.5 3.2 7.4 82.8 81.2 7.3 17.0 FY16 7649.6 1437.2 18.8 743.0 9.7 26.3 128.7 22.9 4.7 14.4 FY17 9185.6 2036.7 22.2 1108.7 12.1 39.3 159.3 15.3 3.8 10.2 FY18E 9599.0 2265.4 23.6 1200.4 12.5 42.6 199.5 14.2 3.0 9.1 FY19E 10750.8 2601.7 24.2 1408.0 13.1 49.9 247.0 12.1 2.4 7.9
50
70
90
110
130
Sep-16 Dec-16 Mar-17 Jun-17 Sep-17
Glenmark Sensex

DHANUKA AGRITECH LTD. Glenmark Pharmaceuticals Limited
EBITDA & EBITDA Margin% PAT and PAT Margin %
ROCE and EPS Net Revenue and Revenue Growth
Recurring R&D Expenditure and R&D% of sales ROE and EV/EBITDA
Source : Company, Systematix Research

DHANUKA AGRITECH LTD. Glenmark Pharmaceuticals Limited
One of the Top 75 Pharma and Biotech Companies in the world and ranks 10
Th
among companies based out at emerging markets Oncology injectables supplies to leading hospitals in emerging markets.It has 9 oncology injectables filed in US It has dedicated Production facility for oncology injectables in Argentina They ranked no 2 in India in Dermatology Segment and have significance presence in Brazil, Mexico and Russia
30+ ANDAs launched in the US, close to 15 await approval, at least 20 products in development
Company Background Glenmark Pharmaceuticals was incorporated in 1977, entered into the dermatology market by 1979 through the launch of its Candid Cream. It is a leading player in the discovery of new molecules both NCEs (new chemical entity) and NBEs (new biological entity) with eight molecules in various stages of clinical development. It operates in the formulation business in over 95 countries that includes India. The company has a significant presence in branded generics markets across emerging economies including India. Its subsidiary, Glenmark Generics Limited has a fast growing and robust US generics business. The subsidiary also markets APIs to regulated and semi-regulated countries. It has 5 API units , 12 manufacturing facilities for formulation business in 4 countries and has 5 R&D centers. India is the largest market in terms of revenue for the organization. The formulations business has 12 manufacturing facilities; 7 in India and 5 overseas. These facilities are approved by several regulatory bodies. The facility at Baddi, Himachal Pradesh, is also approved by MHRA and USFDA for semi-solids. The overseas facilities are situated in Brazil and the Czech Republic and manufacturing facility in Brazil completes requirements of the Latin American region, the Czech facility services requirements of the Central Eastern Europe region. Glenmark has also invested in a dedicated R&D facility for formulations development. This R&D centre, situated near Nashik, India is engaged in developing specialty/ branded formulations for global markets.They are moving to a future where Glenmark’s business will stand on three pillars: > Global generics > Specialty > Innovative products Global generics are already the main stay of their business and will be so for the foreseeable future. Specialty will help us move up the value chain to brand-name products in highly-regulated markets, It is a lucrative opportunity that will unlock a new, sustainable revenue stream for the Company and build a defense against price erosion in generics Strategy for the future
They have built a robust base for business in key markets such as India and the US, They have created a roadmap to navigate a more challenging future. The result is a strategy that allows them to open up multiple, profitable and sustainable revenue streams to take them to a new orbit over the next decade, and is robust enough to withstand market and regulatory turbulence. Glenmark has chosen to sharpen focus to three therapy areas: > Oncology > Respiratory > Dermatology The common part of each therapy area is their substantial market potential and pockets of unmet need for solutions that are more economical, safer, more effective or more convenient. Their research and development skills, manufacturing and commercial capabilities, market-leading position and deep organizational experience in these therapies in multiple markets make them well-positioned among pharmacy Industry
Global footprints – Glenmark Pharmaceuticals Limited is a global pharmaceutical company. The Company is
engaged in the development of new chemical entities (NCEs) and new biological entities (NBEs). Its segments are India, United States, Latin America, Europe and Rest of the World (ROW). It has approximately seven molecules, over two NCEs and approximately five NBEs in various stages of pre-clinical and clinical development. Glenmark has been focused on developing and marketing branded and generic formulations. It focuses on manufacturing products across therapeutic areas of dermatology, respiratory and oncology. Its active pharmaceuticals ingredients (API) business spans over 80 countries, including regulated markets of the United States, Europe, Japan and Canada. Its products are primarily marketed in the United States and Western Europe. It has offices in over 40 countries, and operates approximately 17 manufacturing facilities in over five countries. It operates over five research and development (R&D) centers
Source : Company

DHANUKA AGRITECH LTD. Glenmark Pharmaceuticals Limited
In-licensed with g-Seretide for EU,among the first to launch in multiple emerging markets. R&D guidance for the full year is 11% of sales. 3 generic inhalers under development for the US, market size of USD 6.5 bn to be launched in 3-4 years
Innovations, new products and a diverse portfolio hold the key to growth : Their pipeline of specialty products, to be rolled out over the next 3-4 years, is expected to act as a defense against generics price erosion and increase in competition, and boost profitable growth. GSP 301, a novel fixed dose combination of two drugs in a nasal spray format for seasonal allergic .Rhinitis is their first branded product , to clear Phase III, the final phase of clinical trials. Besides GSP 301, They are also excited about GBR 310, a bio similar of the allergic asthma and Chronic Idiopathic Urticaria drug XOLAIR®. This product is of special interest to them as it is indicated for disease conditions in two of the three therapy areas that are of critical importance to the organization, i.e., respiratory and dermatology.GBR 310 has the potential to be the first biosimilar of XOLAIR® on market and a Phase I study has already been initiated. They expect to file for marketing approval in CY 20. R&D spend will aid drug discovery : Currently R&D Expenses at Rs.1010 cr (11% of net sales), which will increase in 2QFY18 due to Phase 2 study of GBR830 and GSP304, . R&D expenses will increase to 11-12% of net sales in FY18 v/s 7.8% in FY17.The company has almost fully recovered the amount spent on innovative R&D, which is almost US$200 million in the last nine years. Glenmark have 3 dedicated R&D centers. It is a complete end to end setup with expertise in all areas of NCE (new chemical entity) discovery and development ranging from target selection to clinical development. Glenmark biopharmaceutical research is carried out at its R&D facility in Switzerland. Glenmark has also invested in another state-of-the-art R&D facility in Oxford, UK for molecules in clinical development. The R&D facility will serve as Glenmark global centre for clinical development for both small molecules (NCEs) and biologics (NBEs). Formulations Business to benefit from regional focus and new approvals : Glenmark formulations business is currently organized around four regions India, Latin America, Central and Eastern Europe and Semi Regulated Markets of Africa/Asia/CIS. The formulations business focuses on therapeutic areas viz. dermatology, anti-infective, respiratory, cardiac, diabetes, gynecology, CNS, and oncology. In the 12-month period ending July 2017, the Desonide Lotion, achieved annual sales of approximately Rs152 cr ,and the Rythmol SR Capsules 225 mg, 325 mg and 425 mg in which approval from USFDA received on 11 sept achieved annual sales of approximately Rs 442 cr reported a IMS Health sales data Global Pharma Scenario:- Reports suggest that the medicine use is expected to increase by over 24% from CY15 to CY20 to reach a value of USD 1.4 trillion. The projected reason for this to be increased usage by emerging countries and increase of volumes in developed markets. While the developed markets would continue to use branded and specialty medicines. The emerging markets would use more non-original brands, generics and over the counter products. Furthermore, the adoption of newer medicines will remain higher in developed markets than in emerging markets. The spending on medicines in the region is anticipated to reach USD 560 – 590 billion by 2020, an increase of about 34% compared to 2015. The growth is expected to be driven by innovation, price increase and the impact of loss of exclusivity. The US is the largest pharmaceutical market of the world accounting for approximately 35% of the global share. The patent cliff in the US market has been less than historical. The number of Indian and Chinese companies operating in the US has increased year on year which has led to significant price erosion in the generics market. The consolidation in supply chain has also led to continued pressure on margins and working capital .The growth in spending on medicines in emerging markets by CY20 would be about USD 125 billion primarily driven by wider use of medicines. The per capita increase in volume and spending is expected to result from the strong commitment by government to widen the access to healthcare and the expanded private insurance in these markets. Source:-Company, The Indian Pharmaceutical sector : Indian Pharma Sector troubles over the past 24 months are well-known due to regulatory uncertainties, the burden of sustaining historical growth rates on large bases, a strong INR and disruptions in the home market owing to demonetization and GST have contributed to sub-par financial performance that has been reflected in stock price performances. This has caused a deep reset in market expectations from key pharma players. To reduce healthcare costs and improve accessibility, the Indian government has been implementing price controls and promoting the use of generic drugs (currently <10% of IPM), which could hurt the profitability of Indian pharma players. However, quality improvement in generics and strong branding/marketing by larger players will limit the impact. Improving healthcare accessibility, rising government spending on healthcare, Increasing disposable incomes and expanding insurance penetration continue to make the Indian pharma market an attractive structural growth story. Impact of demonetization and GST implementation is being discounted in price and Indian pharma companies to revert to their historical growth trajectories in FY19 MANAGEMENT PERSONNEL :
Name & Designation Brief profile
Mr. Glenn Saldanha
Chairman & Managing
Director
Mr. Saldanha joined Glenmark in 1998 as a Director, and took over as Managing Director and CEO in 2001. He has transformed the Company into a truly global organization with revenue over a billion dollar and commercial presence in over 80 countries. Under his leadership, Glenmark has evolved from an Indian branded generics business, into a research-driven and innovation-led organisation. Mr. Saldanha’s vision is to discover, develop and take to market India’s first innovative drug for the entire world
Mrs. Cherylann Pinto
Director – Corporate
Affairs
Mrs. Pinto is the Director of Corporate Affairs at Glenmark since October 1999 and is an executive member of the Board. With over 28 years of experience in the pharmaceutical field, she currently heads the Company’s Corporate Communications, Corporate Affairs, IT, Admin, HR and CSR functions. She had set up a pharmaceutical company where she served as Managing Director from 1989 to 1999 before joining Glenmark.
DHANUKA AGRITECH LTD. Glenmark Pharmaceuticals Limited
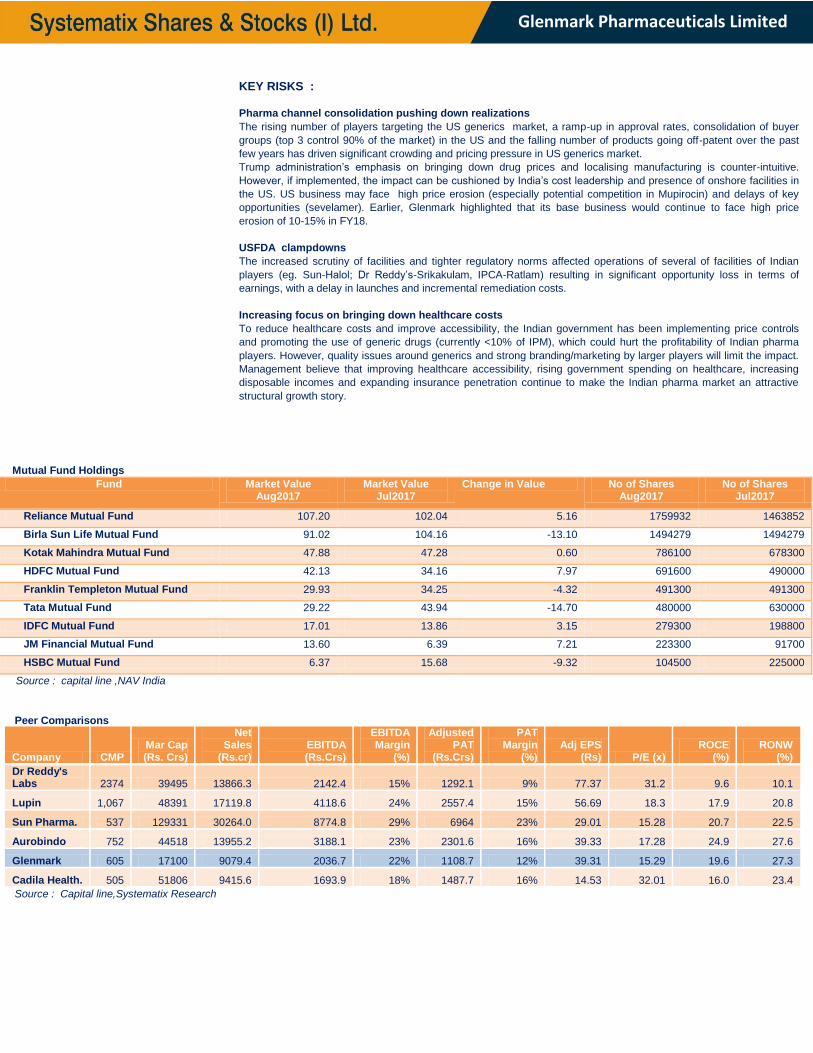
KEY RISKS :
Pharma channel consolidation pushing down realizations
The rising number of players targeting the US generics market, a ramp-up in approval rates, consolidation of buyer
groups (top 3 control 90% of the market) in the US and the falling number of products going off-patent over the past
few years has driven significant crowding and pricing pressure in US generics market.
Trump administration’s emphasis on bringing down drug prices and localising manufacturing is counter-intuitive.
However, if implemented, the impact can be cushioned by India’s cost leadership and presence of onshore facilities in
the US. US business may face high price erosion (especially potential competition in Mupirocin) and delays of key
opportunities (sevelamer). Earlier, Glenmark highlighted that its base business would continue to face high price
erosion of 10-15% in FY18.
USFDA clampdowns
The increased scrutiny of facilities and tighter regulatory norms affected operations of several of facilities of Indian
players (eg. Sun-Halol; Dr Reddy’s-Srikakulam, IPCA-Ratlam) resulting in significant opportunity loss in terms of
earnings, with a delay in launches and incremental remediation costs.
Increasing focus on bringing down healthcare costs
To reduce healthcare costs and improve accessibility, the Indian government has been implementing price controls
and promoting the use of generic drugs (currently <10% of IPM), which could hurt the profitability of Indian pharma
players. However, quality issues around generics and strong branding/marketing by larger players will limit the impact.
Management believe that improving healthcare accessibility, rising government spending on healthcare, increasing
disposable incomes and expanding insurance penetration continue to make the Indian pharma market an attractive
structural growth story.
Mutual Fund Holdings
Fund Market Value Aug2017
Market Value Jul2017
Change in Value No of Shares Aug2017
No of Shares Jul2017
Reliance Mutual Fund 107.20 102.04 5.16 1759932 1463852
Birla Sun Life Mutual Fund 91.02 104.16 -13.10 1494279 1494279
Kotak Mahindra Mutual Fund 47.88 47.28 0.60 786100 678300
HDFC Mutual Fund 42.13 34.16 7.97 691600 490000
Franklin Templeton Mutual Fund 29.93 34.25 -4.32 491300 491300
Tata Mutual Fund 29.22 43.94 -14.70 480000 630000
IDFC Mutual Fund 17.01 13.86 3.15 279300 198800
JM Financial Mutual Fund 13.60 6.39 7.21 223300 91700
HSBC Mutual Fund 6.37 15.68 -9.32 104500 225000
Source : capital line ,NAV India
Peer Comparisons
Company CMP Mar Cap (Rs. Crs)
Net Sales
(Rs.cr) EBITDA (Rs.Crs)
EBITDA Margin
(%)
Adjusted PAT
(Rs.Crs)
PAT Margin
(%) Adj EPS
(Rs) P/E (x) ROCE
(%) RONW
(%)
Dr Reddy's Labs 2374 39495 13866.3 2142.4 15% 1292.1 9% 77.37 31.2 9.6 10.1
Lupin 1,067 48391 17119.8 4118.6 24% 2557.4 15% 56.69 18.3 17.9 20.8
Sun Pharma. 537 129331 30264.0 8774.8 29% 6964 23% 29.01 15.28 20.7 22.5
Aurobindo 752 44518 13955.2 3188.1 23% 2301.6 16% 39.33 17.28 24.9 27.6
Glenmark 605 17100 9079.4 2036.7 22% 1108.7 12% 39.31 15.29 19.6 27.3
Cadila Health. 505 51806 9415.6 1693.9 18% 1487.7 16% 14.53 32.01 16.0 23.4
Source : Capital line,Systematix Research
DHANUKA AGRITECH LTD. Glenmark Pharmaceuticals Limited
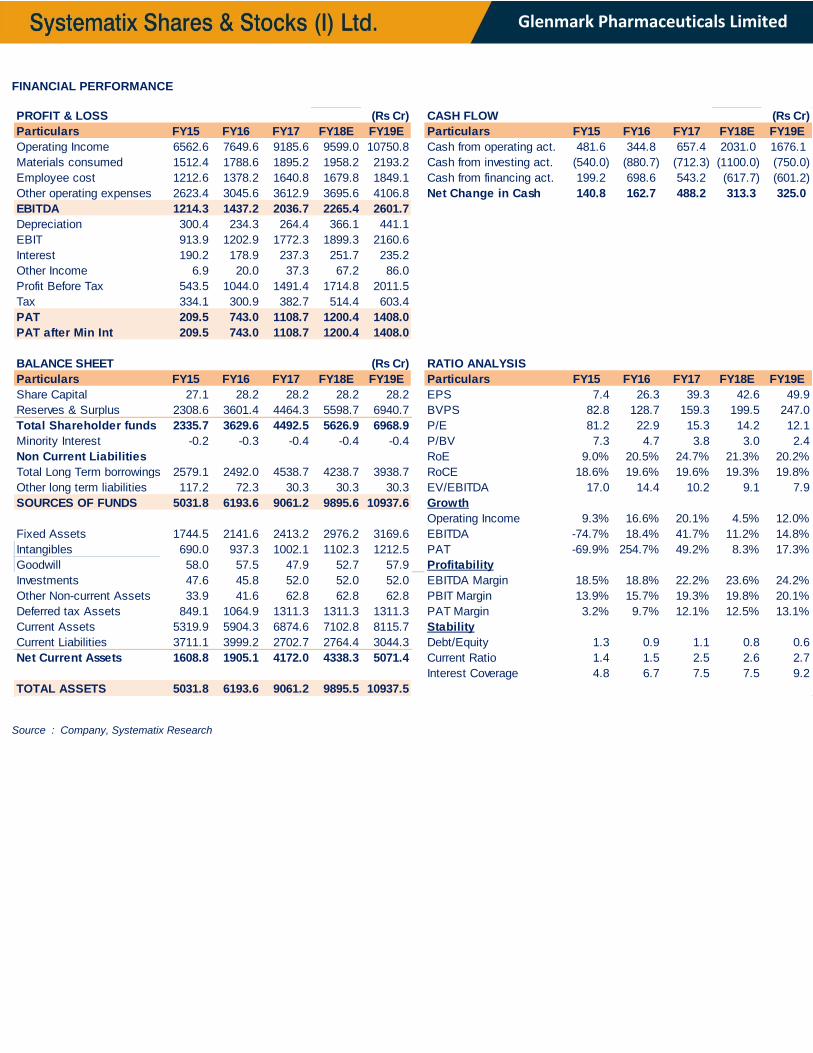
FINANCIAL PERFORMANCE
Source : Company, Systematix Research
PROFIT & LOSS (Rs Cr) CASH FLOW (Rs Cr)
Particulars FY15 FY16 FY17 FY18E FY19E Particulars FY15 FY16 FY17 FY18E FY19E
Operating Income 6562.6 7649.6 9185.6 9599.0 10750.8 Cash from operating act. 481.6 344.8 657.4 2031.0 1676.1
Materials consumed 1512.4 1788.6 1895.2 1958.2 2193.2 Cash from investing act. (540.0) (880.7) (712.3) (1100.0) (750.0)
Employee cost 1212.6 1378.2 1640.8 1679.8 1849.1 Cash from financing act. 199.2 698.6 543.2 (617.7) (601.2)
Other operating expenses 2623.4 3045.6 3612.9 3695.6 4106.8 Net Change in Cash 140.8 162.7 488.2 313.3 325.0
EBITDA 1214.3 1437.2 2036.7 2265.4 2601.7
Depreciation 300.4 234.3 264.4 366.1 441.1
EBIT 913.9 1202.9 1772.3 1899.3 2160.6
Interest 190.2 178.9 237.3 251.7 235.2
Other Income 6.9 20.0 37.3 67.2 86.0
Profit Before Tax 543.5 1044.0 1491.4 1714.8 2011.5
Tax 334.1 300.9 382.7 514.4 603.4
PAT 209.5 743.0 1108.7 1200.4 1408.0
PAT after Min Int 209.5 743.0 1108.7 1200.4 1408.0
BALANCE SHEET (Rs Cr) RATIO ANALYSIS
Particulars FY15 FY16 FY17 FY18E FY19E Particulars FY15 FY16 FY17 FY18E FY19E
Share Capital 27.1 28.2 28.2 28.2 28.2 EPS 7.4 26.3 39.3 42.6 49.9
Reserves & Surplus 2308.6 3601.4 4464.3 5598.7 6940.7 BVPS 82.8 128.7 159.3 199.5 247.0
Total Shareholder funds 2335.7 3629.6 4492.5 5626.9 6968.9 P/E 81.2 22.9 15.3 14.2 12.1
Minority Interest -0.2 -0.3 -0.4 -0.4 -0.4 P/BV 7.3 4.7 3.8 3.0 2.4
Non Current Liabilities RoE 9.0% 20.5% 24.7% 21.3% 20.2%
Total Long Term borrowings 2579.1 2492.0 4538.7 4238.7 3938.7 RoCE 18.6% 19.6% 19.6% 19.3% 19.8%
Other long term liabilities 117.2 72.3 30.3 30.3 30.3 EV/EBITDA 17.0 14.4 10.2 9.1 7.9
SOURCES OF FUNDS 5031.8 6193.6 9061.2 9895.6 10937.6 Growth
Operating Income 9.3% 16.6% 20.1% 4.5% 12.0%
Fixed Assets 1744.5 2141.6 2413.2 2976.2 3169.6 EBITDA -74.7% 18.4% 41.7% 11.2% 14.8%
Intangibles 690.0 937.3 1002.1 1102.3 1212.5 PAT -69.9% 254.7% 49.2% 8.3% 17.3%
Goodwill 58.0 57.5 47.9 52.7 57.9 Profitability
Investments 47.6 45.8 52.0 52.0 52.0 EBITDA Margin 18.5% 18.8% 22.2% 23.6% 24.2%
Other Non-current Assets 33.9 41.6 62.8 62.8 62.8 PBIT Margin 13.9% 15.7% 19.3% 19.8% 20.1%
Deferred tax Assets 849.1 1064.9 1311.3 1311.3 1311.3 PAT Margin 3.2% 9.7% 12.1% 12.5% 13.1%
Current Assets 5319.9 5904.3 6874.6 7102.8 8115.7 Stability
Current Liabilities 3711.1 3999.2 2702.7 2764.4 3044.3 Debt/Equity 1.3 0.9 1.1 0.8 0.6
Net Current Assets 1608.8 1905.1 4172.0 4338.3 5071.4 Current Ratio 1.4 1.5 2.5 2.6 2.7
Interest Coverage 4.8 6.7 7.5 7.5 9.2
TOTAL ASSETS 5031.8 6193.6 9061.2 9895.5 10937.5
DISCLOSURES/ APPENDIX
I. ANALYST CERTIFICATION We, Gaurav Jhanwar and Arun Gopalan, hereby certify (1) that the views expressed in this research report accurately reflect our personal views about any or all of the subject securities or issuers referred to in this research report, (2) No part of our compensation was, is, or will be directly or indirectly related to the specific recommendations or views expressed in this research report by Systematix Shares & Stocks (I) Limited or its Group/associates companies. (3) has taken reasonable care to achieve and maintain independence and objectivity in making any recommendations.
Disclosure of Interest Statement Response
Analyst holding in the stock No
Served as an officer, director or employee No
II. ISSUER SPECIFIC REGULATORY DISCLOSURES, UNLESS SPECIFICALLY MENTIONED IN POINT NO. 9 BELOW:
1. The Research Analyst(s), Systematix Shares & Stocks(I) Limited (SSSIL), Associate of Analyst or his relative does not have any financial interest in the company(ies) covered in this report. 2. The Research Analyst, SSSIL or its associates or relatives of the Research Analyst affiliates collectively do not hold more than 1% of the securities of the company (ies) covered in this report as of the end of
the month immediately preceding the distribution of the research report. 3. The Research Analyst, his associate, his relative and SSSIL do not have any other material conflict of interest at the time of publication of this research report. 4. The Research Analyst, SSSIL and its associates have not received compensation for investment banking or merchant banking or brokerage services or for any other products or services from the
company(ies) covered in this report, in the past twelve months. 5. The Research Analyst, SSSIL or its associates have not managed or co-managed in the previous twelve months, a private or public offering of securities for the company (ies) covered in this report. 6. SSSIL or its associates have not received compensation or other benefits from the company(ies) covered in this report or from any third party, in connection with the research report. 7. The Research Analyst has not served as an Officer, Director or employee of the company (ies) covered in the Research report. 8. The Research Analyst and SSSIL has not been engaged in market making activity for the company(ies) covered in the Research report. 9. Details SSSIL, Research Analyst and its associates pertaining to the companies covered in the Research report:
Sr. No.
Particulars Yes / No.
1 Whether compensation has been received from the company(ies) covered in the Research report in the past 12 months for investment banking transaction by SSSIL No
2 Whether Research Analyst, SSSIL or its associates or relatives of the Research Analyst affiliates collectively hold more than 1% of the company(ies) covered in the Research report No
3 Whether compensation has been received by SSSIL or its associates from the company(ies) covered in the Research report No
4 SSSIL or its affiliates have managed or co-managed in the previous twelve months a private or public offering of securities for the company(ies) covered in the Research report No
5 Research Analyst, his associate, SSSIL or its associates have received compensation for investment banking or merchant banking or brokerage services or for any other products or services from the company(ies) covered in the Research report, in the last twelve month
No
10. There are no material disciplinary action that been taken by any regulatory authority impacting equity research analysis activities. 11. Systematix Shares & Stocks (I) Limited is in a process of seeking registration under SEBI (Research Analyst) Regulations, 2014.
EXPLANATION TO RATINGS: BUY: TP>15%; ACCUMULATE: 5%<TP<15%; HOLD: -5%<TP<5%; REDUCE: -15%<TP<-5%; SELL: TP<-15%
III. DISCLAIMER The information and opinions contained herein have been compiled or arrived at, based upon information obtained in good faith from sources believed to be reliable. Such information has not been independently verified and no guaranty, representation of warranty, express or implied, is made as to its accuracy completeness or correctness.
This document is for information purposes only. This report is based on information that we consider reliable, but we do not represent that it is accurate or complete, and one should exercise due caution while acting on it. Descriptions of any company or companies or their securities mentioned herein are not complete and this document is not, and should not be construed as an offer or solicitation of an offer to buy or sell any securities or other financial instruments. Past performance is not a guide for future performance, future returns are not guaranteed and a loss of original capital may occur. All opinions, projections and estimates constitute the judgment of the author as on the date of the report and these, plus any other information contained in the report, are subject to change without notice. Prices and availabili ty of financial instruments also are subject to change without notice.
This report is not directed to or intended for display, downloading, printing, reproducing or for distribution to or use by, any person or entity that is a citizen or resident or located in any locality, state, country or other jurisdiction where such distribution, publication, reproduction, availability or use would be contrary to law or regulation or what would subject to SSSIL or its affiliates to any registration or licensing requirement within such jurisdiction. If this report is inadvertently send or has reached any individual in such country, especially, USA, the same may be ignored and brought to the attention of the sender. Neither this document nor any copy of it may be taken or transmitted into the United State (to U.S.Persons), Canada, or Japan or distributed, directly or indirectly, in the United States or Canada or distributed or redistributed in Japan or to any resident thereof. Any unauthorized use, duplication, redistribution or disclosure of this report including, but not limited to, redistribution by electronic mail, posting of the report on a website or page, and/or providing to a third party a link , is prohibited by law and will result in prosecution. The information contained in the Report is intended solely for the recipient and may not be further distributed by the recipient to any third party.
SSSIL generally prohibits its analysts, persons reporting to analysts, and members of their households from maintaining a financial interest in the securities or derivatives of any companies that the analysts cover. Additionally, SSSIL generally prohibits its analysts and persons reporting to analysts from serving as an officer, director, or advisory board member of any companies that the analysts cover. Our salespeople, traders, and other professionals or affiliates may provide oral or written market commentary or trading strategies to our clients that reflect opinions that are contrary to the opinions expressed herein. Our proprietary trading and investing businesses may make investment decisions that are inconsistent with the recommendations expressed herein. The views expressed in this research report reflect the personal views of the analyst(s) about the subject securities or issues, and no part of the compensation of the research analyst(s) was, is, or will be directly or indirectly related to the specific recommendations and views expressed by research analyst(s) in this report. The compensation of the analyst who prepared this document is determined exclusively by SSSIL however, compensation may relate to the revenues of the Systematix Group as a whole, of which investment banking, sales and trading are a part. Research analysts and sales persons of SSSIL may provide important inputs to its affiliated company(ies).
Foreign currencies denominated securities, wherever mentioned, are subject to exchange rate fluctuations, which could have an adverse effect on their value or price, or the income derived from them. In addit ion, investors in securities such as ADRs, the values of which are influenced by foreign currencies effectively assume currency risk.
MUTUAL FUND INVESTMENTS ARE SUBJECT TO MARKET RISKS, READ ALL SCHEME RELATED DOCUMENTS CAREFULLY. SSSIL, its directors, analysts or employees do not take any responsibility, financial or otherwise, of the losses or the damages sustained due to the investments made or any action taken on basis of this report including but not restricted to fluctuation in the prices of shares and bonds, changes in the currency rates, diminution in the NAVs, reduction in the dividend or income, etc.
SSSIL and its affiliates, officers, directors, and employees subject to the information given in the disclosures may: (a) from time to time, have long or short positions in, and buy or sell the securities thereof, of company (ies) mentioned herein or (b) be engaged in any other transaction involving such securities and earn brokerage or other compensation (financial interest) or act as a market maker in the financial instruments of the company (ies) discussed herein or act as advisor or lender / borrower to such company (ies) or have other potential material conflict of interest with respect to any recommendation and related information and opinions. The views expressed are those of the analyst and the Company may or may not subscribe to the views expressed therein.
SSSIL, its affiliates and any third party involved in, or related to, computing or compiling the information hereby expressly disclaim all warranties of originality, accuracy, completeness, merchantability or fitness for a particular purpose with respect to any of this information. Without limiting any of the foregoing, in no event shall SSSIL, any of its affiliates or any third party involved in, or related to, computing or compiling the information have any liability for any damages of any kind. The Company accepts no liability whatsoever for the actions of third parties. The Report may provide the addresses of, or contain hyperlinks to, websites. Except to the extent to which the Report refers to website material of the Company, the Company has not reviewed the linked site. Accessing such website or following such link through the report or the website of the Company shall be at your own risk and the Company shall have no liability arising out of, or in connection with, any such referenced website
SSSIL shall not be liable for any delay or any other interruption which may occur in presenting the data due to any technical glitch to present the data. In no event shall the SSSIL be liable for any damages, including without limitation, direct or indirect, special, incidental, or consequential damages, losses or expenses arising in connection with the data presented by SSSIL through this presentation.
Neither SSSIL, nor any of its other group companies or associates, shall be responsible for any decisions taken on the basis of this report. Investors are advised to consult their Investment and Tax consultants before taking any investment decisions based on this report. Systematix Shares & Stocks (I) Ltd. CIN: U65993TN1995PLC031285 : SEBI Regn. No.: BSE: INB/F011132736 Member Code: 182 | NSE: INB/F/E231132730 Member Code : 11327 | MCX-SX: INB/F261132733 Member Code: 17560 | PMS SEBI Reg No. : INP000002692 | Depository Participant: IN-DP-CDSL-246-2004 | AMFI: ARN No. 64917 Corporate Office Address: A 603-606 , The Capital, BKC, Bandra (E), Mumbai, India - 400051