give your business a healthy boost · give your business a healthy boost ... based on a random...
TRANSCRIPT

Give Your Business A Healthy Boost
WHITE PAPER
The benefits of proper cleaning cannot be underestimated. The Value of Clean white paper was developed by ISSA and highlights the ben-efits of The Healthy Workplace Project* as a method to reduce worker absenteeism due to minor illness. The Healthy Workplace Project* three-step protocol of wash, wipe and sanitize can help break the chain of germ transmission in all types of facilities – leading to en-hanced tenant satisfaction, cleaner buildings and healthier, more productive workers.
The following is an excerpt of the Absenteeism section of ISSA’S The Value of Clean white paper. The full white paper can be found at issa.com/value.
i
The Healthy Workplace Project*

1
The Value of Cleaning
Absenteeism
One of the many benefits of a clean facility is the reduction of harmful contaminants in the indoor environment. A clean and hygienic facility gives building occupants a visual comfort level and reduces potential risks that may be associated with buildings that are not as clean. Although there are many studies that address improved indoor air quality and the risks associated with dust and bacteria on surfaces, few have demonstrated how health risks due to inadequate cleaning impact building occupant personnel costs and, ultimately, a business’s bottom line.
The research that follows addresses the connection between cleaning and the spread of illness, which manifests itself in employee lost work days (absenteeism). Absenteeism is a substantial cost to businesses that can be reduced through proper cleaning practices.
An Absent Management Study was conducted in 2011 Chartered Institute of Personnel and Development (CIPD) (The Chartered Institute of Personnel and Development, 2011). CIPD is an internationally recognized company with more than 135,000 members across 120 countries. It is one of the world’s largest human resource organizations.
The CPID study gathered data from 592 organizations across the UK, employing more than 2 million employees. The study documented the average days of absenteeism per employee in a variety of work settings, along with their estimated costs to employers. The average sick days per employee per year were 7.7 days (Table 1). CIPD determined the average cost of absences to be £673 ($869 USD) per employee per year. Illnesses such as colds, flu, stomach upsets, and headaches were the most common cause of short-term absences.
Table 1: Average Level of Employee Absence, All Employees 1
Average working time lost per year (%)
Average number of days lostper employee per year
Mean StandardDeviation
5% Trimmed
MeanMean Standard
Deviation
5% Trimmed
Mean
2011: All Employees 3.8 3.5 3.4 8.7 8 7.7*
2010: All Employees 3.4 1.9 3.2 7.7* 4.3 7.4
Base: 403 (2011); 429 (2010)
1 A 5 percent trimmed mean was used because the large standard deviation shows there is high variation across organizations, with some reporting extremely high levels of absence. In 2010 the arithmetic mean was used because the standard deviation was within acceptable limits, showing less variation in the absences reported by organizations. Table 1 includes the mean and 5 percent trimmed mean for reference.

2
The Value of Cleaning
A study published in the Journal of Occupational Environmental Medicine in 2003 reported that, based on a random sample of 28,902 United States workers, health-related lost productive time (LPT) costs employers $225.8 billion per year, or $1,685 per employee per year (Stewart, 2003).
That study calculated absenteeism as the sum of hours per week absent from work for a health-related reason. Cost impact is estimated by multiplying lost productive time (absence hours plus hours lost from reduced performance) by the individual worker’s hourly labor cost. This is the recommended method of calculating the basic impact of absenteeism and its cost to the organization.
Hidden Costs of Absenteeism
While some organizations may track worker absenteeism, thus providing preliminary data useful in connecting cleaning impact on personnel costs, they may be missing all the absenteeism costs involved.
A 2008 survey conducted by Mercer/Marsh (Kronos Consulting E Mercer, LLC., 2008) identified the hidden costs of absenteeism. The survey found that, in addition to the payroll cost of the absent employee, organizations must hire temporary labor or offer overtime to cover the absent employee’s responsibilities and that the “hidden costs” should be factored into absenteeism calculations. To do so, multiply the additional hourly costs by the number of hours incurred and add this figure to the absent employee’s direct costs.
The survey also revealed that many employers fail to account for the 36 percent in administrative expenses that it takes to manage absence benefits. This includes tracking, reviewing, and processing the absence by company staff. Once that cost is determined, often as an annual percentage, it can be evenly divided by the total number of employees to determine the average per employee. It then is added to the average direct and indirect labor costs above, per employee.
Still more impact was revealed by the Mercer/Mash survey: the disruption in the labor supply affects productivity, even with replacement staff. This could lead to lost sales, late delivery of goods/services, customer dissatisfaction and loss of revenue. Respondents to the survey reported that unplanned absences caused a 54 percent decrease in productivity/output and a 39 percent drop in sales/customer service. If an organization can estimate these additional costs, the annual average cost of lost revenue per employee then would be increased.
3
The Value of Cleaning
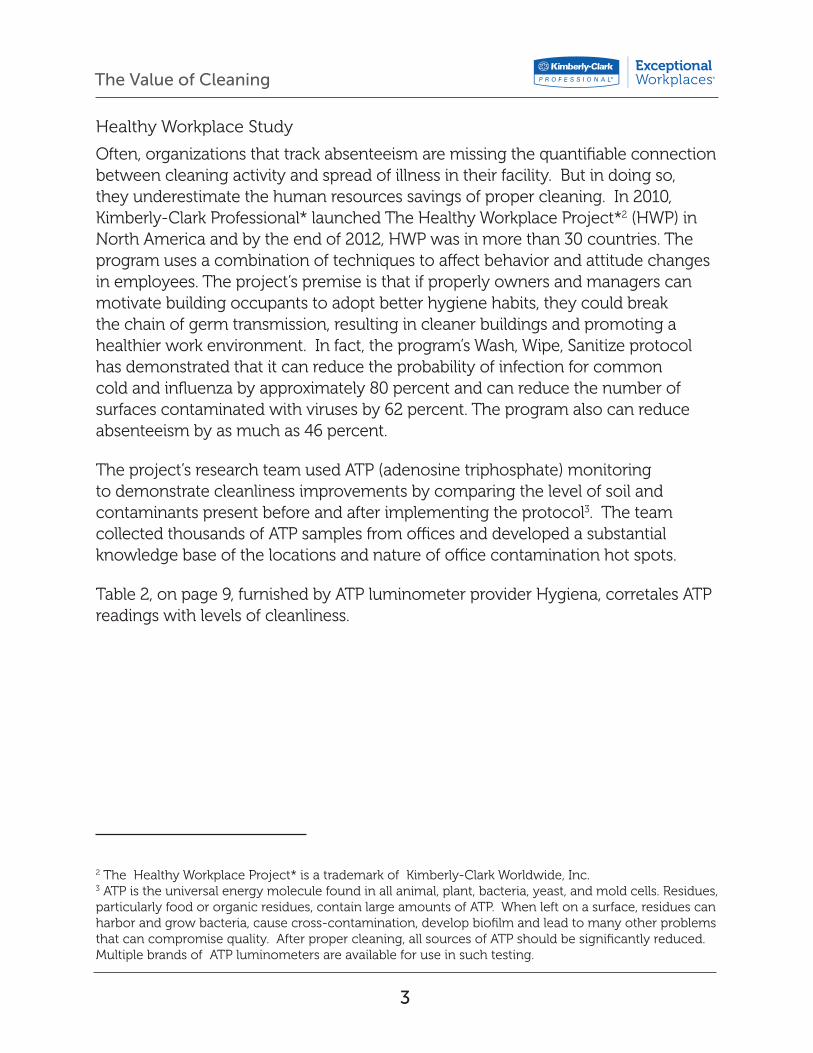
Healthy Workplace Study
Often, organizations that track absenteeism are missing the quantifiable connection between cleaning activity and spread of illness in their facility. But in doing so, they underestimate the human resources savings of proper cleaning. In 2010, Kimberly-Clark Professional* launched The Healthy Workplace Project*2 (HWP) in North America and by the end of 2012, HWP was in more than 30 countries. The program uses a combination of techniques to affect behavior and attitude changes in employees. The project’s premise is that if properly owners and managers can motivate building occupants to adopt better hygiene habits, they could break the chain of germ transmission, resulting in cleaner buildings and promoting a healthier work environment. In fact, the program’s Wash, Wipe, Sanitize protocol has demonstrated that it can reduce the probability of infection for common cold and influenza by approximately 80 percent and can reduce the number of surfaces contaminated with viruses by 62 percent. The program also can reduce absenteeism by as much as 46 percent.
The project’s research team used ATP (adenosine triphosphate) monitoring to demonstrate cleanliness improvements by comparing the level of soil and contaminants present before and after implementing the protocol3. The team collected thousands of ATP samples from offices and developed a substantial knowledge base of the locations and nature of office contamination hot spots.
Table 2, on page 9, furnished by ATP luminometer provider Hygiena, corretales ATP readings with levels of cleanliness.
2 The Healthy Workplace Project* is a trademark of Kimberly-Clark Worldwide, Inc.3 ATP is the universal energy molecule found in all animal, plant, bacteria, yeast, and mold cells. Residues, particularly food or organic residues, contain large amounts of ATP. When left on a surface, residues can harbor and grow bacteria, cause cross-contamination, develop biofilm and lead to many other problems that can compromise quality. After proper cleaning, all sources of ATP should be significantly reduced. Multiple brands of ATP luminometers are available for use in such testing.

4
The Value of Cleaning
Table 2: Hygiena ATP Levels of Cleanliness 4
Hygiena ATP Levels of CleanRelative Ligth Units
(RLU)
Ultra CleanSterile surfaces and food preparation areas
0-10
Very Clean Critical touch points
11-30
Good CleanFloor requirement and typical microfiber performance
31-80
Somewhat DirtyCaution: Surface should be cleaned and has some risk of contamination from disease-causing bacteria
81-200
DirtyWarning: Surface needs cleaning and has medium risk of contamination from disease-causing bacteria
201-500
Very DirtyDanger: Surface needs cleaning and has a medium to high risk of contamination from disease-causing bacteria
501-1,000
FilthyDancer: Surface needs cleaning and has a high risk of contamination from disease-causing bacteria
>1,000
The research team found in their monitoring that the percentage of office surfaces tested and found to have high levels of contamination (an ATP count of 300 or higher), includes:
● 75 percent of break room sink faucet handles;
● 48 percent of microwave door handles;
● 27 percent of keyboards;
● 26 percent of refrigerator door and handles;
● 23 percent of water fountain buttons; and
● 21 percent of vending machine buttons.
4 Kimberly-Clark used a Hygiena ATP luminometer to measure ATP. When ATP is broughtinto contact with Hygiena’s lucifering reagent in the Ultrasnap surface-testing device, light is emitted in direct proportion to the amount of ATP present. The system measures the amount of light generated in relative light units (RLUs) and provides information on the level of contamination in just seconds. The higher the RLU reading, the higher the level of contamination present ATP hygiene monitoring provides accurate and traceable verification of the hygienic status of a surface.

5
The Value of Cleaning
In addition, half of all computer mice and desk phones tested were found to have ATP llevels between 100 and 300. After implementation of the protocol, the levels decreased an average of 62 percent, providing significant improvement in overall workplace cleanliness.
To demonstrate the program could break the chain of transmission of germs, the research team engaged Dr. Charles Gerba of the University of Arizona to carry out a study to quantify the reduction of exposure of viruses after introduction of a hygiene intervention.
The study was conducted in a hundred-person office, where a person and a surface were contaminated with a surrogate virus at the beginning of the day. After 4 hours, numerous commonly touched surfaces and people’s hands were tested for the virus, and transmission was determined. The same test was conducted after introducing the project’s educate and engage protocol, and targeted hand and surface hygiene products.
The results demonstrated that if these viruses were placed on either the hand of one individual or on a common encountered surface like a door handle, up to half or more of the hands or surfaces in the office were contaminated within four hours. This illustrates how important a contaminated object or hand can be in the spread of a virus in an office environment.
After the hygiene intervention, there was a statistically significant reduction in the concentration of the virus on hands and surfaces, which in turn, greatly reduced the spread of the virus in the office. Mathematical modeling indicated that the probability of infection by the common cold, flu and other viruses among office employee was reduced by 80 percent. This was achieved with only half (52 percent) of the office employees participating in the intervention.
Additionally, ATP samples collected at sites adjacent to the virus sampling indicated there was a significant correlation between ATP reduction and virus reduction on surfaces. This suggests that reduction ATP readings can be used to monitor the success of the protocol.
The program was designed to deliver measurable value to human resource departments, facility managers and other influencers that are responsible for office employees. The program can deliver the following outcomes:
6
The Value of Cleaning
● Cleaner buildings with more satisfied tenants, giving property managers an edge
● Elevating the level of cleanliness in buildings without increasing annual cleaning costs of the existing cleaning contractor or in-house staff
● For Building Service Contractors, the ability to enhance client relationships by promoting workplace wellness
● Improved relations with employees who are concerned about cleanliness and personal hygiene
● A reduction in the probability of illness, which can positively impact the costs associated with worker absenteeism and presenteeism
®/*Trademarks of Kimberly-Clark Worldwide, Inc. or its affiliates. Marques déposées de
Kimberly-Clark Worldwide, Inc. ou de ses filiales.
© 2013 KCWW. K02886 K8593-13-01 1/13