gis modelling in support of earthquake-induced rockfall risk
TRANSCRIPT
GIS modelling in support of earthquake-induced rockfall risk assessment in the Port Hills, Christchurch
Biljana Lukovic, David Heron, William Ries & Chris Massey
Natural Hazards Division GNS Science, Lower Hutt, New Zealand
Phone: +64 4 570-4756 Fax: +64 4 570-1440 Email: [email protected]
Presented at SIRC NZ 2013 – GIS and Remote Sensing Research Conference University of Otago, Dunedin, New Zealand
August 29th – 30th 2013
Keywords and phrases: GIS, slope failure, rockfall, boulder rolls, cliff collapse, risk assessment, Port Hills, Christchurch
1.0 INTRODUCTION
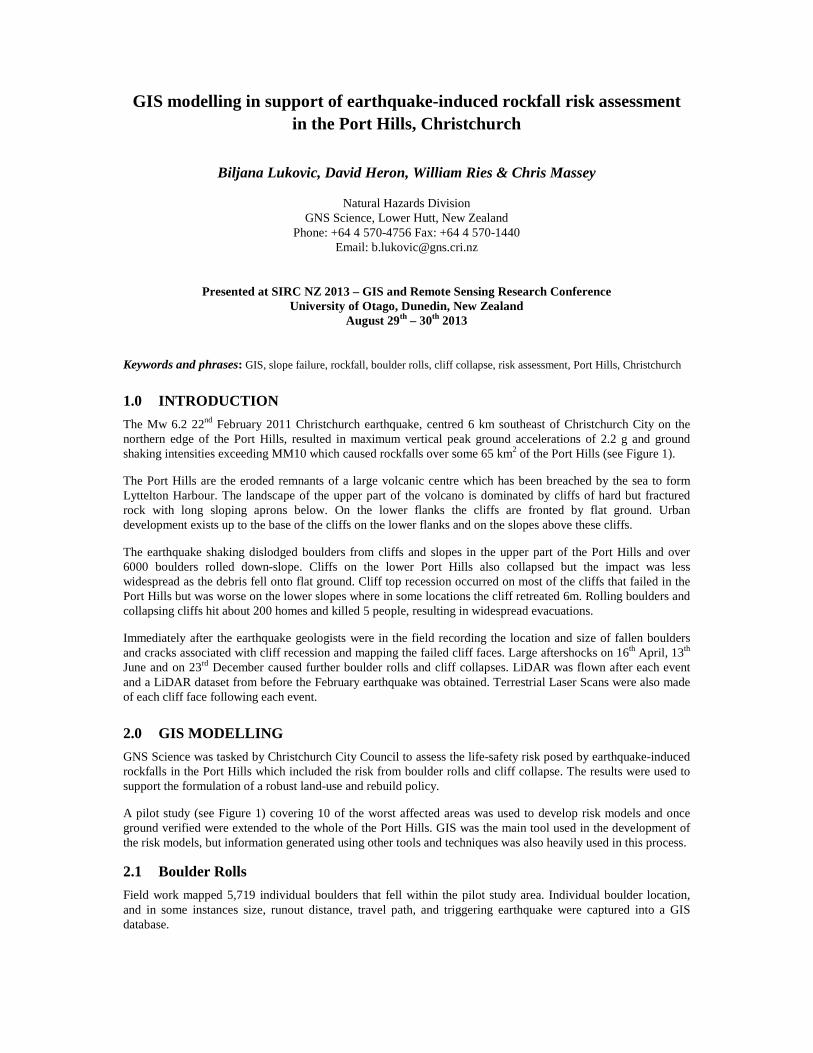
The Mw 6.2 22nd February 2011 Christchurch earthquake, centred 6 km southeast of Christchurch City on the northern edge of the Port Hills, resulted in maximum vertical peak ground accelerations of 2.2 g and ground shaking intensities exceeding MM10 which caused rockfalls over some 65 km2 of the Port Hills (see Figure 1).
The Port Hills are the eroded remnants of a large volcanic centre which has been breached by the sea to form Lyttelton Harbour. The landscape of the upper part of the volcano is dominated by cliffs of hard but fractured rock with long sloping aprons below. On the lower flanks the cliffs are fronted by flat ground. Urban development exists up to the base of the cliffs on the lower flanks and on the slopes above these cliffs.
The earthquake shaking dislodged boulders from cliffs and slopes in the upper part of the Port Hills and over 6000 boulders rolled down-slope. Cliffs on the lower Port Hills also collapsed but the impact was less widespread as the debris fell onto flat ground. Cliff top recession occurred on most of the cliffs that failed in the Port Hills but was worse on the lower slopes where in some locations the cliff retreated 6m. Rolling boulders and collapsing cliffs hit about 200 homes and killed 5 people, resulting in widespread evacuations.
Immediately after the earthquake geologists were in the field recording the location and size of fallen boulders and cracks associated with cliff recession and mapping the failed cliff faces. Large aftershocks on 16th April, 13th June and on 23rd December caused further boulder rolls and cliff collapses. LiDAR was flown after each event and a LiDAR dataset from before the February earthquake was obtained. Terrestrial Laser Scans were also made of each cliff face following each event.
2.0 GIS MODELLING
GNS Science was tasked by Christchurch City Council to assess the life-safety risk posed by earthquake-induced rockfalls in the Port Hills which included the risk from boulder rolls and cliff collapse. The results were used to support the formulation of a robust land-use and rebuild policy.
A pilot study (see Figure 1) covering 10 of the worst affected areas was used to develop risk models and once ground verified were extended to the whole of the Port Hills. GIS was the main tool used in the development of the risk models, but information generated using other tools and techniques was also heavily used in this process.
2.1 Boulder Rolls
Field work mapped 5,719 individual boulders that fell within the pilot study area. Individual boulder location, and in some instances size, runout distance, travel path, and triggering earthquake were captured into a GIS database.
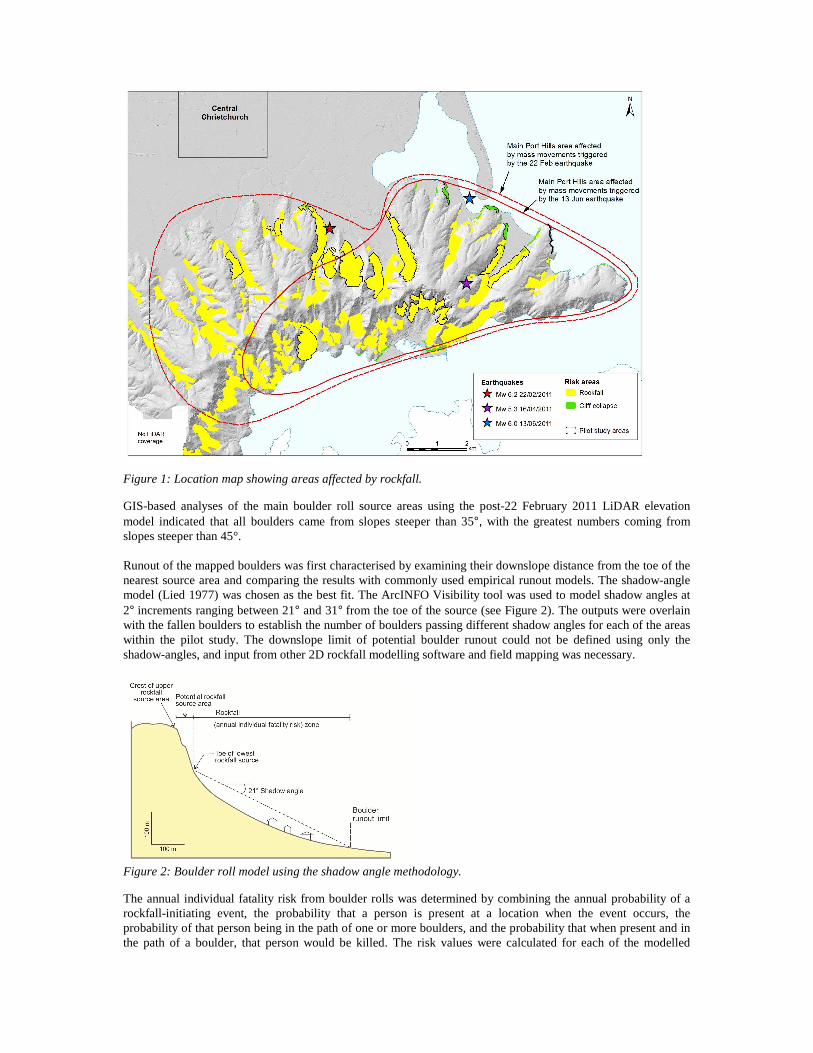
Figure 1: Location map showing areas affected by rockfall.
GIS-based analyses of the main boulder roll source areas using the post-22 February 2011 LiDAR elevation model indicated that all boulders came from slopes steeper than 35°, with the greatest numbers coming from slopes steeper than 45°. Runout of the mapped boulders was first characterised by examining their downslope distance from the toe of the nearest source area and comparing the results with commonly used empirical runout models. The shadow-angle model (Lied 1977) was chosen as the best fit. The ArcINFO Visibility tool was used to model shadow angles at 2° increments ranging between 21° and 31° from the toe of the source (see Figure 2). The outputs were overlain with the fallen boulders to establish the number of boulders passing different shadow angles for each of the areas within the pilot study. The downslope limit of potential boulder runout could not be defined using only the shadow-angles, and input from other 2D rockfall modelling software and field mapping was necessary.
Figure 2: Boulder roll model using the shadow angle methodology.
The annual individual fatality risk from boulder rolls was determined by combining the annual probability of a rockfall-initiating event, the probability that a person is present at a location when the event occurs, the probability of that person being in the path of one or more boulders, and the probability that when present and in the path of a boulder, that person would be killed. The risk values were calculated for each of the modelled
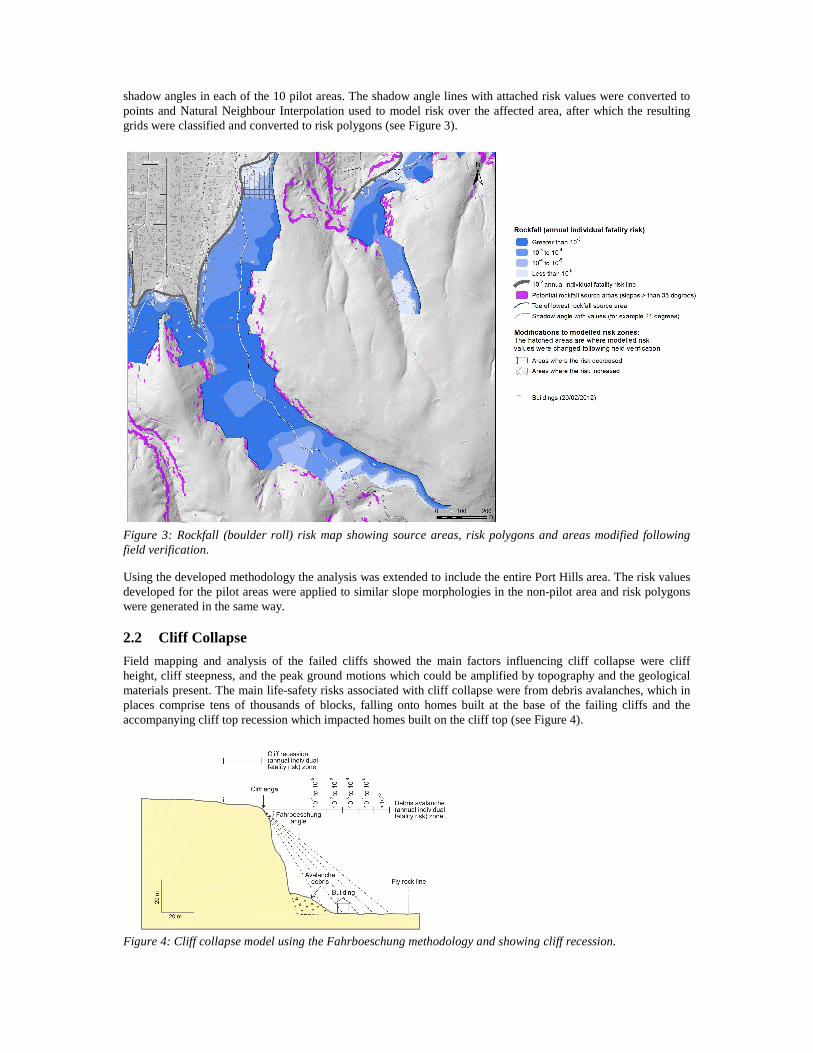
shadow angles in each of the 10 pilot areas. The shadow angle lines with attached risk values were converted to points and Natural Neighbour Interpolation used to model risk over the affected area, after which the resulting grids were classified and converted to risk polygons (see Figure 3).
Figure 3: Rockfall (boulder roll) risk map showing source areas, risk polygons and areas modified following field verification.
Using the developed methodology the analysis was extended to include the entire Port Hills area. The risk values developed for the pilot areas were applied to similar slope morphologies in the non-pilot area and risk polygons were generated in the same way.
2.2 Cliff Collapse
Field mapping and analysis of the failed cliffs showed the main factors influencing cliff collapse were cliff height, cliff steepness, and the peak ground motions which could be amplified by topography and the geological materials present. The main life-safety risks associated with cliff collapse were from debris avalanches, which in places comprise tens of thousands of blocks, falling onto homes built at the base of the failing cliffs and the accompanying cliff top recession which impacted homes built on the cliff top (see Figure 4).
Figure 4: Cliff collapse model using the Fahrboeschung methodology and showing cliff recession.
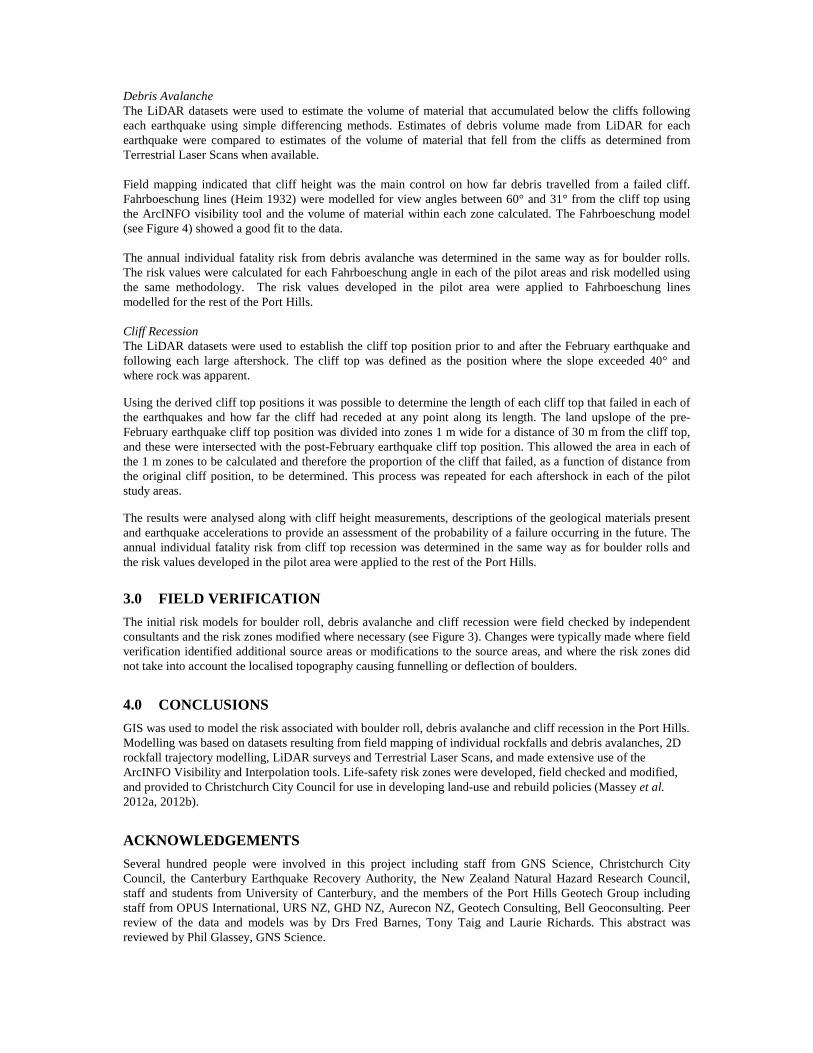
Debris Avalanche The LiDAR datasets were used to estimate the volume of material that accumulated below the cliffs following each earthquake using simple differencing methods. Estimates of debris volume made from LiDAR for each earthquake were compared to estimates of the volume of material that fell from the cliffs as determined from Terrestrial Laser Scans when available. Field mapping indicated that cliff height was the main control on how far debris travelled from a failed cliff. Fahrboeschung lines (Heim 1932) were modelled for view angles between 60° and 31° from the cliff top using the ArcINFO visibility tool and the volume of material within each zone calculated. The Fahrboeschung model (see Figure 4) showed a good fit to the data. The annual individual fatality risk from debris avalanche was determined in the same way as for boulder rolls. The risk values were calculated for each Fahrboeschung angle in each of the pilot areas and risk modelled using the same methodology. The risk values developed in the pilot area were applied to Fahrboeschung lines modelled for the rest of the Port Hills. Cliff Recession The LiDAR datasets were used to establish the cliff top position prior to and after the February earthquake and following each large aftershock. The cliff top was defined as the position where the slope exceeded 40° and where rock was apparent.
Using the derived cliff top positions it was possible to determine the length of each cliff top that failed in each of the earthquakes and how far the cliff had receded at any point along its length. The land upslope of the pre-February earthquake cliff top position was divided into zones 1 m wide for a distance of 30 m from the cliff top, and these were intersected with the post-February earthquake cliff top position. This allowed the area in each of the 1 m zones to be calculated and therefore the proportion of the cliff that failed, as a function of distance from the original cliff position, to be determined. This process was repeated for each aftershock in each of the pilot study areas.
The results were analysed along with cliff height measurements, descriptions of the geological materials present and earthquake accelerations to provide an assessment of the probability of a failure occurring in the future. The annual individual fatality risk from cliff top recession was determined in the same way as for boulder rolls and the risk values developed in the pilot area were applied to the rest of the Port Hills.
3.0 FIELD VERIFICATION
The initial risk models for boulder roll, debris avalanche and cliff recession were field checked by independent consultants and the risk zones modified where necessary (see Figure 3). Changes were typically made where field verification identified additional source areas or modifications to the source areas, and where the risk zones did not take into account the localised topography causing funnelling or deflection of boulders.
4.0 CONCLUSIONS
GIS was used to model the risk associated with boulder roll, debris avalanche and cliff recession in the Port Hills. Modelling was based on datasets resulting from field mapping of individual rockfalls and debris avalanches, 2D rockfall trajectory modelling, LiDAR surveys and Terrestrial Laser Scans, and made extensive use of the ArcINFO Visibility and Interpolation tools. Life-safety risk zones were developed, field checked and modified, and provided to Christchurch City Council for use in developing land-use and rebuild policies (Massey et al. 2012a, 2012b).
ACKNOWLEDGEMENTS
Several hundred people were involved in this project including staff from GNS Science, Christchurch City Council, the Canterbury Earthquake Recovery Authority, the New Zealand Natural Hazard Research Council, staff and students from University of Canterbury, and the members of the Port Hills Geotech Group including staff from OPUS International, URS NZ, GHD NZ, Aurecon NZ, Geotech Consulting, Bell Geoconsulting. Peer review of the data and models was by Drs Fred Barnes, Tony Taig and Laurie Richards. This abstract was reviewed by Phil Glassey, GNS Science.
REFERENCES
Heim, A. (1932) Bergsturz und Menschenleben. Zurich: Fretz and Wasmuth Verlag, 218 pp.
Lied, K. (1977) Rockfall problems in Norway. ISMES Publication, 90, pp. 51-53.
Massey, C.I., McSaveney, M.J., Lukovic, B., Heron, D., Ries, W., Moore, A., and Carey, J., 2012a. Canterbury earthquakes 2010/11 Port Hills slope stability: life-safety risk from rockfalls (boulder rolls) in the Port Hills, GNS Science Consultancy Report 2012/123. <http://resources.ccc.govt.nz/files/Homeliving/civildefence/chchearthquake/gns_ph_lifesafetyrockfall12684517web-s.pdf> Massey, C.I., McSaveney, M.J., and Heron, D. 2012b. Canterbury earthquakes 2010/11 Port Hills Slope Stability: Life-safety risk from cliff collapse in the Port Hills, GNS Science Consultancy Report 2012/124. <http://resources.ccc.govt.nz/files/Homeliving/civildefence/chchearthquake/gns_ph_lifesafetycliffcollapse12684515web-s.pdf>