earthquake induced rock shear through a deposition hole
TRANSCRIPT

Svensk Kärnbränslehantering ABSwedish Nuclear Fueland Waste Management Co
Box 250, SE-101 24 Stockholm Phone +46 8 459 84 00
Technical Report
TR-10-33
Earthquake induced rock shear through a deposition hole Modelling of three model tests scaled 1:10
Verification of the bentonite material model and the calculation technique
Lennart Börgesson, Clay Technology AB
Jan Hernelind, 5T Engineering AB
November 2010
TR-10-33
Earthquake induced rock shear through a deposition hole – Modelling of three m
odel tests scaled 1:10
CM
Gru
ppen
AB
, Bro
mm
a, 2
011

Tänd ett lager:
P, R eller TR.
Earthquake induced rock shear through a deposition hole Modelling of three model tests scaled 1:10
Verification of the bentonite material model and the calculation technique
Lennart Börgesson, Clay Technology AB
Jan Hernelind, 5T Engineering AB
November 2010
ISSN 1404-0344
SKB TR-10-33
Keywords: SKBdoc 1269264, Rock shear, Modelling, Scale test, Buffer, Bentonite, Canister, Stresses, Strain.
This report concerns a study which was conducted for SKB. The conclusions and viewpoints presented in the report are those of the authors. SKB may draw modified conclusions, based on additional literature sources and/or expert opinions.
A pdf version of this document can be downloaded from www.skb.se.

TR-10-33 3
Abstract
Three model shear tests of very high quality simulating a horizontal rock shear through a deposi-tion hole in the centre of a canister were performed 1986. The tests and the results are described by /Börgesson 1986/. The tests simulated a deposition hole in the scale 1:10 with reference density of the buffer, very stiff confinement simulating the rock, and a solid bar of copper simulating the canister. The three tests were almost identical with exception of the rate of shear, which was varied between 0.031 and 160 mm/s, i.e. with a factor of more than 5,000 and the density of the bentonite, which differed slightly. The tests were very well documented. Shear force, shear rate, total stress in the bentonite, strain in the copper and the movement of the top of the simulated canister were meas-ured continuously during the shear. After finished shear the equipment was dismantled and careful sampling of the bentonite with measurement of water ratio and density were made. The deformed copper “canister” was also carefully measured after the test.
The tests have been modelled with the finite element code Abaqus with the same models and tech-niques that were used for the full scale scenarios in SR-Site. The results have been compared with the measured results, which has yielded very valuable information about the relevancy of the mate-rial models and the modelling technique.
An elastic-plastic material model was used for the bentonite where the stress-strain relations have been derived from laboratory tests. The material model is made a function of both the density and the strain rate at shear. Since the shear is fast and takes place under undrained conditions, the density is not changed during the tests. However, strain rate varies largely with both the location of the ele-ments and time. This can be taken into account in Abaqus by making the material model a function of the strain rate for each element.
A similar model, based on tensile tests on the copper used in the scale tests, has been used for the copper.
Two element models were used. In one of them (model A) the bentonite was divided into three parts with different densities according to the measurements made during dismantling and sampling. In the other one (model B) the same density, corresponding to the weighted mean value, was used for all bentonite in the test. The reason for using both these models was to investigate whether the simplification done in SR-Site, where only one density was modelled and thus no consideration was taken to the incomplete homogenisation that remains after water saturation and swelling, would affect the results significantly.
The results show a remarkable agreement between modelled and measured results, in spite of the complexity of the models and the difficulties to measure stresses and strains under the very fast tests. In addition there was less than two per cent difference between the results of the simplified model with one density and the model with three densities. Figure 1 shows an example of results from Test 3 with the shear rate 160 mm/sec. i.e. the entire test took only 13/100 of a second.
The modelling results of both models were thus found to agree well with the measurements, which validates the SR-Site modelling of the rock shear scenario. It should be emphasized that the calcula-tions have been done without any changes or adaptations of material models or parameter values to test results.
The overall conclusion is that the modelling technique, the element mesh and the material models used in these analyses are well fitted and useful for this type of modelling.

4 TR-10-33
Figure 1. Measured total force as function of the shear deformation for Test 3 with the shear rate 160 mm/sec. Results from the calculations with the two models and the results of the measurements are shown.
0
50
100
150
200
250
0 5 10 15 20 25
Meas.
A Calc.
B Calc.Tot F
(kN
)
Deforma�on (mm)

TR-10-33 5
Sammanfattning
Tre högkvalitativa modellskjuvförsök som simulerar en horisontell bergskjuvning genom ett deponeringshål genomfördes 1986. Försöken och resultaten är beskrivna av /Börgesson 1986/. Försöken simulerade ett deponeringshål i skala 1:10 med en buffert med referensdensitet, mycket styv inneslutning som simulerade berget och en solid stång av koppar som simulerade kapseln. De tre försöken var i stort sett identiska med undantag av skjuvningshastigheten som varierades mellan 0,031 och 160 mm/s, dvs med mer än en faktor 5 000 och densiteten på bentoniten som skilde sig något. Försöken dokumenterades mycket väl. Skjuvkraft, skjuvningshastighet, totalspänningar i bentoniten, töjningar i kapseln och relativrörelsen hos kapselns överdel mättes kontinuerligt under försökens gång. Efter avslutad skjuvning demonterades utrustningen och en noggrann provtagning av bentoniten med mätning av vattenkvot och densitet gjordes. En noggrann inmätning av den defor-merade kapseln gjordes också efter försöket.
Försöken har modellerats med finita-element-programmet Abaqus med samma modeller och teknik som de scenarier som modellerats i full skala i SR-Site. Genom att jämföra resultaten med mätresul-taten har värdefull information om materialmodellens och modelleringsteknikens relevans erhållits.
En elasto-plastisk materialmodell användes för bentoniten där spännings-töjningssambandet tagits fram från laboratorieförsök. Materialmodellen är en funktion av både densiteten hos bentoniten och töjningshastigheten vid skjuvning. Eftersom skjuvningen är snabb och sker under odränerade förhållanden ändras inte densiteten under försöken. Däremot varierar töjningshastigheten med både elementens läge i elementmodellen och med tiden. Hänsyn till detta tas i Abaqus genom att material-modellen för varje element görs till en funktion av töjningshastigheten.
En liknande materialmodell, baserad på dragprovning av den koppar som användes i försöken, användes för kopparn.
Två elementmodeller har använts. I den ena (modell A) delades bentoniten in i tre delar med olika densitet enligt mätningarna som gjordes när försöken bröts. I den andra (modell B) användes en och samma densitet för all bentonit motsvarande det viktade medelvärdet. Anledningen till att båda dessa modeller användes var att se om den förenkling som gjorts i SR-Site, där endast en densitet modelle-rats och således ingen hänsyn tagits till den ofullständiga homogeniseringen som kvarstår vid vatten-mättnad och svällning, påverkar resultatet signifikant.
Resultaten visar en anmärkningsvärd överensstämmelse mellan modellerade och mätta resultat, trots modellernas komplexitet och svårigheter att mäta spänningar och töjningar under de snabba försöken. Resultaten av beräkningarna med en densitet och beräkningarna med tre densiteter skiljde sig dessutom åt med mindre än två procent. Figur 1 visar ett exempel på resultat från Test 3 med skjuvningshastigheten 160 mm/sekund dvs hela försöket tog 13/100 av en sekund.
Modelleringsresultaten för båda modellerna överensstämmer alltså väl med mätdata, vilket validerar resultaten från analyserna i SR-Site. Det bör understrykas att beräkningarna gjordes utan ändringar eller anpassningar av materialmodellernas parametervärden till mätresultaten.
Den övergripande slutsatsen är att modelleringsteknik, elementnät och materialmodeller är väl lämpade och användbara för denna typ av modellering.

6 TR-10-33
Figur 1. Mätt totalkraft som funktion av skjuvningsdeformation för Test 3 med skjuvningshastigheten 160 mm/sekund. Resultaten av beräkningarna med de två modellerna och resultaten av mätningarna visas.
0
50
100
150
200
250
0 5 10 15 20 25
Mätdata
A Beräknad
B Beräknad
Tota
l kra
� (k
N)
Deforma�on (mm)
TR-10-33 7
Contents
1 Introduction 91.1 General 91.2 Modelling of three model shear tests 91.3 Data storage 10
2 Model shear tests 112.1 General 112.2 Test set up 112.3 Test sequence 122.4 Test results 13
3 Material models 153.1 General 153.2 Bentonite model 153.3 Copper model 193.4 Contact surfaces 20
4 Element mesh 21
5 Calculations 255.1 General 255.2 Results 26
6 Calculated results from model A with three bentonite densities and comparison with measured results 29
6.1 General 296.2 Total force 296.3 Radial stress in the bentonite 316.4 Axial strain in the canister surface 336.5 Canister tilting 356.6 Deformed canister 386.7 Axial buffer displacement 40
7 Calculated results from model B with one bentonite density and comparison with measured results 43
7.1 General 437.2 Comparison between the results of model A and B 43
8 Evaluation and analyses 458.1 General 458.2 Model A 468.3 Model B 46
9 Conclusions 47
References 49
Appendix 1 Data and stress strain relations used for the different bentonite densities 51
Appendix 2 Results from modelling with bentonite model B (one density) 61Appendix 3 Storage of files 71

TR-10-33 9
1 Introduction
1.1 GeneralThis report is one in a series of reports that together address the response of the buffer and the canis-ter in a KBS-3 repository to shear movements in fractures intersecting deposition holes.
Rock shear movements to analyse are given as design requirements derived from previous safety assessments. Mechanical properties of the buffer are determined in laboratory tests that are inter-preted into a buffer material model with parameter values for the calculations. The buffer material model and the shear modelling calculation technique have been verified against three shear experi-ments on scale 1:10. Mechanical data for the canister insert and copper shell are obtained from labo-ratory tests yielding canister material models.
The mechanical impact on the buffer and on the canister insert and copper shell by shear movements are for SR-Site determined by finite element modelling. The calculated canister stresses and strains are propagated i) to an assessment of plastic and creep deformation against failure criteria for the copper shell, ii) to an analysis of the damage tolerance of the insert and iii) to an assessment of the margin to global collapse of the insert.
The overall evaluation of whether the calculated impacts result in failures of the canister is made in a design analysis report where impacts are compared to established failure criteria. The design analysis report also summarises the results of the entire series of rock shear analyses as well as several other mechanical load situations of relevance.
1.2 Modelling of three model shear testsThree model shear tests of very high quality simulating a horizontal rock shear through a deposi-tion hole in the centre of the canister were performed 1986. The tests and the results are described by /Börgesson 1986/. The tests simulated a deposition hole in the scale 1:10 with reference density of the buffer, very stiff confinement simulating the rock, and a solid bar of copper simulating the canister. The three tests were almost identical with exception of the rate of shear, which was varied between 0.031 and 160 mm/s, i.e. with a factor of more than 5,000. The tests were very well docu-mented. Shear force, shear rate, total stress in the bentonite, strain in the copper and the movement of the top of the simulated canister were measured continuously during the shear. After finished shear the equipment was dismantled and careful sampling of the bentonite with measurement of water ratio and density were made. The deformed copper “canister” was also carefully measured after the test.
Some attempts to model the tests were done and are reported in that report. However, no additional modelling of these tests has been done since then, which means that the present material models of bentonite have not been used for modelling these tests.
The comprehensive data collected in these tests are thus available and can be used to check the material models, the calculation sequence and the boundary conditions that have been used in the calculations for SR-Site /Hernelind 2010/. Although the scale differs with a factor of 10 renewed calculations using the same models and techniques applied on these tests and comparison with meas-ured results yield excellent possibility to validate the calculations and models or change the models if required.
These three 24 years’ old tests have thus been modelled with the same models and techniques as the full scale scenarios. The results have been compared with the measured results, which has yielded very valuable conclusions about the modelling technique. As will be shown in the report the calcula-tions agree well with measured data without modifying anything in the models or the calculation technique, which thus strongly validates the results achieved from the full scale scenario calcula-tions.

10 TR-10-33
For the sake of simplicity the copper bars in the tests simulating the canister in a deposition hole will be called canister and the steel tube cased with a bronze filter will be called rock in the text since they model these parts of a deposition hole.
1.3 Data storageThe input files, geometry definitions and script files are stored at SKB (SKBdoc 1272192). The names of the files are given in Appendix 3.
TR-10-33 11
2 Model shear tests
2.1 GeneralThe model shear tests are described in detail by /Börgesson 1986/. A brief summary of the tests will be given in this chapter.
2.2 Test set upThe deposition hole was scaled about 1:10, the diameter of the hole being 15.8 cm and the length 62.2 cm. The copper canister was simulated by rods of solid HPOF (high purity oxygen free) copper with a length of 45.0 cm and a diameter of 8.0 cm. The permeable rock was simulated by a cylindri-cal bronze filter with a thickness of 2 cm. This filter was made from small bronze pellets to give a maximum pore size of 12 µm. Such a filter is permeable enough to guarantee unlimited water supply for the bentonite without letting bentonite penetrate into the filter. It is also stiff enough to resist the swelling pressures and the local stress-concentrations during the shear. Filters were also mounted to cover the top and bottom of the deposition hole.
The cylindrical filter was surrounded by a cylinder made of acid proof stainless steel 2333. In order to guarantee a perfect fitting, the inner diameter of the steel cylinder was made 0.2 mm smaller than the outer diameter of the filter. The filter was then mounted into the steel cylinder by expanding the steel cylinder through heating. The cylinders were made in two 30 cm long parts in order to locate the shear plane at the center of the canister, and to orient it perpendicularly to its axis. The cylinders were rigidly mounted to form one unit in a steel frame during the water saturation phase while one of them was free to move during the shearing phase.
The mounted apparatus with the frame and the cylinders was kept in a vertical standing position with the fixed cylinder below the moveable during the mounting and water saturating procedures. At shearing the apparatus was turned to a horizontal position.
Altogether 18 sensors were installed in order to measure stresses and strains during saturation and shear: four force transducers to measure the required force during shear, three displacement trans-ducers, six pressure transducers to measure the pressure at the clay/canister interface and at the clay/rock interface, and five strain gauges to measure canister-strain. Figure 2-1 shows the location of the sensors. The four force transducers were later reduced to three. Two of the displacement transducers were used to measure the shearing of the modeled rock while the third was used to measure the move-ment of the end of the canister relative to the simulated rock. This was made by use of a copper tube that was fixed at the canister and passed through the filter and the steel cylinder.
Figure 2-1 shows an outline figure of the test and the instrumentation. Figure 2-2 shows two pictures taken during mounting of the equipment and during shear.
The canister was made from a piece of copper which was turned in a lathe and cut to the correct dimensions. Then the cable paths were drilled and the pressure transducers and strain gauges mounted in the canister. Parallel to this the bentonite was prepared. Blocks were taken from MX-80 samples that were originally intended for the Buffer Mass Test in Stripa. They had a density of ρ = 2,140 kg/m3 and a water content of w = 9%. These blocks were sawed to fit into the shear appa-ratus and given the size and weight suited for a final target density of ρ = 2,050 kg/m3 in water satu-rated and expanded state. The bentonite originally consisted of 6 pieces, one below, one above and 4 surrounding the canister.
Finally, the end pieces were mounted and the water-bearing tubes connected. A slight overpres-sure was applied to the bottom in order to have a flow of water upwards through the filter during the whole saturation procedure which would prevent big air-bubbles from delaying the saturation. Distilled water was used to saturate the bentonite.

12 TR-10-33
2.3 Test sequenceBefore shearing the bentonite was wetted with distilled water through the surrounding filters by applying a small water pressure and left to saturate for between two and four months. The swelling pressure and the water inflow were continuously measured. Two months was sufficient to get steady state conditions and no more water intake was noted after that time.
Figure 2-2. Pictures of the equipment during mounting (left), where the shear plane and the very stiff immovable part of the equipment are seen, and during shear (right).
Figure 2-1. Outline figure of the test and the measuring equipment.F1–F4 force transducers,σ5–σ10 pressure transducers,δ11–δ13 displacement transducers,ε14–ε18 strain gauges.

TR-10-33 13
Three shear tests were performed, each with very different shear rate but at otherwise identical con-ditions. The shear displacements were about 30 mm for the slower tests but less for the very fast test. The following shear rates and shear displacements were used:
Test 1: Shear rate 0.031 mm/s and shear displacement 28 mm.Test 2: Shear rate 1.9 mm/s and shear displacement 30 mm.Test 3: Shear rate 160 mm/s and shear displacement 21 mm.
The data collection was made in two different ways. In Tests 1 and 2 data was recorded by suc-cessively printing the values. In Test 3 the data was collected by a computer, recorded by tape and simultaneously plotted. This explains way the curves from Test 3 are smoother in appearance.
After finished shearing the equipment was dismantled and the bentonite carefully sampled with measurement of density and water ratio. Also the deformed canister was measured after the test.
2.4 Test resultsMost measuring results are described and compared to calculated results in the forthcoming chapters. However, the water saturation phase with subsequent evolution of the swelling pressure is not mod-elled since this process is not of interest for the shear case, with exception of the final swelling pres-sure that needs to be defined for the modelling. Figure 2-3 shows an example of measured swelling pressure during the wetting phase (Test 1).
The measured swelling pressure varied both between each pressure transducer and between the three tests. However the average swelling pressures were
Test 1: σs = 9.4 MPaTest 2: σs = 8.6 MPaTest 3: σs = 10.0 MPa
yielding an average of σs = 9.3 MPa.
Figure 2-3. Measured swelling pressure as function of evolved time from start wetting during the wetting phase of Test 1.
14 TR-10-33
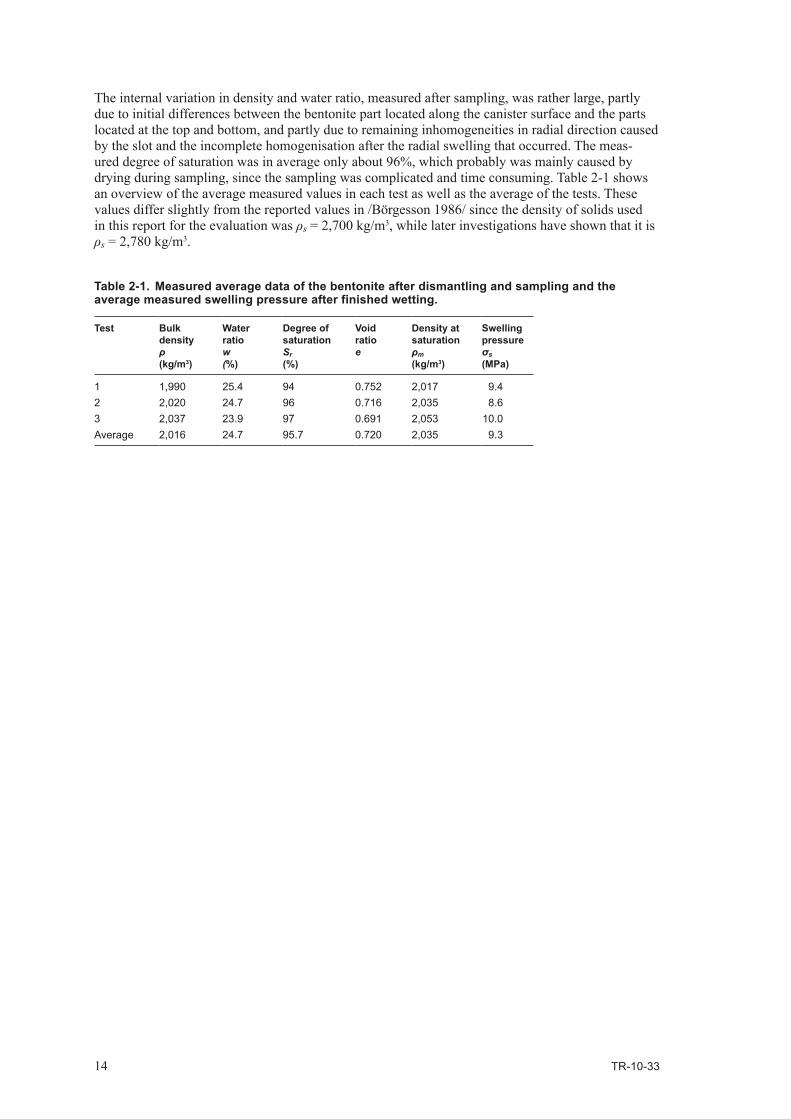
The internal variation in density and water ratio, measured after sampling, was rather large, partly due to initial differences between the bentonite part located along the canister surface and the parts located at the top and bottom, and partly due to remaining inhomogeneities in radial direction caused by the slot and the incomplete homogenisation after the radial swelling that occurred. The meas-ured degree of saturation was in average only about 96%, which probably was mainly caused by drying during sampling, since the sampling was complicated and time consuming. Table 2-1 shows an overview of the average measured values in each test as well as the average of the tests. These values differ slightly from the reported values in /Börgesson 1986/ since the density of solids used in this report for the evaluation was ρs = 2,700 kg/m3, while later investigations have shown that it is ρs = 2,780 kg/m3.
Table 2-1. Measured average data of the bentonite after dismantling and sampling and the average measured swelling pressure after finished wetting.
Test Bulk densityρ (kg/m3)
Water ratiow (%)
Degree of saturationSr (%)
Void ratioe
Density at saturationρm (kg/m3)
Swelling pressureσs (MPa)
1 1,990 25.4 94 0.752 2,017 9.42 2,020 24.7 96 0.716 2,035 8.63 2,037 23.9 97 0.691 2,053 10.0Average 2,016 24.7 95.7 0.720 2,035 9.3

TR-10-33 15
3 Material models
3.1 GeneralThe finite element code Abaqus has been used for the calculations. The materials have been mod-elled as elastic-plastic materials with stress-strain properties that correspond to the different materi-als and the shear rate applied. The material models and the calculation technique have gradually been improved as a consequence of improved knowledge in concordance with the modelling of the actual rock shear cases for SR-Site.
3.2 Bentonite modelThe bentonite is modelled with identical models as used for the SR-Site calculations but adapted to the bentonite used in the scale tests, the actual density of the bentonite and to the actual strain rate. The bentonite buffer is modelled using only total stresses that don’t include the pore water pres-sure, the reason being the very fast compression and shear. The stress-strain relation is in Abaqus expressed with von Mises stress σj that describes the “shear stress” in three dimensions according to Equation 3-1.
σj = (((σ1–σ3)2 + (σ1–σ2)2 + (σ2–σ3)2)/2)1/2 (3-1)
where
σ1, σ2 and σ3 are the major principal stresses.
At triaxial tests σ2 and σ3 are equal and the Mises stress equal to the deviator stress q.
q = (σ1–σ3) (3-2)
The stress-strain properties of bentonite have been investigated in several laboratory studies /Börgesson et al. 1995, 2004, Börgesson and Hernelind 2006/. The results of the studies and the resulting material model used for SR-Site are described in two separate reports /Börgesson et al. 2010, Dueck et al. 2010/. The material used for the modelling in SR-Site differs from the material used for the scale tests, since MX-80Ca (MX-80 ion-exchanged from Na-bentonite to Ca-bentonite) is used as reference buffer material in SR-Site while unaffected MX-80 was used in the scale tests.
Relation between shear strength and densityThe most important property of the buffer in a rock shear scenario is the shear strength since the shear strength limits the stiffness of the buffer. When the shear strength is reached the buffer can be plastically deformed without additional stresses. The higher the shear strength of the buffer is the higher stresses will be in the canister.
The shear strength of MX-80 has been measured at different densities at different conditions. Figure 3-1 shows the results together with measurements on Ca-bentonites. See /Börgesson et al. 2010/ and /Dueck et al. 2010/. The void ratio e is used in the figure instead of the density at water saturation since Abaqus uses void ratio as variable. The void ratio is defined as the ratio between the volume of the voids and the volume of the solids and can be calculated from the density according to Equation 3-3.
(3-3)
where
ρs = density of solids = 2,780 kg/m3
ρm = density at water saturationρs = density of water = 1,000 kg/m3.

16 TR-10-33
Relation between shear strength and strain rateThe shear strength of bentonite is as for many materials dependant on the strain rate. Investigations of the influence of strain rate have yielded a dependency described by Equation 3-4 /Börgesson et al. 2010/.
n
s
sfsfs v
vqq
=
00 (3-4)
where
vs = strain ratevs0 = reference strain rate = 10–4 1/sqfs = deviator stress at failure at the strain rate vs
qfs0 = deviator stress at failure at the reference strain rate vs0
n = 0.038
The value n = 0.038 has been found valid for MX-80 and some other bentonites and is used for SR-Site.
Applying the relation between shear strength qfs0 and void ratio at the strain rate vs0 = 10–4 according to the x-marks in Figure 3-1, Equation 3-4 thus yields the shear strength of the material at different strain rates and void ratios.
Stress-strain relationNumerous triaxial and uniaxial tests have shown that the stress-strain relation during shear is very similar if the deviator stress (Mises stress) is normalised against the strength (maximum deviator stress). This means that both the elastic and the plastic parts are proportional to the actual strength. A general stress-strain relation for uniaxial unconfined compression with the following properties has been derived for SR-Site /Börgesson et al. 2010/:
Figure 3-1. Measured deviator stress at failure as a function of void ratio for different bentonites at different test techniques. The relation used for MX-80 in the calculations is marked with x and relates to the strain rate 10–4 s–1. For information about the legend of the different test results; see /Dueck et al. 2010/.
0
1000
2000
3000
4000
5000
6000
0.60 0.65 0.70 0.75 0.80 0.85 0.90
Devi
ator
stre
ss a
t fai
lure
(kPa
)
Void ra�o
MX-80 UC
MX-80 T
start value of void ra�o
MX -80 12˚C UC
MX-80 a�er w.p. UC
MX-80 a�er w.p. T
MX-80Ca T
MX-80Na T
DepCaN UC
DepCaN T
DepCaN 12˚C UC
Values used for modelling
( )

TR-10-33 17
• Linearelasticinthestraininterval0<ε<≈1%withanelasticitythatyields58%ofthemaxi-mumMisesstressatthestrainε≈1%.
• Plastichardeninginthestraininterval≈1%<ε<≈5.3%withthemaximumMisesstressdeter-mined according to the relation in Figure 3-1.
• Almostideallyplasticatε>≈5.3%.
For the buffer material with the density at saturation ρm = 2,020 kg/m3 (e = 0.745) at the reference strain rate (vs0 = 10–4 s–1) this yields an E-modulus of E = 179 MPa and a maximum Mises stress of qfs0 = 3.10 MPa at the strain ε > 5.4%.
The shear takes place at such a high rate that no pore water transport can occur during the shear, which means that no volume change of the water saturated material can take place. Thus Poisson’s ratio must be close to 0.5, corresponding to no volume change. However, a small amount of volume change will appear due to compressibility of water and therefore Poisson's ratio has been chosen to
v = 0.49
in all calculations.
Elastic-plastic stress-strain relationThe stress-strain relation can be achieved with an elastic-plastic material model according to Table 3-1.
Since the elastic strain is added to the plastic strain the total strain at the maximum Mises stress will be ε = 5.4%.
By applying the influence of the strain rate according to Equation 3-4 new values of the maximum Mises stress and corresponding data for the elastic plastic material model can be derived for other strain rates. Table 3-2 shows the results as a table with strain rates varying between 10–6 s–1 and 103 s–1.Linearinterpolationisappliedbetweenthetabulatedvalues.
Abaqus has a unique feature that allows for assigning individual strain rate dependant properties. The plastic properties of each element can be made a function of the strain rate of the element. However, this feature does not allow for changes in elastic properties but only plastic, so a constant elasticity must be used. Since the elasticity only affects the strain at failure the E-modulus of an average strain rate (vs = 0.1 s–1) has been used in the calculation which makes the strain at failure to be between about 4.5% and 6.0%. The resulting stress-strain relations at different strain rates are plotted in Figure 3-2.
Table 3-2 and Figure 3-2 only describes the properties at one density. Since the density of the ben-tonite in the three tests varied both in average and in different parts of the simulated deposition hole, the properties at other densities are also required and have been derived in an identical way as for the density 2,020 kg/m3. These properties are shown in Appendix 1 for the densities 1,970 kg/m3, 2,020 kg/m3, 2,040 kg/m3, 2050 kg/m3 and 2,070 kg/m3.
Table 3-1. Elastic-plastic material data for the bentonite buffer at one density and one strain rate.
Material ρm kg/m3
Rate of strainvs
s–1
Elastic part Plastic part: von Mises true stress σj (MPa) at the following plastic nominal strains εp
E MPa
ν εp= 0
εp= 0.004
εp= 0.01
εp= 0.018
εp= 0.026
εp= 0.036
εp= 0.46
εp= 1.0
MX-80 2,020 10–4 179 0.49 1.79 2.39 2.75 2.93 3.06 3.10 3.06 3.06

18 TR-10-33
Figure 3-2. Stress-strain model of MX-80 bentonite at different strain rates (s–1) at the density at saturation 2,020 kg/m3 plotted as Mises stress as function of the engineering strain.
0
1
2
3
4
5
6
7
0 0.2 0.4 0.6 0.8 1 1.2
Stre
ss M
Pa
Engineering strain
Density 2020
1.00E-06
1.00E-04
1.00E-03
1.00E-02
0.1
1
10
100
1000
0
1
2
3
4
5
6
7
0 0.01 0.02 0.03 0.04 0.05 0.06 0.07 0.08 0.09 0.1
Stre
ss M
Pa
Engineering strain
Density 2020
1.00E-06
1.00E-04
1.00E-03
1.00E-02
0.1
1
10
100
1000

TR-10-33 19
Table 3-2. Elastic-plastic material data for the bentonite buffer at the density 2,020 kg/m3 (e = 0.745) and all strain rates.
Material ρm kg/m3
Rate of strainvs
s–1
Elastic part Plastic part: von Mises true stress σj (MPa) at the following plastic nominal strains εp
E MPa
ν εp= 0
εp= 0.004
εp= 0.01
εp= 0.018
εp= 0.026
εp= 0.036
εp= 0.46
εp= 1.0
MX-80 2,020 10–6 150 0.49 1.50 2.01 2.30 2.46 2.56 2.60 2.57 2.57MX-80 2,020 10–4 179 0.49 1.79 2.39 2.75 2.93 3.06 3.10 3.06 3.06MX-80 2,020 10–3 195 0.49 1.95 2.61 2.99 3.20 3.33 3.38 3.34 3.34MX-80 2,020 10–2 213 0.49 2.13 2.85 3.27 3.49 3.64 3.69 3.65 3.65MX-80 2,020 10–1 233 0.49 2.33 3.11 3.57 3.81 3.97 4.03 3.98 3.98MX-80 2,020 1.0 254 0.49 2.54 3.39 3.90 4.16 4.34 4.40 4.35 4.35MX-80 2,020 10 277 0.49 2.77 3.70 4.25 4.54 4.73 4.80 4.74 4.74MX-80 2,020 100 303 0.49 3.03 4.04 4.64 4.96 5.16 5.24 5.18 5.18MX-80 2,020 1,000 330 0.49 3.30 4.41 5.07 5.41 5.64 5.72 5.65 5.65
3.3 Copper modelThe stress-strain properties of the copper in the copper bars used to simulate the canister in the scale tests have been investigated by several laboratories. Problems with sampling technique made some test results erroneous. The most relevant tests were made in 2010 by Exova AB on samples cut and drilled from the upper 8 cm of the solid copper cylinder used in one of the shear tests. Three tension tests were made with very similar results. Figure 3-3 shows the stress-strain relation of one of the tests. The tests were made with a strain rate of about 5%/s.
Just as for the bentonite an elastic-plastic material was used for the copper, with a constant E-modulus and strain-rate dependent plasticity. For copper the strain-rate dependent plasticity is based on the measurements at 5%/s and for other strain-rates these values are multiplied by a factor. The strain rate dependency is identical to the one used in the rock shear calculations for SR-Site and described by /Hernelind 2010/. The model is described in Table 3-3. Examples of stress-strain rela-tion for different strain rates are shown in Figure 3-4.
Figure 3-3. Measured stress-strain relation of the copper in the test canister (Testbar 1).
0
50
100
150
200
250
0.0% 10.0% 20.0% 30.0% 40.0% 50.0% 60.0%
Strain %
Stre
ss M
Pa

20 TR-10-33
3.4 Contact surfacesAll the boundaries of the bentonite against the copper canister are equipped with contact surfaces. All contact surfaces have friction at sliding along the elements with no cohesion and the friction coefficient 0.1, i.e. the friction angle and cohesion are
φ = 5.7°
c = 0 kPa
The contact is thus released when the swelling pressure is lost.
Figure 3-4. Copper model plotted as Mises stress as function of the engineering strain for different strain-rates (s–1). The measured relation (denoted “test”) at the strain rate 5%/s is also plotted and is in almost complete agreement with the model for the same strain rate.
Table 3-3. Elastic-plastic material data for the copper.
Rate of strainvs
s–1
Elastic part Plastic part: von Mises stress σj (MPa) at the following plastic logarithmic strains (εp)
E GPa
ν εp=0.0
εp=1.0∙10–4
εp=5.0∙10–3
εp=0.01
εp=0.05
εp=0.10
εp=0.20
εp=0.30
εp=0.40
εp=0.44
0 120 0.33 17.4 25.7 50.3 58.0 92.0 127.0 187.0 232.0 264.0 68.910–6 120 0.33 17.7 26.2 51.3 59.2 93.8 129.5 190.7 236.7 269.3 70.310–5 120 0.33 18.1 26.7 52.3 60.3 95.7 132.1 194.6 241.4 274.7 71.70.001 120 0.33 18.5 27.3 53.4 61.6 97.6 134.8 198.5 246.2 280.2 73.10.005 120 0.33 19.1 28.2 55.2 63.6 100.9 139.4 205.2 254.6 289.7 75.60.05 120 0.33 19.5 28.8 56.3 64.9 103.0 142.2 209.4 259.8 295.6 77.20.5 120 0.33 19.9 29.4 57.5 66.3 105.1 145.1 213.7 265.1 301.7 78.7
0
20
40
60
80
100
120
140
160
180
200
0.0% 2.0% 4.0% 6.0% 8.0% 10.0% 12.0% 14.0% 16.0% 18.0% 20.0%
Stre
ss M
Pa
Plas�c engineering strain %
Copper
plas�c
1.00E-06
1.00E-05
1.00E-03
5.00E-03
5.00E-02
5.00E-01
test

TR-10-33 21
4 Element mesh
The element mesh includes the bentonite and the copper canister. The confining steel tube is not modelled but instead all nodes at the outer boundary of the bentonite buffer have prescribed zero displacement simulating the lower fixed part of the steel tube and constant displacement rate of the upper half simulating the shear movement. A mesh with about the same number of elements in the bentonite buffer as in the calculations of the earthquake induced rock shear for SR-Site /Hernelind 2010/ is desired. Figure 4-1 shows the element mesh. The element size is approximately 5×5×5 mm3, which renders a total of about 50,000 elements. The buffer between the rock and the canister con-sists of 8 elements in radial direction, which can be compared to 6 elements, which were used in the SR-Site model.
The boundaries between the bentonite and the copper canister are equipped with contact surfaces. Eight-node elements with reduced integration have been used.
The buffer material has been divided into three different parts with different density and thus differ-ent stress-strain relations as shown in Figure 4-2.
Figure 4-1. The element mesh. The shearing part of the buffer is removed in the right figure. The different grey scales represent the three different bentonite densities used in the model.

22 TR-10-33
The reason for dividing the buffer in three different zones is that the measurement of the density distribution after the detailed sampling at the end of the tests showed that the bentonite was not fully homogenised after completed water saturation. Figure 4-3 shows as an example a copy of measured water content distribution as a function of the distance to the copper bar in Test 2 of the scale tests in 8 different levels (C–J) /Börgesson 1986/.
An evaluation of the measured densities and density distributions has been made and the results are shown in Table 4-1, where the density of the different parts in the three tests and the resulting aver-age density of each test are shown.
The average densities are close to the densities evaluated in the report and shown in Table 2-1.
Figure 4-2. The different parts in the buffer of the scale test used in the calculations.
Part 1 (rim) Part 2 (radial) Part 3 (axial)
Part 1: a rim at the outer surface with the thickness 10 mm (two elements)Part 2: the rest of the buffer between the “rock” and the canisterPart 3: the end parts
Table 4-1. Evaluated densities of the three parts shown in Figure 4-3.
Test No. Density at saturation kg/m3
Part 1 Part 2 Part 3 Average
Test 1 1,970 2,050 2,020 2,019Test 2 2,020 2,050 2,040 2,039Test 3 2,020 2,070 2,050 2,050

TR-10-33 23
Figure 4-3. Example of measured inhomogeneities in the bentonite in Test 2. The water content is plotted as function of the radial distance to the copper canister at 8 different levels.

TR-10-33 25
5 Calculations
5.1 GeneralAbaqus version 6.9-1 has been used for the calculations. The influence of shear rate on the shear stress was taken into account by using the rate dependant stress-strain model valid for the speci-fieddensities.LargestrainsandlargedisplacementsareconsideredinAbaqus.Time-incrementsare chosen by the program but can be guided by mass-scaling.
Inertial effects were not considered in the modeling. The shear rate only influenced the stress-strain relations. In the very fast Test 3, which was run under 0.1 second, such effect could be present at the startup when accelerating the top part of the device. However, the logical results and good agreement between measurements and calculations for all three tests indicate that these effects were negligible.
The calculations were done in two steps. At first the swelling pressure (10 MPa) was applied and then the shear phase started and was run until about the same displacement was reached as in the different tests as shown in Table 5-1.
The value 10 MPa is equal to the average measured swelling pressure in Test 3 but a little higher than in Tests 1 and 2. The same initial swelling pressure was used in all parts of the buffer, which deviates from the expected swelling pressure if evaluated according to the densities. However, the swelling pressure applied in the model has insignificant influence on the results since the buffer is virtually incompressible (v = 0.49) and the stress-strain relation is controlled by the density and not directly by the swelling pressure.
In order to try to get the most relevant modelling results the buffer was divided into three parts with different density as described earlier. However, the calculations of the earthquake induced rock shear for SR-Site /Hernelind 2010/ were made with only one density and one can expect some inhomo-geneities with lower density at the rock surface (see /Åkesson et al. 2010/), which has not been considered in the rock shear calculations for SR-Site. In order to investigate the influence of this simplification the same calculations of the scale tests were made with the weighted average of the measured densities. Table 5-2 shows the densities used for the different calculations.
Table 5-2. Densities used in the calculations.
Density kg/m3
Model A (3 densities) Model B(1 density)Part 1 Part 2 Part 3
Test 1 1,970 2,050 2,020 2,020Test 2 2,020 2,050 2,040 2,040Test 3 2,020 2,070 2,050 2,050
Table 5-1. Shear distance in the calculations.
Shear distance
Test 1 30 mmTest 2 30 mmTest 3 23 mm
26 TR-10-33
5.2 ResultsThe results include a large number of data produced in each calculation step with mainly stresses and strains in the bentonite and copper in all elements at different times. Since the only really interesting results are the ones that can be compared with measurements, no complete result reporting will be done. Chapter 6 will report and compare measured and calculated results.
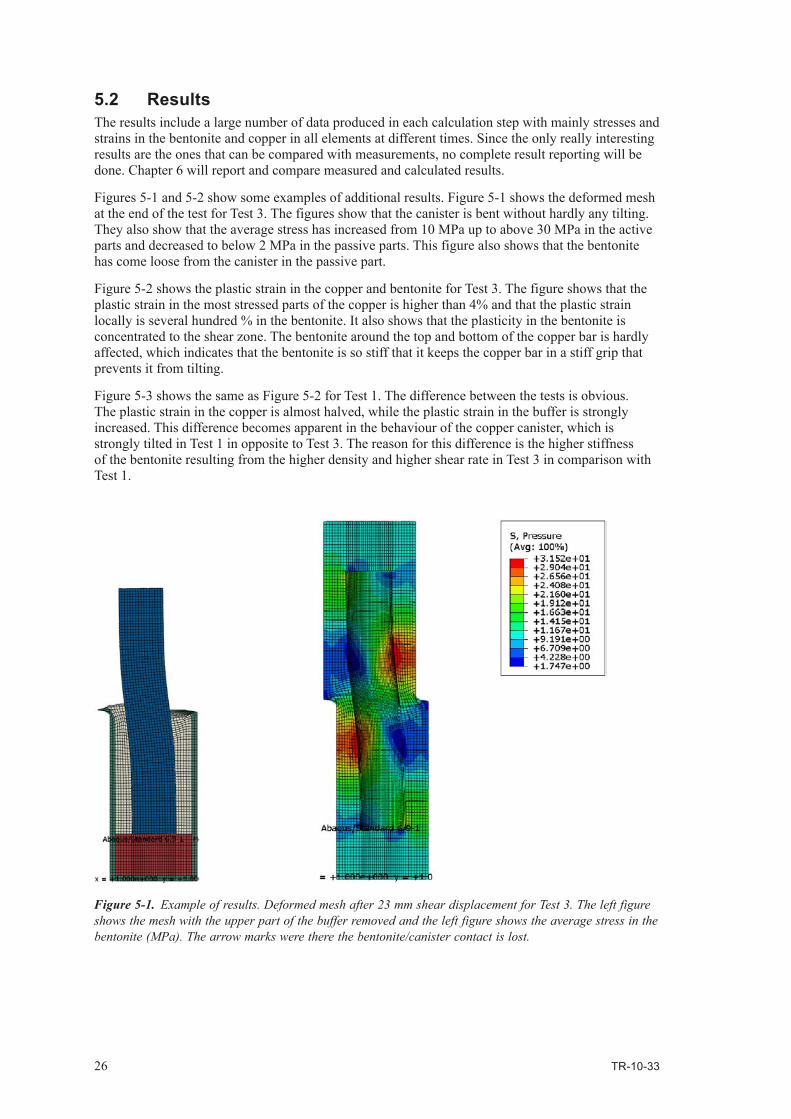
Figures 5-1 and 5-2 show some examples of additional results. Figure 5-1 shows the deformed mesh at the end of the test for Test 3. The figures show that the canister is bent without hardly any tilting. They also show that the average stress has increased from 10 MPa up to above 30 MPa in the active parts and decreased to below 2 MPa in the passive parts. This figure also shows that the bentonite has come loose from the canister in the passive part.
Figure 5-2 shows the plastic strain in the copper and bentonite for Test 3. The figure shows that the plastic strain in the most stressed parts of the copper is higher than 4% and that the plastic strain locally is several hundred % in the bentonite. It also shows that the plasticity in the bentonite is concentrated to the shear zone. The bentonite around the top and bottom of the copper bar is hardly affected, which indicates that the bentonite is so stiff that it keeps the copper bar in a stiff grip that prevents it from tilting.
Figure 5-3 shows the same as Figure 5-2 for Test 1. The difference between the tests is obvious. The plastic strain in the copper is almost halved, while the plastic strain in the buffer is strongly increased. This difference becomes apparent in the behaviour of the copper canister, which is strongly tilted in Test 1 in opposite to Test 3. The reason for this difference is the higher stiffness of the bentonite resulting from the higher density and higher shear rate in Test 3 in comparison with Test 1.
Figure 5-1. Example of results. Deformed mesh after 23 mm shear displacement for Test 3. The left figure shows the mesh with the upper part of the buffer removed and the left figure shows the average stress in the bentonite (MPa). The arrow marks were there the bentonite/canister contact is lost.

TR-10-33 27
Figure 5-3. Example of results. Deformed mesh after 30 mm shear displacement for Test 1. The figures show the plastic strain in the copper and in the bentonite.
Figure 5-2. Example of results. Deformed mesh after 23 mm shear displacement for Test 3. The figures show the plastic strain in the copper and in the bentonite.
28 TR-10-33
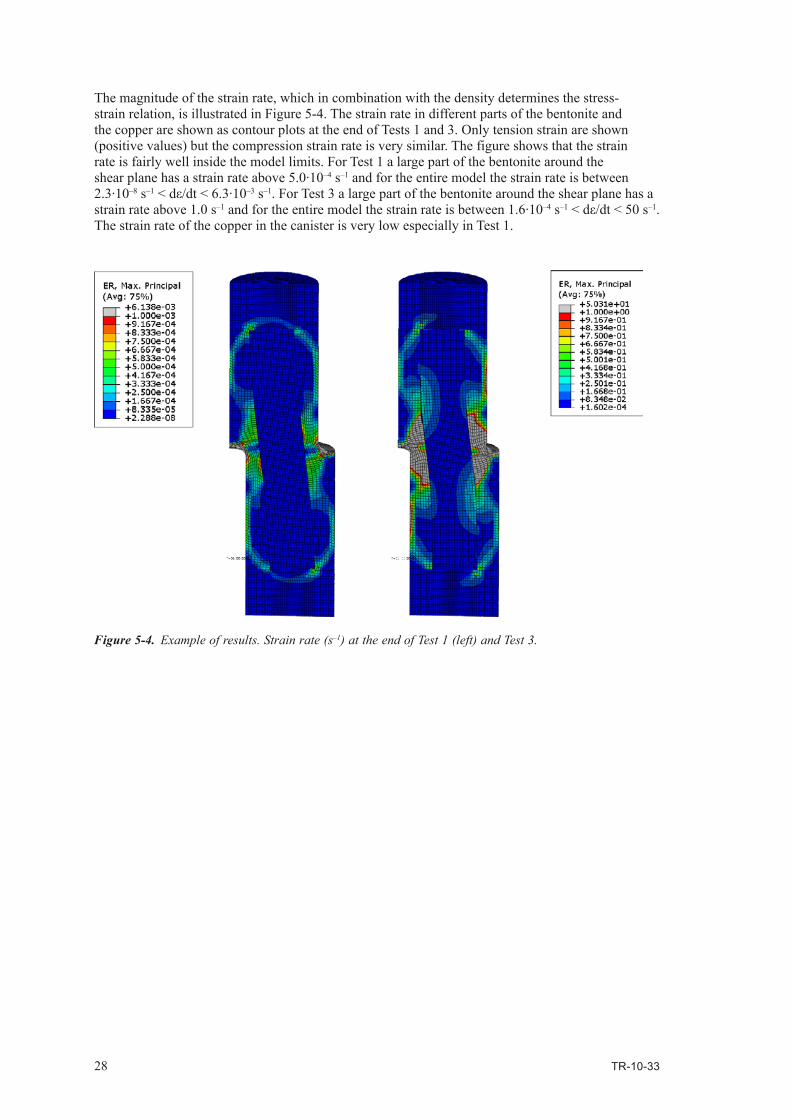
The magnitude of the strain rate, which in combination with the density determines the stress-strain relation, is illustrated in Figure 5-4. The strain rate in different parts of the bentonite and the copper are shown as contour plots at the end of Tests 1 and 3. Only tension strain are shown (positive values) but the compression strain rate is very similar. The figure shows that the strain rate is fairly well inside the model limits. For Test 1 a large part of the bentonite around the shear plane has a strain rate above 5.0∙10–4 s–1 and for the entire model the strain rate is between 2.3∙10–8 s–1<dε/dt<6.3∙10–3 s–1. For Test 3 a large part of the bentonite around the shear plane has a strain rate above 1.0 s–1 and for the entire model the strain rate is between 1.6∙10–4 s–1<dε/dt<50s–1. The strain rate of the copper in the canister is very low especially in Test 1.
Figure 5-4. Example of results. Strain rate (s–1) at the end of Test 1 (left) and Test 3.

TR-10-33 29
6 Calculated results from model A with three bentonite densities and comparison with measured results
6.1 GeneralIn this chapter the results derived from the calculations with model A that has three buffer densities will be compared with measured results. The reporting will be done so that each measured vari able will be shown and analysed for all three tests. This way not only direct results can be compared but analyses of trends and differences between the different shear rates can also be done.
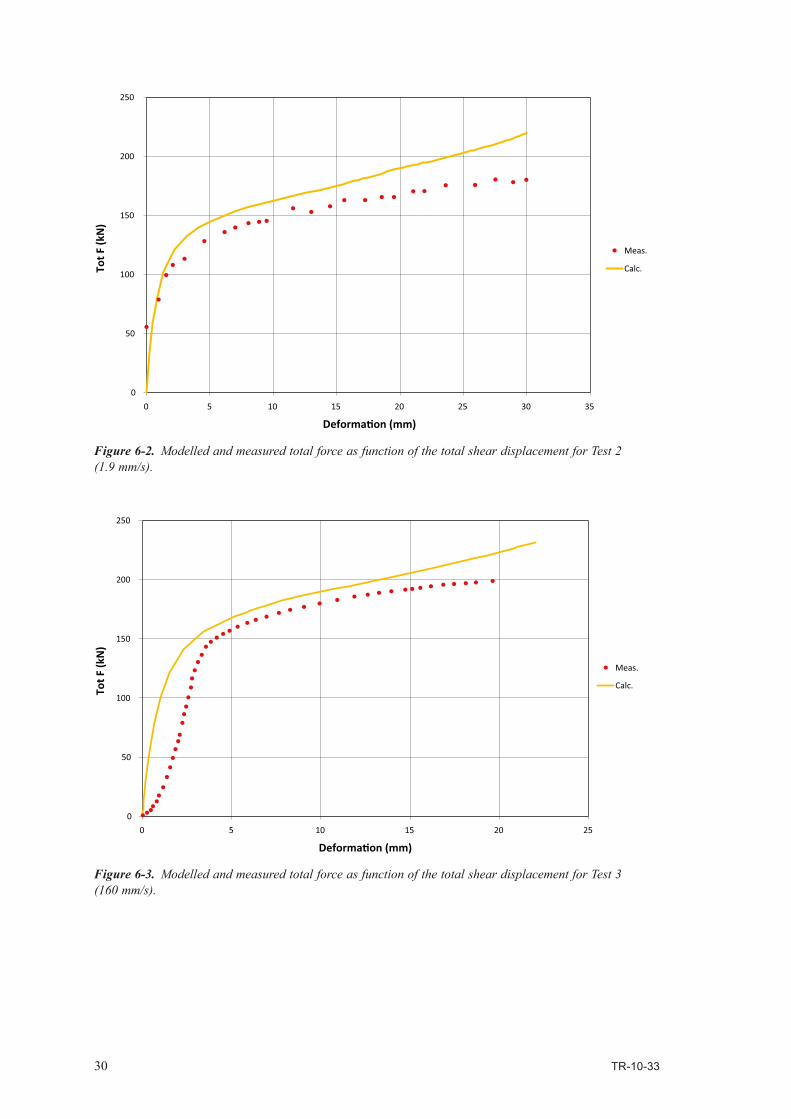
6.2 Total forceThe total force required to move one half of the steel cylinder simulating the deposition hole in rela-tion to the other half was measured with 3–4 force transducers. The modelled total force was evalu-ated by summarizing the reaction forces in the nodes of the movable part. Figures 6-1 to 6-3 show the calculated and measured force as function of the shear displacement.
A comparison between modelled and measured force shows that• Theshearprocessseemstobewellcapturedsincetheshapeofthecurvesaresimilarwithatfirst
a fast increase in force until about 3 mm shear and then a slow almost linear increase until the end of the test.
• Themagnitudeofthecalculatedforceagreesverywellwiththemeasuredalthoughthemodellingyields a slight overestimation for all tests.
• Theinfluenceofthebentonitedensityandtheshearrateisreflectedinboththemodelledandmeasured force. The force increases logically with increasing test number since both the density and the shear increase likewise.
The overall impression is that the total force as a function of the shear deformation is very well mod-elled for all three tests in spite of a slight overestimation.
0
20
40
60
80
100
120
140
160
180
200
0 5 10 15 20 25 30 35
Meas.
Calc.Tot F
(kN
)
Deforma�on (mm)
Figure 6-1. Modelled and measured total force as function of the total shear displacement for Test 1 (0.031 mm/s).
30 TR-10-33
Figure 6-3. Modelled and measured total force as function of the total shear displacement for Test 3 (160 mm/s).
Figure 6-2. Modelled and measured total force as function of the total shear displacement for Test 2 (1.9 mm/s).
0
50
100
150
200
250
0 5 10 15 20 25
Meas.
Calc.Tot F
(kN
)
Deforma�on (mm)
0
50
100
150
200
250
0 5 10 15 20 25 30 35
Meas.
Calc.Tot F
(kN
)
Deforma�on (mm)

TR-10-33 31
6.3 Radial stress in the bentoniteThe radial stress in the bentonite was measured in three points on the surface of the copper canister and in three points on the surface of the steel tube (rock) according to Figure 2-1 on the pressurised “active” pressurised side. Figure 6-4 shows the location of the transducers. Figures 6-5 to 6-7 show the calculated and measured radial stresses in the three tests. The measured results in point 10 in Test 1 and in point 8 in Test 3 are missing due to malfunction of the transducers.
Observe that the calculated stress is the total stress (including the initial swelling pressure) and the measured stress is the change in stress (excluding the initial swelling pressure). In order to compare the calculations and the measurements the calculated results have been reduced with the initial aver-age stress 10 MPa.
Some observations and analyses of the results:
• Themeasuredresultsoftransducer6inTest1yieldanalmostconstantverylowvalueduringtheentire test. This contradicts all other measured results and it is concluded that this transducer has not worked properly
• Transducers5,6,8,and9locatedratherfarfromthetopofthecanister,yieldincreasedstressaccording to both the calculations and the measurements while the two upper transducers (7 and 10) yield decreased stress. This is logical since the canister tends to rotate during shear. The only exception from these logical results is the measured values of transducers 7 and 9 in Test 2, which have the opposite results. It is difficult to explain why Test 2 should differ from the other tests. A plausible explanation is that the measured results of transducers 7 and 9 in Test 2 have been mixed up, because if they are changed the results would fit very well both with the measured results of the other tests and with the calculated results.
• Thetransducersthatyieldincreasingstress(5,6,8,and9)donotdifferverymuchindividuallyaccording to the calculations, which agree with corresponding measurements in Tests 1 and 3. For Test 2 there is a substantial scatter of these measured values but the average agrees well with the average of the calculations. It should be observed that these measurements are difficult to do since the bentonite is very stiff and is not allowed to swell during the fast shear so valve forma-tions may occur at the contact with the transducer.
• Theaverageofthemeasuredpositivestressagreesfairlywellwithcalculatedvaluesexceptforin Test 3 where they are little lower.
• Themeasureddecreasedstressoftransducers7and10iswellcapturedinthemodellingespe-cially for Tests 2 and 3 where the agreement is very good (if the transducer mix-up is considered).
Figure 6-4. Location and numbering of pressure transducers (located 3, 11 and 19 cm from top of the copper canister).
07 10
06 09
05 08
Shear plane

32 TR-10-33
Figure 6-6. Modelled and measured radial stress change in the buffer as function of the total shear displacement for Test 2 (1.9 mm/s).
-10
-5
0
5
10
15
0 5 10 15 20 25 30 35
P05 meas.
P05 calc.
P06 meas.
P06 calc.
P07 meas.
P07 calc.
P08 meas.
P08 calc.
P09 meas.
P09 calc.
P10 calc.
Stre
ss c
hang
e (M
Pa)
Deforma�on (mm)
Figure 6-5. Modelled and measured radial stress change in the buffer as function of the total shear displacement for Test 1 (0.031 mm/s).
The overall conclusion of the comparison is that the agreement between measured and modelled stresses is surprisingly good, both regarding trends and values, considering the problems associated with this type of measurements.
-10
-5
0
5
10
15
20
25
0 5 10 15 20 25 30 35
P05 meas.
P05 calc.
P06 meas.
P06 calc.
P07 meas.
P07 calc.
P08 meas.
P08 calc.
P09 meas.
P09 calc.
P10 meas.
P10 calc.
Deforma�on (mm)
Stre
ss c
hang
e (M
Pa)

TR-10-33 33
6.4 Axial strain in the canister surfaceThe strain gauges were glued axially on the pressurised “active” side of the canister (although on the lower part of the canister). They were placed as shown in Figure 6-8.
Figure 6-7. Modelled and measured radial stress change in the buffer as function of the total shear displacement for Test 3 (160 mm/s).
-10
-5
0
5
10
15
20
0.00 5.00 10.00 15.00 20.00 25.00
P05 meas.
P05 calc.
P06 meas.
P06 calc.
P07 meas.
P07 calc.
P08 calc.
P09 meas.
P09 calc.
P10 meas.
P10 calc.
Stre
ss c
hang
e (M
Pa)
Deforma�on (mm)
20 mm25 mm
30 mm
35 mm
55 mm
60 mm
14
15
16
17
18
Shear force
Figure 6-8. Location and numbering of the strain gauges glued to the canister surface.

34 TR-10-33
Figures 6-9 to 6-11 show the calculated and measured strain in the canister surface as function of the shear displacement.
Figure 6-10. Modelled and measured axial strain in the canister surface (in point 17) as function of the total shear displacement for Test 2 (1.9 mm/s).
Figure 6-9. Modelled and measured axial strain in the canister surface as function of the total shear displacement for Test 1 (0.031 mm/s).
0
0.5
1
1.5
2
2.5
0 5 10 15 20 25 30 35
P14 meas.
P14 calc.
P15 meas.
P15 calc.
P16 meas.
P16 calc.
P17 meas.
P17 calc.
P18 meas.
P18 calc.
Stra
in (%
)
Deforma�on (mm)
0
0.5
1
1.5
2
2.5
3
3.5
4
0 5 10 15 20 25 30 35
P14 calc.
P15 calc.
P16 calc.
P17 meas.
P17 calc.
P18 calc.
Stra
in (%
)
Deforma�on (mm)

TR-10-33 35
These measurements are difficult and impaired with many sources of errors since they are glued to the copper surface without possibility to check or calibrate. In addition they are exposed to the swelling pressure of about 10 MPa and any displacement of the bentonite relative to the copper may destroy the results. The measurement results also reveal that there have been problems for many of the strain gauges. The only transducers that seem to work properly for all three tests are number 16 and 17, which also yield the largest strain, both according to the measurements and the calculations.
If we confine ourselves to compare the results of strain gauges 16 and 17 we can see that both the shape and the magnitude of the curves, when plotting the strain in the copper bar surface against the total shear displacement, agree very well between modelled and measured results, although the modelled strain in at least Test 1 is a little higher than the measured and the measured reduced strain increase at the end of the test is not captured. The agreement suggests that the stress-strain processes in the copper canister are rather well captured in the modelling. See also the measuring of the deformed canisters at the end of the tests in Section 6.6.
6.5 Canister tiltingThe displacement of the simulated canister in relation to the simulated rock was measured close to the end of the canister (4 cm from the end; see Figure 2-1). If the canister was sheared without any tilting there would be no measured displacement. The more tilting and correspondingly the less bending (shearing) of the canister the larger relative displacement would be measured. Unfortunately only Test 1 yielded useful results from this measurement. Figure 6-12 shows a comparison between calculated and measured relative displacement for this test.
The modelled and measured curves are in very good agreement although the curves are shifted 5 mm relative each other. The shape of the curve (straight line) and the inclination are almost identical. The measured tilting (relative displacement) does not start until after 5 mm shear displacement while the modelling results show that the tilting starts immediately. The difference could be caused by some slack in the equipment but we confine ourselves to establish that the modelled results exactly follow the measurements after 5 mm shear displacement.
Figure 6-11. Modelled and measured axial strain in the canister surface as function of the total shear displacement for Test 3 (160 mm/s).
0
0.5
1
1.5
2
2.5
3
3.5
4
0 5 10 15 20 25
P14 meas.
P14 calc.
P15 meas.
P15 calc.
P16 meas.
P16 calc.
P17 meas.
P17 calc.
P18 calc.
Stra
in (%
)
Deforma�on (mm)

36 TR-10-33
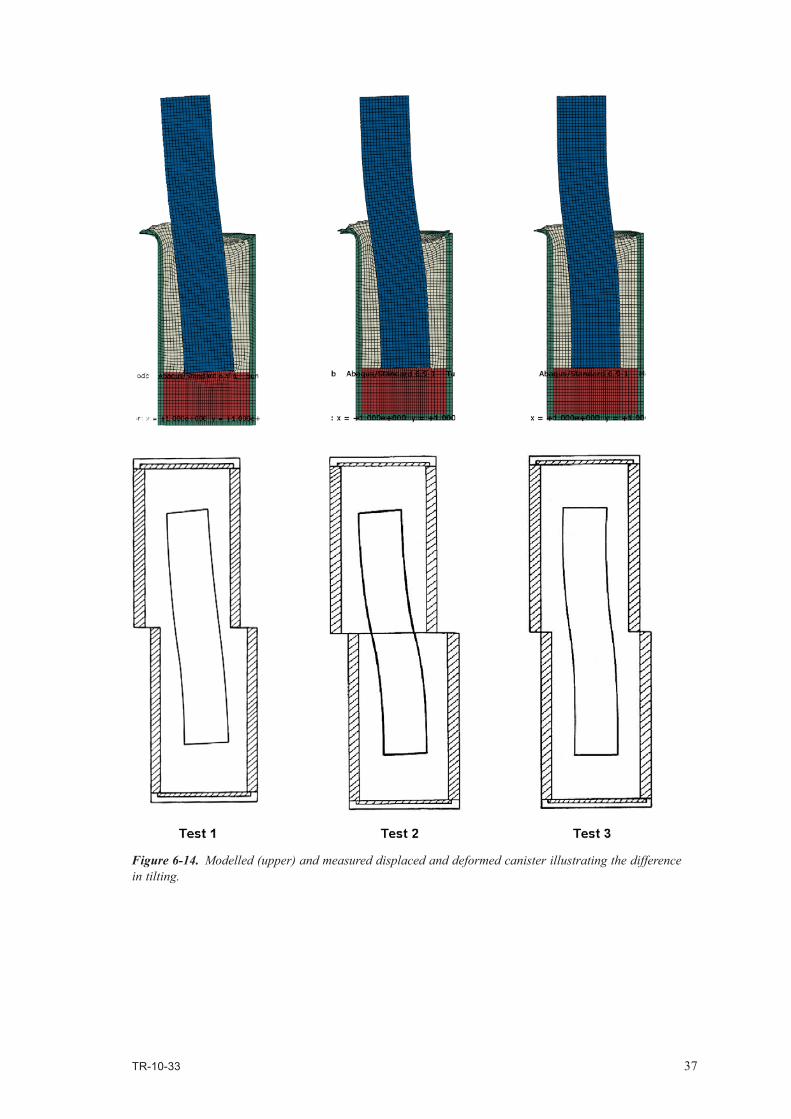
The modelled results are shown in Figure 6-13 for illustration of the influence of an increased stiff-ness of the clay corresponding to the three tests. The tilting is reduced with increasing stiffness from the increased density and increased shear rate. Figure 6-14 shows the modelled and measured final location and geometry of the canisters in all three tests illustrating this difference in tilting.
Figure 6-12. Calculated and measured relative displacement between the “canister” end and the “rock surface” as function of the total shear displacement for Test 1 (0.031 mm/s).
Figure 6-13. Modelled relative displacement between the canister end and the rock surface as function of the total shear displacement for Tests 1 to 3.
0
0.2
0.4
0.6
0.8
1
1.2
1.4
1.6
1.8
2
0 5 10 15 20 25 30
Meas.
Calc.
Cann
iste
r def
orm
a�on
(mm
)
Deforma�on (mm)
0
0.5
1
1.5
2
2.5
0 5 10 15 20 25 30 35
D1 Calc.
D2 Calc.
D3 Calc.
Cann
iste
r def
orm
a�on
(mm
)
Deforma�on (mm)
TR-10-33 37
Figure 6-14. Modelled (upper) and measured displaced and deformed canister illustrating the difference in tilting.
38 TR-10-33
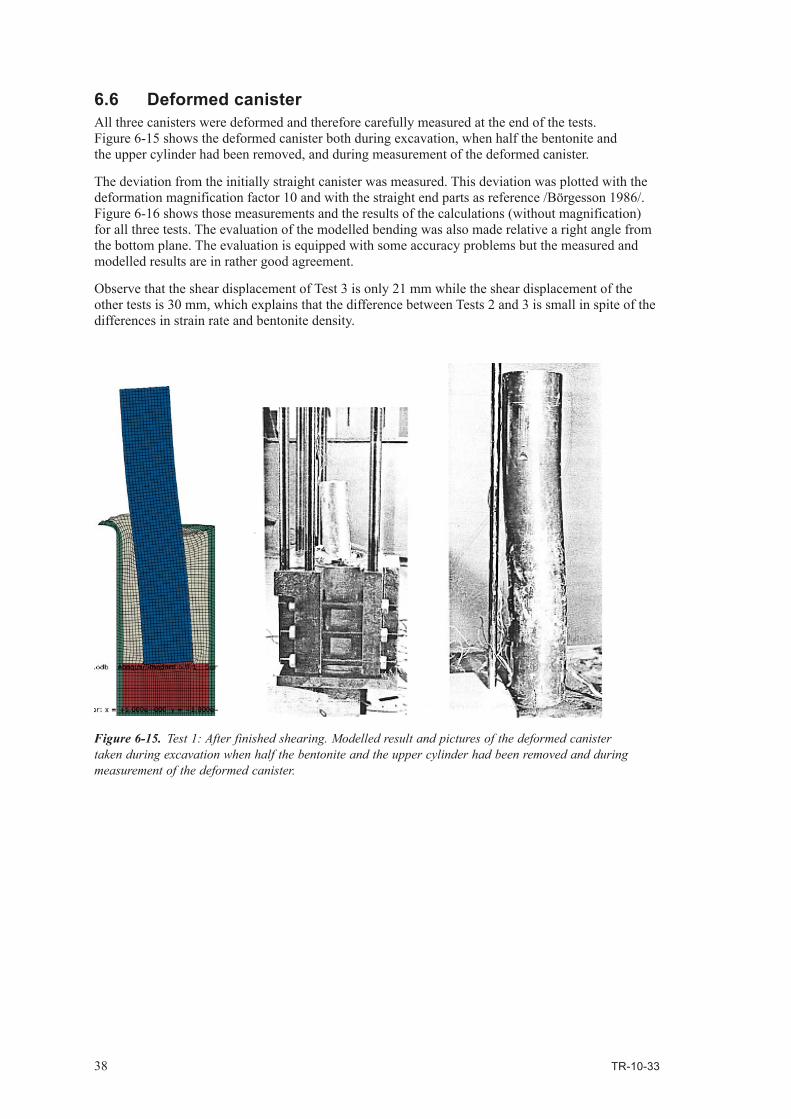
6.6 Deformed canisterAll three canisters were deformed and therefore carefully measured at the end of the tests. Figure 6-15 shows the deformed canister both during excavation, when half the bentonite and the upper cylinder had been removed, and during measurement of the deformed canister.
The deviation from the initially straight canister was measured. This deviation was plotted with the deformation magnification factor 10 and with the straight end parts as reference /Börgesson 1986/. Figure 6-16 shows those measurements and the results of the calculations (without magnification) for all three tests. The evaluation of the modelled bending was also made relative a right angle from the bottom plane. The evaluation is equipped with some accuracy problems but the measured and modelled results are in rather good agreement.
Observe that the shear displacement of Test 3 is only 21 mm while the shear displacement of the other tests is 30 mm, which explains that the difference between Tests 2 and 3 is small in spite of the differences in strain rate and bentonite density.
Figure 6-15. Test 1: After finished shearing. Modelled result and pictures of the deformed canister taken during excavation when half the bentonite and the upper cylinder had been removed and during measurement of the deformed canister.

TR-10-33 39
Figure 6-16. Measured (left) and modelled canister bending. The deformation scale in the measurements is magnified with a factor of ten.
Canister bending
Test 1
Measured: 14 mm
Modelled: 13.5 mm
Canister bending
Test 2
Measured: 19 mm
Modelled: 21.6 mm
Canister bending
Test 3
Measured: 21 mm
Modelled: 19.3 mm

40 TR-10-33
6.7 Axial buffer displacementAs was shown in Figure 6-15 the buffer deformed significantly around the shear plane especially in the axial direction. This performance could be investigated during dismantling of the test since the shear plane coincide with the initial joint between two bentonite blocks and during removal of the bentonite it was easy to locate the surface of this joint. A careful measurement of this surface was done for Test 3. Figure 6-17 shows a picture of the deformed surface of Test 3 and the results of the surveying of the surface plotted as contour lines and scaled as deviations from the shear plane.
Calculated results are shown in Figure 6-18 both as an overview picture and as contour lines plotted in similar way as the measurements.
Comparing the measured and calculated results shows that both the appearance and the magnitude of the displacements are in very good agreement. The buffer is displaced equally much upwards on the active side and downwards on the passive side with the largest deformation close to the canister. The total difference in the maximum points close to the canister is 24 mm according to the modelling. The measured total difference is between 20 and 25 mm (the value in the maximum point was not evaluated). The value 23 mm has been used in the comparison table in Chapter 8.
Figure 6-17. Picture of the deformed surface of Test 3 and the results of the surveying of the surface plotted as contour lines.

TR-10-33 41
Figure 6-18. Modelled buffer deformation of Test 3 at end of test. Contour lines of the axial displacements (m) are also plotted.

TR-10-33 43
7 Calculated results from model B with one bentonite density and comparison with measured results
7.1 GeneralIdentical calculations have been made with bentonite model B, where only one density of the ben-tonite, equal to the weighted average of the three densities in model A, was used. All these results will not be shown in this chapter but the results are instead compiled in Appendix 2. The difference between the model results is very small. In this chapter only comparison of the results between the two models with respect to the total force will be done.
The calculation of Test 1 did not converge for the entire 30 mm shear displacement, so results from this model are only available to 27 mm.
7.2 Comparison between the results of model A and BAs noted above the same results of the calculations with model B, as shown for model A in Chapter 6, are given in Appendix 2. A complete comparison between the results of the calculations with the two bentonite models is not fruitful since the difference is so small. A compilation of the results with the two models and the measured results will be given in Chapter 8. As an example of the difference between the results of the two models the modelled total force of the three tests is shown in Figure 7-1.
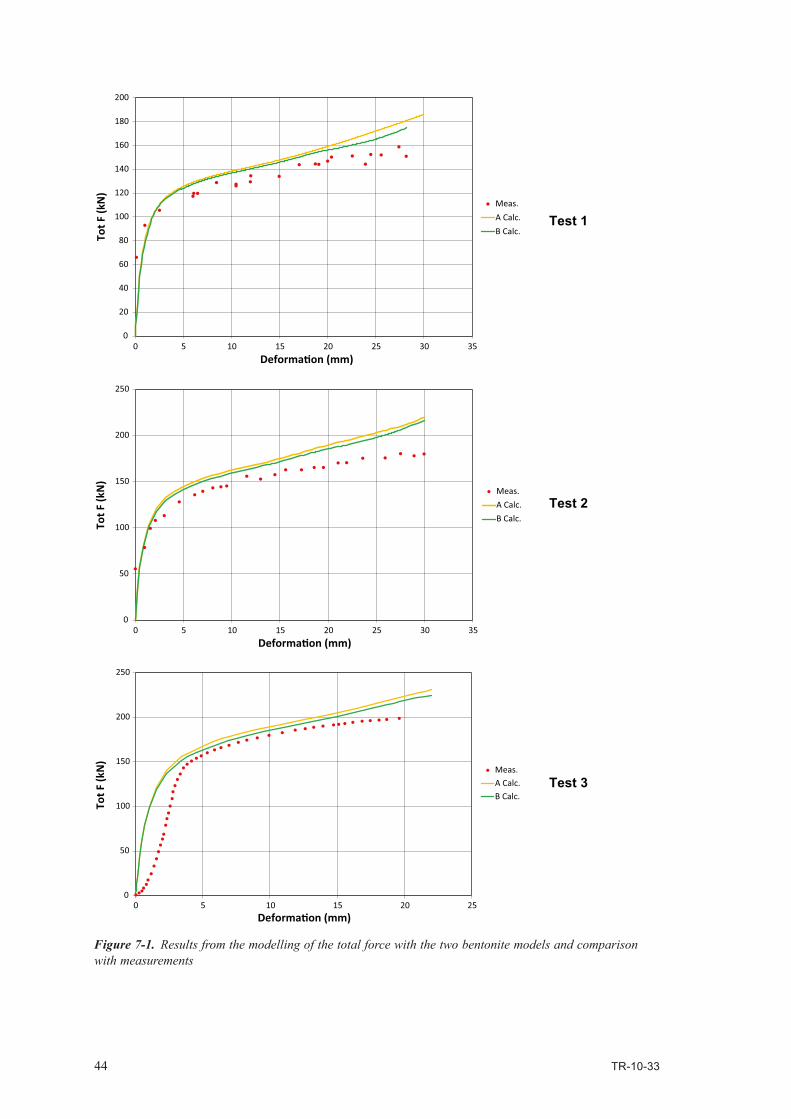
44 TR-10-33
Figure 7-1. Results from the modelling of the total force with the two bentonite models and comparison with measurements
Test 1
Test 2
Test 3
0
20
40
60
80
100
120
140
160
180
200
0 5 10 15 20 25 30 35
Meas.A Calc.B Calc.To
t F (k
N)
Deforma�on (mm)
0
50
100
150
200
250
0 5 10 15 20 25 30 35
Meas.A Calc.B Calc.
Tot F
(kN
)
Deforma�on (mm)
0
50
100
150
200
250
0 5 10 15 20 25
Meas.A Calc.B Calc.
Tot F
(kN
)
Deforma�on (mm)
TR-10-33 45
8 Evaluation and analyses
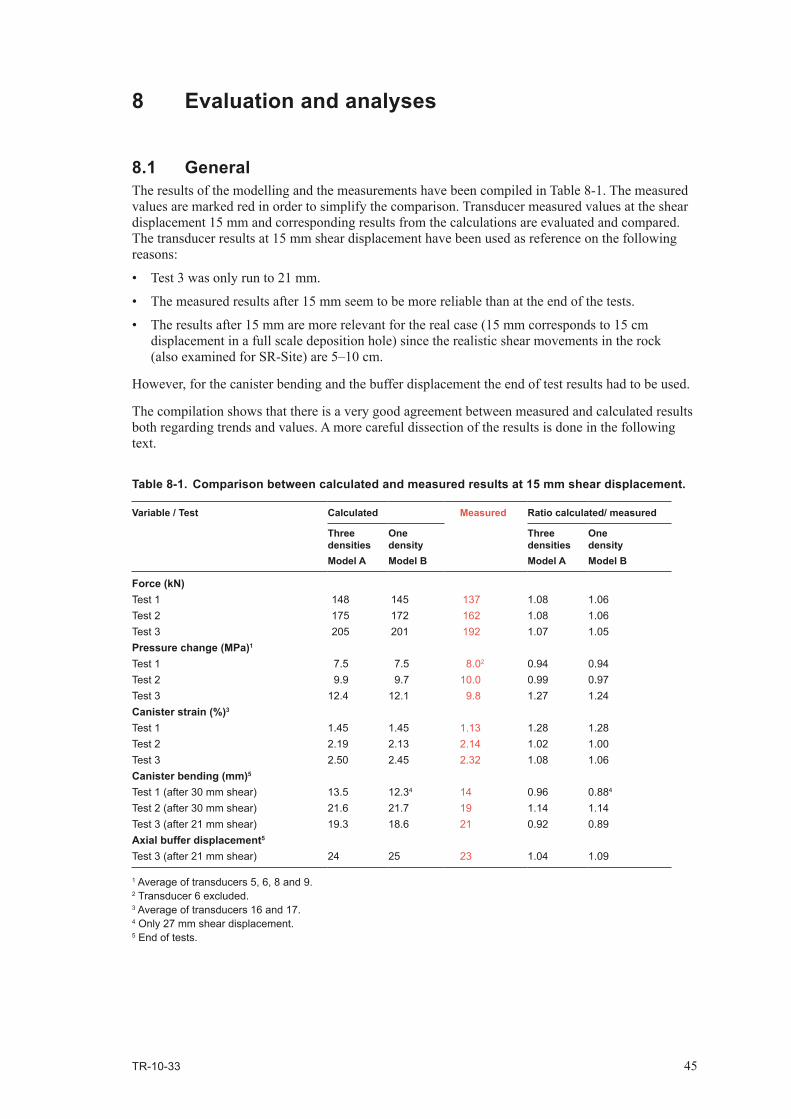
8.1 GeneralThe results of the modelling and the measurements have been compiled in Table 8-1. The measured values are marked red in order to simplify the comparison. Transducer measured values at the shear displacement 15 mm and corresponding results from the calculations are evaluated and compared. The transducer results at 15 mm shear displacement have been used as reference on the following reasons:
• Test3wasonlyrunto21mm.
• Themeasuredresultsafter15mmseemtobemorereliablethanattheendofthetests.
• Theresultsafter15mmaremorerelevantfortherealcase(15mmcorrespondsto15cmdisplacement in a full scale deposition hole) since the realistic shear movements in the rock (also examined for SR-Site) are 5–10 cm.
However, for the canister bending and the buffer displacement the end of test results had to be used.
The compilation shows that there is a very good agreement between measured and calculated results both regarding trends and values. A more careful dissection of the results is done in the following text.
Table 8-1. Comparison between calculated and measured results at 15 mm shear displacement.
Variable / Test Calculated Measured Ratio calculated/ measured
Three densitiesModel A
One densityModel B
Three densitiesModel A
One densityModel B
Force (kN)Test 1 148 145 137 1.08 1.06Test 2 175 172 162 1.08 1.06Test 3 205 201 192 1.07 1.05Pressure change (MPa)1
Test 1 7.5 7.5 8.02 0.94 0.94Test 2 9.9 9.7 10.0 0.99 0.97Test 3 12.4 12.1 9.8 1.27 1.24Canister strain (%)3
Test 1 1.45 1.45 1.13 1.28 1.28Test 2 2.19 2.13 2.14 1.02 1.00Test 3 2.50 2.45 2.32 1.08 1.06Canister bending (mm)5
Test 1 (after 30 mm shear) 13.5 12.34 14 0.96 0.884
Test 2 (after 30 mm shear) 21.6 21.7 19 1.14 1.14Test 3 (after 21 mm shear) 19.3 18.6 21 0.92 0.89Axial buffer displacement5
Test 3 (after 21 mm shear) 24 25 23 1.04 1.09
1 Average of transducers 5, 6, 8 and 9.2 Transducer 6 excluded.3 Average of transducers 16 and 17.4 Only 27 mm shear displacement.5 End of tests.

46 TR-10-33
8.2 Model AIn model A the modelled force is slightly overestimated with 7–8% consistently for all three tests. This consequent behaviour indicates that the shear strength of the bentonite is slightly overestimated. Since the force is easy to measure with good accuracy this comparison is probably the most reliable one. The difference does not seem to be caused by the strain rate dependency since the difference is the same for all shear rates. However, the scatter of measured shear strength of the bentonite is well above these 8% so an overestimation of the shear strength could be one factor.
Also the density measurements are uncertain and the average density of the bentonite in the tests is evaluated from a large number of small samples taken under difficult conditions. A difference in shear strength of 8% corresponds to a difference in density (at saturation) of about 0.6% or between e.g. ρm = 2,035 kg/m3 and ρm = 2,047 kg/m3. Both drying and subsequent shrinkage and swelling due to stress release can take place during sampling as well as mechanical disturbance.
The conclusion that there is a slight overestimation of the shear strength is not unambiguously supported by the other results. Two out of the three modelling results for pressure change, canister strain and canister bending are in very good agreement with measured results, with a divergence of less than 8%. The other results differ between 14% and 28% and these larger differences do not fall upon one test but upon all three tests. The only results of those variables that support the overesti-mation of the shear strength are that all these three larger deviations yield higher pressure change, higher canister strain and larger canister bending in the modelling than measured.
Thecoppermodelisalsoapossiblesourceofuncertainty.Loweryieldstrengthwoulddecreasethemodelled force but this would also increase the canister strain and canister bending too much.
The overall conclusion of the modelling of the experiments, with a division of the bentonite in three different parts with different densities (model A), is that there is a remarkable agreement between modelling results and measurements, considering the measurement difficulties and the complexity of the models. There are indications that the modelled shear strength of the bentonite is slightly over-estimated but the results are too inconsistent in order to fully establish this and the overestimation could be caused by an overestimation of the density of the buffer in the tests.
8.3 Model BIn model B the bentonite buffer has been simplified to one density instead of three, using the aver-age density measured. The main implication of this is that the inhomogeneity of the density in radial direction between the canister and the simulated rock is not considered but instead the weighed mean value is used. This corresponds in in many respects on the simplification made for the rock shear calculations made in SR-Site. It has thus been of vital interest to see if this simplification has a large impact on the results.
As seen in Table 8-1, in Figure 7-1 and in Appendix 2 the implication of this simplification is very small. All results are only affected with a few per cent, which is clearly within the limits of error uncertainties. The largest difference was seen for the canister bending at the end of Test 1, but that calculation stopped before the shear displacement 30 mm was reached due to convergence problems. As noted in Table 8-1 the canister bending is derived after 27 mm shear deformation instead of 30 mm. If the bending is linearly extrapolated the bending would be identical to the bending accord-ing to model A.

TR-10-33 47
9 Conclusions
The three model tests of a rock shear through a deposition hole that were performed 1986 have been modelled with the same finite element program Abaqus, a similar finite element mesh, the same modelling technique, the same contact conditions (between different materials) and the same mate-rial models as used for the SR-Site calculations of this scenario. The modelling results have been compared with the measured results of the tests and were found to agree very well for all three tests.
It should be emphasized that the calculations have been done without any changes or adaptations of material models or parameter values after measured results. Exactly the same values and models and calculation techniques have been used as were used in the modelling of the effect of full scale rock shear through a deposition hole at different scenarios for SR-Site. The only difference is that the SR-Site calculations were done with a buffer material model that corresponds to the expected properties of Ca-converted MX-80, which means higher shear strength than applied for the scale test modelling. The calculations of the three model shear tests and the comparisons made in this report can thus be considered to validate the SR-Site modelling of the rock shear scenario.
The results also show that the modelling can be done with the simplified assumption that the benton-ite buffer between the canister and the rock is homogeneous with only one average density without considering the density difference between the bentonite close to the rock surface and close to the canister, which is caused by incomplete homogenisation after finished swelling.

TR-10-33 49
References
SKB’s (Svensk Kärnbränslehantering AB) publications can be found at www.skb.se/publications.
Börgesson L, 1986. Model shear tests of canisters with smectite clay envelopes in deposition holes. SKB TR 86-26, Svensk Kärnbränslehantering AB.
Börgesson L, Hernelind J, 2006. Earthquake induced rock shear through a deposition hole. Influence of shear plane inclination and location as well as buffer properties on the damage caused to the canister. SKB TR-06-43, Svensk Kärnbränslehantering AB.
Börgesson L, Johannesson L-E, Sandén T, Hernelind J, 1995. Modelling of the physical behav-iourofwatersaturatedclaybarriers.Laboratorytests,materialmodelsandfiniteelementapplica-tion. SKB TR 95-20, Svensk Kärnbränslehantering AB.
Börgesson L, Johannesson L-E, Hernelind J, 2004. Earthquake induced rock shear through a deposi-tion hole. Effect on the canister and the buffer. SKB TR-04-02, Svensk Kärnbränslehantering AB.
Börgesson L, Dueck A, Johannesson L-E, 2010. Material model for shear of the buffer – evalua-tion of laboratory test results. SKB TR-10-31, Svensk Kärnbränslehantering AB.
Dueck A, Börgesson L, Johannesson L-E, 2010. Stress-strain relation of bentonite at undrained shear.Laboratoryteststoinvestigatetheinfluenceofmaterialcompositionandtesttechnique.SKB TR-10-32, Svensk Kärnbränslehantering AB.
Hernelind J, 2010. Modelling and analysis of canister and buffer for earthquake induced rock shear and glacial load. SKB TR-10-34, Svensk Kärnbränslehantering AB.
Åkesson M, Kristensson O, Börgesson L, Dueck A, Hernelind J, 2010. THM modelling of buffer, backfill and other system components. Critical processes and scenarios. SKB TR-10-11, Svensk Kärnbränslehantering AB.

TR-10-33 51
Appendix 1
Data and stress strain relations used for the different bentonite densities
Table A1-1. Bentonite model (MX-80) at the density 1,970 kg/m3 (e = 0.835).
Material ρm kg/m3
Rate of strainvs
Elastic part Plastic part: von Mises true stress σj (MPa) at the following plastic nominal strains εp
E MPa
ν εp= 0
εp= 0.004
εp= 0.01
εp= 0.018
εp= 0.026
εp= 0.036
εp= 0.46
εp= 1.0
MX-80 1,970 10–6 109 0.49 1.09 1.46 1.67 1.79 1.86 1.89 1.87 1.87MX-80 1,970 10–4 130 0.49 1.30 1.74 2.00 2.13 2.23 2.25 2.23 2.23MX-80 1,970 10–3 142 0.49 1.42 1.90 2.17 2.33 2.42 2.46 2.43 2.43MX-80 1,970 10–2 155 0.49 1.55 2.07 2.38 2.54 2.65 2.68 2.65 2.65MX-80 1,970 10–1 169 0.49 1.69 2.26 2.60 2.77 2.89 2.93 2.89 2.89MX-80 1,970 1.0 185 0.49 1.85 2.47 2.84 3.03 3.16 3.20 3.16 3.16MX-80 1,970 10 201 0.49 2.01 2.69 3.09 3.30 3.44 3.49 3.45 3.45MX-80 1,970 100 220 0.49 2.20 2.94 3.37 3.61 3.75 3.81 3.77 3.77MX-80 1,970 1,000 240 0.49 2.40 3.21 3.69 3.93 4.10 4.16 4.11 4.11

52 TR-10-33
0
0.5
1
1.5
2
2.5
3
3.5
4
4.5
0 0.2 0.4 0.6 0.8 1 1.2
Stre
ss M
Pa
Engineering strain
Density 1970
1.00E-06
1.00E-04
1.00E-03
1.00E-02
0.1
1
10
100
1000
0
0.5
1
1.5
2
2.5
3
3.5
4
4.5
0 0.01 0.02 0.03 0.04 0.05 0.06 0.07 0.08 0.09 0.1
Stre
ss M
Pa
Engineering strain
Density 1970
1.00E-06
1.00E-04
1.00E-03
1.00E-02
0.1
1
10
100
1000

TR-10-33 53
Table A1-2. Bentonite model (MX-80) at the density 2,020 kg/m3 (e = 0.745).
Material ρm kg/m3
Rate of strainvs
Elastic part Plastic part: von Mises true stress σj (MPa) at the following plastic nominal strains εp
E MPa
ν εp= 0
εp= 0.004
εp= 0.01
εp= 0.018
εp= 0.026
εp= 0.036
εp= 0.46
εp= 1.0
MX-80 2,020 10–6 150 0.49 1.50 2.01 2.30 2.46 2.56 2.60 2.57 2.57MX-80 2,020 10–4 179 0.49 1.79 2.39 2.75 2.93 3.06 3.10 3.06 3.06MX-80 2,020 10–3 195 0.49 1.95 2.61 2.99 3.20 3.33 3.38 3.34 3.34MX-80 2,020 10–2 213 0.49 2.13 2.85 3.27 3.49 3.64 3.69 3.65 3.65MX-80 2,020 10–1 233 0.49 2.33 3.11 3.57 3.81 3.97 4.03 3.98 3.98MX-80 2,020 1.0 254 0.49 2.54 3.39 3.90 4.16 4.34 4.40 4.35 4.35MX-80 2,020 10 277 0.49 2.77 3.70 4.25 4.54 4.73 4.80 4.74 4.74MX-80 2,020 100 303 0.49 3.03 4.04 4.64 4.96 5.16 5.24 5.18 5.18MX-80 2,020 1,000 330 0.49 3.30 4.41 5.07 5.41 5.64 5.72 5.65 5.65

54 TR-10-33
0
1
2
3
4
5
6
7
0 0.2 0.4 0.6 0.8 1 1.2
Stre
ss M
Pa
Engineering strain
Density 2020
1.00E-06
1.00E-04
1.00E-03
1.00E-02
0.1
1
10
100
1000
0
1
2
3
4
5
6
7
0 0.01 0.02 0.03 0.04 0.05 0.06 0.07 0.08 0.09 0.1
Stre
ss M
Pa
Engineering strain
Density 2020
1.00E-06
1.00E-04
1.00E-03
1.00E-02
0.1
1
10
100
1000

TR-10-33 55
Table A1-3. Bentonite model (MX-80) at the density 2,040 kg/m3 (e = 0.711).
Material ρm kg/m3
Rate of strainvs
Elastic part Plastic part: von Mises true stress σj (MPa) at the following plastic nominal strains εp
E MPa
ν εp= 0
εp= 0.004
εp= 0.01
εp= 0.018
εp= 0.026
εp= 0.036
εp= 0.46
εp= 1.0
MX-80 2,040 10–6 161 0.49 1.61 2.16 2.47 2.65 2.76 2.80 2.77 2.77MX-80 2,040 10–4 193 0.49 1.93 2.58 2.96 3.16 3.30 3.33 3.30 3.30MX-80 2,040 10–3 210 0.49 2.10 2.81 3.21 3.45 3.58 3.64 3.60 3.60MX-80 2,040 10–2 230 0.49 2.30 3.07 3.53 3.76 3.93 3.97 3.93 3.93MX-80 2,040 10–1 250 0.49 2.50 3.35 3.85 4.10 4.28 4.34 4.28 4.28MX-80 2,040 1.0 274 0.49 2.74 3.66 4.21 4.49 4.68 4.74 4.68 4.68MX-80 2,040 10 298 0.49 2.98 3.98 4.58 4.89 5.10 5.17 5.11 5.11MX-80 2,040 100 326 0.49 3.26 4.35 4.99 5.35 5.55 5.64 5.58 5.58MX-80 2,040 1,000 240 0.49 3.56 4.75 5.47 5.82 6.07 6.16 6.09 6.09

56 TR-10-33
0
1
2
3
4
5
6
7
0 0.2 0.4 0.6 0.8 1 1.2
Stre
ss M
Pa
Engineering strain
Density 2040
1.00E-06
1.00E-04
1.00E-03
1.00E-02
0.1
1
10
100
1000
0
1
2
3
4
5
6
7
0 0.01 0.02 0.03 0.04 0.05 0.06 0.07 0.08 0.09 0.1
Stre
ss M
Pa
Engineering strain
Density 2040
1.00E-06
1.00E-04
1.00E-03
1.00E-02
0.1
1
10
100
1000

TR-10-33 57
Table A1-4. Bentonite model (MX-80) at the density 2,050 kg/m3 (e = 0.695).
Material ρm kg/m3
Rate of strainvs
Elastic part Plastic part: von Mises true stress σj (MPa) at the following plastic nominal strains εp
E MPa
ν εp= 0
εp= 0.004
εp= 0.01
εp= 0.018
εp= 0.026
εp= 0.036
εp= 0.46
εp= 1.0
MX-80 2,050 10–6 174 0.49 1.74 2.32 2.67 2.85 2.97 3.01 2.98 2.98MX-80 2,050 10–4 207 0.49 2.07 2.77 3.18 3.40 3.54 3.59 3.55 3.55MX-80 2,050 10–3 226 0.49 2.26 3.02 3.47 3.71 3.86 3.92 3.87 3.87MX-80 2,050 10–2 247 0.49 2.47 3.30 3.79 4.05 4.22 4.28 4.23 4.23MX-80 2,050 10–1 270 0.49 2.70 3.60 4.14 4.42 4.60 4.67 4.62 4.62MX-80 2, 050 1.0 294 0.49 2.94 3.93 4.52 4.83 5.03 5.10 5.04 5.04MX-80 2,050 10 321 0.49 3.21 4.29 4.92 5.26 5.48 5.56 5.50 5.50MX-80 2,050 100 350 0.49 3.50 4.68 5.38 5.75 5.98 6.07 6.00 6.00MX-80 2,050 1,000 383 0.49 3.83 5.11 5.87 6.28 6.53 6.63 6.55 6.55

58 TR-10-33
0
1
2
3
4
5
6
7
0 0.2 0.4 0.6 0.8 1 1.2
Stre
ss M
Pa
Engineering strain
Density 2050
1.00E-06
1.00E-04
1.00E-03
1.00E-02
0.1
1
10
100
1000
0
1
2
3
4
5
6
7
0 0.01 0.02 0.03 0.04 0.05 0.06 0.07 0.08 0.09 0.1
Stre
ss M
Pa
Engineering strain
Density 2050
1.00E-06
1.00E-04
1.00E-03
1.00E-02
0.1
1
10
100
1000

TR-10-33 59
Table A1-5. Bentonite model (MX-80) at the density 2,070 kg/m3 (e = 0.664).
Material ρm kg/m3
Rate of strainvs
Elastic part Plastic part: von Mises true stress σj (MPa) at the following plastic nominal strains εp
E MPa
ν εp= 0
εp= 0.004
εp= 0.01
εp= 0.018
εp= 0.026
εp= 0.036
εp= 0.46
εp= 1.0
MX-80 2,070 10–6 195 0.49 1.95 2.60 2.98 3.19 3.32 3.37 3.33 3.33MX-80 2,070 10–4 232 0.49 2.32 3.10 3.56 3.80 3.96 4.02 3.97 3.97MX-80 2,070 10–3 253 0.49 2.53 3.38 3.88 4.15 4.32 4.38 4.33 4.33MX-80 2,070 10–2 276 0.49 2.76 3.69 4.23 4.52 4.71 4.78 4.72 4.72MX-80 2,070 10–1 301 0.49 3.01 4.03 4.62 4.94 5.14 5.22 5.16 5.16MX-80 2,070 1.0 329 0.49 3.29 4.40 5.05 5.40 5.62 5.70 5.63 5.63MX-80 2,070 10 359 0.49 3.59 4.80 5.51 5.89 6.13 6.22 6.15 6.15MX-80 2,070 100 392 0.49 3.92 5.24 6.01 6.43 6.69 6.79 6.71 6.71MX-80 2,070 1,000 428 0.49 4.28 5.72 6.56 7.01 7.30 7.41 7.32 7.32

60 TR-10-33
0
1
2
3
4
5
6
7
8
0 0.2 0.4 0.6 0.8 1 1.2
Stre
ss M
Pa
Engineering strain
Density 2070
1.00E-06
1.00E-04
1.00E-03
1.00E-02
0.1
1
10
100
1000
0
1
2
3
4
5
6
7
8
0 0.01 0.02 0.03 0.04 0.05 0.06 0.07 0.08 0.09 0.1
Stre
ss M
Pa
Engineering strain
Density 2070
1.00E-06
1.00E-04
1.00E-03
1.00E-02
0.1
1
10
100
1000

TR-10-33 61
Appendix 2
Results from modelling with bentonite model B (one density)The same results of the model B calculations as shown for the Modal A calculations are presented in this appendix. For further description see Chapter 6.
Total force
Figure A2-1. Modelled and measured total force as function of the total shear displacement for Test 1 (0.031 mm/s).
Figure A2-2. Modelled and measured total force as function of the total shear displacement for Test 2 (1.9 mm/s).
0
20
40
60
80
100
120
140
160
180
200
0 5 10 15 20 25 30
Meas.
Calc.
Tot F
(kN
)
Deforma�on (mm)
0
50
100
150
200
250
0 5 10 15 20 25 30 35
Meas.
Calc.
Tot F
(kN
)
Deforma�on (mm)

62 TR-10-33
Radial stress in the bentonite
Figure A2-3. Modelled and measured total force as function of the total shear displacement for Test 3 (160 mm/s).
Figure A2-4. Location and numbering of pressure transducers (3, 11 and 19 cm from top of the copper canister).
0
50
100
150
200
250
0 5 10 15 20 25
Meas.
Calc.
Tot F
(kN
)
Deforma�on (mm)
07 10
06 09
05 08
Shear plane

TR-10-33 63
Figure A2-5. Modelled and measured radial stress change in the buffer as function of the total shear displacement for Test 1 (0.031 mm/s).
Figure A2-6. Modelled and measured rad radial stress change in the buffer as function of the total shear displacement for Test 2 (1.9 mm/s).
-10.00
-5.00
0.00
5.00
10.00
15.00
0 5 10 15 20 25 30
P05 meas.
P05 calc.
P06 meas.
P06 calc.
P07 meas.
P07 calc.
P08 meas.
P08 calc.
P09 meas.
P09 calc.
P10 calc.
Stre
ss c
hang
e (M
Pa)
Deforma�on (mm)
-10
-5
0
5
10
15
20
25
0 5 10 15 20 25 30 35
P05 meas.
P05 calc.
P06 meas.
P06 calc.
P07 meas.
P07 calc.
P08 meas.
P08 calc.
P09 meas.
P09 calc.
P10 meas.
P10 calc.
Deforma�on (mm)
Stre
ss c
hang
e (M
Pa)

64 TR-10-33
Axial strain at the canister surface
Figure A2-7. Modelled and measured radial stress change in the buffer as function of the total shear displacement for Test 3 (160 mm/s).
Figure A2-8. Location and numbering of the strain gauges glued to the canister surface.
-10
-5
0
5
10
15
20
0.00 5.00 10.00 15.00 20.00 25.00
P05 meas.
P05 calc.
P06 meas.
P06 calc.
P07 meas.
P07 calc.
P08 calc.
P09 meas.
P09 calc.
P10 meas.
P10 calc.
Stre
ss c
hang
e (M
Pa)
Deforma�on (mm)
20 mm25 mm30 mm
35 mm
55 mm
60 mm
141516
17
18
Shear force

TR-10-33 65
Figure A2-9. Modelled and measured axial strain in the canister surface as function of the total shear displacement for Test 1 (0.031 mm/s).
Figure A2-10. Modelled and measured axial strain in the canister surface (in point 17) as function of the total shear displacement for Test 2 (1.9 mm/s).
0
0.5
1
1.5
2
2.5
0 5 10 15 20 25 30
P14 meas.
P14 calc.
P15 meas.
P15 calc.
P16 meas.
P16 calc.
P17 meas.
P17 calc.
P18 meas.
P18 calc.
Stra
in (%
)
Deforma�on (mm)
0
0.5
1
1.5
2
2.5
3
3.5
4
0 5 10 15 20 25 30 35
P14 calc.
P15 calc.
P16 calc.
P17 meas.
P17 calc.
P18 calc.
Stra
in (%
)
Deforma�on (mm)

66 TR-10-33
Canister tilting
Figure A2-11. Modelled and measured axial strain in the canister surface as function of the total shear displacement for Test 3 (160 mm/s).
Figure A2-12. Calculated and measured relative displacement between the “canister” end and the “rock surface” as function of the total shear displacement for Test 1 (0.031 mm/s).
0
0.5
1
1.5
2
2.5
3
3.5
4
0 5 10 15 20 25
P14 meas.
P14 calc.
P15 meas.
P15 calc.
P16 meas.
P16 calc.
P17 meas.
P17 calc.
P18 calc.
Stra
in (%
)
Deforma�on (mm)
0
0.5
1
1.5
2
2.5
0 5 10 15 20 25 30
Meas.
Calc.
Cann
iste
r def
orm
a�on
(mm
)
Deforma�on (mm)

TR-10-33 67
Figure A2-13. Measured (left) and modelled canister bending. The deformation scale in the measurements is magnified with a factor of ten.
Canister bending
Test 1
Measured: 14 mm
Modelled to 27 mm shear displacement: 12.3 mm
Canister bending
Test 2
Measured: 19 mm
Modelled: 21.7 mm
Canister bending
Test 3
Measured: 21 mm
Modelled: 18.6 mm
Deformed canister

68 TR-10-33
Axial buffer displacement
Figure A2-14. Picture of the deformed surface of Test 3 and the results of the surveying of the surface plotted as contour lines.

TR-10-33 69
Figure A2-15. Modelled buffer deformation of Test 3 at end of test. Contour lines of the axial displace-ments (m) are also plotted.

TR-10-33 71
Appendix 3
Storage of filesThis report is based on the results from a lot of FE-simulations using ABAQUS which is a com-mercial available code and is thus not stored as part of the work. Below is a short description of files used in the project and directories for storage of these.
1 – Input files used for the simulations
Each analysis is started by abaqus job=input-file (w/o .inp).
Contents in C:\Users\jhd\mappar\clay\kbs3\kapsel\model_report\Input-files_2011
klippet2b_standard_test1_c3_culab4.inp - input-file for test1, weighted densityklippet2b_standard_test1_b_culab4.inp - input-file for test1, distributed densityklippet2b_standard_test2_c_culab4.inp - input-file for test2, weighted densityklippet2b_standard_test2_b_culab4.inp - input-file for test2, distributed densityklippet2b_standard_test3_c_culab4.inp - input-file for test3, weighted densityklippet2b_standard_test3_b_culab4.inp - input-file for test1, distributed density
material_coppar.incl - material definition for copper
2 – Geometry definitions
Contents in C:\Users\jhd\mappar\clay\kbs3\\kapsel\model_report\geometry_2011
klippet.cae - ABAQUS/CAE-database and journal files
klippet.jnl - journal file to create klippet.cae (abaqus cae recover=klippet.jnl)
3 – Script-files
Contents in C:\Users\jhd\mappar\clay\kbs3\\kapsel\model_report\scripts_2011
klippet2b_standard_new2.py - used for post-processing (abaqus cae startup=klippet2b_standard_new2.py
klippet2b_er.py - used for post-processing of strain rate