giordani, federica (2011) new approaches to …theses.gla.ac.uk/2454/1/2010giordanifphd.pdf ·...
TRANSCRIPT
Glasgow Theses Service http://theses.gla.ac.uk/
Giordani, Federica (2011) New approaches to fluorescence-based diagnostics for human African trypanosomiasis. PhD thesis. http://theses.gla.ac.uk/2454/ Copyright and moral rights for this thesis are retained by the author A copy can be downloaded for personal non-commercial research or study, without prior permission or charge This thesis cannot be reproduced or quoted extensively from without first obtaining permission in writing from the Author The content must not be changed in any way or sold commercially in any format or medium without the formal permission of the Author When referring to this work, full bibliographic details including the author, title, awarding institution and date of the thesis must be given

New approaches to fluorescence-based diagnostics
for human African trypanosomiasis
Federica Giordani
Thesis submitted in fulfilment of the requirements for the degree of Doctor of Philosophy
Institute of Infection, Immunity & Inflammation College of Medical, Veterinary & Life Sciences
University of Glasgow
November 2010
ii
Abstract
In the absence of any vaccine, prophylactic drug and effective vector control, the fight
against human African trypanosomiais (HAT) is based on the the combination of active
case-finding and consequent drug treatment of identified positive cases. Unfortunately, low
sensitivity and specificity of current diagnostic techniques often result in misdiagnosis,
leaving infected patients without cure or exposing them to inappropriate chemotherapy
protocols, which use dangerous and expensive drugs. The development of more efficient,
simple, cheap and field-robust diagnostic tests is, therefore, urgently needed.
In the field, direct observation by light microscopy of trypanosomes in human fluids
(blood, lymph node aspirate, cerebrospinal fluid) is considered the ideal way of confirming
HAT infection. However, in practice this approach is problematic, especially for the
Gambian form of the disease, where patients may present with very low parasitaemia.
Detection limits of parasitological techniques can be improved by adding a preliminary
step of sample concentration, although this further increases the laboriousness of HAT
diagnostic algorithm.
Recent advances in fluorescence microscopy could be exploited to facilitate trypanosome
detection. The introduction and implementation of fluorescence microscopy in HAT
endemic countries would offer the advantages of an increased overall sensitivity of
microscopical examination and a more rapid screening of the specimen. In contrast to
traditional, expensive and fragile fluorescence microscopes, new LED-illuminated
instruments are relatively cheap, very efficient and portable, lending themselves to
utilisation in poorly equipped rural settings. In order to design a new diagnostic tool that
exploits LED technology, however, selective and reliable fluorescent markers to label
trypanosomes in human fluids are needed.
The development of new tools to assist in the diagnosis of African trypanosomiasis by use
of LED fluorescence microscopy was the overall objective of this project. The work was
mainly focused on testing various fluorescent compounds for their ability to selectively
stain trypanosomes. Fluorophores were otained from commercial and academic sources, or
else directly synthesised during the project. An important requirement evaluated was the
compounds’ compatibility with the currently available SMR LED Cytoscience
fluorescence microscope, developed and kindly provided by our collaborator Prof. D.
Jones (Philipps University, Marburg).
iii
The utility of a UV LED-driven microscope in performing the arsenical drug resistance test
was also assessed. This assay, developed in our laboratory to detect trypanosome strains
resistant to arsenical and diamidine compounds, could represent a useful tool for
chemotherapeutic decision making in the field, where resistance to arsenical drugs is a
rising problem.
iv
Table of Contents
1 General introduction............................... .......................................................1 1.1 Human African trypanosomiasis ...............................................................2
1.1.1 The aetiological agent.................................................................................2 1.1.2 Disease burden ..........................................................................................3 1.1.3 Vector and transmission .............................................................................4 1.1.4 Life cycle ....................................................................................................5 1.1.5 Cell morphology and cell compartments .....................................................7 1.1.6 Control strategies .......................................................................................8 1.1.7 Chemotherapy ............................................................................................9
1.2 Diagnosis of T. b. gambiense infection...................................................12 1.2.1 Clinical features ........................................................................................14 1.2.2 Serological tests .......................................................................................14
1.2.2.1 CATT/T. b. gambiense.........................................................................................15 1.2.2.2 LATEX/T. b. gambiense.......................................................................................16 1.2.2.3 Immunofluorescent antibody test (IFAT) and enzyme-linked immunosorbent
assay (ELISA) ......................................................................................................17 1.2.3 Parasitological methods............................................................................17
1.2.3.1 Chancre aspirate .................................................................................................18 1.2.3.2 Lymph node aspirate ...........................................................................................18 1.2.3.3 Thin and thick blood films ....................................................................................19 1.2.3.4 Microhaematocrit centrifugation technique (mHCT)............................................19 1.2.3.5 Miniature anion-exchange centrifugation technique (mAECT)............................20 1.2.3.6 Quantitative buffy coat (QBC)..............................................................................20 1.2.3.7 In vivo and in vitro isolation of trypanosome strains ............................................21
1.2.4 DNA technologies.....................................................................................22 1.2.4.1 PCR .....................................................................................................................22 1.2.4.2 Loop-mediated isothermal amplification (LAMP).................................................23 1.2.4.3 Molecular dipstick test (HAT-PCR-OC) ...............................................................24 1.2.4.4 Nucleic acid sequence-based amplification (NASBA) and NASBA-OC..............24 1.2.4.5 Fluorescence in situ hybridisation test (PNA FISH).............................................24
1.2.5 Stage determination..................................................................................25 1.2.5.1 Trypanosome detection in CSF ...........................................................................25 1.2.5.2 White blood cell count in CSF..............................................................................26 1.2.5.3 Protein concentration in CSF...............................................................................26 1.2.5.4 Other markers and tests for second stage determination ...................................26 1.2.5.5 Polysomnography ................................................................................................28
1.2.6 Other diagnostic approaches ....................................................................28 1.2.7 Follow-up..................................................................................................28 1.2.8 Diagnosis of drug resistance.....................................................................29
1.3 Diagnosis of T. b. rhodesiense infection.................................................31 1.4 African animal trypanosomiasis ..............................................................32 1.5 Need for new diagnostics .......................................................................33 1.6 Fluorescence microscopy for diagnosis of infectious diseases...............34
1.6.1 The fluorescence process.........................................................................35 1.6.2 The fluorescence microscope ...................................................................37 1.6.3 Light-emitting diodes (LEDs) for fluorescence microscopy........................38 1.6.4 Fluorescent probes for trypanosomes.......................................................39
1.7 Aim of this thesis ....................................................................................40
2 Materials and methods.............................. ..................................................43 2.1 T. b. brucei in vitro culture ......................................................................44 2.2 Cell line genotyping ................................................................................44
2.2.1 Retrieval of DNA from FTA® card for PCR analysis ..................................45 2.3 Trypanosome-infected blood samples....................................................46 2.4 Alamar Blue assay..................................................................................47
v
2.5 Microscopy techniques ...........................................................................48 2.5.1 Fluorophores ............................................................................................48 2.5.2 In vitro trypanosome samples for fluorescence microscopy ......................48
2.5.2.1 Fluorescent staining and sample preparation......................................................48 2.5.2.2 Cell immobilisation in agarose.............................................................................49 2.5.2.3 Cell fixation in methanol.......................................................................................49 2.5.2.4 Cell fixation in glutaraldehyde..............................................................................49 2.5.2.5 Cell fixation in formaldehyde................................................................................50 2.5.2.6 Mounting media ...................................................................................................50
2.5.3 Ex-vivo trypanosome samples for fluorescence microscopy .....................51 2.5.3.1 Thin and thick blood film preparation...................................................................51 2.5.3.2 Staining procedures for blood films .....................................................................51 2.5.3.3 Giemsa stain ........................................................................................................52
2.5.4 Image acquisition......................................................................................52 2.5.4.1 Zeiss Axioplan fluorescence microscope ............................................................52 2.5.4.2 SMR LED microscope and UV LED microscope (Cytoscience)..........................53
2.5.5 Fluorescence fading measurement...........................................................53 2.6 Fluorescence spectra measurement.......................................................54 2.7 Molecular biology techniques .................................................................54
2.7.1 Genomic DNA extraction ..........................................................................54 2.7.2 PCR..........................................................................................................55
2.7.2.1 Amplification of TbAT1 and mCherry ORF ..........................................................55 2.7.2.2 PCR screening of transfected trypanosomes ......................................................56
2.7.3 Plasmid and vector construction ...............................................................57 2.7.4 E. coli transformation and plasmid purification ..........................................59 2.7.5 Trypanosome transfection ........................................................................60 2.7.6 Southern blot ............................................................................................60
2.7.6.1 gDNA preparation and capillary transfer to membrane .......................................60 2.7.6.2 Preparation of radiolabeled probes .....................................................................61 2.7.6.3 Blot hybridisation and autoradiography ...............................................................61 2.7.6.4 Removal of hybridised probe from membrane ....................................................62
2.7.7 Protein extraction from trypanosomes ......................................................62 2.7.7.1 Total cell lysates ..................................................................................................62 2.7.7.2 Preparation of protein-enriched fractions ............................................................62
2.7.8 Protein quantification ................................................................................63 2.7.9 SDS-PAGE...............................................................................................63 2.7.10 Western blot .............................................................................................64
2.8 Chemical synthesis: general experimental details ..................................64
3 Fluorescence-based diagnostic tests involving the U V fluorescent diamidine DB75..................................... ......................................................66
3.1 Introduction.............................................................................................67 3.1.1 DB75 ........................................................................................................67 3.1.2 DAPI.........................................................................................................68 3.1.3 Fluorophore photobleaching .....................................................................69 3.1.4 Arsenical drug resistance test...................................................................70
3.2 Results....................................................................................................72 3.2.1 DB75 fluorescence in in vitro trypanosomes .............................................72 3.2.2 DB75 fluorescence in ex-vivo trypanosomes ............................................72 3.2.3 DB75 photobleaching ...............................................................................74
3.2.3.1 DB75 and DAPI photobleaching quantification....................................................74 3.2.4 DB75 photobleaching in the presence of antifading agents.......................75
3.2.4.1 DABCO ................................................................................................................76 3.2.4.2 n-propyl gallate ....................................................................................................76 3.2.4.3 Trolox ...................................................................................................................77
3.2.5 Assessment of a new UV LED microscope for DB75 and DAPI excitation 77 3.2.5.1 DB75 photobleaching upon excitation with the UV LED light source..................79
3.2.6 Assessing the suitability of the new Cytoscience UV LED microscope for use with the arsenical drug resistance test ...............................................79
3.2.7 DB75 fluorescence under FITC filter.........................................................82

vi
3.2.7.1 Use of DB75 as fluorescent probe for HAT in association with the LED Cytoscience SMR microscope.............................................................................85
3.3 Discussion ..............................................................................................86 3.3.1 DB75 fluorescence in live and fixed specimens ........................................86 3.3.2 DB75 photobleaching ...............................................................................86 3.3.3 Assessment of the UV LED microscope for the arsenical drug resistance
test ...........................................................................................................87 3.3.4 DB75 fluorescence under a FITC filter ......................................................88
4 Green fluorescent diamidines and phenanthridines as diagnostic probes for trypanosomes................................... .....................................................91
4.1 Introduction.............................................................................................92 4.1.1 Green fluorescent pentamidine analogues................................................92 4.1.2 Phenanthridines........................................................................................93 4.1.3 Acridine orange ........................................................................................96
4.2 Results....................................................................................................98 4.2.1 Fluorescence properties of the five pentamidine analogues......................98
4.2.1.1 Fluorescence in in vitro trypanosomes ................................................................98 4.2.1.2 Uptake and intracellular distribution...................................................................100 4.2.1.3 Fluorescence in viable ex-vivo trypanosomes...................................................103 4.2.1.4 Fluorescence in fixed thin blood smears ...........................................................103 4.2.1.5 Compatibility with the LED Cytoscience SMR microscope ...............................105
4.2.2 Use of the green fluorescent pentamidine analogues as substrates for the arsenical drug resistance test .................................................................105
4.2.2.1 Trypanocidal effect on wild type and P2-deficient T. b. brucei strains ..............105 4.2.2.2 Fluorescence in wild type and P2-deficient T. b. brucei strains.........................107
4.2.3 Ethidium bromide and isometamidium chloride.......................................107 4.2.3.1 Fluorescence in ex-vivo viable trypanosomes...................................................108 4.2.3.2 Fluorescence in fixed thin blood smears ...........................................................110
4.2.4 Propidium iodide.....................................................................................111 4.2.4.1 Fluorescence in in vitro viable trypanosomes....................................................111 4.2.4.2 Fluorescence in ex-vivo viable trypanosomes...................................................111 4.2.4.3 Fluorescence in fixed thin blood smears ...........................................................115 4.2.4.4 Compatibility with the LED Cytoscience SMR microscope ...............................115
4.2.5 Acridine orange ......................................................................................116 4.2.5.1 Fluorescence in in vitro viable trypanosomes....................................................116 4.2.5.2 Fluorescence in ex-vivo trypanosomes .............................................................117 4.2.5.3 Compatibility with the LED Cytoscience SMR microscope ...............................118
4.2.6 Fluorescent staining of thick blood smears .............................................119 4.2.7 Double stain with Giemsa and fluorophores............................................122
4.3 Discussion ............................................................................................125 4.3.1 New fluorophores for the arsenical drug resistance test..........................125 4.3.2 Intracellular distribution of the five pentamidine analogues .....................126 4.3.3 Phenanthridines and acridine orange as fluorescent probes for
trypanosomes.........................................................................................128 4.3.4 Practical considerations on the use of the LED Cytoscience SMR
microscope .............................................................................................129
5 Synthesis of UV fluorescent amino acid derivatives .............................131 5.1 Introduction...........................................................................................132 5.2 Results..................................................................................................134
5.2.1 Synthesis of a dichlorobenzyl tyrosine derivative ....................................134 5.2.2 Synthesis of a 2-methylnaphthalene serine derivative ............................134 5.2.3 Synthesis of a dansyl chloride lysine derivative ......................................135 5.2.4 Experimental details ...............................................................................138 5.2.5 Biological evaluation ...............................................................................143
5.2.5.1 Fluorescence spectra ........................................................................................143 5.2.5.2 Trypanotoxicity...................................................................................................144 5.2.5.3 Fluorescence microscopy ..................................................................................144
5.3 Discussion ............................................................................................148

vii
6 Construction of a TbAT1 -RFP reporter system to study the sub-cellular localisation of the P2 transporter ................. ...........................................150
6.1 Introduction...........................................................................................151 6.1.1 The P2 amino-purine transporter and its substrates................................151 6.1.2 Regulation of the P2 transporter expression ...........................................152 6.1.3 TbAT1 fluorescent tagging......................................................................154
6.2 Results..................................................................................................156 6.2.1 Preparation of the TbAT1-mCherry recombinant constructs ...................156
6.2.1.1 Amplification of TbAT1 and mCherry ORF ........................................................156 6.2.1.2 Sequence analysis.............................................................................................156 6.2.1.3 Cloning into the expression vector pHD676 ......................................................157
6.2.2 Transfection and PCR screening of clones .............................................159 6.2.3 Southern blot ..........................................................................................161
6.2.3.1 Clone 449 Cl.7 C-t .............................................................................................161 6.2.3.2 Clone 449 Cl.4 N-t .............................................................................................165
6.2.4 Western blot ...........................................................................................166 6.2.5 Drug sensitivity .......................................................................................168 6.2.6 Fluorescence microscopy .......................................................................172
6.2.6.1 Fluorescence of clones grown in vitro ...............................................................172 6.2.6.2 Fluorescence of clones grown in vivo................................................................175
6.3 Discussion ............................................................................................177
7 General discussion................................. ...................................................180
Appendices......................................... ...............................................................185
References......................................... ................................................................189

viii
List of Figures
Figure 1.1 – Map of Africa showing the geographical distribution of T. b. gambiense and T. b. rhodesiense. ....................................................4
Figure 1.2 – Schematic representation of the digenetic life cycle of Trypanosoma brucei in the mammalian host and in the tsetse fly vector. ................6
Figure 1.3 – Diagram of a bloodstream Trypanosoma brucei cell illustrating the major organelles. ...............................................................................7
Figure 1.4 – Chemical structure of the drugs used for human African trypanosomiasis treatment. .............................................................10
Figure 1.5 – General flow chart for T. b. gambiense diagnosis. ..........................13 Figure 1.6 – Diagram illustrating the fluorescence process. ................................36 Figure 1.7 – Schematic illustration of the light path of an epifluorescence
microscope. .....................................................................................38 Figure 1.8 – The prototypical SMR portable LED fluorescence microscope
(Cytoscience)...................................................................................41 Figure 2.1 – Schematic representation of the steps taken to build pMB-G94 and
pMB-G95 vectors.............................................................................58 Figure 3.1 – Chemical structure of DB75 and DAPI. ...........................................68 Figure 3.2 – DB75 and DAPI fluorescence acquisition in live, in vitro
trypanosomes..................................................................................73 Figure 3.3 – DB75 fluorescence in fixed and fresh infected murine blood
samples. ..........................................................................................73 Figure 3.4 – Fading profile of DB75 and DAPI.....................................................75 Figure 3.5 – Fading profile of DB75 in the presence of different mounting
media...............................................................................................76 Figure 3.6 – The UV LED microscope built by Prof. D. Jones (Philipps University,
Marburg). .........................................................................................78 Figure 3.7 – Fluorescence images of trypanosomes stained with DAPI or DB75
acquired using the UV LED microscope. .........................................78 Figure 3.8 – Time course of DB75 internalisation in wild type and tbat1-/- cells as
observed under the UV LED fluorescence microscope. ..................81 Figure 3.9 – Fluorescence of ex-vivo DB75-stained trypanosomes viewed under
DAPI and FITC filters.......................................................................83 Figure 3.10 – DB75 fluorescence development within bloodstream trypanosomes
as visualised during our experiments and in the published work by Mathis et al., 2006. ..........................................................................84
Figure 3.11 – Cellular localization of DB75 and the mitochondrial marker Mito Tracker Red.....................................................................................85
Figure 4.1 – Chemical structure of the five green fluorescent pentamidine analogues........................................................................................93
Figure 4.2 – Chemical structure of the three phenanthridines used in the present study................................................................................................95
Figure 4.3 – Chemical structure of acridine orange. ............................................97 Figure 4.4 – Fluorescence development within in vitro trypanosomes treated with
the five green fluorescent pentamidine analogues. .........................99 Figure 4.5 – Effect of temperature on the internalisation of DB1680 and DB1692
into T. b. brucei................................................................................99 Figure 4.6 – Fluorescence spectra of DB1680 and DB75. ................................100 Figure 4.7 – Effect of cytochalasin D on the uptake of DB1680 and DB1692....102 Figure 4.8 – Fluorescence images at high magnification of trypanosomes treated
with DB1680 and DB1692. ............................................................102

ix
Figure 4.9 – Fluorescence images of live trypanosomes treated ex-vivo with each of the five green fluorescent pentamidine analogues. ...................104
Figure 4.10 – Fixed T. b. brucei w.t. trypanosomes stained with DB1692. ..........104 Figure 4.11 – Fluorescence images of T. b. brucei w.t., tbat1-/- and B48 line treated
with each of the five green fluorescent pentamidine analogues. ...108 Figure 4.12 – Ethidium bromide fluorescence development within live ex-vivo
trypanosomes................................................................................109 Figure 4.13 – Isometamidium chloride fluorescence development within live ex-vivo
trypanosomes................................................................................109 Figure 4.14 – Fixed thin blood smears stained with ethidium bromide and
isometamidium. .............................................................................110 Figure 4.15 – Fluorescence images of in vitro and ex-vivo trypanosomes stained
with propidium iodide.....................................................................112 Figure 4.16 – Propidium iodide-stained trypanosome viewed at high
magnification. ................................................................................114 Figure 4.17 – Propidium iodide fluorescence development within ex-vivo
trypanosomes................................................................................114 Figure 4.18 – Fixed thin blood smears stained with propidium iodide. ................115 Figure 4.19 – In vitro wild type and tbat1-/- trypanosomes treated with acridine
orange at different temperatures. ..................................................117 Figure 4.20 – Acridine orange-stained trypanosome viewed at high
magnification. ................................................................................117 Figure 4.21 – Wet thin blood smear stained with acridine orange. ......................119 Figure 4.22 – Fixed thin blood smears stained with acridine orange. ..................119 Figure 4.23 – Air-dried thick blood smears stained with acridine orange or
propidium iodide. ...........................................................................120 Figure 4.24 – Thick blood smears stained with acridine orange or propidium iodide
before air-drying. ...........................................................................121 Figure 4.25 – Thin blood smears stained with propidum iodide alone or double-
stained with Giemsa and the fluorophore. .....................................123 Figure 5.1 – Synthesis of Tyr(Cl2-Bzl)-OH (FG10) from Boc-Tyr(Cl2-Bzl)-OH. ..134 Figure 5.2 – Synthesis of the 2-methylnaphthalene serine derivative FG70......135 Figure 5.3 – Synthesis of the dansyl chloride lysine derivative FG400..............136 Figure 5.4 – 400 MHz 1H-NMR spectrum of the dansyl chloride lysine derivative
FG400 (sample dissolved in CD3OD). ...........................................137 Figure 5.5 – Electron impact positive (EI+) mass spectrum of FG400. ..............137 Figure 5.6 – IR spectrum of FG400. ..................................................................138 Figure 5.7 – Fluorescence spectra of FG400. ...................................................144 Figure 5.8 – Sensitivity of T. b. brucei w.t. S427 to the three amino acid
derivatives. ....................................................................................145 Figure 5.9 – Fluorescence imges of trypanosomes stained with FG400. ..........146 Figure 5.10 – Fluorescence images of trypanosomes stained with DB1919. ......146 Figure 6.1 – Adenosine uptake in trypanosomes grown either in tissue culture or
harvested from rat blood................................................................153 Figure 6.2 Amino acid sequence alignment of mCherry PCR products for N-t
and C-t tagging. .............................................................................157 Figure 6.3 – Maps of pMB-G94 and pMB-G95 and their restriction profiles. .....158 Figure 6.4 – PCR screening of transgenic bloodstream form cell lines. ............160 Figure 6.5 – Southern blot analysis of line 449 and derived clone 449 Cl. 7 C-t,
hybridized with TbAT1 probe.........................................................162 Figure 6.6 – Restriction digest map of vectors pMB-G94 and pMB-G95 and of the
rRNA locus of T. b. brucei. ............................................................163

x
Figure 6.7 – Southern blot analysis of line 449 and derived clone 449 Cl.7 C-t, hybridized with mCherry probe......................................................164
Figure 6.8 – Southern blot analysis of clone 449 Cl.4 N-t, hybridized with TbAT1 and mCherry probes......................................................................166
Figure 6.9 – Western blot analysis of cell extracts from clone 449 Cl.4 N-t and 449 Cl.7 C-t. ..................................................................................167
Figure 6.10 – Sensitivity of four clones and their parental lines to four different trypanocidal drugs. ........................................................................171
Figure 6.11 – Fluorescence images of four in vitro-grown clones expressing the P2 transporter fused with the mCherry fluorescent protein. ................174
Figure 6.12 – Percentage of fluorescence intensity measured for clone 449 Cl.4 N-t..................................................................................................175
Figure 6.13 – Fluorescence images of two C-t clones expressing the TbAT1::mCherry fusion protein and grown in mice........................176

xi
List of Tables
Table 2.1 – Oligonucleotides used for cell line genotyping. ..................................44 Table 2.2 – Oligonucleotides used for TbAT1 and mCherry ORF amplification. ...55 Table 2.3 – Oligonucleotides used for amplification of a fragment spanning TbAT1
and mCherry domains in transfected trypanosomes. .........................56 Table 4.1 – Excitation and emission wavelengths of the five green fluorescent
diamidines. .........................................................................................93 Table 4.2 – Excitation and emission maxima of the three phenanthridines
tested. ................................................................................................95 Table 4.3 – Excitation and emission maxima of acridine orange. .........................97 Table 4.4 – Trypanocidal activity of the five pentamidine analogues against T. b.
brucei S427 w.t., tbat1-/- and B48 cell lines. .....................................106 Table 6.1 – Drug sensitivity of four transfectant lines to different trypanocidal
drugs. ...............................................................................................170

xii
Acknowledgement
I am particularly grateful to my supervisor Prof. M. P. Barrett, for his trust and his
invaluable support throughout these three years of PhD. I am also very thankful to my
supervisor Dr. A. Sutherland, for making the period I spent in his chemistry laboratory a
very useful and positive experience.
I would like to thank my assessors, Dr. R. Burchmore and Prof. M. Turner, for their advice
and support, and all the people who contributed to this project, especially Prof. D. Jones
(Philipps University, Marburg, Germany), who developed the LED fluorescence
microscopes, and Prof. D. W. Boykin (Georgia State University, Atlanta, USA), who
provided the fluorescent diamidine compounds.
This work would have not been possible without the financial support of the “Sir Halley
Stewart Trust”, to whom I am very grateful.
I wish to thank all the friends and colleagues I had the privilege to work with at the
University of Glasgow. I am very thankful to the Loudon group, for their patience in
teaching me some chemistry, and to all the people of Level 5 and 6 of the GBRC, in
particular those in M. Barrett’s group and those I shared the office with: Anne, Pius, Isabel,
Eduard, Jana, Darren, Gordon, Nicola, Caroline, Paul. A special thanks to Pui Ee for her
help with the animal work but, most of all, for being such a good friend of mine. Thanks to
Chris, for sharing his wisdom with me and...for all the banjo demonstrations. Many thanks
to Dave, for his generous help with the molecular biology work and for the precious gift of
his time and understanding.
I owe a very special thanks to my family, whose support gives me the strength to face
every new day.
The list of the acknowledgements would not be complete without mentioning this beautiful
country that hosted me, Scotland, which “may not be big, but her heart, like her
landscapes, is mighty” (C.W.).

xiii
Author’s Declaration
I declare that the results presented in this thesis are my own work, except when stated
otherwise, and that this work has not been submitted for a degree at another institution.
Federica Giordani
November 2010
xiv
Abbreviations
νmax/cm-1 infrared absorption frequencies [α]D specific rotation ACT actin Amp ampère AMP ampicillin resistance marker (β-lactamase) AO acridine orange Ar aryl (or argon) b.f. bloodstream form BP bandpass bp base pairs br broad BSA bovine serum albumin Bzl benzyl c concentration calcd calculated cat catalyst CATT card agglutination test for trypanosomiasis Cbz carbobenzyloxy CCD charge coupled device CD3OD deuterated methanol CDCl3 deuterated chloroform CI chemical ionisation cm centimetre CNS central nervous system CSF cerebrospinal fluid d doublet DABCO 1,4-diazabicyclo(2,2,2)-octane DAPI 4'-6-diamidino-2-phenylindole DC double centrifugation DCM dichloromethane dd doublet of doublets DFMO α-difluoromethylornithine (eflornithine) dH2O distilled water DMAP 4-dimethylaminopyridine DMF N,N-dimethylformamide DMSO dimethylsulfoxide DMSO-d6 deuterated dimethylsulfoxide DNDi Drugs for Neglected Diseases Initiative dNTPs deoxynucleotide triphosphates E. coli Escherichia coli EDCI 1-(3-dimethylaminopropyl)-3-ethyl-carbodiimide hydrochloride EDTA ethylenediaminetetraacetic acid disodium salt dihydrate EI electron impact (ionization) ELISA enzyme-linked immunosorbent assay eq equivalent Et ethyl EtOAc ethyl acetate EtOH ethanol f forward FAB fast atom bombardment

xv
FCS fetal calf serum FIND Foundation for Innovative New Diagnostics FISH fluorescence in situ hybridization FITC fluorescein-5-isothiocyanate g gram gDNA genomic DNA GFP green fluorescent protein h hour HAPT high affinity pentamidine transporter HAT human African trypanosomiasis HRMS high resolution mass spectrometry Hyg hygromycin HYG hygromycin resistance gene (hygromycin phosphotransferase) Hz Hertz IC50 median inhibition concentration IFAT immunofluorescent antibody test IPTG isopropyl-β-D-1-thiogalactopyranoside IR infrared J NMR spectra coupling constant kb kilobase kDa kilodalton kDNA kinetoplast DNA L litre LAMP loop-mediated isothermal amplification LAPT low affinity pentamidine transporter LB Luria Bertani LED light-emitting diode lit. literature LMRS low resolution mass spectrometry LP longpass Lys lysine M molar m multiplet mAECT miniature anion-exchange centrifugation technique MeOH methanol mHCT microhaematocrit centrifugation technique MHz mega Hertz min minute ml millilitre mm millimetre mM millimolar mmol millimole mp melting point ms millisecond MW molecular weight NA numerical aperture NASBA nucleic acid sequence-based amplification assay NEO neomycin resistance gene (neomycin phosphotransferase) NEt3 triethylamine ng nanogram nm nanometre nM nanomolar NMR nuclear magnetic resonance
xvi
NTDs neglected tropical diseases o/n overnight ºC degrees Celsius OC oligochromatography OD optical density ORF open reading frame ORI origin of replication PAC puromycin resistance gene (puromycin N-acetyltransferase) PARP procyclic acidic repetitive protein PBS phosphate-buffered saline PCR polymerase chain reaction ppm part per million q quartet QBC quantitative buffy coat r reverse r.t. room temperature RFLP restriction fragment length polymorphism RFP red fluorescent protein RHOD rhodamine rpm revolutions per minute rRNA ribosomal RNA s singlet SDS-PAGE sodium dodecyl sulfate polyacrylamide gel electrophoresis sec second t triplet T. b. Trypanosoma brucei t-Boc tert-butoxycarbonyl TDR WHO Programme for Research and Training in Tropical Diseases Tet tetracycline TFA trifluoroacetic acid Tyr tyrosine U unit UV ultraviolet V volt v volume VAT variable antigen type VSG variant surface glycoprotein w weight w.t. wild type wb whole blood WHO World Health Organisation X-Gal 5-bromo-4-chloro-3-indolyl-β-D-galactopyranoside δ chemical shift λEM wavelength of maximum emission λEX wavelength of maximum excitation µg microgram µl microlitre µm micrometre µM micromolar

1
General introduction

Federica Giordani, 2010 Chapter 1, 2
1.1 Human African trypanosomiasis
Human African trypanosomiasis (HAT), also known as sleeping sickness, is a deadly
parasitic disease endemic to sub-Saharan Africa (Stich et al., 2002). HAT belongs to the
so-called “neglected tropical diseases” (NTDs), a group of infections affecting the world’s
poor that includes, among others, leishmaniasis, Chagas’ disease, dengue, leprosy,
schistosomiasis and onchocerciasis. The World Health Organisation (WHO) estimates that
one billion people (one sixth of the world's population) are affected by at least one of the
NTDs (http://www.who.int/neglected_diseases/en/). Unfortunately, since these diseases
persist almost exclusively in the most marginalised communities of undeveloped countries,
very little resource is spent to lighten their tremendous social and economic burden. HAT
represents a major public health threat in Africa and together with nagana, the animal form
of African trypanosomiasis, is considered a main obstacle for development of rural regions
of the continent (Simarro et al., 2008). Since 1997, WHO has been raising awareness of
this most neglected disease, favouring the establishment of national control programs and
the involvement of public and private partnerships (Stich et al., 2003). These efforts have
significantly reduced the incidence of HAT in endemic countries by implementation of
surveillance and drug availability.
1.1.1 The aetiological agent
The aetiological agent of HAT is a haemoflagellate protozoan belonging to the species
Trypanosoma brucei (genus Trypanosoma, order Kinetoplastida) (Cox, 2004). Of the three
subspecies of T. brucei only two are infectious to humans (T. b. gambiense and T. b.
rhodesiense), while T. b. brucei causes infection in wild and domestic animals (Barrett et
al., 2003). Sporadic cases of human infection with other trypanosome species have been
reported (Truc et al., 1998c; Joshi et al., 2005), but, at least in one case, infection could be
ascribed to a mutated apolipoprotein L1 found in the serum of the patient (Lun et al.,
2009), which is a component of the trypanolytic factor that normally protects humans from
animal trypanosome infection (Pays and Vanhollebeke, 2008). Both T. b. gambiense and T.
b. rhodesiense are transmitted to the human host by the bite of an infected tsetse fly (genus
Glossina), which acts as vector of the disease.
The two forms of HAT differ greatly (Welburn et al., 2001a). T. b. gambiense is
responsible for more than 90% of reported cases of HAT and causes a chronic form of the
illness, which can last for months or years before major symptoms arise. Checchi and

Federica Giordani, 2010 Chapter 1, 3
colleagues indirectly estimated the duration of the Gambian form to nearly three years in
absence of treatment, equally split between the two stages (see Section 1.1.4) of the disease
(Checchi et al., 2008a). On the other hand, T. b. rhodesiense causes an acute form that
usually leads to the patient’s death within weeks or few months (Brun et al., 2009).
However, exceptions to these rules, with acute Gambian disease and chronic Rhodesiense
trypanosomiasis cases, are observed (Garcia et al., 2006). Moreover, despite most T. b.
gambiense infections being fatal in absence of treatment, human trypano-tolerance, with
self-resolving and asymptomatic chronic infections, has been postulated (Checchi et al.,
2008b). Other differences between the Rhodesiense and Gambiense forms lie in their
clinical features and the chemotherapy protocols used, in their epidemiology and
transmission and, therefore, in the control strategies applied (Fèvre et al., 2006).
1.1.2 Disease burden
HAT transmission is restricted to the African continent (Figure 1.1), but around 50 cases
per year are diagnosed elsewhere in people who had travelled to affected regions (Sinha et
al., 1999; Ripamonti et al., 2002; Lejon et al., 2003a). Endemic foci of the disease have a
discrete distribution, correlated to the presence of the tsetse flies. There are nearly 300
active foci identified, confined to an area that stretches south of the Sahara and north of the
Kalahari desert (Barrett et al., 2003). T. b. gambiense infection is found in west and central
Africa: Angola, Democratic Republic of the Congo and Sudan are the most affected
countries by the Gambian form, with more than 1,500 new cases per year reported up to
2004 (WHO, 2006b). T. b. rhodesiense is found in the eastern and southern part of the
continent. The above mentioned study identified Malawi, Uganda and United Republic of
Tanzania as the countries with the highest incidence of this HAT form (50–1,500 cases per
year). Uganda is the only country in Africa known to be affected by both T. brucei
subspecies, but the distribution of these parasites is, at least for the time being, separate
(Picozzi et al., 2005).
Compared to other parasitic diseases like malaria or worm infections, incidence of HAT is
lower, but its potential to give rise to devastating epidemics as soon as active surveillance
is abandoned makes this illness a major health priority in endemic countries (Cattand et al.,
2001). Systematic control programs established by European authorities resulted in
efficacious intervention in the big epidemics that occurred between the end of the 19th and
the beginning of the 20th century, bringing the disease to a nearly elimination by the 1960s
(Pépin and Méda, 2001; Maudlin, 2006). After the colonial era, however, the number of

Federica Giordani, 2010 Chapter 1, 4
Figure 1.1 – Map of Africa showing the geographical distribution of T. b. gambiense and T. b. rhodesiense . The epidemiological status of the endemic countries is indicated with different colours. (Reproduced from Simarro et al ., 2008; doi:10.1371/journal.pmed.0050055.g003).
cases increased rapidly, due to lack of surveillance and awareness from local government,
but also to poverty, political instability, wars and displacement of populations (Smith et al.,
1998; Cattand, 2001; Brun et al., 2009). Today, a total of 60 million people in 36 African
countries are continuously exposed to the risk of infection by one of the two forms of
HAT, but only 3-4 million are under surveillance (Cattand et al., 2001). For this reason,
accurate epidemiological data for sleeping sickness are difficult to collect and reported
incidence of the illness is often considered an underestimate (Fèvre et al., 2008; Welburn
et al., 2009). Despite this uncertainty, at the end of the 20th century, WHO estimated an
annual number of cases of at least 300,000 (40,000 – 50,000 deaths), of which only 13%
were identified and treated (WHO, 2001). Fortunately, improvement in control policies and
new international initiatives have led, during the last decade, to a steady decline of total
cases, currently estimated to be 50,000 – 70,000 (WHO, 2006b; Barrett, 2006).
1.1.3 Vector and transmission
HAT is transmitted to humans through the bite of infected haematophagous arthropods
belonging to the Glossina species. Gambian trypanosomiasis is typically acquired from
Federica Giordani, 2010 Chapter 1, 5
riverine tsetse flies of the G. papalis group, but also G. fuscipes, G. tachinoides and G.
calliginea can act as vectors of T. b. gambiense (Cattand, 2001). The reservoir of this
infection is considered exclusively human. Therefore, the cyclic transmission human-fly-
human is the main cause of the persistence of the disease. Nevertheless, natural infections
with T. b. gambiense have been reported in domesticated animals (pigs, dogs and sheep)
and may occur in wild fauna as well (Njiokou et al., 2006), although the epidemiological
impact of this reservoir on humans remains as yet undetermined (Pépin and Méda, 2001;
Brun and Balmer, 2006; Fèvre et al., 2006). T. b. rhodesiense, on the contrary, is a
zoonotic parasite found in savannah habitats. Human infection with this species is
sporadic, but when it occurs the disease is highly virulent and progresses very rapidly.
Rhodesiense trypanosomiasis is transmitted by tsetse flies belonging to the G. morsitans
group (and, at lesser extent, to G. pallidipes, G. swynnertoni and G. fuscipes) that have fed
on infected domestic (cattle in particular) and wild (especially ungulates) animals, which,
therefore, serve as the main reservoir of the parasite (Pépin and Méda, 2001; Welburn et
al., 2001b). Tsetse flies are usually active during the day, but some species can bite at night
and both sexes can transmit the infection (Fèvre et al., 2006). Interactions between vector
and parasite are complex. Only a very small percentage of natural population of tsetse flies
are infected by T. brucei species and this can explain the absence of correlation between
insect concentration and incidence of the human disease (Pépin and Méda, 2001). Other
possible routes of infection with trypanosomes are through blood transfusions, infected
needles or congenitally (Barrett et al., 2003).
1.1.4 Life cycle
Trypanosomes are pleomorphic, single-celled parasites with a two-host life cycle:
mammalian and arthropod (Chappuis et al., 2005; Brun et al., 2009). The cycle (Figure
1.2) starts when an infected tsetse fly takes its blood meal on the mammalian host and it
inoculates the metacyclic trypomastigote form of the parasite present in its saliva.
Trypanosomes quickly transform into the long slender trypomastigotes and proliferate by
binary fission at the site of the bite for a few days, leading to an inflammatory chancre. The
parasites, then, spread to the draining lymph nodes and the bloodstream (first or early
haemolymphatic stage of infection), through which they reach other organs such as the
spleen, liver, heart and endocrine system. After a few weeks (T. b. rhodesiense) or several
months (T. b. gambiense) trypanosomes cross the blood-brain barrier (BBB) to invade the
central nervous system (CNS) through mechanisms that are still poorly understood
(Enanga et al., 2002): the patient is, then, said to be in the meningoencephalitic, second (or
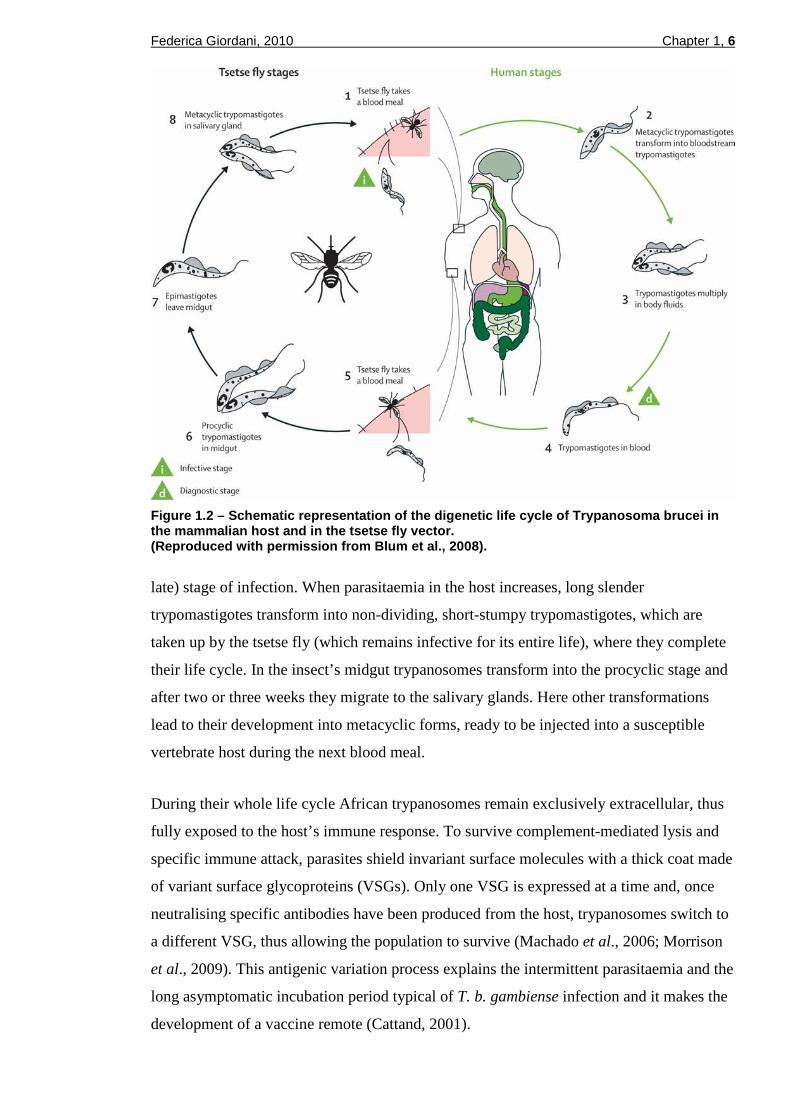
Federica Giordani, 2010 Chapter 1, 6
Figure 1.2 – Schematic representation of the digene tic life cycle of Trypanosoma brucei in the mammalian host and in the tsetse fly vector. (Reproduced with permission from Blum et al ., 2008).
late) stage of infection. When parasitaemia in the host increases, long slender
trypomastigotes transform into non-dividing, short-stumpy trypomastigotes, which are
taken up by the tsetse fly (which remains infective for its entire life), where they complete
their life cycle. In the insect’s midgut trypanosomes transform into the procyclic stage and
after two or three weeks they migrate to the salivary glands. Here other transformations
lead to their development into metacyclic forms, ready to be injected into a susceptible
vertebrate host during the next blood meal.
During their whole life cycle African trypanosomes remain exclusively extracellular, thus
fully exposed to the host’s immune response. To survive complement-mediated lysis and
specific immune attack, parasites shield invariant surface molecules with a thick coat made
of variant surface glycoproteins (VSGs). Only one VSG is expressed at a time and, once
neutralising specific antibodies have been produced from the host, trypanosomes switch to
a different VSG, thus allowing the population to survive (Machado et al., 2006; Morrison
et al., 2009). This antigenic variation process explains the intermittent parasitaemia and the
long asymptomatic incubation period typical of T. b. gambiense infection and it makes the
development of a vaccine remote (Cattand, 2001).
Federica Giordani, 2010 Chapter 1, 7
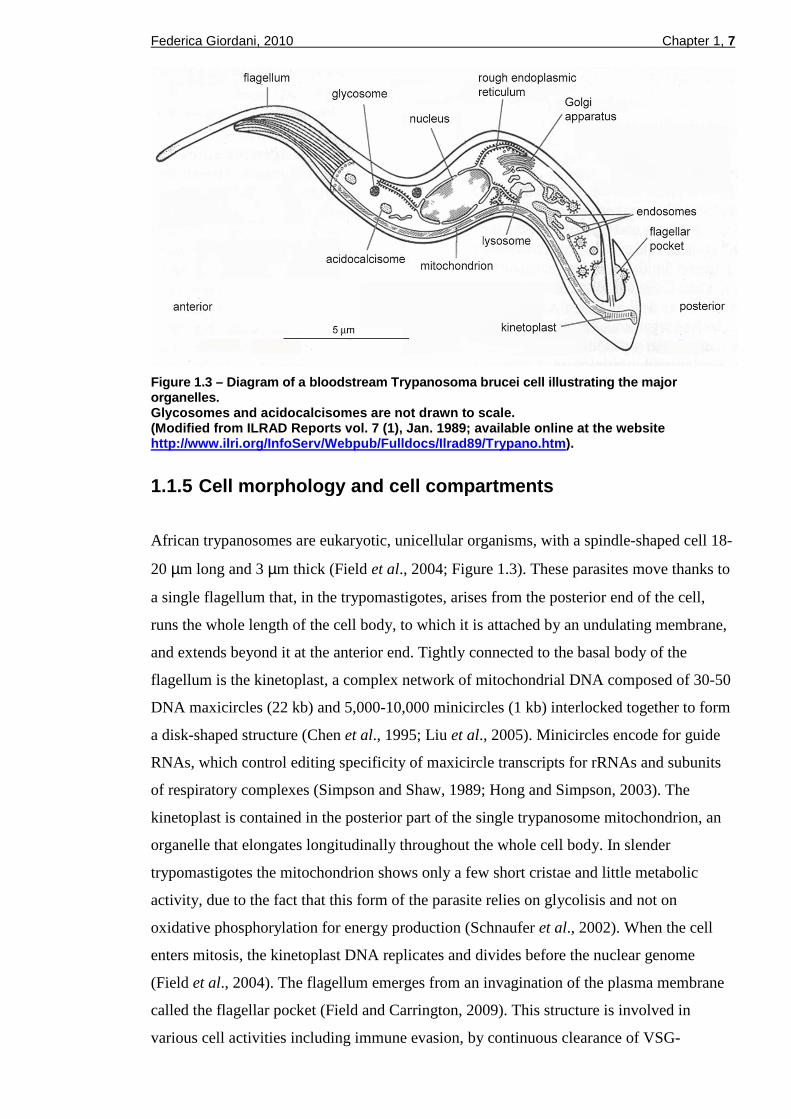
Figure 1.3 – Diagram of a bloodstream Trypanosoma brucei cell illustrating the major organelles. Glycosomes and acidocalcisomes are not drawn to sca le. (Modified from ILRAD Reports vol. 7 (1), Jan. 1989; available online at the website http://www.ilri.org/InfoServ/Webpub/Fulldocs/Ilrad8 9/Trypano.htm ).
1.1.5 Cell morphology and cell compartments
African trypanosomes are eukaryotic, unicellular organisms, with a spindle-shaped cell 18-
20 µm long and 3 µm thick (Field et al., 2004; Figure 1.3). These parasites move thanks to
a single flagellum that, in the trypomastigotes, arises from the posterior end of the cell,
runs the whole length of the cell body, to which it is attached by an undulating membrane,
and extends beyond it at the anterior end. Tightly connected to the basal body of the
flagellum is the kinetoplast, a complex network of mitochondrial DNA composed of 30-50
DNA maxicircles (22 kb) and 5,000-10,000 minicircles (1 kb) interlocked together to form
a disk-shaped structure (Chen et al., 1995; Liu et al., 2005). Minicircles encode for guide
RNAs, which control editing specificity of maxicircle transcripts for rRNAs and subunits
of respiratory complexes (Simpson and Shaw, 1989; Hong and Simpson, 2003). The
kinetoplast is contained in the posterior part of the single trypanosome mitochondrion, an
organelle that elongates longitudinally throughout the whole cell body. In slender
trypomastigotes the mitochondrion shows only a few short cristae and little metabolic
activity, due to the fact that this form of the parasite relies on glycolisis and not on
oxidative phosphorylation for energy production (Schnaufer et al., 2002). When the cell
enters mitosis, the kinetoplast DNA replicates and divides before the nuclear genome
(Field et al., 2004). The flagellum emerges from an invagination of the plasma membrane
called the flagellar pocket (Field and Carrington, 2009). This structure is involved in
various cell activities including immune evasion, by continuous clearance of VSG-
Federica Giordani, 2010 Chapter 1, 8
immunoglobulin complexes, and cell trafficking, being the only site where endocytic and
exocytic processes occur (Morgan et al., 2002). The organisation of the cell compartments
from the flagellar pocket towards the anterior side is highly polarised. Associated to the
pocket is the Golgi complex with its endocytic and secretory vesicles confined between
kinetoplast and nucleus. The single lysosome is usually close to the nucleus, which is
located at the midpoint of the cell (Field et al., 2004). The nuclear genome of T. brucei
includes 11 diploid, megabase-sized chromosomes and various aneuploid, mini- and
intermediate chromosomes (30-700 kb), which harbour VSGs sequences and expression
sites similar to those present in the subtelomeres of the megabase chromosomes (Berriman
et al., 2005). The endoplasmic reticulum is distributed in the whole cytoplasm as well as
the acidocalcisomes, acidic electron-dense granules with a diameter of around 0.2 µm,
important for the homeostasis of various elements including several cations, dications
(Na+, Ca2+, Mg2+, Zn2+) and phosphate (Docampo and Moreno, 1999; Rodrigues et al.,
1999). Acidocalcisomes, which have no counterpart in mammalian cells, can be visualised
inside different Trypanosoma species by their specific staining with acridine orange
(Vercesi et al., 1994; Mendoza et al., 2002). Glycosomes are other membrane-bound
organelles, homogeneous in size (0.27 µm diameter), present throughout the whole cell
body of T. brucei. These structures, which are closely related to peroxisomes, contain
glycolytic enzymes and are particularly abundant in bloodstream trypomastigotes (240 per
cell) (Opperdoes, 1987).
1.1.6 Control strategies
All countries affected by HAT have national programs dedicated to surveillance of the
disease (Simarro et al., 2008). Control is based on two approaches: the reduction of the
reservoirs (human or animal) of the parasite and the reduction of the chance of contact
between vector and human host by means of vector removal (Welburn et al., 2001a). For
T. b. gambiense form, where humans represent the main reservoir, active case-finding (and
therefore, correct diagnosis) and treatment of the infected patients are the strategies
adopted to interrupt transmission (Simarro et al., 2006; Brun et al., 2009). For T. b.
rhodesiense, instead, the control of infection in livestock (and, to a minor extent, in
wildlife) through the use of curative or prophylactic trypanocides or application of
insecticides to the animals plays a crucial role (Hutchinson et al., 2003; Fèvre et al., 2006;
Simarro et al., 2008). For Rhodesian HAT, vector control can also be an efficient approach
for containing the transmission of the disease (Welburn et al., 2009). The fight against
tsetse flies involves the use of insecticides and the installation of traps or screens (Torr et

Federica Giordani, 2010 Chapter 1, 9
al., 2005; Lindh et al., 2009). A new technology available to decrease tsetse population
consist in the release of sterilised tsetse males (sterile insect technique, SIT), but its cost-
effectiveness is disputed (Vreysen, 2001).
1.1.7 Chemotherapy
Since African trypanosomiasis is considered invariably fatal if untreated, chemotherapy is
mandatory. Unfortunately, as for the other neglected tropical diseases, drug research and
development for HAT is a minor activity due to lack of profit perspectives for
pharmaceutical companies (Trouiller et al., 2002). Although today new initiatives, like the
Drugs for Neglected Diseases Initiative, DNDi (http://www.dndi.org/index.php), are trying
to face this problem, HAT treatment still relies on only four drugs (Figure 1.4), three of
them introduced over 50 years ago (Ollivier and Legros, 2001). Recently, nifurtimox (an
orally administered 5-nitrofuran licensed for the treatment of Chagas’ disease) for use in
combination with eflornithine (see later), has been added to the list (Delespaux and de
Koning, 2007; Figure 1.4). The production and availability of these drugs is in constant
danger and continues only thanks to agreements between WHO and the suppliers
(Etchegorry et al., 2001; Barrett et al., 2003). All of these four drugs are far from ideal,
with problems associated to toxicity, route of administration, low efficacy and resistance
(Legros et al., 2002; Fairlamb, 2003). HAT therapy is even more complicated during the
second stage of the disease, since drugs have to reach the brain by crossing the blood-brain
barrier, which otherwise protects parasites from compounds active in the haemolymphatic
compartment (Enanga et al., 2002; Lejon and Büscher, 2005).
Pentamidine and Suramin are the drugs used to treat the early stage of HAT. Pentamidine
isethionate (Lomidine®) was introduced in the early 1940s and, since then, it has been used
for the treatment of T. b. gambiense infection without being associated with any significant
resistance outbreak (Delespaux and de Koning, 2007). During the colonial era this
compound was also widely used as mass chemoprophylactic agent (Ollivier and Legros,
2001). Pentamidine is administered by intramuscular injection (7-10 doses of 4 mg/kg
daily or every two days) and it is relatively well tolerated (Legros et al., 2002). Three
transmembrane transporters responsible for the selective accumulation of pentamidine
inside trypanosomes have been identified (de Koning, 2001a) and two more have recently
being discovered (Ortiz et al., 2009), but the mechanism of action of this slow-acting
diamidine is still unclear. Suramin sodium (Germanin®) is a polyanionic sulfonated
naphthylamine used as first line treatment for T. b. rhodesiense form of HAT since 1920.

Federica Giordani, 2010 Chapter 1, 10
OO
NH
NH2 NH2
NH
NH
NH
O
NH
NH
NH O O NH
SO3H
SO3H
SO3H
SO3H
SO3H
SO3H
O
O
CH3CH3
N
N
N
NH
NH2
NH2
AsS
S
OH
NH2
OH
O
F
F NH2
N S
CH3
O
ONOO2N C
H
Suramin
Pentamidine Eflornithine
Melarsoprol Nifurtimox
OO
NH
NH2 NH2
NH
NH
NH
O
NH
NH
NH O O NH
SO3H
SO3H
SO3H
SO3H
SO3H
SO3H
O
O
CH3CH3
N
N
N
NH
NH2
NH2
AsS
S
OH
NH2
OH
O
F
F NH2
N S
CH3
O
ONOO2N C
H
Suramin
Pentamidine Eflornithine
Melarsoprol Nifurtimox Figure 1.4 – Chemical structure of the drugs used f or human African trypanosomiasis treatment. Nifurtimox, a drug licensed for Chagas’ disease, ha s recently been included in the Essential List of Medicines for HAT chemotherapy in associati on with eflornithine.
It can also be used as second drug of choice for Gambian first stage trypanosomiasis.
Suramin is administered intravenously (typically, five injections every 3-7 days over a four
weeks period) and can have severe adverse reactions like anaphylactic shock,
neurotoxicity, kidney damage and cutaneous reactions (Legros et al., 2002). As for
pentamidine, the trypanocidal mechanism of suramin is poorly understood (Barrett et al.,
2007). This compound is known to inhibit many enzymes and a multiple mode of action is
compatible with the absence of resistance cases observed in the field (Fairlamb, 2003),
although resistant lines are easily selected in the laboratory (Scott et al., 1996).
Melarsoprol and eflornithine are the two drugs used to treat late stage HAT. Melarsoprol
(Arsobal®, Mel B) was introduced in 1949 and is active on both forms of sleeping sickness.
Treatment protocols with melarsoprol traditionally consists of various intravenous
injections of the drug (3.6 mg/kg body weight, dissolved in propylene glycol) separated by
periods of 7-10 days (Cattand, 2001). Only hypotheses exist on the mode in which this
drug kills trypanosomes, the disruption of the parasite thiol-redox balance being one often
Federica Giordani, 2010 Chapter 1, 11
proposed (Fairlamb, 2003). Melarsoprol is an organo-arsenical compound extremely toxic
to humans and it is responsible for the death of up to 5% of patients to whom it is
administered, due to a post-treatment reactive encephalopathy. Furthermore, over the last
decade, an increasing number of clinical failures (up to 30% in some areas), particularly in
the treatment of T. b. gambiense, have been observed (Brun et al., 2001; Ollivier and
Legros, 2001). Apart from poor treatment regimens, these failures have been associated, at
least partially, to alterations or loss of the parasite’s P2 amino-purine transporter (Carter
and Fairlamb, 1993; Matovu et al., 2001a), which is involved in the uptake of melarsoprol
but also of diamidines like pentamidine and diminazene aceturate (a veterinary
trypanocide), leading to worries about possible cross-resistance onset (Barrett and
Fairlamb, 1999; de Koning 2008; Section 1.2.8). The alternative drug for treatment of
melarsoprol-refractory late sage T. b. gambiense is eflornithine (Ornidyl®, DFMO).
Introduced in 1990, this drug is not active on T. b. rhodesiense, is expensive (five times
more than melarsoprol) and requires a high dose treatment: 400 mg/kg daily subdivided
into four intravenous infusions for 7 or 14 days (Burri and Brun, 2003). Treatment failures
have been observed (Balasegaram et al., 2009), but it must be taken into consideration that
the compound has a cytostatic effect that requires an active immune system to clear
infection (Bitonti et al., 1986). Nevertheless, DFMO has a much lower toxicity than
melarsoprol: side effects include seizures, gastrointestinal problems and myelosuppression
(Priotto et al., 2006). Originally developed as a cancer treatment, the intracellular target of
eflornithine is well known: the drug acts as a suicide inhibitor of the enzyme ornithine
decarboxylase, disrupting the essential polyamine biosynthetic pathway of the parasite and
leading to several downstream effects (Barrett et al., 2007; Delespaux and de Koning,
2007).
Since DFMO registration, the first new drug candidate for HAT therapy has been an oral
diamidine designed for the early stage of the disease, DB289, but, despite its efficacy, the
compound’s development was recently stopped due to toxicity issues (Thuita et al., 2008).
Diamidines remain interesting drug leads against HAT and other compounds, more potent
than DB289 and including blood-brain barrier permeant derivatives, have already been
identified (Wenzler et al., 2009). Nitroimidazoles are another class of molecule active
against trypanosomiasis (Denise and Barrett, 2001); among them, fexinidazole, developed
by DNDi, is currently in Phase I trials (Torreele at al., 2009). Thanks to recent advances in
the knowledge of parasite biology new drug targets may be validated in the future (Croft et
al., 2005; Barrett et al., 2003 and 2007). Moreover, improved therapeutic protocols and
combinations of existing drugs are under evaluation for the advantages they can offer (in

Federica Giordani, 2010 Chapter 1, 12
particular the limitation of side effects and delay of drug resistance development, but also
the reduction of costs and treatment duration). A new, shorter 10-day protocol with
melarsoprol (2.2 mg/kg daily intravenously) has already been introduced with success for
Gambian trypanosomiasis: it does not eliminate toxicity, but it reduces hospitalisation
period and costs (Schmid et al., 2005). Combination therapies of nifurtimox with either
melarsoprol or DFMO have been tested for treatment of HAT second stage: the association
of nifurtimox with eflornithine, in particular, has given encouraging results during early
clinical trials (Bisser et al., 2007; Priotto et al., 2006 and 2009) and, recently, this drug
combination has been included in the Essential List of Medicines for HAT treatment by
WHO (http://www.who.int/neglected_diseases/en/).
1.2 Diagnosis of T. b. gambiense infection
Accurate diagnosis and staging of sleeping sickness infection is of the utmost importance
for disease management and control (Louis et al., 2001). Early detection of the disease
allows not only to treat the patients with the cheaper, less toxic drugs for the first stage of
the disease, but also to reduce the human reservoir of the parasite in the case of T. b.
gambiense infection (Fèvre et al., 2006). Unfortunately, diagnosis of HAT still represents a
major problem, due to insensitivity and laboriousness of the techniques available especially
in remote locations with limited facilities. Passive case-finding (self-reporting patients) is
extremely inefficient, as infected individuals can manifest symptoms only after many
months, and usually refer to local health centres when already in the second stage
(Ekwanzala et al., 1996; Smith et al., 1998; Abel et al., 2004; Odiit et al., 2004).
Therefore, more effective active case-finding programs have been established to screen the
whole population at risk through the work of specialised mobile teams (Ruiz et al., 2002;
Robays et al., 2004; Simarro et al., 2006). HAT is diagnosed using a combination of tests.
Every endemic country has adopted a specific algorithm for detection of infected subjects,
but all strategies comprise a sequence of screening and confirmation steps (Figure 1.5).
Suspected HAT cases are identified using indirect diagnostic tools (clinical features,
serological tests and, to a lesser extent, molecular tests) and must always be confirmed by
direct microscopy. On infected individuals staging of the disease is carried out to decide on
the treatment protocol to use. Stage determination requires an invasive lumbar puncture
and is usually performed in local treatment centres. Direct and indirect diagnostic
procedures must also be applied during follow-up periods to check for relapses, but also to
monitor seropositive individuals not confirmed by parasitological techniques (Chappuis et
al., 2005).

Federica Giordani, 2010 Chapter 1, 13
Figure 1.5 – General flow chart for T. b. gambiense diagnosis. Every endemic country utilises a specific algorithm that can slightly differentiate from the one illustrated here. Threshold values indicated fo r second stage determination are those recommended by the World Health Organisation (WHO, 1998). The diagnostic techniques indicated in the figure are described in Section 1. 2. CATT-wb: card agglutination test for trypanosomiasi s on whole blood; FBE: fresh blood examination; TBF: thick blood film; mAECT: miniatur e anion-exchange centrifugation technique; mHTC: microhaematocrit centrifugation te chnique; QBC: quantitative buffy coat; CSF: cerebrospinal fluid; WBC: white blood cells; P rot: protein; +: positive test result; -: negative test result.
None of the various assays available today for HAT diagnosis is ideal: practicality, costs
and low efficiency are the main drawbacks. A test’s diagnostic accuracy is usually
quantified by means of its sensitivity and specificity, which are respectively defined as the
proportion of true positives (true positives/true positives+false negatives) and of true
negatives (true negatives/true negatives+false positives) that are correctly identified by the
assay (Altman and Bland, 1994a; Akobeng, 2007). More useful to clinicians to decide
about the probability of disease in patients are the positive and negative predictive values,
which represent the proportion of people with a positive test result who actually have the
disease (true positives/true positives+false positives), and the proportion of people with a
negative test result who do not have the disease (true negatives/true negatives+false
negatives), respectively (Altman and Bland 1994b; Banoo et al., 2007). Predictive values
are dependent on the population and change if the prevalence of the disease changes, while
specificity and sensitivity remain unvarying. Since sensitivity and specificity are usually
Federica Giordani, 2010 Chapter 1, 14
inversely related, the choice of an assay with a certain precision depends on the case under
study: in situations where it is important to detect the highest number of affected patients
(like mass screening programs), a highly sensitive test is preferable, while for case
confirmation tests a high specificity is needed to avoid the risk of false positives (Empson,
2001; Nendaz and Perrier, 2004).
1.2.1 Clinical features
HAT is difficult to diagnose at an early stage, when symptoms are largely variable and
aspecific and the disease can be easily confused with other common tropical infections,
especially malaria (Louis et al., 2001). Fever, general malaise, headache, facial oedema,
anaemia, cutaneous lesions are all manifest during the haemolymphatic stage (Kennedy,
2006a). The only specific features are a local inflammation at the site of the tsetse bite,
called the chancre, and an enlarged posterior cervical lymphadenopathy (Winterbottom’s
sign). The chancre generally occurs 5-15 days after the inoculation of the parasite, but it is
seldom observed in Africans (Büscher and Lejon, 2004). Palpation of enlarged neck glands
and microscopic examination of the aspirate in positive cases is generally used for HAT
diagnosis (Lutumba et al., 2005; Section 1.2.3.2). The diffuse inability of the local primary
healthcare facilities to promptly identify the disease results in considerable delays in
diagnosis and treatment, with consequent increase of risk of unfavourable prognosis and of
human suffering (Bukachi et al., 2009). HAT becomes more easily recognizable as the
disease progresses. Later clinical features reflect the involvement of specific organs:
gastro-intestinal problems, cardiovascular disturbances, endocrine dysfunction and,
sometimes, eye involvement can occur (Kennedy, 2006a; Blum et al., 2008). When the
infection reaches the meningoencephalitic stage, signs of nervous system disruption
become evident and extensive in Gambian trypanosomiasis. Sleep-pattern disturbances,
with dysregulation of the circadian rhythm, represent the most typical feature at this stage
and lend HAT its common name “sleeping sickness”. Other neurological changes include
painful peripheral sensory disturbances, tone and mobility disorders, mental changes and
psychiatric disorders. If untreated, patients stop eating, lapse into a semi-coma and finally
die (Kennedy, 2006a and 2006b).
1.2.2 Serological tests
Application of serological assays to obtain indirect indication of infection (by antibody
detection) is a widely used approach to rapidly screen the population at risk in endemic

Federica Giordani, 2010 Chapter 1, 15
areas but, as for clinical features, these tests are just indicative of the presence of
trypanosomes. Since immunological tests lack sensitivity and specificity, subsequent
parasitological confirmation has to be performed on the positive cases identified for final
diagnosis (Chappuis et al., 2005). In the field, however, mobile teams often face complex
situations where patients with a positive serology are not confirmed by microscopy (a
phenomenon called seropositivity) and the question of whether to provide treatment to
these subjects is disputed (Koffi et al., 2006). The main cause of seropositivity is probably
the low sensitivity of parasitological methods that gives rise to false negatives (Section
1.2.3), but this phenomenon can also be explained by false serological positives generated
by cross-reactivity with animal trypanosomes or other co-infecting parasites. Moreover, an
efficient immune system response could allow some subjects to control the virulence of the
infection and keep it under detection limits of current diagnostics (Garcia et al., 2000 and
2006). The serological tests available are very useful, but they are not ideal, because of
their use of not defined recombinant proteins against variable antigens. Therefore, new
protein markers for HAT serodiagnosis are under study (Hutchinson et al., 2004).
1.2.2.1 CATT/T. b. gambiense
Since its introduction in 1978, the card agglutination test for trypanosomiasis (CATT/T. b.
gambiense) has been the most widely used technique for mass population screening in the
field (Chappuis et al., 2005). The test is a cheap, fast and simple agglutination assay able to
detect specific antibodies to the T. b. gambiense variable antigen type (VAT) LiTat 1.3,
common in the serum of patients infected with this subspecies. Recently, a thermostable
format of the test has been developed (Hasker et al., 2010). To perform the assay, a drop of
reagent, consisting of lyophilised, blue-stained bloodstream trypanosomes expressing the
LiTat 1.3 antigen and resuspended in PBS, is mixed with a drop of fresh, heparinized,
capillary blood on a white plastic card, which is then shaken for 5 minutes on a 12/220 V
card rotator. The result is immediately read by the naked eye: in subjects previously
exposed to T. b. gambiense the trypanosomes agglutinate and form a blue clot. The test
sensitivity on undiluted whole blood (CATT-wb) varies from 87 to 98%, while specificity
can reach 90-95% (Penchenier et al., 2003; Chappuis et al., 2005). Serial dilutions of
blood, plasma or serum before applying the test improve its specificity. The use of end-
dilution titers have been suggested as a useful tool for therapeutical decision making for
CATT-wb positive patients (Simarro et al., 1999; Chappuis et al., 2004), although this
approach can be risky because of the poor positive predictive value of the test where
disease prevalence is low (Inojosa et al., 2006). Moreover, a study on cost-effectiveness of

Federica Giordani, 2010 Chapter 1, 16
different confirmation algorithms showed that the use of parasitologic confirmatory tests
by concentration methods without CATT titration had a better efficiency (Lutumba et al.,
2007). The CATT loses its efficacy on samples from patients infected with strains of
trypanosomes that lack, or do not express, the LiTat 1.3 antigen, resulting in false
negatives, but the distribution of these strains seems limited (Dukes et al., 1992). Similarly,
false positives can occur in patients infected with other trypanosome species or parasitic
diseases, which cross-react with non-variant epitopes on the surface of trypanosomes
present in the reagent (Jamonneau et al., 2000; Inojosa et al., 2006). Furthermore, the
agglutination can be inhibited by complement factors, a phenomenon called prozone, when
the test is performed on undiluted, heparinized blood or serum with low dilutions (<1:4). In
these cases, addition of EDTA to the dilution buffer eliminates the problem by increasing
the sensitivity with only a minor loss of specificity (Pansaerts et al., 1998; Magus et al.,
2002). Other disadvantages of CATT are that it does not work on T. b. rhodesiense and it
does not differentiate between past and current infections: this is the reason why this test
can not be used to assess treatment efficacy during follow-up (Section 1.2.7), since
circulating antibodies can persist for several years after cure (Paquet et al., 1992).
Variations on the same theme of the CATT have been proposed as, for example, the micro-
CATT (micro-card agglutination test for trypanosomiasis). This test allows the collection
and storage (at 4 ºC) of dried blood samples on a filter paper (Miézan et al., 1991). The
micro-CATT showed the same specificity of the CATT-wb but a lower sensitivity in the
field (Truc et al., 2002). Furthermore, although it requires smaller volumes of reagents, it
is a more expensive method than the CATT-wb because more consumables are needed to
perform the assay.
1.2.2.2 LATEX/T. b. gambiense
The LATEX/T. b. gambiense is an agglutination card test developed as a field alternative
to the CATT-wb. The reagent is based on the combination of three purified variable
surface antigens (LiTat 1.3, 1.5 and 1.6) absorbed on latex particles, in order to avoid non-
specific cross reactions frequent in complex antigen preparations (Büscher et al., 1991).
The test follows a procedure similar to the CATT, but as it is usually performed on diluted
blood (≥1:4) it is more laborious to perform (Jamonneau et al., 2000). The LATEX/T. b.
gambiense showed a higher specificity (up to 99%) but a lower, or similar, sensitivity
(form 84 to 100%) when compared to the CATT assay (Truc et al., 2002; Penchenier et al.,
2003).

Federica Giordani, 2010 Chapter 1, 17
1.2.2.3 Immunofluorescent antibody test (IFAT) and enzyme-linked
immunosorbent assay (ELISA)
The enzyme-linked immunosorbent assay (ELISA) and the indirect immunofluorescent
antibody test (IFAT) can detect specific host antibodies (IgM, IgG), related to the presence
of parasites in blood, plasma, serum or cerebrospinal fluid, after 3-4 weeks of infection.
Tests use purified trypanosomal glycoproteins or lysates of whole trypanosomes of
selected antigen types (Büscher and Lejon, 2004). The immunofluorescent antibody test
has been used with success for HAT control in different countries (Noireau et al., 1988;
Simarro et al., 2006) due to its high sensitivity and specificity (evaluated as superior to the
CATT test). The ELISA methods can be performed with serum, filter paper eluates or
cerebrospinal fluid (Lejon et al., 1998), but they were also shown to be able to detect
specific antibodies against T. b. gambiense VSGs in the saliva, with sensitivity and
specificity above 90%, thus opening new perspectives for the development of a new, non-
invasive serological test (Lejon et al., 2006). The ELISA assay can also be used for
detection of parasite antigens in patients’ sera (Liu et al., 1989). This approach has the
advantage of demonstrating that the parasite is still, or has recently been, present in the
host and does not rely on his immune response. Various antigen candidates are currently
under evaluation, although their low concentration in circulation could represent a major
limitation for the development of a test for African trypanosomiasis (Radwanska, 2010).
Moreover, studies on animal infections raised doubts about the sensitivity and specificity
of this approach (Rebeski et al., 1999). Due to the need of expensive and sophisticated
equipment and trained personnel, the use of IFAT and ELISA is restricted to specialised
laboratories (Chappuis et al., 2005).
1.2.3 Parasitological methods
Direct detection of parasites in human fluids (lymph node aspirate, blood or cerebrospinal
fluid) through light microscopy has always represented the “gold standard” of HAT
diagnosis (Büscher and Lejon, 2004; Chappuis et al., 2005). Due to risks related to
available drugs, confirmation of infection by parasitological techniques for clinically or
serologically diagnosed suspects should always be done before starting treatment (Louis et
al., 2001). Microscopy has virtually 100% specificity, but suffers from a very low
sensitivity, that significantly affects the overall efficacy of African trypanosomiasis
diagnosis in the field, failing to confirm 20-30% of infections (Robays et al., 2004;
Lutumba et al., 2005). The main cause of this limited sensitivity is represented by the low

Federica Giordani, 2010 Chapter 1, 18
and fluctuating parasitaemia typical of T. b. gambiense infection: parasites seldom exceed
10,000 trypanosomes/ml (a number easily detectable) but can be present at numbers lower
than 100 trypanosomes/ml (below the detection limit of the most sensitive parasitological
methods in use) (Chappuis et al., 2005). To decrease the number of false negatives, it is
possible to examine various samples over consecutive days, or to follow-up seropositives
at regular intervals, but these strategies are difficult to apply in rural settings. Processing
samples with concentration techniques before viewing improves the sensitivity and
increases the cost-effectiveness of confirmation algorithms (Lutumba et al., 2007), but it
also makes parasitological methods more laborious and expensive, limiting their routine
use (Lutumba et al., 2006). Despite all of these drawbacks, light microscopy is widely used
in the field because of its simplicity, its immediate results and the lack of a valid
alternative.
1.2.3.1 Chancre aspirate
Trypanosomes can be detected in the chancre several days earlier than in the blood
(Chappuis et al., 2005), especially in the Rhodesian form (Louis et al., 2001), but a blood
smear is more sensitive. The chancre aspirate can be viewed directly under the microscope
or after fixation and Giemsa-staining. This procedure is seldom used in the field because
most infections are detected when the chancre has already disappeared (Büscher and
Lejon, 2004).
1.2.3.2 Lymph node aspirate
Due to its simplicity, cervical lymph node palpation is systematically done (often in
association with CATT) for population screening in many endemic countries. Even if this
test is considered less cost-effective than the agglutination assay (Lutumba et al., 2005), in
some areas it appears to be the best method for early diagnosis of human African
trypanosomiasis (Vanhecke et al., 2010). When enlarged lymph nodes (Winterbottom’s
sign) are identified, they are punctured and the fresh aspirate is spread on a slide and
covered with a coverslip. The wet preparation is then quickly examined (to avoid lysis of
parasites in the sample) by light microscopy at ×400 total magnification for the presence of
motile trypanosomes. The sensitivity of this method varies between 40 and 80%,
depending on the parasite strain, the stage of the disease (sensitivity is higher during the
first stage) and the prevalence of other infections causing lymphadenopathy (Louis et al.,
2001; Büscher and Lejon, 2004).

Federica Giordani, 2010 Chapter 1, 19
1.2.3.3 Thin and thick blood films
To prepare wet blood films, 5 or 10 µl of finger-prick blood are placed on a slide and
examined microscopically under a coverslip at ×400 total magnification (Louis et al.,
2001). Trypanosomes are revealed by their moving between the erythrocytes. In spite of its
very low sensitivity, with a detection limit as high as 10,000 trypanosomes/ml (1
parasite/200 microscope fields) this method is still used in some centres (especially for T.
b. rhodesiense) because it is very simple, cheap and offers immediate results (Büscher and
Lejon, 2004). Fixed thin blood films stained with Giemsa or Field’s solutions have a
similar low sensitivity (Chappuis et al., 2005). The preparation of a thick blood film is,
therefore, preferred since it slightly improves the sensitivity to 5,000 trypanosomes/ml
(Louis et al., 2001). To prepare a thick blood film, 20 µl of finger-prick blood is placed on
a small area of the microscope slide and defibrinated by the use of the corner of another
slide. The sample is then left to dry without being fixed, protected from direct sunlight,
stained with Giemsa or Field’s solution and finally observed under the microscope at
×1,000 total magnification (Büscher and Lejon, 2004). This technique is the most widely
used in the absence of a centrifuge, even if examination of each slide can take 10 to 20
minutes and must be carried out by an expert microscopist, since parasites are often
deformed during sample preparation and are easily missed (Chappuis et al., 2005).
1.2.3.4 Microhaematocrit centrifugation technique ( mHCT)
The blood concentration technique of microhaematocrit centrifugation (mHCT), also called
the capillary tube centrifugation technique (CTC) or Woo test (Woo, 1970), is generally
used during mass surveys to test CATT-positive suspects in whom the diagnosis could not
be confirmed by classical methods (Chappuis et al., 2005). The mHCT is relatively easy to
perform: it consists in filling three-quarters full heparinized capillary tubes with 50-60 µl
of finger-prick blood. After being sealed at their end, the tubes are centrifuged at high
speed for 6-8 minutes in a haematocrit centrifuge, in order to concentrate the trypanosomes
present in the blood at the level of the buffy coat. The capillary tubes are then mounted on
a special holder and can then be directly viewed at low magnification (×100 or ×200 total
magnification) for mobile parasites (Louis et al., 2001; Chappuis et al., 2005). By
examining more than one capillary tube (usually 6 or 8), the sensitivity of mHCT
increases, and fewer than 500 trypanosomes/ml can be detected (Büscher and Lejon,
2004). The mHCT is quite time-consuming and the presence of microfilariae in the blood
can hamper detection of smaller trypanosomes (Lutumba et al., 2006). The need of a

Federica Giordani, 2010 Chapter 1, 20
centrifuge represents the major drawback to the implementation of this technique in the
field (Jannin and Cattand, 2004).
1.2.3.5 Miniature anion-exchange centrifugation tec hnique (mAECT)
Since its adaptation for field diagnostic use in 1979 (Lumsden et al., 1979), the miniature
anion-exchange centrifugation technique (mAECT) has been continuously improved
(Kimber, 1984; Zillmann et al., 1996; Truc et al., 1998b; Büscher et al., 2009). This
method purifies trypanosomes from blood using anion-exchange chromatographical
columns containing diethylaminoethyl-cellulose (DEAE-52) and then it concentrates them
by centrifugation before viewing (Lumsden et al., 1979). The chromatographical
separation depends on difference in surface charges of the blood cells and the parasites,
which are less negatively charged because their glycoprotein coat keeps the negative
phospholipid head groups away from the matrix. When infected blood is mixed with PSG
(phosphate saline glucose) buffer at pH 8 and is added to the column, the red and white
blood cells adhere to the DEAE gel particles, while trypanosomes, being at their isoelectric
point, flow through and are collected at the bottom of a sealed glass tube. After low speed
centrifugation, the tip of the tube is mounted on a special holder and examined for the
presence of trypanosomes using light microscopy at low magnification. Since a large blood
volume (300-350 µl) is used, high sensitivity is achieved (the detection limit is less than
100 trypanosomes/ml) (Louis et al., 2001). The efficiency of the technique could be further
improved by processing on the column the buffy coat obtained from a larger volume of
blood (5 ml) (Camara et al., 2010). However, the mAECT also has some drawbacks: the
manipulations are quite time-consuming, materials are expensive and an energy source is
needed (Chappuis et al., 2005). Initial evaluation in experimentally infected animal blood
showed that this technique was more sensitive than the mHCT (Sachs, 1984). Both the
mAECT and the mHCT need 30 minutes for results, but the microscopy phase for the
mAECT is faster (1 minute, compared to 5 minutes for the mHTC) (Lumsden et al., 1979).
The mAECT is currently considered the most sensitive parasitological technique for
detection of trypanosomes in blood, with sensitivity in the field in the range of 75.3-84.5%
(Miézan et al., 1994; Lutumba et al., 2006).
1.2.3.6 Quantitative buffy coat (QBC)
The quantitative buffy coat (QBC, Becton-Dickinson) is a very sensitive technique initially
developed for rapid cell count and applied to malaria diagnosis. It is a modification of the

Federica Giordani, 2010 Chapter 1, 21
mHCT method that associates concentration of the parasites by centrifugation with their
fluorescence staining using acridine orange (Bailey and Smith, 1992; Chappuis et al.,
2005). For sample preparation, 60 µl of finger-prick blood are loaded into capillary tubes
containing EDTA, acridine orange and a small floating cylinder and are centrifuged at high
speed for 5 minutes. Fluorescent DNA of motile trypanosomes can be visualised in a
darkroom in the expanded buffy coat by using a UV light connected to a special objective
(60×) containing the appropriate filter. The need of this fragile equipment prevents the use
of this test by mobile teams, limiting its application to referral centres (Chappuis et al.,
2005). The QBC is a very sensitive technique, with a detection limit estimated lower than
500 trypanosomes/ml (Louis et al., 2001). Compared to the mAECT, the QBC was found
to have a slightly lower sensitivity both on finger-prick and venepuncture samples, but due
to its simplicity and rapidity (only 15 minutes instead of the 30-45 minutes needed for
mAECT result) its use was recommended for routine screening (Truc et al., 1998a).
Nevertheless, the costs of this technique can represent a major obstacle for its
implementation in low-income countries.
1.2.3.7 In vivo and in vitro isolation of trypanosome strains
Trypanosome strains have always been isolated for research purposes from patients
through inoculation of infected blood or cerebrospinal fluid into susceptible laboratory
animals. Immunosuppressed African Mastomys natalensis rats are considered the best
recipient for primary propagation of T. b. gambiense, with a success rate of 50% (Büscher
et al., 2005; Maina et al., 2007b), but Grammomys surdaster thicket rats were shown to
lead to even higher percentages of success (Büscher et al., 2005). The process of isolation
and propagation in rodents is problematic, especially for the low virulent Gambian strains,
and requires long incubation times (Brun et al., 2001). A simpler kit for in vitro isolation
(KIVI) of trypanosome strains under field conditions proved effective both for human and
animal samples (Truc et al., 1992). The procedure of the kit consists of inoculating,
aseptically, several millilitres of blood in culture medium, where bloodstream parasites
transform into procyclics and multiply at room temperature during the successive weeks
(Büscher and Lejon, 2004). The KIVI kit can have a diagnostic value in detecting
infections when other parasitological techniques fail, but it is seldom applied due to delays
to obtain the results (Louis et al., 2001). The long adaptation periods needed to propagate
isolates can have as a consequence the selection of clones or the modification of the
original isolate and, for this reasons, the number of passages must be kept at a minimum
(Brun et al., 2001). Recently, T. b. gambiense parasites were successfully amplified from

Federica Giordani, 2010 Chapter 1, 22
cerebrospinal fluid of HAT patients by in vitro culture on a fibroblast feeder layer (Giroud
et al., 2009), a new promising technique which was found more efficient than inoculation
in BALB/c mice.
1.2.4 DNA technologies
The applications of DNA techniques in diagnostics are quickly expanding. This is due to
the many advantages these technologies offer, first of all their high sensitivity and
specificity, superior to those of traditional parasitological tools. Moreover, they allow
differentiating between trypanosomes of veterinary importance and, especially, between
the two human pathogenic subspecies T. b. rhodesiense and T. b. gambiense, otherwise
morphologically indistinguishable. This will become a crucial aspect of disease control in
the case of overlap of the two human forms (Picozzi et al., 2005). The continuous
simplification of molecular diagnostic procedures makes their use in the field, even in
relatively simply equipped laboratories, a real option (Mugasa et al., 2009).
1.2.4.1 PCR
The polymerase chain reaction (PCR), together with other molecular biology techniques,
has been widely used for research purposes to identify infecting trypanosome DNA in
animal and human blood (Gibson, 2001 and 2002a; Becker et al., 2004; Brun and Balmer,
2006). Different molecular probes have been tested for detection and identification of
single trypanosome isolates from patients (Jamonneau et al., 2001). Among them, the
classical TBR 1-2 primers, which recognise a repeated satellite sequence of the subgenus
Trypanozoon, showed high sensitivity in human blood samples (up to 100%) with a
specificity higher than 92% (Penchenier et al., 2000; Solano et al., 2002), but these primers
can not differentiate between the three Trypanosoma brucei subspecies. Other markers are
available for detection of T. b. gambiense infection, such as the genes encoding for the
variant surface glycoproteins LiTat 1.3 and AnTat 11.17 (Bromidge et al., 1993), but these
antigens are not homogeneously expressed in all isolates (Dukes et al., 1992). A specific
target for the Gambian form has been identified in the receptor-like flagellar pocket
glycoprotein TgsGP (Berberof et al., 2001), which has been shown to detect down to 10
trypanosomes/ml of human blood (Radwanska et al., 2002b). For T. b. rhodesiense, a PCR
based on the use of primers targeting the human serum resistance associated gene (SRA),
which confers resistance to lysis by human serum and is ubiquitous in this species (Gibson
et al., 2002b), has been successfully applied as a molecular marker (Radwanska et al.,

Federica Giordani, 2010 Chapter 1, 23
2002a; Njiru et al., 2004). Regardless of the primers utilised, PCR is generally more
sensitive than other serological and parasitological diagnostic methods currently in use,
showing detection limits of 0.1 trypanosome/ml of cattle blood and 1 to 40
trypanosomes/ml of human blood (Jamonneau et al., 2004). Experimental work on animals
has demonstrated that its application allows detection of active infection or relapse at a
very early stage (Clausen et al., 1998; Bengaly et al., 2001). Moreover, as PCR can be
performed on samples from both blood and cerebrospinal fluid, this approach offers a
possible tool not only for diagnosis but also staging of HAT (Truc et al., 1999; Jamonneau
et al., 2001; Section 1.2.5). Unfortunately, despite the high potential as a confirmatory
assay for infection, the use of this technique is restricted to research laboratories and it is
not commonly used for HAT diagnosis because of the need of expensive thermocyclers
and of complex DNA purification protocols. Furthermore, PCR can be relatively slow and
suffers a significant risk of sample contamination (Mugasa et al., 2008). Finally, this
technique has not been fully validated yet: it has problems of reproducibility and can
provide results at odds with those of both serological and parasitological tests (Koffi et al.,
2006).
1.2.4.2 Loop-mediated isothermal amplification (LA MP)
Efforts have been made in order to simplify PCR protocols and make this technique more
suitable for field requirements. One of the most promising innovations is a new isothermal
PCR-like method, called loop-mediated isothermal amplification (LAMP) (Notomi et al.,
2000). This technique, already commercialised for various infectious diseases, allows
accurate and robust amplification of the target sequence in a single heating step (60-65°C),
which can be performed in a water bath, and the results can be visualised by a simple
colorimetric reaction (Njiru et al., 2008a and 2008b; Mori and Notomi, 2009). When
applied to Trypanozoon isolates using primers targeting the repetitive insertion mobile
element (RIME), this methodology showed a very high sensitivity (as low as 0.001
trypanosomes/ml) and reproducibility (Njiru et al., 2008b). Other probes have been
designed for detection of specific trypanosome species including T. b. gambiense
(Thekisoe et al., 2007) and T. b. rhodesiense (Njiru et al., 2008a). Moreover, the test is fast
(results are available in 35 minutes) and less prone to inhibitory factors than classical PCR,
a characteristic that enables the use of unprocessed template, whether buffy coat, heat-
treated blood or serum (Njiru et al., 2008a and 2008b), although there is some evidence of
a loss of sensitivity on crude samples (Thekisoe et al., 2009).

Federica Giordani, 2010 Chapter 1, 24
1.2.4.3 Molecular dipstick test (HAT-PCR-OC)
The molecular dipstick test is a simple detection tool for PCR products based on
oligochromatography (OC). In positive samples, amplicons hybridize with a specific gold-
conjugated probe and migrate on a chromatographical membrane where they result in a
visible line in only 5 minutes. The test developed for T. brucei (HAT-PCR-OC) had 100%
specificity and sensitivity on blood samples and was able to detect a single parasite in only
180 µl of blood (Deborggraeve et al., 2006).
1.2.4.4 Nucleic acid sequence-based amplification ( NASBA) and NASBA-OC
The nucleic acid sequence-based amplification assay (NASBA) consists in a self-sustained
real-time PCR based on the amplification of RNA targets under isothermal conditions
(41°C) (Deiman et al., 2002). The detection of the unstable mRNA has two advantages: it
is indicative of active transcription and it avoids possible DNA contamination (Büscher
and Lejon, 2004). By amplification of the 18S ribosomal RNA, this assay was able to
detect specifically Trypanosoma brucei species (without distinction between T. b.
gambiense and T. b. rhodesiense) with a sensitivity of 70% on clinical samples and a
detection limit of 10 trypanosomes/ml (Mugasa et al., 2008). The association of NASBA
with oligochromatography (OC) for amplicon detection makes this assay even easier and
cheaper. During a study conducted by Mugasa and collaborators, the NASBA-OC showed
higher sensitivity than standard microscopy both on blood (73%) and cerebrospinal fluid
(88.2%) (Mugasa et al., 2009). Results were available in only 90 minutes (compared to the
two or more hours needed for PCR or NASBA alone) and were highly reproducible.
1.2.4.5 Fluorescence in situ hybridisation test (PNA FISH)
The peptide nucleic acid fluorescence in situ hybridization (PNA FISH) is a new technique
designed to facilitate detection of trypanosomes in blood smears by the use of fluorescent
molecular probes that hybridise to parasitic RNA sequences. The use of fluorescein-
labelled peptide nucleic acid (PNA) probes, targeting the 18S rRNA of the subgenus
Trypanozoon, showed a detection limit of 500 trypanosomes/ml of blood (Radwanska et
al., 2002c), but 90 minutes were necessary for hybridisation.

Federica Giordani, 2010 Chapter 1, 25
1.2.5 Stage determination
When a HAT case is confirmed, the stage of the disease must be determined in order to
guide treatment (Bisser et al., 2002; Kennedy, 2006a; Rodgers, 2009). Since specific
neurological symptoms occur late and no blood test indicating brain involvement is
available, this can only be done by analysis of a cerebrospinal fluid (CSF) sample obtained
from the patient by invasive lumbar puncture (Enanga et al., 2002; Kennedy, 2008). Direct
evidence of central nervous system (CNS) invasion is represented by the finding of
trypanosomes in the CSF, but since this approach can be very insensitive, WHO also
recommends the use of other indirect parameters related to the host’s neuroinflammatory
immune response: white blood cell count and protein concentration (WHO, 1998).
Positivity of one of these two tests defines the second stage even in absence of parasite
detection or clinical symptoms (Bisser et al., 2002). Nevertheless, cut-off values for these
assays are disputed and the exact definition of second stage is not definitive (Kennedy,
2006a and 2006b). Improved diagnostics for disease staging is urgently needed and
evaluation of alternative CSF parameters for indirect stage determination is currently under
investigation (Lejon and Büscher, 2005).
1.2.5.1 Trypanosome detection in CSF
Detection of trypanosomes in the CSF is sufficient to classify a subject in the meningo-
encephalitic stage of the illness (Lejon and Büscher, 2005). The CSF has to be examined
immediately after lumbar puncture, because trypanosomes in this medium seem to be very
fragile and they start to lyse within 10 minutes (Büscher and Lejon, 2004). This technique
is simple and cheap, but it suffers from insufficient sensitivity since it can detect parasites
only when their concentration is >1,000 trypanosomes/ml (Lejon and Büscher, 2002). The
sensitivity can be increased by single or, especially, by double centrifugation (DC) of the
CSF sample. The first technique consists of viewing the sediment obtained from
centrifugation of several millilitres of CSF spread on a glass slide, while in the second
method this sediment is further centrifuged in a flame-sealed capillary tube which is, then,
directly examined by microscopy (Cattand et al., 1988). Due to the number of
manipulations and the equipment required, these techniques are not widely applied
(Chappuis et al., 2005). A simplification of the DC test was developed by Miézan and
colleagues, who showed that the direct examination of the CSF sediment at the bottom of a
sealed Pasteur pipette obtained after a single centrifugation had the same sensitivity as the
DC technique but it was faster (10 minutes) (Miézan et al., 2000). The introduction of a
Federica Giordani, 2010 Chapter 1, 26
new plastic collector tube, originally developed for the mAECT, could further ameliorate
this technique, increasing the sensitivity to <2 trypanosomes/ml of CSF (Büscher et al., 2009).
1.2.5.2 White blood cell count in CSF
Despite its lack of specificity, the white blood cell count is the most widely used (and often
unique) technique for stage determination and follow-up (Lejon and Büscher, 2001 and
2005). The WHO upper limit for normal white cell concentration is set at 5 cells/µl, but it
has been proposed to raise this value to 10 cells/µl (Chappuis et al., 2005) or 20 cells/µl
(Lejon et al., 2003b), since patients found with 6 to 20 cells/µl in their CSF were
successfully cured by pentamidine (Doua et al., 1996). These subjects, considered to be in
the so-called “early second stage” or “intermediate stage” of the illness, often present non-
concordant markers that complicate staging (Bisser et al., 2002). Once the CSF is collected
(at least 5 ml), the leukocyte count must be carried out quickly to prevent cell lysis
(Chappuis et al., 2005). In African trypanosomiasis, the CSF can present with a special
type of enlarged B-cell, known as morular cells of Mott, containing cytoplasmic vacuoles
filled with IgM, which can be considered pathognomic, although they are not specific for
HAT (Lejon and Büscher, 2005). A recent work showed how the detection and
quantification of B lymphocytes may be useful to stage the disease (Bouteille et al., 2009).
1.2.5.3 Protein concentration in CSF
In CSF of late stage HAT patients protein concentration is elevated (0.4-2 mg/ml)
(Kennedy, 2006b), but it can also be raised during the first stage of the illness, due to the
diffusion of the abundant serum immunoglobulins in the CSF (Chappuis et al., 2005). Cut-
off values set by WHO for sleeping sickness vary according to the quantification method
used (WHO, 1998). Recent data suggest that the protein concentration threshold of 370
mg/litre for the colorimetric method is too low and should be raised (Lejon et al., 2003b).
This technique is seldom applied in African sleeping sickness control centres, because the
methods are sophisticated, reagents needed are unstable and the results do not offer much
more information than CSF cell count (Lejon and Büscher, 2001 and 2002).
1.2.5.4 Other markers and tests for second stage de termination
CSF of second stage T. b. gambiense patients contains high levels of immunoglobulins,
especially IgM, which are considered a strong early indicator of inflammation in the CNS

Federica Giordani, 2010 Chapter 1, 27
due to parasite invasion (Bisser et al., 2002), even if other neurological infections could
cause the same effect (Lejon et al., 2003b). Studies on quotients CSF/serum concentration
for IgM, IgG and IgA confirmed that the elevated concentration in the CSF was due to
intrathecal synthesis and only partially to blood-derived immunoglobulins and that the
predominant IgM presence was the most sensitive (95%) marker for brain involvement
(Lejon et al., 2003b). Determining the IgM content in the CSF can be very difficult to
carry out under field conditions but a semiquantitative latex agglutination test for IgM in
CSF (LATEX/IgM) has recently been designed for field use, thanks to its reagent stability
at 45ºC for more than 2 years (Lejon and Büscher, 2002). End titres (highest dilution
causing an agglutination) ≥1:8 were shown to be 89.4% sensitive and 92.7% specific for
presence of intrathecal IgM synthesis (Lejon et al., 2002b). The possibility to use the
LATEX/IgM agglutination test also for stage determination of T. b. rhodesiense infection
is under evaluation (Lejon et al., 2002b).
Other antibodies with different affinities are being evaluated as possible second stage
markers (Lejon and Büscher, 2001). Among them, autoantibodies against brain-specific
components such as neurofilaments and galactocerebrosides have been found in CSF of
HAT patients (Vincendeau and Bouteille, 2006). Simple test formats to detect these
antibodies not only in CSF, but also in other biological fluids like saliva, could represent a
great improvement towards a less invasive assay for staging (Jannin and Cattand, 2004).
Cytokines and chemokines mediate the host’s neuroinflammatory immune response and
high levels of these molecules in CSF have been associated to neurological involvement in
T. b. gambiense disease (Courtioux et al., 2006; Hainard et al., 2009). Interleukin-10, in
particular, has significantly raised concentrations in plasma (Courtin et al., 2006) and CSF
of infected patients and it could represent an interesting marker for treatment and follow-
up, since its levels lower immediately after treatment (Lejon et al., 2002a). A combination
of different markers (two chemokines, CXCL8 and CXCL10 and a brain damage marker,
H-FABP) was shown to correlate to HAT second stage with 97% sensitivity (Hainard et
al., 2009). However, the use of these indicators for staging suffers various drawbacks, such
as the not direct applicability in the field, the necessity of invasive lumbar puncture and the
need to exclude other brain inflammatory diseases.
Finally, the finding of trypanosome DNA in CSF by the use of PCR techniques could
represent another possible tool for staging of sleeping sickness (Truc et al., 1999).
Federica Giordani, 2010 Chapter 1, 28
1.2.5.5 Polysomnography
Polysomnography is a promising non-invasive diagnostic technique that could be used to
discriminate between the two stages of African trypanosomiasis (Buguet et al., 2005). It
combines different tools (electro-encephalogram, electro-oculogram and electro-myogram)
which allow the monitoring of sleep structure and phases, both known to be seriously
compromised in second stage HAT patients. The detection of abnormal sleep onset rapid
eye movement periods (SOREMPs) that occur shortly after CNS involvement, has been
proven to be proportional to illness severity and to recede after treatment, showing a
possible application also in follow-up studies.
1.2.6 Other diagnostic approaches
Novel diagnostic approaches based on the detection of specific biomarker patterns related
to the presence of the disease (“fingerprints”) are under study. A proteomic signature
analysis technique, for example, has been demonstrated to be much more accurate than any
other diagnostic test, being able to distinguish between trypanosome-infected and non-
infected serum samples with a sensitivity of 100% and a specificity of 98.6%
(Papadopoulos et al., 2004). The proteomic analysis is impracticable in the field but it
could represent a very sensitive tool for the identification of new biomarker proteins for
successive applications in diagnostics or drug discovery (Agranoff et al., 2005). Following
this principle, Hainard and collaborators evaluated various molecules identified by
proteomic analysis as possible indicators for HAT second stage (Hainard et al., 2009).
Similarly, the comparison of metabolite patterns could offer another approach for
discovering “fingerprints” to use for HAT diagnosis or staging. A study carried out by
Wang and collaborators demonstrated the utility of the analysis of the metabolome for
diagnostics, by showing a correlation between T. b. brucei infection in mice and systematic
perturbations in the metabolites profile of the animal’s urine and plasma (Wang et al., 2008).
1.2.7 Follow-up
Ideally, patients should be periodically checked (visits at 3, 6, 12, 18, 24 months) for a
total period of two years after treatment to confirm complete cure (WHO, 1998), but in
practice this is hardly achieved in the field, where compliance with follow-up is extremely
low (Legros et al., 1999). Unfortunately, unsuccesful treatment regimens are far from rare
and early detection of these failures would increase the chances of the patients to be cured.

Federica Giordani, 2010 Chapter 1, 29
Causes of drug relapses are still unclear. Many phenomena could be involved in this
process, such as low drug potency, under-dosing, pharmacokinetic differences between
individuals, presence of co-infections (especially HIV), poor health of the patient at the
moment of admission to the treatment centre or decreased susceptibility of trypanosomes
to the drug. To assess chemotherapy success both direct and indirect diagnostic techniques
are used, but standard operational criteria are still lacking. Since no blood markers for cure
have been identified so far and the CATT test resulted unreliable during follow-up
examinations (Lejon et al., 2010), treatment failure is usually identified as a deterioration
of the CSF parameters. This phenomenon normally occurs in 3-9% of late stage patients
treated with melarsoprol (Maina et al., 2007a). Detection of trypanosomes in blood, lymph
nodes or CSF indicates treatment failure or relapse, but due to low sensitivity of
parasitological techniques, increased leukocyte count and recurrence of neurological
symptoms are also often evaluated (Lejon and Büscher, 2001 and 2005; Mumba Ngoyi et
al., 2009). Patients hospitalised with severe brain inflammation or as previous relapsing
cases are at high risk of treatment failure (Legros et al., 1999; Lejon et al., 2008). A recent
work on T. b. gambiense patients identified the association between white cell count ≥ 8
cells/ml and LATEX/IgM end titre ≥ 1:4 as being 97 % and 100% specific for relapse
prediction after 12 and 18 month from treatment respectively (Lejon et al., 2008). The
identification of criteria for treatment outcome would have the great advantage of
shortening the follow-up period of patients with low risk of failure (Mumba Ngoyi et al.,
2010). Since normalisation of CSF values is generally slow, the use of the PCR technique
for earlier detection of relapses by mean of trypanosome DNA amplification is strongly
advocated (Truc et al., 1999).
1.2.8 Diagnosis of drug resistance
HAT treatment is complex for a number of reasons: need for hospitalisation, toxicity,
stage-specificity and high costs of the drugs are all major issues in endemic countries.
Moreover, the loss of efficacy of melarsoprol (the drug most used to treat the second stage
of the Gambian form and the only one available for late stage T. b. rhodesiense infection)
has become a pressing problem. In recent years the number of melarsoprol treatment
failures has increased to alarming levels in some areas, reaching values of 30% in Uganda
(Legros et al., 1999). Drug resistance of some trypanosome strains to melarsoprol has been
indicated as an important cause for these chemotherapic failures in individuals infected
with T. b. gambiense (Brun et al., 2001; Matovu et al., 2001a), but other factors may
contribute (Maina et al., 2007a), such as differences in drug pharmacokinetics between

Federica Giordani, 2010 Chapter 1, 30
individuals (Legros et al., 1999). A major problem for drug resistance study is the difficult
isolation and propagation of trypanosomes from relapsing patients, thus limiting the
number of samples available for successive in vitro and in vivo drug sensitivity tests in the
laboratory (Brun et al., 2001; Section 1.2.3.7).
Various mechanisms, affecting both drug levels inside the parasite and the drug target(s),
can contribute to reduced sensitivity to trypanocidal compounds (Barrett and Fairlamb,
1999; Mäser et al., 2003). Resistance to melaminophenyl arsenicals and diamidines has
been, at least partially, ascribed to altered activity of the T. brucei P2 amino-purine
transporter involved in their uptake (Carter and Fairlamb, 1993; Barrett and Fairlamb,
1999; Mäser et al., 1999; Delespaux and de Koning, 2007). The loss of P2 function was
found responsible for diminished internalisation of these classes of compounds and
multidrug resistance onset (Barrett and Fairlamb, 1999). Increased drug export through
over-expression of a T. brucei multidrug-resistance protein, called MRPA, has also been
found to cause melarsoprol-resistance in vitro, but data were not supported in vivo (Alibu
et al., 2006). Instead, mutations in the TbAT1 gene, which encodes for the P2 transporter,
have been identified in resistant trypanosomes both in laboratory strains and field isolates
(Mäser et al., 1999; Matovu et al., 2001a). The use of a PCR/SfaNI RFLP technique (PCR
amplification of the TbAT1 gene followed by analysis of the restriction fragment length
polymorphism for SfaNI) allowed identification of mutated forms of the transporter, but
this method was not able to identify all resistant strains, since many of them had a wild
type sequence of the TbAT1 gene (Mäser et al., 1999; Matovu et al., 2001b). Deletion of
the whole TbAT1 gene is also a rare, but possible, event in field isolates (Matovu et al.,
2001b). The treatment of patients infected with strains less sensitive to melarsoprol has
both the consequences of unnecessarily exposing them to the highly toxic side effects of
the arsenical compound and of contributing to the maintenance of the alleles associated
with resistance in the trypanosome population (Kazibwe, 2008). In a recent paper,
Kazibwe and colleagues showed how the withdrawal of melarsoprol as first-line drug in a
focus with high levels of treatment failures correlated with disappearance of mutant alleles
in the trypanosome isolates, identified with the PCR/SfaNI RFLP technique (Kazibwe et
al., 2009). This study demonstrates the potential benefits of drug resistance tests for
treatment decision making and rational management of HAT in resource-poor settings.
In our laboratory, a rapid and easy fluorescent test able to identify resistance to arsenical
and diamidine drugs, by exploiting altered activity of the P2 transporter in resistant strains,
was developed (Stewart et al., 2005). The test utilises the diamidine DB99 [2,5-bis(4-

Federica Giordani, 2010 Chapter 1, 31
amidinophenyl)-3,4-dimethylfuran], which is actively transported by trypanosomes
through the P2 permease and accumulates in DNA-containing organelles (nucleus and
kinetoplast). DB99 is intrinsically fluorescent and its internalisation inside parasites can be
monitored using a standard fluorescence microscope (λEX=330 nm, λEM=400 nm). The test
was proven able to discriminate between various sensitive (stained) and resistant
(unstained) strains in mice blood, both from in vitro culture and field isolates, if exposure
to the drug was kept inferior to 1 minute.
1.3 Diagnosis of T. b. rhodesiense infection
T. b. rhodesiense causes an acute, febrile form of HAT in east Africa and can lead to death
of the patient within months (Barrett et al., 2003). The parasite is harboured in a wide
animal reservoir (Smith et al., 1998; Stich et al., 2002), infected livestock representing a
major cause of maintenance and spread of the disease (Hutchinson et al., 2003; Picozzi et
al., 2005). Before the advent of molecular technologies, the immune trypanolysis test
(Rickman and Robson, 1970; Van Meirvenne et al., 1995) had been the only tool to
discriminate between human infective (mainly T. b. rhodesiense) and non-infective
trypanosome species isolated from animals and it was widely used for epidemiological
purposes.
For diagnosis of T. b. rhodesiense an effective serological tool, equivalent to the CATT, is
still lacking and is difficult to envisage due to the higher degree of VSG variability than in
T. b. gambiense (Louis et al., 2001). Case-detection for Rhodesiense trypanosomiasis is,
therefore, based on passive surveillance (Hutchinson et al., 2003) and initial diagnosis
relies on clinical symptoms (Garcia et al., 2006). For T. b. rhodesiense infection biological
parameters are generally more abnormal than for T. b. gambiense form, including severe
anaemia, liver dysfunction, thrombocytopenia and cardiac failure that often causes the
death of the patient (Lejon and Büscher, 2005). On the contrary, the neurological
symptoms typical of the Gambian disease are not frequent in Rhodesiense trypanosomiasis
and a clear distinction between first and second stage is more difficult to determine
(Kennedy, 2006a). Parasitological confirmation and staging are based on the same methods
used for T. b. gambiense disease but, since T. b. rhodesiense infection presents a high and
persistent parasitaemia, the detection of the parasites is relatively easy (Kennedy, 2008)
and direct examination of thin or thick blood smears or lymph node aspirate is usually
sufficient (Smith et al., 1998). More sophisticated assays like ELISA and PCR are
available, but not applicable in the field (Chappuis et al., 2005).
Federica Giordani, 2010 Chapter 1, 32
1.4 African animal trypanosomiasis
African animal trypanosomiasis (also called nagana) represents a major obstacle to
livestock production and, therefore, to the development of the rural areas of the continent,
with a loss estimated at more than $ 1,000 million annually (Kristjanson et al., 1999). The
disease is mainly caused by three tsetse-transmitted trypanosome species, Trypanosoma
congolense, Trypanosoma vivax and, at lesser extent, Trypanosoma brucei ssp., which
infect or co-infect both domestic and wild mammals. Animal trypanosomes are not
infective to humans because they are susceptible to lysis by the trypanolytic factor present
in human serum (Pays and Vanhollebeke, 2008). Once injected into the mammalian host,
T. congolense and T. vivax do not usually leave the blood vessels, even if they can cause
tissue lesions, while T. brucei can cause cerebral infection (Naessens, 2006). Typical
clinical features in cattle are fever, anaemia, and immunosuppression, with gradual loss of
weight and emaciation that usually leads to death of the animal through heart failure. Some
local bovine breeds are able to control anaemia and parasitaemia and remain productive
after having contracted trypanosomiasis: a phenomenon defined as trypano-tolerance
(Naessens, 2006).
Control of the disease relies on the use of insecticides applied to animals to protect them
from tsetse bites and on chemotherapy/chemoprophylaxis. Three compounds are used for
treatment of nagana, independently of the infecting species: diminazene aceturate (a
diamidine), homidium (the phenanthridine ethidium) and isometamidium (a hybrid
molecule from ethidium and diminazene). Isometamidium is also used as a prophylactic
agent (Leach and Roberts, 1981; Connor, 1992). All of these drugs have toxic effects on
animals and cross-resistance of isometamidium with homidium and, to a lesser extent, with
diminazene, limits their efficacy (Codjia et al., 1993; Peregrine et al., 1997; Afewerk et al.,
2000; Delespaux and de Koning, 2007). The identification of new molecular markers is
currently under study to improve drug resistance diagnosis and substitute conventional
field and laboratory tests, which are laborious and expensive (Delespaux et al., 2008).
Diagnostic techniques used for detection of animal trypanosomes are essentially the same
as those applied to humans (Molyneux, 1975; Leach and Roberts, 1981; Connor, 1992) and
the problems encountered are similar (Uilenberg, 1998). The diagnosis is usually carried
out on blood samples, while lymph node aspirate is less used and CSF is examined only
exceptionally. The “gold standard” in the field to detect and differentiate animal
trypanosome species (which can be identified by morphological characteristics) is

Federica Giordani, 2010 Chapter 1, 33
represented by the cheap light microscopy examination of wet or dry thin and thick blood
smears (Connor, 1992). However, as for human African trypanosomiasis, this approach is
highly insensitive and laborious due to the very low levels of parasitaemia in chronic
infected animals. For wet preparations, the buffy coat under phase contrast illumination
(Murray et al., 1977) is the most sensitive technique. Serological techniques like ELISA
and IFAT are widely used but only for surveillance purposes (Eisler et al., 1998; Reyna-
Bello et al., 1998; Ezeani et al., 2008), as well as new PCR methods, which allow
differentiation between clinically important species and subspecies (Cox et al., 2005;
Picozzi et al., 2002 and 2008).
1.5 Need for new diagnostics
The fact that so many diagnostic methodologies have been applied and proposed for
sleeping sickness is a demonstration that none of them meets all the requirements of an
ideal test with regard to simplicity, efficiency, rapidity and low cost. Despite the crucial
importance of correct diagnosis for disease management in developing countries, relatively
limited resources are invested in microbial diagnostics, which remains, together with drug
research, particularly neglected (Checchi et al., 2006; Perkins and Small, 2006;
Anonymous, 2007). Several international organisations are trying to address the issue.
WHO, with its programme for Research and Training in Tropical Diseases (TDR), has set
up a network to facilitate research and introduction of new diagnostic tests (Remme et al.,
2002). More significantly, a public-private partnership named FIND (Foundation for
Innovative New Diagnostics, http://www.finddiagnostics.org/), was launched in 2003 to
fill this gap by promoting the introduction of new products for diagnosis of infectious
diseases (such as LAMP, the loop-mediated isothermal amplification of DNA) and by
implementation of those already existing (Steverding, 2006; WHO, 2006a). The FIND
commitment to HAT is aimed at the improvement of both serological and parasitological
techniques. Concrete results of these efforts have been the development of a new
concentration method by lysis of the red blood cells and a new improved kit for mAECT,
now produced in the Democratic Republic of Congo and marketed in the other endemic
countries (Büscher et al., 2009). However, as already mentioned (Section 1.2.3.5), the
mAECT is not ideal and new possibilities have to be explored. For example, since the real
bottleneck of HAT diagnosis is represented by the low sensitivity of the confirmatory step
by light microscopy, its improvement by the use of fluorescence microscopy could bring
concrete benefits in the detection of trypanosomes among a complex matrix such as blood.

Federica Giordani, 2010 Chapter 1, 34
1.6 Fluorescence microscopy for diagnosis of infect ious
diseases
Light microscopy has always represented the cornerstone of laboratory diagnosis of
infectious blood and tissue parasites, but, despite the minimal amount of equipment
required, the low concentration of organisms and their difficult differentiation hamper this
procedure (Rosenblatt, 2009). In recent years, fluorescence microscopy applications have
been expanding in many fields of biological research as well as clinical pathology and
medical diagnosis, becoming one of the most powerful tools for high contrast imaging
(Lichtman and Conchello, 2005; Yuste, 2005). Compared to traditional light microscopy,
this technology can offer equal simplicity but higher specificity, sensitivity and rapidity of
screening and, for these reasons, it has been increasingly exploited for infectious disease
diagnosis and monitoring (Sanborn et al., 2005).
The avalability of more affordable instrumentation has allowed the use of fluorescence
techniques also in countries with little resources, where it has been successfully utilised to
improve diagnosis of various infections, including tuberculosis and malaria, which
otherwise still rely on light microscopy of stained films. A systematic review of numerous
studies on the subject demonstrated that fluorescence microscopy for tuberculosis
diagnosis was on average 10% more sensitive than classical sputum smear light
microscopy and equally specific (Steingart et al., 2006). The detection of Mycobacterium
tuberculosis by auramine O or auramine-rhodamine staining, by enabling microscopists to
use lower magnifications, also decreased the time needed for smear examination.
Moreover, auramine O labelling of the specimens is a simpler procedure than the standard
Ziehl-Neelsen technique (Hendry et al., 2009; Minion et al., 2009). For the diagnosis of
malaria the same advantages of rapidity and efficacy of fluorescence techniques over
classical tools (Giemsa-stained blood smears) have been observed (Keiser et al., 2002).
Both the use of acridine orange for direct staining of blood films (Delacollette and Van der
Stuyft, 1994; Kong and Chung, 1995; Gay et al., 1996) or in association with the
quantitative buffy coat (Wongsrichanalai et al., 1991) and the combination of DAPI and
propidium iodide (Caramello et al., 1993) proved useful, especially for the detection of low
levels of parasitaemia. A dual staining method for malaria, using a fluorescent dye (SYBR
Green I), to rapidly detect parasites within red blood cells, and Giemsa, for speciation, has
also been developed (Guy et al., 2007). The implementation of fluorescence microscopy
for use in endemic low-income countries offers many benefits, but the process also faces

Federica Giordani, 2010 Chapter 1, 35
various problems principally related to a lack of resources, inconsistent electricity supplies
and the instability of microscopy reagents (Keiser et al., 2002; Steingart et al., 2006).
Moreover, trained microscopists are needed to distinguish non-specific fluorescent staining
of debris and the microorganisms for diagnosis (Shapiro and Perlmutter, 2008). The high
cost and fragility of fluorescent microscopes and their light sources is also a major issue
(Delacollette and Van der Stuyft, 1994; Hänscheid, 2008). To address this problem a more
affordable interference filter, specific for acridine orange, to be mounted on normal light
microscopes was designed for malaria diagnosis (Kawamoto, 1991; Delacollette and Van
der Stuyft, 1994). The current development of new light sources for fluorescence that
exploit light-emitting diode (LED) technology (Section 1.6.3), offers considerable promise
towards the availability of more affordable and simple fluorescence microscopes suited for
field use (Marais et al., 2008).
1.6.1 The fluorescence process
Fluorescence is a property of a small number of molecules called fluorophores or
fluorochromes, which generally contain polyaromatic hydrocarbons or heterocycles in their
chemical structure. Fluorochromes include various organic dyes (like fluorescein or
rhodamine) extensively used for labelling of molecules, cells, and tissues (Suzuki et al.,
2007; Gonçalves, 2009). An increasing number of fluorescent genetically-encoded proteins
(such as the green fluorescent protein, GFP) are today available and utilised in protein
localisation and gene expression studies in living cells (Chalfie et al., 1994; Shaner et al.,
2004). Fluorophores are able to absorb light with a specific energy and re-emit it at longer
wavelengths as fluorescence following a three step process (Lichtman and Conchello,
2005; Figure 1.6). Initially, the fluorophore absorbs a photon of energy hνEX emitted by an
external source (such as an incandescent lamp or laser) that allows one of its electrons to
pass from its ground state S0 to an excited outer orbital (S1’). Conjugated double bonds
present in these molecules can distribute excited electrons, so that the energy necessary for
their excitation is relatively low. During the brief period of time (measured in picoseconds)
in which the fluorophore exists in its excited state, it can undergo internal conversions,
vibrational relaxation and it can interact with its molecular environment. These events
have, as a consequence, a partial dissipation of its energy, yielding a relaxed singlet excited
state (S1). Finally the fluorophore spontaneously returns to its ground state S0 by emitting a
photon hνEM with a lower energy (and, therefore, a longer wavelength) than the excitation
photon, because of the energy dissipation that occurred during the excited-state lifetime.

Federica Giordani, 2010 Chapter 1, 36
Figure 1.6 – Diagram illustrating the fluorescence process. After absorption of a light photon (h ννννEX), an electron of the fluorophore is excited form t he ground state (S 0) to an outer orbital (S 1’). Here, a partial energy dissipation of the excit ed state occurs and the electron is converted into a l ower excited state (S 1). Finally, the fluorophore returns to the ground state by emitting , as fluorescence, a photon h ννννEM with lower energy than the excitation photon (see Sectio n 1.6.1 for more details).
For molecules in solution, the different discrete electronic transitions give rise to energy
spectra of excitation and emission, which generally have mirror symmetry (Lichtman and
Conchello, 2005). Under the same conditions, the wavelength of the emitted light is not
related to the excitation wavelength and its intensity is proportional to the amplitude of the
fluorescence excitation spectrum. The difference between the exciting and the emitted
wavelength, called the Stokes shift, is fundamental to the sensitivity of fluorescence
techniques, allowing the detection of emitted light against a low background, isolated from
the excitation one. The high sensitivity is also a consequence of the fact that each
fluorophore can generate thousands of photons and that they can be cyclically excited and
detected, unless irreversibly damaged in the excited state (photobleaching phenomenon).
Photobleaching (Chapter 3) is defined as the chemical destruction of a fluorescent
molecule as a result of its excitation (Petty, 2007) and must not be confused with
quenching, which is a reversible loss of fluorescence caused by non-covalent interactions
between the fluorophore and its environment.
The fluorescent signal of a fluorophore depends on its absorption and emission
efficiencies, which are respectively quantified in terms of molar extinction coefficient (ε)
and quantum yield (QY). The value of ε is specified for the absorption maximum
wavelength and represents the probability that the molecule will absorb a photon. Typical
ε values for small fluorophores are comprised between 25,000 to 200,000 M-1 cm-1. The
quantum yield of a fluorophore is a measure of the total light emission over the entire

Federica Giordani, 2010 Chapter 1, 37
fluorescence spectral range and, therefore, of the efficiency with which the absorbed light
produces fluorescent emission. High fluorescent intensities are obtained for QY close to 1.
Fluorescence intensity for a given fluorophore is proportional to the product of ε and QY
(Lichtman and Conchello, 2005).
1.6.2 The fluorescence microscope
The basic parts of a fluorescence microscope include a high intensity light source to excite
the fluorophore and a series of filters to select photons of the excitation wavelength and to
separate them from the light emitted by the fluorophore (Lichtman and Conchello, 2005).
A detector (usually a digital CCD camera) is needed to collect emitted photons and convert
them to a recordable output signal (Petty, 2007). The most commonly used light source is a
low-pressure mercury (or xenon) arc lamp, where the ionization of the gas is obtained by a
high voltage current. Since these lamps emit in a wide range of wavelengths across the
visible spectrum (380-750 nm), an excitation filter to preselect the excitation wavelength
and block all others is required. In epifluorescent microscopes (the most efficient and
widely used) (Figure 1.7) a dichromatic (also called dichroic) beamsplitter mirror, then,
reflects the excitation light into the objective while allowing the emitted light, at higher
wavelength, to pass through. In this system the objective has not only a function of
imaging and magnification of the specimen, but also of condenser for the excitation light.
A secondary barrier filter is usually present to prevent any scattered excitation light from
reaching the eyepiece (Sanborn et al., 2005). In modern fluorescence microscopes barrier
filters and dichromatic mirror designed for a particular spectral range are all contained in a
holder, called filter cube.
Despite the great improvements in optics and detection devices, the illumination sources
used for fluorescence (mercury and xenon arc lamps) have, until recently, not advanced
(Cole and Turner, 2008). Apart from their high purchase and operational costs,
conventional gas discharge bulbs have other technical drawbacks: their broad-spectrum
emission has wide, uncontrolled intensity variations and high quantities of dangerous UV
radiation, which can not be completely shielded by blocking filters, is emitted. Moreover,
these bulbs require several minutes to reach optimal intensity, they produce high amounts
of heat and their lifespan is short (200-300 hours). In the case of mercury bulbs,
environmental problems of disposal must also be taken into account (Anthony et al., 2006;
Cole and Turner, 2008; Robertson et al., 2009).
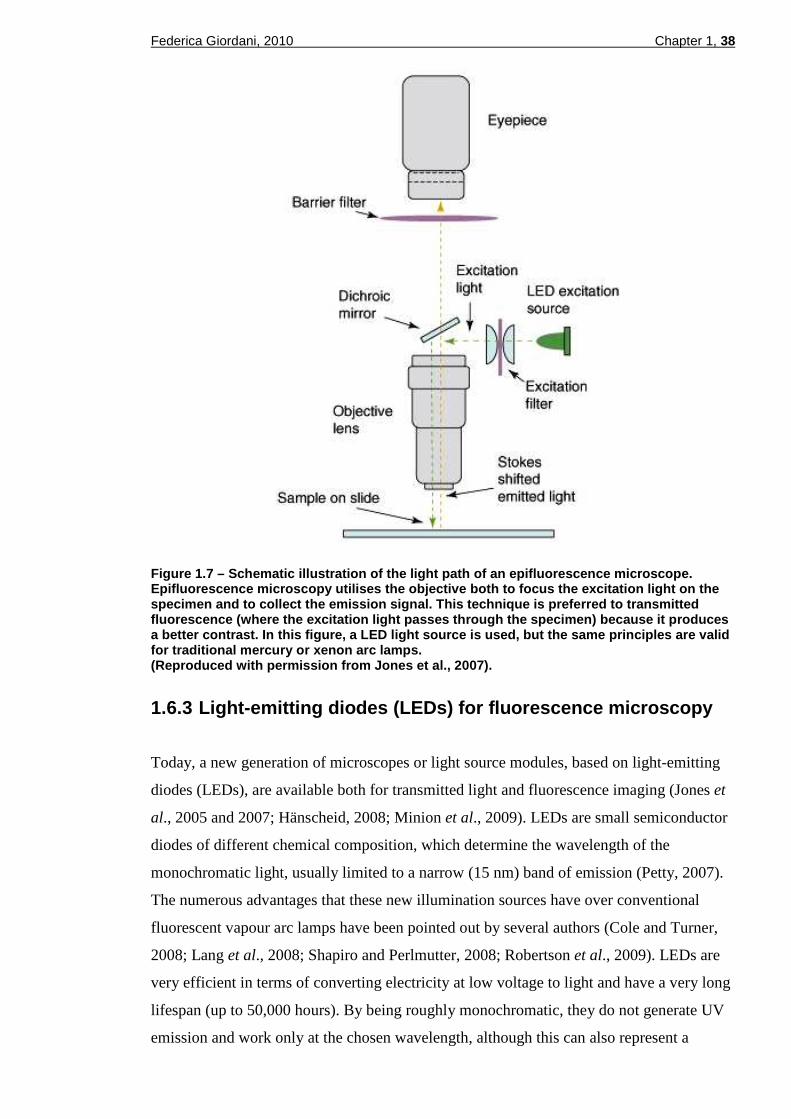
Federica Giordani, 2010 Chapter 1, 38
Figure 1.7 – Schematic illustration of the light pa th of an epifluorescence microscope. Epifluorescence microscopy utilises the objective b oth to focus the excitation light on the specimen and to collect the emission signal. This t echnique is preferred to transmitted fluorescence (where the excitation light passes thr ough the specimen) because it produces a better contrast. In this figure, a LED light sour ce is used, but the same principles are valid for traditional mercury or xenon arc lamps. (Reproduced with permission from Jones et al ., 2007).
1.6.3 Light-emitting diodes (LEDs) for fluorescence microscopy
Today, a new generation of microscopes or light source modules, based on light-emitting
diodes (LEDs), are available both for transmitted light and fluorescence imaging (Jones et
al., 2005 and 2007; Hänscheid, 2008; Minion et al., 2009). LEDs are small semiconductor
diodes of different chemical composition, which determine the wavelength of the
monochromatic light, usually limited to a narrow (15 nm) band of emission (Petty, 2007).
The numerous advantages that these new illumination sources have over conventional
fluorescent vapour arc lamps have been pointed out by several authors (Cole and Turner,
2008; Lang et al., 2008; Shapiro and Perlmutter, 2008; Robertson et al., 2009). LEDs are
very efficient in terms of converting electricity at low voltage to light and have a very long
lifespan (up to 50,000 hours). By being roughly monochromatic, they do not generate UV
emission and work only at the chosen wavelength, although this can also represent a

Federica Giordani, 2010 Chapter 1, 39
disadvantage, since it limits the number of fluorophores that can be used (Anthony et al.,
2006). The diodes produce only minimal heat, are smaller than classical bulbs and they are
easier to use: they do not need lamp adjustment, in theory they do not need excitation
filters and can be repeatedly turned on and off directly without the need of a shutter. All of
these characteristics make LEDs a very cheap and convenient light source for fluorescence
applications: their cost is less than 10% of the price of a mercury vapour bulb (Anthony et
al., 2006). Moreover, since LEDs need only a low voltage power supply, they can be run
on batteries, a crucial aspect for their use in resource-poor settings. However, since LEDs
emit photons in all directions, capturing enough light for microscopy is problematic and
only some of them are sufficiently intense to be exploited for fluorescence applications
(Cole and Turner, 2008).
The benefits offered by LED technology have already been tested for diagnostic purposes.
The simple substitution of traditional light sources with LEDs has proven successful for
detection of malaria parasites (Guy et al., 2007) and auramine O-stained Mycobacterium
tuberculosis, giving sharp, even and highly contrasted images (Anthony et al., 2006; Hung
et al., 2007). LED fluorescence microscopy was shown to be equally sensitive to classical
mercury lamp source microscopy on sputum specimens (Marais et al., 2008). Shapiro and
Perlmutter showed the possible application of this new technology to the development of a
simple and robust fluorescence image cytometer for malaria and tuberculosis diagnosis
(Shapiro and Perlmutter, 2008). Some studies also reported that the examination of
samples with LED-illuminated microscopes was still possible in an environment that was
not completely darkened (Hung et al., 2007; Marais et al., 2008). A recent collaboration
between FIND and the Zeiss group for the development of a new, affordable LED-driven
microscope for high burden countries is the latest validation of this new technology for
diagnosis of infectious diseases (http://www.finddiagnostics.org/).
1.6.4 Fluorescent probes for trypanosomes
One of the main difficulties encountered in HAT diagnosis is the direct observation of
parasites in blood when using light microscopy, given the low numbers of parasite
generally found in infected individuals. A possible way to raise the sensitivity could be to
label trypanosomes with fluorochromes, so that they are more easily detectable among
other blood cells by using a fluorescent microscope. Some fluorescent applications
designed to improve diagnosis of African trypanosomiasis have already demonstrated to be
efficacious. These include the utilisation of acridine orange to help detection of parasites in

Federica Giordani, 2010 Chapter 1, 40
the quantitative buffy coat technique (Bailey and Smith, 1992; Section 1.2.3.6), or the
more sophisticated fluorescein-labelled peptide nucleic acid probes developed for in situ
detection in the PNA FISH technique (Radwanska et al., 2002c; Section 1.2.4.5). Non-
specific staining of dyes like acridine orange can represent a problem since other human
cells in the sample (especially white blood cells) can become fluorescent. The very
different morphology between trypanosomes and white blood cells, however, allows easy
differentiation. Many other studies on trypanosomes have used fluorescence microscopy
for research purposes, by taking advantage of the innate fluorescence of various
trypanocidal drugs and related compounds, or by adding specific fluorescent groups to
non-fluorescent molecules to study their internalisation and localisation inside parasites.
Azema and collaborators labelled hexoses with a fluorescent adduct (dansyl group) to track
their accumulation inside trypanosomes through the THT1 hexose transporter (Azema et
al., 2004). They demonstrated that dansylated hexoses cross the membrane of bloodstream
form parasites without labelling erythrocytes, despite the fact that their internalisation
seemed non-specific. This was probably because fluorescence within red cells was
quenched due to the high concentration of haemoglobin in their cytoplasm. A similar
approach was followed by other authors to study differential uptake of fluorescent
compounds into wild type and melarsoprol- or pentamidine-resistant cells: fluorophores
like DAPI and Hoechst 3342 (both diamidines), ethidium bromide (a phenanthridine
trypanocidal) and acriflavine (an acridine) were all shown to accumulate at higher rates in
sensitive cells than in resistant strains (Frommel and Balber, 1987; Bridges et al., 2007).
Intrinsic fluorescence of the trypanocides isometamidium, ethidium bromide and the
analog propidium was also exploited to identify their intracellular targets by microscopy
(Cox et al., 1984; Boibessot et al., 2002). Identically, accumulation and localisation of
various fluorescent diamidine compounds, including DB75, were extensively studied by
microscopy (Sturk et al., 2004; Mathis et al., 2006; Lanteri et al., 2008). A work conducted
in our laboratory by Stewart and collaborators exploited the slower accumulation of
diamidines in melarsoprol-resistant strains to develop a simple fluorescent arsenical drug
resistance test (Stewart et al., 2005; Section 1.2.8 and Chapter 3).
1.7 Aim of this thesis
The overall objective of this project was to develop new tools to assist in the diagnosis of
African trypanosomiasis and to improve the current test for drug resistance detection by
exploiting LED fluorescence microscopy. Starting from the arsenical drug resistance assay
designed in our laboratory (Stewart et al., 2005), we explored its validity using a

Federica Giordani, 2010 Chapter 1, 41
Figure 1.8 – The prototypical SMR portable LED fluo rescence microscope (Cytoscience). This compact microscope has a standard epifluoresce nce design (see Figure 1.7) and utilises a 472 nm excitation LED light source. Tech nical details are in Section 2.5.4.2. (Reproduced with permission from Jones et al ., 2007).
microscope equipped with a UV LED light instead of the traditional mercury arc used by
Stewart and collaborators. A large part of the work was, then, focused on the evaluation of
various chemical fluorescent probes for their ability to selectively enter and label
trypanosomes, in order to identify valid compounds to use in the design of a more effective
fluorescence field diagnostic test. Prof. D. Jones (Philipps University, Marburg, Germany)
collaborated with the project by providing the UV LED prototype and the Cytoscience
SMR LED epifluorescence microscope (Jones et al., 2005), a very compact, high
resolution instrument designed for field use (Figure 1.8). The SMR scope, in addition to
having relative low cost (~1,000 €) compared to traditional fluorescence microscopes, is
battery-driven and is sealed against dust and water (Jones et al., 2007). We deliberately
avoided the use of expensive fluorophores present on the market including, for example,
fluorescently tagged antibodies, and focused on more affordable chemical dyes that were
compatible with the range in which the Cytoscience microscope operates (λEX=472 nm,
λEM>500 nm). Nevertheless, since LED sources are today available for nearly all
wavelengths across the visible spectrum, and appropriate devices could eventually be
developed, we also tested some fluorochromes excited outside the range covered by the
Cytoscience instrument, utilising a standard epifluorescence microscope. Some of the
fluorescent dyes tested were commercially available compounds, while others were new

Federica Giordani, 2010 Chapter 1, 42
molecules kindly provided by Prof. D. W. Boykin (Georgia State University, Atlanta,
USA), or personally synthesised in collaboration with Dr. A. Sutherland’s group
(University of Glasgow, Glasgow, UK). Particular attention was paid to the ability of the
fluorochromes to yield a bright, specific and stable signal, all important requirements when
considering the use of fluorescence for field diagnostics.

2
Materials and methods

Federica Giordani, 2010 Chapter 2, 44
2.1 T. b. brucei in vitro culture
Non-human infective T. b. brucei bloodstream forms (monomorphic Lister 427 strain wild
type and derived lines) were cultured in HMI-9 medium (Gibco, Appendix A) including
10% heat-inactivated foetal calf serum at 37°C in a humidified, 5% CO2 environment
(Hirumi and Hirumi, 1994). An aliquot of cells (1-2×10⁵ cells/ml) was subpassaged in
fresh medium every 48 h, when parasites had reached the mid-log phase concentration of
approximately 2×10⁶ cells/ml. The bloodstream form 449 line (kind gift of Dr. Christine
Clayton, University of Heidelberg), a wild type line stably expressing the tetracycline
repressor from the integrated pHD449 plasmid (Biebinger et al., 1997), was cultured in
HMI-9 plus 10% FCS, including 0.2 µg/ml phleomycin. To maintain the culture as stable
as possible, the same cell aliquot was subpassaged for a maximum of 30 times and then
substituted with a new one. All cell line stabilates were maintained in liquid nitrogen in a
freezing medium (HMI-9) containing 10% glycerol.
2.2 Cell line genotyping
All bloodstream T. b. brucei cell lines used during the experiments were regularly checked
by PCR. The presence of four genetic markers was assessed: TbAT1, the gene encoding the
P2 amino-purine transporter present in T. b. brucei S427 wild type (Mäser et al., 1999); the
genes for neomycin resistance (NEO) and puromycin resistance (PAC), the selective
markers used to replace both alleles of the TbAT1 gene in the tbat1-/- line (Matovu et al.,
2003) and also present in tbat1-/--derived lines; actin (ACT), as a positive internal control.
Primer sequences for the four markers are shown in Table 2.1.
Sequence amplified Primer pair Primer sequence
MB183 (f) 5’-GACTGTCGACATGCTCGGGTTTGACTCAGCC-3’ TbAT1 MB184 (r) 5’-GACTCTGCAGTAGTGCTACTTGGGAAGCCCC-3’ MB37 (f) 5’-ATGATTGAACAAGATGGATTGC-3’ NEO MB38 (r) 5’-TCAGAAGAACTCGTCAAGAAG-3’ MB308 (f) 5’-ATGACCGAGTACAAGCCCACGG-3’ PAC MB309 (r) 5’-TTGCGGGTCATGCACCAGGT-3’ MB173 (f) 5’-CCGAGTCACACAACGT-3’
ACT MB174 (r) 5’-CCACCTGCATAACATTG-3’
Table 2.1 – Oligonucleotides used for cell line gen otyping. NEO: neomycin resistance gene; PAC: puromycin resistance gene; ACT: actin; (f): forward; (r): reverse.

Federica Giordani, 2010 Chapter 2, 45
TbAT1, NEO and ACT were usually amplified all together in a multiplex PCR reaction
containing 2× PCR Master Mix buffer (Thermo Scientific), 0.1 µM of each primer, 1.25 U
GoTaq® DNA polymerase (Promega) and template gDNA (0.5-1 ng/µl final concentration)
extracted from cells grown in vitro using the DNeasy® Blood and Tissue Kit (Qiagen),
following manufacturer’s instructions. Negative controls (without any DNA) were always
included.
Cycling conditions of the multiplex PCR for TbAT1, NEO and ACT were as follow:
1- Polymerase activation 94°C for 5 min
2- Denaturation 94°C for 1 min
3- Annealing 55°C for 1 min
4- Extension 65°C for 4 min
5- Repeat steps 2-4 35 cycles
5- Final extension 65°C for 8 min
PAC was amplified in a single marker PCR reaction. The mastermix was prepared as
described above for the multiplex reaction but using 1× PCR Master Mix buffer.
Cycling conditions for PAC were the following:
1- Polymerase activation 95°C for 1 min
2- Denaturation 94°C for 30 sec
3- Annealing 60°C for 30 sec
4- Extension 72°C for 1 min
5- Repeat steps 2-4 35 cycles
5- Final extension 72°C for 2 min
PCR products were separated on a 1% agarose gel and visualised with SYBR® Safe DNA
gel stain (Invitrogen) under a UV light transilluminator (UVP Inc.).
2.2.1 Retrieval of DNA from FTA ® card for PCR analysis
Occasionally, gDNA was extracted from samples absorbed to FTA® cards (Whatman, GE
Healthcare). Cards were prepared both for in vitro culture genotyping and, especially, for
PCR testing of trypanosomes in blood, to check for the presence or absence of the TbAT1
gene. Each card was spotted with 50-100 µl of the sample (trypanosomes in medium or

Federica Giordani, 2010 Chapter 2, 46
blood), air-dried and kept at 4°C until use. Small card disks, cut using a punch tool, were
thoroughly washed in 200 µl FTA purification reagent (Whatman, GE Healthcare) 3 times
at r.t. (5 min per wash). Disks were then washed twice in 200 µl TE buffer (Appendix B)
for 5 min and finally dried for at least 1 h at r.t.. For PCR reaction, the disk was directly
immersed in the mastermix solution. TbAT1 was successfully amplified from blood
samples absorbed on FTA® cards using a reaction solution containing 1× PCR buffer
(Promega), 0.1 µM of each primer, 1.25 U GoTaq® DNA polymerase (Promega), 2.5 mM
MgCl2 and 0.3 mM dNTPs.
For TbAT1 amplification from FTA® cards cycling conditions were as follow:
1- Polymerase activation 94°C for 2 min
2- Denaturation 94°C for 1 min
3- Annealing 55°C for 1 min
4- Extension 72°C for 90 sec
5- Repeat steps 2-4 30 cycles
5- Final extension 72°C for 2 min
2.3 Trypanosome-infected blood samples
Monomorphic bloodstream form trypanosomes were grown in vivo either in adult ICR
Swiss and BALB/c female mice or Wistar female rats. Due to the high number of blood
samples needed during this project, for routine ex-vivo fluorescence microscopy
experiments we decided to use the discarded rat blood left after elimination of the buffy
coat, which is often used for uptake assays in our laboratory. This had the double
advantage of avoiding the sacrifice of too many animals and of obtaining a blood sample
with, ideally, a not excessively high parasitaemia. Nevertheless, elimination of the buffy
coat containing the trypanosomes also removed the white blood cells from the sample and,
therefore, whole blood infected samples (usually from mice) were also used.
For growth in mice, 1×10⁶ parasites of the cell line under study were injected
intraperitoneally. Parasitaemia was monitored daily by tail-prick blood examination. At
peak parasitaemia (1-2×10⁸ parasites/ml, 3-4 days post-infection), infected blood was
collected by cardiac puncture in a tube containing CBSS (Appendix B) and heparin and
kept ice-cold until use without any other processing. Aliquots of the infected blood were
treated with the fluorochrome to test within hours from collection.

Federica Giordani, 2010 Chapter 2, 47
Wistar rats were inoculated with 8×10⁶ trypanosomes and parasitaemia was checked daily,
as for mice. Parasites were harvested at peak parasitaemia by cardiac puncture. The
collected blood sample was centrifuged at 1,300×g for 15 min at 4°C to separate the buffy
coat (used in other experiments in the laboratory). The upper layer of plasma was
transferred to a new tube and mixed again with the lower layer containing the red blood
cells. Fresh aliquots of this new blood sample, from which most parasites were eliminated,
were incubated ex-vivo with the appropriate fluorochrome and used for fluorescent
microscopy experiments.
The rat blood buffy coat containing concentrated trypanosomes obtained after
centrifugation was further purified to prepare protein samples for Western blot (Chapter 6).
Parasites were resuspended 1:1 in PSG buffer at pH 8 (Appendix B) and separated from
blood cells by anion exchange chromatography, using a DE52 cellulose column. The
eluted trypanosomes were collected in a 50 ml polypropylene falcon tube and washed
twice (1,300×g, 10 min) in CBSS to eliminate every residue of PSG buffer. Parasites were,
then, counted on a haemocytometer and resuspended at 1×10⁸ cells/ml in CBSS. Protein
extraction protocols are described in Section 2.7.7.
2.4 Alamar Blue assay
Trypanotoxicity of target compounds on different T. b. brucei cell lines was assessed by
the Alamar Blue assay (adapted from Räz et al., 1997). Bloodstream form trypanosomes
(100 µl at 4×10⁴ cells/ml) were added to each well of a 96-well flat-bottomed white plate,
where doubling serial dilutions of the test compounds (100 µM - 0.024 nM) had been
previously prepared in a volume of 100 µl HMI-9. After 48 h incubation at 37°C and 5%
CO2, 20 µl of Alamar Blue solution (resazurin sodium salt from Sigma-Aldrich; 0.49 mM
in 1× PBS, pH 7.4) were added to each well, and plates were incubated for further 24 h.
The reduction of the blue reagent to a colourless form by living parasites was measured
with a FLUOstar OPTIMA fluorimeter (BGM Labtech) using a 544 nm excitation
wavelength and a 590 nm emission wavelength. Fluorescence data were plotted as a
function of drug concentration using the IC50 algorithm of Prism 5.0 software (GraphPad)
to obtain inhibitory concentrations (50% fluorescence reduction). Untreated cells were
used as negative control and known trypanocidal drugs, such as pentamidine, as positive
control. All experiments were carried out in duplicate and repeated on at least three
independent occasions.

Federica Giordani, 2010 Chapter 2, 48
2.5 Microscopy techniques
2.5.1 Fluorophores
Fluorescent compounds were obtained both from academic laboratories and from various
commercial sources. DB75 dihydrochloride salt (Chapter 3), the five green fluorescent
diamidines DB1464, DB1465, DB1645, DB1680 and DB1692 (Chapter 4) and the dansyl
derivative diamidine DB1919 (Chapter 5) were kindly provided by Prof. D. W. Boykin
(Georgia State University, Atlanta). DAPI dihydrochloride (Chapter 3), ethidium bromide
and acridine orange (Chapter 4) were purchased from Sigma-Aldrich. Propidium iodide
was supplied by Molecular Probes (Invitrogen). Pure isometamidium (May and Baker
4180; Chapter 4) was a gift from Mr. Brian Cover (University of Kent, Canterbury). I
personally synthesised the amino acid derivatives FG10, FG70 and FG400 in Dr. A.
Sutherland’s chemistry laboratory (University of Glasgow) (Chapter 5).
Stock solutions of the five green fluorescent diamidines synthesised in Prof. D. W.
Boykin’s laboratory and of DB75 were prepared at 10 mM in DMSO (2.5 mM for
DB1680). DB1919 stock solution was at 20 mM in DMSO. Stocks of ethidium bromide,
propidium iodide and isometamidium chloride were at 10 mM in 1× PBS. Acridine orange
stock was prepared at 17 mM in dH2O and DAPI at 50 mM in dH2O. The three amino acid
derivatives were solubilised at 10 mM in DMSO (methanol for FG10). Aliquots of stock
solutions were kept at -20°C protected from the light.
2.5.2 In vitro trypanosome samples for fluorescence microscopy
2.5.2.1 Fluorescent staining and sample preparation
Live trypanosomes from culture (2×10⁷ cells/ml) were treated, at the desired temperature,
with the test concentration of fluorochrome, in 1.5 ml Eppendorf tubes (for treatment times
up to 4 h) or, for longer times of incubation, in 24-well plates (kept at 37°C in a
humidified, 5% CO2 environment). Wet films of stained live parasites in culture medium,
or resuspended in 1× PBS (Appendix B) after washing, were prepared by spreading 50 µl
of the sample onto a slide using a coverslip and immediately viewed under a fluorescence
microscope. Otherwise, stained cells were immobilised in agarose to facilitate imaging
(Section 2.5.2.2). Methanol-fixed trypanosomes from in vitro culture (Sections 2.5.2.3)
were stained after fixation by directly spreading 50 µl of the dye (or mounting medium)

Federica Giordani, 2010 Chapter 2, 49
onto the specimen at the desired concentration and by covering it with a coverslip (this
procedure was only used for fading quantification of UV diamidines, Section 2.5.5).
2.5.2.2 Cell immobilisation in agarose
To reduce the motility of cultured live trypanosomes for image acquisition, cells were
embedded in agarose (Widener et al., 2007; Lanteri et al., 2008). After incubation with the
fluorophore under study, cells (2×10⁷ cells/ml) were collected by centrifugation (1300×g
for 10 min) and resuspended in a small volume (50 µl or less) of 1× PBS. After an equal
volume of 2% w/v low melting point agarose (Sigma-Aldrich) at 37°C was mixed with the
cell suspension, an aliquot of the sample was immediately put onto a slide and covered
with a coverslip. The agarose was left to solidify at room temperature, or by chilling the
slides for 10-15 min at 4°C, before viewing.
2.5.2.3 Cell fixation in methanol
To prepare methanol-fixed parasites to use for photobleaching studies, 50 µl of a 2×10⁶
cells/ml culture of T. b. brucei w.t. S427 in HMI-9 (10% FCS) were directly spread onto a
glass microscope slide using the edge of a coverslip and left to air-dry. Slides were, then,
dipped into 100% cold methanol and left overnight at -20°C. Afterwards the methanol was
allowed to evaporate from the specimens under a fume-hood and slides were kept in a box
at 4°C until use. Before staining, fixed cells were rehydrated by addition of 1-2 ml of PBS
for 10 minutes. The excess of PBS was then removed by tilting and the specimen directly
soaked with 50 µl of the fluorochrome solution and, eventually, the mounting medium
(Section 2.5.2.6) and covered with a coverslip.
2.5.2.4 Cell fixation in glutaraldehyde
Glutaraldehyde was one of the fixatives tested to prepare specimens of transfected
trypanosomes produced during the molecular biology work (Chapter 6). 107 cells were
collected in 1 ml of medium and washed once in 1× PBS at 4°C, before being submerged
for 5 min in chilled 2.5% v/v glutaraldehyde (Sigma-Aldrich) solution, prepared in
1× PBS. The fixative was removed from the pelleted parasites by pulse centrifuging at
8,000 rpm in a benchtop centrifuge for several seconds. Parasites were, then, resuspended
in 20 µl of 1× PBS, smeared onto a lysine-coated slide (0.1% w/v poly-L-lysine solution
from Sigma-Aldrich) and left to settle for 5 min: the negative charges of cells in solution

Federica Giordani, 2010 Chapter 2, 50
interacted electrostatically with the positive charges of the polylysine, allowing them to
adhere to the slide in a dispersed monolayer (Husain et al., 1980). Mounting medium
(40 µl) containing a counterstain for DNA (Section 2.5.2.6) was spread on the specimen by
addition of a coverslip, which was successively sealed with nail varnish.
2.5.2.5 Cell fixation in formaldehyde
Fixation in formaldehyde was the method adopted to fix transfected trypanosomes for
fluorescence microscopy imaging (Chapter 6). After washing in 1× PBS, transfected and
parental lines trypanosomes (1×10⁷ cells) were resuspended in 0.5 ml of the buffer and
mixed with an equal volume of 6% v/v formaldehyde (Sigma-Aldrich) solution, prepared
in 1× PBS. Cells were fixed for 10 min at 4ºC and then separated from the fixative by
centrifuging at 8,000 rpm for several seconds. The cell pellet was resuspended in 1× PBS
(40 µl) and spread onto lysine-coated slides (20 µl per slide). After the solution had settled,
40 µl of mounting medium containing the DNA counterstain (Section 2.5.2.6) were added
and covered with a coverslip, which was sealed in place with nail varnish.
2.5.2.6 Mounting media
The mounting medium for DNA counterstaining was prepared by mixing 0.1% v/v DAPI
and 2.5% w/v DABCO (both from Sigma-Adrich) in 9:1 glycerol/1× PBS.
Various mounting media containing antifading agents were tested in attempts to decrease
DB75 photobleaching in methanol-fixed cells. Two different solutions containing 5% w/v
n-propyl gallate (NPG, [3,4,5-trihydroxybenzoic acid propyl ester]) were prepared in 9:1
buffered glycerol (9 parts of glycerol and 1 part of 1× PBS) and 1:1 buffered glycerol.
Another antioxidant agent, DABCO, [1,4-diazobicyclo-(2,2,2)-octane], was prepared as a
2.5% w/v solution in 9:1 buffered glycerol (Johnson et al., 1982; Florijn et al., 1995). The
third antioxidant agent used was Trolox, [6-hydroxy-2,5,7,8-tetramethylchroman-2-
carboxylic acid], a cell-permeable, water soluble derivative of vitamin E, which was
prepared at 2 mM in PBS and was used on DB75-stained fixed cells but also in living
samples. All three antifading agents were from Sigma-Aldrich. For fading profile
measurements, 50 µl of each mounting media containing 3 µM of DB75 were spread onto
the slide containing methanol-fixed cells and covered with a coverslip, which was sealed
by the use of nail varnish.

Federica Giordani, 2010 Chapter 2, 51
2.5.3 Ex-vivo trypanosome samples for fluorescence microscopy
2.5.3.1 Thin and thick blood film preparation
Thin blood smears were prepared by spreading a drop of infected blood (5 µl) along the
glass slide by using the edge of a coverslip (Houwen, 2000). The smears were covered
with a coverslip to produce wet films, which were immediately viewed under the
fluorescence microscope. Otherwise, thin films were left to air-dry and, generally, fixed in
cold 100% methanol for 2 min. After fixation, blood smears were air-dried again and kept
in a slide box until viewing (usually under a 40× objective).
Thick blood films were prepared by putting a drop of blood (20 µl) onto a slide and by
spreading it in a circle (1-2 cm in diameter) using the corner of another clean slide. Thick
films were thoroughly air-dried but not fixed (since fixation would prevent lysis of
erythrocytes by the aqueous stain solution, usually Giemsa, needed to see through the
several layers of blood) and viewed under a 100× oil-immersion objective.
2.5.3.2 Staining procedures for blood films
Live ex-vivo trypanosomes were stained with various fluorophores by incubating aliquots
of fresh infected rat blood with the dye under study inside 1.5 ml Eppendorf tubes, kept at
the desired temperature. At the end of the incubation time, aliquots of blood containing
stained parasites were used to prepare fresh thin smears. Staining properties of some
fluorophores were also assessed after application of a drop of the dye (50 µl) directly to the
wet smear, which was, then, covered with a coverslip.
For fluorescent stain of fixed thin films (Section 2.5.3.1), a solution of the fluorochrome
(50 µl) was directly applied to the specimen and spread by covering with a coverslip.
These samples were viewed under a fluorescence microscope without further processing or
washing steps. To stain thick blood films various procedures were followed. These
included (1) application of the dye (30 µl) and of a coverslip to the dry smear; (2)
dehaemoglobinisation of the dry thick film in dH2O (5 min), fixation in methanol (2 min)
and subsequent staining with 30 µl of the fluorophore solution (Caramello et al., 1993); (3)
addition of the fluorescent dye directly to the drop of blood before preparing the smear.
The efficacy of these protocols is discussed in Chapter 4.

Federica Giordani, 2010 Chapter 2, 52
2.5.3.3 Giemsa stain
For trypanosome visualisation under light microscopy, fixed thin blood films and air-dried
thick smears were put in a Coplin jar and immersed in a 5% v/v Giemsa stain solution
(BDH Laboratory Supplies) in phosphate buffer (Appendix B) for 1 h. Excess dye was
washed by briefly immerging the slides in dH2O (5 min). Slides were then allowed to air-
dry and kept in a box until viewing.
2.5.4 Image acquisition
2.5.4.1 Zeiss Axioplan fluorescence microscope
Most of the fluorophores studies were performed in a dark room, using a motorized Zeiss
Axioplan 2 Imaging epifluorescence microscope (Carl Zeiss) equipped with a HBO 100W
short arc mercury lamp (Osram) and 10× eyepieces, and coupled with a Hamamatsu
C4742-80-12AG digital CCD camera (Hamamatsu Photonics). Three standard filter sets
were generally used (all filter sets were from Carl Zeiss): filter set 49 for DAPI (excitation
filter G 365 nm, beamsplitter FT 395 nm and emission filter BP 445/50 nm); filter set 10
for FITC (excitation filter BP 450-490 nm, beamsplitter FT 510 nm and emission filter BP
515-565 nm); filter set 15 for RHOD (excitation filter BP 546/12 nm, beamsplitter FT 580
nm and emission filter LP 590 nm). Other filter cubes were occasionally utilised, such as
filter set 43 for DsRed (excitation filter BP 545/25 nm, beamsplitter FT 570 nm and
emission filter BP 605/70 nm). Emission was recorded through a PlanNEUFLUAR 40×
air, NA 0.75 objective, or a 100× oil-immersion, NA 1.4 objective (both from Carl Zeiss).
Typical camera exposure times for imaging were: 33 ms for DAPI, 68 ms (or 100 ms) for
FITC and 68 ms for RHOD (the precise values used during each experiment are indicated
underneath every figure).
Image acquisition, image processing and quantification studies were performed using the
Volocity imaging software (Improvision). Z-stack images, collected at 0.4 µm intervals,
were deconvolved using the Volocity Iterative Restoration algorithm, set with a confidence
limit of 97.5-98%. Images obtained using different channels were merged using the Adobe
Photoshop 7.0 software package.

Federica Giordani, 2010 Chapter 2, 53
2.5.4.2 SMR LED microscope and UV LED microscope (C ytoscience)
The portable microscope we used during this project was the prototype for the SMR
Cytoscience epifluorescent microscope (Jones et al., 2005). This instrument (Figure 1.8)
used a 472 nm Golden Dragon LED as excitation light source (Osram) and it had a single,
fixed, 40× achromat DIN objective (NA 0.65, 160 mm tube length) (Lambda Praha). The
filter set was composed of a 500-510 nm blocking filter (some LED output was in this
region), a 580 nm 45° dichromatic mirror and a 515-750 nm emission filter for all
wavelengths from green to red. The cost of the microscope was ~1,000 euros.
The UV LED microscope (Figure 3.6) was an adapted Hund bench microscope, equipped
with a 365 nm UL LED 500 mA light source (Nichia) and a 40× achromatic objective (NA
0.65) (Hund). The prototype was designed and built by Prof. D. Jones (Cytoscience). Its
cost was ~1,200 euros. To acquire images we used a 1.4 MP 160 camera (Lumenera)
which had a 2/3 inch Sony Extra HAD (hile accumulation diode) and was connected to a
ScopePhoto software (ScopeTek). The cost of the camera was 3,500 euros.
2.5.5 Fluorescence fading measurement
Fading profile of DB75 and DAPI was measured in stained in vitro T. b. brucei w.t. S427
cells fixed in methanol. Before the experiment, slides were always freshly stained in the
dark with 50 µl of a 3 µM solution in 1× PBS of one of the two fluorophores and covered
with a coverslip. Photobleaching of DB75 was quantified either in the absence of
antifading agents or after mounting with different mounting media (Section 2.5.2.6). Slides
were left to set for 15-30 minutes at room temperature before viewing under the DAPI
filter of the Zeiss Axioplan microscope (Carl Zeiss). Images of the continuously
illuminated field were captured every 5 seconds for a total period of 5 minutes for DB75
and every 15 seconds for a total period of 12 minutes for DAPI by using the Volocity
Imaging software (Improvision). Illumination conditions and acquisition settings were kept
identical for experiments with both fluorophores (144 gain, 14 offset, 33 ms exposure time
for DAPI filter, 40× air objective NA 0.75). Fluorescence fading was quantified using the
quantitation program of the Volocity Imaging software (Improvision). All images were
processed by subtracting the background (i.e. the illuminated sample with no cells in the
field of view) and then percentage of intensity of fluorescence of the nucleus and
kinetoplast of every cell was measured for each time point. Only trypanosomes with a
single nucleus and a single kinetoplast were considered. For each dye, and also for each of

Federica Giordani, 2010 Chapter 2, 54
the different mounting media used in association with DB75, fluorescence decay of at least
100 stained cells was measured. Since fluorescence intensity of individual cells can vary
between samples, several slides were analysed for both fluorophores. All data were plotted
using an exponential algorithm of Prism 5.0 software (GraphPad).
2.6 Fluorescence spectra measurement
Excitation and emission spectra of a specific fluorophore were recorded using the LS 55
Luminescence Spectrometer (PerkinElmer), connected to the FL WinLab software
(PerkinElmer). Samples were diluted in dH2O until unsaturated signal strength was
achieved. An aliquot of the samples (1 ml) was put in 10 mm quartz cuvettes (Merck) and
a pre-scan was performed over the full spectrum range for excitation (200-800 nm) and
emission (200-900 nm) with both slits set to 5 nm and the scan speed set to 150 nm/min.
The approximate values for the excitation and emission maxima obtained during the pre-
scan were, then, used to record the excitation and emission spectra with more accuracy, by
running successive scans while keeping either value (excitation or emission maximum) fixed.
2.7 Molecular biology techniques
2.7.1 Genomic DNA extraction
To isolate large quantities of gDNA, 100 ml of a mid-log phase cell culture (1-2×10⁶
cells/ml) were initially washed twice in 1× PBS. The pellet was resuspended in 500 µl of
lysis buffer (Appendix C), added with 100 µg of protease K and incubated overnight at
50°C. After mixing with an equal volume of phenol-chloroform-isoamyl alcohol (25:24:1)
(Sigma-Aldrich) for 5 min, the DNA was extracted in the aqueous layer by centrifugating
at 855×g for 10 min. The aqueous phase was transferred to a new tube and washed twice
by addition of an equal volume of chloroform. The DNA was precipitated in 0.1 volume of
3 M NaCl and 2 volumes of 100% EtOH and then washed in 70% EtOH, left to air dry and
finally resuspended in 100 µl TE buffer (Appendix B).
A DNeasy® Blood and Tissue Kit (Qiagen) was used, following the manufacturer’s
instructions, to quickly isolate gDNA from transfected clones in order to screen for the
presence of the correct mCherry::TbAT1 or TbAT1::mCherry construct (Section 2.7.2.2).
In this case, cells from a 5 ml dense culture (2×10⁶ cells/ml) were used.

Federica Giordani, 2010 Chapter 2, 55
The concentration of extracted gDNA and of purified plasmids was measured using a ND-
1000 V31.0 NanoDrop instrument (Thermo Fisher Scientific Inc.).
2.7.2 PCR
2.7.2.1 Amplification of TbAT1 and mCherry ORF
The polymerase chain reaction (PCR) was used to amplify DNA fragments both from
genomic material and plasmids. For the project involving the construction of a TbAT1-
RFP reporter system (Chapter 6), four sets of primers, containing the required restriction
sites, were designed for amplification of TbAT1 (form gDNA) and mCherry (from vector
p2664, described in Kelly et al., 2007) coding sequences: two sets for the N-t construct
(mCherry::TbAT1) and two sets for the C-t construct (TbAT1::mCherry) (Table 2.2).
Sequence amplified Primer pair Primer sequence
MB405 (f) 5’-ATTAAGCTTATGGCAACTAGCGGCATGGT-3’ mCherry (N-t)
MB406 (r) 5’-ATTGGGCCCTCCTCCTGCGGTACCAGAACCTTTGT-3’
MB407 (f) 5’-ATTGGGCCCATGCTCGGGTTTGACTCAGC-3’ TbAT1 (N-t)
MB408 (r) 5’-ATTGGATCCCTACTTGGGAAGCCCCTCAT-3’
MB409 (f) 5’-ATTGGGCCCATGGCAACTAGCGGCATGGT-3’ mCherry (C-t)
MB410 (r) 5’-TTAGGATCCTTATGCGGTACCAGAACCTT-3’
MB411 (f) 5’-ATTAAGCTTATGCTCGGGTTTGACTCAGC-3’ TbAT1 (C-t)
MB412 (r) 5’-ATTGGGCCCTCCTCCCTTGGGAAGCCCCTCATTGA-3’
Table 2.2 – Oligonucleotides used for TbAT1 and mCherry ORF amplification. Restriction sites introduced for cloning purposes a re underlined; stop codons are in bold; glycine-encoding codons are in italics. (f): forward; (r): reverse.
All oligonucleotides were synthesised by Eurofins MWG Operon. A high fidelity enzyme
(KOD Hot Start DNA polymerase, Novagen) was used to obtain fragments for subsequent
cloning (while for routine PCR applications a GoTaq® DNA polymerase, by Promega, was
used). PCR mastermix was prepared in a total volume of 25 µl per reaction, containing 1×
buffer, 0.3 mM dNTPs, 1.5 mM MgCl, 0.3 µM both of sense (5’) and anti-sense (3’)
primer, 1.25 U of polymerase and the template (~100 ng gDNA, or 0.5 ng plasmidic
DNA). The thermal cycler PTC200 DNA Engine Thermal Cycler (MJ Research) was used
for DNA amplification. Reaction conditions were optimised for each experiment. In
particular, the best annealing temperature for each set of primers was determined by
gradient PCR.

Federica Giordani, 2010 Chapter 2, 56
For TbAT1 amplification from gDNA, cycling conditions were as follow:
1- Polymerase activation 95°C for 2 min
2- Denaturation 95°C for 20 sec
3- Annealing 58.4°C for 10 sec
4- Extension 70°C for 35 sec
5- Repeat steps 2-4 30 cycles
For mCherry amplification from p2664, cycling conditions were as follow:
1- Polymerase activation 95°C for 2 min
2- Denaturation 95°C for 20 sec
3- Annealing 64.8°C for 10 sec
4- Extension 70°C for 15 sec
5- Repeat steps 2-4 25 cycles
PCR amplicons were isolated and visualised by electrophoresis on a 1% agarose gel
stained with SYBR® Safe DNA gel stain (Invitrogen) and then purified from the gel using
the QIAquick PCR Purification Kit (Qiagen) following the manufacturer’s instructions.
2.7.2.2 PCR screening of transfected trypanosomes
PCR amplification of a fragment spanning TbAT1 and mCherry domains was used to check
for the presence of the constructs pMB-G94 (containing mCherry::TbAT1) and pMB-G95
(containing TbAT1::mCherry) inside transfected trypanosomes. Primers used for screening
are shown in Table 2.3. PCR reactions were prepared as previously described (2.7.2.1),
using as template ~0.5-1 ng/µl gDNA, extracted with the DNeasy® Blood and Tissue Kit
(Qiagen).
Sequence amplified
Primer pair Primer sequence
MB363 (f) 5’-AGCCCTCAATTCATGTATGG-3’ mCherry::TbAT1 (fragment) MB182 (r) 5’-TCATCGCCTCCGTGGGGGTC-3’
MB181 (f) 5’-CAGAGTTCCGATATGCAGC-3’ TbAT1::mCherry (fragment) MB410 (r) 5’-TTAGGATCCTTATGCGGTACCAGAACCTT-3’
Table 2.3 – Oligonucleotides used for amplification of a fragment spanning TbAT1 and mCherry domains in transfected trypanosomes. (f): forward; (r): reverse.

Federica Giordani, 2010 Chapter 2, 57
PCR conditions were as follow:
1- Polymerase activation 95°C for 1 min
2- Denaturation 95°C for 1 min
3- Annealing 53.4°C for 1 min
4- Extension 72°C for 90 sec
5- Repeat steps 2-4 30 cycles
5- Final extension 72°C for 1 min
2.7.3 Plasmid and vector construction
In order to ligate PCR amplicons into the plasmid pGEM-T Easy (Promega), which has
additional overhanging thymidine at both 3’ terminals, they had first to be added with a
single 3’-terminal adenosine. This was obtained by incubating the PCR products with
2.5 U of GoTaq® DNA polymerase at 72°C for 15 min before gel extraction. The ligation
reactions (10 µl total volume) were prepared by mixing 50 ng of plasmid, 1× T4 ligation
buffer, 3 U of T4 DNA ligase polymerase (Promega) and 5 µl of purified PCR product.
Reactions were incubated overnight at 4°C.
After bacterial amplification and purification (Section 2.7.4), ligation products were
checked for presence of the correct insert size by electrophoretic migration of digested
products on a 1% agarose gel. 1 µl of plasmid was digested with 10 U of the specific
restriction enzymes in a 10 µl reaction mixture containing 1× of the appropriate restriction
enzyme buffer. Digest reactions were always carried out for 2 h at 37°C. Correctness of the
ligated sequences was verified by sequence analysis (Eurofins MWG Operon). If the insert
proved correct, a higher amount of plasmid containing the PCR amplicon (5 µl) was
digested to isolate the inserts for subsequent cloning. When the two enzymes used to
isolate the fragments needed different buffers, digest was carried out in two distinct
reactions separated by a purification step to eliminate the buffer used for the first reaction
(the PCR Purification Kit from Qiagen was used for this purpose). Fragments were then
separated from the plasmid backbone by running the digest products on a 1% agarose gel
and purified (QiAquick Gel Extraction Kit, Qiagen).
TbAT1 and mCherry amplicons were first joined together in pGEM-T Easy and only
afterwards cloned into the final expression vector pHD676 (Figure 2.1), kind gift of Dr.
Christine Clayton, University of Heidelberg (Biebinger et al., 1997), as HindIII-BamHI

Federica Giordani, 2010 Chapter 2, 58
Figure 2.1 – Schematic representation of the steps taken to build pMB-G94 and pMB-G95 vectors. TbAT1 and mCherry sequences for the N-t construct ( mCherry ORF upstream the TbAT1 gene) and C-t construct ( mCherry ORF downstream the TbAT1 gene) differed for the restriction sites introduced by PCR for subsequent cloning into the expression vector pHD676. TbAT1 and mCherry genes cloned inside pGEM-T Easy (Promega) were fir st cleaved and linked together into another pGEM-T Eas y plasmid by exploiting the indicated restriction sites contained in its polylinker, in o rder to generate the fused sequences mCherry::TbAT1 (N-t) and TbAT1::mCherry (C-t). These inserted gene sequences were successively cut as HindIII-BamHI fragments and cloned into the expression vector pHD676, generating vectors pMB-G94 and pMG-G95. Names of th e intermediate constructs are also indicated. A: Apa I; B: BamHI; H: HindIII; N: Not I; S: Nsi I.

Federica Giordani, 2010 Chapter 2, 59
fragments. This strategy was chosen since direct insertion of the genes inside the final
vector proved unsuccessful. To ligate together TbAT1 and mCherry into pGEM-T Easy
various restriction sites contained inside the plasmid polylinker were used (these sites are
indicated in Figure 2.1). All ligation reactions were carried out using a 1:1 or 1:2
vector/insert(s) ratio as described above. Final vectors (pMB-G94 and pMB-G95) were
sent to Eurofins MWG Operon for sequencing.
2.7.4 E. coli transformation and plasmid purification
Large quantities (required for trypanosome transfection) of plasmids containing the gene(s)
of interest were obtained by heat shock bacterial transformation and subsequent plasmid
purification. The E. coli competent cell line DH5α (50 µl) was mixed with the plasmid
(10 µl if a ligation product, 1 µl if a miniprep product) for 30 min in ice. Cells were then
heat-shocked for 45 sec at 42°C, returned to ice for 1 min, added with 200 µl of LB
medium (Appendix B) and left to recover by shaking for 45 min at 37°C. An aliquot of the
transformed bacteria was then spread on an LB agar (Appendix B) plate containing
100 µg/ml ampicillin and allowed to grow overnight at 37°C.
When the plasmid pGEM-T Easy (Promega) was used, a preliminary blue-white colony
screening was performed to confirm the presence of the target gene(s). Insertion of a
fragment into this plasmid disrupts the LacZ gene and stops the production of the encoded
β-galactosidase. When cells are plated on agarose containing 40 µl of 5-bromo-4-chloro-3-
indolyl-β-D-galactopyranoside (X-Gal, 2% w/v, a chromogenic substrate of the enzyme)
and 100 µl of 0.1 M isopropyl-β-D-1-thiogalactopyranoside (IPTG, which induces the
system by inactivating the LacZ repressor), if the insert is present the X-Gal remains
unmetabolised and the colony appears white, while in the absence of insert X-Gal is
cleaved to a blue product.
Single colonies were cultured in LB plus ampicillin (100 µg/ml) by shaking overnight at
37°C. Bacteria were collected by centrifugation (4,500×g, 10 min) and the plasmidic DNA
was purified using the QIAprep Spin Miniprep Kit (Qiagen) according to the
manufacturer’s instructions.

Federica Giordani, 2010 Chapter 2, 60
2.7.5 Trypanosome transfection
Before transfection, vectors pMB-G94 and pMB-G95 were linearised, sterilised and
concentrated. Linearisation was obtained by digesting at the unique NotI site overnight at
37°C. The reaction (300 µl total volume) was prepared by mixing a large amount of
purified vector (>50 µg) with 1× buffer D (Promega), 0.1 mg/ml BSA and 2.5 U NotI/µg
of vector (Promega). After checking for complete digest by 0.8% agarose gel
electrophoresis, the restriction enzyme was heat-inactivated at 65°C for 20 min. The whole
digest product was then loaded on an agarose gel and purified by gel extraction using the
QiAquick Gel Extraction Kit (Qiagen). Vectors were allowed to precipitate in 2 volumes of
100% cold EtOH and 1/10 volume of 3 M sodium acetate (pH 5), for at least 2 h at -80°C.
After washing in 1 ml of 70% EtOH, the pelleted constructs were left to air-dry for 30 min
under a sterile hood and then resuspended in sterile water (20 µl). Samples were heated 30
min at 37°C and other 20 min at 65°C to help solubilisation. After concentration, the
linearised vectors were checked again by 0.8% agarose gel electrophoresis.
For transfection, 1×10⁷ cells from a mid-log phase culture (1-2×10⁶ cells/ml) were pelleted
and resuspended in 100 µl Amaxa Human T-cell buffer (Lonza Group Ltd.) at 4°C, mixed
with 10 µg of linearised vector and immediately put into a cuvette for nucleofection.
Program X-001 of the Amaxa Nucleofector® II Device (Lonza Group Ltd.) was used.
Transfected parasites were then put into 20 ml of pre-warmed, complete HMI-9 and left to
recover overnight at 37°C. The day after, cells were cloned by limiting dilution in 96-well
plates in the presence of the selective drug (hygromycin, 5 µg/ml). All clones obtained
were then maintained in culture flasks with 10 µg/ml of hygromycin (Clayton et al., 2005).
2.7.6 Southern blot
2.7.6.1 gDNA preparation and capillary transfer to membrane
Southern blot analysis was performed to study the integration of linearised pMB-G94 and
pMB-G95 vectors into the non-transcribed rRNA spacers (Chapter 6). Genomic DNA
(6 µg) obtained by phenol-chloroform extraction (Section 2.7.1) from 449 cell line and two
derived clones was digested with seven different restriction enzymes (PstI, HindIII, StuI,
BglII, NcoI, XhoI, SpeI, all from Promega). Each reaction was performed in a total volume
of 60 µl containing the gDNA, 0.1 mg/ml BSA (Promega), 1× specific enzyme buffer

Federica Giordani, 2010 Chapter 2, 61
(Promega) and 5 U of each enzyme/µg of gDNA (a second aliquot of enzyme was added 2
h after the set up of the restriction digest). The reactions were carried out overnight at 37°C
and the day after another aliquot of enzyme was eventually added if digests had proven
incomplete (as visualised by running 2 µl of each sample on a 1% agarose gel). Digested
gDNA was then loaded on a 0.7% agarose gel and run at low voltage (40 V) for more than
12 h in 1× TAE buffer (Appendix B) to allow improved separation of DNA fragments.
To prepare the gel for blotting, it was first soaked in 500 ml of depurination solution, to
depurinate DNA (twice for 7 min), then in a denaturation solution, to denature the nucleic
acids (twice for 15 min) and finally in a neutralisation solution (twice for 15 min) to re-
equilibrate the pH to 7.4 (Appendix C). The gDNA fragments were transferred overnight
to a neutral nylon HybondTM-N membrane (GE Healthcare) through upward capillary
transfer in 20× SSC (Appendix C) as described by Sambrook and Russell (Sambrook and
Russell, 2001). After a brief wash in 6× SSC, the membrane was exposed to UV irradiation
to immobilise the DNA onto it by cross-linking, and stored at 4°C until hybridization with
radiolabeled probes.
2.7.6.2 Preparation of radiolabeled probes
The whole ORFs of TbAT1 and mCherry were used as probes. The two genes were cleaved
from vector pMB-G94 by restriction digest, separated on a 1% agarose gel and purified.
Radioactive labelling was carried out using the Prime-It II Random Labeling Kit
(Stratagene) following the manufacturer’s instructions. Briefly, 25 ng of probe DNA were
mixed with 10 µl of random oligo primers in a final volume of 37 µl in water. The solution
was heated for 5 min at 95°C before addition of 10 µl of 5× buffer, 2 µl deoxyadenosine
5’-triphosphate [α-32P] (PerkinElmer) and 1µl Exo(-)Klenow (5 U/µl). The radionucleotide
incorporation reaction was incubated for 10 min at 38°C and then stopped by addition of 2
µl of Stop mix. Radiolabelled probes were successively purified by eluting through an
illustra MicroSpinTM S-200 HR Columns (GE Healthcare). Before addition to the bottle
containing the membrane soaked in prehybridisation solution (Section 2.7.6.3), probes
were denatured for 5 min at 95°C.
2.7.6.3 Blot hybridisation and autoradiography
Before probing, the membrane was prehybridised in a roller bottle with 15 ml
prehybridisation solution (Appendix C) for at least 2 h at 42°C. Herring Sperm DNA

Federica Giordani, 2010 Chapter 2, 62
(200 µg/ml) (Promega) was added to the solution after denaturation for 5 min at 95°C.
Boiled radiolabeled probe was added to the hybridisation solution and incubated with the
membrane for at least 16 h at 42°C. The blot was then washed with a low stringency
washing solution (0.3× SSC, 0.1% SDS) twice at r. t. and a further twice at 50°C (for 20
and 45 min respectively). Finally, the filter was covered with an X-ray film (Kodak) and
left at -80°C. The film was exposed for the appropriate length of time in order to obtain
clear bands and finally developed using the X-OMAT SRX-101A film processor (Konica
Minolta).
2.7.6.4 Removal of hybridised probe from membrane
To remove the probe from the membrane in order to reprobe it with another
oligonucleotide, the blot was first soaked for 30 min at 42°C in a stripping solution (0.4 M
NaOH) and then washed for another 30 min at 42°C with a washing solution at pH 7.6
(Appendix C). To check for complete removal of bound probe the membrane was exposed
to an X-ray film as described before (Section 2.7.6.3).
2.7.7 Protein extraction from trypanosomes
2.7.7.1 Total cell lysates
For total protein extraction from trypanosomes, cells (5×10⁷ cells/ml) were first washed in
STEN buffer (Appendix D) by spinning at 2,500×g for 10 min at 4°C. The pellet was then
resuspended in PBS containing 1× complete protease inhibitor cocktail (Roche), in order to
have 1×10⁷ cells/ml per 10 µl of solution. The suspension was added with an equal volume
of 2× Laemmli buffer (Appendix D) and thoroughly mixed by pipetting. If samples
resulted too viscous, they were passed thorough a syringe several times using a 0.45 × 16
mm needle. Samples were then heated at 65°C for 5 min before spinning at full speed for 1
min to separate supernatant from cell debris and finally stored at -20°C until use.
2.7.7.2 Preparation of protein-enriched fractions
To prepare protein-enriched fractions, 5×10⁸ cells were harvested by centrifugation at
1300×g for 10 min at 4ºC and washed once in ice-cold PBS. The resulting pellet was
resuspended in 2 ml of ice-cold 1% Triton X-114 in 1× PBS, containing 1× complete
protease inhibitor cocktail (Roche). The solution was stirred vigorously on ice for 90 min,

Federica Giordani, 2010 Chapter 2, 63
after which a 200 µl aliquot was collected and immediately frozen at -20ºC (total lysis
sample). The remainder was centrifuged twice at 40,000×g for 30 min at 4ºC to precipitate
the detergent insoluble fraction. The obtained supernatant was incubated for 10 min at
30ºC and then spun at 5,000×g for 20 min at 30ºC, without using the brake during
deceleration, to separate the upper aqueous from the detergent-organic phase. Both
fractions were put in ice and returned to a volume of 2 ml by adding ice-cold 1× PBS to the
detergent phase and ice-cold 10% Triton X-114 in 1× PBS to the aqueous phase for
washing. Samples were first vigorously stirred on ice for 60 min and then incubated 10 min
at 30ºC. After centrifugation at 5,000×g for 20 min at 30ºC, the aqueous wash was
separated from the original detergent phase and the detergent phase from the original
aqueous phase and discarded. Samples were stored frozen at -20ºC until analysis by SDS-
PAGE.
2.7.8 Protein quantification
Protein concentration was determined by the Bradford method using the Bio-Rad Protein
Assay (Bio-Rad Laboratories). A small amount of sample (usually 1 µl) was mixed with
200 µl of Bio-Rad dye reagent and 1× PBS (to a total volume of 1 ml) in a 1 cm disposable
cuvette. The solution was incubated at room temperature for 30 min to allow colour change
of the dye in response to the concentration of protein in the sample. Absorbance (OD) was
then determined using a Spectronic Helios-Gamma spectrophotometer (Thermo Fisher
Scientific) set at 595 nm and corrected for “blank” (reagent plus buffer). Experimental
OD595 were finally plotted versus concentration of standards, measured for bovine serum
albumin (Sigma-Aldrich), and unknowns were extrapolated.
2.7.9 SDS-PAGE
Protein samples (usually 25 µg) were separated by sodium dodecyl sulfate polyacrylamide
gel electrophoresis. Gels (0.75 mm thick) were prepared using 10% polyacrylamide for the
running gel and 3% for the stacking gel (Appendix D). Before loading, protein-enriched
fractions were added of Laemmli buffer (5 µl of buffer added to 20 µl of sample) and then
boiled at 65°C for 5 min. Total protein extracts and prestained protein marker (New
England Biolabs Inc.) were also denatured at the same temperature just before loading.
Gels were run at 50-70 V for a few hours in 1× running buffer (Appendix D) and then
immediately used for Western analysis. After electrophoretic blotting, gels were eventually

Federica Giordani, 2010 Chapter 2, 64
stained with a Coomassie Brilliant Blue solution (Appendix D) to check for transfer
efficiency.
2.7.10 Western blot
Samples separated by SDS-PAGE were transferred onto an Amersham HybondTM-ECL
nitrocellulose membrane (GE Healthcare) by electrophoretic transfer. Once the
electrophoretic block was assembled (membrane placed on the side of the gel facing the
anode), immunoblotting was performed at a constant voltage (0.1 Amp, for 4 h at 4°C) in
1× transfer buffer (Appendix D). To optimise protein transfer, a Tris-glycine buffer
without MeOH was used (Small et al., 1988). The membrane was then blocked for at least
1 h at r.t. in 40 ml 1× PBS containing 0.05% Tween-20 (PBS-T) and 5% powdered milk
(Marvel). After three washes with 0.05% PBS-T (15 min each, at r.t.), the blot was
incubated overnight at 4ºC with the Living Colors® DsRed monoclonal primary antibody
(Clontech Laboratories) prepared at a 1:250 dilution in 0.01% PBS-T containing 5% milk.
Membrane was then washed thoroughly in 0.05% PBS-T to remove unbound or excess
antibodies, and successively incubated (for 3 h at 4°C) with a goat anti-mouse IgG
peroxidase conjugate secondary antibody (Calbiochem) at 1:2,000 dilution in blocking
solution (0.05% PBS-T containing 5% milk). After 3 further washes in 0.05% PBS-T (15
min per wash) to remove excess antibodies, protein detection was carried out using the
chemiluminescent SuperSignal® HPR Substrate kit (Novagen). After the blot was coated
with an appropriate quantity of reagent and put into a cassette, a film (Amersham
Hyperfilm ECL, GE Healthcare) was exposed to the chemiluminescent signal for the time
needed to obtain clear bands. Films were developed using the X-OMAT SRX-101A film
processor (Konica Minolta).
2.8 Chemical synthesis: general experimental detail s
All reactions described in Chapter 5 were carried out in oven-dried glassware and under an
inert atmosphere, unless otherwise stated. Starting materials and reagents were obtained
from commercial sources (Sigma-Aldrich, Alfa Aesar) and used as received without
further purification. All solvents were of reagent grade and distilled or dried, if needed,
before use. Purification by flash column chromatography was carried out using Matrex
Silica 60Ǻ silica gel, mesh size 35-70 µm (Thermo Fisher Scientific Inc.) as the stationary
phase. Thin layer chromatography was performed using aluminium backed plates pre-
coated with silica gel 60 (UV254) (Macherey-Nagel) and visualised by staining with

Federica Giordani, 2010 Chapter 2, 65
KMnO4. 1H NMR and 13C NMR spectra were recorded on a DPX 400 spectrometer
(Bruker). Chemical shifts (δ) are given in ppm relative to tetramethylsilane, used as
internal standard. All NMR J values are given in Hz. IR spectra were recorded using
sodium chloride plates on a FT/IR 410 spectrometer (JASCO). Samples for IR analysis
were used neat or prepared as KBr disks. Mass spectra were recorded on a JMS-700
spectrometer (JEOL). Optical rotations were determined as solutions irradiating with the
sodium D line (λ=589 nm) using an AA series Automatic Polarimeter. [α]D values are
given in units 10-1 degcm2 g-1. Melting point of compound FG10 was measured using a
Gallenkamp apparatus.

3
Fluorescence-based diagnostic tests
involving the UV fluorescent diamidine DB75
Federica Giordani, 2010 Chapter 3, 67
3.1 Introduction
3.1.1 DB75
DB75 (furamidine, [2,5-bis(4-amidinophenyl)furan], Figure 3.1) is a diphenyl-diamidine
compound extremely active against human African trypanosomes (Boykin, 2002; Mathis et
al., 2006; Thuita et al., 2008) and Plasmodium species (Yeramian et al., 2005) both in
vitro and in vivo. Its oral prodrug DB289 [2,5-bis(4-amidinophenyl)furan-bis-O-
methylamidoxime] had reached phase III clinical trials for treatment of HAT early stage,
before being dismissed for excessive toxicity in volunteers during a retrospective phase I
trial, dosing for 14 days at 100 mg twice daily (Thuita et al., 2008; Wenzler et al., 2009).
DB75, like several other compounds of the DB-series of heterocyclic diamidines, is
fluorescent (Wilson et al., 2005; Mathis et al., 2006 and 2007), with λEX=356 nm and
λEM=458 nm (Mathis et al., 2007). It quickly accumulates at millimolar levels inside
trypanosomes, where it concentrates in the DNA-containing organelles: within minutes of
incubation with the fluorophore the nucleus shows a bright blue fluorescence, while the
kinetoplast can appear with a white-yellow colour when 330-380 nm excitation and ≥420
nm emission wavelengths are used (Mathis et al., 2006). With same filter set, Mathis and
collaborators found that at later time points (after 2 h) trypanosomes from mice treated
with DB75 (7.5 µmol/kg) also demonstrated a yellow fluorescence in other cytoplasmic
organelles, believed to be acidocalcisomes (Mathis et al., 2006). Like other diamidines,
DB75 uptake is mostly dependent on the P2 amino-purine transporter, but a secondary,
slow route of internalisation must exist, since trypanosomes lacking this transporter retain
some sensitivity to the drug (Lanteri et al., 2006). Molecules belonging to this class of
compounds bind to the DNA minor groove at AT-rich sites, which are abundant in the
minicircles of the kinetoplast DNA, where AT sequences reach 70-75% of the total
(Wilson et al., 2005; Liu et al., 2007; Mathis et al., 2007). The high affinity for DNA has
been suggested as a possible cause for the biological activity of dications as DB75, which
can induce DNA structure instability or interfere with DNA-targeted proteins, such as the
mitochondrial topoisomerase II (Shapiro and Englund, 1990; Wilson et al., 2005). The
finding of other organelles (identified as acidocalcisomes) targeted by the drug, though,
may indicate different additional mechanisms of action for DB75 (Mathis et al., 2007).
Moreover, the fact that akinetoplastic (i.e. without kDNA) Trypanosoma evansi (an animal
pathogenic species) are also susceptible to diamidines might render the kinetoplast an
unlikely target (Gillingwater et al., 2009).

Federica Giordani, 2010 Chapter 3, 68
NH2
NH
O
NH
NH2DB75NH2
NHNH
NH2
NH
DAPINH2
NH
O
NH
NH2DB75NH2
NHNH
NH2
NH
DAPI Figure 3.1 – Chemical structure of DB75 and DAPI.
Despite its disappointing failure as a trypanocidal drug, DB75 could still have other
applications as a fluorescent marker. Since this compound enters predominantly via the P2
transporter it can, for example, be used to discriminate wild type trypanosomes from drug-
resistant parasites, which have lost the P2 transporter, in the arsenical drug resistance test
(Stewart et al., 2005; Lanteri et al., 2006). Another option would be to use DB75 as a more
general fluorescent DNA marker for trypanosomes or any cell type, both for research and
diagnostic purposes. Thanks to its cost-efficient synthesis (Gillingwater et al., 2009), this
compound could represent a valid alternative to the widely used, but expensive (~£10 for 1
mg from Sigma-Aldrich) DAPI, another diamidine with very similar fluorescent properties
(Kapuscinski, 1995). Both these aspects were investigated.
3.1.2 DAPI
DAPI, [4’,6-diamidino-2-phenylindole] (Figure 3.1), is a widely used, DNA-specific,
fluorescent stain, initially synthesised during the search for new trypanocidal agents
(Kapuscinski, 1995). As DB75, this fluorophore is a UV-excited dication which binds to
DNA in a sequence-dependent way, even though the interactions between this compound
and the double helix of DNA seem to be more complex than for DB75. DAPI attaches
strongly to the minor groove at AT sites, but it also seems to intercalate between the GC
base pairs of DNA (Banerjee and Pal, 2008) and at AU sites of RNA (Tanious et al.,
1992). DAPI-DNA complexes involving GC sequences inside the major groove have also
been suggested (Kim et al., 1993). Upon binding to DNA, the maximum excitation
wavelength of DAPI is red-shifted from 347 nm to 363 nm (bathochromic effect), while
the emission has a hypsochromic shift (from 453 nm to 448 nm) and its quantum yield
increases more than 20-fold compared to the unbound dye (Kapuscinski, 1990 and 1995).
DB75 fluorescence intensity, instead, was found to decrease by 17% in the presence of
DNA (Mathis et al., 2007). DAPI is known to have good trypanocidal activity (Borowy et
al., 1985; Lanteri et al., 2006). A study carried out by Bridges and collaborators showed
that this compound has high affinity for all of the three pentamidine transporters of T. b.

Federica Giordani, 2010 Chapter 3, 69
brucei (TbAT1/P2, HAPT1 -high affinity pentamidine transporter- and LAPT1 -low
affinity pentamidine transporter-) (Bridges et al., 2007). These authors showed that
fluorescence in S427 wild type cells treated with 10 µM of the compound was already
visible after 5 minutes of incubation. Loss of P2 had no significant effects on DAPI
internalisation, while additional absence of HAPT increased significantly the time of
fluorescence development inside the cells.
3.1.3 Fluorophore photobleaching
Photostability of a fluorochrome is a major issue in fluorescence microscopy. A specific
dye must have a relatively long half-life in order to allow acquisition of well-defined
images over an extended period of time of exposure under the excitation source.
Unfortunately, the most commonly used dyes suffer from photobleaching, a process that
causes the photochemical decomposition of the fluorophore especially when exposed under
optimal conditions (Petty, 2007). This phenomenon depends on many factors such as the
environment, the concentration of the fluorophore and the excitation conditions
(Widengren et al., 2007). The mechanisms of this complex process are still poorly
understood, but it seems that loss of signal is due to a process of photo-oxidation and
photoionisation, involved in the formation of reactive radical species of the excited state of
the fluorophore (Widengren et al., 2007; Vogelsang et al., 2008). Apart from reducing
illumination levels and time of exposure, three methods are routinely used, often in
combination, to retard dye photobleaching: (1) removal of oxygen from the mounting
medium, (2) increasing the viscosity of the mounting medium to retard oxygen diffusion or
(3) the use of an antifading reagent (Johnson et al., 1982; Ono et al., 2001; Vogelsang et
al., 2008). There are several mounting media that can be added to retard bleaching (Valnes
and Brandtzaeg, 1985; Longin et al., 1993; Florijn et al., 1995; Ono et al., 2001). They
include antioxidant and triplet state quenchers that act as radical scavengers (Widengren et
al., 2007). Most of them, despite retarding fading, have the drawback of reducing
fluorescence intensity, especially when used at high concentrations (Valnes and
Brandtzaeg, 1985; Longin et al., 1993; Widengren et al., 2007).
During our experiments, the use of DB75 for fluorescent staining of trypanosomes showed
a fast photobleaching, especially under certain conditions. Therefore, efforts were made to
decrease this effect by the use of homemade mounting media. Since different antifading
agents vary in efficacy in increasing photostability in a dye-specific manner, three different
antioxidant compounds were tested: n-propyl gallate [3,4,5-trihydroxybenzoic acid propyl

Federica Giordani, 2010 Chapter 3, 70
ester], DABCO [1,4-diazobicyclo-(2,2,2)-octane] and Trolox [6-hydroxy-2,5,7,8-
tetramethylchroman-2-carboxylic acid]. n-Propyl gallate is a well known antioxidant that
acts as an electron donor to reduce a damaged fluorophore back to its fluorescent state
(Widengren et al., 2007). DABCO is another cheap antifading agent, usually used to retard
bleaching of FITC or DAPI (Johnson et al., 1982; Florijn et al., 1995). Both are widely
utilised for mounting of fixed specimens. Trolox, finally, is a cell-permeable, water soluble
derivative of vitamin E that has been used to recover photoionized fluorophores and to
remove singlet oxygen (Rasnik et al., 2006; Vogelsang et al., 2008). This strong
antioxidant is easily applicable also to living specimens.
3.1.4 Arsenical drug resistance test
Arsenical drug resistance has always represented a major issue in the history of African
trypanosomiasis (Ollivier and Legros, 2001; Delespaux and de Koning, 2007). Recently,
this phenomenon has been indicated as an important cause for the increasing number of
relapses following melarsoprol treatment in patients infected with T. b. gambiense (Matovu
et al., 2001a; Kazibwe et al., 2009). Causes of decreased sensitivity of parasites to
trypanocidal compounds are still unclear. They could involve various mechanisms
including decreased drug import or increased drug export, compound sequestration or
inactivation inside parasites, or decreased affinity for the target (Borst and Ouellette, 1995;
Barrett and Fairlamb, 1999). Melarsoprol can enter the cells through passive diffusion, but
high levels of uptake into trypanosomes involve internalisation of melarsoprol’s in vivo
metabolite, melarsen oxide, through one of trypanosome’s adenosine transporters called P2
(Mäser et al., 1999). Low resistance to the drug was obtained in vitro by knocking down
the TbAT1 gene that encodes for this transporter (Matovu et al., 2003). Higher resistance
levels were achieved when the HAPT1 (high affinity pentamidine transporter) activity was
also eliminated (Bridges et al., 2007). Loss of TbAT1 gene function can also arise as a
consequence of mutations in its sequence, rather than complete loss of the whole ORF, and
also when stable expression of the gene is lost (Stewart et al., 2010). These findings have
been partially confirmed in field isolates, which presented with a similar pattern of
mutations in the TbAT1 ORF (Mäser et al., 1999; Matovu et al., 2001a). Molecular biology
methods such as the PCR/SfaNI RFLP have been described for identification of
melarsoprol-resistant strains in field isolates (Mäser et al., 1999; Matovu et al., 2001b;
Kazibwe et al., 2009), but this approach is not able to identify all resistant strains, since
some present with a wild type sequence of the TbAT1 gene (Stewart et al., 2010). The
design and introduction of similar tests, able to identify melarsoprol-resistant parasites,

Federica Giordani, 2010 Chapter 3, 71
would be extremely useful in chemotherapeutic decision making and for disease
management.
The rapid and easy arsenical resistance assay developed in our laboratory (Stewart et al.,
2005) could represent a useful option. This assay is able to identify the altered activity of
the P2 transporter in resistant strains, regardless of the genetic changes to TbAT1, by the
diminished uptake of a fluorescent substrate. The original compound used in the test was
the diamidine DB99 [2,5-bis(4-amidinophenyl)-3,4-dimethylfuran], which, like other
diamidines, is mainly internalised by P2. Being intrinsically fluorescent, DB99
accumulation in DNA-containing organelles can be monitored under a standard fluorescent
microscope (λEX=330 nm, λEM=400 nm) and its signal used to discriminate between
sensitive and resistant strains, since only wild type cells develop fluorescence within 1
minute of incubation. For longer treatment times other routes of entry for diamidines may
contribute to the internalisation of the fluorophore inside resistant parasites, thus making
distinction between resistant and sensitive strains less certain (Lanteri et al., 2006).
The fluorescent test could prove useful for arsenical drug resistance identification in
reference laboratories of endemic countries and the use of a simple and robust LED-
illuminated microscope could make it readily applicable. The Cytoscience LED
microscope currently available (Jones et al., 2007) does not work in the UV spectrum (it
being fitted with a higher wavelength emitting LED and filter set, Section 1.7) and can not
excite fluorophores in the range needed for DB99. Therefore, Prof. D. Jones (Philipps
University, Marburg) developed a new microscope prototype, comprising a simple white
light bench microscope, equipped with a UV LED light source (λEX=365 nm) with a
suitable filter set and a digital camera, fitted directly inside one of the eyepieces for image
acquisition (Figure 3.6). The efficiency of this new microscope was evaluated on
trypanosomes from culture and in infected rat blood after treatment with two different
diamidines: DB75 and DAPI (both having similar fluorescent characteristics as DB99).
The feasibility of the arsenical drug resistance test using this LED light source to excite
DB75-stained T. b. brucei cells was also tested, as previously done by other authors with a
conventional fluorescence microscope (Stewart et al., 2005; Lanteri et al., 2006).

Federica Giordani, 2010 Chapter 3, 72
3.2 Results
3.2.1 DB75 fluorescence in in vitro trypanosomes
DB75 is excited under a UV light source (λEX and λEM for this compound are, respectively,
356 and 458 nm) and it stains the DNA-containing organelles (nucleus and kinetoplast) in
a very similar way to another nucleic acid-targeting dye, DAPI. For DB75, though, the
kinetoplast always appeared as the brightest and most easily detectable organelle under the
DAPI filter of our Zeiss Axioplan epifluorescence microscope. When live, wild type, in
vitro-cultured trypanosomes (S427) were treated with 10 µM DB75, 15-30 minutes were
needed to obtain a good signal inside the nucleus and the kinetoplast. Incubation at 37°C,
instead of room temperature, accelerated uptake, consistent with the transport-mediated
model for internalisation of the compound (Lanteri et al., 2006). This fluorescence pattern
(nucleus plus kinetoplast) was maintained for long incubation times: treatment of wild type
cells with 500 nM DB75 showed no changes in cell distribution up to 24 hours, when, in a
high number of trypanosomes, the kinetoplast was no longer visible (Figure 3.2). This is in
agreement with previous observations that ascribed this effect to the toxic mechanism of
action of diamidines (i.e. disintegration of the kinetoplast, possibly due to an inability to
replicate) (Mathis et al., 2006). At this time point (24 h) also in many trypanosomes treated
with the same concentration of DAPI the kinetoplast was no more detectable (Figure 3.2).
3.2.2 DB75 fluorescence in ex-vivo trypanosomes
DB75 UV fluorescence development in ex-vivo trypanosomes (i.e. trypanosomes in rodent
blood) was always much faster than in cells from culture: 1-5 minutes exposure to 10 µM
of the dye were sufficient for staining ex-vivo samples, the shortest times needed when
cells were incubated at 37°C instead of room temperature. This difference can be explained
by the significant in vitro downregulation of the activity of the P2 amino-purine transporter
(the permease mainly responsible for DB75 uptake) compared to cells grown in vivo (Pui
Ee Wong, unpublished; Chapter 6).
For air-dried fixed blood films a lower concentration of the dye (3 µM) was sufficient to
obtain a bright fluorescence. In these preparations white blood cells were also highly
fluorescent and, for red blood cells, “halos” appear on the background (Figure 3.3). On the
other hand, fluorescence of white blood cells was low in wet blood preparations (up to 2 h

Federica Giordani, 2010 Chapter 3, 73
Figure 3.2 – DB75 and DAPI fluorescence acquisition in live, in vitro trypanosomes. T. b. brucei S427 w.t. parasites were treated with 0.5 µµµµM of either fluorophore at 37°C. At the indicated time points an aliquot of culture contain ing live cells was washed, spread on a slide with a coverslip and directly viewed under th e Zeiss fluorescence microscope (DAPI filter). DAPI 33 ms exposure; 40× objective. *: kinetoplast; ►: nucleus. Bar: 10 µµµµm.
Figure 3.3 – DB75 fluorescence in fixed and fresh i nfected murine blood samples. (A) DB75 staining (3 µµµµM, r.t.) of air-dried, fixed thin blood films was n early immediate. In these preparations the kinetoplast and nucleus of t rypanosomes ( T. b. brucei S427 w.t.) were clearly visible on a blue background of red bl ood cells, but also the white blood cells DNA was highly fluorescent under DAPI filter set. (B) In wet blood films the cell membrane integrity ensured specific staining of DB75 (10 µµµµM, r.t., 30 min), with wild type parasites accumulatin g the fluorophore at higher rates than white blood cells. Note that live trypanosomes in the wet specimen (B) moved during acquisition of the fluorescence and bright field images. DAPI 33 ms exposure; 40× objective. →: white blood cell. Bar: 10 µµµµm.

Federica Giordani, 2010 Chapter 3, 74
incubation), consistent with the selective high level of DB75 uptake by the trypanosome P2
transporter. Studies carried out in our laboratory, nevertheless, have shown that DB75 can
be internalised into various living human cell lines, with time needed for visible
fluorescence to develop depending on the cell line and varying from 15 minutes to several
hours (Chris Ward, personal communication).
3.2.3 DB75 photobleaching
The bright UV fluorescence of DB75 made this diamidine a very interesting DNA probe
for trypanosomes (both in fixed and live specimens) and, eventually, also for other cell
lines (at least in fixed samples, where the cell membrane integrity is lost and the DNA is
freely accessible to the dye). Nevertheless, a key drawback was observed during testing of
this fluorophore: the dye suffered a fast photobleaching, especially under certain
conditions. In wet preparations of living cells from culture and also in methanol-fixed and
successively stained specimens, DB75 UV fluorescence was very unstable, hampering cell
viewing and image acquisition, in particular at high magnification. Fading of the
compound in live trypanosomes in blood samples, instead, was less marked compared to
wet or fixed slides prepared from culture (as already observed by Mathis et al., 2007). Air-
dried blood films stained with the fluorochrome also showed a more stable signal when
observed upon low magnification (40× objective).
3.2.3.1 DB75 and DAPI photobleaching quantification
To quantitatively compare DB75 fluorescence stability to that of the widely used DNA
marker DAPI, fading of both fluorophores bound to DNA was measured on methanol-
fixed cells stained with 3 µM of either compound and exposed to UV light (Section 2.5.5).
Results showed a clear difference between the photobleaching of the two fluorochromes
(Figure 3.4). Under our experimental conditions DAPI lost 50% of its fluorescence within
90.8 seconds of continuous illumination, following a single phase decay pattern. The curve
did not reach values close to zero because of a small percentage of cells (around 10%) that
appeared to be over-stained (due to variation in staining intensities of individual cells) and
faded in a lower, more linear way. Previous work had found faster times for DAPI fading
(Gallardo-Escárate et al., 2007), with loss of half of its fluorescence intensity after only 20
seconds of continuous illumination, but differences in sample preparation and illumination
and cell type do not allow direct comparison with this previous study. Under the same
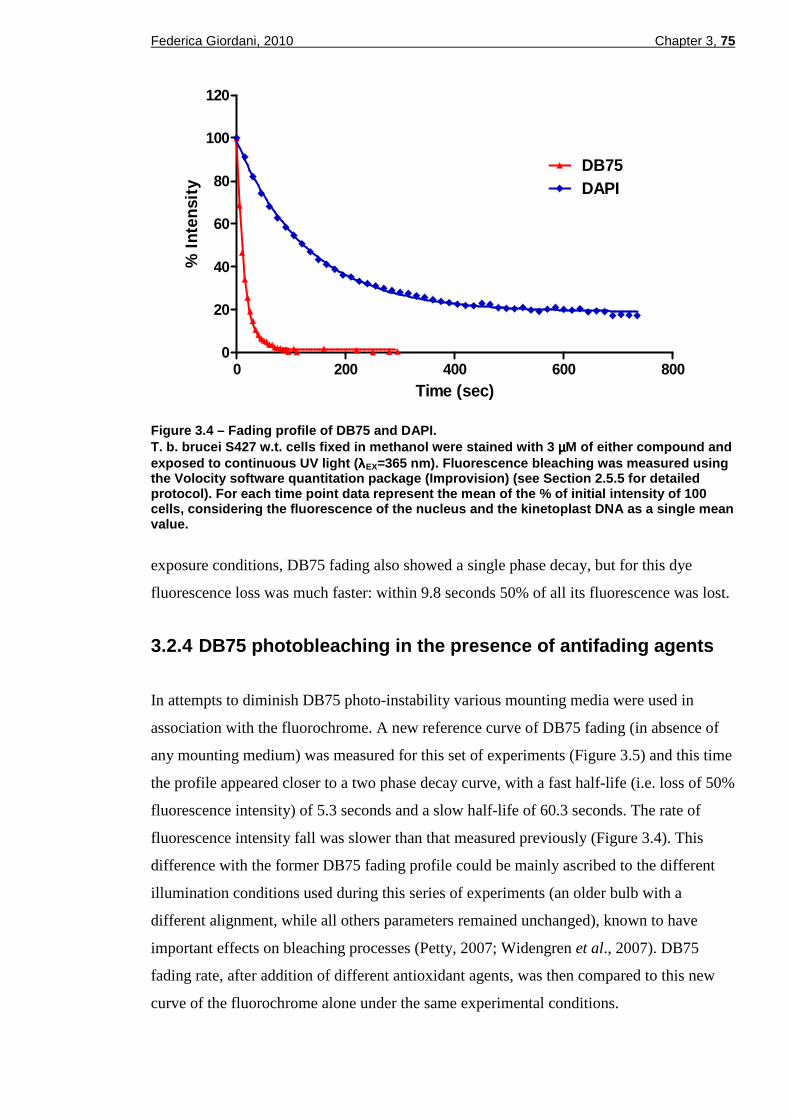
Federica Giordani, 2010 Chapter 3, 75
0 200 400 600 8000
20
40
60
80
100
120
DB75DAPI
Time (sec)
% I
nten
sity
Figure 3.4 – Fading profile of DB75 and DAPI. T. b. brucei S427 w.t. cells fixed in methanol were stained wit h 3 µµµµM of either compound and exposed to continuous UV light ( λλλλEX=365 nm). Fluorescence bleaching was measured using the Volocity software quantitation package (Improvi sion) (see Section 2.5.5 for detailed protocol). For each time point data represent the m ean of the % of initial intensity of 100 cells, considering the fluorescence of the nucleus and the kinetoplast DNA as a single mean value.
exposure conditions, DB75 fading also showed a single phase decay, but for this dye
fluorescence loss was much faster: within 9.8 seconds 50% of all its fluorescence was lost.
3.2.4 DB75 photobleaching in the presence of antifa ding agents
In attempts to diminish DB75 photo-instability various mounting media were used in
association with the fluorochrome. A new reference curve of DB75 fading (in absence of
any mounting medium) was measured for this set of experiments (Figure 3.5) and this time
the profile appeared closer to a two phase decay curve, with a fast half-life (i.e. loss of 50%
fluorescence intensity) of 5.3 seconds and a slow half-life of 60.3 seconds. The rate of
fluorescence intensity fall was slower than that measured previously (Figure 3.4). This
difference with the former DB75 fading profile could be mainly ascribed to the different
illumination conditions used during this series of experiments (an older bulb with a
different alignment, while all others parameters remained unchanged), known to have
important effects on bleaching processes (Petty, 2007; Widengren et al., 2007). DB75
fading rate, after addition of different antioxidant agents, was then compared to this new
curve of the fluorochrome alone under the same experimental conditions.
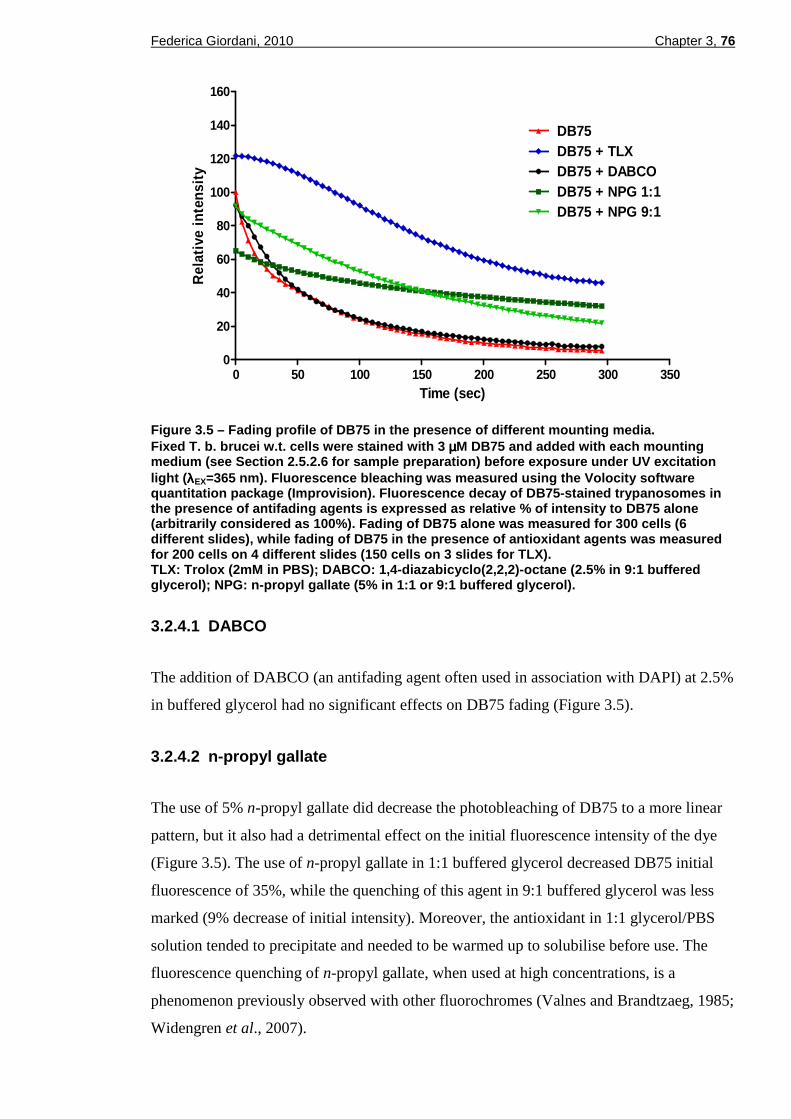
Federica Giordani, 2010 Chapter 3, 76
0 50 100 150 200 250 300 3500
20
40
60
80
100
120
140
160
DB75DB75 + TLXDB75 + DABCODB75 + NPG 1:1DB75 + NPG 9:1
Time (sec)
Rel
ativ
e in
tens
ity
Figure 3.5 – Fading profile of DB75 in the presence of different mounting media. Fixed T. b. brucei w.t. cells were stained with 3 µµµµM DB75 and added with each mounting medium (see Section 2.5.2.6 for sample preparation) before exposure under UV excitation light ( λλλλEX=365 nm). Fluorescence bleaching was measured using the Volocity software quantitation package (Improvision). Fluorescence de cay of DB75-stained trypanosomes in the presence of antifading agents is expressed as r elative % of intensity to DB75 alone (arbitrarily considered as 100%). Fading of DB75 al one was measured for 300 cells (6 different slides), while fading of DB75 in the pres ence of antioxidant agents was measured for 200 cells on 4 different slides (150 cells on 3 slides for TLX). TLX: Trolox (2mM in PBS); DABCO: 1,4-diazabicyclo(2 ,2,2)-octane (2.5% in 9:1 buffered glycerol); NPG: n-propyl gallate (5% in 1:1 or 9:1 buffered glycerol ).
3.2.4.1 DABCO
The addition of DABCO (an antifading agent often used in association with DAPI) at 2.5%
in buffered glycerol had no significant effects on DB75 fading (Figure 3.5).
3.2.4.2 n-propyl gallate
The use of 5% n-propyl gallate did decrease the photobleaching of DB75 to a more linear
pattern, but it also had a detrimental effect on the initial fluorescence intensity of the dye
(Figure 3.5). The use of n-propyl gallate in 1:1 buffered glycerol decreased DB75 initial
fluorescence of 35%, while the quenching of this agent in 9:1 buffered glycerol was less
marked (9% decrease of initial intensity). Moreover, the antioxidant in 1:1 glycerol/PBS
solution tended to precipitate and needed to be warmed up to solubilise before use. The
fluorescence quenching of n-propyl gallate, when used at high concentrations, is a
phenomenon previously observed with other fluorochromes (Valnes and Brandtzaeg, 1985;
Widengren et al., 2007).

Federica Giordani, 2010 Chapter 3, 77
3.2.4.3 Trolox
Unlike n-propyl gallate, addition of 2 mM Trolox in PBS enhanced the overall intensity of
DB75 (22% increase in initial intensity) and consequently retarded the photobleaching
yielding a sigmoidal curve (Figure 3.5). This fading profile was only obtained using a
Trolox solution that had already turned to a yellowish colour (due, possibly, to partial
oxidation). When a freshly made solution of Trolox was used, it still enhanced initial DB75
fluorescence intensity, but this initial emission increase was followed by a fast, single
phase decay similar to that measured for DB75 alone (data not shown). The positive effect
of Trolox on DB75 fading was confirmed during experiments using living cells, although
in these conditions it was not possible to determine the effect of this antioxidant
quantitatively, due to fast cell movement.
3.2.5 Assessment of a new UV LED microscope for DB7 5 and
DAPI excitation
When this project started, the use of DB75 and other UV-excited diamidines for
fluorescence-based field diagnostics of trypanosomiasis was mainly hampered by the
absence on the market of suitable UV LED-driven fluorescence microscopes. Our
collaborator Prof. D. Jones (Philipps University, Marburg), therefore, developed a new
LED microscope prototype working in this region of the spectrum (Figure 3.6).
The new UV microscope proved easy to use and extremely efficient in exciting DB75 and
DAPI, both of which absorb in the UV spectrum range. The fluorescence of live T. b.
brucei parasites from cell culture, treated with 10 µM of either compound, was particularly
sharp. Nucleus and kinetoplast were clearly visible. In particular, the kinetoplast appeared
very brilliant following DB75 treatment. After long incubation times (2 h, 37°C) with
10 µM of each compound, a fluorescent tubular structure connected to the kinetoplast and
elongating towards the anterior part of the cell body became evident in many trypanosomes
(Figure 3.7). This organelle, identified as the mitochondrion based on its peculiar shape,
was never observed using the same fluorophores, following the same treatment conditions,
under the standard Zeiss fluorescence microscope. However, it was not possible to perform
colocalisation studies with the mitochondrion-specific red fluorescent marker Mito Tracker
(Field et al., 2004) because of the monochromatic UV light source fitted in the LED
instrument.
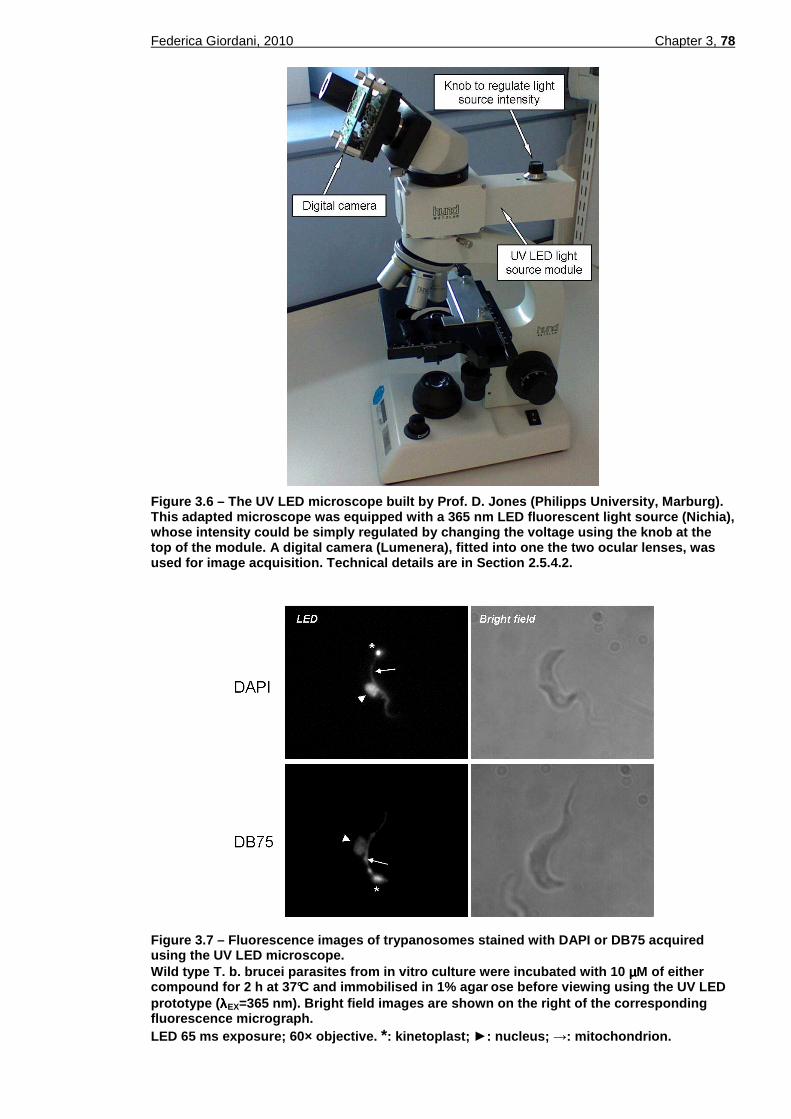
Federica Giordani, 2010 Chapter 3, 78
Figure 3.6 – The UV LED microscope built by Prof. D . Jones (Philipps University, Marburg). This adapted microscope was equipped with a 365 nm LED fluorescent light source (Nichia), whose intensity could be simply regulated by changi ng the voltage using the knob at the top of the module. A digital camera (Lumenera), fit ted into one the two ocular lenses, was used for image acquisition. Technical details are i n Section 2.5.4.2.
Figure 3.7 – Fluorescence images of trypanosomes st ained with DAPI or DB75 acquired using the UV LED microscope. Wild type T. b. brucei parasites from in vitro culture were incubated with 10 µµµµM of either compound for 2 h at 37°C and immobilised in 1% agar ose before viewing using the UV LED prototype ( λλλλEX=365 nm). Bright field images are shown on the righ t of the corresponding fluorescence micrograph. LED 65 ms exposure; 60× objective. *: kinetoplast; ►: nucleus; →: mitochondrion.

Federica Giordani, 2010 Chapter 3, 79
3.2.5.1 DB75 photobleaching upon excitation with th e UV LED light source
DB75 UV fluorescence suffered a fast fading upon excitation with a conventional mercury
arc, especially for samples from culture (Section 3.2.3). The use of the LED-driven
microscope was expected to have a less detrimental effect on the fluorophore stability,
since these light sources do not produce any heat that can damage the sample.
Nevertheless, the fading of DB75 did not appear to be diminished under LED excitation.
Loss of fluorescence of this compound when exposed to the UV LED light was very fast in
in vitro live and fixed samples. DB75 appeared less photostable than DAPI also using this
new instrument, although a direct comparison with the decay rate measured for the
fluorophores under the mercury bulb was not possible. Decreasing the LED power to half
the maximum intensity reduced fading, facilitating viewing and imaging during some
experiments. In blood samples, photobleaching of DB75 was decreased, as already
observed using the mercury arc-driven microscope.
3.2.6 Assessing the suitability of the new Cytoscie nce UV LED
microscope for use with the arsenical drug resistan ce test
The test developed to report on the presence or absence of the P2 amino-purine transporter
associated with drug resistance depends on using UV fluorescent diamidines such as DB99
(Stewart et al., 2005) or DB75 (Lanteri et al., 2006). Unfortunately, typical field
microscopes (i.e. the Cytoscience SMR instrument, Section 1.7) work at longer
wavelengths and are not compatible with these fluorophores. The UV LED source
microscope developed by Prof. D. Jones at Cytoscience, instead, proved very efficient in
exciting DB75 (Section 3.2.5); hence, the possibility to perform the arsenical drug
resistance test using this instrument in association with the fluorophore was explored.
For the test, T. b. brucei S427 wild type (w.t.) and tbat1-/- (lacking the P2 transporter) were
grown in mice (female BALB/c) and collected in heparinized blood. The test was repeated
only twice because we only had the prototypical microscope at our disposal for a limited
period of time. On both occasions the test was carried out on different days for the two
lines, since the tbat1-/- reached a similar parasitaemia as the w.t. (6×10⁷ cells/ml) only after
24 hours longer growth. Aliquots of whole infected blood were directly incubated with
10 µM DB75 and wet thin films were prepared at different time points as previously
reported (Lanteri et al., 2006). When viewed under the UV light the w.t. line appeared
highly fluorescent already after 30 seconds of incubation (Figure 3.8). The kinetoplast and

Federica Giordani, 2010 Chapter 3, 80
the nucleus were brightly stained, but DB75 was also visible in the cytoplasm of the w.t.
parasites making the whole cell body distinguishable. For this cell line, the fluorescence
pattern remained the same over the 5 minutes of observation, with an increase of intensity
over time. The tbat1-/- line accumulated the diamidine at a much slower rate than w.t., as
expected. Nevertheless, DB75 fluorescence in cells incubated for only 30 seconds could
still be detected under the LED light source. In particular, the kinetoplast could be seen as
a moving spot in the specimen, as a function of the whole cell moving. After a few more
minutes the nucleus could also be identified. By contrast, Stewart et al. observed a
complete lack of fluorescence in T. b. brucei tbat1-/- line up to 10 minutes of incubation
using a standard fluorescence microscope (Stewart et al., 2005). One difference between
the test conditions we utilised and those adopted in the published assay was the use of wet
smears instead of dried blood films. DB75 uptake in wet samples is not blocked and
accumulation of the fluorophore continues during sample preparation and viewing, a factor
that could slightly increase fluorescence of the tbat1-/- line at earlier time points.
Nevertheless, the same arsenical resistance test was performed using wet blood smears
stained with DB75 by Lanteri and collaborators, who also could not detect any
fluorescence in the tbat1-/- line up to 10 minutes incubation using a traditional fluorescence
microscope (Lanteri et al., 2006). During our experiments, on the other hand, P2-deficient
trypanosomes could always be detected, by fluorescence staining, at the earliest time point
(30 seconds) in the various blood smears prepared. When these same specimens containing
the tbat1-/- line were observed under the mercury bulb of the Zeiss microscope, no
trypanosomes could be detected by 5 min incubation with 10 µM DB75. Only a very faint
autofluorescence emitted by the moving cells could be visualised. After this incubation
time, UV emission of P2-deficient parasites could be detected using both microscopes
(mercury arc and LED-driven) even when a lower dye concentration (5 µM) was used.
PCR amplification technique on aliquots of the blood samples used during these
experiments and collected on FTA® cards (Whatman, GE Healthcare; Section 2.2.1)
confirmed the absence of the TbAT1 gene in the P2-knockout line utilised (data not
shown).
DB75 excitation in tbat1-/- cells using the UV LED-driven microscope seemed, therefore,
to be more sensitive than with mercury arc-lamps. This prototypical instrument was able to
provide very bright and sharp images of trypanosomes stained with diamidines like DB75
and DAPI, showing up particulars that could be lost by excitation with a traditional broad
spectrum mercury bulb.

Fig
ure
3.8
– T
ime
cour
se o
f DB
75 in
tern
alis
atio
n in
wild
type
and
tb
at1
-/- c
ells
as
obse
rved
und
er th
e U
V L
ED
fluo
resc
ence
mi
cros
cope
. T
. b. b
ruce
i S
427
w.t.
and
tba
t1-/
- line
(M
atov
u et
al.
, 200
3) w
ere
colle
cted
from
mic
e in
hep
arin
ized
bl
ood
and
trea
ted
with
10
µµ µµM o
f DB
75 a
t 37°
C. A
t di
ffere
nt ti
me
poin
ts (
0.5,
1, 2
, 5 m
in)
wet
blo
od
smea
rs w
ere
prep
ared
and
imm
edia
tely
obs
erve
d un
der
the
LED
ligh
t (λλ λλ E
X=3
65 n
m)
of th
e pr
otot
ypic
al
UV
LE
D in
stru
men
t (de
velo
ped
by P
rof.
D. J
ones
at C
ytos
cien
ce)
usin
g its
max
imum
inte
nsity
. Rep
rese
nta
tive
brig
ht fi
eld
imag
es a
re s
how
n on
the
right
(a
prob
able
impe
rfec
t alig
nmen
t of t
he w
hite
lig
ht s
ourc
e ca
used
the
unev
enne
ss a
t the
left
side
of t
he fi
eld)
. LE
D 7
0 m
s ex
posu
re; 4
0× o
bjec
tive.
Arr
ows
indi
cate
tb
at1
-/- tr
ypan
osom
es.

Federica Giordani, 2010 Chapter 3, 82
3.2.7 DB75 fluorescence under FITC filter
In addition to its blue emission following UV excitation, DB75 had also been shown to
fluoresce at longer wavelengths once inside various trypanosome cytoplasmic organelles,
some of them identified as acidocalcisomes (Mathis et al., 2006). Using the FITC filter of
the Zeiss Axioplan microscope (λEX=470 nm, λEM=519 nm) we could detect various
fluorescent dots generated by the fluorochrome (given at 10 µM) in ex-vivo cells, as soon
as 5-10 minutes of exposure to DB75 at 37°C (Figure 3.9). The kinetoplast was also
always visible and brilliant under this filter set, but the nucleus was never observed. Some
of these dots could also be identified under the DAPI filter using the 100× objective. Under
our experimental conditions, we could observe around a dozen green fluorescent spots
distributed across the whole length of the cell, forming a “pearl necklace” pattern, also
visible as electron-dense corpuscles under phase contrast. The number of detectable spots
was quite stable up to 2 hours of exposure, after which they seemed to decrease in
fluorescence. In order to visualise this green emission, the UV filter had to be avoided,
since photons emitted in this region of the spectrum also caused the bleaching of the
fluorescence emitted at longer wavelengths. If UV light was not utilised, the fluorescence
observed using the FITC filter block appeared more photostable than the emission upon
DAPI excitation and it could still be visualised after drying the blood smears and viewing
them 24 hours later.
This specific fluorescent pattern of DB75 inside trypanosomes was the product of an active
accumulation of the compound inside the cells. After staining the kinetoplast and the
nuclear DNA (the first two organelles that could be visualised using UV light), DB75
started to be detectable inside these other cytoplasmic corpuscles, where its concentration
increased with time (visualised as an increase of fluorescence intensity). DB75
fluorescence upon FITC excitation needed living cells to develop and it could not be seen
when the fluorochrome was used to stain air-dried blood smears, where it only produced
the DAPI-like blue emission.
The identity of these cytoplasmic fluorescent corpuscles visualised under FITC filter,
following DB75 treatment, is still uncertain and under investigation. Considering their
dimension and distribution, they partially seemed to correspond to those viewed by Mathis
and collaborators (Mathis et al., 2006) in trypanosomes treated up to 2 hours incubation
with the dye (Figure 3.10). These authors observed that DB75 fluorescence initially
developed inside various (unidentified) punctate cytoplasmic vesicles, before concentrating

Fig
ure
3.9
– F
luor
esce
nce
of
ex-v
ivo
DB
75-s
tain
ed tr
ypan
osom
es v
iew
ed u
nder
DA
PI a
nd F
ITC
filte
rs.
Try
pano
som
es (
T. b
. bru
cei
S42
7 w
.t. g
row
n in
mur
ine
bloo
d) w
ere
trea
ted
ex-v
ivo
with
10
µµ µµM D
B75
at 3
7°C
. Wet
thin
blo
od s
mea
rs w
ere
prep
ared
at
diffe
rent
tim
e po
ints
and
vie
wed
und
er th
e Z
eiss
Ax
iopl
an m
icro
scop
e us
ing
a 10
0× o
bjec
tive
(A)
or a
40×
obj
ectiv
e (B
). T
he b
lue
fluor
esce
nce
insi
de
nucl
eus
and
kine
topl
ast d
evel
oped
imm
edia
tely
, with
in 1
min
incu
batio
n w
ith th
e dr
ug. T
he g
reen
fluo
resc
ence
nee
ded
at le
ast 5
min
of i
ncub
atio
n to
de
velo
p an
d its
inte
nsity
incr
ease
d w
ith ti
me.
The
ki
neto
plas
t was
vis
ible
und
er b
oth
filte
rs, w
hile
the
nuc
leus
did
not
app
ear
usin
g th
e F
ITC
cha
nnel
. In
stea
d, a
ser
ies
of o
ther
cyt
opla
smic
org
anel
les,
di
strib
uted
thro
ugho
ut th
e w
hole
cel
l bod
y w
ith a
“pe
arl n
eckl
ace”
pat
tern
, wer
e flu
ores
cent
und
er th
is
filte
r. D
B75
gre
en fl
uore
scen
ce w
as a
lso
exci
ted
by th
e LE
D li
ght s
ourc
e of
the
Cyt
osci
ence
SM
R e
piflu
ores
cent
mic
rosc
ope
(try
pano
som
e flu
ores
cenc
e un
der
this
inst
rum
ent a
ppea
red
very
sim
ilar
to th
at v
isua
lised
und
er th
e Z
eiss
mic
rosc
ope
usin
g th
e 40
× ob
ject
ive
– pa
nel B
, FIT
C fi
lter)
. Not
e th
at
tryp
anos
omes
in w
et s
mea
rs w
ere
high
ly m
otile
and
the
ir po
sitio
n in
the
imag
es a
cqui
red
unde
r di
ffere
nt f
ilter
s ca
n ch
ange
. T
ime
of e
xpos
ure
of th
e ca
mer
a fo
r D
AP
I was
alw
ays
mai
ntai
ned
at 3
3 m
s, w
hile
for
FIT
C fi
lter
at ×
1,00
0 to
tal m
agni
ficat
ion
it w
as d
ecre
ased
at l
ates
t ti
me
poin
ts to
avo
id s
atur
atio
n of
the
gree
n flu
ores
cenc
e (1
00 m
s at
10
and
15 m
in, 4
0 m
s at
30
min
). *
: kin
etop
last
; ►
: nuc
leus
. Bar
: 10
µµ µµm.
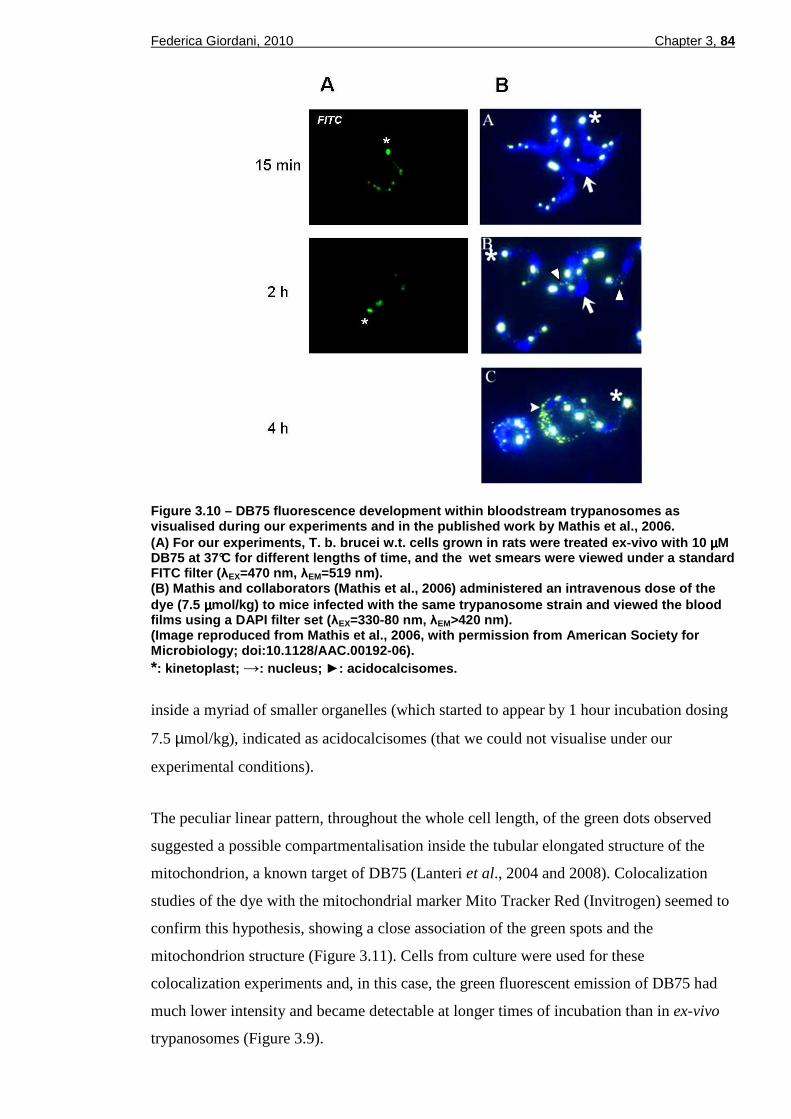
Federica Giordani, 2010 Chapter 3, 84
Figure 3.10 – DB75 fluorescence development within bloodstream trypanosomes as visualised during our experiments and in the publis hed work by Mathis et al ., 2006. (A) For our experiments, T. b. brucei w.t. cells grown in rats were treated ex-vivo with 10 µµµµM DB75 at 37°C for different lengths of time, and the wet smears were viewed under a standard FITC filter ( λEX=470 nm, λEM=519 nm). (B) Mathis and collaborators (Mathis et al ., 2006) administered an intravenous dose of the dye (7.5 µµµµmol/kg) to mice infected with the same trypanosome strain and viewed the blood films using a DAPI filter set ( λEX=330-80 nm, λEM>420 nm). (Image reproduced from Mathis et al. , 2006, with permission from American Society for Microbiology; doi:10.1128/AAC.00192-06). *: kinetoplast; →: nucleus; ►: acidocalcisomes.
inside a myriad of smaller organelles (which started to appear by 1 hour incubation dosing
7.5 µmol/kg), indicated as acidocalcisomes (that we could not visualise under our
experimental conditions).
The peculiar linear pattern, throughout the whole cell length, of the green dots observed
suggested a possible compartmentalisation inside the tubular elongated structure of the
mitochondrion, a known target of DB75 (Lanteri et al., 2004 and 2008). Colocalization
studies of the dye with the mitochondrial marker Mito Tracker Red (Invitrogen) seemed to
confirm this hypothesis, showing a close association of the green spots and the
mitochondrion structure (Figure 3.11). Cells from culture were used for these
colocalization experiments and, in this case, the green fluorescent emission of DB75 had
much lower intensity and became detectable at longer times of incubation than in ex-vivo
trypanosomes (Figure 3.9).

Federica Giordani, 2010 Chapter 3, 85
Figure 3.11 – Cellular localization of DB75 and the mitochondrial marker Mito Tracker Red. In vitro -cultured T. b. brucei w.t. parasites (2×10 7 cells/ml) were treated with 10 µµµµM DB75 for 2 hours at 37°C, to allow the development of a dete ctable fluorescence under FITC filter. Cells were then added with 100 nM Mito Tracker Red CMXRos (Invitrogen) and incubated for further 10 min at 37°C. After washing in PBS, aliqu ots of cells were added with an equal volume of agarose (1% final concentration) and moun ted on slides. The green fluorescence of DB75 was viewed under FITC filter, and its blue emission (DAPI channel) was used to localise the nucleus and the kinetoplast. The emiss ion of the mitochondrial marker Mito Tracker Red was visualised using the RHOD filter of the Zeiss Axioplan microscope. Images were merged using the Adobe Photoshop 7.0 software. FITC and RHOD 68 ms exposure; DAPI 33 ms exposure; 100× objective. *: kinetoplast; ►: nucleus; →: mitochondrion. Bar: 10 µµµµm.
3.2.7.1 Use of DB75 as fluorescent probe for HAT in association with the
LED Cytoscience SMR microscope
The green fluorescent emission of DB75 presented various advantages for its eventual use
in diagnostic tests for live trypanosomes. The characteristic “pearl necklace” staining
pattern viewed under FITC filter could allow an easy detection of parasites among other
blood components. Moreover, the signal of the dye observed under this filter was more
stable than that generated by exposure to highly energetic UV light. Another important
aspect to take into consideration is that it is easier to obtain LED microscopes that work in
this region of the spectrum, rather than at low wavelengths.
Interestingly, the green fluorescence of DB75 could be viewed under the LED Cytoscience
SMR epifluorescent microscope (λEX=472 nm) (Section 1.7). No images can be shown for
this microscope (as a suitable camera was not available), but under this instrument
trypanosomes appeared very similar to those visualised under the Zeiss Axioplan FITC
filter using the 40× objective (Figure 3.9 B), the only difference being the more yellowish
colour of DB75 under the LED light of the field microscope.

Federica Giordani, 2010 Chapter 3, 86
3.3 Discussion
3.3.1 DB75 fluorescence in live and fixed specimens
DB75 is a fluorescent diamidine that is actively concentrated into wild type trypanosomes,
where it binds to DNA of the nucleus and kinetoplast yielding a bright emission upon UV
excitation. Its fast uptake through the parasite amino-purine transporter termed P2 (Mäser
et al., 1999) enables this compound’s utilization as a specific fluorescent marker for T.
brucei when living specimens are used. In wet preparations of infected murine blood,
staining of trypanosomes was practically instantaneous after exposure at 37°C, while
leukocytes present in the sample showed only a low fluorescence (Figure 3.3 B). When air-
dried thin blood smears were stained with DB75 after fixing, this specificity was lost due
to cell membrane disruption in these preparations, meaning that white blood cell nuclei
were also exposed and were easily labelled by the fluorochrome (Figure 3.3 A). The rapid
accumulation of DB75 into live trypanosomes is an important property when considering a
possible application of the dye for diagnostic staining of trypanosomes derived from
infected human fluids (whether blood or lymph node aspirate or CSF). Parasites in fresh
human samples can be very fragile and lyse quickly (Chappuis et al., 2005); therefore, fast
processing of the specimen becomes essential.
3.3.2 DB75 photobleaching
The photochemical instability of DB75 when excited under UV light represents another
important aspect to consider when assessing the suitability of this dye as a reagent to assist
diagnosis of trypanosome infections in fluids other than blood. During our experiments, the
compound bleached rapidly in wet and fixed specimens prepared from cell culture, while
fading appeared less marked in blood samples (whether fixed or fresh).
A range of antifading agents was tested for their impact on DB75 fluorescence. Among
them, Trolox acted as a reasonable antifading compound for this fluorophore (Figure 3.5)
and it could be easily used in wet as well as fixed samples. Although specimen preparation
using mounting media adds to the overall cost and laboriousness of fluorescence
microscopy, it could also prove useful for sample storage (Valnes and Brandtzaeg, 1985),
by preserving the fluorescent signal for longer periods of time (this aspect was no further
investigated).
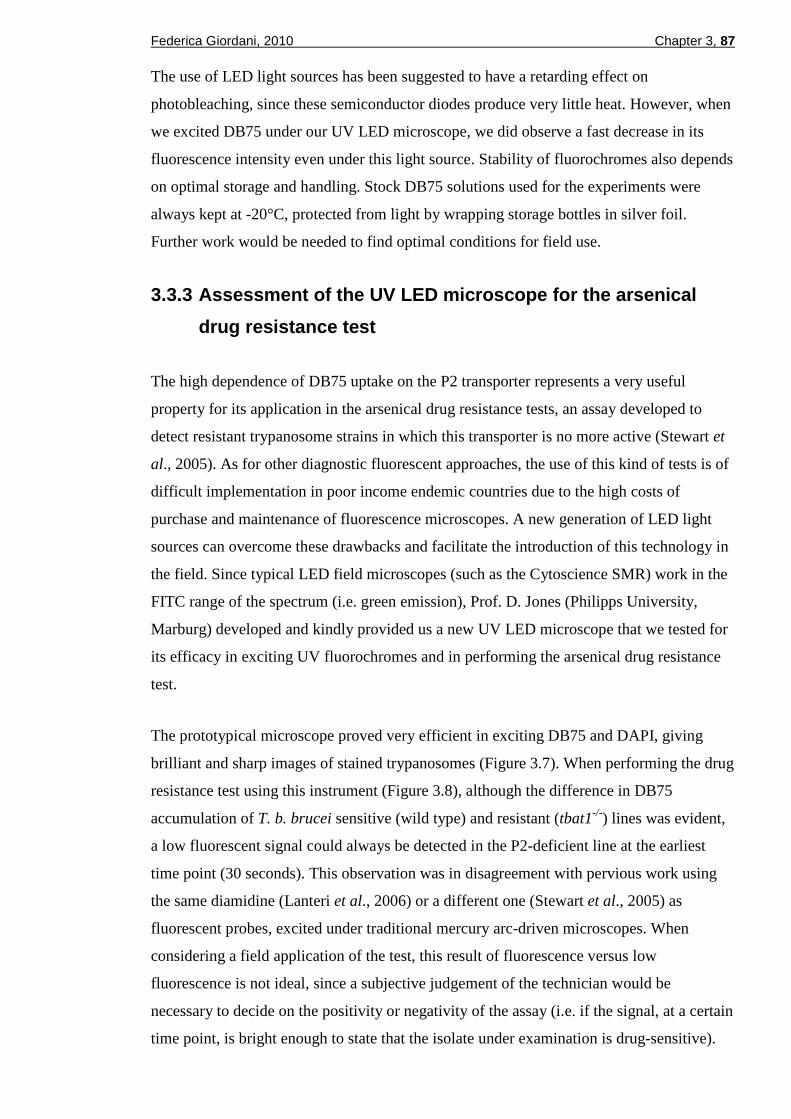
Federica Giordani, 2010 Chapter 3, 87
The use of LED light sources has been suggested to have a retarding effect on
photobleaching, since these semiconductor diodes produce very little heat. However, when
we excited DB75 under our UV LED microscope, we did observe a fast decrease in its
fluorescence intensity even under this light source. Stability of fluorochromes also depends
on optimal storage and handling. Stock DB75 solutions used for the experiments were
always kept at -20°C, protected from light by wrapping storage bottles in silver foil.
Further work would be needed to find optimal conditions for field use.
3.3.3 Assessment of the UV LED microscope for the a rsenical
drug resistance test
The high dependence of DB75 uptake on the P2 transporter represents a very useful
property for its application in the arsenical drug resistance tests, an assay developed to
detect resistant trypanosome strains in which this transporter is no more active (Stewart et
al., 2005). As for other diagnostic fluorescent approaches, the use of this kind of tests is of
difficult implementation in poor income endemic countries due to the high costs of
purchase and maintenance of fluorescence microscopes. A new generation of LED light
sources can overcome these drawbacks and facilitate the introduction of this technology in
the field. Since typical LED field microscopes (such as the Cytoscience SMR) work in the
FITC range of the spectrum (i.e. green emission), Prof. D. Jones (Philipps University,
Marburg) developed and kindly provided us a new UV LED microscope that we tested for
its efficacy in exciting UV fluorochromes and in performing the arsenical drug resistance
test.
The prototypical microscope proved very efficient in exciting DB75 and DAPI, giving
brilliant and sharp images of stained trypanosomes (Figure 3.7). When performing the drug
resistance test using this instrument (Figure 3.8), although the difference in DB75
accumulation of T. b. brucei sensitive (wild type) and resistant (tbat1-/-) lines was evident,
a low fluorescent signal could always be detected in the P2-deficient line at the earliest
time point (30 seconds). This observation was in disagreement with pervious work using
the same diamidine (Lanteri et al., 2006) or a different one (Stewart et al., 2005) as
fluorescent probes, excited under traditional mercury arc-driven microscopes. When
considering a field application of the test, this result of fluorescence versus low
fluorescence is not ideal, since a subjective judgement of the technician would be
necessary to decide on the positivity or negativity of the assay (i.e. if the signal, at a certain
time point, is bright enough to state that the isolate under examination is drug-sensitive).

Federica Giordani, 2010 Chapter 3, 88
Determination of a fluorescent threshold could be even more difficult to assess for human
pathogenic strains, where the differences in diamidines internalisation time between
resistant and wild type lines could be less evident, as already observed for DB99 (Stewart
et al., 2005). Therefore, a re-optimisation of the test in association with the UV LED
microscope will be needed, in order to go back to the situation of fluorescence versus non-
fluorescence of the originally designed assay. This could be done by adjusting the
microscope settings (such as the LED intensity) or by modifying the preparation of the
sample (different dye doses and times of incubation, use of dried blood films, assessment
of other fluorescent substrates).
The reasons for the images’ definition obtained using the UV LED instrument are still
unclear and under investigation. Sharpness and resolution of microscopy micrographs
mainly depend on the objectives used and their numerical aperture (Petty, 2007). In our
case, this factor did not seem to have any discriminatory effect, since the objectives fitted
in the LED microscope belonged to a standard light bench microscope. The different focus
of the mercury gas discharge bulb compared to the LED light source could have more
significant consequences on the final specimen image (Jones et al., 2005) and this aspect
should be further evaluated.
3.3.4 DB75 fluorescence under a FITC filter
Whereas accumulation of DB75 in the nucleus and kinetoplast formed the basis of the
original proposed test for P2-deficiency related drug resistance (Stewart et al., 2005;
Lanteri et al., 2006), this compound also accumulates to concentrations allowing detection
in other cell compartments that can be visualised under a standard FITC filter (Figure 3.9).
In live wild type trypanosomes various fluorescent inclusions became highly stained after
only 10 minutes incubation with 10 µM DB75. The kinetoplast was also always visible
using the FITC filter set. DB75 emission at this longer wavelength was more photostable
than the signal emitted upon UV excitation, but it needed living cells to develop and could
not be seen in fixed specimens directly stained with the compound.
The “pearl necklace” staining pattern of the fluorochrome could also be visualised under
the LED Cytoscience SMR microscope already available. This very peculiar fluorescent
pattern (kinetoplast plus cytoplasmic dots) could be useful to identify trypanosomes in a
complex blood sample, where many other components are often stained and hamper the
identification of parasites. These blood components do render the detection of the punctate

Federica Giordani, 2010 Chapter 3, 89
nucleus and kinetoplast after DB75 treatment, upon UV excitation, problematic for
diagnosis. This is due to the fact that these organelles may be difficult to distinguish from
the contaminants of the specimen, appearing merely as small dots among many other
fluorescent components, especially in fixed samples at low parasitaemia (the use of the
Cytoscience UV LED instrument, instead of a classical fluorescence microscope, however,
also allowed evidencing the low cytoplasmic emission of DB75-stained cells). When
considering this aspect, a fluorochrome able to stain the whole trypanosome cell body, thus
providing a clear trypanosomal form, or, as in this case, a dye that produces a very
characteristic fluorescent pattern, would enable an easier discrimination from debris as
well as other co-infecting parasites. Future work will study the development of DB75
green emission in tbat1-/- line, for its eventual use in the arsenical drug resistance test.
The exact identity of the green fluorescent dots visualised under FITC filter following
DB75 treatment is unknown. They do not seem to correspond to the vesicles proposed to
be acidocalcisomes (Mathis et al., 2006), since these only appeared at longer time of
incubation with DB75 (after 1 hour), they were smaller in size and higher in number. The
organelles we observed using the FITC filter, instead, started to appear already after 5 min
of treatment with 10 µM DB75 in ex-vivo samples and were never more than a dozen. Also
Mathis and collaborators visualised similar punctate corpuscles (Figure 3.10), but their
number and distribution was not identical to that we were able to detect. This discrepancy
could be ascribed to the different filter set used (FITC filter set with λEX=470 nm and
λEM=519 nm for us, UV excitation at 330-80 nm with detection of emission at ≥420 nm for
Mathis et al.), but a different accumulation and compartmentalisation of DB75 in
trypanosomes treated in vivo (Mathis and colleagues) and ex-vivo (our experiments) can
not be excluded. The fluorescence compartmentalisation pattern of DB75 had also been
demonstrated to be dose-dependent (Wilson et al., 2005) and our use of 10 µm DB75
instead of the 7.5 µmol/kg to treat mice in Mathis et al. work could be another reason for
the differences we found.
The organelles visualised under FITC filter during our experiments were distributed
throughout the whole cell body and this observation exclude possible identification with
endocytic and secretory vesicles, which are confined in the posterior part of the cell
(Morgan et al., 2002). The green fluorescent dots evidenced in trypanosomes after
treatment with DB75, instead, appeared to localise within the mitochondrion (Figure 3.11),
a known target of this diamidine (Lanteri et al., 2008). The compartmentalisation of the
fluorescent corpuscles inside the elongated mitochondrial tubular structure would explain

Federica Giordani, 2010 Chapter 3, 90
their linear “pearl-necklace” pattern extending from the kinetoplast towards the anterior
part of the cell. The cause of DB75 fluorescent emission shift from blue to longer
wavelengths once inside this organelle, though, is still poorly understood. Spectral
properties of a fuorochrome are often strictly dependent on the pH of the environment, but
previous work did not find any correlation between acidification of the medium and a
DB75 fluorescent shift (Mathis et al., 2006). Another important factor affecting the
emission maximum of a fluorophore is its condensation with various cellular components.
This phenomenon has already been observed for the closely related diamidine DAPI,
which presents with a large bathochromic emission shift (yellow fluorescence) upon
binding with polyanions such as RNA, mucopolysaccharides and polyphosphates
(Kapuscinski, 1995). We hypothesize that DB75 is actively accumulated by living cells
inside the mitochondrion where it condensates with polyanions until a critical
concentration, which causes precipitation of the complexes and fluorescence shift to longer
wavelengths. Discrete distribution of these negatively charged cellular components inside
the mitochondrion could cause the punctate fluorescence pattern visualised. The identity of
these components is unknown: although crystalline masses have been found in the
mitochondrion of Trypanosoma evansi, no similar dense incusions were observed in other
salivarian trypanosomes (Vickerman, 1977). The compartmentalisation of the green
corpuscles inside the mitochondrial organelle would also explain why DB75 green
emission is evidenced in association with the kinetoplast but not with the nucleus (both
stained by the fluorophore upon DAPI excitation). Understanding the cause for the
fluorescence shift of DB75 emission from blue to longer wavelengths will give important
information regarding the identity of the corpuscles visualised under FITC filter and,
possibly, on the mechanism of action of this trypanocidal compound.

4
Green fluorescent diamidines
and phenanthridines
as diagnostic probes for trypanosomes

Federica Giordani, 2010 Chapter 4, 92
4.1 Introduction
The diamidine DB75 proved to be an interesting fluorophore for diagnosis of
trypanosomiasis. This compound is cost-efficient to synthesise, it is quickly and
specifically internalised into parasites and it emits bright fluorescence when excited using
standard DAPI and FITC filters (Chapter 3). Moreover, LED-driven microscopes
(Cytoscience), compatible with the emission maxima of the compound, are available.
Nevertheless, the use of DB75 as a fluorescent marker also presents some issues: for
example, the drug resistance test using this diamidine in association with the prototypical
UV LED microscope still needs to be optimised, while the photoinstability of this
fluorophore and its inability to stain the whole parasite cell body with bright emission are
not ideal properties for an ultimate use as a general diagnostic dye.
A variety of other fluorophores was, therefore, screened in order to find compounds with
more advantageous properties than DB75. A series of green fluorescent diamidines, with
higher wavelength absorbance and emission spectra, was also studied for their use as
fluorescent substrates for the arsenical drug resistance test.
4.1.1 Green fluorescent pentamidine analogues
When the arsenical drug resistance test was initially developed (Stewart et al., 2005), no
UV LED microscopes were available, thus hampering its development into a format more
suited for field use. To tackle this problem, two solutions were considered: the
development of a new instrument compatible with the UV-excited diamidines (DB75 and
DB99) originally used in the test (this aspect is discussed in Chapter 3), or the search for
other P2-specific substrates compatible with the Cytoscience SMR LED microscope
already available (λEX=472 nm, λEM>500 nm) (Jones et al., 2005).
A series of pentamidine analogues was specifically synthesised by Prof. D. W. Boykin’s
group (Georgia State University, Atlanta) with the intention of generating other fluorescent
substrates for the arsenical drug resistance test. These compounds (Figure 4.1) maintained
the basic dicationic backbone of others diamidines (containing the recognition motif for the
P2/TbAT1 transporter), but were added with a series of ultra-conjugated ring structures in
the linker, which provided them with emission wavelengths higher than DB75 (and,
therefore, more likely to be compatible with the already available Cytoscience SMR
microscope) (Table 4.1).

Federica Giordani, 2010 Chapter 4, 93
OOO
O
NH2
NH
NH
NH2
SSO
O
NH2
NH
NH
NH2
OOS
S
NH2
NH
NH
NH2
O
OO
NH2
NHO
NH2
NH
O
OOO
NH2
NHNH
NH2
DB1464 DB1465
DB1645 DB1692
DB1680
OOO
O
NH2
NH
NH
NH2
SSO
O
NH2
NH
NH
NH2
OOS
S
NH2
NH
NH
NH2
O
OO
NH2
NHO
NH2
NH
O
OOO
NH2
NHNH
NH2
DB1464 DB1465
DB1645 DB1692
DB1680
Figure 4.1 – Chemical structure of the five green f luorescent pentamidine analogues. These compounds shared the same diamidine backbone (for P2 recognition) with DB75 and pentamidine and had various combinations of furan, thiophene and phenyl rings in the linker between the two amidine groups, which gave t hem fluorescent properties.
Compound λEX (nm) λEM (nm)
DB1464 413 540
DB1465 405 525
DB1645 426 575
DB1692 400 545
DB1680* 397 515
Table 4.1 – Excitation and emission wavelengths of the five green fluorescent diamidines. The spectrum of DB1680 ( *) was measured in our laboratory using a 1 µµµµM solution in dH 2O (see also Figure 4.6 A). The excitation and emissio n maxima of the other four diamidines were determined in Prof. D. W. Boykin’s laboratory (Georgia State University, Atlanta). λλλλEX: wavelength of maximum excitation; λλλλEM: wavelength of maximum emission.
The ability of these promising compounds to selectively stain trypanosomes was studied
both in vitro (on cultured bloodstream parasites) and in ex-vivo infected rat blood samples.
Their potential use as substrates for the arsenical drug resistance test was also evaluated
both by studying their uptake-dependence on the P2 amino-purine transporter (using a drug
sensitivity assay) and by fluorescence microscopy on strains either expressing, or not
expressing, this permease.
4.1.2 Phenanthridines
Phenanthridines are a group of molecules containing a nitrogen heterocyclic core that
makes them fluoresce in the red region of the visible spectrum. Phenanthridines were

Federica Giordani, 2010 Chapter 4, 94
considered of interest for our project since some of them also possess trypanocidal activity,
implying selective internalisation inside these parasites. Ethidium bromide (homidium
bromide, Ethidium®, [3,8-diamino-5-ethyl-6-phenylphenanthridinium bromide]) is a
fluorophore widely applied in molecular biology as nucleic acid stain. Both ethidium and
isometamidium chloride (Samorin®, [8-[(m-amidinophenylazo)amino]-3-amino-5ethyl-6-
phenylphenanthridinium chloride hydrochloride]) (Figure 4.2) are phenanthridines used for
the treatment of animal African trypanosomiasis (Leach and Roberts, 1981).
Isometamidium is also applied to livestock as a prophylactic agent (Kinabo and Bogan,
1988). The chemical structure of isometamidium is a hybrid from homidium and the p-
aminobenzamide moiety of diminazene aceturate (an aromatic diamidine also used in
veterinary trypanosomiasis). Despite possessing the recognition motif for the P2/TbAT1
transporter, however, the internalisation of isometamidium inside parasites only partly
occurs through this route (Delespaux and de Koning, 2007). Instead, it has been proposed
that this compound freely crosses the plasma membrane and is, then, actively concentrated
inside the mitochondrion, a main target of the drug (de Koning, 2001b). The high cross-
resistance of isometamidium with ethidium (Peregrine et al., 1997) suggests the
involvement of a common route of uptake for the two compounds. Propidium iodide [3,8-
diamino-5-[3-(diethylmethylammonio)propyl]-6-phenylphenanthridinium diiodide] is a
phenanthridinium analogue of ethidium, but it is characterised by a more hydrophilic
nature, due to the presence of a bulky ionic substituent on the phenanthridine ring (Figure
4.2). Propidium is widely used as nucleic acid stain in fluorescence techniques and to
identify dead cells in a population, since it is a membrane-impermeant molecule and it is
normally excluded from live cells (Suzuki et al., 1997; Riccardi and Nicoletti, 2006).
Propidium has also been shown to have trypanocidal activity in vivo (Cox et al., 1984) and
in vitro (Gould et al., 2008).
Phenanthridines bind to DNA by intercalating between the bases (one molecule of dye for
every four or five nucleotides), apparently with no significant sequence preference
(Waring, 1965). All of the three phenanthridines considered in this study also stain
cytoplasmic RNA (Waring, 1965; Suzuki et al., 1997). As occurs with DAPI (Chapter 3),
DNA binding changes the spectral properties of these phenanthridine molecules, inducing
a shift of both the excitation and emission maxima (Table 4.2) and enhancing the overall
fluorescence emission intensity 20- to 30-fold for ethidium and propidium (Waring, 1965)
and more than 4-fold for isometamidium (Zilberstein et al., 1993; Wilkes et al., 1995). The
high affinity of phenanthridines for nucleic acids is also responsible for their mutagenicity
and it appears to be related to the trypanocidal activity of these compounds, which involves

Federica Giordani, 2010 Chapter 4, 95
NH2 NH2
N+
N+
I
I
NH2 NH2
N+
Br
Ethidium bromide
N+N
H
NN
NH
NH2
NH2
Cl
Propidium iodide
Isometamidium chloride
NH2 NH2
N+
N+
I
I
NH2 NH2
N+
Br
Ethidium bromide
N+N
H
NN
NH
NH2
NH2
Cl
Propidium iodide
Isometamidium chloride Figure 4.2 – Chemical structure of the three phenan thridines used in the present study.
λEX (nm) λEM (nm) Compound
free dye +ds DNA free dye +ds DNA
Ethidium bromide 480 518 620 605 Propidium iodide 482 540 608 608
Isometamidium chloride 374 - 600 584
Table 4.2 – Excitation and emission maxima of the t hree phenanthridines tested. Peak values in the absence (free dye) or presence o f DNA (+ds DNA) are indicated. Wavelengths for ethidium bromide and propidium iodi de are from the Sigma-Aldrich website ( http://www.sigmaaldrich.com/life-science/cell-biolo gy/detection/learning-center/wavelength-index.html ). The emission and excitation spectra data for iso metamidium chloride are from Zilberstein et al ., 1993. These authors used lysates of T. congolense (IL 1180) for the spectra measurements in the presence of DNA. Free isometamidium has a second emission peak at 645 nm, which is not affect ed upon DNA binding. dsDNA: double-stranded DNA; λλλλEX: wavelength of maximum excitation; λλλλEM: wavelength of maximum emission.
inhibition of DNA synthesis (Leach and Roberts, 1981; Kinabo and Bogan, 1988).
Isometamidium chloride, in particular, was shown to cause linearization of kinetoplast
DNA minicircles in T. equiperdum by interacting with the complexes formed by
topoisomerases and the kinetoplast DNA (Shapiro and Englund, 1990). Another study
showed that dyskinetoplastic trypanosomes were not responsive to ethidium bromide
treatment in an in vivo model, suggesting that the kinetoplast was an important target for
the action of the phenanthridine (Agbe and Yielding, 1995).
The intrinsic fluorescence of ethidium, propidium and isometamidium has been used to
study their distribution in trypanosomes, in order to identify their intracellular targets.
Microscopic examination of T. brucei parasites treated in vivo with ethidium bromide
Federica Giordani, 2010 Chapter 4, 96
showed that this compound localised inside the kinetoplast and the nucleus of the cells,
with a fluorescent intensity proportional to the drug concentration (Cox et al., 1984). The
same authors showed a more diffuse cytoplasmic fluorescence for propidium iodide, which
appeared to stain the kinetoplast with a less intense emission than the nucleus (Cox et al.,
1984). Isometamidium revealed a greater affinity for the kinetoplast than ethidium
(Boibessot et al., 2002). Boibessot and collaborators also observed that the absorption of
ethidium into trypanosomes was slower than that of isometamidium, confirming data
published previously (Hawking and Sen, 1960).
4.1.3 Acridine orange
Acridine orange [3,6-bis(dimethylamino)acridine] is a basic nucleic acid dye, isomer of
phenanthridine (Figure 4.3). The fluorescence characteristics of this molecule are complex.
In diluted aqueous solutions (10-7 M) the fluorophore is present as a monomer, while the
dimeric form prevails in more concentrated solutions (>10-2 M). These two forms have
different spectral properties (Table 4.3) and give rise to specific complexes with nucleic
acids (Tomita, 1967; MacInnes and McClintock, 1970; Zelenin, 1999). Complex I is
formed when the monomer of acridine orange intercalates within bases of double-stranded
DNA (with a ratio of one molecule of dye per four bases of DNA). This interaction
increases the green fluorescence yield 2- to 2.5-fold as compared to the free dye. Complex
II has a red emission and arises from binding of the dimer to single-stranded nucleic acids
and RNA, apparently by ionic interactions with the sugar-phosphate backbone (Gardner
and Mason, 1967). This interaction induces a 10-fold decrease in the fluorescence yield
(Zelenin, 1999) (spectral characteristics of these complexes are indicated in Table 4.3).
Acridine orange can also form salt-like complexes with polysaccharides and, at pH>7, it
binds to proteins, yielding red fluorescence (Zelenin, 1999).
The fluorescent properties of acridine orange have been intensively exploited for a wide
range of purposes. Its double green and red emission can allow discrimination between
double-stranded DNA and single-stranded nucleic acids (Watson and Chambers, 1977). By
being a membrane-permeant compound, acridine is also used in association with other
exclusion dyes (such as propidium iodide) to distinguish living from apoptotic cells (Bank,
1988; Foglieni et al., 2001). Another use of this fluorophore is as an in vivo marker for
acidic cell compartments, such as lysosomes (Zelenin, 1966; Brunk et al., 2001) or the
trypanosome’s acidocalcisomes (Docampo and Moreno, 1999), inside which acridine is
actively accumulated, protonated and sequestered.

Federica Giordani, 2010 Chapter 4, 97
N NN
Acridine orange
N NN
Acridine orange Figure 4.3 – Chemical structure of acridine orange.
λEX (nm) λEM (nm)
free dye + NA free dye + NA
AO monomer/Complex I 494 502-504 530 530 AO dimer/Complex II 465 475 640 640
Table 4.3 – Excitation and emission maxima of acrid ine orange. Peak values in the absence (free dye) or presence o f nucleic acids (+ NA) are indicated. In aqueous solutions (free dye) the fluorophore exists in two forms, depending on its concentration. At low molarities acridine orange is present as a monomer, which binds to double-stranded DNA by intercalation, yielding gree n fluorescence (Complex I). The dimer is formed at high concentrations and it binds to singl e-stranded DNA or RNA yielding red fluorescence (Complex II). AO: acridine orange; NA: nucleic acids; λ λ λ λEX: wavelength of maximum excitation; λλλλEM: wavelength of maximum emission.
Acridine orange is used as fluorescent probe for the diagnosis of malaria: protocols include
direct application of the dye to the specimen on microscopy slides (Kawamoto, 1991;
Delacollette and Van der Stuyft, 1994; Keiser et al., 2002) or coating the interior of the
capillary tubes used in the quantitative buffy coat system (Baird et al., 1992). This last
technique has also been applied to detect trypanosomes in human blood (Bailey and Smith,
1992; Chappuis et al., 2005), but its high cost makes it difficult to implement in field
settings (Section 1.2.3.6).
The fluorescence spectra of this fluorophore match the wavelength range of the standard
FITC filter, which is the spectral region also covered by the LED Cytoscience SMR
microscope (Jones et al., 2007).
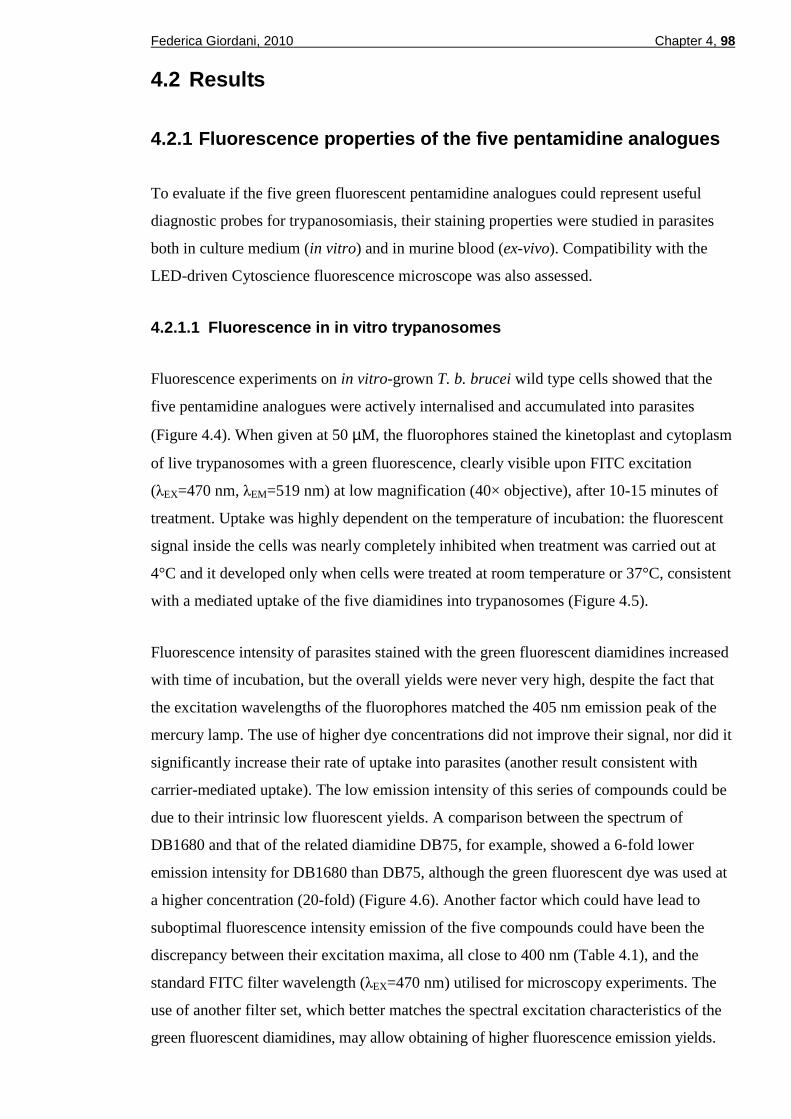
Federica Giordani, 2010 Chapter 4, 98
4.2 Results
4.2.1 Fluorescence properties of the five pentamidi ne analogues
To evaluate if the five green fluorescent pentamidine analogues could represent useful
diagnostic probes for trypanosomiasis, their staining properties were studied in parasites
both in culture medium (in vitro) and in murine blood (ex-vivo). Compatibility with the
LED-driven Cytoscience fluorescence microscope was also assessed.
4.2.1.1 Fluorescence in in vitro trypanosomes
Fluorescence experiments on in vitro-grown T. b. brucei wild type cells showed that the
five pentamidine analogues were actively internalised and accumulated into parasites
(Figure 4.4). When given at 50 µM, the fluorophores stained the kinetoplast and cytoplasm
of live trypanosomes with a green fluorescence, clearly visible upon FITC excitation
(λEX=470 nm, λEM=519 nm) at low magnification (40× objective), after 10-15 minutes of
treatment. Uptake was highly dependent on the temperature of incubation: the fluorescent
signal inside the cells was nearly completely inhibited when treatment was carried out at
4°C and it developed only when cells were treated at room temperature or 37°C, consistent
with a mediated uptake of the five diamidines into trypanosomes (Figure 4.5).
Fluorescence intensity of parasites stained with the green fluorescent diamidines increased
with time of incubation, but the overall yields were never very high, despite the fact that
the excitation wavelengths of the fluorophores matched the 405 nm emission peak of the
mercury lamp. The use of higher dye concentrations did not improve their signal, nor did it
significantly increase their rate of uptake into parasites (another result consistent with
carrier-mediated uptake). The low emission intensity of this series of compounds could be
due to their intrinsic low fluorescent yields. A comparison between the spectrum of
DB1680 and that of the related diamidine DB75, for example, showed a 6-fold lower
emission intensity for DB1680 than DB75, although the green fluorescent dye was used at
a higher concentration (20-fold) (Figure 4.6). Another factor which could have lead to
suboptimal fluorescence intensity emission of the five compounds could have been the
discrepancy between their excitation maxima, all close to 400 nm (Table 4.1), and the
standard FITC filter wavelength (λEX=470 nm) utilised for microscopy experiments. The
use of another filter set, which better matches the spectral excitation characteristics of the
green fluorescent diamidines, may allow obtaining of higher fluorescence emission yields.
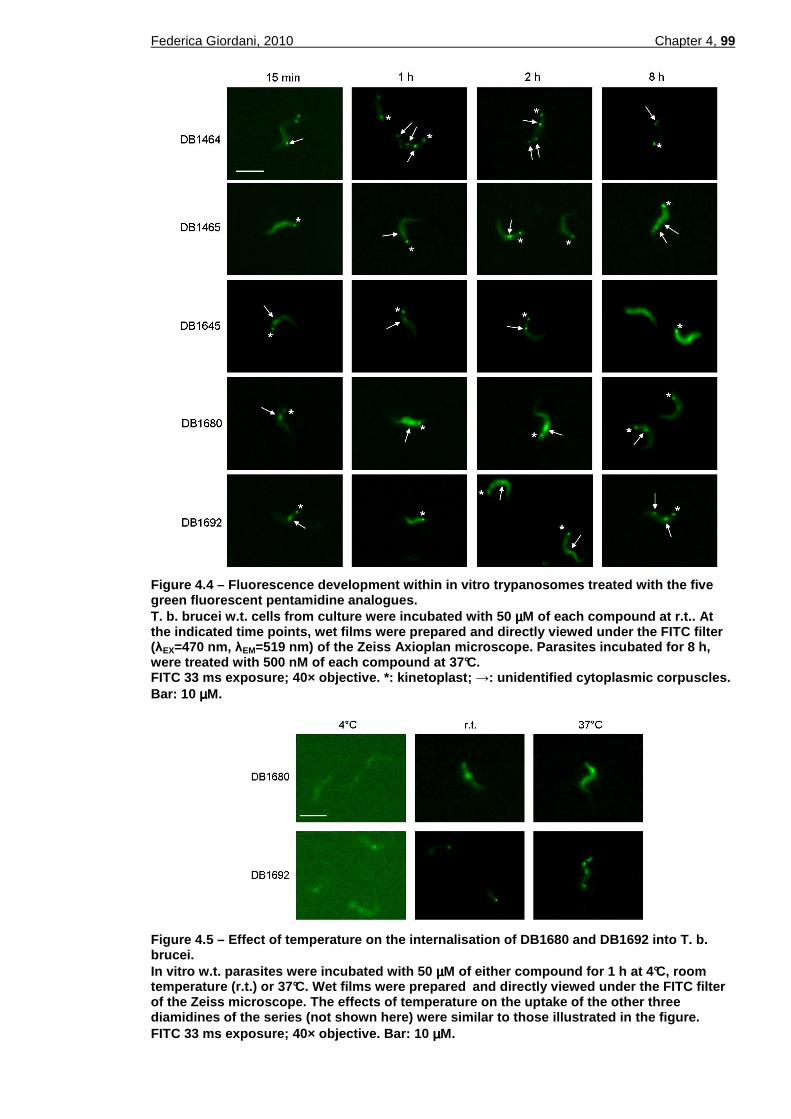
Federica Giordani, 2010 Chapter 4, 99
Figure 4.4 – Fluorescence development within in vitro trypanosomes treated with the five green fluorescent pentamidine analogues. T. b. brucei w.t. cells from culture were incubated with 50 µµµµM of each compound at r.t.. At the indicated time points, wet films were prepared and directly viewed under the FITC filter (λEX=470 nm, λEM=519 nm) of the Zeiss Axioplan microscope. Parasite s incubated for 8 h, were treated with 500 nM of each compound at 37°C. FITC 33 ms exposure; 40× objective. *: kinetoplast; →: unidentified cytoplasmic corpuscles. Bar: 10 µµµµM.
Figure 4.5 – Effect of temperature on the internali sation of DB1680 and DB1692 into T. b. brucei . In vitro w.t. parasites were incubated with 50 µµµµM of either compound for 1 h at 4°C, room temperature (r.t.) or 37°C. Wet films were prepared and directly viewed under the FITC filter of the Zeiss microscope. The effects of temperature on the uptake of the other three diamidines of the series (not shown here) were simi lar to those illustrated in the figure. FITC 33 ms exposure; 40× objective. Bar: 10 µµµµM.

Federica Giordani, 2010 Chapter 4, 100
300 350 400 450 500 550 600 650 7000
50
100
150
200EXEM
Wavelength (nm)
Inte
nsity
300 350 400 450 500 550 600 650 7000
200
400
600
800
1000EXEM
Wavelength (nm)
Inte
nsity
A B
300 350 400 450 500 550 600 650 7000
50
100
150
200EXEM
Wavelength (nm)
Inte
nsity
300 350 400 450 500 550 600 650 7000
200
400
600
800
1000EXEM
Wavelength (nm)
Inte
nsity
A B
300 350 400 450 500 550 600 650 7000
50
100
150
200EXEM
Wavelength (nm)
Inte
nsity
300 350 400 450 500 550 600 650 7000
200
400
600
800
1000EXEM
Wavelength (nm)
Inte
nsity
A B
Figure 4.6 – Fluorescence spectra of DB1680 and DB7 5. (A) The spectrum of DB1680, measured using a 1 µµµµM solution of the compound in dH 2O. (B) The spectrum of DB75, measured using a 50 nM so lution of the compound in dH 2O. Note the different scale of the axis of ordinates. EX: excitation spectrum; EM: emission spectrum.
4.2.1.2 Uptake and intracellular distribution
When wild type trypanosomes, stained with 50 µM of each diamidine, were viewed using
the FITC channel (Figure 4.4 and 4.9), two common features, shared by all of the five
green fluorescent compounds, could be identified: (1) all of them rapidly concentrated
inside the kinetoplast, which remained the brightest organelle beyond 8 hours incubation
time; (2) the nucleus could never be visualised. With the exception of DB1464, where this
characteristic was less marked, the fluorophores accumulated inside the cytoplasm, making
the whole cell shape distinguishable even at low magnification. Punctate fluorescent
granules, spread throughout the whole cell length and similar to those observed for DB75
upon FITC excitation (Section 3.2.7), could be detected among the diffuse cytoplasmic
signal.
A more pronounced fluorescent spot present in an area between the kinetoplast and the
nucleus of the cells was consistently detected by 15 minutes treatment with DB1645,
DB1692 and DB1680 (Figure 4.4). Since this region of the trypanosome cell is occupied
by the endomembrane compartments (Golgi complex and endosomes, Figure 1.3) and it is
in this area that all membrane trafficking takes place (Field et al., 2007; Field and
Carrington, 2009) we speculated a possible involvement of endocytosis (a highly active
process in bloodstream form) in the internalisation of these compounds. This hypothesis
was strengthened by the Alamar Blue results, which suggested alternative routes of entry,
other than P2, for the fluorophores (Section 4.2.2.1), and by the loss of diamidine
internalisation when incubating at 4°C (Figure 4.5), a temperature known to inhibit
endocytosis (Brickman et al., 1995; Coppens et al., 1995; Liu et al., 2000), as well as other

Federica Giordani, 2010 Chapter 4, 101
active mechanisms of uptake. To further test this idea, the fluorescence patterns were
assessed in in vitro wild type trypanosomes pre-treated with endocytic inhibitors before
staining with the diamidines DB1680 and DB1692. For these experiments we used
cytochalasin D (10 µM for 1 h at 37°C), a cell-permeable potent inhibitor of actin
polymerisation, which in bloodstream trypanosomes is required for the formation of coated
vesicles from the flagellar pocket membrane (García-Salcedo et al., 2004). The use of this
toxin, together with other membrane stabilizing drugs, was shown to reversibly inhibit
human serum lysis, a process that involves endocytosis (Rifkin, 1983; Ortiz-Ordóñez et al.,
1994). However, fluorescent micrographs did not evidence any significant change in dye
distribution following cytochalasin pre-treatment (Figure 4.7), the fluorophores continuing
to accumulate as posteriorly localised spots (although their number and size appeared
slightly increased following incubation with the toxin). Similarly, no evident effects were
observed after pre-treating with chloroquine (up to 200 µM for 1 h at 37°C), a
lysomotropic amine which had previously been used as a receptor-mediated endocytosis
inhibitor in both procyclic form (Liu et al., 2000) and bloodstream T. brucei (Coppens et
al., 1993 and 1995) (data not shown). These experiments did not, therefore, demonstrate an
endosomal localisation of the green fluorescent diamidines.
To study in more depth these fluorescent inclusions, trypanosomes had to be immobilised.
Methanol fixation of stained trypanosomes, however, proved inadequate, since it washed
away most of the incorporated fluorophore. A better system was to immobilise labelled
living parasites by embedding them in agarose (Section 2.5.2.2). This system allowed the
study of the fluorophores’ intracellular distribution in live parasites, avoiding artefacts
often produced by common fixation protocols.
When cells were immobilised in agarose and viewed at high magnification the cytoplasmic
fluorescent inclusions, already visible under 40× objective, became more obvious (Figure
4.8). Following DB1680 treatment, the vesicular structures tended to be localised to the
posterior of the cell, while after incubation with DB1692 other inclusions, present in the
anterior part of the cell, were clear, again inconsistent with endocytic vesicles.
Interestingly, fluorescent emission from cytoplasmic corpuscles could also be detected at
longer wavelengths, using the RHOD filter set (λEX=546 nm, λEM=590 nm), a phenomenon
already noticed for the diamidine DB75 (for which we observed fluorescence in the blue
and green regions of the spectrum; Chapter 3). The red fluorescent signal mostly
colocalised with the green emission, but intensity of each fluorescent corpuscle was
variable under the different filter sets. For DB1692, a prominent red fluorescent spot

Federica Giordani, 2010 Chapter 4, 102
Figure 4.7 – Effect of cytochalasin D on the uptake of DB1680 and DB1692. In vitro T. b. brucei w.t. cells (2×10 7 cells/ml) were pre-incubated with 10 µµµµM cytochalasin D (Cyt. D, Sigma-Aldrich) for 1 h at 37°C and then tr eated with 50 µµµµM of either diamidine for 1 h at 37°C. Aliquots of live parasites were put on a m icroscope slide, covered with a coverslip and directly viewed under the FITC filter of the Ze iss Axioplan microscope. Trypanosomes not pre-treated with cytochalasin and used as contr ol are shown on the left panels. FITC 33 ms exposure; 100× objective. *: kinetoplast; →: hypothetical endosomal vesicles. Bar: 10 µµµµM.
Figure 4.8 – Fluorescence images at high magnificat ion of trypanosomes treated with DB1680 and DB1692. T. b. brucei w.t. cells from culture were incubated with 50 µµµµM of either compound for 1 h at 37°C and successively put into ice to stop dye upta ke. DAPI (20 µµµµM) was added to the cells as DNA counterstain and left for 30 min before moun ting in 1% agarose. Trypanosomes were also viewed without addition of counterstain t o exclude possible interference of DAPI in the emission of the green fluorescent diamidines . Cells were viewed using various filters of the Zeiss Axioplan fluorescence microscope, as i ndicated in the images. Micrographs were merged using Adobe Photoshop 7.0 software. Time of exposure of the camera for the three filter s (DAPI, FITC, RHOD) was not kept constant; 100× objective. *: kinetoplast; ►: nucleus. Bar: 10 µµµµM.

Federica Giordani, 2010 Chapter 4, 103
appeared in a region between nucleus and kinetoplast after 1 hour treatment with the
fluorophore, but it was not visible at shorter time of incubation. The other three compounds
of the series yielded similar punctate emission upon RHOD excitation (data not shown).
These fluorescent corpuscles could be the same as those observed using the FITC channel
following DB75 treatment (Figure 3.9), although, following incubation with DB1692, they
appeared less homogeneous in size and some were localised at the posterior of the
kinetoplast (Figure 4.8). Further studies will be needed in order to understand the origin of
these spots. The general low intensity yield and the punctate fluorescent pattern meant that
this red emission will be of limited use as a fluorescent diagnostic marker for
trypanosomes.
4.2.1.3 Fluorescence in viable ex-vivo trypanosomes
To be useful for fluorescence-based trypanosomiasis diagnostics, it is important that
fluorophores are able to specifically label parasites among a complex blood matrix, the
fluid most widely used for parasitological examination in the field. The five green
fluorescent diamidines fulfilled this criterion, since they provided a specific staining of
trypanosomes without labelling erythrocytes in infected rat blood films, when given at
50 µM (Figure 4.9). As for in vitro samples, in ex-vivo-treated specimens the kinetoplast
appeared the brightest organelle. The other cytoplasmic fluorescent corpuscles were also
visible in these samples. Green fluorescent trypanosomes were readily detectable among
blood cells based on their movement and fluorescent dots (especially the bright
kinetoplast), which allowed them to be easily distinguished from crystals or debris that
fluoresced in the background using a low magnification objective (40×). As already
noticed for DB75, however, also these diamidines suffered a relatively fast photobleaching,
although the fading appeared less marked in blood samples compared to culture samples.
4.2.1.4 Fluorescence in fixed thin blood smears
When they were applied to fixed thin blood smears, fluorescence of the five pentamidine
analogues proved generally quite poor and suffered photobleaching. DB1692 appeared to
be the best of the series, labelling trypanosomes in methanol-fixed films with discrete
yields (Figure 4.10 A). When a dry thin smear, not fixed in methanol, was stained with the
same amount of the compound (10 µM), the quality of fluorescence was highly affected
(Figure 4.10 B). DB1692 could also be used to stain methanol-fixed trypanosomes from
culture, but in these samples fluorescence yields were low (Figure 4.10 C).

Federica Giordani, 2010 Chapter 4, 104
Figure 4.9 – Fluorescence images of live trypanosom es treated ex-vivo with each of the five green fluorescent pentamidine analogues. Aliquots of rat blood infected with T. b. brucei w.t. parasites were incubated with 50 µµµµM of each compound at 37°C and at the indicated time poi nts wet blood smears were prepared and viewed under the FITC filter of the Zeiss Axiop lan microscope. Bright field images are shown on the left of the corresponding fluorescent micrograph (note that position of motile trypanosomes can change in the two images). FITC 100 ms exposure; 40× objective. *: kinetoplast; →: cytoplasmic corpuscles. Bar: 10 µµµµM.
Figure 4.10 – Fixed T. b. brucei w.t. trypanosomes stained with DB1692. (A) Thin blood smear fixed in methanol and labelled with 10 µµµµM DB1692. (B) Thin blood smear, air-dried but not fixed in methanol, and lab elled with 10 µµµµM DB1692. (C) Trypanosomes from culture, fixed in methanol and st ained with 10 µµµµM DB1692. For all of the three samples, 50 µµµµl of dye solution were applied and spread with a co verslip. Specimens were viewed under the FITC filter of the Zeiss Axio plan microscope. FITC 68 ms (A and B) or 450 ms (C) exposure; 40× ob jective (A and B); 100× objective (C). →: white blood cell. Bar: 10 µµµµM.
Federica Giordani, 2010 Chapter 4, 105
4.2.1.5 Compatibility with the LED Cytoscience SMR microscope
The green fluorescent series of pentamidine analogues was specifically designed to create
P2 substrates with longer wavelengths than the UV diamidine DB75, in order to generate
new substrates to use in the arsenical drug resistance test (Stewart et al., 2005), in
association with the already available LED Cytoscience SMR field fluorescence
microscope (Jones et al., 2005 and 2007). Unfortunately, although of longer excitation
wavelength than DB75 (Table 4.1), the excitation maxima of the compounds of this series
were still too short to be compatible with the narrow band-emitting LED source of the
Cytoscience instrument (λEX=472 nm). DB1680 and DB1692 were the only two
compounds out of the five that yielded an extremely faint emission when observed under
this microscope (no images are available because no suitable camera could be connected
with the instrument). As previously discussed (Section 4.2.1.1), the standard FITC filter of
the Zeiss fluorescence microscope was not ideally matched with the spectral characteristics
of these diamidines, and the use of a more appropriate filter set (also for the LED
instrument) might allow a better exploitation of their fluorescent properties.
4.2.2 Use of the green fluorescent pentamidine anal ogues as
substrates for the arsenical drug resistance test
The five green fluorescent diamidines appeared to be accumulated into wild type
trypanosomes by a carrier-mediated process, although low fluorescence emission allowed
detection of the intracellular dyes only after 10-15 minutes. As with other diamidine
molecules, these compounds were expected to be internalised mainly by the P2/TbAT1
amino-purine transporter and, therefore, to enter only marginally into arsenical- and
diamidine-resistant parasites lacking this transporter’s activity. Tight dependence on the P2
carrier for their uptake would have made these compounds alternative probes to the UV
diamidines DB99 and DB75 for the arsenical drug resistance test.
4.2.2.1 Trypanocidal effect on wild type and P2-def icient T. b. brucei strains
To investigate the involvement of the P2 transporter in the molecules’ uptake, the Alamar
Blue assay was first performed. For the test, three different T. b. brucei strains were used:
wild type S427 line, tbat1-/- line, which lacks the gene that encodes for the P2 transporter
(Matovu et al., 2003) and B48 line, a pentamidine-adapted clone derived from tbat1-/- and
in which the HAPT (high affinity pentamidine transporter) activity is lost (Bridges et al., 2007).

Federica Giordani, 2010 Chapter 4, 106
IC50 (nM) Resistance factor Compound
w.t. tbat1-/- B48 tbat1-/- B48
DB1464 0.87 ± 0.57 6.92 ± 4.12 7.25 ± 1.51 8.0 8.3 DB1465 6.85 ± 3.72 71.40 ± 8.80 333.90 ± 24.52 10.4 48.7 DB1645 14.50 ± 6.32 232.93 ± 86.19 610.44 ± 133.21 16.1 42.1 DB1692 17.64 ± 9.79 436.10 ±82.39 344.20 ± 31.29 24.7 19.5 DB1680 266.20 ± 45.93 590.95 ± 84.94 340.48 ± 23.51 2.2 1.3
Pentamidine 0.61 ± 0.65 0.91 ± 0.41 166.95 ± 20.04 1.5 273.7
Table 4.4 – Trypanocidal activity of the five penta midine analogues against T. b. brucei S427 w.t., tbat1 -/- and B48 cell lines. IC50 values (drug concentration required to inhibit try panosome proliferation by 50%) were measured using the Alamar Blue assay (Section 2.4). Trypanotoxicity of pentamidine was used as positive control. Resistance factors were c alculated by dividing the IC 50 value obtained for each compound on the tbat1 -/- and B48 lines by the value obtained on the w.t. line. All data are reported ± the standard deviatio n and represent the mean of at least three independent experiments.
The Alamar Blue results on the wild type strain showed a potent trypanotoxicity for all of
the five diamidines, with IC50 in the nanomolar range (Table 4.4). DB1464 was the most
active trypanocide, having an IC50 close to the value of pentamidine. For this molecule,
loss of P2 (tbat1-/- line) corresponded to 8-fold decrease of toxic activity, indicating an
involvement of this permease in its uptake into the parasite. Similar loss of activity against
the tbat1-/- line, but more marked, was also observed for DB1465 and DB1645 (10- and 16-
fold resistance factor respectively), which had a very similar molecular structure to
DB1464 (Figure 4.1). Unlike DB1464, however, these last two compounds showed a high
dependence on HAPT for internalisation, their IC50 further increasing 38- and 26-fold,
respectively, when also activity of this transporter was lost (B48 line). DB1692 appeared to
be the diamidine most dependent on P2 activity, showing an IC50 nearly 25-fold higher on
the tbat1-/- line as compared to the wild type strain, with no further loss of toxicity in the
B48 line. The resistance factors measured for these four green fluorescent diamidines were
in the same order of magnitude (10- to 20-fold higher for tbat1-/- line compared to wild
type) of those reported for DB75 and diminazene, two trypanocidal drugs highly dependent
on P2 transport (Lanteri et al., 2006; Bridges et al., 2007). The addition of a single furan
ring in the linker of DB1680 drastically affected its trypanocidal activity (the molecule was
the less toxic of the series). The IC50 of this compound on tbat1-/- line was only 2-fold that
measured on the wild type strain, a value similar to that of pentamidine, a drug that only
partially relies on the P2 permease for uptake. However, if pentamidine internalisation was
highly disrupted by loss of HAPT (B48 line), the same effect was not observed for
DB1680, indicating that other routes of internalisation must play a role for its uptake.
In conclusion, the Alamar Blue results suggested that the pentamidine analogues
synthesised in Prof. D. W. Boykin’s laboratory were substrates for the P2 amino-purine

Federica Giordani, 2010 Chapter 4, 107
transporter, although other carriers (such as HAPT for DB1465 and DB1645), or other
routes of uptake (for DB1680), may play a role for their internalisation into trypanosomes.
Endocytosis could represent an alternative mechanism of entrance, but our experiments
failed to support this hypothesis (Section 4.2.1.2).
4.2.2.2 Fluorescence in wild type and P2-deficient T. b. brucei strains
The Alamar Blue results proved the presence of a link between the compounds’
cytotoxicity and active expression of the P2 amino-purine transporter, as expected for
diamidine compounds. Fluorescence microscopy was then used to assess if this correlation
also resulted in a differential fluorescence development in parasites lacking or expressing
the P2 permease, the crucial aspect for their use in the arsenical drug resistance test. For
microscopy, the same parasites lines used to perform the Alamar Blue assay (Section
4.2.2.1) were treated with each compound of the series (50 µM) for 15 min and viewed
under the FITC filter of the Zeiss fluorescence microscope (Figure 4.11). Unfortunately,
fluorescence micrographs did not reveal any significant difference in the diamidines’ speed
of uptake when comparing wild type, tbat1-/- and B48 lines. No differences were noticed
even after longer times of incubation (up to 2 hours).
The fact that we could not observe differential uptake in wild type and tbat1-/-cells after 15
minutes of incubation was not completely surprising: differences in intracellular
fluorescence development linked to the presence or absence of the P2 transporter are more
evident within the first minutes of incubation (Stewart et al., 2005), after which other
lower affinity transporters, or differential routes of uptake, can compensate for the absence
of this permease’s activity. Unfortunately, the low fluorescence yields observed for the
green diamidine series, under our experimental conditions, did not allow detectable signal
inside trypanosomes at shorter times of treatment (up to 10 minutes). For this reason we do
not consider these fluorescent diamidines to be suitable probes for the arsenical resistance
test, unless higher yields are obtained with a more compatible filter set.
4.2.3 Ethidium bromide and isometamidium chloride
The compounds belonging to the green fluorescent diamidine series did not possess all of
the necessary requisites to become fluorescent diagnostic markers for trypanosomiasis. The
main problems associated with their use were a low fluorescent yield upon FITC excitation
and a relatively fast photobleaching. Therefore, the staining properties of other

Federica Giordani, 2010 Chapter 4, 108
Figure 4.11 – Fluorescence images of T. b. brucei w.t., tbat1 -/- and B48 line treated with each of the five green fluorescent pentamidine analogues . Cells from culture were incubated with 50 µµµµM of each compound for 15 min at r.t. and directly viewed under the FITC filter of the Zeiss Axioplan microscope. FITC 33 ms exposure; 40× objective. Bar: 10 µµµµM.
commercially available fluorophores were assessed, in order to find better probes to label
trypanosomes. The phenanthridines ethidium bromide and isometamidium chloride were
considered of interest for our project, being both fluorescent and specifically absorbed by
trypanosomes (Cox et al., 1984; Boibessot et al., 2002). Fluorescence of propidium iodide
(an analogue of ethidium) and of acridine orange (an isomer of phenanthridine) were also
assessed (Sections 4.2.4 and 4.2.5 respectively).
4.2.3.1 Fluorescence in ex-vivo viable trypanosomes
Ethidium bromide quickly permeated live ex-vivo trypanosomes, yielding a bright
fluorescence of the kinetoplast after only 5-10 minutes incubation with low doses of the
compound (0.5, 1 µM) (Figure 4.12). However, we noticed that not all of the cells in the
sample were equally stained by the fluorochrome. At these concentrations, fluorescence

Federica Giordani, 2010 Chapter 4, 109
Figure 4.12 – Ethidium bromide fluorescence develop ment within live ex-vivo trypanosomes. Rat blood samples infected with T. b. brucei w.t. line were incubated ex-vivo with different concentrations of ethidium bromide at 37°C. At the indicated time points thin wet smears were prepared and viewed under the RHOD filter ( λEX=546 nm, λEM=590 nm) of the Zeiss Axioplan microscope. RHOD 68 ms exposure; 40× objective. *: kinetoplast; ►: nucleus. Bar: 10 µµµµM.
Figure 4.13 – Isometamidium chloride fluorescence d evelopment within live ex-vivo trypanosomes. Rat blood samples infected with T. b. brucei w.t. line were incubated with different concentrations of isometamidium chloride at 37°C. A t the indicated time points thin wet smears were prepared and viewed under the RHOD filt er of the Zeiss Axioplan microscope. No fluorescence could be detected for treatment wit h 0.5 µµµµM up to 10 min of incubation. RHOD 68 ms exposure; 40× objective. *: kinetoplast. Bar: 10 µµµµM.

Federica Giordani, 2010 Chapter 4, 110
Figure 4.14 – Fixed thin blood smears stained with ethidium bromide and isometamidium. Specimens were stained with 50 µµµµl of 5 µµµµM ethidium bromide (A) or isometamidium (B) and immediately viewed under the RHOD filter of the Zei ss Axioplan microscope. The fixed smears had been prepared a fortnight before the exp eriments, using murine blood infected with T. b. brucei w.t. trypanosomes. Slides were kept in a box until use. RHOD 68 ms exposure; 40× objective. →: white blood cell. Bar: 10 µµµµM.
development inside the nucleus was slightly delayed compared to that of the kinetoplast.
At 5 µM the nucleus was, however, already visible after 5 minutes of treatment, although
its emission was comparable to that of the kinetoplast only after further 10 minutes.
Nucleus and kinetoplast were the main detectable organelles, but ethidium also produced a
low fluorescence from the cell cytoplasm. Red blood cells remained unstained. After
longer times of incubation (1 hour when given at 5 µM and 2 hours when given at 1 µM)
treatment with ethidium caused bursting of parasites present in the samples.
Treatment of ex-vivo trypanosomes with isometamidium chloride, using the same
concentrations utilised during the experiments with ethidium bromide, showed a much
lower fluorescence (Figure 4.13). The only bright signal easily detectable while examining
these samples under RHOD filter was a spot corresponding to the kinetoplast of the
parasites. No other organelles could be detected up to 30 minutes incubation using these
doses and only a very faint fluorescence in the cell’s cytoplasm was evident.
4.2.3.2 Fluorescence in fixed thin blood smears
Ethidium bromide proved a good probe for trypanosome staining in thin fixed blood
smears. A low concentration of the dye (5 µM) was sufficient to give a bright red
fluorescence to the parasites, while leaving the erythrocytes unlabelled (Figure 4.14 A).
Application of an isometamidium solution (5 µM) to the smear, instead, stained the red
blood cells (Figure 4.14 B), which yielded a low background emission, only slightly lower

Federica Giordani, 2010 Chapter 4, 111
than that emitted by trypanosomes. For these experiments, films that were several weeks
old were used. Storage could have determined a slight deterioration of the specimens,
causing the homogeneous staining of the parasites’ cytosol and hampering the distinction
of the nucleus and the kinetoplast.
4.2.4 Propidium iodide
4.2.4.1 Fluorescence in in vitro viable trypanosomes
Despite being considered a membrane-impermeant dye, propidium iodide was shown to
stain viable T. brucei parasites with a bright red fluorescence, more intense than that of its
analogue ethidium bromide (Cox et al., 1984). Our microscopy experiments confirmed
these findings. When in vitro-cultured wild type trypanosomes were incubated at 37°C
with micromolar concentrations of this phenanthridine (10-50 µM), the fluorophore was
absorbed by the cells, staining with a stable fluorescence the nucleus and, to a lesser extent,
the kinetoplast (Figure 4.15, left panels). Propidium also dispersed inside the cytoplasm,
revealing the shape of the whole cell. For in vitro parasites, long times of incubation
(greater than 1 hour) were needed to obtain the internalisation of sufficient dye in order to
give a relatively good signal-to-noise ratio, indicating a slow mechanism of uptake for this
fluorophore.
4.2.4.2 Fluorescence in ex-vivo viable trypanosomes
Using prolonged incubation times (1-2 hours), in ex-vivo specimens, propidium iodide
brightly stained trypanosomes, leaving the erythrocytes non-fluorescent. Interestingly,
when parasites grown in rodents were treated ex-vivo following the same protocol used for
in vitro cells, their corresponding fluorescence intensity appeared much higher (Figure
4.15, right panels), even though their general fluorescent pattern was identical. A
significant fraction of wild type trypanosomes in infected rat blood samples was killed by
this phenanthridine after 2 hours of incubation, the cells appearing to be lysed by the dye
(given at 10 or 50 µM). At this time point, the same concentration of the fluorophore did
not kill in vitro cells. The high trypanocidal activity of propidium on wild type cells was
confirmed by our Alamar Blue data: for this compound we measured an IC50 of 30.26 ±
7.66 nM (mean of three experiments ± standard deviation).

Fig
ure
4.15
– F
luor
esce
nce
imag
es o
f in
vitr
o an
d e
x-vi
vo tr
ypan
osom
es s
tain
ed w
ith p
ropi
dium
iodi
de.
In v
itro
T. b
. bru
cei
w.t.
par
asite
s (2
×10
7 cel
ls/m
l, le
ft pa
nels
) an
d al
iquo
ts o
f rat
blo
od i
nfec
ted
with
the
sam
e ce
ll lin
e (
ex-v
ivo
, rig
ht p
anel
s) w
ere
incu
bate
d w
ith 1
0 or
50
µµ µµM o
f pro
pidi
um fo
r 1
or 2
hou
rs a
t 37°
C. W
et fi
lms
of c
ultu
re m
ediu
m a
nd w
et th
in b
lood
sm
ears
con
tain
ing
stai
ned
para
site
s w
ere
view
ed u
nder
the
RH
OD
filte
r of
the
Zei
ss A
xio
plan
mic
rosc
ope.
Brig
ht fi
eld
imag
es fo
r th
e ex
-viv
o s
ampl
es a
re s
how
n on
the
right
of t
he
corr
espo
ndin
g flu
ores
cenc
e m
icro
grap
h (n
ote
that
the
posi
tion
of m
otile
tryp
anos
omes
can
cha
nge
in th
e tw
o im
ages
).
RH
OD
68
ms
expo
sure
; 40×
obj
ectiv
e.
*: k
inet
opla
st; ►
: nuc
leus
; †: d
ead
cell.
Bar
: 10
µµ µµM.
Federica Giordani, 2010 Chapter 4, 113
The different levels of propidium absorption by in vitro and ex-vivo trypanosomes could be
due to the fact that cells from rodents might be more fragile than those grown in culture,
resulting in their being more permeable to the fluorophore. However, ex-vivo parasites
incubated up to 1 hour with propidium iodide appeared normal and actively motile in the
sample. We may also hypothesize a mechanism of transport of this compound into
trypanosomes, subject to down-regulation in in vitro-grown cells compared to in vivo-
grown parasites, as occurs with uptake of DB75 by the P2/TbAT1 transporter (Chapter 6).
Uptake experiments carried out in our laboratory showed that pentamidine can partially
inhibit ehidium bromide internalisation (Chris Ward, personal communication), suggesting
a competition for the same surface binding sites. It is possible that propidium, being an
analogue of ethidium, is transported by similar permeases into trypanosomes. Co-treatment
of ex-vivo wild type trypanosomes with propidium (1 µM) and P2-substrates DB75
(10 µM) or adenosine (25 mM), however, did not reveal significant differences in
fluorescence development as compared to cells treated with propidium alone (data not
shown). This result excluded a primary role of the P2 transporter in the uptake of the
phenanthridine. Future fluorescence experiments on mutant strains lacking specific
pentamidine transporters could reveal if they are involved in the uptake of propidium
iodide and give some indications regarding how it crosses the parasite’s membrane.
When viewed at low magnification, the trypanosome’s cytosol appeared homogeneously
stained by propidium iodide (Figure 4.15). However, when cells were examined at high
magnification (100× objective) the cytoplasmic emission showed a punctate distribution
(Figure 4.16). These fluorescent granules could correspond to the inclusion bodies already
observed in trypanosomes treated with other phenanthridines (Ormerod, 1951; Taylor,
1960). The inclusion bodies were described as cytoplasmic granules mainly composed of
ribonulceic acids and proteins, hence a target for propidium iodide, which is a known
strong RNA-binding compound.
Since propidium was capable of labelling viable parasites in blood samples, its staining
properties were assessed for lower dye concentration and shorter times of incubation.
These experiments were carried out in order to identify a protocol more suitable for field
diagnostic purposes, for which reagent availability and sample processing time are of
fundamental importance. Microscopy showed that in ex-vivo samples treated at 37°C,
concentrations of the fluorophore as low as 5 µM could stain live trypanosomes in 10-15
minutes, although the emission was not bright (Figure 4.17). Propidum internalisation was
dose- and time- dependent: when 0.5 µM of the fluorophore were used, at least 30 minutes

Federica Giordani, 2010 Chapter 4, 114
Figure 4.16 – Propidium iodide-stained trypanosome viewed at high magnification. Aliquots of rat blood infected with T. b. brucei w.t. parasites were incubated ex-vivo with 10 µµµµM propidium iodide for 1 h at 37°C. The wet thin sm ear was viewed under the RHOD filter of the Zeiss Axioplan microscope. RHOD 68 ms exposure; 100× objective. *: kinetoplast; ►: nucleus. Bar: 10 µµµµM.
Figure 4.17 – Propidium iodide fluorescence develop ment within ex-vivo trypanosomes. Rat blood samples infected with T. b. brucei w.t. parasites were incubated with different concentrations of propidium iodide at 37°C. At the indicated time points thin wet smears were prepared and viewed under the RHOD filter of t he Zeiss Axioplan microscope. RHOD 68 ms exposure; 40× objective. *: kinetoplast; ►: nucleus. Bar: 10 µµµµM.
were needed to obtain a discrete staining of trypanosomes, while this time decreased to 15-
20 minutes when 1 µM was applied. If incubation was carried out at room temperature,
fluorescence development was significantly reduced, possibly due to a lower fluidity of the
plasma membrane. During these experiments using wet films, white blood cells labelled by
the dye were never observed. This suggested the hypothesis that propidum entered
trypanosomes using specific transporters that were not present on leukocytes’ surface.

Federica Giordani, 2010 Chapter 4, 115
Figure 4.18 – Fixed thin blood smears stained with propidium iodide. (A) Blood smear air-dried and fixed in methanol bef ore staining with 5 µµµµM of propidium. (B) Blood smear air-dried and stained with 5 µµµµM of propidium without methanol fixation. Both specimens were covered with a coverslip and im mediately viewed under the RHOD filter of the Zeiss Axioplan microscope. Specimen e xamination was carried out within few hours from their preparation using murine blood inf ected with T. b. brucei w.t.. Note that the nuclei of trypanosomes on the top right and at the bottom of panel B appear swollen. RHOD 68 ms exposure; 40× objective. →: white blood cell; *: kinetoplast; ►: nucleus. Bar: 10 µµµµM.
4.2.4.3 Fluorescence in fixed thin blood smears
Propidium iodide yielded very bright fluorescence in fixed infected thin blood films. In
these specimens, where the barrier represented by intact membranes was eliminated,
application of 5 µM of the fluorophore gave an immediate red fluorescence inside
trypanosomes and nucleated blood cells (Figure 4.18 A). The nucleus and kinetoplast of
parasites were brightly labelled as well as other nucleic acids present in the sample. A
faster and simpler preparation of the specimens was assessed: air-dried smears were
immediately stained with the fluorophore without previous fixation in methanol. In these
specimens trypanosomes were brightly fluorescent, but the shape of the cells could appear
deformed and damaged, often showing an enlarged nucleus (Figure 4.18 B). When used to
stain old, fixed specimens (kept in a box for several weeks) propidium iodide
homogeneously stained the whole cell body of parasites (Figure 4.25 A).
4.2.4.4 Compatibility with the LED Cytoscience SMR microscope
Another interesting feature of propidium iodide was its compatibility with the LED
Cytoscience SMR fluorescent microscope. Using this instrument, parasites in thin smears
and stained with 5 µM of the fluorophore appeared orange-red, easily distinguishable from
the red blood cells, green on the background (as already mentioned previously, no images
were produced since a suitable camera was not available).

Federica Giordani, 2010 Chapter 4, 116
4.2.5 Acridine orange
None of the novel and known fluorescent dyes described above possessed all of the
characteristics an ideal probe for trypanosome detection must have (fast labelling, high
yield, specificity, photochemical stability, affordability). The widely used fluorophore
acridine orange, instead, appeared to have most of these qualities, as confirmed by our
experiments.
4.2.5.1 Fluorescence in in vitro viable trypanosomes
Acridine orange quickly permeated the parasite’s membrane, yielding a bright green
fluorescence upon FITC excitation (Figure 4.19). A concentration as low as 1 µM of this
compound was sufficient for obtaining a bright signal within 1 minute of incubation. The
temperature of treatment did not affect dye penetration inside the cells, indicating passive
diffusion (Figure 4.19). Treatment with the fluorophore revealed the nucleus and the
kinetoplast of trypanosomes, but it also produced a cytoplasmic diffuse green fluorescence,
which greatly facilitated detection of parasites in the specimen. These characteristics made
acridine the best fluorescent probe for trypanosomes tested during the project.
Nevertheless, its use in the arsenical drug resistance test (Stewart et al., 2005) was not
possible, since this fluorophore crosses the plasma membrane non-specifically and our
experiments showed that its internalisation was completely unaffected by the presence
(wild type line) or absence (tbat1-/- line) of the P2/TbAT1 transporter on the parasites’
surface (Figure 4.19). After only 15 minutes of incubation with the dye (1 µM, 37°C), a
few cells from in vitro culture started to show some aberrations (i.e. fragmentation of the
nucleus, abnormal shape), a probable consequence of the genotoxicity of acridine orange.
In attempt to detect the acidocalcisomes, a known intracellular target of acridine orange,
stained parasites were examined at high magnification. Due to the high fluorescent
emission of the dye upon FITC filter excitation, however, visualization of these organelles
proved difficult and only some of them emerged from the diffuse cytoplasmic green
fluorescence (Figure 4.20). A brighter vacuole, situated at the posterior of the cell, and
believed to be the lysosome, based on its intracellular position (Shimamura et al., 2001),
was evidenced using both FITC and RHOD filter set. This vesicular structure,
distinguishable from the others by its more intense emission, did not appear in previously
published epifluorescence micrographs of T. evansi (Mendoza et al., 2002) and procyclic
trypomastigotes of T. brucei (Docampo and Moreno, 1999) treated with acridine orange,

Federica Giordani, 2010 Chapter 4, 117
Figure 4.19 – In vitro wild type and tbat1 -/- trypanosomes treated with acridine orange at different temperatures. Aliquots of T. b. brucei w.t. cells from culture were incubated with 1 µµµµM acridine orange at 4°C, room temperature or 37°C for 1 minute. Wet fil ms were viewed under the FITC filter of the Zeiss Axioplan microscope. Fluorescence intensi ty of labelled parasites was not affected by different incubation temperatures or by the absence of the P2 amino-purine transporter ( tbat1 -/- line) on the cell surface. FITC 68 ms exposure; 40× objective. *: kinetoplast; ►: nucleus. Bar: 10 µµµµM.
Figure 4.20 – Acridine orange-stained trypanosome v iewed at high magnification. T. b. brucei w.t. trypanosomes from culture were incubated with 5 µµµµM acridine orange at 37°C for 15 minutes and embedded in 1% agarose befo re viewing at ×1,000 total magnification. For fluorescence the FITC and RHOD f ilters of the Zeiss Axioplan microscope were used. FITC 5 ms exposure, RHOD 68 ms exposure; 100× objec tive. →: acidocalcisomes; ►: lysosome. Bar: 10 µµµµM.
although differences in sample preparation and cell line used do not allow direct
comparison with our work.
4.2.5.2 Fluorescence in ex-vivo trypanosomes
Acridine orange has already been successfully used to selectively stain parasites, including
trypanosomes, among blood cells (Kawamoto, 1991; Bailey and Smith, 1992; Delacollette

Federica Giordani, 2010 Chapter 4, 118
and Van der Stuyft, 1994; Adeoye and Nga, 2007). During our fluorescence experiments
on infected rat blood, we were able to label viable T. b. brucei with a bright green
fluorescence, using a very low concentration of the dye (5 µM) (Figure 4.21). Vital
staining of parasites was extremely fast (1 minute was sufficient to obtain a bright signal)
and red blood cells remained largely unlabelled (although some appeared to fluoresce
faintly). Labelling of live trypanosomes in a blood samples could be easily carried out by
directly adding few microliters of acridine orange solution directly to the drop of blood
before the preparation of the wet film. This procedure, already illustrated for malaria
parasites (Metzger and Nkeyi, 1995), had many advantages, being extremely fast (there
was no need to air-dry or fix the specimen) and allowing easy discrimination of parasites
due to their motility among blood cells.
Direct application of acridine orange (5 µM) to dried, fixed blood smears, was equally
effective (Figure 4.22 A). In these specimens trypanosomes were instantaneously stained
by the dye. The kinetoplast and the nucleus of parasites appeared very bright, but the entire
cell shape of the parasites was also revealed upon FITC excitation. Other nucleated cells in
the specimen showed high emission. In an attempt to simplify sample preparation, we also
stained a thin air-dried smear with the same dose of acridine orange, eliminating the
methanol fixation step (as previously shown for propidium iodide). In this case the
trypanosomes’ nucleus and kinetoplast also appeared brightly fluorescent, but the
cytoplasm remained unstained (Figure 4.22 B). The samples used during these experiments
were prepared on the same day as the test. When acridine orange was used to label few
weeks old thin blood films, the fluorescence inside trypanosomes appeared more evenly
distributed, and no organelles could be distinguished (as already observed for blood smears
stained with propidium iodide, Section 4.2.4.3).
4.2.5.3 Compatibility with the LED Cytoscience SMR microscope
The LED Cytoscience SMR microscope was designed to excite green fluorescent
compounds such as acridine orange (Jones et al., 2007) and the efficacy of the instrument
in visualising malaria parasites labelled with this fluorophore has already been proven
(Jones et al., 2005 and 2007). Similarly, acridine orange-stained T. b. brucei could be
readily identified under the LED source of the Cytoscience microscope, appearing highly
fluorescent over a black background (no images are available).

Federica Giordani, 2010 Chapter 4, 119
Figure 4.21 – Wet thin blood smear stained with acr idine orange. Murine blood infected with T. b. bru cei w.t. was incubated with 5 µµµµM acridine orange at r.t. for 1 minute. An aliquot of the sample was then use d to prepare the wet smear which was viewed under the FITC filter of the Zeiss Axioplan microscope. Note that the position of motile trypanosomes changed during acquisition of f luorescence and bright field images. FITC 60 ms exposure; 40× objective. Bar: 10 µµµµM.
Figure 4.22 – Fixed thin blood smears stained with acridine orange. (A) Blood smear air-dried and methanol-fixed before staining with 5 µµµµM of acridine orange. (B) Blood smear air-dried and stained with 5 µµµµM of acridine orange without methanol fixation. Both specimens were prepared using murine blood infected with T. b. brucei w.t. parasites. After staining, slides were covered with a coverslip and immediately viewed under the FITC filter of the Zeiss Axioplan microsc ope. Specimens examination was carried out within few hours from their preparation. FITC 68 ms exposure; 40× objective. →: white blood cell. *: kinetoplast; ►: nucleus. Bar: 10 µµµµM.
4.2.6 Fluorescent staining of thick blood smears
The fluorescent properties of the dyes tested during this project were mainly studied using
thin blood films (whether wet or fixed). However, although thin specimens are still used in
the field due to their straightforward preparation, their examination suffers a very low
sensitivity (Chappuis et al., 2005). Preparation of Giemsa-stained thick films is usually
preferred for diagnosis, decreasing the detection limit from 10,000 to 5,000 cells/ml (Louis
et al., 2001; Chappuis et al., 2005). Hence, in order to be a useful tool for the diagnosis of

Federica Giordani, 2010 Chapter 4, 120
Figure 4.23 – Air-dried thick blood smears stained with acridine orange or propidium iodide. The thick smears infected with T. b. brucei were left to air-dry and kept unfixed until staini ng with 5 µµµµM of acridine orange (A) or propidium iodide (B): 3 0 µµµµl of either dye solutions were applied to the smear and covered with a coverslip. Acridine orange was excited using the FITC filter of the Zeiss Axioplan microscope, while propidium iodide was excited using the RHOD filter set. FITC and RHOD 68 ms exposure; 100× objective. →: white blood cell; ♦: trypanosome. Bar: 10 µµµµM.
trypanosomiasis, fluorescence microscopy has to be easily applied to thick blood
preparations as well as thin films. Since acridine orange and propidium iodide had proven
very efficacious in staining trypanosomes, these two fluorophores were used to assess the
feasibility of different staining protocols for fluorescent labelling of infected thick blood
films (see Section 2.5.3 for preparation of these specimens).
The first protocol evaluated involved direct staining of air-dried thick smears. To prepare
the samples, a drop of either dye (30 µl of a 5 µM solution) was put onto a dry, unfixed
thick film, and covered with a coverslip. This resulted in a partial solubilisation and
haemolysis of the sample, which was unevenly spread on the microscope slide surface.
Fluorescence from these samples was relatively unfocused, with a high background
probably being due to the unbound dye (Figure 4.23). White blood cells showed bright
fluorescence, while trypanosomes had only low emission. If the fluorophores were applied
to the thick smear and allowed to air-dry without applying a coverslip, examination of the
specimen revealed the presence of crystals, high background and no specific fluorescence.
A different protocol included a dehaemoglobinisation step to eliminate the red blood cells
from the film before staining, as is performed for the preparation of malaria specimens for
fluorescence microscopy (Sodeman, 1970; Caramello et al., 1993). Air-dried thick smears
were soaked in distilled water for 5 minutes, left to dry and then fixed in cold methanol for
2 minutes. After evaporation of the fixative, samples were stained, as previously described,
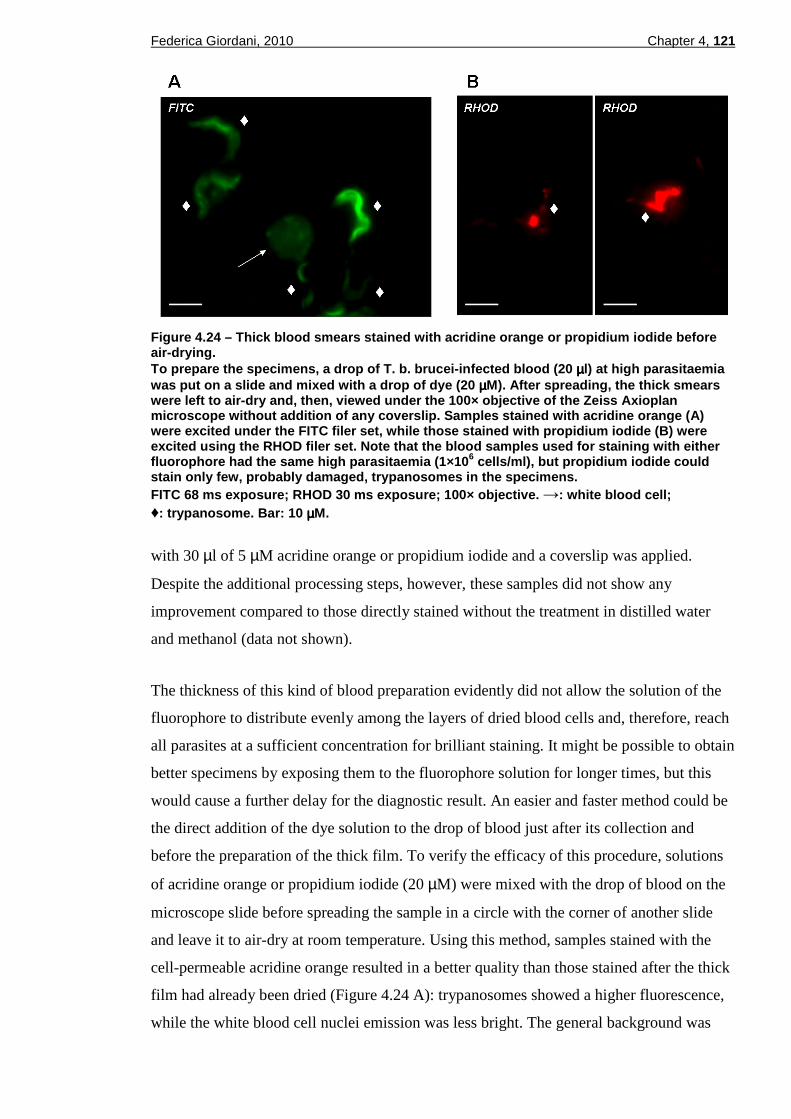
Federica Giordani, 2010 Chapter 4, 121
Figure 4.24 – Thick blood smears stained with acrid ine orange or propidium iodide before air-drying. To prepare the specimens, a drop of T. b. brucei -infected blood (20 µµµµl) at high parasitaemia was put on a slide and mixed with a drop of dye (20 µµµµM). After spreading, the thick smears were left to air-dry and, then, viewed under the 10 0× objective of the Zeiss Axioplan microscope without addition of any coverslip. Sampl es stained with acridine orange (A) were excited under the FITC filer set, while those stained with propidium iodide (B) were excited using the RHOD filer set. Note that the blo od samples used for staining with either fluorophore had the same high parasitaemia (1×10 6 cells/ml), but propidium iodide could stain only few, probably damaged, trypanosomes in t he specimens. FITC 68 ms exposure; RHOD 30 ms exposure; 100× obje ctive. →: white blood cell; ♦: trypanosome. Bar: 10 µµµµM.
with 30 µl of 5 µM acridine orange or propidium iodide and a coverslip was applied.
Despite the additional processing steps, however, these samples did not show any
improvement compared to those directly stained without the treatment in distilled water
and methanol (data not shown).
The thickness of this kind of blood preparation evidently did not allow the solution of the
fluorophore to distribute evenly among the layers of dried blood cells and, therefore, reach
all parasites at a sufficient concentration for brilliant staining. It might be possible to obtain
better specimens by exposing them to the fluorophore solution for longer times, but this
would cause a further delay for the diagnostic result. An easier and faster method could be
the direct addition of the dye solution to the drop of blood just after its collection and
before the preparation of the thick film. To verify the efficacy of this procedure, solutions
of acridine orange or propidium iodide (20 µM) were mixed with the drop of blood on the
microscope slide before spreading the sample in a circle with the corner of another slide
and leave it to air-dry at room temperature. Using this method, samples stained with the
cell-permeable acridine orange resulted in a better quality than those stained after the thick
film had already been dried (Figure 4.24 A): trypanosomes showed a higher fluorescence,
while the white blood cell nuclei emission was less bright. The general background was
Federica Giordani, 2010 Chapter 4, 122
also lower and the image more focused. Propidum iodide, however, did not stain
trypanosomes or other nucleated cells in these specimens, leading to a general red
background. It is probable that the time needed for the smear to dry (several minutes) was
not sufficient for this dye to permeate the cells and only trypanosomes with damaged
membranes internalised the fluorophore becoming highly fluorescent (Figure 4.24 B).
Of all the protocols used, direct application of acridine orange to the drop of blood before
preparation of the thick film appeared to be the best technique, both for its straightforward
procedure and the quality of the fluorescence. To allow even higher levels of trypanosome
staining, it could also be possible to collect the blood in a small tube, in which incubation
with the fluorophore could proceed for longer times, followed by preparation of the thick
smear (this was the protocol most used to stain infected blood samples during this project,
see Section 2.5.3.2).
When considering the use of fluorescently stained thick blood smears for diagnosis,
another important aspect to consider is the necessity of having a microscope equipped with
a high magnification, oil-immersion objective to examine the samples. Even though
fluorescent parasites could also be detected in the thick specimen using the 40× objective,
in the field high magnification objectives (100×) are used in order to identify, with
confidence, trypanosomes in thick smears, where they usually appear deformed. The
current LED Cytoscience microscope, however, has only a single, fixed 40× objective
fitted, not suited to view thick smears. Future prototypes will have to take into account this
issue and include higher magnification objectives in their design.
4.2.7 Double stain with Giemsa and fluorophores
The introduction of LED fluorescence microscopes in health care facilities of HAT
endemic countries would be intended not only as a substitute to traditional parasitological
techniques, but also as a complementary tool. The combination of both light and
fluorescence microscopy could offer a simple way of improving accuracy of
parasitological examination, by offering the possibility to re-check dubious specimens for
diagnostic confirmation. This would be particularly useful for fixed samples, whether thin
or thick Giemsa-stained blood films. For this reason, it would be ideal that each specimen
could be easily examined using both techniques. Therefore, the possibility of double
staining Giemsa-treated thin blood samples with acridine orange or propidium iodide, a
procedure shown to be feasible for some fluorescent dyes (Guy et al., 2007), was assessed.

Federica Giordani, 2010 Chapter 4, 123
Figure 4.25 – Thin blood smears stained with propid um iodide alone or double-stained with Giemsa and the fluorophore. (A) Blood smear labelled with 50 µµµµl of 5 µµµµM propidium iodide. (B) Giemsa-stained blood smear (5% Giemsa solution) subsequently stained with 5 µµµµM of propidium iodide. Murine blood infected with T. b. brucei w.t. (1×10 6 cells/ml) was used to prepare the thin films, which were left to air-dry and kept in a slide box for several weeks before staining. Both specimens were viewed under t he same experimental conditions, using the RHOD filter of the Zeiss Axioplan microsc ope. RHOD 68 ms exposure; 40× objective. The arrow in pa nel B indicates a trypanosome. Bar: 10 µµµµM.
Thin infected blood smears, stained with a 5% Giemsa solution (Section 2.5.3.3), were
subsequently treated with 5 µM of either fluorophore and viewed under the fluorescence
microscope. In these specimens, however, neither trypanosomes nor white blood cells
acquired fluorescence (Figure 4.25 B for the specimen stained with propidium), a result
probably due to the fact that the binding sites targeted by the fluorophores (i.e. nucleic
acids) were already occupied by the Giemsa stain.
An alternative protocol could involve sequential staining of the same specimen, by
introducing a destaining step of the Giemsa solution before the addition of the fluorophore.
To destain Giemsa-labeled specimens we soaked thin films in a solution of 90% ethanol
and 1.5% HCl for 30 minutes (Suzuki et al., 1991). The samples were, then, stained with
5 µM of acridine orange or propidium iodide and immediately examined under
fluorescence microscopy. The destaining procedure proved capable of eliminating enough
Giemsa dye in order to allow both fluorophores to label parasites, but the emission was not
as brilliant as in samples directly stained for florescence microscopy. Moreover, the
background was relatively high and this hampered quick detection of parasites.
Simultaneous labelling of the same specimen with a fluorophore and the histological
Giemsa stain would offer the advantage of complementing bright field and fluorescence
microscopy. However, the incompatibility of the dyes used usually hampers this approach,

Federica Giordani, 2010 Chapter 4, 124
as observed for association of propidium iodide and acridine orange with Giemsa. In the
future, it will be important to verify other combinations of staining agents or, eventually, to
define a straightforward and efficient destaining protocol, in order to improve the overall
diagnostic performance and accuracy of microscopy.

Federica Giordani, 2010 Chapter 4, 125
4.3 Discussion
4.3.1 New fluorophores for the arsenical drug resis tance test
The arsenical drug resistance test was developed as a quick, simple assay to identify
trypanosome strains resistant to diamidines and arsenical drugs (Stewart et al., 2005). As
for other diagnostic techniques, its introduction in poor-income endemic countries is
mainly hampered by the need for expensive, sophisticated fluorescence microscopes, but
the use of cheaper LED-driven instruments could make this technique more easily
affordable. We showed the feasibility of performing the test in association with a
prototypical UV LED-illuminated microscope (Chapter 3), although the detailed conditions
of the test still need optimisation.
The original assay developed by Stewart and collaborators used UV fluorescent diamidines
as substrates (Stewart et al., 2005). However, UV LED light sources for fluorescence
microscopy are not yet widely available as compared to LEDs for excitation of green-
emitting fluorophores. The LED Cytoscience SMR microscope, for example, works in this
spectral region (λEX=472 nm, λEM>500 nm). We were, therefore, interested in identifying
new compounds to use as substrates for the test but with longer excitation wavelengths
than those of the originally used UV fluorescent compounds. The series of five green
fluorescent pentamidine analogues synthesised in Prof. D. W. Boykin’s laboratory
appeared to be interesting for this purpose, since they carried the P2/TbAT1 recognition
motif and had longer excitation wavelengths than that of their parental compound DB75
(Table 4.1). The Alamar blue data confirmed a dependence on this transporter for uptake
into trypanosomes (Table 4.4). DB1680 appeared to rely less on this mechanism of uptake,
but we failed to prove a possible involvement of an endocytic mechanism of
internalisation. Passive diffusion through the membrane could represent another route of
entry for DB1680: the polar nature given by the dicationic structure of the DB compounds
is thought to hamper the interaction with the lipid layer, but the presence of multiple
aromatic rings in the molecule linker could increase its lipophilicity and allow a faster
diffusion. Although the other four compounds of the series lost some trypanocidal activity
in the absence of an active P2 transporter, we were not able to identify clear differences in
fluorescence development in treated trypanosome strains expressing, or not expressing, the
P2 amino-purine transporter (Figure 4.11). The main problem with these diamidines,
however, was their low fluorescence, which did not allow detection of green signal within
Federica Giordani, 2010 Chapter 4, 126
short incubation times (within 15 minutes). The low emission was probably caused by the
intrinsic low yields of the compounds, but also by the use of an inappropriate detection
system, since the standard FITC filter only partially matched the spectral region in which
the green diamidines fluoresced. Due to their excitation maxima being too short, the five
dyes were also incompatible with the LED Cytoscience SMR microscope. The use of
another LED source with a shorter excitation wavelength (~420 nm) fitted into this
instrument, however, could allow the detection of the diamidines’ green fluorescence.
The five green fluorescent molecules were capable of specifically staining trypanosomes in
blood samples (Figure 4.9), a characteristic that could make them possible fluorescent
markers for trypanosomes, if appropriate filter sets and LED sources could lead to higher
yields from the compounds.
4.3.2 Intracellular distribution of the five pentam idine analogues
The study of the fluorescent properties of the pentamidine analogues revealed interesting
staining features which raised new questions about their intracellular targets and
mechanism of trypanotoxicity. As with other diamidines (Mathis et al., 2007) these
compounds were good DNA binders: melting temperatures measured for DB1464,
DB1680 and DB1692 bound to a poly(dA)·poly(dT) oligomer were 9.4, 15.0 and 17.0 °C
respectively (these data were kindly provided by Prof. D. W. Boykin). However, during
our experiments none of the five compounds apparently labelled the nucleus of
trypanosomes, while all of them brightly stained the kinetoplast DNA (kDNA). This result
was unexpected, since nuclear DNA, which is surrounded by a porous membrane, should
be more accessible to fluorophores than the kinetoplast, which is enclosed inside the
mitochondrial membrane. It is probable that most diamidines reach the kDNA before other
intracellular targets because the mitochondrial membrane potential acts as a potent driving
force (de Koning, 2008). However, during our experiments, visible fluorescence inside the
nucleus did not develop even after long incubation times (up to 8 h) (Figure 4.4). A
possible explanation for the lack of signal development from inside the nucleus is that the
pentamidine analogues did enter the organelle to reach the chromosomal DNA, but an
unknown phenomenon caused quenching of their emission. Another possibility could be a
shift in fluorescence of the compounds bound to nuclear DNA that could not be detected
using our standard filter sets. Further investigations will be needed to understand these
results.

Federica Giordani, 2010 Chapter 4, 127
Another interesting feature concerning the staining pattern of the green fluorescent
compounds was their accumulation in a series of cytoplasmic corpuscles, as already
observed for other diamidines (Mathis et al., 2006). As previously discussed with regard to
DB75 fluorescent pattern (Chapter 3), the identity of these corpuscles is still unclear and
needs to be investigated in more details, especially to understand if they localise within the
mitochondrion or correspond to cytoplasmic vesicles. The causes of the red fluorescence
shift observed under the RHOD filter (Figure 4.8) are also unknown: it could be caused by
peculiar environmental conditions inside organelles or by binding to cytoplasmic
macromolecules. Mathis and colleagues were of the opinion that it was acidocalcisomes
that accumulated diamidines, an identification based on the similarity to the fluorescent
pattern of acridine orange in trypanosomes and its abolition following pre-treatment with
compounds which inhibit acidification of intracellular organelles (Mathis et al., 2006 and
2007). Some observations made during our experiments with the green fluorescent
diamidines were consistent with this theory, although a definitive identification could not
be made. The posterior fluorescent spots observed after DB1680 treatment (Figure 4.8),
and initially believed to be endosomes, for example, overlapped the area occupied by the
acidocalcisomes labelled, during another experiment, with acridine orange (Figure 4.20).
The identification of these cytoplasmic vesicles, stained by the fluorophores, as
acidocalcisomes would offer an explanation for the fluorescence bathochromic shift (i.e.
red emission) observed for all the compounds of the series: these organelles have an acidic
pH and contain phosphates, both of which can interact with the compounds and influence
their fluorescence spectra. Similarly, the brighter fluorescent spot labelled by DB1692 and
visible under the RHOD filter after 1 hour of incubation (Figure 4.8) could be identified
with the lysosome, another acidic organelle located at the posterior of the cell. The
corpuscles observed following T. b. brucei treatment with the green fluorescent
diamidines, using the FITC channel, generally appeared more similar to those visualised
during our experiments with DB75 (Section 3.2.7) than to the acidocalcisomes evidenced
by Mathis and collaborators (Mathis et al., 2006 and 2007). Unlike the myriad of vesicles
that became visible in 2 or 4 hours incubation (depending on the diamidine used) described
by these authors, the green fluorescent pentamidine analogues we tested were observed in
only a limited number of corpuscles, which were stained within 1 hour of incubation. The
use of different fluorophores and experimental conditions (in particular, different filter
sets) could explain the discrepancies between our results and those published by Mathis
and collaborators, but future studies will be necessary to clarify the intracellular
distribution of these compounds.

Federica Giordani, 2010 Chapter 4, 128
4.3.3 Phenanthridines and acridine orange as fluore scent probes
for trypanosomes
By being both fluorescent in the range of the available LED Cytoscience SMR microscope
and trypanocidal (which may imply specific internalisation into parasites), phenanthridines
appeared to be promising compounds for our project. Fluorescence of isometamidium
inside trypanosomes, however, was found to be too low to be considered of any utility for
fluorescence diagnostics (Figure 4.13). Moreover, this phenanthridine preferentially
accumulated inside the kinetoplast and did not allow determination of parasites shape in
the sample. The staining properties of ethidium bromide and its analogue propidium iodide
proved more interesting. Both compounds could stain viable trypanosomes in blood
samples, revealing the whole cells shape (Figures 4.12 and 4.15). Propidium iodide, in
particular, produced a brilliant and stable emission once bound to trypanosomes’ nucleic
acids. This compound is supposed to be a membrane-impermeant molecule, which is
generally considered unable to enter intact cells (Foglieni et al., 2001). However,
propidium was clearly able to permeate trypanosomes in blood samples at a relatively fast
rate, which depended on the concentration of the compound and on the temperature of
incubation (Figure 4.17). Internalisation of this phenanthridine appeared to be enhanced
when cells were treated at 37°C rather than at room temperature, indicating a probable
transport-mediated uptake. This hypothesis was supported by indications, obtained in our
laboratory, of transporter involvement in the internalisation of the propidium structural
analogue ethidium bromide (Chris Ward, personal communication). Future studies on this
subject could reveal how these trypanocidal drugs enter the parasites. In fixed specimens,
where the integrity of the membranes was lost, the staining properties of propidium iodide
and ethidium bromide were excellent (Figures 4.14 and 4.18), although staining of other
nucleated cells in the specimens was evident.
Acridine orange, an analogue of phenanthridine, was the fluorophore with the best
characteristics among those tested. As propidium iodide, it was able to stain trypanosomes
instantaneously in fixed blood samples at very low concentrations (Figure 4.22). This
fluorophore could also enter viable parasites quickly, probably due to its lipophilic nature
(Figure 4.21). Acridine orange has the advantage of being less expensive than propidium
iodide (~£80 for 1 g for acridine, ~£90 for 100 mg for propidium from Molecular Probes,
Invitrogen) and very low concentrations are needed for microscopy. Since phenanthridines
are intercalating agents and, therefore, potential mutagens and carcinogens, the fact that
very low concentrations can be used not only reduces the costs, but also the risks

Federica Giordani, 2010 Chapter 4, 129
associated with the handling of the fluorophore. The fluorescent properties of acridine
orange have already been exploited for the diagnosis of HAT in the quantitative buffy coat
test (Bailey and Smith, 1992), which is very sensitive but also too expensive and
sophisticated to be widely applied in poor rural settings. The use of this fluorophore to
label trypanosomes in microscopy specimens is relatively straightforward and definitively
faster than the currently used Giemsa stain. We showed how the dye could be directly
applied to dry but also wet thin blood smear, further decreasing the time needed for
specimen preparation (since there was no need to dry or fix the sample). This also
facilitated the identification of labelled trypanosomes by their fast movement among blood
cells. Acridine orange stained live parasites in medium with a bright, stable fluorescence
(Figure 4.19), and we would expect it to stain parasites in human fluids other than blood,
such as lymph node aspirate or cerebrospinal fluid, equally well. The simple addition of a
drop of dye to a wet film prepared with these human samples could enable a faster
detection of trypanosomes, normally identified only by their active wriggling in unstained
samples (Chappuis et al., 2005). However, the application of aspecific, membrane-
permeant fluorophores, such as acridine orange, might be problematic for CSF samples,
where the high white blood cell count, usually associated with HAT infection, could
interefere with parasite visualisation. Moreover, other co-infecting microorganisms present
in the sample (in particular blood) may be stained aswell, thus complicating diagnosis.
These aspects will need to be verified by future experiments. Direct application of acridine
orange during the preparation of thick smears (Section 4.2.6) proved to be a fast and
simple procedure to label trypanosomes in these specimens. Since the entire parasite cell
was stained, trypanosomes could be identified even if their shape was slightly deformed in
these preparations.
Due to its ideal fluorescent characteristics, acridine orange has been independently chosen
by FIND (Foundation for Innovative New Diagnostics) to develop new fluorescence-based
diagnostics for trypanosomiasis (http://www.finddiagnostics.org/).
4.3.4 Practical considerations on the use of the LE D Cytoscience
SMR microscope
The LED Cytoscience SMR microscope (Figure 1.8) excited acridine orange and
propidium iodide yielding bright fluorescence. The instrument proved easy to use and
could be positioned in a dim dark room. However, when utilising the instrument we
noticed some defects, which will need to be considered when developing new prototypes

Federica Giordani, 2010 Chapter 4, 130
for field use. First, the presence of a single eyepiece could result in eye fatigue after hours
of microscopy, as already pointed out (Hänscheid, 2008). A fake, blind eyepiece positioned
in the place of the one missing could easily solve this issue, by allowing the microscopist
to keep the unused eye open during slide observation. A second problem was represented
by the fact that the stage could not be moved. This obliged the microscopist to manually
move the slide horizontally, with consequent loss of time and difficulties in
homogeneously screening the specimen. The introduction of a cross-table to clamp slides
and move them on the stage would make the microscope more practical, with only a minor
loss in compactness. A third aspect to be mentioned was the presence on the instrument of
a single, low magnification, 40× objective. This was ideal to quickly screen thin film, but
not to view thick smears, for which a high magnification 100× objective is commonly
used. In the field, thick specimens are usually preferred to thin ones because of their higher
sensitivity (Chappuis et al., 2005). Fitting an appropriate, high magnification objective
(100× or 60×) in microscopes designed for the field will, therefore, have to be considered
in future prototypes.

5
Synthesis of UV fluorescent
amino acid derivatives

Federica Giordani, 2010 Chapter 5, 132
5.1 Introduction
One aspect of this research project involved the direct synthesis of potential fluorescent
probes for African trypanosomes. In designing the new molecules, it was decided to couple
fluorescent moieties to a parasite surface transporter’s substrate, in order to ensure fast and
specific internalisation into parasites. This strategy had already been attempted by previous
work by Azema and collaborators (Azema et al., 2004), who designed fluorescent
substrates of the glucose transporter family by linking a dansyl chloride group (which is
fluorescent) to hexoses. These fluorophores, however, seemed to enter into trypanosomes
without interacting with the transporters, probably due to their lipophilic nature, which
allowed them to diffuse through the plasma membrane.
Nutrient uptake routes represent useful pathways to carry toxins and other compounds into
parasites. Internalisation of the fluorescent diamidines described in Chapters 3 and 4 was
assured by the activity of other classes of trypanosome transporters, including the amino-
purine transporter P2/TbAT1, and the high and low affinity pentamidine transporters
(HAPT and LAPT). To deliver fluorescent groups into trypanosomes, we chose to exploit a
different class of parasite carriers: the amino acid transporters. Trypanosomatids possess a
large family of specific and generic amino acids transporters (Barrett and Gilbert, 2006;
Jackson, 2007), since these parasites are auxotrophic for the essential amino acids of
humans (Berriman et al., 2005). The high affinity of these carriers could assure the
concentration of the designed substrates against their concentration gradient. Moreover,
addition of hydrophobic aromatic substituents, typical of fluorogenic groups, to polar
amino acids was expected to lead to products still hydrophilic enough to preclude passive
diffusion through the membrane, as happened for the hexose analogues mentioned above
(Azema et al., 2004). Obviously, amino acid transporters, as glucose transporters, are not
exclusive to trypanosomes. However, differences in affinity and rate of activity between
parasite and human carriers might ensure specific internalisation into parasites (a
phenomenon difficult to predict in advance), as observed for the sugar derivatives designed
by Azema and colleagues (Azema et al., 2004).
To generate fluorescent amino acid conjugates, different aromatic substituents were linked
to the side-chain of various amino acids. Fluorophores included UV fluorescent groups
such as dansyl chloride (λEX=337 nm, λEM=492 nm) and 2-(bromomethyl)naphthalene
(λEX=274 nm, λEM=334 nm). Among them, dansyl chloride was considered of particular
interest. This compound [5-(dimethylamino)naphthalene-1-sulfonyl chloride], is a

Federica Giordani, 2010 Chapter 5, 133
naphthalene-based, lipophilic fluorophore, nonfluorescent until it reacts with amines. It is
generally used for amino acid and protein covalent labelling (Chersi et al., 1997;
Gonçalves, 2009), but sugars too are often fluorescently tagged with this organic probe
(Hermetter et al., 2001; Azema et al., 2004).
The work was carried out under the supervision of Dr. A. Sutherland in the Chemistry
Department of the University of Glasgow. Purity and characterisation of the compounds
generated were verified by IR, 1H NMR/13C NMR spectroscopy and mass spectrometry
analyses. Optical activity was also determined. Full chemical characterisation and detailed
synthetic procedures are presented in Section 5.2.4, while general experimental details are
in Section 2.8. The biological and fluorescent properties of the amino acid derivatives
obtained were, successively, assessed on in vitro, wild type trypanosomes.

Federica Giordani, 2010 Chapter 5, 134
5.2 Results
5.2.1 Synthesis of a dichlorobenzyl tyrosine deriva tive
The first compound synthesised was a tyrosine analogue (Tyr(Cl2-Bzl)-OH, named FG10)
(Figure 5.1). This compound was chosen for the presence in its molecular structure of two
aromatic rings (one from the lateral chain of the amino acid, the other from a condensed
dichlorobenzyl alcohol moiety), and, therefore, likely to have fluorescent properties.
Another reason for this choice was the possibility of obtaining the product from a
commercially available starting material ([Boc-O-(2,6-dichlorobenzyl)-L-tyrosine], or Boc-
Tyr(Cl2-Bzl)-OH, from Sigma-Aldrich) through a single, standard reaction. This offered an
opportunity to gain some initial experience in the chemistry laboratory.
ONHBoc
Cl
Cl
CO2H
ONH2
Cl
Cl
CO2HTFA (1 eq)
DCM
83%FG10
ONHBoc
Cl
Cl
CO2H
ONH2
Cl
Cl
CO2HTFA (1 eq)
DCM
83%
ONHBoc
Cl
Cl
CO2H
ONH2
Cl
Cl
CO2HTFA (1 eq)
DCM
83%FG10
Figure 5.1 – Synthesis of Tyr(Cl 2-Bzl)-OH (FG10) from Boc-Tyr(Cl 2-Bzl)-OH. The single reaction involved the deprotection of th e amino group of the commercially available tyrosine analogue.
The tyrosine derivative FG10 was produced with good yield (83%) by removing the
protective t-Boc residue from the amino group of tyrosine, following a standard procedure.
5.2.2 Synthesis of a 2-methylnaphthalene serine der ivative
A second compound was obtained by linking a 2-methylnaphthalene substituent (the
fluorophore) to the side-chain of the amino acid L-serine, following a two step procedure
(Figure 5.2). Alkylation of 2-(bromomethyl)naphthalene to the hydroxyl group of N-Boc-
serine (Sigma-Aldrich) gave the desired intermediate product (FG60, 46% yield). A
previous attempt to perform this reaction using the methyl ester of serine as starting
material, instead, did not give the expected product. In this case, the addition of the
aromatic electrophile 2-(bromomethyl)naphthalene generated a mixture of two unknown
compounds, one of which contained a methyl ester. This mixture was treated with 6 M HCl
under reflux conditions in an effort to hydrolyse the ester. However, this proved
unsuccessful, completely decomposing the molecules.

Federica Giordani, 2010 Chapter 5, 135
OH
NHBoc
CO2H O
NHBoc
CO2H O
NH2
CO2HNaH (2.2 eq)
Br
DMF
46%
TFA
DCM
100%
(1.1 eq)
FG70FG60
OH
NHBoc
CO2H O
NHBoc
CO2H O
NH2
CO2HNaH (2.2 eq)
Br
DMF
46%
TFA
DCM
100%
(1.1 eq)
OH
NHBoc
CO2H O
NHBoc
CO2H O
NH2
CO2HNaH (2.2 eq)
Br
DMF
46%
TFA
DCM
100%
(1.1 eq)
FG70FG60 Figure 5.2 – Synthesis of the 2-methylnaphthalene s erine derivative FG70. Synthesis involved alkylation of an analogue of the amino acid serine (amino group protected by a t-Boc residue) with 2-(bromomethyl)naphthalene, to g ive the intermediate compound FG60, and subsequent deprotection of the a mino group of the amino acid to generate the final product.
The second reaction of the synthetic pathway involved treatment with TFA to release the
protecting t-Boc group from the amino group of serine, generating the final product (FG70)
with 100% yield.
5.2.3 Synthesis of a dansyl chloride lysine derivat ive
The synthesis of a dansyl chloride derivative was then attempted. This molecule was
considered quite promising since the addition of a dansyl substituent to primary amino
groups is known to give a stable blue or blue-green fluorescence to the product. A first
attempt to obtain a serine derivative through condensation of dansyl chloride with the side-
chain of this amino acid failed, probably due to an intramolecular rearrangement that led to
the unprotected carboxyl group of serine to attack the S-O bond, resulting in the
elimination of the adduct (data not shown).
We then decided to change starting material, using the amino acid lysine, and to protect its
carboxyl group at the outset. The long side-chain of this amino acid represented a steric
barrier to possible intramolecular rearrangement and its nitrogen was expected to form a
stronger chemical bond with the sulfur of the dansyl chloride than the oxygen of serine.
Following this approach we were able to obtain the final product (FG400) in five steps
(Figure 5.3). Each reaction was carried out at first on a small scale and, if it proved
successful, a larger scale reaction was set up. A modified lysine (Boc-Lys(Cbz)-OH,
Sigma-Aldrich), with the amino group protected by a t-Boc residue and the lateral chain
blocked by a carbobenzyloxy (Cbz) group, was used as starting material. Synthesis started
by blocking the free carboxylic acid of lysine by addition of an ethyl group, following a
standard procedure (the compound obtained was named FG90). Successively, the side-
chain of the amino acid was deprotected using a hydrogenation reaction, to expose the
amino group for the subsequent condensation with the fluorophore. Conditions applied for
this reaction were the same as those published by Bergeron and collaborators (Bergeron et.

Federica Giordani, 2010 Chapter 5, 136
CbzHN
NHBoc
CO2H CbzHN
NHBoc
CO2Et NH2
NHBoc
CO2Et
S
O
O
Cl
N
NH
NHBoc
CO2EtS
O
O
N
NH
NHBoc
S
O
O
CO2H
N
NH
NH2
S
O
O
CO2H
N
EDCI (1.6 eq)
DMAP
EtOH (5 eq)
DCM
100%
HCl 1N
Pd/C 10%
EtOH, H2
100%
NEt3 (2.1 eq)
DCM
57%
(1 eq)
MeOH
100%
LiOH·H2O (1.5 eq)
DCM
100%
TFA
FG400
FG90 FG100
FG200FG300
CbzHN
NHBoc
CO2H CbzHN
NHBoc
CO2Et NH2
NHBoc
CO2Et
S
O
O
Cl
N
NH
NHBoc
CO2EtS
O
O
N
NH
NHBoc
S
O
O
CO2H
N
NH
NH2
S
O
O
CO2H
N
EDCI (1.6 eq)
DMAP
EtOH (5 eq)
DCM
100%
HCl 1N
Pd/C 10%
EtOH, H2
100%
NEt3 (2.1 eq)
DCM
57%
(1 eq)
MeOH
100%
LiOH·H2O (1.5 eq)
DCM
100%
TFA
FG400
FG90 FG100
FG200FG300
Figure 5.3 – Synthesis of the dansyl chloride lysin e derivative FG400. The carboxyl group of the starting material (a lysi ne molecule with both amino groups blocked) was initially protected by an ethyl residu e to generate FG90. The amine of the side-chain of lysine was, then, exposed (in the compound FG100) for the subsequent fusion with the dansyl chloride group (the joined product was n amed FG200). Both the carboxyl and amino group of the amino acid were, successively, d eprotected to give the final product FG400.
al., 1997). The product (FG100) was obtained using an acid environment and Pd/C as
catalyst and it was purified by filtration through Celite® as a Cl-NH3+ salt. Interestingly, the
use of the acid reagent (HCl 1 N) helped the removal of the Cbz-protecting group without
taking the t-Boc group off. The next step was the condensation of the lysine derivative with
dansyl chloride. For this reaction, a procedure published by Ceroni and collaborators was
followed with some modifications (Ceroni et al., 2002). Two equivalents of NEt3 were
needed to first eliminate the Cl-NH3+ salt and then to act as a reagent. The product FG200
was obtained with a 57% yield after purification by flash silica gel chromatography.
Standard procedures were followed in the last two reactions to deprotect the amino and
carboxylic groups of lysine, to generate the final product FG400. 1H NMR spectroscopy
(Figure 5.4), mass spectrometry (Figure 5.5) and IR spectra (Figure 5.6) of the dansyl
chloride derivative are shown below.
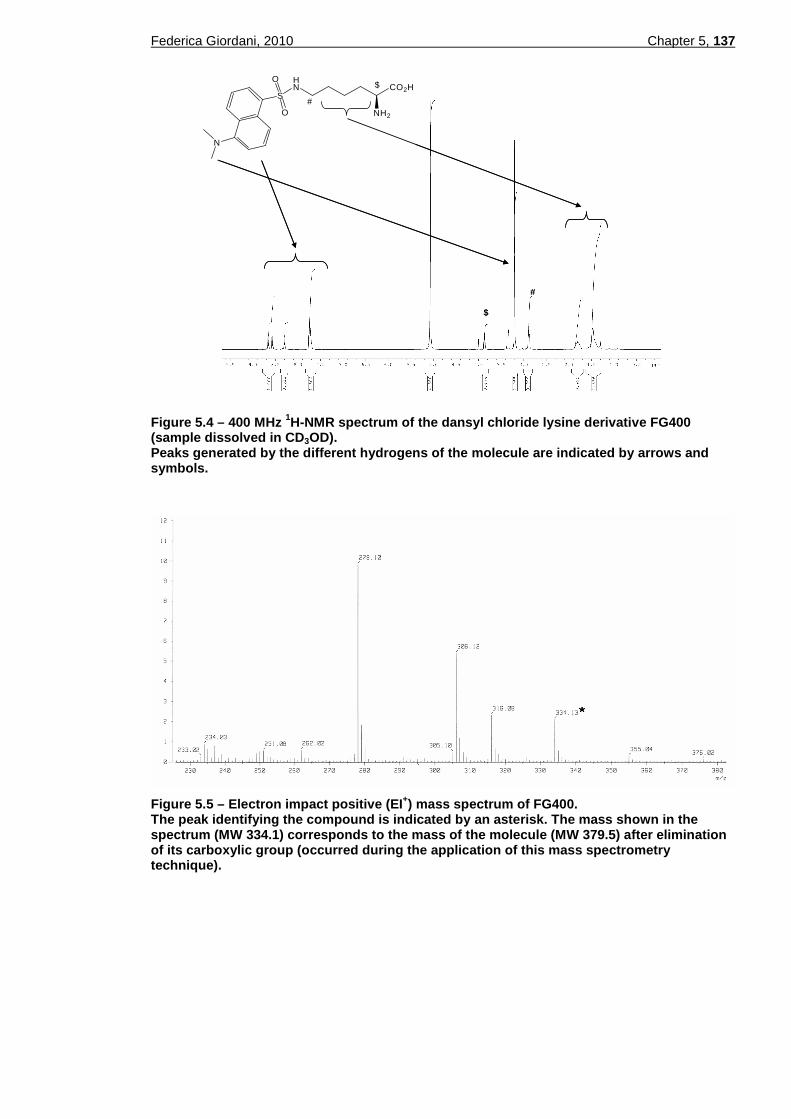
Federica Giordani, 2010 Chapter 5, 137
CO2H
NH2
HN
S
O
O
N
#
#
$
$
CO2H
NH2
HN
S
O
O
N
#
#
$
$
CO2H
NH2
HN
S
O
O
N
CO2H
NH2
HN
S
O
O
N
#
#
$
$
Figure 5.4 – 400 MHz 1H-NMR spectrum of the dansyl chloride lysine deriva tive FG400 (sample dissolved in CD 3OD). Peaks generated by the different hydrogens of the m olecule are indicated by arrows and symbols.
Figure 5.5 – Electron impact positive (EI +) mass spectrum of FG400. The peak identifying the compound is indicated by a n asterisk. The mass shown in the spectrum (MW 334.1) corresponds to the mass of the molecule (MW 379.5) after elimination of its carboxylic group (occurred during the applic ation of this mass spectrometry technique).

Federica Giordani, 2010 Chapter 5, 138
Figure 5.6 – IR spectrum of FG400. The main functional groups are indicated underneath the corresponding absorption peaks.
5.2.4 Experimental details
(2S)-2-Amino-3-[4-(2,6-dichlorobenzyloxy)phenyl]propionic acid (FG10)
O
CO2H
NH2
Cl
Cl
Trifluoroacetic acid (3 ml) was added to a solution of Boc-Tyr(Cl2-Bzl)-OH (1.00 g, 2.27
mmol) in DCM (10 ml). The solution was left stirring overnight at room temperature and
then the solvent was evaporated in vacuo. Starting material, TFA salt and impurities were
eliminated by extraction with EtOAc and H2O (4 × 50 ml) and the combined aqueous
phases were finally dried to give the product (FG10) as a white powder (0.64 g, 83%). mp:
204-206°C (lit. 200-203°C; Yamashiro and Li, 1973); [α]D23 –18.2 (c 1.0, MeOH);
νmax(KBr)/cm-1: 3442 (NH), 2990 (CH), 1665 (CO), 1521, 1243, 1023; δH (400 MHz,
CD3OD): 3.01 (1H, dd, J 14.6, 8.5 Hz, 3-HH), 3.26-3.28 (1H, m, 3-HH), 3.86 (1H, dd, J
8.5, 4.5 Hz, 2-H), 5.28 (2H, s, CH2O), 7.03 (2H, d, J 8.8 Hz, 2 × Ar-H), 7.26 (2H, d, J 8.8
Hz, 2 × Ar-H), 7.34-7.38 (1H, m, 1 × Ar-H), 7.44-7.46 (2H, m, 2 × Ar-H); δC (100 MHz,
CD3OD): 37.3 (CH2), 57.1 (CH), 66.2 (CH2), 116.3 (CH), 129.3 (ArC), 129.8 (2 × ArCH),
131.7 (2 × ArCH), 132.1 (2 × ArCH), 133.6 (ArC), 138.1 (2 × ArC), 159.8 (ArC), 173.2

Federica Giordani, 2010 Chapter 5, 139
(CO); LRMS (FAB+): 340.2 ([MH]+, 99%), 294.2 (24), 265.1 (17), 176.8 (15), 159.9 (60);
HRMS calcd for C16H1635Cl2NO3 340.0507, found 340.0510.
(2S)-2-(tert-Butoxycarbonylamino)-3-(naphthalen-2-ylmethoxy)propionic acid (FG60)
CO2HO
NHBoc
A solution of N-(tert-butoxycarbonyl)-L-serine (0.50 g, 2.44 mmol) in DMF (10 ml) was
prepared at 4°C under argon conditions. After slow addition of 60% NaH powder (0.23 g,
5.37 mmol), the solution was left stirring for 0.5 h and then 2-(bromomethyl)naphthalene
(0.59 g, 2.68 mmol) was added. The mixture was left stirring for another hour at 4°C and,
finally, overnight at room temperature. The addition of a saturated aqueous solution of
NaCl (30 ml) gave a precipitate that was filtered and the filtrate was extracted with diethyl
ether (3 × 25 ml). HCl was added to the aqueous layer until pH 2 was reached and the
solution was immediately extracted with EtOAc (3 × 25 ml). The collected organic phases
were dried over MgSO4 and the solvent was evaporated in vacuo. The obtained residue
was purified by flash column chromatography on silica gel, using a gradient of petroleum
ether/ethyl acetate as eluent to give the product as a brown oil (0.39 g, 46%). [α]D25 +20.7
(c 1.0, CHCl3); νmax(neat)/cm-1: 3439 (NH), 2979 (CH), 1685 (CO), 1508, 1163, 818, 754;
δH (400 MHz, CDCl3): 1.37 (9H, s, 3 × CH3), 3.67 (1H, dd, J 9.2, 3.2 Hz, 3-HH), 3.90 (1H,
dd, J 9.2, 3.2 Hz, 3-HH), 4.42-4.44 (1H, m, 2-H), 4.61 (2H, s, CH2O), 5.37 (1H, d, J 8.4
Hz, NH), 7.32-7.34 (1H, m, Ar-H), 7.37-7.42 (2H, m, 2 × Ar-H), 7.65 (1H, br s, Ar-H),
7.73-7.74 (3H, m, 3 × Ar-H); δC (100 MHz, CDCl3): 28.3 (3 × CH3), 53.8 (CH), 69.7
(CH2), 73.6 (CH2), 80.4 (C), 125.6 (ArCH), 126.1 (ArCH), 126.2 (ArCH), 126.7 (ArCH),
127.7 (ArCH), 127.9 (ArCH), 128.4 (ArCH), 133.1 (ArC), 133.2 (ArC), 134.7 (ArC),
155.8 (C), 175.2 (C); LRMS (CI+): 346.3 ([MH]+, 5%), 290.2 (56), 272.2 (10), 141.2 (99),
132.1 (10); HRMS calcd for C19H24 NO5 346.1654, found 346.1658.
(2S)-2-Amino-3-(naphthalen-2-ylmethoxy)propionic acid (FG70)
CO2HO
NH2
Federica Giordani, 2010 Chapter 5, 140
To a solution of FG60 (0.35 g, 1.02 mmol) in DCM (10 ml), the reagent trifluoroacetic
acid (4 ml) was added and the solution was left stirring overnight at room temperature.
Evaporation of the solvent gave the TFA salt product as an oil (0.32 g, 100%).
νmax(neat)/cm-1: 3420 (NH), 2925 (CH), 1675 (CO), 1509, 1203, 817; δH (400 MHz,
DMSO-d6): 3.76-3.91 (2H, m, 3-H2), 3.96-3.97 (1H, m, 2-H), 4.61-4.76 (2H, m, CH2O),
7.42-7.59 (4H, m, Ar-H), 7.82-8.02 (3H, m, Ar-H); δC (100 MHz, DMSO-d6): 54.2 (CH),
59.4 (CH2), 72.5 (CH2), 25.4 (ArCH), 125.8 (ArCH), 126.0 (ArCH), 126.2 (ArCH), 127.6
(ArCH), 127.7 (ArCH), 127.9 (ArCH), 133.5 (ArC), 134.5 (ArC), 140.0 (ArC), 169.5
(CO); LRMS (FAB+): 246.2 ([MH]+, 9%), 142.2 (54), 102.7 (20), 81.0 (100), 59.4 (35);
HRMS calcd for C14H16 NO3 246.1130, found 246.1114.
Ethyl (2S)-6-(Benzyloxycarbonylamino)-2-(tert-butoxycarbonylamino)hexanoate (FG90)
CO2EtCbzHN
NHBoc
A stirred solution of Boc-Lys(Cbz)-OH (0.50 g, 1.32 mmol) in dry DCM (15 ml) was
prepared under argon atmosphere. The reagent EDCI (0.40 g, 2.11 mmol), the catalyst
DMAP (0.10 g) and dry ethanol (0.40 ml, 6.60 mmol) were sequentially added to the
solution, which was allowed to stir at room temperature for 48 h. The mixture was, then,
extracted with H2O (2 × 30 ml) and the collected organic phases were dried over MgSO4
and, finally, concentrated in vacuo to give FG90 as an oil (0.54 g, 100%). [α]D25 +2.0 (c
1.0, CHCl3); νmax(neat)/cm-1: 3339 (NH), 2936 (CH), 1712 (CO), 1525, 1251, 1167, 1026;
δH (400 MHz, CDCl3): 1.29 (3H, t, J 7.2 Hz, CH3-CH2), 1.38-1.45 (11H, m, 3 × CH3, 4-
H2), 1.50-1.57 (2H, m, 3-H2), 1.60-1.69 (1H, m, 5-HH), 1.79-1.81 (1H, m, 5-HH), 3.17-
3.22 (2H, q, J 6.8 Hz, 6-H2), 4.17-4.22 (2H, m, OCH2-CH3), 4.24-4.29 (1H, m, 2-H), 5.03
(½H, br m, NH), 5.10 (2H, s, CH2), 5.18-5.20 (½H, m, NH), 6.49-6.50 (½H, m, NH), 7.31-
7.37 (5H, m, Ar-H), 8.22-8.24 (½H, m, NH); δC (100 MHz, CDCl3): 14.2 (CH3), 22.4
(CH2), 28.3 (3 × CH3), 29.4 (CH2), 32.4 (CH2), 40.6 (CH2), 53.3 (CH), 61.3 (CH2), 66.6
(CH2), 79.8 (C), 128.1 (ArCH), 128.2 (3 × ArCH), 128.5 (ArCH), 136.6 (C), 155.6 (C),
156.5 (C) 172.8 (C); LRMS (CI+): 409.5 ([MH]+, 12%), 353.5 (37), 309.5 (73), 245.3 (55),
123.2 (98); HRMS calcd for C21H33N2O6 409.2339, found 409.2340.

Federica Giordani, 2010 Chapter 5, 141
Ethyl (2S)-6-Amino-2-(tert-butoxycarbonylamino)hexanoate (FG100)
CO2EtH2N
NHBoc
1 N HCl (1.30 ml) was added to a stirred solution of FG90 (0.51 g, 1.25 mmol) in EtOH
(20 ml). After addition of 0.05 g of Pd/C 10%, H2 at atmospheric pressure was introduced
and the mixture was left stirring for 3 h before further catalyst (0.02 g) was added. The
solution was stirred at room temperature under H2 atmosphere overnight. The black
suspension was then filtered through Celite® and washed with EtOH (3 × 25 ml). The
filtrate was, finally, dried in vacuo to give FG100 as an oil (0.38 g, 100%). [α]D24 +2.3 (c
1.0, CHCl3); νmax(neat)/cm-1: 3413 (NH), 2979 (CH), 1701 (CO), 1523, 1369, 1166, 1025;
δH (400 MHz, CDCl3): 1.21 (3H, t, J 7.0 Hz, CH3-CH2); 1.37 (10H, br s, 9 × CH3, 1 × 4-
HH), 1.51-1.74 (5H, m, 3-H2, 4-HH, 5-H2), 2.87-2.96 (2H, m, 6-H2), 4.09-4.19 (3H, m,
OCH2-CH3, 2-H), 5.22 (½H, br d, J 7.2 Hz, NH), 6.52 (½H, d, J 7.2 Hz, NH), 7.52 (2H, br
s, NH2); δC (100 MHz, CDCl3): 14.2 (CH3), 22.6 (CH2), 27.6 (CH2), 28.4 (3 × CH3), 32.1
(CH2), 39.8 (CH2), 53.4 (CH), 61.4 (CH2), 79.8 (C), 155.6 (C), 172.7 (C); LRMS (CI+):
275.3 ([MH]+, 100%), 219.2 (77), 175.2 (33), 156.2 (12), 123.2 (23); HRMS calcd for
C13H27N2O4 275.1971, found 275.1974.
Ethyl (2S)-2-(tert-Butoxycarbonylamino)-6-(5-dimethylaminonaphthalene-1-
sulfonylamino)hexanoate (FG200)
CO2EtHN
S
O
O
N
NHBoc
NEt3 (0.40 ml, 2.84 mmol) was added to a stirred solution of FG100 (0.37 g, 1.35 mmol) in
DCM anhydrous (10 ml) under argon atmosphere. Dansyl chloride (0.36 g, 1.35 mmol),
previously suspended in dry DCM (10 ml), was added dropwise to the solution, which was
left stirring overnight at room temperature. After removal of the solvent under reduced
pressure, the yellow-brown residue was resuspended in DCM and washed with H2O (30
ml), saturated aqueous Na2CO3 solution (30 ml) and again with H2O (3 × 30 ml). The
organic layer was, then, dried over Na2SO4 and concentrated in vacuo. The yellow-brown
oil was resuspended in a small amount of DCM, purified by silica gel column

Federica Giordani, 2010 Chapter 5, 142
chromatography using a gradient of DCM : MeOH (from 100% : 0% to 95% : 5%) and
finally dried in vacuo to give the product as a yellow oil (0.39 g, 57%). [α]D25 +9.6 (c 1.0,
CHCl3); νmax(neat)/cm-1: 3362 (NH), 2939 (CH), 1710 (CO), 1458, 1367, 1321, 1145,
1092, 791; δH (400 MHz, CDCl3): 1.17-1.24 (5H, m, 4-H2, CH3-CH2), 1.28-1.45 (12H, m,
3-H2, 3 × CH3), 1.50-1.59 (1H, m, 5-H2), 2.81 (8H, br s, 6-H2, 2 × N-CH3), 4.06-4.11 (3H,
m, OCH2-CH3, 2-H), 5.17 (1H, d, J 8.4 Hz, NHBoc), 5.73 (1H, br t, J 5.8 Hz, SO2-NH),
7.11 (1H, d, J 7.4 Hz, Ar-H), 7.43-7.49 (2H, m, 2 × Ar-H), 8.18 (1H, d, J 7.4 Hz, Ar-H),
8.31 (1H, d, J 8.8 Hz, Ar-H), 8.47 (1H, d, J 8.8 Hz, Ar-H); δC (100 MHz, CDCl3): 14.2
(CH3), 22.2 (CH2), 28.4 (3 × CH3), 29.0 (CH2), 32.3 (CH2), 43.0 (CH2), 45.5 (2 × CH3),
53.1 (CH), 61.4 (CH2), 80.0 (C), 115.2 (ArCH), 118.7 (ArCH), 123.2 (ArCH), 128.4
(ArCH), 129.6 (ArC), 129.7 (ArCH), 129.9 (ArC), 130.5 (ArCH), 134.6 (ArC), 152.1
(ArC), 155.5 (C), 172.7 (C); LRMS (FAB+): 530.2 ([MNa]+, 100%), 507.2 (100), 452.2
(53), 408.2 (39), 317.2 (13), 170.8 (99), 59.4 (38); HRMS calcd for C25H37N3O6NaS
530.2301, found 530.2317.
(2S)-2-(tert-Butoxycarbonylamino)-6-(5-dimethylaminonaphthalene-1-
sulfonylamino)hexanoic acid (FG300)
CO2H
NHBoc
HN
S
O
O
N
FG200 (0.20 g, 0.39 mmol) was dissolved in MeOH (10 ml) and the solution was cooled to
4ºC. LiOH·H2O (0.03 g, 0.59 mmol) dissolved in H2O (5 ml) was added dropwise to the
mixture and the reaction was, then, warmed to room temperature and allowed to stir
overnight. The reaction mixture was dried under reduced pressure and the resulting residue
was resuspended in H2O. After acidification to pH 2 by addition of 2 M HCl, the mixture
was extracted with EtOAc (3 × 25 ml) and the organic layer was dried over MgSO4 and
concentrated in vacuo to give FG300 as a yellow viscous oil (0.20 g, 100%). [α]D25 +4.7 (c
1.0, CHCl3); νmax(neat)/cm-1: 3370 (NH), 2937 (CH), 1695 (CO), 1509, 1316, 1161, 1062;
δH (400 MHz, CDCl3): 1.18-1.34 (13H, m, 3-H2, 4-H2, 3 × CH3), 1.40-1.58 (2H, m, 5-
CH2), 2.80 (8H, br s, 6-H2, 2 × N-CH3), 4.11-4.12 (1H, m, 2-H), 5.17-5.19 (1H, br d, J 6
Hz, NHBoc), 5.39 (1H, br s, SO2-NH), 7.10 (1H, d, J 7.2 Hz, Ar-H), 7.40-7.46 (2H, m, 2 ×
Ar-H), 8.13-8.14 (1H, m, Ar-H), 8.22-8.24 (1H, m, Ar-H), 8.43 (1H, d, J 8.8 Hz, Ar-H); δC
Federica Giordani, 2010 Chapter 5, 143
(100 MHz, CDCl3): 22.2 (CH2), 28.4 (3 × CH3), 28.9 (CH2), 31.8 (CH2), 42.8 (CH2), 45.5
(2 × CH3), 53.1 (CH), 80.2 (C), 115.4 (ArCH), 119.2 (ArCH), 123.4 (ArCH), 128.4
(ArCH), 129.5 (ArCH), 129.6 (ArC), 129.7 (ArC), 130.2 (ArCH), 134.8 (ArC), 151.5
(ArC), 155.8 (C), 176.5 (C); LRMS (FAB+): 502.2 ([MNa]+, 49%), 479.2 (39), 424.2 (35),
170.9 (100), 168.9 (37), 86.0 (17); HRMS calcd for C23H33N3O6NaS 502.1988, found
502.1973.
(S)-2-Amino-6-(5-dimethylamino-naphthalene-1-sulfonylamino)-hexanoic acid (FG400)
CO2H
NH2
HN
S
O
O
N
FG300 (0.08 g, 0.16 mmol) was dissolved in DCM (10 ml) at room temperature. After
addition of TFA (1 ml) the solution was allowed to stir overnight. The reaction mixture
was then concentrated in vacuo to give FG400 as a yellow viscous oil (0.08 g, 100%).
[α]D26 +6.8 (c 1.0, MeOH); νmax(neat)/cm-1: 3422 (NH), 2940 (CH), 1677 (CO), 1202,
1141, 796; δH (400 MHz, CD3OD): 1.39-1.52 (4H, m, 3-H2, 4-H2), 1.76-1.89 (2H, m, 5-
H2), 2.89 (2H, t, J 5.8, 6-H2), 3.20 (6H, s, 2 × N-CH3), 3.87 (1H, br t, J 6.4 Hz, 2-H), 7.69-
7.76 (3H, m, Ar-H), 8.30 (1H, d, J 7.2 Hz, Ar-H), 8.57 (1H, d, J 8.4 Hz, Ar-H), 8.65 (1H,
d, J 8.4 Hz, Ar-H); δC (100 MHz, CD3OD): 23.0 (CH2), 30.3 (CH2), 31.0 (CH2), 43.4
(CH2), 46.5 (2 × CH3), 53.8 (CH), 117.9 (ArCH), 123.2 (ArCH), 125.6 (ArCH), 129.0
(ArCH), 129.7 (ArCH), 129.9 (C), 130.5 (ArCH), 130.9 (C), 137.6 (C), 149.0 (C), 171.8
(CO); LRMS (EI+): 334.1 ([M-COOH]+, 2%), 306.1 (6), 278.1 (10), 171.1 (64), 154.0 (9),
95.0 (12), 69 (100), 45 (68); HRMS calcd for C17H24N3O2S 334.1589, found 334.1583.
5.2.5 Biological evaluation
5.2.5.1 Fluorescence spectra
Once the synthesis was completed, the biological properties of the three amino acid
derivatives were evaluated. The fluorescence excitation and emission spectra of the
compounds were measured using solutions of the molecules in distilled water (Section
2.6). Pre-scan of FG10 and FG70 (0.5 to 10 µM) revealed that both molecules absorbed

Federica Giordani, 2010 Chapter 5, 144
300 350 400 450 500 550 600 650 7000
50
100
150
200EXEM
Wavelength (nm)
Inte
nsity
Figure 5.7 – Fluorescence spectra of FG400. The spectra were measured using a 10 µµµµM solution of the compound in dH 2O. EX; excitation spectrum; EM: emission spectrum.
UV radiation, but no relevant emission peaks could be identified in the visible region of the
spectrum, thus preventing more accurate spectra measurements (data not shown). For the
lysine derivative FG400, instead, we could measure an excitation wavelength maximum of
333 nm and emission of 520 nm (Figure 5.7). Another absorption peak in the UV region,
with maximum at 247 nm was identified. Fluorescence intensity in aqueous solution was
weak (see, for comparison, the spectra of DB75 shown in Figure 4.6). Both the large
Stokes shift (i.e. distance between excitation and emission maxima) and the low yield
found for our dansyl chloride conjugate were in agreement with the data reported for this
class of fluorophores (the Molecular Probes Handbook, available online at the website
http://probes.invitrogen.com/handbook/, indicates for dansyl sulfonamides an absorptivity
as weak as ε ~4,000 cm-1M-1 at 330-340 nm and a low quantum yield).
5.2.5.2 Trypanotoxicity
The Alamar Blue assay (Section 2.4) was performed to obtain some indication concerning
interaction of the synthesised molecules with trypanosomes: trypanotoxicity could be
expressed after entry of the compounds into the cell, a requirement for their use as
fluorescent probes. The results, however, did not give any information on this subject,
showing that none of the amino acid derivatives had any trypanocidal activity up to
100 µM (Figure 5.8). Treatment with the three compounds did not appear to alter the
normal cell motility and morphology.
5.2.5.3 Fluorescence microscopy
To directly visualise the ability of the amino acid derivatives to stain live cells, treated in
vitro wild type trypanosomes were viewed under the standard filter sets of the Zeiss

Federica Giordani, 2010 Chapter 5, 145
-12 -10 -8 -6 -4 -20
20000
40000
60000
80000
FG10FG70FG400Pentamidine
Log [compound] (M)
Flu
ores
cenc
e
Figure 5.8 – Sensitivity of T. b. brucei w.t. S427 to the three amino acid derivatives. The data shown are from a representative Alamar Blu e experiment. Pentamidine was used as positive control. For each curve, the lowest con centration data point is the “no drug” negative control. Error bars represent the standard deviation of the two replicates. Fluorescence is in arbitrary units.
Axioplan fluorescence microscope. Parasites incubated for up to 2 hours with 100 µM
FG10 and FG70 did not show any fluorescence emission when excited using DAPI or
FITC channels. This confirmed the findings obtained with the spectra measurements,
which showed no emission in the visible region for these conjugates.
The dansyl chloride lysine derivative FG400, instead, appeared to accumulate into
trypanosomes and labelled the cells after only 15 minutes of incubation, when given at
100 µM (Figure 5.9). A blue, faint emission could be detected using the DAPI filter set: the
entire cell was stained and some more intense spots were visible in its posterior region. A
slightly better signal was obtained with the FITC channel. The use of this filter to excite
the fluorophore allowed evidence of the entire shape of the parasites, including the
flagellum, and various bright corpuscles spread throughout the whole cell body. The use of
50 µM FG400 gave similar results, but a further decrease to 10 µM proved insufficient for
trypanosome labelling. Dye emission (especially upon DAPI excitation) seemed to
diminish at long incubation times (from 1 hour). The cause of this phenomenon is still
unknown; it is possible that the activity of intracellular enzymes determined the release of
the nonfluorescent dansyl residue from the amino acid. As already mentioned, FG400 had
a large Stokes shift (λEX=333 nm, λEM=520 nm), which did not match any of the standard
filter sets fitted on the Zeiss microscope (DAPI: λEX=365 nm, λEM=445 nm; FITC:
λEX=470 nm, λEM=519 nm). This factor could have contributed to the low emission
observed during qualitative fluorescence microscopy, along with the intrinsic low yield of
the dansyl conjugate. Following incubation of trypanosomes in blood samples (100 µM for

Federica Giordani, 2010 Chapter 5, 146
Figure 5.9 – Fluorescence imges of trypanosomes sta ined with FG400. Aliquots of T. b. brucei w.t parasites from culture were incubated with 100 µµµµM FG400 at 37°C for 15 minutes. Trypanosomes were, then, immobilise d in 1% agarose and viewed under DAPI and FITC filters of the Zeiss Axioplan microsc ope. DAPI 33 ms exposure, FITC 60 ms exposure; 100× obje ctive. Bar: 10 µµµµM.
Figure 5.10 – Fluorescence images of trypanosomes s tained with DB1919. The compound DB1919 was kindly provided by Prof. D. W. Boykin (Georgia State University, Atlanta). Aliquots of T. b. brucei w.t parasites from culture were incubated with 10 µµµµM of the compound at 37°C for 1 hour. Trypanosomes were, the n, immobilised in 1% agarose and viewed under DAPI and FITC filter of the Zeiss Axio plan microscope. DAPI 33 ms exposure, FITC 60 ms exposure; 100× obje ctive. Bar: 10 µµµµM.
up to 2 h) no fluorescent parasites were observed, possibly due to some quenching
phenomenon happening inside this complex matrix.
The fluorescence pattern of FG400 was similar to that of another dansyl chloride derivative
(DB1919) synthesised in Prof. D. W. Boykin’s laboratory and kindly provided us to test
for our project. In this compound, the dansyl chloride group was linked to an amidino
moiety (the recognition motif of the P2 amino-purine transporter), instead of the lateral
chain of an amino acid, as in FG400. Treatment of in vitro wild type cells with 10 µM of
this compound also yielded a faint fluorescence under both DAPI and FITC filter sets
(Figure 5.10). At this dose, the emission started to be detectable after 15 minutes of
incubation. The use of lower concentrations (1 or 5 µM) of the fluorophore or shorter times
of incubation were not sufficient to obtain a recordable signal. A bright fluorescent spot
positioned in the posterior of the cell (similar to that observed inside trypanosomes stained
with the dansyl lysine derivative) was clearly evident under DAPI and FITC filter, but for
this molecule we were not able to see other cytoplasmic corpuscles. The brighter spot
labelled by both dansyl conjugates could be generated by compound internalised by

Federica Giordani, 2010 Chapter 5, 147
endocytosis and accumulated inside endosomes. Further studies will be needed to verify
this hypothesis. As observed for FG400, also DB1919 fluorescence in infected blood
samples was extremely low, close to background levels (data not shown).

Federica Giordani, 2010 Chapter 5, 148
5.3 Discussion
In this chapter, the synthesis and biological evaluation of three amino acid derivatives,
designed as possible fluorescent probes for trypanosomes, is described. This phase of the
project offered me the opportunity to learn the work carried out in an organic chemistry
laboratory and to participate directly in the initial development (from its creation to its
testing) of new chemical agents.
The synthetic strategy adopted involved the fusion of fluorogenic groups to the side-chain
of amino acids. The intention was to exploit these biomolecules as “haptophore”
(anchorer) moieties, able to rapidly convey the fluorophores into trypanosomes by means
of surface amino acid transporters activity. This approach was similar to that used in the
field of drug development to introduce toxins into parasites by linking them to substrates of
specific trypanosome membrane transporters (Baliani et al., 2005; Barrett and Gilbert,
2006; Chollet et al., 2009). Although the complexity of the synthetic pathway increased
from the first to the last of the three compounds synthesised (a single reaction to generate
FG10, two for FG70, five for FG400), a basic strategy was followed for all of them: (1)
potentially reactive groups of the amino acid were protected or deprotected in preparation
for the reaction of alkylation; (2) the fluorogenic moiety was fused with the side-chain of
the amino acid; (3) the groups still blocked were deprotected, to release the final amino
acid derivative.
Of the three amino acid conjugates synthesised, the dansyl chloride lysine derivative
FG400 was the only one that showed a detectable signal in the visible region of the
spectrum (λEM=520 nm). The blue-green fluorescence of this compound was visible in in
vitro trypanosomes treated with the fluorophore (Figure 5.9). However, fluorescence was
generally low, even when the compound was used at a relatively high dose (100 µM). The
emission of dansyl chloride derivates is known to be weak in aqueous solution and
environment-sensitive. Both of these factors could have contributed to the low and
unstable emission observed. Moreover the compound would need specific filters to be
optimally excited and detected (λEX~340 nm, λEM>520 nm), while standard DAPI and
FITC channels only partially overlapped the spectra of this conjugate. No fluorescent
signal could be detected in treated infected blood samples, possibly due to some quenching
event which occurred in these specimens. The lack of fluorescence in ex-vivo samples did
not allow a check for specific labelling of trypanosomes as compared to other mammalian
cells present in the blood film.

Federica Giordani, 2010 Chapter 5, 149
No indication regarding the mechanism of entry of FG400 into trypanosomes was
obtained. We expected the molecule to be internalised through the activity of specific
amino acid transporters, but other routes could not be excluded. Addition of substituents to
the core amino acid structure could affect the function and stereochemistry of the
“haptophore”, thus preventing recognition by binding sites of specific transporters. Among
other routes, endocytosis could have contributed to the uptake of FG400. The presence of
fluorescent corpuscles in the region where endosomes are normally localised (Figure 5.9)
suggested this hypothesis, but these corpuscles and the other smaller bright spots (spread
throughout the whole cell length), observed in treated parasites, could equally represent
secondary sites of accumulation following transporter uptake.
The synthesised tyrosine (FG10) and serine (FG70) conjugates did not show any
interesting fluorescent properties. Although we could measure excitation peaks in the UV
region of the spectrum for both compounds, no visible emission was evidenced by
spectrometry or qualitative fluorescence microscopy for any of them. No increase of
autofluorescence in cells treated with the tyrosine derivative FG10 was observed. Tyrosine
is a fluorescent amino acid (λEM=300 nm), responsible for the intrinsic fluorescence of
cells and tissues together with the other aromatic amino acids tryptophan and
phenylalanine and molecules such as NADH and FAD (Petty, 2007). Evidently, the
experimental conditions adopted and the low yields of this amino acid (ε ~1,405 cm-1M-1 at
274 nm) did not allow detection of increased emission in treated cells.
To conclude, the overall fluorescence of the three amino acid derivatives proved too low to
be considered of real interest for use in field fluorescence diagnostics of trypanosomiasis,
but in the future new, more effective fluorogenic derivatives for parasite labelling could be
synthesised following the same approach adopted here.

6
Construction of a TbAT1 -RFP reporter system
to study the sub-cellular localisation
of the P2 transporter

Federica Giordani, 2010 Chapter 6, 151
6.1 Introduction
6.1.1 The P2 amino-purine transporter and its subst rates
The P2 amino-purine transporter is a membrane carrier found only in Trypanosoma brucei
(Carter and Fairlamb, 1993; Mäser et al., 1999). The protein is encoded by a single copy
gene named TbAT1, which is located in the subtelomeric region of chromosome V (Lanteri
et al., 2006; Stewart et al., 2010). The physiological substrates of this carrier are adenosine
and adenine, which the parasite needs to scavenge from the human host, since it lacks the
pathway for purine synthesis de novo (Geiser et al., 2005). The importance of this
transporter lies in its primary role in the uptake of various toxic compounds, including
diamidine and melaminophenyl arsenical trypanocidal drugs, which share the same
recognition motif that the P2 transporter uses to interact with its physiological ligands
(Carter and Fairlamb, 1993; Barrett and Fairlamb, 1999; de Koning, 2008). Loss of activity
of this transporter can cause the development of drug resistance, especially for those drugs
(diminazene, DB75) that rely nearly exclusively on its activity for their uptake into
trypanosomes (de Koning et al., 2004; Lanteri et al., 2006). On the other hand, the
presence in T. brucei of other related low affinity transporters partially compensate for loss
of P2 activity in tbat1-/- cells (which lacks both alleles of the TbAT1 gene) and derived
lines, allowing lower but significant internalisation of drugs such as pentamidine and
melarsoprol into parasites (de Koning, 2001b; Matovu et al., 2003).
All of the fluorescent diamidines tested during this project were substrates of the P2
amino-purine transporter. As already mentioned, DB75 is internalised mainly through this
route (Lanteri et al., 2006) and this substrate specificity has been exploited to develop the
arsenical drug resistance fluorescence test (Stewart et al., 2005; Chapter 3). Similarly,
DAPI relies on the P2 transporter for uptake into trypanosomes, but this compound has
also significant affinity for the high affinity pentamidine transporter (HAPT) (Bridges et
al., 2007). Not surprisingly, the Alamar Blue data on drug sensitivity indicated that the five
green fluorescent diamidines synthesised in Prof. D. W. Boykin’s laboratory was mediated
by P2 activity, although other transporters appeared to play a role in their accumulation, as
shown by fluorescence images of the tbat1-/- cell line incubated with these compounds
(Chapter 4).
Since a significant part of this project had focused on studying the ability of different
compounds to enter via the P2 carrier, either alone or as one of several transporters, it was

Federica Giordani, 2010 Chapter 6, 152
of interest to investigate important aspects of the activity of this carrier under different
conditions.
6.1.2 Regulation of the P2 transporter expression
Extensive study has elucidated the substrate specificity and kinetics of the P2 transporter
(Carter and Fairlamb, 1993; Barrett and Fairlamb, 1999; Mäser et al., 1999; de Koning,
2001a; de Koning et al., 2004; Lanteri et al., 2006; Collar et al., 2009) and various efforts
have been made in order to exploit this knowledge to target toxic compounds into
trypanosomes through this route (Tye et al., 1998; Stewart et al., 2004; Baliani et al., 2005;
Barrett and Gilbert, 2006; Chollet et al., 2009; Landfear, 2009). However, very little is
known about the localisation of this carrier within the parasite or about the regulatory
mechanisms of its expression under different environmental conditions. It is known that P2
activity is dependent on the life cycle stage of T. b. brucei, being expressed in bloodstream
forms but not in procyclics (de Koning, 2001a). Moreover, several strands of evidence
obtained in our laboratory indicate that P2 activity is down-regulated in bloodstream cells
grown in culture compared to its expression levels in parasites from in vivo models. Uptake
of radiolabelled adenosine into T. b. brucei cells through this transporter route was found
to be much lower in cells from culture than in cells from rat (Pui Ee Wong, University of
Glasgow, unpublished; Figure 6.1).
Other uptake assays showed that trypanosomes grown in vivo and subsequently transferred
to broth culture gradually down-regulated the adenosine P2-mediated transport activity;
levels similar to continuously in vitro-grown parasites were reached after 8 hours (Pui Ee
Wong, unpublished). This phenomenon could be a response of parasites to the rich in vitro
environment, where nutrients are easily available in the medium and high transporter
expression would be energetically unfavourable. Other data obtained by Pui Ee Wong in
our laboratory demonstrated that the expression of the P2 transporter was higher in
trypanosomes which had reached high parasitaemia levels compared to those that had
reached only low blood parasitaemia (Pui Ee Wong, unpublished). This observation could
be another indication that high levels of P2 expression help protozoan parasites to better
compete for nutrients (in this case, purines) inside their host.
Understanding how trypanosomes regulate the expression of this transporter in response to
changes in their environment and life cycle stage is important, especially when considering
the crucial role of P2 in the internalisation of various trypanocidal compounds. The

Federica Giordani, 2010 Chapter 6, 153
Figure 6.1 – Adenosine uptake in trypanosomes grown either in tissue culture or harvested from rat blood. T. b. brucei S427 w.t. cells from culture ( in vitro cells, blue ■) were directly used for the assay after washing in CBSS, while parasites grown in rats ( in vivo cells, red ▲) were separated from blood cells by elution over a DE52 c olumn and washed in CBSS before use. Uptake of [ 3H]adenosine (10 nM) was measured in the presence of increasing concentrations of unlabeled adenosine after 30 sec incubation. Data were fitted to a sigmoid curve using the nonlinear regression equation of Gr aphPad Prism 5.0 software package. Data and graph were kindly provided by Pui Ee Wong (University of Glasgow, unpublished), and are included here to provide context for work c onducted as part of this thesis.
observation that P2 expression is linked to the level of parasitaemia could have
pharmacokinetic implications for drug development, considering that in humans T. b.
gambiense usually gives rise to very low parasitaemia levels while concentration of T. b.
rhodesiense in human hosts is normally quite high. Furthermore, investigations with
compounds whose entry into trypanosomes has some dependency on P2 may be influenced
by the expression levels of this carrier. For example, during this project, it emerged that
various fluorophores (especially DB75 and propidium iodide) yielded a brighter
fluorescence emission in ex-vivo stained trypanosomes (blood films) than cells derived
from in vitro culture, treated under the same experimental conditions (Chapters 3 and 4).
This difference may be due to the in vitro down-regulation of the P2 transporter in the case
of DB75, but a similar mechanism, involving other transporters, could also be valid for
propidium iodide. The use of trypanosomes grown in rodent blood for testing of
fluorophores was, thus, not only justified by the fact that these blood samples better mimic
the human specimens used for diagnosis than cultured parasites, but also by the
observation that the staining properties of ex-vivo trypanosomes could prove different than
those of cells cultivated in vitro.
The biological mechanisms that trypanosomes use to regulate the levels of the P2
transporter are not known. Various phenomena could be involved in this process, including
different levels of transcription of the TbAT1 gene, instability of the mRNA, post-
transcriptional modifications or compartmentalisation of the protein. Here, the

Federica Giordani, 2010 Chapter 6, 154
construction, by genetic engineering, of a fluorescently tagged P2 transporter, aimed to
localise the carrier in trypanosomes under various environmental conditions, is described.
6.1.3 TbAT1 fluorescent tagging
Previous attempts to generate antibodies against the P2 transporter protein to assess its
intracellular localisation failed (Richard Burchmore, personal communication). We,
therefore, decided to study P2 expression and cell distribution by constructing a reporter
system, in which the TbAT1 gene was expressed together with a fluorescent protein. For
tagging, we chose the monomeric red fluorescent protein mCherry (λEX=587 nm, λEM=610
nm). This fluorophore was derived, by sequential mutations, from mRFP1 (Campbell, et
al., 2002), the monomeric mutant of the Discosoma sp. reef coral tetrameric DsRed protein
(Shaner et al., 2004). The mCherry protein is reported to have high photostability, high
pH-stability and a good maturation rate (measured as the time needed to reach its full
fluorescence) (Shaner et al., 2004 and 2005) and it has already been successfully expressed
in various organisms (Snaith et al., 2005; Pisharath et al., 2007; Pradel et al., 2007). To
ensure that the fluorescent tag itself did not interfere with the biological function of the
target transporter, two constructs were prepared: one with the gene encoding for the red
fluorescent protein linked to the C-terminus of TbAT1 (TbAT1::mCherry, C-t construct)
and one with the mCherry gene linked to its N-terminus (mCherry::TbAT1, N-t construct).
The tetracycline-responsive expression vector pHD676 (Biebinger et al., 1997) was chosen
for cloning. The decision to use an inducible system was made in order to obtain a tight
control on transcription, minimising the risk of over-expression of the exogenous genes,
which could lead to mislocalization of the encoded protein. The two fusion constructs
(TbAT1::mCherry and mCherry::TbAT1) were designed to be inserted within pHD676 as
HindIII-BamHI fragments, with insert downstream of a procyclic acidic repetitive protein
(PARP) promoter, containing tetracycline operator sequences (Wirtz and Clayton, 1995;
Figure 6.3 A). When transfected into a cell line genetically modified to express a
tetracycline repressor (bloodstream form strain 449), the transcription of the exogenous
genes was expected to be repressed until addition to the medium of the inducer
tetracycline. This antibiotic, by binding the repressor, released it from the operator. A
separate constitutive promoter drove transcription of the hygromycin selectable marker
(Biebinger et al., 1997). pHD676 was designed to integrate, once linearised, into the
trypanosome’s genome within the non-transcribed intergenic spacers of the rRNA repeat
region, with an orientation opposite to that of rRNA gene transcription (Wirtz and Clayton,

Federica Giordani, 2010 Chapter 6, 155
1995). Both constructs (N-t and C-t) were also transfected into the tbat1-/- line lacking the
endogenous P2 transporter (Matovu et al., 2003), where they were expected to work in a
constitutive way.

Federica Giordani, 2010 Chapter 6, 156
6.2 Results
6.2.1 Preparation of the TbAT1 -mCherry recombinant constructs
6.2.1.1 Amplification of TbAT1 and mCherry ORF
The TbAT1 ORF was amplified from gDNA extracted from T. b. brucei S427 wild type by
using the high proofreading enzyme KOD Hot Start DNA polymerase (Novagen) (Section
2.7.2.1). Two different sets of primers, containing the appropriate restriction sites for
subsequent cloning, were designed for its amplification (Table 2.2): MB407 and MB408
for the N-t sequence (mCherry ORF upstream TbAT1), MB411 and MB412 for the C-t
(mCherry downstream the TbAT1 sequence). The gene for the mCherry fluorescent protein
was amplified, using the same high fidelity enzyme, from vector p2664 (Kelly et al.,
2007), developed in Dr. M. Carrington’s laboratory (University of Cambridge). Another
two sets of primers flanking the mCherry ORF were designed for its amplification (Table
2.2): MB405 and 406 for the N-t construct, MB409 and MB410 for the C-t. A pair of
glycine residues was introduced as a linker between the TbAT1 and mCherry sequences in
order to provide flexibility to the fused protein.
6.2.1.2 Sequence analysis
Sequencing of the PCR products showed that both of the TbAT1 amplicons (for N-t and C-t
constructs) had the correct sequence (data not shown). The mCherry N-t product sequence
also proved correct. The mCherry amplicon for C-t tagging, however, possessed a single
point mutation at base 64 of its ORF, where the change from a cytosine to an adenine
corresponded to an amino acid change from a histidine to an asparagine (Figure 6.2).
Another discrepancy between our mCherry protein sequence (for both N-t and C-t tagging)
and that published by Shaner and collaborators (Shaner et al., 2004) was the presence in
our products of an asparagine instead of an aspartic acid at position 8. This Asp8 residue
was encoded by the gene sequence in p2664 used as template for mCherry amplification,
and therefore was not the product of a mutation event. Restriction sites introduced for
cloning proved correct for all of the amplicons.

Federica Giordani, 2010 Chapter 6, 157
Figure 6.2 –Amino acid sequence alignment of mCherr y PCR products for N-t and C-t tagging. mCherry ORF was amplified from vector p2664 (Kelly et al ., 2007). Discrepancies between our products and the published mCherry sequence (Sh aner et al ., 2004) are shaded in red. The first amino acid change (Asp 8
→Asn) is at position 8 of both N-t and C-t products; the second mutation (His 22
→Asn) is at position 22 of the C-t product. Addition al residues introduced by PCR amplification upstream and downst ream the mCherry ORF, containing the restriction sites and the stop codon ( -), are shaded in grey.
6.2.1.3 Cloning into the expression vector pHD676
The TbAT1 and mCherry genes were first linked together in a pGEM-T Easy plasmid
(Promega) and, then, the whole HindIII-BamHI fragment containing the fused ORF
(TbAT1::mCherry or mCherry::TbAT1) was excised and inserted into the expression vector
pHD676 (Biebinger et al., 1997) to generate either the N-t (pMB-G94) or C-t (pMB-G95)
final expression constructs (see Figure 2.1 for a schematic representation of the preparation
of the constructs and Figure 6.3 A for the vectors maps). Interestingly, the bacterial pellet
transformed with the C-t vector was pink, while the N-t transformants had a normal
yellowish colour. Insertion of the TbAT1 and mCherry genes inside pHD676 was assessed
by restriction digest analysis (Figure 6.3 B). The use of HindIII-BamHI enzymes released
the correct 2148 bp fragment containing the fused TbAT1 and mCherry sequences. Double
HindIII-ApaI digest released the expected 754 bp fragment (containing mCherry) from
pMB-G94 and a 1405 bp fragment (containing TbAT1) from pMB-G95. Digest with ApaI-
BamHI gave the correct 1394 bp band (TbAT1) in pMB-G94 and 743 bp band (mCherry)
in pMB-G95. Sequencing of the vectors confirmed the correctness of the insertion for both
N-t and C-t HindIII-BamHI fragments.
mCherry C-t (1) GGPMATSGMVSKGEENNMAIIKEFMRFKVNMEGSVNGHEFEIEGEGEGRP mCherry N-t (1) HKLMATSGMVSKGEENNMAIIKEFMRFKVHMEGSVNGHEFEIEGEGEGRP mCherry C-t (51) YEGTQTAKLKVTKGGPLPFAWDILSPQFMYGSKAYVKHPADIPDYLKLSF mCherry N-t (51) YEGTQTAKLKVTKGGPLPFAWDILSPQFMYGSKAYVKHPADIPDYLKLSF mCherry C-t (101) PEGFKWERVMNFEDGGVVTVTQDSSLQDGEFIYKVKLRGTNFPSDGPVMQ mCherry N-t (101) PEGFKWERVMNFEDGGVVTVTQDSSLQDGEFIYKVKLRGTNFPSDGPVMQ mCherry C-t (151) KKTMGWEASSERMYPEDGALKGEIKQRLKLKDGGHYDAEVKTTYKAKKPV mCherry N-t (151) KKTMGWEASSERMYPEDGALKGEIKQRLKLKDGGHYDAEVKTTYKAKKPV mCherry C-t (201) QLPGAYNVNIKLDITSHNEDYTIVEQYERAEGRHSTGGMDELYKGSGTA- mCherry N-t (201) QLPGAYNVNIKLDITSHNEDYTIVEQYERAEGRHSTGGMDELYKGSGTAG mCherry C-t (250) GS- mCherry N-t (251) GGP

Federica Giordani, 2010 Chapter 6, 158
Figure 6.3 – Maps of pMB-G94 and pMB-G95 and their restriction profiles. (A) The two constructs pMB-G94 and pMB-G95 were der ived from pDH676 by insertion of TbAT1-mCherry fused ORFs ( TbAT1::mCherry or mCherry::TbAT1 ) as HindIII-BamHI fragment downstream of a tetracycline-inducible PAR P promoter, containing the tetracycline operator sequence. The hygromycin phos photransferase gene ( HYG) for hygromycin resistance was under control of a differ ent constitutive rRNA promoter. Regulatory 5’ and 3’ actin ( ACT) and PARP untranslated regions (5’ or 3’ UTR) are indicated. Stable integration in the rRNA intergenic region wa s obtained after linearization at the unique Not I site. (B) Restriction digest products of the two vectors, run on a 1% agarose gel (1 kb ladder, Promega). The uncut vector pMB-G95 was loaded as po sitive control.
A
pMB-G94
8245 bp
HYG
AMP
mCherry
TbAT1
PARP promoter
rRNA promoter
E. coli ORI
PARP 5' UTR
ACT 3' UTR
ACT 3' UTR
ACT 5' UTR
rRNA
NotI (275)
ApaI (1888)
HindIII (1134)
BamHI (3282)
pMB-G95
8245 bp
TbAT1
mCherry
HYG
AMP
PARP promoter
rRNA promoter
E. coli ORI
PARP 5' UTR
ACT 3' UTR
ACT 3' UTR
ACT 5' UTR
rRNA
NotI (275)
HindIII (1134)
ApaI (2539)
BamHI (3282)

Federica Giordani, 2010 Chapter 6, 159
6.2.2 Transfection and PCR screening of clones
Bloodstream form T. brucei strain 449 (Biebinger et al., 1997) and the tbat1-/- strain
(Matovu et al., 2003) were transfected with 10 µg of either linearised vector pMB-G94 or
pMB-G95 (Section 2.7.5). Clones were obtained for both cell lines after selection with 5
µg/ml hygromycin. All transfectant lines grew well in culture in the presence of the
selective drug, duplicating at a similar rate as the parental lines.
To check for the presence of the vectors inside transfectants a PCR analysis was
performed. A fragment spanning TbAT1 and mCherry domains was amplified from gDNA
extracted from the clones (Section 2.7.2.2). Primers MB363 (annealing inside the mCherry
ORF) and MB182 (annealing inside the TbAT1 ORF) were used for amplification of the
N-t construct (expected product size of 1302 bp), and MB181 (annealing inside the TbAT1
ORF) and MB410 (annealing at the 3’ of the mCherry ORF) were used for the C-t
construct (expected product size of 1455 bp) (Table 2.3 for primer sequences). Various
transfectants, derived from both 449 and tbat1-/- cell lines, showed the expected band
following PCR amplification (Figure 6.4). Four of them were chosen for subsequent
molecular and biological assays (these clones are indicated with asterisks in Figure 6.4):
two 449-derived lines transfected with pMB-G94 or pMB-G95 (449 Cl.4 N-t, 449 Cl.7 C-t,
respectively) and two tbat1-/--derived lines transfected with either vector (tbat1-/- Cl.6 N-t,
tbat1-/- Cl.9 C-t). Some clones did not yield any product. Nevertheless, absence of an
amplified fragment for these lines could be due to limiting quantities of gDNA template
rather than to unsuccessful transfection, since all of the clones grew well under drug
pressure. Amplification of the endogenous actin gene, however, gave clear bands for all
clones, indicating the presence of DNA template in all samples.
Although PCR analysis confirmed the presence of the constructs inside some of the
transfectants, these results could not distinguish between their presence as stable gDNA
integrated copies or as transient episomes. Bloodstream form trypanosomes, however,
generally fail to maintain episomal plasmids, especially when compared to procyclic form
(Patnaik et al., 1993; Burkard et al., 2007); hence, it was assumed DNA was integrated.

Federica Giordani, 2010 Chapter 6, 160
Figure 6.4 – PCR screening of transgenic bloodstrea m form cell lines. Genomic DNA from clones obtained after transfection of the 449 and tbat1 -/- lines with either pMB-G94 (N-t clones, panel A) or pMB-G95 (C-t clone s, panel B) was extracted using the DNeasy® Blood and Tissue Kit (Qiagen). A fragment spanning the fused TbAT1 and mCherry sequences was amplified using specific primers (Tab le 2.3). The expected band size for the N-t fragment was 1302 bp, for the C-t 1455 bp. Ampl icons were run on a 1% agarose gel (1 kb ladder, Promega). Numbers at the top of the gel indicate different clones: (A) 449 clones 1,2,3,4 were obtained after transfection of 449 lin e with pMB-G94; tbat1 -/- clones 6,7,8,9 were obtained after transfection of tbat1 -/- line with pMB-G94. (B) 449 clones 2,4,7,9 were obt ained after transfection of 449 line with pMB-G95; tbat1 -/- clones 1,2,9,12 were obtained after transfection of tbat1 -/- line with pMB-G95. Actin ( ACT, expected band size 455 bp) amplification was used to verify presence of gDNA t emplate in the PCR samples. Clones chosen for successive biological assays are indicat ed with an asterisk. +: positive control (purified plasmid); -: negative control (no gDNA).

Federica Giordani, 2010 Chapter 6, 161
6.2.3 Southern blot
Southern blot hybridization (Section 2.7.6) was used to determine correct and stable
integration of the constructs within the non-transcribed rRNA spacer of the trypanosome’s
genome, in the reverse orientation relative to endogenous rRNA genes transcription. The
ORFs of both TbAT1 and mCherry were used as probes. Two clones (449 Cl.7 C-t and 449
Cl.4 N-t) were selected for study. At the same time, the gDNA of the parental line 449 was
also analysed to determine the restriction pattern of the endogenous copy of the TbAT1
gene.
6.2.3.1 Clone 449 Cl.7 C-t
The gDNA of clone 449 Cl.7 C-t and its parental line 449 were digested with seven
different restriction enzymes and probed with the TbAT1 ORF. Southern analysis of the
449 line identified the position of the endogenous copy of the TbAT1 gene (Figure 6.5). All
band sizes corresponded to the expected restriction pattern of the TbAT1 genomic region
(24 kb total length) annotated for T. brucei in GeneDB (http://www.genedb.org/Homepage),
except for StuI. The expected band for this enzyme was 6.7 kb, while the fragment in our
blot had a size of ~3.7 kb, possibly due to heterogeneity between the published 927 strain
genome and that of 427 strain used during our experiments. The sizes of the bands for the
other enzymes were: PstI: 6.8 kb; HindIII: 13.9 kb; BglII: no bands; NcoI: 3.5 and 3.9 kb;
XhoI: 2.7 kb; SpeI: 8.7 kb.
In the derived clone 449 Cl.7 C-t, insertion of the vector pMB-G95 (containing the
exogenous TbAT1 copy) yielded additional bands (Figure 6.5). To determine the
correctness of integration, the size of these bands was compared to the published restriction
maps of the rRNA locus (Biebinger et al., 1996 and 1997), schematically reproduced in
Figure 6.6 together with the restriction pattern of the two transfected vectors. In addition to
the endogenous 6.8 kb band, PstI digestion yielded an extra-band of the expected size (8
kb). Digestion with HindIII, StuI and BglII yielded two additional bands instead of the
single one expected. An explanation for this result is the possible insertion of two copies of
the vector in two separated rRNA spacers with different restriction polymorphisms, a
known characteristic of this genomic region that complicates analysis (Biebinger et al.,
1996). Nevertheless, insertion in other regions of the genome for one or both constructs
can not be excluded. If this hypothesis was right we would expect a similar double band
pattern also for PstI, NcoI and XhoI, but this was not observed. HindIII digestion produced

Federica Giordani, 2010 Chapter 6, 162
Figure 6.5 – Southern blot analysis of line 449 and derived clone 449 Cl. 7 C-t, hybridized with TbAT1 probe. gDNA of both cell lines was digested with seven dif ferent enzymes and hybridized with a probe constituted by the whole TbAT1 ORF to verify integration in the rRNA non-transcri bed spacer. Asterisks denote the extra bands hybridized in the derived clone compared to the parental line. 1: Pst I; 2: HindIII; 3: Stu I; 4: Bgl II; 5: Nco I; 6: Xho I; 7: SpeI.
a band of ~9 kb and another that could correspond to the expected 12.3 kb, but the exact
size of this band was difficult to determine, being beyond the range of the molecular
weight ladder used. The expected band size after StuI digestion was of 5.7 kb, as found,
while the slightly bigger band (~5.9 kb) could derive from a polymorphic restriction site in
another rRNA spacer. The size of the bands yielded following BglII digestion (~8.8 and
9.7 kb) could not be explained using the mapped sites, and other polymorphic BglII
restriction sequences must be present in our line, if the vector targeted the rRNA spacer.
NcoI digestion generated an expected band of 0.9 kb and another one of ~1.6 kb expanding
outside the vector length, as the band (~8.5 kb) generated by XhoI digestion (no restriction
map of the rRNA locus was available for these two enzyme). TbAT1 probing following
SpeI digestion yielded the correct vector-internal 3.2 kb fragment. Overall we can conclude
that the vector had integrated into the T. brucei genome, but that this integration had not
been targeted to the precise location anticipated, or else polymorphisms between the

Federica Giordani, 2010 Chapter 6, 163
Figure 6.6 – Restriction digest map of vectors pMB- G94 and pMB-G95 and of the rRNA locus of T. b. brucei . (A) Schematic representation of the two vectors use d for transfection (pMB-G94 and pMB-G95) linearised at the unique Not I site. Underneath each construct are illustrated t he restriction fragments resulting from their digestio n with the seven enzymes used for Southern blotting ( Pst I, HindIII, Stu I, Bgl II, Nco I, Xho I, SpeI). (B) Restriction map of the the rRNA locus of T. b. brucei S427 (adapted from Biebinger et al ., 1996 and 1997), with the size of the fragments expe cted by digest of this locus with Pst I, HindIII, Stu I and Bgl II indicated underneath (restriction map of this lo cus for Nco I, Xho I, SpeI was not available). Restriction sites that vary between loci are in bra ckets. Black boxes represent the rRNA genes. The striped box indicates the site of vector integration. Arrows indicate the direction of transcription. B: Bgl II; H: HindIII; P: Pst I; S: Stu I.

Federica Giordani, 2010 Chapter 6, 164
Figure 6.7 – Southern blot analysis of line 449 and derived clone 449 Cl.7 C-t, hybridized with mCherry probe. gDNA of both cell lines was digested with seven dif ferent enzymes and hybridized with a probe constituted by the mCherry ORF to verify integration in the rRNA non-transcri bed spacer. 1: Pst I; 2: HindIII; 3: Stu I; 4: Bgl II; 5: Nco I; 6: Xho I; 7: SpeI.
non-transcribed intergenic spacers in the ribosomal locus of 427 genome (the strain from
which b.f. 449 derives) affected restriction patterns.
After probing with TbAT1, the two membranes were stripped (Section 2.7.6.4) and re-
probed with the mCherry ORF. As expected, hybridization of the gDNA from the parental
line (449) yielded no bands (Figure 6.7). In the derived clone 449 Cl.7 C-t, PstI, HindIII,
BglII, XhoI and SpeI digestion yielded the same bands detected using the TbAT1 probe (8
kb for PstI, 9.0 and 12.3 kb for HindIII, 8.8 kb and 9.7 for BglII, 8.5 kb for XhoI and 3.2 kb
for SpeI) (Figure 6.7). StuI digestion showed the correct 2.4 kb band. The other very small
band expected after digestion with this enzyme (0.3 kb) had gone off the end of the gel and
does not appear in the blot shown in Figure 6.7. NcoI digestion yielded the expected 1.8 kb
band.

Federica Giordani, 2010 Chapter 6, 165
6.2.3.2 Clone 449 Cl.4 N-t
As for the C-t clone, the Southern blot of the N-t clone (449 Cl.4 N-t) showed additional
bands compared to the parental 449 line (Figure 6.8), indicative of integration of the vector
into the parasite genome (the digestion pattern for the parental line has already been shown
in Figure 6.5). For this clone each enzyme yielded a single extra band pattern compared to
the 449 line, suggesting a single insertion event. The size of some of the bands expanding
beyond the length of the vector, and expected to be identical to the bands obtained for the
C-t clone (Figure 6.6), actually differed from these. Hence, integration of the constructs
inside the genome of the two clones appeared to be at two different sites. In 449 Cl.4 N-t
PstI digestion should have yielded an additional band of 8 kb identical to that of the C-t
clone, but in the N-t clone a band with a slightly bigger size (~8.5 kb) was observed.
HindIII yielded an extra band, slightly smaller than that generated by the endogenous
TbAT1 copy (13.9 kb), but bigger than the band of 12.3 kb found in the C-t clone. XhoI
digestion, instead, yielded a band of 8.5 kb identical to the C-t clone. Digestion with either
StuI, NcoI or SpeI were expected to generate bands contained within the length of the
vector and all of these enzymes yielded correct band sizes:the StuI band was 3.8 kb,the
NcoI band was 2.0 kb and the SpeI band was 3.2 kb. The second band yielded by NcoI
digestion (a faintly detectable 2.4 kb band) must be due to a site just downstream the site of
integration, as inferred also for the C-t clone. Finally, BglII digestion generated a high
molecular weight band of ~14 kb.
The use of the mCherry probe confirmed the presence of the sequence of the fluorescent
protein within the clone 449 Cl.4 N-t, although the bands appeared faint in this particular
blot (Figure 6.8). Bands obtained after digestion with PstI, HindIII, BglII, XhoI and SpeI
were identical, as expected, to the bands obtained after hybridization with the TbAT1 probe
(PstI and XhoI 8.5 kb, HindIII 13.5 kb, BglII 14 kb, SpeI 3.2 kb). StuI digestion generated
an expected 4.3 kb band, but the small 0.3 kb band and the other expected 3.8 kb band
were not detectable on the blot (the first one had probably run out of the gel and the second
could have resulted too faint to be detectable). NcoI digestion yielded the expected 2.4 kb
band.
Summarising, Southern blot hybridization confirmed the presence of the exogenous TbAT1
and mCherry fused ORF in the genome of both analysed clones. Integration of pMB-G94
and pMB-G95 in the genome of the two clones seemed to have occurred at two different
loci, none of which could be unequivocally identified with the rRNA spacers.
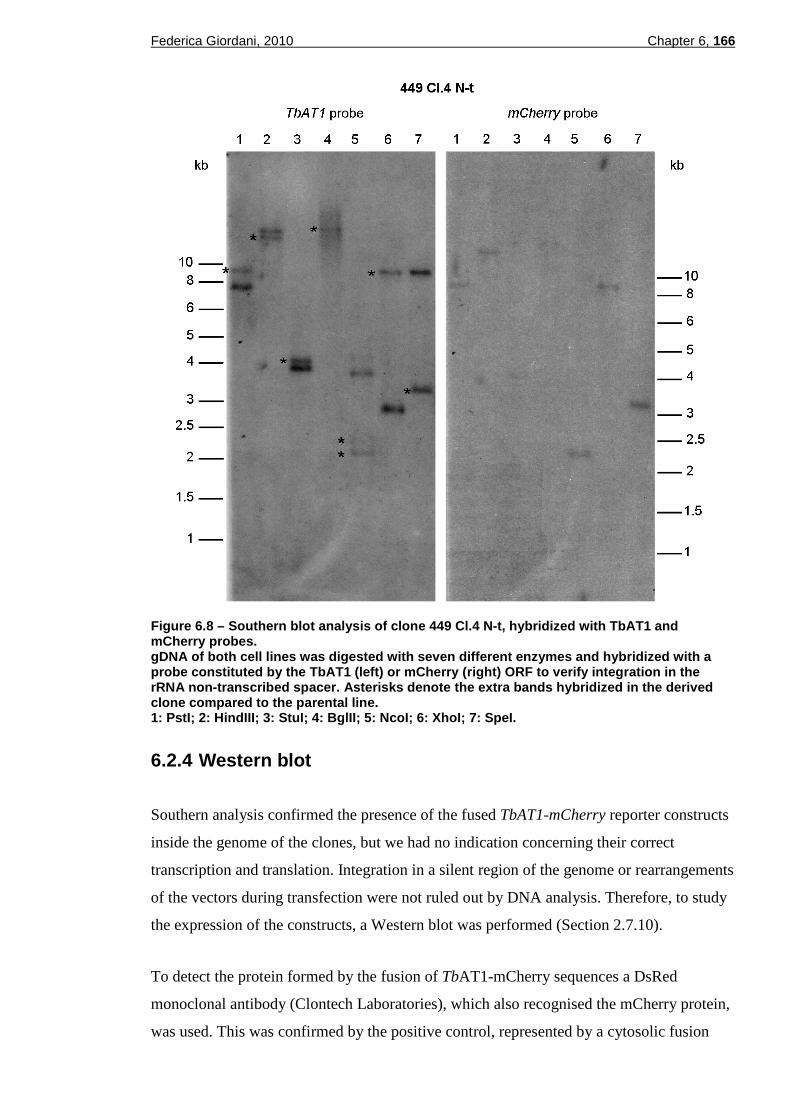
Federica Giordani, 2010 Chapter 6, 166
Figure 6.8 – Southern blot analysis of clone 449 Cl .4 N-t, hybridized with TbAT1 and mCherry probes. gDNA of both cell lines was digested with seven dif ferent enzymes and hybridized with a probe constituted by the TbAT1 (left) or mCherry (right) ORF to verify integration in the rRNA non-transcribed spacer. Asterisks denote the e xtra bands hybridized in the derived clone compared to the parental line. 1: Pst I; 2: HindIII; 3: Stu I; 4: Bgl II; 5: Nco I; 6: Xho I; 7: SpeI.
6.2.4 Western blot
Southern analysis confirmed the presence of the fused TbAT1-mCherry reporter constructs
inside the genome of the clones, but we had no indication concerning their correct
transcription and translation. Integration in a silent region of the genome or rearrangements
of the vectors during transfection were not ruled out by DNA analysis. Therefore, to study
the expression of the constructs, a Western blot was performed (Section 2.7.10).
To detect the protein formed by the fusion of TbAT1-mCherry sequences a DsRed
monoclonal antibody (Clontech Laboratories), which also recognised the mCherry protein,
was used. This was confirmed by the positive control, represented by a cytosolic fusion

Federica Giordani, 2010 Chapter 6, 167
protein containing the mCherry sequence and expressed in Leishmania mexicana (kindly
provided by Elmarie Myburgh, University of Glasgow) (Figure 6.9). Unfortunately, our
experiments failed to detect the TbAT1-mCherry fusion protein (predicted protein size was
78 kDa: 27 kDa for the mCherry protein and 51 kDa for the P2 transporter). Instead, the
mCherry antibody always bound to a 175 kDa protein, particularly abundant in the aqueous
fraction but also detectable in the total protein extract of the clones analysed (Figure 6.9).
This high molecular weight protein was not specific for our transfectants, since it was also
detected in the parental line 449 (and in the other parental line tbat1-/-, data not shown).
Figure 6.9 – Western blot analysis of cell extracts from clone 449 Cl.4 N-t and 449 Cl.7 C-t. After growth in the presence of the inducer tetracy cline, cells were lysed for differential extraction of proteins (Section 2.7.7). Total prote in extract (T), enriched aqueous (A) and organic (O) protein fractions were prepared for bot h clones and probed with the DsRed monoclonal antibody (1:250) and the goat anti-mouse secondary antibody (1:2,000). The positive control (+) is represented by the total ce ll lysate from a Leishmania mexicana line expressing a cytosolic fusion protein containing mC herry (kindly provided by Elmarie Myburgh, University of Glasgow). Total cell lysate from the parental line 449, probed with the same antibody, is shown on the right.
There are a number of potential reasons for the inability to detect our fusion protein. First,
low levels of expression of the construct in the clones could have yielded only low
amounts of protein (too low to generate a signal in the blot). The unknown mechanism
involved in P2 down-regulation in vitro could have played a role in this phenomenon. For
this reason, total cell lysate from clones grown in vivo (where P2 is not down-regulated)
was analysed following the same procedure as for in vitro cells, but these samples also
failed to show the expected protein (data not shown). Extraction of membrane proteins can
be difficult; hence the organic fractions (where the fusion protein was expected to be
present) were extracted using the non-ionic detergent Triton X-114, resulting in very
viscous samples: this hampered both loading and running of the fractions; a smeared
signal, stuck inside the well of the polyacrylamide gel of 449 Cl.7 C-t clone (Figure 6.9,

Federica Giordani, 2010 Chapter 6, 168
449 Cl.7 C-t clone, lane O) could derive from a protein sample that did not run properly
inside the gel.
Western blot analysis, therefore, was inconclusive and failed to demonstrate successful
expression of the fusion protein in T. brucei, although a low abundant membrane protein
might escape detection using these procedures.
6.2.5 Drug sensitivity
Since Western blot analysis failed to demonstrate the successful expression of the TbAT1-
mCherry reporter protein, we performed some biological assays as another means to assess
functional expression. To determine whether the exogenous TbAT1 copy was functionally
expressed inside the cells, the Alamar Blue assay was performed (Section 2.4). The test
allows determination of bloodstream form trypanosome drug sensitivity, which reveals
differences depending on the expression of the TbAT1 transporter in the cells. Four drugs
were tested: DB75 and diminazene, two diamidines principally dependent on the P2
transporter for their uptake into parasites (Lanteri et al., 2006; de Koning et al., 2004),
pentamidine, another diamidine only partially dependent on P2 activity (de Koning,
2001a), and suramin, a molecule thought to enter the cells by receptor-mediated
endocytosis without any interaction with the P2 transporter (Fairlamb, 2003). IC50 (half
maximal inhibitory concentration) values for the 449-derived lines were measured in the
absence of tetracycline, or after addition of the inducer at 1 µg/ml, 48 h before performing
the test, in order to obtain complete induction of reporter expression (Wirtz and Clayton,
1995). All transfectant lines were cultivated in the presence or absence (removal was
carried out 48 h before the test) of hygromycin, before and during the assay, to monitor
possible interaction of this antibiotic with the other drugs or eventual effects on cell growth.
IC50 values showed that addition of hygromycin to the medium did not interfere with the
activity of the four drugs (Table 6.1), but slightly decreased the cell growth rate of the
transfectants compared to the parental line (which was grown in absence of antibiotics).
Therefore, to compare the effects of the various drugs on the tested cell lines, only data
obtained with clones grown in medium without hygromycin were considered in this discussion.
For all of the transformants it was evident that a significant increase in sensitivity to P2-
transported drugs (DB75 and diminazene) was induced compared to the parental line
(Table 6.1 and Figure 6.10), suggesting active expression of the exogenous copy (or

Federica Giordani, 2010 Chapter 6, 169
copies) of TbAT1. For clone 449 Cl.4 N-t (Figure 6.10 A), the IC50 value following DB75
treatment was 11.6-fold lower than the value measured for the parental line 449 in the
presence of tetracycline, and 2.6-fold lower in case of diminazene treatment. Both
differences were statistically significant (P <0.01) by the Student’s t-test. Increase of
sensitivity of the clone compared to the 449 line was much smaller following pentamidine
(1.2-fold) and suramin (1.4-fold) incubation. Although the data measured for clone 449
Cl.4 N-t incubated with suramin was found significantly lower (P <0.01) than that of line
449, in the presence of tetracycline, this result was not confirmed by any of the other
transformants analysed. The causes of the slightly higher sensitivity to suramin of clone
449 Cl.4 N-t compared to its parental line could be ascribed to a slightly lower growth rate
of the clone, or to some other mutational event which could have increased its sensitivity to
the drug (especially in the presence of tetracycline). An absence of the inducer tetracycline
in the medium resulted in IC50 values being very similar between the clone and its parental
line, indicating a successful regulation of the system.
Clone 449 Cl.7 C-t (Figure 6.10 C) was also significantly more sensitive to DB75 (6.7-fold
lower IC50, P <0.01 by the t-test) and diminazene (5.7-fold lower IC50, P <0.001)
compared to line 449, in the presence of tetracycline. The clone was only 1.3-fold more
sensitive to pentamidine than 449 and did not show any significant difference with the
parental line after suramin treatment. This clone transfected with the C-t construct
appeared to have a worse regulation compared to clone 449 Cl.4 N-t and, even in the
absence of tetracycline, it still maintained higher sensitivity towards DB75 (P <0.01),
diminazene (P <0.001) and pentamidine (P <0.05) than 449 line. This result could be
explained by lessened control at the tetracycline-responsive site, or by different levels of
transcription between rRNA spacers or other possible integration sites. Variability between
phenotypes of different clones is a common phenomenon and it has already been observed
in bloodstream transfectants (Biebinger et al., 1996).
For tbat1-/--derived lines (Figure 6.10 B and D), the absence of the endogenous P2
background resulted in more significant differences between transfectant and parental IC50
values. tbat1-/- Cl.6 N-t was 85.2-fold more sensitive to DB75 treatment than tbat1-/- cell
line (P <0.001) and 14.5-fold to diminazene (P <0.01). Clone tbat1-/- Cl.9 C-t showed a
similar trend, resulting in its being 117.1-fold more sensitive to DB75 and 27.2 to
diminazene than tbat1-/- (P <0.001 in both cases). Differences between transfectants and
parental line drastically diminished following pentamidine treatment and disappeared
following suramin incubation for both tbat1-/--derived clones.
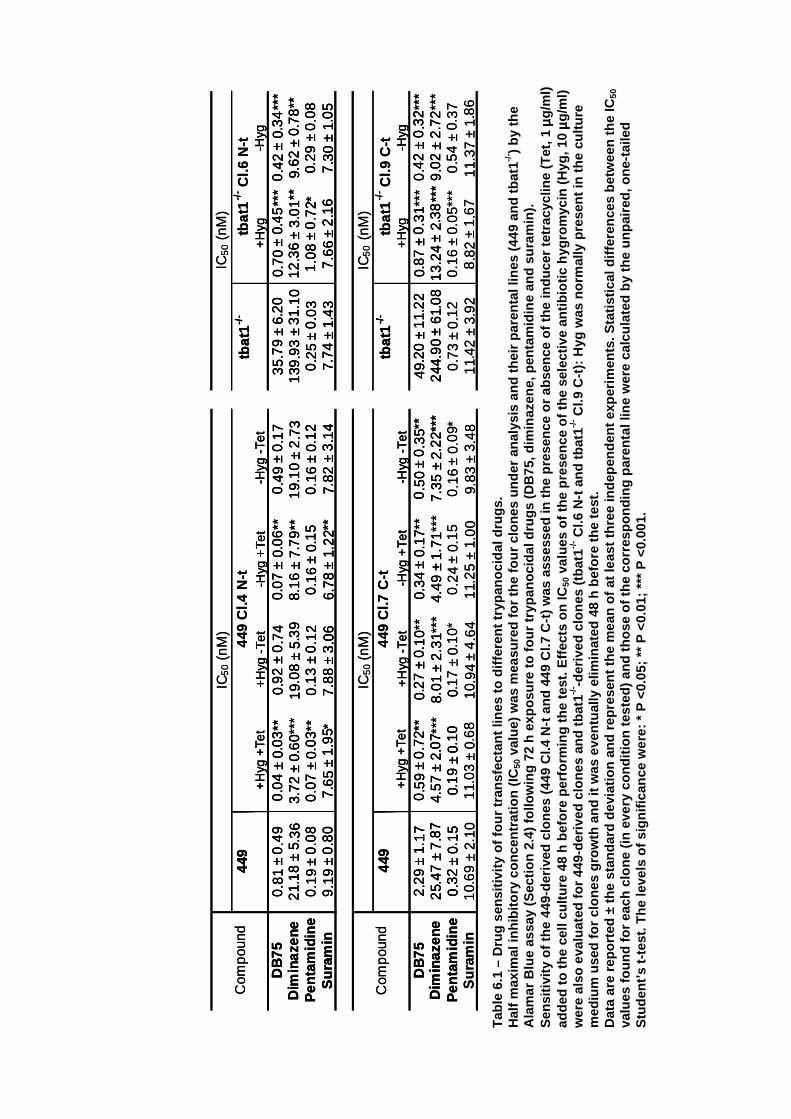
T
able
6.1
– D
rug
sens
itivi
ty o
f fou
r tr
ansf
ecta
nt l
ines
to d
iffer
ent t
rypa
noci
dal d
rugs
. H
alf m
axim
al in
hibi
tory
con
cent
ratio
n (I
C50
val
ue)
was
mea
sure
d fo
r th
e fo
ur c
lone
s un
der
anal
ysis
and
thei
r pa
rent
al li
nes
(449
and
tb
at1
-/- )
by th
e A
lam
ar B
lue
assa
y (S
ectio
n 2.
4) fo
llow
ing
72 h
exp
osu
re to
four
tryp
anoc
idal
dru
gs (
DB
75, d
imin
azen
e,
pent
amid
ine
and
sura
min
).
Sen
sitiv
ity o
f the
449
-der
ived
clo
nes
(449
Cl.4
N-t
and
449
Cl.7
C-t
) w
as a
sses
sed
in th
e pr
esen
ce o
r ab
senc
e of
the
indu
cer
tetr
acyc
line
(Tet
, 1
µµ µµg/m
l) ad
ded
to th
e ce
ll cu
lture
48
h be
fore
per
form
ing
the
test
. Effe
cts
on IC
50 v
alue
s of
the
pres
ence
of t
he s
elec
tive
antib
iotic
hyg
rom
ycin
(H
yg, 1
0 µµ µµg
/ml)
wer
e al
so e
valu
ated
for
449-
deriv
ed c
lone
s an
d tb
at1
-/- -d
eriv
ed c
lone
s (
tbat
1-/
- Cl.6
N-t
and
tba
t1-/
- Cl.9
C-t
): H
yg w
as n
orm
ally
pre
sent
in th
e cu
lture
m
ediu
m u
sed
for
clon
es g
row
th a
nd it
was
eve
ntua
lly e
limin
ated
48
h be
fore
the
test
. D
ata
are
repo
rted
± th
e st
anda
rd d
evia
tion
and
repr
esen
t the
mea
n of
at l
east
thre
e in
depe
nden
t exp
eri
men
ts. S
tatis
tical
diff
eren
ces
betw
een
the
IC50
va
lues
foun
d fo
r ea
ch c
lone
(in
eve
ry c
ondi
tion
tes
ted)
and
thos
e of
the
corr
espo
ndin
g pa
rent
al li
ne w
ere
calc
ulat
ed b
y th
e un
paire
d, o
ne-t
aile
d S
tude
nt’s
t-
test
. The
leve
ls o
f sig
nific
ance
wer
e: *
P
<0.
05; *
* P
<0.
01; *
** P
<0.
001.
449
tbat
1-/
-
+H
yg+
Tet
+H
yg-T
et-H
yg+
Tet
-Hyg
-Tet
+H
yg-H
ygD
B75
0 .81
±0
.49
0.04
±0.
03**
0.92
±0
.74
0.07
±0.
06**
0 .49
±0
.17
35.
79
±6.
200.
70 ±
0.4
5**
*0 .
42 ±
0.34
***
Dim
inaz
ene
21.
18 ±
5 .36
3.72
±0.
60**
*19
.08
±5.
39
8.16
±7.
79 *
*1
9.1
0 ±
2.7
313
9.9
3 ±
31. 1
012
.36
±3.
01*
*9.
62 ±
0.78
**P
enta
mid
ine
0 .19
±0
.08
0.0
7 ±
0.03
**0
.13
±0
.12
0.1
6 ±
0.15
0 .16
±0.
120 .
25 ±
0.0
31 .
08 ±
0.7
2 *0.
29 ±
0.0
8S
uram
in9 .
19 ±
0.8
07.
65
±1
.95 *
7.88
±3
.06
6.78
±1.
22**
7.82
±3 .
147.
74 ±
1.4
37
.66
±2
.16
7.3
0 ±
1.05
449
tbat
1-/
-
+H
yg+
Tet
+H
yg-T
et-H
yg+
Tet
-Hyg
-Tet
+H
yg-H
ygD
B75
2 .29
±1.
170 .
59
±0
.72*
*0.
27 ±
0.10
**0.
34 ±
0.17
**0 .
50 ±
0.3
5**
49.2
0 ±
11.2
20.
87 ±
0 .31
***
0.4
2 ±
0.3
2 ***
Dim
inaz
ene
25.
47 ±
7.8
74.
57 ±
2.07
***
8.0
1 ±
2.31
***
4.49
±1
. 71*
**7.
35 ±
2.22
***
244.
90
±61
.08
13.2
4 ±
2.38
***
9.0
2 ±
2.72
***
Pen
tam
idin
e0.
32 ±
0.15
0.1
9 ±
0.10
0.17
±0.
10*
0.2
4 ±
0.15
0 .16
±0.
09*
0.73
±0.
120.
16 ±
0.05
***
0.5
4 ±
0.37
Sur
amin
10.
69 ±
2.10
11.
03 ±
0.68
10.9
4 ±
4.6
411
.25
±1 .
00
9.83
±3 .
4811
. 42
±3.
928
.82
±1
.67
11.3
7 ±
1.86
449
Cl.4
N-t
Com
poun
d
449
Cl.7
C-t
Com
poun
d
IC5
0(n
M)
IC50
(nM
)
tbat
1-/
-C
l.6 N
-t
tbat
1-/
-C
l.9 C
-t
IC50
(nM
)
IC5
0(n
M)
449
tbat
1-/
-
+H
yg+
Tet
+H
yg-T
et-H
yg+
Tet
-Hyg
-Tet
+H
yg-H
ygD
B75
0 .81
±0
.49
0.04
±0.
03**
0.92
±0
.74
0.07
±0.
06**
0 .49
±0
.17
35.
79
±6.
200.
70 ±
0.4
5**
*0 .
42 ±
0.34
***
Dim
inaz
ene
21.
18 ±
5 .36
3.72
±0.
60**
*19
.08
±5.
39
8.16
±7.
79 *
*1
9.1
0 ±
2.7
313
9.9
3 ±
31. 1
012
.36
±3.
01*
*9.
62 ±
0.78
**P
enta
mid
ine
0 .19
±0
.08
0.0
7 ±
0.03
**0
.13
±0
.12
0.1
6 ±
0.15
0 .16
±0.
120 .
25 ±
0.0
31 .
08 ±
0.7
2 *0.
29 ±
0.0
8S
uram
in9 .
19 ±
0.8
07.
65
±1
.95 *
7.88
±3
.06
6.78
±1.
22**
7.82
±3 .
147.
74 ±
1.4
37
.66
±2
.16
7.3
0 ±
1.05
449
tbat
1-/
-
+H
yg+
Tet
+H
yg-T
et-H
yg+
Tet
-Hyg
-Tet
+H
yg-H
ygD
B75
2 .29
±1.
170 .
59
±0
.72*
*0.
27 ±
0.10
**0.
34 ±
0.17
**0 .
50 ±
0.3
5**
49.2
0 ±
11.2
20.
87 ±
0 .31
***
0.4
2 ±
0.3
2 ***
Dim
inaz
ene
25.
47 ±
7.8
74.
57 ±
2.07
***
8.0
1 ±
2.31
***
4.49
±1
. 71*
**7.
35 ±
2.22
***
244.
90
±61
.08
13.2
4 ±
2.38
***
9.0
2 ±
2.72
***
Pen
tam
idin
e0.
32 ±
0.15
0.1
9 ±
0.10
0
65
±1
.95 *
7.88
±3
.06
6.78
±1.
22**
7.82
±3 .
147.
74 ±
1.4
37
.66
±2
.16
7.3
0 ±
1.05
449
tbat
1-/
-
+H
yg+
Tet
+H
yg-T
et-H
yg+
Tet
-Hyg
-Tet
+H
yg-H
ygD
B75
2 .29
±1.
170 .
59
±0
.72*
*0.
27 ±
0.10
**0.
34 ±
0.17
**0 .
50 ±
0.3
5**
49.2
0 ±
11.2
20.
87 ±
0 .31
***
0.4
2 ±
0.3
2 ***
Dim
inaz
ene
25.
47 ±
7.8
74.
57 ±
2.07
***
8.0
1 ±
2.31
***
4.49
±1
. 71*
**7.
35 ±
2.22
***
244.
90
±61
.08
13.2
4 ±
2.38
***
9.0
2 ±
2.72
***
Pen
tam
idin
e0.
32 ±
0.15
0.1
9 ±
0.10
0.17
±0.
10*
0.2
4 ±
0.15
0 .16
±0.
09*
0.73
±0.
120.
16 ±
0.05
***
0.5
4 ±
0.37
Sur
amin
10.
69 ±
2.10
11.
03 ±
0.68
10.9
4 ±
4.6
411
.25
±1 .
00
9.83
±3 .
4811
. 42
±3.
928
.82
±1
.67
11.3
7 ±
1.86
449
Cl.4
N-t
Com
poun
d
449
Cl.7
C-t
Com
poun
d
IC5
0(n
M)
IC50
(nM
)
tbat
1-/
-C
l.6 N
-t
tbat
1-/
-C
l.9 C
-t
IC50
(nM
)
IC5
0(n
M)

Fig
ure
6.10
– S
ensi
tivity
of f
our
clon
es a
nd th
eir
pare
ntal
line
s to
four
diff
eren
t try
pano
cida
l dru
gs.
Sen
sitiv
ity o
f clo
nes
449
Cl.4
N-t
(A
),
tbat
1-/
- Cl.6
N-t
(B
), 4
49 C
l.7 C
-t (
C)
and
tbat
1-/
- Cl.9
C-t
(D
) is
exp
ress
ed a
s IC
50 v
alue
s re
lativ
e to
the
corr
espo
ndin
g pa
rent
al li
ne (
449
or
tbat
1-/
- ), c
onsi
dere
d as
100
%. 4
49-d
eriv
ed c
lone
s w
ere
grow
n in
the
pres
ence
or
abse
nce
of th
e in
duce
r te
trac
ycl
ine
(Tet
, 1 µµ µµ
g/m
l).
Tra
nsfe
ctan
ts w
ere
grow
n in
abs
ence
of h
ygro
myc
in i
n th
e m
ediu
m fr
om 4
8 h
befo
re th
e te
st. D
ata
are
show
n ±
the
stan
dard
dev
iatio
n an
d re
pres
ent t
he
mea
n of
thre
e in
depe
nden
t exp
erim
ents
. Sta
tistic
al
diffe
renc
es b
etw
een
the
IC50
val
ues
of e
ach
clon
e an
d th
ose
of th
e co
rres
pond
ing
pare
ntal
line
wer
e ca
lcul
ated
by
the
unpa
ired
one-
taile
d S
tude
nt’s
t-
test
and
are
indi
cate
d by
ast
eris
ks. T
he le
vels
of
sig
nific
ance
wer
e: *
P
<0.
05; *
* P
<0.
01; *
** P
<0.
001.
A
020406080100
120
140
160
180
200
DB
75D
imin
aze
neP
ent
am
idin
eS
ura
min
Relative IC50 (%)
449
449
Cl.4
N-t
+Te
t
449
Cl.4
N-t
-Te
t
C
020406080100
120
140
160
180
200
DB
75D
imin
aze
neP
ent
am
idin
eS
ura
min
Relative IC50 (%)
449
449
Cl.7
C-t
+Te
t
449
Cl.7
C-t
-Te
t
D
020406080
100
120
140
160
180
200
DB
75D
imin
aze
neP
enta
mid
ine
Sur
amin
Relative IC50 (%)
tbat
1-/-
tbat
1-/-
Cl.9
C-t
B
020406080100
120
140
160
180
200
DB
75D
imin
aze
neP
ent
am
idin
eS
ura
min
Relative IC50 (%)
tbat
1-/-
tbat
1-/-
Cl.6
N-t
**
****
***
**
****
***
***
*
***
***
A
020406080100
120
140
160
180
200
DB
75D
imin
aze
neP
ent
am
idin
eS
ura
min
Relative IC50 (%)
449
449
Cl.4
N-t
+Te
t
449
Cl.4
N-t
-Te
t
C
020406080100
120
140
160
180
200
DB
75D
imin
aze
neP
ent
am
idin
eS
ura
min
Relative IC50 (%)
449
449
Cl.7
C-t
+Te
t
449
Cl.7
C-t
-Te
t
D
020406080
100
120
140
160
180
200
DB
75D
imin
aze
neP
enta
mid
ine
Sur
amin
Relative IC50 (%)
tbat
1-/-
tbat
1-/-
Cl.9
C-t
B
020406080100
120
140
160
180
200
DB
75D
imin
aze
neP
ent
am
idin
eS
ura
min
Relative IC50 (%)
tbat
1-/-
tbat
1-/-
Cl.6
N-t
**
****
***
**
****
***
***
*
***
***

Federica Giordani, 2010 Chapter 6, 172
In conclusion, the drug sensitivity data were consistent with successful and inducible
expression of the reporter gene. Furthermore, it appeared that both N-terminal and C-
terminal fusions were functional, which indicated neither terminus played a role in the
transport process of the P2 permease.
6.2.6 Fluorescence microscopy
The Alamar Blue results indicated that the exogenous copy of the TbAT1 gene was actively
expressed and functional, but these data did not give any indications concerning the
expression of the fused mCherry protein. To assess expression of the genetically encoded
fluorescent protein inside trypanosomes all of the clones were analysed by fluorescence
microscopy. The microscopy study was also expected to reveal the subcellular distribution
of the fused protein and, therefore, of the P2 amino-purine transporter, which represented
the final aim of this work.
6.2.6.1 Fluorescence of clones grown in vitro
In vitro transfectants were viewed under the Zeiss Axioplan fluorescence microscope using
the DsRed filter (λEX=545 nm, λEM=605 nm), which matched the recommended
wavelengths for the mCherry protein (Shaner et al., 2005). For 449-derived clones,
construct expression was induced with tetracycline (1 µg/ml) 48 h before viewing. Initial
screening of live in vitro parasites revealed a very low and hardly detectable fluorescence
for all of the clones. Nevertheless, fluorescence levels of the transfectants appeared higher
compared to the autofluorescence shown by parental 449 and tbat1-/- lines (no images were
acquired, since fast cell movement hampered the exposure to the camera for prolonged times).
Due to this low fluorescence of the clones, long times of exposure were necessary in order
to acquire images and, therefore, cells needed to be fixed. Various fixatives were tested.
Immersion in MeOH overnight did not give clear samples for microscopy and the use of
2.5% glutaraldehyde was found responsible to induce a high autofluorescence in both
clones and parental lines upon DsRed filter excitation (see Sections 2.5.2.3 and 2.5.2.4 for
fixation procedures). The induction of autofluorescence by glutaraldehyde is a problem
known in the literature and, apparently, is due to formation of cross-links of the fixative
with the ε-amino groups of lysine residues on proteins (Collins and Goldsmith, 1981;
Choromanski, 1984). The fact that glutaraldehyde had been successfully used in our
laboratory for fixation of T. b. gambiense cells (stib 386 and Eliane) for fluorescence

Federica Giordani, 2010 Chapter 6, 173
microscopy studies (Paul Capewell, University of Glasgow, personal communication)
could be due to their different composition in the external protein coat compared to the
427-derived strains used here (for example, different VSGs might be expressed). For our
experiments, fixation in 3% formaldehyde (Section 2.5.2.5) provided the best samples for
microscopy, without inducing cell autofluorescence, and was, therefore, used to fix the
clones and parental lines under study for image acquisition. Fixed trypanosomes were
viewed immediately or the day after fixation, since a deterioration of the samples was
observed within a week after their preparation.
Images acquired using long exposure times for the camera (1.8 s) allowed capture of the
low fluorescence from trypanosomes (Figure 6.11). All transfectants examined had a
relative higher emission compared to their parental lines, for which only a very low
autofluorescence could be detected. Quantitative measurement of the percentage of
fluorescence intensity for one of the clones analysed (449 Cl.4 N-t) revealed that its
emission was just double the autofluorescence of the 449 line (Figure 6.12). However, it is
also noteworthy that the threshold used for quantification of cells fluorescence had to be
changed for the parental 449 line in order to exclude its high background. Due to the even
lower emission of tbat1-/--derived clones, it was not possible to obtain fluorescence
measurements for these lines.
Comparison of the fluorescence micrographs of transfectants and their parental lines
(Figure 6.11) showed that, in general, tbat1-/--derived clones had a lower fluorescence than
449-derived cells and clones expressing the C-t construct yielded a lower emission than the
corresponding parasites transfected with the N-t vector. Nevertheless, each transfectant line
had internal variability and fluorescence levels varied among cells from the same clone.
The difference in fluorescence emission of the various transfectants compared to their
parental lines suggested expression of the fluorescent mCherry protein, albeit at very low
levels. Moreover, each clone’s fluorescence appeared to be associated with the plasma
membrane, as expected for the transmembrane transporter protein P2. The signal showed a
patchy distribution throughout the whole cell body, but was not present in the flagellum.
The clones transfected with the C-t construct (derived from both 449 and tbat1-/- lines)
often demonstrated one (or more) large and bright fluorescent spot(s), in a region between
the nucleus and the flagellar pocket. Since the endomembrane system is located in this area
of the cell (Field et al., 2007), it could be possible that these fluorescent dots identified
with mature or intermediate forms of the fusion protein accumulated inside vesicles, before
their transport to the plasma membrane. The P2 transporter might, then, be redistributed to

Federica Giordani, 2010 Chapter 6, 174
Figure 6.11 – Fluorescence images of four in vitro -grown clones expressing the P2 transporter fused with the mCherry fluorescent prot ein. Strain 449-derived clones were induced with 1 µµµµg/ml tetracycline 48 h before microscopy examination. After fixation in formaldehyde all cel ls were excited under the DsRed filter of the Zeiss Axioplan microscope. Parental cell lines (449 and tbat1 -/-) were processed as their derived clones in order to compare their autofluore scence level. Acquired fluorescent images (centre) were deconvolved (right) using the iterative restoration program of Volocity Imaging software (Improvision). Bright field images counterstained with DAPI, to identify the position of the nucleus and the kinetoplast, are sh own on the left. DsRed 1.8 s exposure; 100× objective. Bar: 10 µµµµm.

Federica Giordani, 2010 Chapter 6, 175
0
100
200
300
400
500
600
700
800
900
449 449 Cl.4 N-t
% In
tens
ity
Figure 6.12 – Percentage of fluorescence intensity measured for clone 449 Cl.4 N-t. Emission of the clone is compared to the autofluore scence measured for its parental 449 line under the same experimental conditions. Sample s of both cell lines were fixed in formaldehyde. Clone 449 Cl.4 N-t was incubated with 1 µµµµg/ml tetracycline, 48 h before microscopy, to induce expression of the fusion prot ein mCherry:: TbAT1. Fluorescence intensity of 100 cells for each line was measured u sing the Volocity software quantitation package (Improvision) upon DsRed filter excitation of the Zeiss Axioplan microscope.
the cell surface from these cytosolic stocks, following specific external stimuli, a
phenomenon already observed for other protozoan membrane proteins such as the proteins
associated with differentiation of T. brucei (Dean et al., 2009) and the polyamine
transporter TcPOT1.1 of T. cruzi (Hasne et al., 2010). Nevertheless, the fact that this
pattern was much less frequent inside N-t clones supported the hypothesis that the C-t
tagging of the P2 transporter interfered with its distribution to the targeted cell membrane,
leading to the accumulation of the fusion protein inside an intermediate vesicle.
6.2.6.2 Fluorescence of clones grown in vivo
The low fluorescence of in vitro transfectants could have been caused by unsuccessful
transcription of the constructs containing the fused TbAT1-mCherry sequence.
Trypanosomes, however, are known to regulate gene expression mainly at the post-
transcriptional level, rather than by modulating transcriptional activity (Berberof et al.,
1995). Other downstream regulatory mechanisms (such as mRNA stability or protein
folding and distribution), could have contributed to the low levels of fluorescence. Various
uptake assays carried out in our laboratory demonstrated a significant down-regulation of
the P2 transporter activity in in vitro cells compared to parasites grown in rodents (Section
6.1.2). Therefore, the fluorescence of in vivo-grown transfectants was studied, in order to
exclude possible endogenous down-regulation mechanisms interfering with our construct
expression.

Federica Giordani, 2010 Chapter 6, 176
Figure 6.13 – Fluorescence images of two C-t clones expressing the TbAT1::mCherry fusion protein and grown in mice. Water containing doxycycline (200 µµµµg/ml) in a 5% sucrose solution was given to mice infected with 449-derived clone in order to induce the transcription of the transfected C-t construct (Wirtz et al ., 1998). Tail prick samples were obtained 3 days p ost-infection, while the blood smears were prepared 4 days post-infectio n (Section 2.3 for procedures). All samples were viewed under the DsRed filter of the Z eiss Axioplan microscope. DsRed 1.0 s exposure; 100× objective. Bar: 10 µµµµm.
Two clones transfected with the C-t construct (449 Cl.7 C-t and tbat1-/- Cl.9 C-t) were
injected into ICR mice by Dr. P.E. Wong. To induce the expression of the system in the
449-derived clone, 200 µg/ml doxycycline (a water soluble form of tetracycline) were
added to the drinking water of the mouse infected with this transfectant line (Wirtz et al.,
1998; Krieger et al., 2000). Both clones were able to infect mice, but while the tbat1-/--
derived line reached a very high parasitaemia four days post-infection, the 449-derived
clone remained at a low concentration. Fluorescence intensity of parasites in blood samples
(Figure 6.13) was, however, very similar to their fluorescence observed in in vitro-grown
trypanosomes (Figure 6.11). The tbat1-/-- derived clone, especially, had an extremely faint
emission, which hampered image acquisition. In the 449 Cl.7 C-t line, the fluorescent dot
already observed in formaldehyde-fixed cells, was clearly visible in the posterior part of
the cell. The low levels of fluorescence obtained for both in vitro and in vivo transfectants
indicated that they could be more likely ascribed to the chosen expression system rather
than to other parasitic regulatory mechanisms.

Federica Giordani, 2010 Chapter 6, 177
6.3 Discussion
The main aim of this molecular biology project was to tag the P2 amino-purine transporter
with a fluorescent protein, in order to localise it inside trypanosomes by fluorescence
microscopy. Two tetracycline-inducible constructs were built by linking the red fluorescent
protein mCherry either at the N-terminus or C-terminus of the TbAT1 gene, which encodes
the transporter. Constructs were transfected into bloodstream form 449 (a transgenic line
expressing the tetracycline repressor) (Biebinger et al., 1997) and into the tbat1-/- line,
which lacks both alleles of the TbAT1 gene (Matovu et al., 2003) and in which we
expected to have a constitutive expression of the constructs. Unfortunately, microscopy
experiments showed very low fluorescence intensity yields for all of the transfectant lines,
thus making them unsuitable for more thorough localisation studies.
The lack of bright fluorescence emission of the mCherry protein could be ascribed to
various factors. First of all, the change of the amino acid at position 22 (His22→Asn) of the
mCherry protein for C-t tagging (Figure 6.2) could have altered the phenotype of the
mature protein, since this residue was one of the mutations introduced during its generation
(Shaner et al., 2004). This hypothesis, though, was not supported by fluorescence
microscopy (Figure 6.11), which showed equally low levels of emission for the C-t and the
N-t construct (which did not have this mutation). Despite being indicated as another critical
residue (Shaner et al., 2004), the other amino acid change at position 8 (Asp8→Asn) of
both N-t and C-t mCherry products, was not expected to affect the phenotype of the mature
fluorescent protein, since this particular mutation was also present in the sequence of other
mCherry proteins successfully used to build fusion constructs (Elmarie Myburgh,
University of Glasgow, personal communication).
Another possible explanation for our result could be the use of an unsuitable expression
system. Vector pHD676 was chosen in order to control the transcription of the fused
TbAT1-mCherry protein, avoiding the problems of mislocalisation and assembly into non-
physiological complexes often encountered with over-expressed tagged proteins (Shen et
al., 2001; Shahi et al., 2002). The use of this vector, however, could have been responsible
for low levels of fused protein, affecting the overall fluorescence signal. The PARP
promoter, which drives the expression of the exogenous constructs in pHD676, is known to
be down-regulated in bloodstream forms once integrated within the rRNA spacer or in
other genomic sites, and this could have contributed to low expression (Biebinger et al.,
1996). Nevertheless, in trypanosomes gene expression is mostly regulated at the post-
Federica Giordani, 2010 Chapter 6, 178
transcriptional level, rather than by modulation of transcription (Berberof et al., 1995). The
choice of another vector containing different untranslated regulatory regions (UTR)
encoding for trans-splicing and polyadenylation signals (such as VSG 3’UTR), could have
a significant impact on the levels and stability of the transcribed mRNA and therefore, on
the overall expression of the exogenous genes. Instability of the two fused proteins could
be another possible cause for the low fluorescence shown by our clones. The presence of
the tagged P2 transporter could have prevented correct folding of the mCherry protein to
its mature form, disrupting its fluorescent properties.
Despite unsatisfactory fluorescence intensity emission shown by the clones, various data
indicated that the phenotype of transfectants differed from that of the parental lines. The
additional copy(ies) of the TbAT1 gene introduced by transfection appeared to be actively
expressed, as shown by the Alamar Blue data (Table 6.1). Hence, it was reasonable to
expect that the whole construct (mCherry::TbAT1 or TbAT1::mCherry) was correctly
transcribed and translated, although the precise targeted genomic region remained unclear
for the clones analysed (Section 6.2.3). However, we could not detect the mCherry protein
inside cell lysates (Figure 6.9), indicating that the protein was not produced or that its
levels inside parasites were under detection limits of the Western analysis performed. The
fused mCherry protein yielded very low fluorescence emission, but direct comparison by
fluorescence microscopy with the parental lines revealed, for all of the clones, a higher
signal than the autofluorescence of cell lines 449 and tbat1-/- (Figure 6.11). The emission
observed in fixed transfectants, moreover, showed a staining pattern at the cell periphery,
consistent with a membrane distribution. If this signal was indeed derived from the
mCherry-tagged transporter, we can conclude that the P2 carrier localises all along the
trypanosome cell body, in a patchy pattern, and it is not present in the flagellum of the
cells. In various clones (especially transfectants containing the C-t construct) one, or more,
large, fluorescent spots were detected in the posterior part of the cell, in an area between
nucleus and kinetoplast. These fluorescent dots could correspond to immature forms of the
protein contained inside cell compartments, such as vesicles of the Golgi apparatus or the
endoplasmic reticulum; alternatively, they could represent unprocessed proteins not
correctly expressed. Another option would be that these spots represent stocks of the
mature form of the P2 transporter, accumulated inside vesicles, ready to be redistributed to
the cell surface, in response to changes in the parasite’s external environment. This
mechanism had already been observed for other parasitic membrane proteins, whose
distribution was found to shift from an area corresponding to (or adjacent to) the flagellar
pocket, to the cell surface, as a result of thermal (Dean et al., 2009) or metabolic (Hasne et

Federica Giordani, 2010 Chapter 6, 179
al., 2010) stimuli. The presence of sequestered stocks of P2 in the clones analysed during
this work would be in agreement with the fact that these cells were in vitro-grown
parasites, which, as mentioned above (Section 6.1.2), show a relatively low P2 activity.
Nevertheless, three observations contrasted with this model: (1) the spots evidenced by
fluorescence microscopy were mainly observed in parasites transfected with the C-t
construct, suggesting a defective expression of this vector (for example, an eventual signal
associated to the C-terminus of TbAT1 and directing the transporter to the membrane could
have been disturbed by the tag protein); (2) the fluorescent inclusions appeared not only in
in vitro parasites but also in in vivo cells, in which the P2 transporter is expected to be
highly expressed on the cell surface; (3) the spots appeared generally closer to the nucleus
than to the flagellar pocket, therefore strengthening the hypothesis of an immature form of
the protein stuck in some early vesicle of the endosomal system. A series of studies carried
out on Leishmania species demonstrated that these parasitic protozoa cope with purine
starvation by upregulating nucleoside transporter proteins at a post-transcriptional level,
primarily by enhancing translation, without modifying protein turnover (Carter et al., 2010;
Ortiz et al., 2010). A similar control mechanism of expression can not be ruled out for the
P2 transporter of T. brucei, but further study will be required to verify this hypothesis.
The fluorescent tagging approach used during this project to build a fluorescent P2 amino-
purine transporter, has left a series of questions, making it difficult to draw solid
conclusions. It would be interesting to study the expression of the TbAT1-mCherry fused
protein in a different over-expression vector, to try and enhance levels of expression, or to
tag the transporter with a different fluorescent protein (such as the Green Fluorescent
Protein) to rule out possible problems related to the specific tagging gene. Different
approaches for protein detection could also be pursued. Previous work carried out in our
laboratory already attempted, unsuccessfully, to generate and express a fusion construct
containing a Myc-tagged TbAT1 sequence (Bridges, 2006). A more interesting approach
would be to epitope-tag the TbAT1 gene at its endogenous chromosomal locus, in order to
mimic more closely its expression regulation under physiological conditions (Shen et al.,
2001).

7
General discussion

Federica Giordani, 2010 Chapter 7, 181
Accurate and early diagnosis of human African trypanosomiasis is paramount both for
interrupting the progression of this deadly disease in the patient and for stopping the
transmission cycle of the parasite. Nevertheless, the diagnostic tools available for use in
HAT endemic countries remain inaccurate and inadequate, leading to misdiagnosis and
under-detection. Despite the enormous progress made by the academic world in the field of
molecular parasitology, this knowledge has only had a minor impact on the work of health
personnel in rural areas of Africa (Brun and Balmer, 2006). Nowadays, the identification
of T. b. gambiense infected individuals still relies on the activity of mobile teams, whose
equipment consists in a thirty-year-old serological test (the CATT test), used to rapidly
screen the population at risk, and on basic light microscopes, used to confirm the infection
(Chappuis et al., 2005). The urgent need for better diagnostics which are cheap and robust,
but also rapid and user-friendly is hindered both at the development stage, due to the
perspective of low return on investment for commercial companies, but also during the
phase of field application, because of the lack of resources and of trained personnel, the
underdeveloped health care system and the remoteness of many endemic foci. The recent
institution of public-private partnerships (above all the Foundation for Innovative New
Diagnostics, FIND) aims at the identification and implementation of diagnostics for
neglected diseases and is hopefully destined to change this state of affairs (Steverding,
2006).
Parasitological examination represents the weak point in the T. b. gambiense HAT
diagnostic algorithm (Lutumba et al., 2005). Conventional light microscopy techniques are
insensitive, time-consuming and inadequate for use in screening programmes. A series of
new, highly sensitive and specific molecular diagnostic approaches are currently under
study and, in the future, might replace the inefficient methods utilised today (Radwanska,
2010). Although the introduction in the field of relatively sophisticated technologies (in
particular PCR techniques) has been slow, their evolution into practical solutions offers
concrete potential. The loop-mediated isotermal amplification (LAMP) reaction (Njiru et
al., 2008b) and the lateral flow test (dipstick) (Deborggraeve et al., 2006) are two
examples of these attempts to simplify diagnostics.
The introduction of fluorescence technologies in HAT endemic countries is another option
to improve the efficiency of the parasitological confirmation step. The advantages offered
by fluorescence microscopy over conventional light microscopy in terms of increased
sensitivity and gain in reading time have been reported in many studies on other tropical
infectious diseases (Keiser et al., 2002; Steingart et al., 2006) and have been confirmed in

Federica Giordani, 2010 Chapter 7, 182
fields trials (Torrea et al., 2008). The use of fluorescence for diagnosis of trypanosomiasis
is not new, as it has already been applied in the sensitive, but expensive, quantitative buffy
coat assay (Bailey and Smith, 1992). The real innovation is represented by the
development of new LED light sources suitable for fluorescence imaging, which allow the
design of instruments that are more compact, energetically efficient and cheaper than
conventional ones (Jones et al., 2005 and 2007). All of these characteristics make LED-
illuminated instruments ideal for use by mobile teams, and not exclusively of reference
health centres.
A preliminary evaluation of diverse fluorophores and staining protocols to use with LED
fluorescence microscopes for trypanosomiasis diagnosis was the main aim of this project.
Fluorescent staining of parasites with acridine orange proved to be a very straightforward
and fast procedure for labelling trypanosomes in both fresh and fixed specimens. The
emission of this fluorophore could be easily detected using the SMR LED microscope
manifactured by Cytoscience, making their use immediately available for field testing.
Also the diamidine DB75 appeared to be a very interesting probe for trypanosome
diagnosis. Its utilisation as a vital dye or to stain fixed specimens proved particularly
effective in blood samples and its excitation under a UV LED light source was excellent.
Of note, the procedures followed for preparation of fluorescent specimens were extremely
easy to perform and did not require specialist skills. Furthermore, the LED microsocopes
used during this project proved to be user-friendly and efficient. Future work will have to
validate the use of LED fluorescence microscopy on human samples and under field
conditions, where researchers will have to pay particular attention on how to preserve
reagent stability and how to create a dark/dim environment in which to perform
microscopy (in case of outdoor use).
The exploitation of surface transporters peculiar to trypanosomes appeared an useful and
straightforward way to specifically target fluorophores to these parasites and improved
compounds may be developed following this approach. In the future, then, the synthesis of
more efficient and specific fluorescent molecular markers for trypanosomes may allow not
just parasite detection, but also speciation (Radwanska et al., 2002c). Moreover, the use of
fluorescent probes could be extremely useful for other aspects of disease management, as
demonstrated by the arsenical drug resistance test developed in our laboratory (Stewart et
al., 2005). Finally, the potential positive impact that fluorescence microscopy applications
could have in the management of African animal trypanosomiasis, for which the diagnostic
problems are very similar to those encountered for HAT, should not be underestimated.

Federica Giordani, 2010 Chapter 7, 183
Although the introduction of fluorescence microscopy in the field would bring significant
advantages, potentially reducing the workload of microscopists and making HAT diagnosis
more reliable, it will not be sufficient to detect all cases. This technique will not increase
the theoretical detection limit of conventional light microscopy (Radwanska, 2010) and,
due to the low parasite loads typical of this disease, a sample concentration step will still
be required. Efforts have already been made to improve the format and the efficacy of the
most sensitive concentration technique available, the mAECT (Büscher et al., 2009;
Camara et al., 2010). In the future, microfluidics technologies might help in the separation
and concentration of parasites from blood (Huang et al., 2004), making this procedure
faster and more efficient.
The crucial importance of the parasitological examination step originates from the
necessity to confirm the result of serological tests (mainly the CATT test), which are ideal
for mass screening, but not specific or sensitive enough to allow decisions for treatment
(Chappuis et al., 2005). Various laboratories are, today, very active in the search for new
serodiagnostic markers for HAT, with the aim of designing a more specific alternative to
the CATT test, but an antigen detection test for trypanosomes, despite being highly
advocated, has not been developed yet (Radwanska, 2010). Recent advances in genomics,
proteomics and metabolomics may enable the identification of new trypanosome markers
to exploit in serodiagnosis. Another very interesting application of these last two
technologies is their use in the identification of specific host fingerprints, to utilise as
indicators of disease (Agranoff et al., 2005; Wang et al., 2008). Surrogate biomarkers of
infection are also under evaluation for trypanosomiasis staging, a very problematic step in
HAT diagnosis, for which the only specific diagnostic test is currently represented by the
detection of trypanosomes in the CSF (Lejon and Büscher, 2005). The design of a non-
invasive serological test, that does not require a dangerous and painful lumbar puncture to
stage the disease, would be a great improvement in HAT field diagnostics (Lejon et al.,
2006). Moreover, this increasing number of informations will hopefully bring to the
development of a serological test for T. b. rhodesiense, which is still lacking.
During the last decade a coordinated and efficacious use of the, although limited, tools
available (both diagnostic and therapeutic) has determined a decline in the number of HAT
cases (Barrett, 2006). The introduction of new diagnostics and the amelioration of the tests
already in use would certainly accelerate this process. The validation of better tools will
also provide HAT health personnel of adequate instruments to face future challenges. In
particular, the perspective of a decrease of HAT prevalence will require the use of always

Federica Giordani, 2010 Chapter 7, 184
more specific assays, while the foreseen overlap of T. b. gambiense and T. b. rhodesiense
infections in Uganda will require tests able to differentiate between the two subspecies, in
order to decide for appropriate treatment regimen. Together with significant improvements
in patient management and disease control, availability of better diagnostics will also have
positive effects on other aspects of HAT research and surveillance, such as patients
recruitment for drug trials, epidemiological studies, evaluation of interventions and
monitoring of drug resistance onset. Finally, simplification of diagnostic tests and
procedures might help to move from expensive, active case-finding programs, carried out
by specialised teams, towards a more incisive participation of the local health care system,
improving the overall sustainability of HAT intervention policies (Checchi et al., 2006).

Appendices, 185
Appendices
Appendix A: HMI-9 medium (pH 7.4)
Components (mg/L)
Salts, etc CaCl2 165 KCl 330
KNO3 0.076
MgSO4 98 NaCl 4,500
NaHCO3 3,020
NaH2PO4·H2O 125
Na2SeO3·5 H2O 0.017 Glucose 4,500 Phenol Red 15 HEPES 5,960 Bathocuproine sulfonate 28 Mercaptoethanol 15 L-amino acids Alanine 25 Arginine·HCl 84 Asparagine 25 Aspartic acid 30 Cysteine 182 Cystine 91 Glutamic acid 75 Glutamine 584 Glycine 30 Histidine·HCl·H2O 42 Isoleucine 105 Leucine 105 Lysine·HCl 146 Methionine 30 Phenylalanine 66 Proline 40 Serine 42 Threonine 95 Tryptophan 16 Tyrosine 104 Valine 94 Vitamins, etc B12 0.013 Biotin 0.013 D-Ca pantothenate 4 Choline chloride 4 Folic Acid 4 i-Inositol 7.2 Nicotinamide 4 Pyridoxal·HCl 4 Riboflavin 0.4 Thiamine·HCl 4 Organic acids Pyruvate·Na 114 Purines, etc Hypoxanthine 136 Thymidine (deoxy) 39 Lipids & serum Serum 10%

Appendices, 186
Appendix B: general buffers and solutions
CBSS buffer (pH 7.4)
Hepes 25 mM NaCl 120 mM KCl 5.4 mM CaCl2 0.6 mM MgSO4·7 H2O 0.4 mM Na2HPO4 5.6 mM D-glucose 11.1 mM
LB medium -Luria Bertani broth- (pH 7)
LB powder (Sigma-Aldrich) 25 g dH2O 1 L
LB agar
Luria Agar (Sigma-Aldrich) 35 g dH2O 1 L
PBS
NaCl 137 mM KCl 2.7 mM Na2HPO4 10 mM KH2PO4 2 mM
Phosphate buffer for Giemsa stain (pH 7.2)
Na2HPO4 20 mM KH2PO4 4.4 mM
PSG buffer (pH 8)
Na2HPO4 56.9 mM NaH2PO4 3.9 mM NaCl 43.5 mM Glucose 60 mM
TAE buffer (50×) (pH 8.5)
Tris-acetate 2 M EDTA (pH 8.0) 50 mM
TE buffer
Tris-HCl (pH 8) 10 mM EDTA (pH 8) 1 mM

Appendices, 187
Appendix C: buffers and solutions for Southern blot
Denaturation solution
NaCl 1.5 M NaOH 0.5 M
Denhardt’s reagent (50×)
Ficoll 400 (w/v) 1% Polyvinylpyrrolidone (w/v) 1% Bovine serum albumin (w/v) 1%
Depurination solution
HCl 0.25 M
Lysis buffer for gDNA extraction
Tris-HCl (pH 8) 10 mM EDTA 100 mM N-Lauroylsarcosine (w/v) 1% Proteinase K (added fresh) 100 µg
Neutralising solution
Tris-HCl (pH 7.4) 1 M NaCl 1.5 M
Prehybridisation/hybridisation solution
Formamide (v/v) 50% SSC 5× Denhardt’s reagent 10× SDS (w/v) 0.1% NaH2PO4 (pH 6.5) 20 mM EDTA (pH 8) 5 mM Herring sperm DNA (Promega) 200 µg/ml
SSC (20×) (pH 7)
NaCl 3 M Tri-sodium citrate 0.3 M
Washing solution for membrane stripping
SSC 0.1× SDS (w/v) 0.1% Tris-HCl (pH 7.6) 0.2 M

Appendices, 188
Appendix D: buffers and solutions for protein extraction, SDS-
PAGE and Western blot
Coomassie Brilliant Blue stain
Coomassie Brilliant Blue (w/v) 0.1% Methanol (v/v) 45% Glacial acetic acid (v/v) 10%
Laemmli buffer (2×)
Tris-HCl (pH 6.8) 0.125 M Glycerol (v/v) 20% SDS (w/v) 4% β-mercaptoethanol (v/v) 10% Bromophenol blue (w/v) 0.003%
Running buffer (5×)
Tris-Base (pH 8.3) 0.125 M Glycine 0.96 M SDS (w/v) 0.5%
Running gel (10%)
Tris-HCl (pH 8.8) 0.38 M SDS (w/v) 0.1% Acryl/bis 30% (Amresco) (v/v) 10% Ammonium persulfate (w/v) 0.05% TEMED (v/v) 0.1%
Stacking gel (3%)
Tris-HCl (pH 6.8) 0.25 M SDS (w/v) 0.1% Acryl/bis 30% (Amresco) (v/v) 3% Ammonium persulfate (w/v) 0.05% TEMED (v/v) 0.1%
STEN buffer
Sucrose 250 mM Tris-HCl (pH 7.5) 25 mM EDTA 1 mM NaCl 150 mM
Transfer buffer
Tris-base (pH 8.3) 25 mM Glycine 0.7 M

References, 189
References
Abel P.M., Kiala G., Lôa V., Behrend M., Musolf J., Fleishmann H., Théophile J., Krishna S. and Stich A. (2004). Retaking sleeping sickness control in Angola. Trop. Med. Int. Health 9 (1):141-148.
Adeoye G.O. and Nga I.C. (2007). Comparison of quantitative buffy coat technique (QBC) with Giemsa-stained thick film (GTF) for diagnosis of malaria. Parasitol. Int. 56 (4):308-312.
Afewerk Y., Clausen P.H., Abebe G., Tilahun G. and Mehlitz D. (2000). Multiple-drug resistant Trypanosoma congolense populations in village cattle of Metekel district, north-west Ethiopia. Acta Trop.76 (3):231-238.
Agbe A. and Yielding K.L. (1995). Kinetoplasts play an important role in the drug responses of Trypanosoma brucei. J. Parasitol. 81 (6):968-973.
Agranoff D., Stich A., Abel P. and Krishna S. (2005). Proteomic fingerprinting for the diagnosis of human African trypanosomiasis. Trends Parasitol. 21 (4):154-157.
Akobeng A.K. (2007). Understanding diagnostic tests 1: sensitivity, specificity and predictive values. Acta Paediatr. 96 (3):338-341.
Alibu V.P., Richter C., Voncken F., Marti G., Shahi S., Renggli C.K., Seebeck T., Brun R. and Clayton C. (2006). The role of Trypanosoma brucei MRPA in melarsoprol susceptibility. Mol. Biochem. Parasitol. 146 (1):38-44.
Altman D.G. and Bland J.M. (1994a). Diagnostic tests 1: sensitivity and specificity. BMJ 308 (6943):1552.
Altman D.G. and Bland J.M. (1994b). Diagnostic tests 2: predictive values. BMJ 309 (6947):102.
Anonymous (2007). Neglected diagnostics. Nat. Methods 4 (11):877-878.
Anthony R.M., Kolk A.H.J., Kuijper S. and Klatser P.R. (2006). Light emitting diodes for auramine O fluorescence microscopic screening of Mycobacterium tuberculosis. Int. J. Tuberc. Lung Dis. 10 (9):1060-1062.
Azema L., Claustre S., Alric I., Blonski C., Willson M., Perie J., Baltz T., Tetaud E., Bringaud F., Cottem D., Opperdoes F.R. and Barrett M.P. (2004). Interaction of substituted hexose analogues with the Trypanosoma brucei hexose transporter. Biochem. Pharmacol. 67 (3):459-467.
Bailey J.W. and Smith D.H. (1992). The use of the acridine orange QBC® technique in the diagnosis of African trypanosomiasis. Trans. R. Soc. Trop. Med. Hyg. 86 (6):630.
Baird J.K., Purnomo and Jones T.R. (1992). Diagnosis of malaria in the field by fluorescence microscopy of QBC® capillary tubes. Trans. R. Soc. Trop. Med. Hyg. 86 (1):3-5.
Balasegaram M., Young H., Chappuis F., Priotto G., Raguenaud M.E., Checchi F. (2009). Effectiveness of melarsoprol and eflornithine as first-line regimens for gambiense sleeping sickness in nine Médecins Sans Frontières programmes. Trans. R. Soc. Trop. Med. Hyg. 103 (3):280-290.
Baliani A., Bueno G.J., Stewart M.L., Yardley V., Brun R., Barrett M.P and Gilbert I.H. (2005). Design and synthesis of a series of melamine-based nitroheterocycles with activity against trypanosomatid parasites. J. Med. Chem. 48 (17):5570-5579.

References, 190
Banerjee D. and Pal S.K. (2008). Dynamics in the DNA recognition by DAPI: exploration of the various binding modes. J. Phys. Chem. B. 112 (3):1016-1021.
Bank H.L. (1988). Rapid assessment of islet viability with acridine orange and propidium iodide. In Vitro Cell. Dev. Biol. 24 (4):266-273.
Banoo S., Bell D., Bossuyt P., Herring A., Mabey D., Poole F., Smith P.G., Sriram N., Wongsrichanalai C., Linke R., O’Brien R., Perkins M., Cunningham J., Matsoso P., Nathanson C.M., Olliaro P., Peeling R.W. and Ramsay A., TDR Diagnostics Evaluation Expert Panel (2007). Evaluation of diagnostic tests for infectious diseases: general principles. Nat. Rev. Microbiol. 5 (Supp. 11):S17-29.
Barrett M.P. (2006). The rise and fall of sleeping sickness. Lancet 367 (9520):1377-1378.
Barrett M.P. and Fairlamb. A.H. (1999). The biochemical basis of arsenical-diamidine crossresistance in African trypanosomes. Parasitol. Today 15 (4):136-140.
Barrett M.P. and Gilbert I.H. (2006). Targeting of toxic compounds to the trypanosome's interior. Adv. Parasitol. 63:125-183.
Barrett M.P., Boykin D.W., Brun R. and Tidwell R.R. (2007). Human African trypanosomiasis: pharmacological re-engagement with a neglected disease. Br. J. Pharmacol. 152 (8):1155-1171.
Barrett M.P., Burchmore R.J.S., Stich A., Lazzari J.O., Frasch A.C., Cazzulo J.J., Krishna S. (2003). The trypanosomiases. Lancet 362 (9394):1469-1480.
Becker S., Franco J.R., Simarro P.P., Stich A., Abel P.M. and Steverding D. (2004). Real-time PCR for detection of Trypanosoma brucei in human blood samples. Diagn. Microbiol. Infect. Dis. 50 (3):193-199.
Bengaly Z., Kasbari M., Desquesnes M. and Sidibé I. (2001). Validation of a polymerase chain reaction assay for monitoring the therapeutic efficacy of diminazene aceturate in trypanosome-infected sheep. Vet. Parasitol. 96 (2):101-113.
Berberof M., Pérez-Morga D. and Pays E. (2001). A receptor-like flagellar pocket glycoprotein specific to Trypanosoma brucei gambiense. Mol. Biochem. Parasitol. 113 (1):127-138.
Berberof M., Vanhamme L., Tebabi P., Pays A., Jefferies D., Welburn S. and Pays E. (1995). The 3'-terminal region of the mRNAs for VSG and procyclin can confer stage specificity to gene-expression in Trypanosoma brucei. EMBO J. 14 (12):2925-2934.
Bergeron R.J., Ludin C., Muller R., Smith R.E. and Phanstiel O. (1997). Development of a hypusine reagent for peptide synthesis. J. Org. Chem. 62 (10):3285-3290.
Berriman M., Ghedin E., Hertz-Fowler C., Blandin G., Renauld H., Bartholomeu D.C., Lennard N.J., Caler E., Hamlin N.E., Haas B., Böhme W., Hannick L., Aslett M.A., Shallom J., Marcello L., Hou L.H., Wickstead B., Alsmark U.C.M., Arrowsmith C., Atkin R.J., Barron A.J., Bringaud F., Brooks K., Carrington M., Cherevach I., Chillingworth T.J., Churcher C., Clark L.N., Corton C.H., Cronin A., Davies R.M., Doggett J., Djikeng A., Feldblyum T., Field M.C., Fraser A., Goodhead I., Hance Z., Harper D., Harris B.R., Hauser H., Hostetler J., Ivens A., Jagels K., Johnson D., Johnson J., Jones K., Kerhornou A.X., Koo H., Larke N., Landfear S., Larkin C., Leech V., Line A., Lord A., MacLeod A., Mooney P.J., Moule S., Martin D.M.A., Morgan G.W., Mungall K., Norbertczak H., Ormond D., Pai G., Peacock C.S., Peterson J., Quail M.A., Rabbinowitsch E., Rajandream, M.A., Reitter C., Salzberg S.L., Sanders M., Schobel S., Sharp S., Simmonds M., Simpson A.J., Tallon L., Turner C.M.R., Tait A., Tivey A.R., Van Aken S., Walker D., Wanless D., Wang S.L., White B., White O., Whitehead S., Woodward J., Wortman J., Adams M.D., Embley T.M., Gull K., Ullu E.,

References, 191
Barry J.D., Fairlamb A.H., Opperdoes F., Barrell B.G., Donelson J.E., Hall N., Fraser C.M., Melville S.E. and El Sayed N.M. (2005). The genome of the African trypanosome Trypanosoma brucei. Science 309 (5733):416–422.
Biebinger S., Rettenmaier S., Flaspohler J., Hartmann C., Peña-Diaz J., Wirtz L.E., Hotz H.R., Barry J.D. and Clayton C. (1996). The PARP promoter of Trypanosoma brucei is developmentally regulated in a chromosomal context. Nucleic Acids Res. 24 (7):1202-1211.
Biebinger S., Wirtz L.E., Lorenz P. and Clayton C. (1997). Vectors for inducible expression of toxic gene products in bloodstream and procyclic Trypanosoma brucei. Mol. Biochem. Parasitol. 85 (1):99-112.
Bisser S., Lejon V., Preux P.M., Bouteille B., Stanghellini A., Jauberteau M.O., Büscher P. and Dumas M. (2002). Blood-cerebrospinal fluid barrier and intrathecal immunoglobulins compared to field diagnosis of central nervous system involvement in sleeping sickness. J. Neurol. Sci. 193 (2):127-135.
Bisser S., N'Siesi F.X., Lejon V., Preux P.M., Van Nieuwenhove S., Bilenge C.M.M. and Buscher P. (2007). Equivalence trial of melarsoprol and nifurtimox monotherapy and combination therapy for the treatment of second-stage Trypanosoma brucei gambiense sleeping sickness. J. Infect. Dis. 195 (3):322-329.
Bitonti A.J., McCann P.P. and Sjoerdsma A. (1986). Necessity of antibody response in the treatment of African trypanosomiasis with α-Difluoromethylornithine. Biochem. Pharmacol. 35 (2):331-334.
Blum J.A., Zellweger M.J., Burri C. and Hatz C. (2008). Cardiac involvement in African and American trypanosomiasis. Lancet Infect. Dis. 8 (10):631-641.
Boibessot I., Turner C.M.R., Watson D.G., Goldie E., Connel G., McIntosh A., Grant M.H. and Skellern G.G. (2002). Metabolism and distribution of phenanthridine trypanocides in Trypanosoma brucei. Acta Trop. 84 (3):219-228.
Borowy N. K., Fink E. and Hirumi H. (1985). In vitro activity of the trypanocidal diamidine DAPI on animal-infective Trypanosoma brucei brucei. Acta Trop. 42 (4):287-298.
Borst P. and Ouellette M. (1995). New mechanisms of drug resistance in parasitic protozoa. Annu. Rev. Microbiol. 49:427-60.
Bouteille B., Mpandzou G., Cespuglio R., Ngampo S., Peeling R.W., Vincendau P. and Buguet A. (2009). Cerebrospinal fluid B lymphocyte identification for diagnosis and follow-up in human African trypanosomiasis in the field. Trop. Med Int. Health 14 (12):1-8.
Boykin D.W. (2002). Antimicrobial activity of the DNA minor groove binders furamidine and analogs. J. Braz. Chem. Soc. 13 (6):736-771.
Brickman M.J., Cook J.M. and Balber A.E. (1995). Low temperature reversibly inhibits transport from tubular endosomes to a perinuclear, acidic compartment in African trypanosomes. J. Cell Sci. 108 (Pt 11):3611-3621.
Bridges D. (2006). Mechanisms of drug resistance in T. brucei; beyond the P2 transporter... PhD Thesis, University of Glasgow.
Bridges D.J., Gould M.K., Nerima B., Maser P., Burchmore R.J.S. and de Koning H.P. (2007). Loss of the high-affinity pentamidine transporter is responsible for high levels of cross-resistance between arsenical and diamidine drugs in African trypanosomes. Mol. Pharmacol. 71 (4):1098-1108.

References, 192
Bromidge T., Gibson W., Hudson K. and Dukes P. (1993). Identification of Trypanosoma brucei gambiense by PCR amplification of variant surface glycoprotein genes. Acta Trop. 53 (2):107-119.
Brun R. and Balmer O. (2006). New developments in human African trypanosomiasis. Curr. Opin. Infect. Dis. 19 (5):415-420.
Brun R., Blum J., Chappuis F. and Burri C. (2009). Human African trypanosomiasis. Lancet. 375 (9709):148-159.
Brun R., Schumacher R., Schmid C., Kunz C., Burri C. (2001). The phenomenon of treatment failures in human African trypanosomiasis. Trop. Med. Int. Health 6 (11):906-914.
Brunk U.T., Neuzil J. and Eaton J.W. (2001). Lysosomal involvement in apoptosis. Redox Rep. 6 (2):91-97.
Buguet A., Bisser S., Josenando T., Chapotot F. and Cespuglio R. (2005). Sleep structure: a new diagnostic tool for stage determination in sleeping sickness. Acta Trop. 93 (1):107-117.
Bukachi S.A., Wandibba S. and Nyamongo I.K. (2009). The treatment pathways followed by cases of human African trypanosomiasis in western Kenya and eastern Uganda. Ann. Trop. Med. Parasitol. 103 (3):211-220.
Burkard G., Fragoso C.M. and Roditi I. (2007). Highly efficient stable transformation of bloodstream forms of Trypanosoma brucei. Mol. Biochem. Parasitol. 153 (2):220-223.
Burri C. and Brun R. (2003). Eflornithine for the treatment of human African trypanosomiasis. Parasitol. Res. 90 (Supp. 1):S49-52.
Büscher P. and Lejon V. (2004). Diagnosis of human African trypanosomiasis. In: The Trypanosomiasis (eds I. Maudlin, P.H. Holmes and M.A. Miles), CABI, Wallingford, pp. 203-218.
Büscher P., Draelants E., Magnus E., Vervoort T. and Van Meirvenne N. (1991). An experimental latex agglutination test for antibody detection in human African trypanosomiasis. Ann. Soc. Belg. Med. Trop. 71 (4):267-273.
Büscher P., Mumba Ngoyi D., Kaboré J., Lejon V., Robays J., Jamonneau V., Bebronne N., Van der Veken W. and Biéler S. (2009). Improved models of mini anion exchange centrifugation technique (mAECT) and modified single centrifugation (MSC) for sleeping sickness diagnosis and staging. PLoS Negl. Trop. Dis. 3 (11):e471.
Büscher P., Shamamba S.K.B., Mumba Ngoyi D., Pyana P., Baelmans R., Magnus E. and Overmeir C.V. (2005). Susceptibility of Grammomys surdaster thicket rats to Trypanosoma brucei gambiense infection. Trop. Med. Int. Health 10 (9):850-855.
Camara M., Camara O., Ilboudo H., Sakande H., Kaboré J., N’Dri L., Jamonneau V. and Bucheton B. (2010). Sleeping sickness diagnosis: use of buffy coats improves the sensitivity of the mini anion exchange centrifugation test. Trop. Med. Int. Health 15 (7):796-799.
Campbell R.E., Tour O., Palmer A.E., Steinbach P.A., Baird G.S., Zacharias D.A. and Tsien R.Y. (2002). A monomeric red fluorescent protein. Proc. Natl. Acad. Sci. USA 99 (12):7877-7882, 2002.
Caramello P., Lucchini A., Savoia D. and Gioannini P. (1993). Rapid diagnosis of malaria by use of fluorescent probes. Diagn. Microbiol. Infect. Dis. 17 (4):293-297.
Carter N.S. and Fairlamb A.H. (1993). Arsenical-resistant trypanosomes lack an unusual adenosine transporter. Nature 361 (6408):173-176.

References, 193
Carter N.S., Yates P.A., Gessford S.K., Galagan S.R., Landfear S.M. and Ullman B. (2010). Adaptive responses to purine starvation in Leishmania donovani. Mol. Microbiol. 78(1):92-107.
Cattand P. (2001). L’epidémiologie de la trypanosomiase humaine africaine: une histoire multifactorielle complexe. Med. Trop. 61 (4-5):313-322.
Cattand P., Jannin J. and Lucas P. (2001). Sleeping sickness surveillance: an essential step towards elimination. Trop. Med. Int. Health 6 (5):348-361.
Cattand P., Miézan B.T. and de Raadt P. (1988). Human African trypanosomiasis: use of double centrifugation of cerebrospinal fluid to detect trypanosomes. Bull. World Health Organ. 66 (1):83-86.
Ceroni P., Laghi I., Maestri M., Balzani V., Gestermann S., Gorka M. and Vogtle F. (2002). Photochemical, photophysical and electrochemical properties of six dansyl-based dyads. New J. Chem. 26 (1):66-75.
Chalfie M., Tu Y., Euskirchen G., Ward W.W. and Prasher D.C. (1994). Green fluorescent protein as a marker for gene-expression. Science 263 (5148):802-805.
Chappuis F., Loutan L., Simarro P., Lejon V. and Büscher P. (2005). Options for field diagnosis of human African trypanosomiasis. Clin. Microbiol. Rev. 18 (1):133-146.
Chappuis F., Stivanello E., Adams K., Kidane S., Pittet A. and Bovier P.A. (2004). Card agglutination test for trypanosomiasis (CATT) end-dilution titer and cerebrospinal fluid cell count as predictors of human African trypanosomiasis (Trypanosoma brucei gambiense) among serologically suspected individuals in southern Sudan. Am. J. Trop. Med. Hyg. 71 (3):313-317.
Checchi F., Diap G. and Karunakara U. Human African trypanosomiasis. Facing the challenges caused by neglect: the need for new treatment and diagnostics. Médecins Sans Frontières, Campaign for Access to Essential Medicines, Geneva, 2006.
Checchi F., Filipe J.A., Haydon D.T., Chandramohan D. and Chappuis F. (2008a). Estimates of the duration of the early and late stage of gambiense sleeping sickness. BMC Infect. Dis. 8:16.
Checchi F., Filipe J.A.N., Barrett M.P. and Chandramohan D. (2008b). The natural progression of Gambiense sleeping sickness: What is the evidence? PLoS Negl. Trop. Dis. 2 (12):e303.
Chen J., Rauch C.A., White J.H., Englund P.T. and Cozzarelli N.R. (1995). The topology of the kinetoplast DNA network. Cell 80 (1):61-69.
Chersi A., di Modugno F. and Rosanò L. (1997). Selective “in synthesis” labelling of peptides by fluorochromes. Biochim. Biophys. Acta 1336 (1):83-88.
Chollet C., Baliani A., Wong P.E., Barrett M.P. and Gilbert I.H. (2009). Targeted delivery of compounds to Trypanosoma brucei using the melamine motif. Bioorg. Med. Chem. 17 (6):2512-2523.
Choromanski L. (1984). Comparison of the levels of autofluorescence caused by fixatives in fluorescence assay on trypanosomes. J. Parasitol. 70 (6):979-980.
Clausen P.H., Wiemann A., Patzelt R., Kakaire D., Poetzsch C., Peregrine A. and Mehlitz D. (1998). Use of a PCR assay for the specific and sensitive detection of Trypanosoma spp. in naturally infected dairy cattle in peri-urban Kampala, Uganda. Ann. N. Y. Acad. Sci. 849:21-31.

References, 194
Clayton C.E., Estévez A.M., Hartmann C., Alibu V.P., Field M. and Horn D. (2005). Down-regulating gene expression by RNA interference in Trypanosoma brucei. Methods Mol. Biol. 309:39-60.
Codjia V., Mulatu W., Majiwa P.A.O., Leak S.G.A., Rowlands G.J., Authié E., d’Ieteren G.D.M. and Peregrine A.S. (1993). Epidemiology of bovine trypanosomiasis in the Ghibe valley, southwest Ethiopia. 3. Occurrence of populations of Trypanosoma congolense resistant to diminazene, isometamidium and homidium. Acta Trop. 53 (2):151-163.
Cole R.W. and Turner J.N. (2008). Light-emitting diodes are better illumination sources for biological microscopy than conventional sources. Microsc. Microanal. 14 (3):243-250.
Collar C.J., Al Salabi M.I., Stewart M.L., Barrett M.P., Wilson W.D. and de Koning H.P. (2009). Predictive computational models of substrate binding by a nucleoside transporter. J. Biol. Chem. 284 (49):34028-34035.
Collins J.S. and Goldsmith T.H. (1981). Spectral properties of fluorescence induced by glutaraldehyde fixation. J. Histochem. Cytochem. 29 (3):411-414.
Connor R.J. (1992). The diagnosis, treatment and prevention of animal trypanosomiasis under field conditions. In: Programme for the control of African animal trypanosomiasis and related development: ecological and technical aspects. Proceedings FAO Animal Production and Health Paper 100, pp.1-38.
Coppens I., Baudhuin P., Opperdoes F.R. and Courtoy P.J. (1993). Role of acidic compartments in Trypanosoma brucei, with special reference to low-density lipoprotein processing. Mol. Biochem. Parasitol. 58 (2):223-232.
Coppens I., Levade T. and Courtoy P.J. (1995). Host plasma low density lipoprotein particles as an essential source of lipids for the bloodstream forms of Trypanosoma brucei. J. Biol. Chem. 270 (11):5736-5741.
Courtin D., Jamonneau V., Mathieu J.F., Koffi M., Milet J., Yeminanga C.S., Kumeso V.K.B., Cuny G., Bilengue C.M.M. and Garcia A. (2006). Comparison of cytokine plasma levels in human African trypanosomiasis. Trop. Med. Int. Health 11 (5):647-653.
Courtioux B., Boda C., Vatunga G., Pervieux L., Josenando T., M'Eyi P.M., Bouteille B., Jauberteau-Marchan M.O. and Bisser S. (2006). A link between chemokine levels and disease severity in human African trypanosomiasis. Int. J. Parasitol. 36 (9):1057-1065.
Cox A., Tilley A., McOdimba F., Fyfe J., Eisler M., Hide G. and Welburn S. (2005). A PCR based assay for detection and differentiation of African trypanosome species in blood. Exp. Parasitol. 111 (1):24-29.
Cox B.A., Yielding L.W. and Yielding K.L. (1984). Subcellular localisation of photoreactive ethidium analogs in Trypanosoma brucei by fluorescence microscopy. J. Parasitol. 70 (5):694-702.
Cox F.E.G. (2004). History of sleeping sickness (African trypanosomiasis). Infect. Dis. Clin. North. Am. 18 (2):231-245.
Croft S.L., Barrett M.P. and Urbina J.A. (2005). Chemotherapy of trypanosomiases and leishmaniasis. Trends Parasitol. 21 (11):508-512.
de Koning H.P. (2001a). Uptake of pentamidine in Trypanosoma brucei brucei is mediated by three distinct transporters: implications for cross-resistance with arsenicals. Mol. Pharmacol. 59 (3):586-592.

References, 195
de Koning H.P. (2008). Ever-increasing complexities of diamidine and arsenical crossresistance in African trypanosomes. Trends Parasitol. 24 (8):345-349.
de Koning H.P.(2001b). Transporters in African trypanosomes: role in drug action and resistance. Int. J. Parasitol. 31 (5-6):512-522.
de Koning H.P., Anderson L.F., Stewart M., Burchmore R.J.S., Wallace L.J.M. and Barrett M.P. (2004). The trypanocide diminazene aceturate is accumulated predominantly through the TbAT1 purine transporter: additional insights on diamidine resistance in African trypanosomes. Antimicrob. Agents Chemother. 48 (5):1515-1519.
Dean S., Marchetti R., Kirk K. and Matthews K.R. (2009). A surface transporter family conveys the trypanosome differentiation signal. Nature 459 (7244):213-217.
Deborggraeve S., Claes F., Laurent T., Mertens P., Leclipteux T., Dujardin J.C., Herdewijn P. and Büscher P. (2006). Molecular dipstick test for diagnosis of sleeping sickness. J. Clin. Microbiol. 44 (8):2884-2889.
Deiman B., van Aarle P. and Sillekens P. (2002). Characteristics and applications of nucleic acid sequence-based amplification (NASBA). Mol. Biotechnol. 20 (2):163-179.
Delacollette C. and Van der Stuyft P. (1994). Direct acridine orange staining is not a “miracle” solution to the problem of malaria diagnosis in the field. Trans. R. Soc. Trop. Med. Hyg. 88 (2):187-188.
Delespaux V. and de Koning H.P. (2007). Drugs and drug resistance in African trypanosomiasis. Drug Resist. Updat. 10 (1-2):30-50.
Delespaux V., Geysen D., Van den Bossche P. and Geerts S. (2008). Molecular tools for the rapid detection of drug resistance in animal trypanosomes. Trends Parasitol. 24 (5):236-242.
Denise H. and Barrett M.P. (2001). Uptake and mode of action of drugs used against sleeping sickness. Biochem. Pharmacol. 61 (1):1-5.
Docampo R. and Moreno S.N.J. (1999). Acidocalcisome: a novel Ca2+ storage compartment in trypanosomatids and apicomplexan parasites. Parasitol. Today 15 (11):443-448.
Doua F., Miézan T.W., Singaro J.R.S., Yapo F.B. and Baltz T. (1996). The efficacy of pentamidine in the treatment of early-late stage Trypanosoma brucei gambiense trypanosomiasis. Am. J. Trop. Med. Hyg. 55 (6):586-588.
Dukes P., Gibson W.C., Gashumba J.K., Hudson K.M., Bromidge T.J., Kaukus A., Asonganyi T. and Magnus E. (1992). Absence of the LiTat 1.3 (CATT antigen) gene in Trypanosoma brucei gambiense stocks from Cameroon. Acta Trop. 51 (2):123-134.
Eisler M.C., Lessard P., Masake R.A., Moloo S.K. and Peregrine A.S. (1998). Sensitivity and specificity of antigen-capture ELISAs for diagnosis of Trypanosoma congolense and Trypanosoma vivax infections in cattle. Vet. Parasitol. 79 (3):187-201.
Ekwanzala M., Pepin J., Khonde N., Molisho S., Bruneel H. and De Wals P. (1996). In the heart of darkness: sleeping sickness in Zaire. Lancet 348 (9039):1427-1430.
Empson M.B. (2001). Statistic in the pathology laboratory: characteristics of diagnostic tests. Pathology 33 (1):93-95.
Enanga B., Burchmore R.J.S., Stewart M.L. and Barrett M.P. (2002). Sleeping sickness and the brain. Cell. Mol. Life Sci. 59 (5):845-858.
Etchegorry M.G., Helenport J.P., Pecoul B., Jannin J. and Legros D. (2001). Availability and affordability of treatment for human African trypanosomiasis. Trop. Med. Int. Health 6 (11):957-959.

References, 196
Ezeani M.C., Okoro H., Anosa V.O., Onyenekwe C.C., Meludu S.C., Dioka C.E. and Azikiwe C.C. (2008). Immunodiagnosis of bovine trypanosomiasis in Anambra and Imo states, Nigeria, using enzyme-linked immunosorbent assay: zoonotic implications to human health. J. Vector Borne Dis. 45 (4):292-300.
Fairlamb A.H. (2003). Chemotherapy of human African trypanosomiasis: current and future prospects. Trends Parasitol. 19 (11):488-494.
Fèvre E.M., Picozzi K., Jannin J., Welburn S.C. and Maudlin I. (2006). Human African trypanosomiasis: epidemiology and control. Adv. Parasitol. 61:167-221.
Fèvre E.M., Wissmann B.V., Welburn S.C. and Lutumba P. (2008). The burden of human African trypanosomiasis. PLoS Negl. Trop. Dis. 2(12):e333.
Field M.C. and Carrington M. (2009). The trypanosome flagellar pocket. Nat. Rev. Microbiol. 7 (11):775-786.
Field M.C., Allen C.L., Dhir V., Goulding D., Hall B.S., Morgan G.W., Veazey P. and Engstler M. (2004). New approaches to the microscopic imaging of Trypanosoma brucei. Microsc. Microanal. 10 (5):621-636.
Field M.C., Natesan S.K.A., Gabernet-Castello C. and Koumandou V.L. (2007). Intracellular trafficking in the trypanosomatids. Traffic 8 (6):629-639.
Florijn R.J., Slats J., Tanke H.J. and Raap A.K. (1995). Analysis of antifading reagents for fluorescence microscopy. Cytometry 19 (2):177-182.
Foglieni C., Meoni C. and Davalli A.M. (2001). Fluorescent dyes for cell viability: an application on prefixed conditions. Histochem. Cell Biol. 115 (3):223-229.
Frommel T.O. and Balber A.E. (1987). Flow cytofluorometric analysis of drug accumulation by multidrug-resistant Trypanosoma brucei brucei and T. b. rhodesiense. Mol. Biochem. Parasitol. 26 (1-2):183-191.
Gallardo-Escárate C., Alvarez-Borrego J., Von Brand E., Dupré E., Del Río-Portilla M.A. (2007). Relationship between DAPI-fluorescence fading and nuclear DNA content: an alternative method to DNA quantification? Biol. Res. 40 (1):29-40.
Garcia A., Courtin D., Solano P., Koffi M. and Jamonneau V. (2006). Human African trypanosomiasis: connecting parasite and host genetics. Trends Parasitol. 22 (9):405-409.
Garcia A., Jamonneau V., Magnus E., Laveissière C., Lejon V., N'Guessan P., N'Dri L., Van Meirvenne N. and Büscher P. (2000). Follow-up of Card Agglutination Trypanosomiasis Test (CATT) positive but apparently aparasitaemic individuals in Côte d'Ivoire: evidence for a complex and heterogeneous population. Trop. Med. Int. Health 5 (11):786-793.
García-Salcedo J.A., Pérez-Morga D., Gijón P., Dilbeck V., Pays E. and Nolan D.P. (2004). A differential role for actin during the life cycle of Trypanosoma brucei. EMBO J. 23 (4):780-789.
Gardner B.J. and Mason S.F. (1967). Structure and optical activity of DNA-aminoacridine complex. Biopolymers 5 (1):79-94.
Gay F., Traoré B., Zanoni J., Danis M. and Fribourg-Blanc A. (1996). Direct acridine orange fluorescence examination of blood slides compared to current techniques for malaria diagnosis. Trans. R. Soc. Trop. Med. Hyg. 90 (5):516-518.
Geiser F., Lüscher A., de Koning H.P., Seebeck T. and Mäser P. (2005). Molecular pharmacology of adenosine transport in Trypanosoma brucei: P1/P2 revisited. Mol. Pharmacol. 68 (3):589-595.

References, 197
Gibson W. (2001). Molecular characterization of field isolates of human pathogenic trypanosomes. Trop. Med. Int. Health 6 (5):401-406.
Gibson W. (2002a). Epidemiology and diagnosis of African trypanosomiasis using DNA probes. Trans. R. Soc. Trop. Med. Hyg. 96 (Supp. l.1):S141-143.
Gibson W., Backhouse T. and Griffiths A. (2002b). The human serum resistance associated gene is ubiquitous and conserved in Trypanosoma brucei rhodesiense throughout East Africa. Infect. Genet. Evol. 1 (3):207-214.
Gillingwater K., Kumar A., Anbazhagan M., Boykin D.W., Tidwell R.R. and Brun R. (2009). In vivo investigations of selected diamidine compounds against Trypanosoma evansi using a mouse model. Antimicrob. Agents Chemother. 53 (12):5074-5079.
Giroud C., Ottones F., Coustou V., Dacheux D., Biteau N., Miezan B., Van Reet N., Carrington M., Doua F. and Baltz T. (2009). Murine models for Trypanosoma brucei gambiense disease progression – From silent to chronic infections and early brain tropism. PLoS Neg. Trop. Dis. 3 (9):e509.
Gonçalves M.S. (2009). Fluorescent labeling of biomolecules with organic probes. Chem. Rev. 109 (1):190-212.
Gould M.K., Vu X.L., Seebeck T. and de Koning H.P. (2008). Propidium iodide-based methods for monitoring drug action in the kinetoplastidae: comparison with the Alamar Blue assay. Anal. Biochem. 382 (2):87-93.
Guy R., Liu P., Pennefather P. and Crandall I. (2007). The use of fluorescence enhancement to improve the microscopic diagnosis of falciparum malaria. Malar. J. 6:89.
Hainard A., Tiberti N., Robin X., Lejon V., Mumba Ngoyi D., Matovu E., Enyaru J.C., Fouda C., Ndung'u J.M., Lisacek F., Müller M., Turck N. and Sanchez J.C. (2009). A combined CXCL10, CXCL8 and H-FABP panel for the staging of human African trypanosomiasis patients. PLoS Neg. Trop. Dis. 3 (6):e459.
Hänscheid T. (2008). The future looks bright: low-cost fluorescent microscopes for detection of Mycobacterium tuberculosis and Coccidiae. Trans. R. Soc. Trop. Med. Hyg. 102 (6):520-521.
Hasker E., Mitashi P., Baelmans R., Lutumba P., Jacquet D., Lejon V., Kande V., Declercq J., Van der Veken W. and Boelaert M. (2010). A new format of the CATT test for the detection of human African trypanosomiasis, designed for use in peripheral health facilities. Trop. Med. Int. Health 15 (2):263-267.
Hasne M.P., Coppens I., Soysa R. and Ullman B. (2010). A high-affinity putrescine-cadaverine transporter from Trypanosoma cruzi. Mol. Microbiol. 76 (1):78-91.
Hawking F. and Sen A.B. (1960). The trypanocidal action of homidium, quinapyramine and suramin. Br. J. Pharmacol. Chemother. 15 (4):567-570.
Hendry C., Dionne K., Hedgepeth A., Carroll K. and Parrish N. (2009). Evaluation of a rapid fluorescent staining method for detection of mycobacteria in clinical specimens. J. Clin. Microbiol. 47 (4):1206-1208.
Hermetter A., Scholze H., Stütz A.E., Withers S.G. and Wrodnigg T.M. (2001). Powerful probes for glycosidases: novel, fluorescently tagged glycosidase inhibitors. Bioorg. Med. Chem. Lett. 11 (10):1339-1342.
Hirumi H. and Hirumi K. (1994). Axenic culture of African trypanosome bloodstream forms. Parasitol. Today 10 (2):80-84.
References, 198
Hong M. and Simpson L. (2003). Genomic organization of Trypanosoma brucei kinetoplast DNA minicircles. Protist 154 (2):265-279.
Houwen B. (2000). Blood film preparation and staining procedures. Lab. Hematol. 6:1-7.
Huang L.R., Cox E.C., Austin R.H. and Sturm J.C. (2004). Continuous particle separation through deterministic lateral displacement. Science 304 (5673):987-990.
Hung N.V., Sy D.N., Anthony R.M., Cobelens F.G. and van Soolingen D. (2007). Fluorescence microscopy for tuberculosis diagnosis. Lancet Infect. Dis. 7 (4):238-239.
Husain O.A.N., Millett J.A. and Grainger J.M. (1980). Use of polylysine-coated slides in preparation of cell samples for diagnostic cytology, with special reference to urine sample. J. Clin. Pathol. 33 (3):309-311.
Hutchinson O.C., Fèvre E.M., Carrington M. and Welburn S.C. (2003). Lessons learned from the emergence of a new Trypanosoma brucei rhodesiense sleeping sickness focus in Uganda. Lancet Infect. Dis. 3 (1):42-45.
Hutchinson O.C., Webb H., Picozzi K., Welburn S. and Carrington M. (2004). Candidate protein selection for diagnostic markers of African trypanosomiasis. Trends Parasitol. 20 (11):519-523.
Inojosa W.O., Augusto I., Bisoffi Z., Josenado T., Abel P.M., Stich A. and Whitty C.J.M. (2006). Diagnosing human African trypanosomiasis in Angola using a card agglutination test: observational study of active and passive case finding strategies. B. M. J. 332 (7556):1479-1481.
Jackson A.P. (2007). Origins of amino acid transporter loci in trypanosomatid parasites. BMC Evol. Biol. 7:26.
Jamonneau V., Solano P. and Cuny G. (2001). Utilisation de la biologie moleculaire dans le diagnostic de la trypanosomose humaine africaine. Med. Trop. 61 (4-5):347-354.
Jamonneau V., Solano P., Koffi M., Denizot M. and Cuny R. (2004). Apports et limites du diagnostic de la trypanosomiase humaine africaine. Med. Sci. (Paris) 20 (10):871-875.
Jamonneau V., Truc P., Garcia A., Magnus E. and Buscher P. (2000). Preliminary evaluation of LATEX/T. b. gambiense and alternative versions of CATT/T. b. gambiense for the serodiagnosis of Human African Trypanosomiasis of a population at risk in Côte d'Ivoire: considerations for mass-screening. Acta Trop. 76 (2):175-183.
Jannin J. and Cattand P. (2004). Treatment and control of human African trypanosomiasis. Curr. Opin. Infect. Dis. 17 (6):565-570.
Johnson G.D., Davidson R.S., McNamee K.C., Russell G., Goodwin D. and Holborow E.J. (1982). Fading of immunofluorescence during microscopy: a study of phenomenon and its remedy. J. Immunol. Methods 55 (2):231-242.
Jones D., Broeckman E., Derschum H., Mandy F. and Ries H. (2005). LED fluorescence microscopy made for space for use on earth. Proc. Roy. Microsc. Soc. 40 (2):91-96.
Jones D., Nyalwidhe J., Tetley L. and Barrett M.P. (2007). McArthur revisited: fluorescence microscopes for field diagnostics. Trends Parasitol. 23 (10):468-469.
Joshi P.P., Shegokar V.R., Powar R.M., Herder S., Katti R., Salkar H.R., Dani V.S., Bhargava A., Jannin J. and Truc P. (2005). Human trypanosomiasis caused by Trypanosoma evansi in India: the first case report. Am. J. Trop. Med. Hyg. 73 (3):491-495.
Kapuscinski J. (1990). Interactions of nucleic acids with fluorescent dyes: spectral properties of condensed complexes. J. Histochem. Cytochem. 38 (9):1323-1329.

References, 199
Kapuscinski J. (1995). DAPI: a DNA-specific fluorescent probe. Biotech. Histochem. 70 (5):220-233.
Kawamoto F. (1991). Rapid diagnosis of malaria by fluorescence microscopy with light microscope and interference filter. Lancet 337 (8735):200-202.
Kazibwe A.J. (2008). Factors influencing the spread and selection of drug resistance in Human African Trypanosomiasis. PhD Thesis, University of Glasgow.
Kazibwe A.J.N., Nerima B., de Koning H.P., Maser P., Barrett M.P. and Matovu E. (2009). Genotypic status of the TbAT1/P2 adenosine transporter of Trypanosoma brucei gambiense isolates from northwestern Uganda following melarsoprol withdrawal. PLoS Negl. Trop. Dis. 3 (9):e523.
Keiser J., Utzinger J., Premji Z., Yamagata Y. and Singer B.H. (2002). Acridine orange for malaria diagnosis: its diagnostic performance, its promotion and implementation in Tanzania, and the implications for malaria control. Ann. Trop. Med. Parasitol. 96 (7):643-654.
Kelly S., Reed J., Kramer S., Ellis L., Webb H., Sunter J., Salje J., Marinsek N., Gull K., Wickstead B. and Carrington M. (2007). Functional genomics in Trypanosoma brucei: a collection of vectors for the expression of tagged proteins from endogenous and ectopic gene loci. Mol. Biochem. Parasitol. 154 (1):103-109.
Kennedy P.G. (2006a). Diagnostic and neuropathogenesis issues in human African trypanosomiasis. Int. J. Parasitol. 36 (5):505-512.
Kennedy P.G. (2006b). Human African trypanosomiasis–neurological aspects. J. Neurol. 253 (4):411-416.
Kennedy P.G. (2008). The continuing problem of human African trypanosomiasis (sleeping sickness). Ann. Neurol. 64 (2):116-127.
Kim S.K., Eriksson S., Kubista M. and Nordén B. (1993). Interaction of 4',6-Diamidino-2-Phenylindole (DAPI) with Poly[D(G-C)2] and Poly[d(G-m5C)2]: evidence for major groove binding of a DNA probe. J. Am. Chem. Soc. 115 (9):3441-3447.
Kimber C.D. (1984). Further improvements in the miniature anion/exchange centrifugation technique (mAECT) for field work. Trans. R. Soc. Trop. Med. Hyg. 78 (5):702-703.
Kinabo L.D.B. and Bogan J.A. (1988). The pharmacology of isometamidium. J. Vet. Pharmacol. Ther. 11 (3):233-245.
Koffi M., Solano P., Denizot M., Courtin D., Garcia A., Lejon V., Büscher P., Cuny G. and Jamonneau V. (2006). Aparasitemic serological suspects in Trypanosoma brucei gambiense human African trypanosomiasis: a potential human reservoir of parasites? Acta Trop. 98 (2):183-188.
Kong H.H., and Chung D.I. (1995). Comparison of acridine orange and Giemsa stains for malaria diagnosis. Korean J. Parasitol. 33 (4):391-394.
Krieger S., Schwarz W., Ariyanayagam M.R., Fairlamb A.H., Krauth-Siegel R.L. and Clayton C. (2000). Trypanosomes lacking trypanothione reductase are avirulent and show increased sensitivity to oxidative stress. Mol. Microbiol. 35 (3):542-552.
Kristjanson P.M., Swallow B.M., Rowlands G.J., Kruska R.L. and de Leeuw P.N. (1999). Measuring the costs of African animal trypanosomosis, the potential benefits of control and returns to research. Agric. Syst. 59 (1):79-98.
Landfear S.M. (2009). Transporters for drug delivery and as drug targets in parasitic protozoa. Clin. Pharmacol. Ther. 87 (1): 122-125.
References, 200
Lang D.S., Zeiser T., Schultz H., Stellmacher F., Vollmer E., Zabel P. and Goldmann T. (2008). LED-FISH: Fluorescence microscopy based on light emitting diodes for the molecular analysis of Her-2/neu oncogene amplification. Diagn. Pathol. 3:49.
Lanteri C.A., Stewart M.L., Brock J.M., Alibu V.P., Meshnick S.R., Tidwell R.R. and Barrett M.P. (2006). Roles for the Trypanosoma brucei P2 transporter in DB75 uptake and resistance. Mol. Pharmacol. 70 (5):1585-1592.
Lanteri C.A., Tidwell R.R. and Meshnick S.R. (2008). The mitochondrion is a site of trypanocidal action of the aromatic diamidine DB75 in bloodstream forms of Trypanosoma brucei. Antimicrob. Agents Chemother. 52 (3):875-882.
Lanteri C.A., Trumpower B.L., Tidwell R.R. and Meshnick S.R. (2004). DB75, a novel trypanocidal agent, disrupts mitochondrial function in Saccharomyces cerevisiae. Antimicrob. Agents Chemother. 48 (10):3968-3974.
Leach T.M. and Roberts C.J. (1981). Present status of chemotherapy and chemoprophylaxis of animal trypanosomiasis in the Eastern hemisphere. Pharmacol. Ther. 13 (1):91-147.
Legros D., Evans S., Maiso F., Enyaru J.C.K. and Mbulamberi D. (1999). Risk factors for treatment failure after melarsoprol for Trypanosoma brucei gambiense trypanosomiasis in Uganda. Trans. R. Soc. Trop. Med. Hyg. 93 (4):439-442.
Legros D., Ollivier G., Gastellu-Etchegorry M., Paquet C., Burri C., Jannin J. and Büscher P. (2002). Treatment of human African trypanosomiasis - present situation and needs for research and development. Lancet Infect. Dis. 2 (7):437-440.
Lejon V. and Büscher P. (2001). Stage determination and follow-up in sleeping sickness. Med. Trop. 61 (4-5):355-360.
Lejon V. and Büscher P. (2002). Le diagnostic du stade dans la maladie du sommeil: vers une nouvelle approche. Bull. Soc. Pathol. Exot. 95 (5):338-340.
Lejon V. and Büscher P. (2005). Cerebrospinal fluid in human African trypanosomiasis: a key to diagnosis, therapeutic decision and post-treatment follow-up. Trop. Med. Int. Health 10 (5):395-403.
Lejon V., Boelaert M., Jannin J., Moore A. and Buscher P. (2003a). The challenge of Trypanosoma brucei gambiense sleeping sickness diagnosis outside Africa. Lancet Infect. Dis. 3 (12):804-808.
Lejon V., Büscher P., Magnus E., Moons A., Wouters I. and Van Meirvenne N. (1998). A semi-quantitative ELISA for detection of Trypanosoma brucei gambiense specific antibodies in serum and cerebrospinal fluid of sleeping sickness patients. Acta Trop. 69 (2):151-164.
Lejon V., Jamonneau V., Solano P., Atchade P., Mumba D., Nkoy N., Bébronne N., Kibonja T., Balharbi F., Wierckx A., Boelaert M. and Büscher P. (2006). Detection of trypanosome-specific antibodies in saliva, towards non-invasive serological diagnosis of sleeping sickness. Trop. Med. Int. Health 11 (5):620-627.
Lejon V., Lardon J., Kenis G., Pinoges L., Legros D., Bisser S., N'Siesi X., Bosmans E. and Büscher P. (2002a). Interleukin (IL)-6, IL-8 and IL-10 in serum and CSF of Trypanosoma brucei gambiense sleeping sickness patients before and after treatment. Trans. R. Soc. Trop. Med. Hyg. 96 (3):329-333.
Lejon V., Legros D., Richer M., Ruiz J.A., Jamonneau V., Truc P., Doua F., Djé N., N'Siesi F.X., Bisser S., Magnus E., Wouters I., Konings J., Vervoort T., Sultan F. and Büscher P. (2002b). IgM quantification in the cerebrospinal fluid of sleeping sickness patients by a latex card agglutination test. Trop. Med. Int. Health 7 (8):685-692.

References, 201
Lejon V., Mumba Ngoyi D., Boelaert M. and Büscher P. (2010). A CATT negative result after treatment for human African trypanosomiasis is no indication for cure. PLoS Negl. Trop. Dis. 4 (1):e590.
Lejon V., Reiber H., Legros D., Dje N., Magnus E., Wouters I., Sindic C.J.M. and Büscher P. (2003b). Intrathecal immune response pattern for improved diagnosis of central nervous system involvement in trypanosomiasis. J. Infect. Dis. 187 (9):1475-1483.
Lejon V., Roger I., Mumba Ngoyi D., Menten J., Robays J., N’Siesi F.X., Bisser S., Boelaert M. and Büscher P. (2008). Novel markers for treatment outcome in late-stage Trypanosoma brucei gambiense trypanosomiasis. Clin. Infect. Dis. 47 (1):15-22.
Lichtman J.W. and Conchello J.A. (2005). Fluorescence microscopy. Nat. Methods 2 (12):910-919.
Lindh J.M., Torr S.J., Vale G.A. and Lehane M.J. (2009). Improving the cost-effectiveness of artificial visual baits for controlling the tsetse fly Glossina fucipes fucipes. PLoS Neg. Trop. Dis. 3 (7):e474.
Liu B., Liu Y., Motyka S.A., Agbo E.E.C. and Englund P.T. (2005). Fellowship of the rings: the replication of kinetoplast DNA. Trends Parasitol. 21 (8):363-369.
Liu J.Y., Qiao X.G., Du D.Y. and Lee M.G.S. (2000). Receptor-mediated endocytosis in the procyclic form of Trypanosoma brucei. J. Biol. Chem. 275 (16):12032-12040.
Liu M.K., Cattand P., Gardiner I.C. and Pearson T.W. (1989). Immunodiagnosis of sleeping sickness due to Trypanosoma brucei gambiense by detection of anti-procyclic antibodies and trypanosome antigens in patients’ sera. Acta Trop. 46 (4):257-266.
Liu Y., Kumar A., Boykin D.W. and Wilson W.D. (2007). Sequence and length dependent thermodynamic differences in heterocyclic diamidine interactions at AT base pairs in the DNA minor groove. Biophys. Chem. 131 (1-3):1-14.
Longin A., Souchier C., Ffrench M. and Bryon P.A. (1993). Comparison of anti-fading agents used in fluorescence microscopy: image analysis and laser confocal microscopy study. J. Histochem. Cytochem. 41 (12):1833-1840.
Louis F.J., Büscher P. and Lejon V. (2001). Le diagnostic de la trypanosomiase humaine africaine en 2001. Med. Trop. 61 (4-5):340-346.
Lumsden W.H.R., Kimber C.D., Evans D.A. and Doig S.J. (1979). Trypanosoma brucei: miniature anion-exchange centrifugation technique for detection of low parasitaemias: adaptation for field use. Trans. R. Soc. Trop. Med. Hyg. 73 (3):312-317.
Lun Z.R., Reid S.A., Lai D.H., Li F.J. (2009). Atypical human trypanosomiasis: a neglected disease or just an unlucky accident? Trends Parasitol. 25 (3):107-108.
Lutumba P., Meheus F., Robays J., Miaka C., Kande V., Büscher P., Dujardin B. and Boelaert M. (2007). Cost-effectiveness of algorithms for confirmation test of human African trypanosomiasis. Emerg. Infect. Dis. 13 (10):1484-1490.
Lutumba P., Robays J., Miaka C., Kande V., Mumba D., Büscher P., Dujardin B. and Boelaert M. (2006). Validité, coût et faisabilité de la mAECT et CTC comme tests de confirmation dans la détection de la Trypanosomiase Humaine Africaine. Trop. Med. Int. Health 11 (4):470-478.
Lutumba P., Robays J., Miaka C., Kande V., Simarro P.P., Shaw A.P.M., Dujardin B. and Boelaert M. (2005). Efficience de différentes stratégies de détection de la Trypanosomiase Humaine Africaine à T. b. gambiense. Trop. Med. Int. Health 10 (4):347-356.

References, 202
Machado C.R., Augusto-Pinto L., McCulloch R. and Teixeira S.M. (2006). DNA metabolism and genetic diversity in Trypanosomes. Mutat. Res. 612 (1):40-57.
MacInnes J.W. and McClintock. M (1970). Differences in fluorescence spectra of acridine orange-DNA complexes related to DNA base composition. Biopolymers 9 (11):1407-1411.
Magnus E., Lejon V., Bayon D., Buyse D., Simarro P., Verloo D., Vervoort T., Pansaerts R., Buscher P. and Van Meirvenne N. (2002). Evaluation of an EDTA version of CATT/Trypanosoma brucei gambiense for serological screening of human blood samples. Acta Trop. 81 (1):7-12.
Maina N.W.N., Maina K.J., Mäser P. and Brun R. (2007a). Genotypic and phenotypic characterization of Trypanosoma brucei gambiense isolates from Ibba, South Sudan, an area of high melarsoprol treatment failure rate. Acta Trop. 104 (2-3):84-90.
Maina N.W.N., Oberle M., Otieno C., Kunz C., Maeser P., Ndung'u J.M. and Brun R. (2007b). Isolation and propagation of Trypanosoma brucei gambiense from sleeping sickness patients in south Sudan. Trans. R. Soc. Trop. Med. Hyg. 101 (6):540-546.
Marais B.J., Brittle W., Painczyk K., Hesseling A.C., Beyers N., Wasserman E., van Soolingen D. and Warren R.M. (2008). Use of light-emitted diode fluorescence microscopy to detect acid-fast bacilli in sputum. Clin. Infect. Dis. 47 (2):203-207.
Mäser P., Lüscher A. and Kaminsky R. (2003). Drug transport and drug resistance in African trypanosomes. Drug Resist. Updat. 6 (5):281-290.
Mäser P., Sütterlin C., Kralli A. and Kaminsky R. (1999). A nucleoside transporter from Trypanosoma brucei involved in drug resistance. Science 285 (5425):242-244.
Mathis A.M., Bridges A.S., Ismail M.A., Kumar A., Francesconi I., Anbazhagan M., Hu Q., Tanious F.A., Wenzler T., Saulter J., Wilson W.D., Brun R., Boykin D.W., Tidwell R.R. and Hall J.E. (2007). Diphenyl furans and aza analogs: effects of structural modification on in vitro activity, DNA binding, and accumulation and distribution in trypanosomes. Antimicrob. Agents Chemother. 51 (8):2801-2810.
Mathis A.M., Holman J.L.,. Sturk L.M, Ismail M.A., Boykin D.W., Tidwell R.R. and Hall J.E. (2006). Accumulation and intracellular distribution of antitrypanosomal diamidine compounds DB75 and DB820 in African trypanosomes. Antimicrob. Agents Chemother. 50 (6):2185-2191.
Matovu E., Enyaru J.C.K., Legros D., Schmid C., Seebeck T. and Kaminsky R. (2001a). Melarsoprol refractory T. b. gambiense from Omugo, north-western Uganda. Trop. Med. Int. Health 6 (5):407-411.
Matovu E., Geiser F., Schneider V., Mäser P., Enyaru J.C.K., Kaminsky R., Gallati S. and Seebeck T. (2001b). Genetic variants of the TbAT1 adenosine transporter from African trypanosomes in relapse infections following melarsoprol therapy. Mol. Biochem. Parasitol. 117 (1):73-81.
Matovu E., Stewart M.L., Geiser F., Brun R., Mäser P., Wallace L.J.M., Burchmore R.J., Enyaru J.C.K., Barrett M.P., Kaminsky R., Seebeck T. and de Koning H.P. (2003). Mechanisms of arsenical and diamidine uptake and resistance in Trypanosoma brucei. Eukaryot. Cell 2 (5):1003-1008.
Maudlin I. (2006). African trypanosomiasis. Ann. Trop. Med. Parasitol. 100 (8):679-701.
Mendoza M., Mijares A., Rojas H., Rodríguez J. P., Urbina J. A. and DiPolo R. (2002). Physiological and morphological evidences for the presence acidocalcisomes in Trypanosoma evansi - Single cell fluorescence and 31P NMR studies. Mol. Biochem. Parasitol. 125 (1-2):23-33.

References, 203
Metzger W.G. and Nkeyi M. (1995). Immediate detection of malaria parasites by acridine orange staining. Trans. R. Soc. Trop. Med. Hyg. 89 (5):577.
Miézan T.W., Doua F., Cattand P. and de Raadt P. (1991). Evaluation du Testryp CATT appliqué au sang prélevé sur papier filtre et au sang dilué, dans le foyer de trypanosomiase à Trypanosoma brucei gambiense en Côte d’Ivoire. Bull. World Health Organ. 69 (5):603-606.
Miézan T.W., Meda A.H., Doua F. and Cattand P. (1994). Évaluation des techniques parasitologiques utilisées dans le diagnostic de la trypanosomose humaine à Trypanosoma gambiense en Côte d'Ivoire. Bull. Soc. Pathol. Exot. 87 (2):101-104.
Miézan T.W., Meda H.A., Doua F., Djè N.N., Lejon V. and Büscher P. (2000). Single centrifugation of cerebrospinal fluid in a sealed Pasteur pipette for simple, rapid and sensitive detection of trypanosomes. Trans. R. Soc. Trop. Med. Hyg. 94 (3):293.
Minion J., Sohn H. and Pai M. (2009). Light-emitting diode technologies for TB diagnosis: what is on the market? Expert Rev. Med. Devices 6(4):341-345.
Molyneux D.H. (1975). Diagnostic methods in animal trypanosomiasis. Vet. Parasitol. 1 (1):5-17.
Morgan G.W., Hall B.S., Denny P.W., Carrington M. and Field M.C. (2002). The kinetoplastida endocytic apparatus. Part I: a dynamic system for nutrition and evasion of host defences. Trends Parasitol. 18 (11):491-496.
Mori Y. and Notomi T. (2009). Loop-mediated isothermal amplification (LAMP): a rapid, accurate, and cost-effective diagnostic method for infectious diseases. J. Infect. Chemother. 15 (2):62-69.
Morrison L.J., Marcello L., McCulloch R. (2009). Antigenic variation in the African trypanosome: molecular mechanisms and phenotypic complexity. Cell. Microbiol. 11 (12):1724-1734.
Mugasa C.M., Laurent T., Schoone G.J., Kager P.A., Lubega G.W. and Schallig H.D.F.H. (2009). Nucleic acid sequence-based amplification with oligochromatography for detection of Trypanosoma brucei in clinical samples. J. Clin. Microbiol. 47 (3):630-635.
Mugasa M., Schoone G.J., Ekangu R.A., Lubega G.W., Kager P.A. and. Schallig H.D.F.H. (2008). Detection of Trypanosoma brucei parasites in blood samples using real-time nucleic acid sequence-based amplification. Diagn. Microbiol. Infect. Dis. 61 (4):440-445.
Mumba Ngoyi D., Lejon V., N’Siesi F.X., Boelaert M. and Büscher P. (2009). Comparison of operational criteria for treatment outcome in gambiense human African trypanosomiasis. Trop. Med. Int. Health 14 (4):438-444.
Mumba Ngoyi D., Lejon V., Pyana P., Boelaert M., Ilunga M., Menten J., Mulunda J.P., Van Nieuwenhove S., Muyembe Tamfum J.J. and Büscher P. (2010). How to shorten patient follow-up after treatment for Trypanosoma brucei gambiense sleeping sickness. J. Infect. Dis. 201 (3):453-463.
Murray M., Murray P.K. and McIntyre W.I.M. (1977). Improved parasitological technique for diagnosis of African trypanosomiasis. Trans. R. Soc. Trop. Med. Hyg. 71 (4):325-326.
Naessens J. (2006). Bovine trypanotolerance: a natural ability to prevent severe anaemia and haemophagocytic syndrome? Int. J. Parasitol. 36 (5):521-528.

References, 204
Nendaz M.R. and Perrier A. (2004). Sensibilité, spécificité, valeur prédictive positive et valeur prédictive négative d’un test diagnostique. Rev. Mal. Respir. 21 (2 Pt 1):390-393.
Njiokou F., Laveissière C., Simo G., Nkinin S., Grébaut P., Cuny G. and Herder S. (2006). Wild fauna as a probable animal reservoir for Trypanosoma brucei gambiense in Cameroon. Infect. Genet. Evol. 6 (2):147-153.
Njiru Z. K., Mikosza A.S.J., Armstrong T., Enyaru J.C., Ndung'u J.M. and Thompson A.R.C. (2008a). Loop-mediated isothermal amplification (LAMP) method for rapid detection of Trypanosoma brucei rhodesiense. PLoS Negl. Trop. Dis. 2 (1):e147.
Njiru Z.K., Mikosza A.S. J., Matovu E., Enyaru J.C.K., Ouma J.O., Kibona S.N., Thompson R.C.A. and Ndung'u J.M. (2008b). African trypanosomiasis: sensitive and rapid detection of the sub-genus Trypanozoon by loop-mediated isothermal amplification (LAMP) of parasite DNA. Int. J. Parasitol. 38 (5):589-599.
Njiru Z.K., Ndung'u K., Matete G., Ndung'u J.M. and Gibson W.C. (2004). Detection of Trypanosoma brucei rhodesiense in animals from sleeping sickness foci in East Africa using the serum resistance associated (SRA) gene. Acta Trop. 90 (3):249-254.
Noireau F., Lemesre J.L., Nzoukoudi M.Y., Louembet M.T., Gouteux J.P. and Frezil J.L. (1988). Serodiagnosis of sleeping sickness in the Republic of the Congo: comparison of indirect immunofluorescent antibody test and card agglutination test. Trans. R. Soc. Trop. Med. Hyg. 82 (2):237-240.
Notomi T., Okayama H., Masubuchi H., Yonekawa T., Watanabe K., Amino N. and Hase T. (2000). Loop-mediated isothermal amplification of DNA. Nucleic Acids Res. 28 (12):e63.
Odiit M., Coleman P.G., McDermott J.J., Fèvre E.M., Welburn S.C. and Woolhouse M.E.J. (2004). Spatial and temporal risk factors for the early detection of Trypanosoma brucei rhodesiense sleeping sickness patients in Tororo and Busia districts, Uganda. Trans. R. Soc. Trop. Med. Hyg. 98 (10):569-576.
Ollivier G. and Legros D. (2001). Trypanosomiase humaine africaine: historique de la thérapeutique et de ses échecs. Trop. Med. Int. Health 6 (11):855-863.
Ono M., Murakami T., Kudo A., Isshiki M., Sawada H. and Segawa A. (2001). Quantitative comparison of anti-fading mounting media for confocal laser scanning microscopy. J. Histochem. Cytochem. 49 (3):305-311.
Opperdoes F.R. (1987). Compartmentation of carbohydrate metabolism in trypanosomes. Annu. Rev. Microbiol. 41:127-151.
Ormerod W.E. (1951). A study of basophilic inclusion bodies produced by chemotherapeutic agents in trypanosomes. Br. J. Pharmacol. Chemother. 6 (2):334-341.
Ortiz D., Sanchez M.A., Quecke P. and Landfear S.M. (2009). Two novel nucleobase/pentamidine transporters from Trypanosoma brucei. Mol. Biochem. Parasitol. 163 (2):67-76.
Ortiz D., Valdés R., Sanchez M.A., Hayenga J., Elya C., Detke S. and Landfear S.M. (2010). Purine restriction induces pronounced translational upregulation of the NT1 adenosine/pyrimidine nucleoside transporter in Leishmania major. Mol. Microbiol. 78 (1):108-118.
Ortiz-Ordóñez J.C., Sechelski J.B. and Seed J.R. (1994). Mechanism of lysis of Trypanosoma brucei gambiense by human serum. J. Parasitol. 80 (6):924-930.

References, 205
Pansaerts R., Van Meirvenne N., Magnus E. and Verhelst L. (1998). Increased sensitivity of the card agglutination test CATT/Trypanosoma brucei gambiense by inhibition of complement. Acta Trop. 70 (3):349-354.
Papadopoulos M.C., Abel P.M., Agranoff D., Stich A., Tarelli E., Bell B.A., Planche T., Loosemore A., Saadoun S., Wilkins P. and Krishna S. (2004). A novel and accurate diagnostic test for human African trypanosomiasis. Lancet 363 (9418):1358-1363.
Paquet C., Ancelle T., Gastellu-Etchegorry M., Castilla J. and Harndt I. (1992). Persistence of antibodies to Trypanosoma brucei gambiense after treatment of human trypanosomiasis in Uganda. Lancet 340 (8813):250.
Patnaik P.K., Kulkarni S.K. and Cross G.A. (1993). Autonomously replicating single-copy episomes in Trypanosoma brucei show unusual stability. EMBO J. 12 (6):2529-2538.
Pays E. and Vanhollebeke B. (2008). Mutual self-defence: the trypanolytic factor story. Microbes Infect. 10 (9):985-989.
Penchenier L., Grebaut P., Njokou F., Eyenga V.E. and Buscher P. (2003). Evaluation of LATEX/T .b. gambiense for mass screening of Trypanosoma brucei gambiense sleeping sickness in Central Africa. Acta Trop. 85 (1):31-37.
Penchenier L., Simo G., Grébaut P., Nkinin S., Laveissière C. and Herder S. (2000). Diagnosis of human trypanosomiasis, due to Trypanosoma brucei gambiense in central Africa, by the polymerase chain reaction. Trans. R. Soc. Trop. Med. Hyg.94 (4):392-394.
Pépin J. and Méda H.A. (2001). The epidemiology and control of human African trypanosomiasis. Adv. Parasitol. 49:71-132.
Peregrine A.S., Gray M.A. and Moloo S.K. (1997). Cross-resistance associated with development of resistance to isometamidium in a clone of Trypanosoma congolense. Antimicrob. Agents Chemother. 41 (7):1604-1606.
Perkins M.D. and Small P.M. (2006). Partnering for better microbial diagnostics. Nat. Biotechnol. 24 (8):919-921.
Petty H.R. (2007). Fluorescence microscopy: established and emerging methods, experimental strategies, and applications in immunology. Microsc. Res. Tech. 70 (8):687-709.
Picozzi K., Carrington M. and Welburn S.C. (2008). A multiplex PCR that discriminates between Trypanosoma brucei brucei and zoonotic T. b. rhodesiense. Exp. Parasitol. 118 (1):41-46.
Picozzi K., Fèvre E.M., Odiit M., Carrington M., Eisler M.C., Maudlin I., Welburn S.C. (2005). Sleeping sickness in Uganda: a thin line between two fatal diseases. BMJ 331 (7527):1238-1242.
Picozzi K., Tilley A., Fèvre E.M., Coleman P.G., Magona J.W., Odiit M., Eisler M.C. and Welburn S.C. (2002). The diagnosis of trypanosome infections: applications of novel technology for reducing disease risk. Afr. J. Biotechnol. 1 (2):39-45.
Pisharath H., Rhee J.M., Swanson M.A., Leach S.D. and Parsons M. J. (2007). Targeted ablation of beta cells in the embryonic zebrafish pancreas using E. coli nitroreductase. Mech. Dev. 124 (3):218-229.
Pradel N., Santini C.L., Bernadac A., Shih Y.L., Goldberg M.B. and Wu L.F. (2007). Polar positional information in Escherichia coli spherical cells. Biochem. Biophys. Res. Commun. 353 (2):493-500.

References, 206
Priotto G., Fogg C., Balasegaram M., Erphas O., Louga A., Checchi F., Ghabri S. and Piola P. (2006). Three drug combinations for late-stage Trypanosoma brucei gambiense sleeping sickness: a randomized clinical trial in Uganda. PLoS Clin. Trials 1 (8):e39.
Priotto G., Kasparian S., Mutombo W., Ngouama D., Ghorashian S., Arnold U., Ghabri S. Baudin E., Buard V., Kazadi-Kyanza S., Ilunga M., Mutangala W., Pohlig G., Schmid C., Karunakara U., Torreele E. and Kande V. (2009). Nifurtimox-eflornithine combination therapy for second-stage African Trypanosoma brucei gambiense trypanosomiasis: a multicentre, randomised, phase III, non-inferiority trial. Lancet 374 (9683):56-64.
Radwanska M. (2010). Emerging trends in the diagnosis of human African trypanosomiasis. Parasitology. Epub ahead of print.
Radwanska M., Chamekh M., Vanhamme L., Claes F., Magez S., Magnus E., De Baetselier P., Buscher P. and Pays E. (2002a). The serum resistance-associated gene as a diagnostic tool for the detection of Trypanosoma brucei rhodesiense. Am. J. Trop. Med. Hyg. 67 (6):684-690.
Radwanska M., Claes F., Magez S., Magnus E., Perez-Morga D., Pays E. and Buscher P. (2002b). Novel primer sequences for polymerase chain reaction-based detection of Trypanosoma brucei gambiense. Am. J. Trop. Med. Hyg. 67 (3):289-295.
Radwanska M., Magez S., Perry-O'Keefe H., Stender H., Coull J., Sternberg J.M., Büscher P. and Hyldig-Nielsen J.J. (2002c). Direct detection and identification of African trypanosomes by fluorescence in situ hybridization with peptide nucleic acid probes. J. Clin. Microbiol. 40 (11):4295-4297.
Rasnik I., McKinney S.A. and Ha T. (2006). Nonblinking and longlasting single-molecule fluorescence imaging. Nat. Methods 3 (11):891-893.
Raz B., Iten M., GretherBuhler Y., Kaminsky R. and Brun R. (1997). The Alamar Blue® assay to determine drug sensitivity of African trypanosomes (T. b. rhodesiense and T. b. gambiense) in vitro. Acta Trop. 68 (2):139-147.
Rebeski D.E., Winger E.M., Van Rooij E.M.A., Schöchl R., Schuller W., Dwinger R.H., Crowther J.R. and Wright P. (1999). Pitfalls in the application of enzyme-linked immunoassays for the detection of circulating trypanosomal antigens in serum samples. Parasitol. Res. 85 (7):550-556.
Remme J.H.F., Blas E., Chitsulo L., Desjeux P.M.P., Engers H.D., Kanyok T.P., Kayondo J.F.K., Kioy D.W., Kumaraswami V., Lazdins J.K., Nunn P.P., Oduola A., Ridley R.G., Toure Y.T., Zicker F. and Morel C.M. (2002). Strategic emphases for tropical diseases research: a TDR perspective. Trends Microbiol. 10 (10):435-440.
Reyna-Bello A., García F.A., Rivera M., Sansó B. and Aso P.M. (1998). Enzyme-linked immunosorbent assay (ELISA) for detection of anti-Trypanosoma evansi equine antibodies. Vet. Parasitol. 80 (2):149-157.
Riccardi C. and Nicoletti I. (2006). Analysis of apoptosis by propidium iodide staining and flow cytometry. Nat. Protoc. 1 (3):1458-1461.
Rickman L.R. and Robson J. (1970). The testing of proven Trypanosoma brucei and T. rhodesiense strains by the blood incubation infectivity test. Bull. World Health Organ. 42 (6):911-916.
Rifkin M.R. (1983). Interaction of high-density lipoprotein with Trypanosoma brucei: effect of membrane stabilizers. J. Cell. Biochem. 23 (1-4):57-70.

References, 207
Ripamonti D., Massari M., Arici C., Gabbi E., Farina C., Brini M., Capatti C. and Suter F. (2002). African sleeping sickness in tourists returning from Tanzania: the first 2 Italian cases from a small outbreak among European travelers. Clin. Infect. Dis. 34 (1):E18-E22.
Robays J., Bilengue M.M.C., Van der Stuyft P. and Boelaert M. (2004). The effectiveness of active population screening and treatment for sleeping sickness control in the Democratic Republic of Congo. Trop. Med. Int. Health 9 (5):542-550.
Robertson J.B., Zhang Y. and Johnson C.H. (2009). Light-emitting diode flashlights as effective and inexpensive light sources for fluorescence microscopy. J. Microsc. 236 (1):1-4.
Rodgers J. (2009). Human African trypanosomiasis, chemotherapy and CNS disease. J. Neuroimmunol. 211 (1-2):16-22.
Rodrigues C.O., Scott D.A. and Docampo R. (1999). Characterization of a vacuolar pyrophosphatase in Trypanosoma brucei and its localization to acidocalcisomes. Mol. Cell. Biol. 19 (11):7712-7723.
Rosenblatt J.E. (2009). Laboratory diagnosis of infections due to blood and tissue parasites. Clin. Infect. Dis. 49 (7):1103-1108.
Ruiz J.A., Simarro P.P. and Josenando T. (2002). Control of human African trypanosomiasis in the Quiçama focus, Angola. Bull. World Health Organ. 80 (9):738-745.
Sachs R. (1984). The superiority of the miniature anion-exchange centrifugation technique for detecting low grade trypanosome parasitaemias. Trans. R. Soc. Trop. Med. Hyg.78 (5):694-696.
Sambrook J. and Russell D.W. (2001). Molecular cloning: a laboratory manual, 3rd edition, Cold Spring Harbor Laboratory Press, New York, prot. 6.33-6.64.
Sanborn W.R., Heuck C.C., El Aouad R. and Storch W.B. Fluorescence microscopy for disease diagnosis and environmental monitoring. WHO Publications, Eastern Mediterranean Series 28, Cairo, 2005.
Schmid C., Richer M., Bilenge C.M.M., Josenando T., Chappuis F., Manthelot C.R., Nangouma A., Doua F., Asumu P.N., Simarro P.P. and Burri C. (2005). Effectiveness of a 10-day melarsoprol schedule for the treatment of late-stage human African trypanosomiasis: confirmation from a multinational study (IMPAMEL II). J. Infect. Dis. 191 (11):1922-1931.
Schnaufer A., Domingo G.J. and Stuart K. (2002). Natural and induced dyskinetoplastic trypanosomatids: how to live without mitochondrial DNA. Int. J. Parasitol. 32 (9):1071-1084.
Scott A.G., Tait A. and Turner C.M.R. (1996). Characterisation of cloned lines of Trypanosoma brucei expressing stable resistance to MelCy and suramin. Acta Trop. 60 (4):251-262.
Shahi S.K., Krauth-Siegel R.L. and Clayton C.E. (2002). Overexpression of the putative thiol conjugate transporter TbMRPA causes melarsoprol resistance in Trypanosoma brucei. Mol. Microbiol. 43 (5):1129-1138.
Shaner N.C., Campbell R.E., Steinbach P.A., Giepmans B.N.G., Palmer A.E. and Tsien R.Y. (2004). Improved monomeric red, orange and yellow fluorescent proteins derived from Discosoma sp. red fluorescent protein. Nat. Biotechnol. 22 (12):1567-1572.
Shaner N.C., Steinbach P.A. and Tsien R.Y. (2005). A guide to choosing fluorescent proteins. Nat. Methods 2 (12):905-909.

References, 208
Shapiro H.M. and Perlmutter N.G. (2008). Killer applications: toward affordable rapid cell-based diagnostics for malaria and tuberculosis. Cytometry B Clin. Cytom. 74 (Supp. l.1):S152-164.
Shapiro T.A. and Englund P.T. (1990). Selective cleavage of kinetoplast DNA minicircles promoted by antitrypanosomal drugs. Proc. Nat. Acad. Sci. USA 87 (3):950-954.
Shen S.Y., Arhin G.K., Ullu E. and Tschudi C. (2001). In vivo epitope tagging of Trypanosoma brucei genes using a one step PCR-based strategy. Mol. Biochem. Parasitol. 113 (1):171-173.
Shimamura M., Hager K.M. and Hajduk S.L. (2001). The lysosomal targeting and intracellular metabolism of trypanosome lytic factor by Trypanosoma brucei brucei. Mol. Biochem. Parasitol. 115 (2):227-237.
Simarro P.P., Franco J.R., Ndongo P., Nguema E., Louis F.J. and Jannin J. (2006). The elimination of Trypanosoma brucei gambiense sleeping sickness in the focus of Luba, Bioko Island, Equatorial Guinea. Trop. Med. Int. Health 11 (5):636-646.
Simarro P.P., Jannin J. and Cattand P. (2008). Eliminating human African trypanosomiasis: Where do we stand and what comes next? PLoS Med. 5 (2):174-180.
Simarro P.P., Ruiz J.A., Franco J.R. and Josenando T. (1999). Attitude towards CATT-positive individuals without parasitological confirmation in the African Trypanosomiasis (T. b. gambiense) focus of Quiçama (Angola). Trop. Med. Int. Health 4 (12):858-861.
Simpson L. and Shaw J. (1989). RNA editing and the mitochondrial cryptogenes of kinetoplastid protozoa. Cell 57 (3):355-366.
Sinha A., Grace C., Alston W.K., Westenfeld F. and Maguire J.H. (1999). African trypanosomiasis in two travelers from the United States. Clin. Infect. Dis. 29 (4):840-844.
Small G.M., Imanaka T. and Lazarow P.B. (1988). Immunoblotting of hydrophobic integral membrane proteins. Anal. Biochem. 169 (2):405-409.
Smith D.H., Pepin J. and Stich A.H.R. (1998). Human African trypanosomiasis: an emerging public health crisis. Br. Med. Bull. 54 (2):341-355.
Snaith H. A., Samejima I. and Sawin K.E. (2005). Multistep and multimode cortical anchoring of tea1p at cell tips in fission yeast. EMBO J. 24 (21):3690-3699.
Sodeman T.M. (1970). Use of fluorochromes for detection of malaria parasites. Am. J. Trop. Med. Hyg. 19 (1):40-42.
Solano P., Jamonneau V., N'Guessan P., N'Dri L., Dje N.N., Miezan T.W., Lejon V., Buscher P. and Garcia A. (2002). Comparison of different DNA preparation protocols for PCR diagnosis of Human African Trypanosomosis in Côte d'Ivoire. Acta Trop. 82 (3):349-356.
Steingart K.R., Henry M., Ng V., Hopewell P.C., Ramsay A., Cunningham J., Urbanczik R., Perkins M., Aziz M.A. and Pai M. (2006). Fluorescence versus conventional sputum smear microscopy for tuberculosis: a systematic review. Lancet Infect. Dis. 6 (9):570-581.
Steverding D. (2006). A new initiative for the development of new diagnostic tests for human African trypanosomiasis. Kinetoplastid Biol. Dis. 5:1.
Stewart M.L., Bueno G.J., Baliani A., Klenke B., Brun R., Brock J.M., Gilbert I.H. and Barrett M.P. (2004). Trypanocidal activity of melamine-based nitroheterocycles. Antimicrob. Agents Chemother. 48 (5):1733-1738.
References, 209
Stewart M.L., Burchmore R.J., Clucas C., Hertz-Fowler C., Brook K., Tait A., MacLeod A., Turner C.M., de Koning H.P., Wong P.E. and Barrett M.P. (2010). Multiple genetic mechanisms lead to the loss of functional TbAT1 expression in drug resistant trypanosomes. Eukaryot. Cell 9 (2):336-343.
Stewart M.L., Krishna S., Burchmore R.J.S., Brun R., de Koning H.P., Boykin D.W., Tidwell R.R., Hall J.E. and Barrett M.P. (2005). Detection of arsenical drug resistance in Trypanosoma brucei with a simple fluorescence test. Lancet 366 (9484):486-487.
Stich A., Abel P.M. and Krishna S. (2002). Human African trypanosomiasis. BMJ 325 (7357):203-206.
Stich A., Barrett M.P. and Krishna S. (2003). Waking up to sleeping sickness. Trends Parasitol. 19 (5):195-197.
Sturk L.M., Brock J.L., Bagnell C.R., Hall J.E. and Tidwell R.R. (2004). Distribution and quantitation of the anti-trypanosomal diamidine 2,5-bis(4-amidinophenyl)furan (DB75) and its N-methoxy prodrug DB289 in murine brain tissue. Acta Trop. 91 (2):131-143.
Suzuki H., Futsuhara Y., Takaiwa F. and Kurata N. (1991). Localization of glutelin gene in rice chromosome by in situ hybridization. Jpn. J. Genet. 66 (3):305-312.
Suzuki T., Fujikura K., Higashiyama T. and Takata K. (1997). DNA staining for fluorescence and laser confocal microscopy. J. Histochem. Cytochem. 45 (1):49-53.
Suzuki T., Matsuzaki T., Hagiwara H., Aoki T and Takara K. (2007). Recent advances in fluorescent labeling techniques for fluorescence microscopy. Acta Histochem. Cytochem. 40 (5):131-137.
Tanious F.A., Veal J.M., Buczak H., Ratmeyer L.S., Wilson W.D. (1992). DAPI (4',6-Diamidino-2-phenylindole) binds differently to DNA and RNA: minor-groove binding at AT sites and intercalation at AU sites. Biochemistry 31 (12):3103-3112.
Taylor A.E.R. (1960). Absorption of prothidium by Trypanosoma rhodesiense. Br. J. Pharmacol. Chemother. 15 (2):230-234.
Thekisoe O.M.M., Bazie R.S.B., Coronel-Servian A.M., Sugimoto C., Kawazu S. and Inoue N. (2009). Stability of loop-mediated isothermal amplification (LAMP) reagents and its amplification efficiency on crude trypanosome DNA templates. J. Vet. Med. Sci. 71 (4):471-475.
Thekisoe O.M.M., Kuboki N., Nambota A., Fujisaki K., Sugimoto C., Igarashi I., Yasuda J. and Inoue N. (2007). Species-specific loop-mediated isothermal amplification (LAMP) for diagnosis of trypanosomosis. Acta Trop. 102 (3):182-189.
Thuita J.K., Karanja S.M., Wenzler T., Mdachi R.E., Kagira J.M., Tidwell R. and Brun R. (2008). Efficacy of the diamidine DB75 and its prodrug DB289, against murine models of human African trypanosomiasis. Acta Trop. 108 (1):6-10.
Tomita G. (1967). Fluorescence-excitation spectra of acridine orange-DNA and -RNA systems. Biophysik 4 (1):23-29.
Torr S.J., Hargrove J.W. and Vale G.A. (2005). Towards a rational policy for dealing with tsetse. Trends Parasitol. 21 (11):537-541.
Torrea G., Chakaya J., Mayabi M. and Van Deun A. (2008). Evaluation of the FluoreslenSTM and fluorescence microscopy blinded rechecking trial, Nairobi, Kenya. Int. J. Tuberc. Lung Dis. 12 (6):658-663.
Torreele E., Bourdin B., Bray M., Tweats D., Mazué D., Dormeyer M., Colombo P., Kaiser M., Brun R. and Pécoul B. (2009). Fexinidazole: a new drug candidate for

References, 210
human African trypanosomiasis. Abstr. S52. BSP Spring & Malaria meeting, Edinburgh.
Trouiller P., Olliaro P., Torreele E., Orbinski J., Laing R. and Ford N. (2002). Drug development for neglected diseases: a deficient market and a public-health policy failure. Lancet 359 (9324):2188-2194.
Truc P., Aerts D., McNamara J.J., Claes Y., Allingham R., Le Ray D. and Godfrey D.G. (1992). Direct isolation in vitro of Trypanosoma brucei from man and other animals, and its potential value for the diagnosis of gambian trypanosomiasis. Trans. R. Soc. Trop. Med. Hyg. 86 (6):627-629.
Truc P., Jamonneau V., Cuny G., and Frézil J.L. (1999). Use of polymerase chain reaction in human African trypanosomiasis stage detection and follow-up. Bull. World Health Organ. 77 (9):745-748.
Truc P., Jamonneau V., N’Guessan P., Diallo P.B. and Garcia A. (1998a). Parasitological diagnosis of human African trypanosomiasis: a comparison of the QBC® and miniature anion-exchange centrifugation techniques. Trans. R. Soc. Trop. Med. Hyg. 92 (3):288-289.
Truc P., Jamonneau V., N'Guessan P., N'Dri L., Diallo P.B. and Butigieg X. (1998b). Simplification of the miniature anion-exchange centrifugation technique for the parasitological diagnosis of human African trypanosomiasis. Trans. R. Soc. Trop. Med. Hyg. 92 (5):512.
Truc P., Jamonneau V., N'Guessan P., N'Dri L., Diallo P.B. and Cuny G. (1998c). Trypanosoma brucei ssp. and T. congolense: mixed human infection in Cote d'Ivoire. Trans. R. Soc. Trop. Med. Hyg. 92 (5):537-538.
Truc P., Lejon V., Magnus E., Jamonneau V., Nangouma A., Verloo D., Penchenier L. and Büscher P. (2002). Evaluation of the micro-CATT/Trypanosoma brucei gambiense, and LATEX/T. b. gambiense methods for serodiagnosis and surveillance of human African trypanosomiasis in West and Central Africa. Bull. World Health Organ. 80 (11):882-886.
Tye C.K., Kasinathan G., Barrett M.P., Brun R., Doyle V.E., Fairlamb A.H., Weaver R. and Gilbert I.H. (1998). An approach to use an unusual adenosine transporter to selectively deliver polyamine analogues to trypanosomes. Bioorg. Med. Chem. Lett. 8 (7):811-816.
Uilenberg G. (adapted from the original edition by W.P. Boyt). A field guide for the diagnosis, treatment and prevention of African animal trypanosomosis. FAO, Rome, 1998.
Valnes K. and Brandtzaeg P. (1985). Retardation of immunofluorescence fading during microscopy. J. Histochem. Cytochem. 33 (8):755-761.
Van Meirvenne N., Magnus E., Büscher P. (1995). Evaluation of variant specific trypanolysis tests for serodiagnosis of human infections with Trypanosoma brucei gambiense. Acta Trop. 60 (3):189-199.
Vanhecke C., Guevart E., Ezzedine K., Receveur M.C., Jamonneau V., Bucheton B., Camara M., Vincendau P. and Malvy D. (2010). La trypanosomose humaine africaine en faciès épidémiologique de mangrove. Présentation, déterminants et prise en charge dans le contexte de la Guinée (2005 à 2007). Pathol. Biol.(Paris) 58 (1):110-116.
Vercesi A.E., Moreno S.N.J. and Docampo R. (1994). Ca2+/H+ exchange in acidic vacuoles of Trypanosoma brucei. Biochem. J. 304 (Pt 1):227-233.

References, 211
Vickerman K. (1977). The dyskinetoplasty mutation in Trypanosoma evansi and other flagellates. Protozoology 3:57-69.
Vincendeau P. and Bouteille B. (2006). Immunology and immunopathology of African trypanosomiasis. An. Acad. Bras. Cienc. 78 (4):645-665.
Vogelsang J., Kasper R., Steinhauer C., Person B., Heilemann M., Sauer M. and Tinnefeld P. (2008). A reducing and oxidizing system minimizes photobleaching and blinking of fluorescent dyes. Angew. Chem. Int. Ed. Engl. 47 (29):5465-5469.
Vreysen M.J. (2001). Principles of area-wide integrated tsetse fly control using the sterile insect technique. Med. Trop. 61 (4-5):397-411.
Wang Y.L., Utzinger J., Saric J., Li J.V., Burckhardt J., Dirnhofer S., Nicholson J.K., Singer B.H., Brun R. and Holmes E. (2008). Global metabolic responses of mice to Trypanosoma brucei brucei infection. Proc. Natl. Acad. Sci. U S A 105 (16):6127-6132.
Waring M.J. (1965). Complex formation between ethidium bromide and nucleic acids. J. Mol. Biol. 13 (1):269-282.
Watson J.V. and Chambers S.H. (1977). Fluorescence discrimination between diploid cells on their RNA content: possible distinction between clonogenic and non-clonogenic cells. Br. J. Cancer 36 (5):592-600.
Welburn S.C., Fèvre E.M., Coleman P.G., Odiit M. and Maudlin I. (2001a). Sleeping sickness: a tale of two diseases. Trends Parasitol. 17 (1):19-24.
Welburn S.C., Maudlin I. and Simarro P.P. (2009). Controlling sleeping sickness-a review. Parasitology 136 (14):1943-1949.
Welburn S.C., Picozzi K., Fevre E.M., Coleman P.G., Odiit M., Carrington M. and Maudlin I. (2001b). Identification of human-infective trypanosomes in animal reservoir of sleeping sickness in Uganda by means of serum-resistance-associated (SRA) gene. Lancet 358 (9298):2017-2019.
Wenzler T., Boykin D.W., Ismail M.A., Hall J.E., Tidwell R.R. and Brun R. (2009). New treatment option for second-stage African sleeping sickness: in vitro and in vivo efficacy of aza analogs of DB289. Antimicrob. Agents Chemother. 53 (10): 4185-4192.
WHO (1998). Control and surveillance of African trypanosomiasis. WHO Technical Report Series. 881:1-113.
WHO (2006a). Development and evaluation of new diagnostic tests for human African trypanosomiasis. Wkly. Epidemiol. Rec. 81 (6):59-60.
WHO (2006b). Human African trypanosomiasis (sleeping sickness): epidemiological update. Wkly. Epidemiol. Rec. 81 (8):71-80.
WHO. Report of the scientific working group on African trypanosomiasis, Geneva, 4-8 June, 2001.
Widener J., Nielsen M. J., Shiflett A., Moestrup S. K. and Hajduk S. (2007). Hemoglobin is a co-factor of human trypanosome lytic factor. PLoS Pathog. 3 (9):1250-1261.
Widengren J., Chmyrov A., Eggeling C., Löfdahl P.A. and Seidel C.A.M. (2007). Strategies to improve photostabilities in ultrasensitive fluorescence spectroscopy. J. Phys. Chem. A. 111 (3):429-440.
Wilkes J.M., Peregrine A.S. and Zilberstein D. (1995). The accumulation and compartmentalization of isometamidium chloride in Trypanosoma congolense, monitored by its intrinsic fluorescence. Biochem. J. 312 (Pt 1):319-327.

References, 212
Wilson W.D., Nguyen B., Tanious F.A., Mathis A., Hall J.E., Stephens C.E. and Boykin D.W. (2005). Dications that target the DNA minor groove: compound design and preparation, DNA interactions, cellular distribution and biological activity. Curr. Med. Chem. Anticancer Agents 5 (4):389-408.
Wirtz E. and Clayton C. (1995). Inducible gene expression in trypanosomes mediated by a prokaryotic repressor. Science 268 (5214):1179-1183.
Wirtz E., Hoek M. and Cross G.A.M. (1998). Regulated processive transcription of chromatin by T7 RNA polymerase in Trypanosoma brucei. Nucleic Acids Res. 26 (20):4626-4634.
Wongsrichanalai C., Pornsilapatip J., Namsiripongpun V., Webster H.K., Luccini A., Pansamdang P., Wilde H. and Prasittisuk M. (1991). Acridine orange fluorescent microscopy and the detection of malaria in populations with low-density parasitemia. Am. J. Trop. Med. Hyg. 44 (1):17-20.
Woo P.T. (1970). The haematocrit centrifuge technique for the diagnosis of African trypanosomiasis. Acta Trop. 27 (4): 384-386.
Yamashiro D. and Li C.H. (1973). Adrenocorticotropins. 44. Total synthesis of the human hormone by the solid-phase method. J. Am. Chem. Soc. 95 (4):1310-1315.
Yeramian P., Meshnick S.R., Krudsood S., Chalermrut K., Silachamroon U., Tangpukdee N., Allen J., Brun R., Kwiek J.J., Tidwell R. and Looareesuwan S. (2005). Efficacy of DB289 in Thai patients with Plasmodium vivax or acute, uncomplicated Plasmodium falciparum infections. J. Infect. Dis. 192 (2):319-322.
Yuste R. (2005). Fluorescence microscopy today. Nat. Methods 2 (12):902-904.
Zelenin A.V. (1966). Fluorescence microscopy of lysosomes and related structures in living cells. Nature 212 (5060):425-426.
Zelenin A.V. (1999). Acridine orange as probe for cell and molecular biology. In: Fluorescent and luminescent probes for biological activity, 2nd edition (ed.: W.T. Mason), Academic Press, London, pp 117-135.
Zilberstein D., Wilkes J., Hirumi H. and Peregrine A.S. (1993). Fluorescence analysis of the interaction of isometamidium with Trypanosoma congolense. Biochem. J. 292 (Pt 1):31-35.
Zillmann U., Konstantinov S.M., Berger M.R. and Braun R. (1996). Improved performance of the anion-exchange centrifugation technique for studies with human infective African trypanosomes. Acta Trop. 62 (3):183-187.