geo/oc 103 exploring the deep… lab 6dusk.geo.orst.edu/oceans/lab_docs/103lab6.pdf · exploring...
TRANSCRIPT

GEO/OC 103 Exploring the Deep…
Lab 6

Exploring the Dynamic Earth Unit 5 – Tsunami Hazards
Unit 5
Tsunami HazardsIn this unit, you will
• Analyze two major tsunami events in detail.
• Discover the eff ects tsunamis have on communities and how communities can prepare for them.
• Examine tsunami trigger events and develop criteria for issuing tsunami warnings.
A major earthquake off the coast of Chile on May 22, 1960 produced a tsunami that affected the entire Pacific Basin. In Hilo, Hawaii — 10,000 km from the earthquake — the tsunami caused 61 deaths and $24 million in property damage. Frame buildings were either crushed or floated off their foundations, and only buildings of reinforced concrete or structural steel remained standing.
NO
AA
/NG
DC
/Sunset New
spap
er
113

Exploring the Dynamic Earth Unit 5 – Tsunami Hazards
IntroductionLife on Earth evolved in the protective environment of its oceans. To this day, humankind continues to take advantage of the benefi ts of living along the shore. Moderate temperatures, abundant food, and easy transportation are all provided courtesy of our planet’s seas and oceans. Living near the ocean is not without its perils though. Perhaps the most unpredictable and terrifying of these hazards is the tsunami.
A tsunami is a series of large waves created when a disturbance displaces, or moves, an enormous volume of ocean water. Th e waves of a tsunami spread outward from their source at very high speed. Th is means that tsunamis can cross an entire ocean in a matter of hours, making them a truly global hazard for coastal communities.
Tsunamis are a special class of waves called shallow-water waves. Th e speed at which they travel is proportional to the depth of the water. In the open ocean, tsunamis move very fast but have wave heights of m or less. As the water shallows near coastlines, the speed of the waves decreases while their height increases. When the waves reach the shore, they may be tens or, in extreme cases, hundreds of meters high.
Two measurements are used to describe the eff ect of tsunamis on the coastline.
• Run-up is the maximum height of the tsunami wave above normal tide level.
• Run-in is a measure of how far inland the wave reaches beyond the normal shoreline.
Tsunami magnitude scaleTsunami researchers have developed a scale, based on the run-up height, for describing the intensity of a tsunami.
Intensity Run-up height
m
Description Frequency in Pacifi c Ocean
4 16 Disastrous. Near complete destruc-
tion of man-made structures.
1 in 10 years
3 8 Very large. General fl ooding, heavy
damage to shoreline structures.
1 in 3 years
2 4 Large. Flooding of shore, light
damage to structures.
1 per year
1 2 Moderate. Flooding of gently sloping
coasts, slight damage.
1 per
8 months
Where tsunamis occurIn the Pacifi c Ocean, where the majority of tsunamis occur, the historical record shows extensive loss of life and property. Japan, in particular, has repeatedly seen entire towns and cities wiped out by tsunamis, most recently in .
Most coastal communities have some degree of tsunami risk, but the chart shows that tsunamis are far more common in Pacifi c coastal areas than on the U.S. East Coast. Th is is because earthquakes and volcanoes, the features that most commonly cause tsunamis, occur more often in the Pacifi c Basin than in the Atlantic Basin.
Reading 5.3
Analysis of a tsunami
Tsunami magnitude (similar to earthquake intensity) is a measure of the local size of a tsunami.
38
1513 12
9 7 6 6 5 0
Japan
New Guinea
Indonesia
HawaiiChile
Alaska
Australia
West
Coast of U
.S.
Medite
rranean Coast
East Coast
of U.S.
Who’s at risk?
Number of tsunamis over1 meter in height per century
Data source - N
GD
C
sea level run-in
run-up
Analysis of a tsunami 127

Exploring the Dynamic Earth Unit 5 – Tsunami Hazards
Tsunamis of all sizesTsunamis occur at various scales, depending on the magnitude of the event that triggers them, the location, and the surrounding topography.
• Local tsunamis aff ect an area within km of their source.
• Regional tsunamis aff ect an area within about km of their source.
• Teletsunamis travel great distances (over km), often across entire oceans.
What causes tsunamis?Th ere are four types of events capable of producing tsunamis: earthquakes, volcanoes, landslides, and asteroid impacts.
Earthquakes — Normally, only large earthquakes in or near ocean basins produce tsunamis. Of these, only the strongest — magnitude and higher — create teletsunamis. However, smaller earthquakes sometimes indirectly cause tsunamis by triggering landslides.
Volcanoes — Some of the most devastating tsunamis in recorded history occurred during the eruption of the volcano Krakatoa. Tsunamis with -m run-ups destroyed coastal villages on the Indonesian islands of Java and Sumatra, killing over , people. Th e tsunami formed when the volcano either collapsed into its magma chamber or exploded, creating a - by -km crater. Seawater quickly fi lled the void, then sloshed outward as an enormous and deadly tsunami.
Landslides — Th e movement of rocks and soil can displace large volumes of water, creating a tsunami. Th ese landslides can develop on land and fall into the water or take place completely underwater. One of the highest tsunamis in modern history occurred in Lituya Bay, Alaska when a magnitude 8.3 earthquake triggered a landslide that fell into the nearly enclosed bay. Th e slide created a tsunami splash wave that washed 524 m (1720 ft) over a ridge on the opposite side of the bay.
Scientists are also investigating submarine landslides for their tsunami-causing potential. Far more massive than terrestrial landslides, underwater landslides off the Hawaiian Islands have sent thousands of cubic kilometers of material sliding almost km from their source.
Krakatau, Indonesia
VerlatenIsland
LangIsland
Krakatau Island
Anak Krakatau
Island before August 26, 1883
0 5 kilometers
0 3 miles
Lyn Topinka, U
SGS/C
VO
Sumatra
Krakatoa (Krakatau) sits in the Sunda Strait, a major shipping lane between the Indian Ocean and the Java Sea.
Landsat 7/USG
S
USG
S
This map explains the prevalence of tsunamis in the Pacifi c Ocean. The red lines are subduction zones, where one tectonic plate is plunging beneath another. Earthquakes and volcanoes, two common triggers for tsunami events, are typical features of subduction zones.
Diagram of the July 9, 1958 Lituya Bay landslide that produced a 524-m (1720-ft) local tsunami, the highest in historical times.
GlacialValley
Area ofLandslide
Hillside scoured by splash waveHillside scoured by splash wave
Area ofLandslide
Dr. C
harles Mader/The Tsunam
i Society
128 Analysis of a tsunami
Exploring the Dynamic Earth Unit 5 – Tsunami Hazards
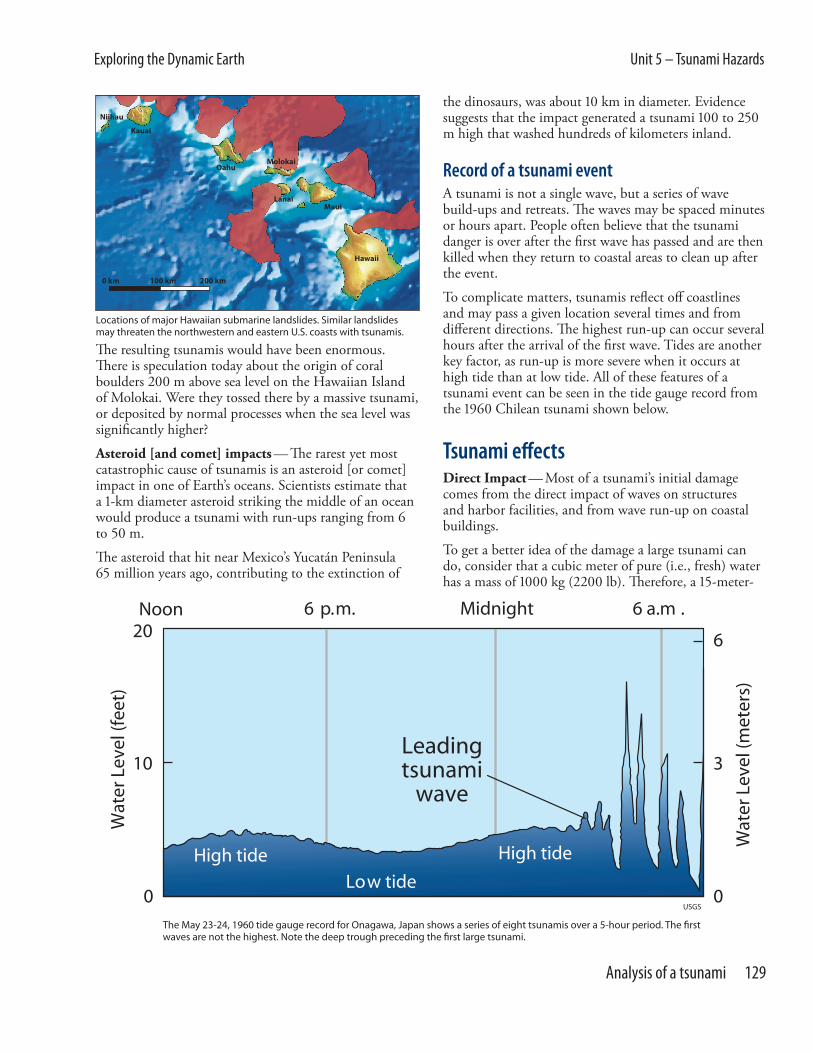
Th e resulting tsunamis would have been enormous. Th ere is speculation today about the origin of coral boulders m above sea level on the Hawaiian Island of Molokai. Were they tossed there by a massive tsunami, or deposited by normal processes when the sea level was signifi cantly higher?
Asteroid [and comet] impacts — Th e rarest yet most catastrophic cause of tsunamis is an asteroid [or comet] impact in one of Earth’s oceans. Scientists estimate that a -km diameter asteroid striking the middle of an ocean would produce a tsunami with run-ups ranging from to m.
Th e asteroid that hit near Mexico’s Yucatán Peninsula million years ago, contributing to the extinction of
the dinosaurs, was about km in diameter. Evidence suggests that the impact generated a tsunami to m high that washed hundreds of kilometers inland.
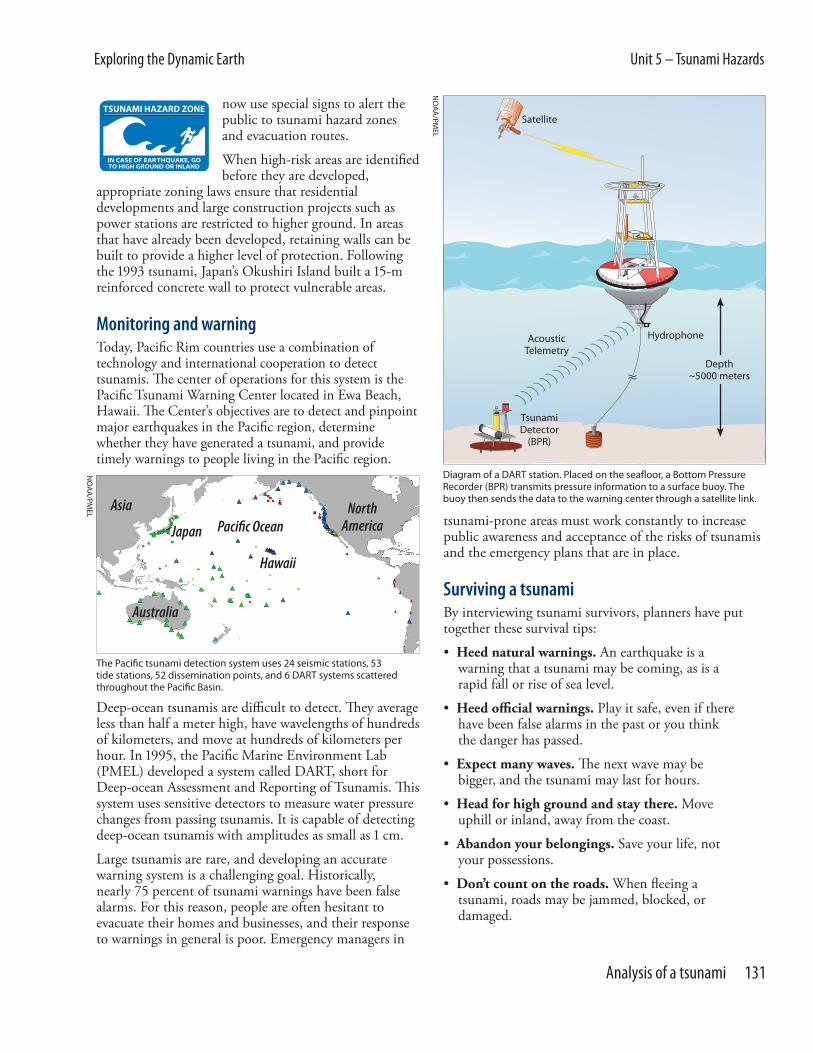
Record of a tsunami eventA tsunami is not a single wave, but a series of wave build-ups and retreats. Th e waves may be spaced minutes or hours apart. People often believe that the tsunami danger is over after the fi rst wave has passed and are then killed when they return to coastal areas to clean up after the event.
To complicate matters, tsunamis refl ect off coastlines and may pass a given location several times and from diff erent directions. Th e highest run-up can occur several hours after the arrival of the fi rst wave. Tides are another key factor, as run-up is more severe when it occurs at high tide than at low tide. All of these features of a tsunami event can be seen in the tide gauge record from the Chilean tsunami shown below.
Tsunami eff ectsDirect Impact — Most of a tsunami’s initial damage comes from the direct impact of waves on structures and harbor facilities, and from wave run-up on coastal buildings.
To get a better idea of the damage a large tsunami can do, consider that a cubic meter of pure (i.e., fresh) water has a mass of kg ( lb). Th erefore, a -meter-
The May 23-24, 1960 tide gauge record for Onagawa, Japan shows a series of eight tsunamis over a 5-hour period. The fi rst waves are not the highest. Note the deep trough preceding the fi rst large tsunami.
USGS
Locations of major Hawaiian submarine landslides. Similar landslides may threaten the northwestern and eastern U.S. coasts with tsunamis.
Niihau
Kauai
Oahu
Hawaii
Maui
Molokai
Lanai
0 km 100 km 200 km
Analysis of a tsunami 129

Exploring the Dynamic Earth Unit 5 – Tsunami Hazards
high tsunami with a wavelength of m would hit a -m length of seawall with a -million-kg (-million-lb) wedge of water — enough to do incredible damage. Debris caught in the backwash of the leading wave makes the secondary waves even more destructive as they come ashore.
Flooding—In addition to the destructive force of the tsunamis, fl ooding can kill people, damage property, and spread pollution over a large area.
As shown in the photograph above, run-in from the Chilean tsunami extended about . km ( mi) inland over fl at coastal areas and penetrated almost km ( mi) up the river channels. Run-in is infl uenced by many factors including the run-up height, orientation relative to the coast, tidal conditions, local topography, and vegetation.
Preparing for tsunamisAlthough we cannot prevent natural disasters from occurring, we can reduce their damaging eff ects through eff ective planning. Scientists and planners are working to improve our ability to detect tsunamis and issue accurate and timely warnings, to respond appropriately when they occur, and to avoid hazardous situations wherever possible.
Planning aheadUsing historical and geological records, planners can predict where and how often tsunami trigger events are likely to occur. Simulating these events using
mathematical models allows them to “see” the eff ects of tsunamis before they occur and to take corrective measures. Many coastal communities are developing tsunami preparedness plans using inundation models like the one shown below. Public education programs are a big part of these plans. For example, some communities
USG
S
Markings on this 1944 photograph of the area surrounding the mouth of Río Maullín on the Chilean coast show the extent of run-in from the 1960 tsunami. The triangle symbols are labeled with the maximum run-up, in feet, and the diamond symbols indicate where fatalities occurred.
Emergency managers use mathematical modeling to create tsunami inundation maps such as this. Areas prone to fl ooding are shown in orange, and roads and highways usable as evacuation routes are in white.
Tsunami Inundation MapNewport, Oregon
Pacifi cOcean
Yaquina Bay
Highway 101
Highway 101
InundationZone
Oregon D
epartm
ent of Geology/N
OA
A/PM
EL
130 Analysis of a tsunami
Exploring the Dynamic Earth Unit 5 – Tsunami Hazards
now use special signs to alert the public to tsunami hazard zones and evacuation routes.
When high-risk areas are identifi ed before they are developed,
appropriate zoning laws ensure that residential developments and large construction projects such as power stations are restricted to higher ground. In areas that have already been developed, retaining walls can be built to provide a higher level of protection. Following the tsunami, Japan’s Okushiri Island built a -m reinforced concrete wall to protect vulnerable areas.
Monitoring and warningToday, Pacifi c Rim countries use a combination of technology and international cooperation to detect tsunamis. Th e center of operations for this system is the Pacifi c Tsunami Warning Center located in Ewa Beach, Hawaii. Th e Center’s objectives are to detect and pinpoint major earthquakes in the Pacifi c region, determine whether they have generated a tsunami, and provide timely warnings to people living in the Pacifi c region.
Deep-ocean tsunamis are diffi cult to detect. Th ey average less than half a meter high, have wavelengths of hundreds of kilometers, and move at hundreds of kilometers per hour. In , the Pacifi c Marine Environment Lab (PMEL) developed a system called DART, short for Deep-ocean Assessment and Reporting of Tsunamis. Th is system uses sensitive detectors to measure water pressure changes from passing tsunamis. It is capable of detecting deep-ocean tsunamis with amplitudes as small as cm.
Large tsunamis are rare, and developing an accurate warning system is a challenging goal. Historically, nearly percent of tsunami warnings have been false alarms. For this reason, people are often hesitant to evacuate their homes and businesses, and their response to warnings in general is poor. Emergency managers in
tsunami-prone areas must work constantly to increase public awareness and acceptance of the risks of tsunamis and the emergency plans that are in place.
Surviving a tsunamiBy interviewing tsunami survivors, planners have put together these survival tips:
• Heed natural warnings. An earthquake is a warning that a tsunami may be coming, as is a rapid fall or rise of sea level.
• Heed offi cial warnings. Play it safe, even if there have been false alarms in the past or you think the danger has passed.
• Expect many waves. Th e next wave may be bigger, and the tsunami may last for hours.
• Head for high ground and stay there. Move uphill or inland, away from the coast.
• Abandon your belongings. Save your life, not your possessions.
• Don’t count on the roads. When fl eeing a tsunami, roads may be jammed, blocked, or damaged.
The Pacifi c tsunami detection system uses 24 seismic stations, 53 tide stations, 52 dissemination points, and 6 DART systems scattered throughout the Pacifi c Basin.
NO
AA
/PMEL
Pacifi c Ocean
Hawaii
North America
Australia
Japan
Asia
T s U N AMI
TS
U N A M I
AcousticTelemetry
TsunamiDetector
(BPR)
Satellite
Hydrophone
Depth~5000 meters
Diagram of a DART station. Placed on the seafl oor, a Bottom Pressure Recorder (BPR) transmits pressure information to a surface buoy. The buoy then sends the data to the warning center through a satellite link.
NO
AA
/PMEL
Analysis of a tsunami 131

Exploring the Dynamic Earth Unit 5 – Tsunami Hazards
• Go to an upper fl oor or roof of a building. If you are trapped and unable to reach high ground, go to an upper story of a sturdy building or get on its roof.
• Climb a tree. As a last resort, if you’re trapped on low ground, climb a strong tree.
• Climb onto something that fl oats. If you are swept up by a tsunami, look for something to use as a raft.
• Expect company. Be prepared to shelter your neighbors.
Excerpted from U.S. Geological Survey Circular 1187.
132 Analysis of a tsunami

Exploring the Dynamic Earth Unit 5 – Tsunami Hazards
Questions . What country is most at risk from tsunamis? Why is this?
Japan has the highest risk from tsunamis. It is an island country with a high population density and is located on the edge of the Pacifi c Rim, in a region with very high seismic activity.
. Why doesn’t the East Coast of the U.S. experience tsunamis more often? Are tsunamis possible there?
Most of the seismic activity in and around the Atlantic Ocean is too weak to trigger tsunamis. There are no subduction zones to produce these large earthquakes (magnitude ≥ 6.75) with off sets of the ocean fl oor. Still, tsunamis triggered by other sources, such as underwater landslides and asteroid or comet impacts, are possible in the Atlantic Ocean.
. Over geological time, what has caused the most destructive tsunamis in the Hawaiian Islands?
The most destructive local tsunamis are caused by underwater landslides. Although they don’t occur as frequently as earthquake-generated tsunamis, they can be much more devastating.
. How often do devastating tsunamis with run-ups of m or more occur in the Pacifi c Basin?
Devastating tsunamis occur about once every 10 years in the Pacifi c Basin.
. Why is the fi rst wave of a tsunami often not the most dangerous?
The leading wave of a tsunami contains much less debris and may be smaller than the waves that follow. Waves refl ected off coastlines may join, causing the following waves to be higher than expected.
. Why are tsunamis diffi cult to detect in the open ocean?
In the open ocean, tsunamis average only about 40 cm (16 in) tall, are spread over hundreds of kilometers, and move very fast.
. How can a community prepare for a tsunami?
Answers will vary. Communities can prepare for tsunamis in many ways, including reinforcing structures in coastal areas; planning and marking evacuation routes; educating the public; conducting emergency response drills; and developing and enforcing zoning laws.
. When is it safe to return to coastal areas after a tsunami?
It is safe to return to coastal areas only after an offi cial “all clear” signal has been issued.
Analysis of a tsunami 133

Exploring the Dynamic Earth Unit 5 – Tsunami Hazards
The 1964 Alaska tsunami Launch ArcMap, and locate and open the etde_unit_.mxd fi le.
If you encounter unfamiliar GIS terminology or are unable to perform a task, refer to the Quick Reference Sheet in the introduction to this module.
In the Table of Contents, right-click the Alaska Tsunami data frame and choose Activate.
Expand the Alaska Tsunami data frame.
Th e Alaska earthquake was the second strongest earthquake in recorded history and the strongest to strike U.S. territory. Th e earthquake, shown with the red star symbol, caused extensive damage to Anchorage both through shaking and liquefaction (i.e., making liquid) of the soil. Th e earthquake also triggered a major tsunami that seriously impacted many coastal communities, causing fatalities as far away as Eureka, California.
Turn on the Plate Boundaries layer.
Although the epicenter of the earthquake (marked by the red star on your map) was inland, the greatest motion of the seafl oor took place some distance off shore, along the Aleutian Trench. An -km-long slab of the North American plate was thrust suddenly upward by as much as m as the Pacifi c plate plunged beneath it.
Turn on the Tsunami Source layer. Th is shows the approximate extent of the displaced seafl oor.
Turn on the Run-up Locations layer. Th is layer shows sites that recorded one or more run-up measurements from the tsunami.
To view an animation of the eff ects of the Alaska tsunami:
Select the Trigger Event layer.
Click on the trigger-event symbol (red star) using the Hyperlink tool . Be patient while the movie loads.
Use the Pause button to examine the movie at various times.
Th is movie is diff erent from others you have seen. Rather than show a simulated wave, this movie uses colors to show changes from average sea level. Light blues, oranges, and reds are higher than normal sea level; darker blues are lower than normal.
Th e digital clock at the bottom of the movie screen shows the number of hours and minutes that have passed since the trigger event. Th e movie begins minutes before the earthquake and ends almost hours later.
Use Pause and Play buttons to return to the frame where the clock reads :. Notice the long red-orange “hill” of water that forms off the Alaska coast. As the movie advances forward in time, the hill spreads out. Follow the light blue leading edge of the tsunami southward (shown as a white dashed line in the fi gure at left).
Tsunami warningInvestigation 5.4
Tracking the leading waveAt 1:09 after the earthquake event, the leading wave of a tsunami appears as a light blue arc traveling southward from the source. (The dashed white line does not appear in the movie.)
Leading wave at 1:09
NO
AA
/PMEL
Tsunami warning 135

Exploring the Dynamic Earth Unit 5 – Tsunami Hazards
Tides and tsunamisTide gauges are devices used to record changes in sea level at coastal locations. Run the movie through several more times, each time focusing your attention on the tide gauge record at Seaside, Oregon. Normal tides would create a regular, gently changing record of the water level like the one shown at left. Watch the leading wave and the tide gauge; you should be able to see the “arrival signature” of the leading wave on the tide gauge readout.
Th e arrival signature is found where the gauge readout in the movie fi rst diff ers from the plot in the sidebar to the left.
. How long did it take the leading wave to reach Seaside, Oregon?
Based on the color-coded map of water levels in the vicinity, the leading wave appears to have taken about 3.5 to 4 hours to reach Seaside. However, based on the tide gauge, it takes only about two hours to reach Seaside. The discrepancy arises because the wave actually led with a trough rather than a crest, but the color-coded map’s depth resolution is too coarse to reveal this subtle detail.
Continue the movie and watch the tide gauge. Earlier you read that tsunamis slosh around an ocean basin (like water in a bathtub). If the waves have enough energy, they can refl ect off coastlines and return at a later time. When you reach the end of the movie, answer the following questions.
. According to the tide gauge, how many secondary waves struck Seaside after the leading wave? (One wave may be very diffi cult to see in the plot.)
Answers will vary. Counting peaks, anything from 6 to 10 secondary waves is an acceptable answer. The main point is that there are many secondary waves.
. Was the leading wave the highest? If not, how many hours after the trigger event did the highest sea-level run-up occur? Th ere were actually two peak waves at Seaside; record them both.
No, the two highest run-ups hit Seaside about 8 hours after the trigger event and at about 13 or 14 hours after the trigger event.
. Based on what you’ve seen, is it safe to return to low-lying coastal areas immediately after the leading wave? Explain your answer.
Answers will vary. It’s not safe to return after the fi rst wave has passed. It is diffi cult to be sure when it is safe to return to low-lying coastal areas. Usually, 24 hours is a reasonably safe period. In some places, the “all clear” may not be given until up to 48 hours after the arrival of the leading wave.
Close the Media Viewer window when you are fi nished.
Tsunami trigger events Click the QuickLoad button .
Select Data Frames, choose Tsunami Hazards from the list, and click OK.
Tide gauge plotsTide gauge plots show the local water level at a gauge as it changes over time. A typical plot, in the absence of factors such as tsunamis, shows a gentle pattern of high and low tides that repeats with a period of around 13 hours.
This plot shows what the Seaside, Oregon tide gauge might have registered if the 1964 Alaska tsunami had never happened. The starting point and time scale of the plot are the same as the graph in the movie.
Water Level
Met
ers
from
sea
le
vel
Hours after trigger event
136 Tsunami warning

Exploring the Dynamic Earth Unit 5 – Tsunami Hazards
Now that you have an idea what tsunamis are and how they travel, you will look at the geologic trigger events that cause them. Any event that displaces a large volume of seawater can generate a tsunami. Th ese trigger events include volcanic eruptions, underwater and coastal landslides, earthquakes, and even (rarely, thank goodness) asteroid impacts. Each of the red star symbols in the Tsunami Sources layer represents an event that triggered a tsunami in the th century. Next, you will examine these data to fi nd out how common each type of trigger event is.
How often do tsunamis occur? Select the Tsunami Sources layer.
Click the Open Attribute Table button .
Read the total number of events recorded since at the bottom of the table. (Your answer will be diff erent than the example shown below.)
. What is the average number of tsunami events recorded each year? (Divide the total number of events by years.)
Average = 489 events ÷ 105 years = 4.7 events/year
What causes most tsunamis? Scroll across the table to the Event Type fi eld. Scroll down the table to see
the diff erent types of trigger events.
. What is the most common type of tsunami trigger event?
Earthquakes are, by far, the most common type of tsunami trigger event.
Close the attribute table.
Tsunami warningsNot all earthquakes produce tsunamis. It’s a good idea to warn people of an approaching tsunami, but evacuations are expensive and carry their own risks (panic, looting, etc.). Is there some minimum earthquake magnitude associated with tsunamis? To fi nd out, you will examine the Tsunami Sources layer for all events that have an earthquake magnitude greater than zero.
Click the Select By Attributes button .
To display the locations of events with magnitudes greater than zero, query the Tsunami Sources layer for (“Magnitude” > 0) as shown in steps 1-6 on the following page. Your query will actually read:
(“MAG” > 0)
read total here
Tsunami warning 137

Exploring the Dynamic Earth Unit 5 – Tsunami Hazards
If you have diffi culty entering the query statement correctly, refer to the Quickload Query described at left.
Th e tsunamis generated by earthquakes with known magnitudes are now highlighted on your map.
To fi nd magnitude statistics for these tsunamis:
Click the Statistics button in the Select By Attributes window.
In the Statistics window, calculate statistics for only selected features of the Tsunami Sources layer, using the Magnitude fi eld.
Click OK. Be patient while the statistics are calculated.
QuickLoad Query • Click the QuickLoad Query
button and select the Tsunami EQ Trigger Magnitude query.
• Click OK. • Click New.
2) Double-click Field
3) Single-click Operators
4) Update Values and Double-click Value
5) Choose Display Mode 6) Click New
1) Select Layer
Read query statement here as you enter it.
138 Tsunami warning

Exploring the Dynamic Earth Unit 5 – Tsunami Hazards
. Record the following statistics about the earthquakes that cause tsunamis.
a. Average magnitude (Mean) =
7.2
b. Highest magnitude (Maximum) =
9.6
c. Lowest magnitude (Minimum) =
3.0
Close the Statistics and Select By Attributes windows.
Click the Clear Selected Features button .
Use these statistics to help answer the following questions.
. Create a list of criteria that you would use to decide whether and when to issue a tsunami warning. Explain each of your criteria.
a. What size trigger event requires a warning? How close or how far away would it have to occur?
Answers will vary. In practice, the normal threshold for issuing a tsunami warning is an earthquake of magnitude 6.7 or greater.
b. How would your local geography fi gure into your decision?
Proximity to the ocean, likelihood of landslides, and the orientation and shape of the coastline are factors that aff ect the degree of hazard posed by a tsunami.
c. When would you issue the warning?
Answers will vary. The answer depends partly on the proximity of the trigger event.
d. Which offi cials would you notify? How would you notify them?
Answers will vary. At a minimum, students should notify local and state emergency management offi cials as well as the news media and law enforcement.
e. What would you tell them?
Answers will vary. Give them the known facts. The emergency management people should decide what to do next.
f. When would you issue an “all clear” signal?
Answers will vary. Generally, an “all clear” is issued after confi rmation that the trigger event did not generate a tsunami, or some reasonable time after the wave amplitude decreases suffi ciently.
Tsunami warning 139
Exploring the Dynamic Earth Unit 5 – Tsunami Hazards
. Since , more than percent of tsunami warnings have been false alarms, because it is diffi cult to predict the impact of a tsunami. Currently a warning is issued each time there is an earthquake of magnitude . or greater near a coastline or in the open ocean. Do you think it is better to “assume the worst” and send out too many warnings or “assume the best” and send out too few? Explain.
Answers will vary. The question calls for speculation, so look for a complete answer with reasonable justifi cation.
Quit ArcMap and do not save changes.
140 Tsunami warning