science of tsunami hazards - tsunami societytsunamisociety.org/sthvol33n3y2014.pdf · science of...
TRANSCRIPT

1
ISSN 8755-6839
SCIENCE OF TSUNAMI HAZARDS
Journal of Tsunami Society International
Volume 33 Number 3 2014
EVACUATION BEHAVIOR AND FATALITY DURING THE 2011 TOHOKU TSUNAMI 144
Nam-Yi Yun - Research Associate, Waseda University, Department of Civil & Environmental Engineering, JAPAN [email protected]
Masanori Hamada - Professor Emeritus, Waseda University, Department of Civil & Environmental Engineering, JAPAN [email protected]
SIMULATION OF TSUNAMI FORCE ON ROWS OF BUILDINGS IN ACEH REGION AFTER TSUNAMI DISASTER IN 2004 156
Radianta Triatmadja - Civil and Environmental Engineering, Tsunami Research Group, Research Centre for Engineering Science, Universitas Gadjah Mada, Yogyakarta, 55281, INDONESIA
[email protected] Benazir - Civil and Environmental Engineering, Tsunami Research Group, Universitas Gadjah Mada, Yogyakarta, 55281, INDONESIA
[email protected] NOVEL TSUNAMI BARRIERS AND THEIR APPLICATIONS FOR HYDROELECTRIC ENERGY STORAGE, FISH FARMING, AND FOR LAND RECLAMATION 170
Hans J. Scheel - Scheel Consulting, CH-8808 Pfäffikon, SWITZERLAND [email protected] www.hans-scheel.ch
Copyright © 2014 - TSUNAMI SOCIETY INTERNATIONAL

2
WWW.TSUNAMISOCIETY.ORG
TSUNAMI SOCIETY INTERNATIONAL, 1741 Ala Moana Blvd. #70, Honolulu, HI 96815, USA.
SCIENCE OF TSUNAMI HAZARDS is a CERTIFIED OPEN ACCESS Journal included in the prestigious international academic journal database DOAJ, maintained by the University of Lund in Sweden with the support of the European Union. SCIENCE OF TSUNAMI HAZARDS is also preserved, archived and disseminated by the National Library, The Hague, NETHERLANDS, the Library of Congress, Washington D.C., USA, the Electronic Library of Los Alamos, National Laboratory, New Mexico, USA, the EBSCO Publishing databases and ELSEVIER Publishing in Amsterdam. The vast dissemination gives the journal additional global exposure and readership in 90% of the academic institutions worldwide, including nation-wide access to databases in more than 70 countries.
OBJECTIVE: Tsunami Society International publishes this interdisciplinary journal to increase and disseminate knowledge about tsunamis and their hazards.
DISCLAIMER: Although the articles in SCIENCE OF TSUNAMI HAZARDS have been technically reviewed by peers, Tsunami Society International is not responsible for the veracity of any statement, opinion or consequences.
EDITORIAL STAFF Dr. George Pararas-Carayannis, Editor mailto:[email protected]
EDITORIAL BOARD Dr. Charles MADER, Mader Consulting Co., Colorado, New Mexico, Hawaii, USA Dr. Hermann FRITZ, Georgia Institute of Technology, USA Prof. George CURTIS, University of Hawaii -Hilo, USA Dr. Tad S. MURTY, University of Ottawa, CANADA Dr. Zygmunt KOWALIK, University of Alaska, USA Dr. Galen GISLER, NORWAY Prof. Kam Tim CHAU, Hong Kong Polytechnic University, HONG KONG Dr. Jochen BUNDSCHUH, (ICE) COSTA RICA, Royal Institute of Technology, SWEDEN Dr. Yurii SHOKIN, Novosibirsk, RUSSIAN FEDERATION TSUNAMI SOCIETY INTERNATIONAL, OFFICERS Dr. George Pararas-Carayannis, President; Dr. Tad Murty, Vice President; Dr. Carolyn Forbes, Secretary/Treasurer. Submit manuscripts of research papers, notes or letters to the Editor. If a research paper is accepted for publication the author(s) must submit a scan-ready manuscript, a Doc, TeX or a PDF file in the journal format. Issues of the journal are published electronically in PDF format. There is a minimal publication fee for authors who are members of Tsunami Society International for three years and slightly higher for non-members. Tsunami Society International members are notified by e-mail when a new issue is available. Permission to use figures, tables and brief excerpts from this journal in scientific and educational works is granted provided that the source is acknowledged. Recent and all past journal issues are available at: http://www.TsunamiSociety.org CD-ROMs of past volumes may be purchased by contacting Tsunami Society International at [email protected] Issues of the journal from 1982 thru 2005 are also available in PDF format at the U.S. Los Alamos National Laboratory Library http://epubs.lanl.gov/tsunami/

ISSN 8755-6839
SCIENCE OF TSUNAMI HAZARDS
Journal of Tsunami Society International
Volume 33 Number 3 2014
EVACUATION BEHAVIOR AND FATALITY DURING THE 2011 TOHOKU TSUNAMI
Nam-Yi Yun1 and Masanori Hamada2
ABSTRACT The 2011 Great East Japan earthquake triggered powerful tsunami waves, causing disastrous damages in a vast area and took more than 18,000 lives. Despite the unprecedented disaster, some of the buildings and concrete bridges located in tsunami-inundated areas survived and functioned as effective shelters for those who evacuated. It indicates that the disaster could be the product of other factors such as behavioral or environmental factor. In order to study the human impact in the 2011 Tohoku tsunami, it investigates the relationships among evacuation behaviors (i.e., evacuation starting time), preparedness before the disaster, and evacuee’s characteristics and survival rate of the 2011 disaster. Results show that behaviors during the disaster differentiated for the survivors and the dead and missing. A model is developed based on the analysis of each evacuation behavior factors on the fatalities; integrated strategies are proposed and discussed for the reduction of casualties in the future large-scaled natural disasters. Keywords: Tohoku Tsunami, human impact, evacuation behavior, fatalities
Vol. 33, No. 3, page 144 (2014)
1 Research Associate, Waseda University, Department of Civil & Environmental Engineering, [email protected] 2 Professor Emeritus, Waseda University, Department of Civil & Environmental Engineering, [email protected]

1. INTRODUCTION
The MW 9.0 earthquake on 11 March 2011 was generated along a very large fault area (450km length and 200km width) and constituted one of the most powerful earthquakes known to have hit Japan, and one of the five largest earthquakes by magnitude in the world (USGS, March 6, 2014). The 2011 Great East Japan Earthquake caused approximately between 16 and 25 trillion yen (around $250-500 billion USD in 2011, estimated by Cabinet Office, Government of Japan) in direct damage to social capital, housing, and private corporate facilities (White paper on Disaster Management, 2011). It also unleashed a deadly tsunami in which caused injuries, loss of lives, road and bridge damages, general property damage, and the collapse or destabilization of buildings. Among the approximately 15,000 dead and 3,000 missing, the majority was within the Tohoku area (i.e., Iwate, Miyagi, and Fukushima prefectures) and 92.5% died by drowning (National Police Agency, April 11, 2011). The affected area, Tohoku area, could be considered as one of the most prepared coastal areas in the world against a tsunami emergency, due to the awareness created by a series of recent major events – 1896 Meiji Sanriku (M 8.5), 1933 Showa Sanriku (M 8.4), and 1960 Chile (M 9.5). Additionally, tsunami preparedness in this area was clearly taken seriously by local authorities and residents, clearly indicating a high level of tsunami awareness (Esteban et al., 2013). It is clear that structural and non-structural measures should be considered and implemented simultaneously. Additionally, lessons from recent large-scale disasters show that human behavior plays a significant role in natural disaster mitigation, as well as structural and non-structural mitigation. In particular, evacuation actions taken by residents are fundamental to human damage mitigation measures against a large-scale disaster. Hence, the present paper will investigate the behaviors on evacuation during the 2011 Tohoku tsunami. Previous researchers have analyzed survivors’ evacuation behavior, but generally excluded non-survivors due to the difficulties in gathering data. In the present work the authors include several factors that influence individual coping responses using data from both survivors and non-survivors of the 2011 Tohoku tsunami. The results provide some useful information on the kind of individual behaviors that increase the likelihood of fatality due to a tsunami, which include:
• Evacuation starting time – how does the behavior of survivors and the dead and missing differ in the in response to a warning or ground shaking? • Evacuee’s characteristics (i.e., age, occupation) – to what extent do deaths have individual causes? • Preparedness before disasters – what is the relationship between levels of preparedness with disaster prevention education and survival rates? • Differences in behavior between groups of non-survivors and single survivors – effectiveness of tsunami evacuation principles.
2. PREVIOUS RESEARCH IN EVACUATION BEHAVIORS Evacuation during the 2011 Tohoku tsunami was a mass movement of more than 468,600 people escaping from the earthquake-induced tsunami (March 14, 2011, National Police Agency). For effective evacuation, warnings/alarms were issued 28 times and four of these alarms were for tsunamis more than three meters in height (Ozaki, 2012). The survivors’ evacuation experiences provided an opportunity to examine some of the very important practical issues regarding tsunami
Vol. 33, No. 3, page 145 (2014)
evacuation. Comparative analysis between the survivors and non-survivors provide valuable insights into the factors of some very important practical issues regarding evacuation. Hence, in the present section, the authors review previous research in evacuation behavior during past tsunamis and investigate the factors that influenced the evacuation behavior of those who perished by the wave. Based on the results, conclusions can be drawn that identify behavior differences between survivors and non-survivors under the disaster, which can help to better understand how to provide a more practical mitigation strategy. Much of the previous research on evacuation during earthquake-induced tsunamis aimed to predict who or how many evacuated, and focused on both the individual characteristics and community evacuation cues (Yun & Hamada, 2014). Researches in the individual characteristics were that characteristics - age, presence of children or elderly in the household, gender, and previous experiences with disasters - have been tested with results of a successful evacuation and showed mixed results depending on the situation (Dash & Gladwin, 2007; Yeh, 2010; Goto, 2012). Early evacuation was examined as a key factor for survival and the evacuation reasons and/or reasons for not evacuating have also been analyzed (Quarantelli, 1985; Riad et al., 1999; Sorensen, 1991). Also, the community evacuation cues analyzed the communities that facilitated evacuation through disaster prevention training and early warning systems enabled residents to safely and efficiently escape tsunami dangers (Fujinawa & Noda, 2013; Gregg et al., 2006; Papathoma et al., 2003). In case of a tsunami event, the swift evacuation to higher grounds of each person in the coastal areas should take place as soon as a strong or extended ground shaking is felt. Yun & Hamada (2012) shows an overview of the evacuation behavior against tsunamis in Japan since 1980, in addition to illustrating the results of surveys on affected residents. Evacuation rates, defined as proportion of evacuees from the total population that evacuated, vary from place to place for the case of the same tsunami. Also, for different tsunamis the evacuation rate at a given point is different for each event. Evacuation rates did not, however, depend on the size of the tsunami wave, and ranged from 1.1% in 1982 to 89.2% in 1993. This shows that more comprehensive studies should be performed to better understand evacuation behavior. During the 2011 Tohoku tsunami, several studies of residents’ behavior were performed using survey data, but there is no common agreement on evacuation rates. For example, interviews were conducted with 870 refugees from Iwate, Miyagi, and Fukushima Prefectures through a joint investigation between JMA, the Fire and Disaster Management Agency, and the Cabinet Office of Japan using a questionnaire designed to grasp the relationship between evacuation behavior and tsunami damage. The analysis results revealed that there were 496 immediate evacuees and 267 delayed evacuees; of these evacuees, 31% after some hesitation. Also, 11% of the respondents who did not evacuate were not able to withdraw immediately. Out of the total samples, 34% went back to their houses to look for or pick up family members, and 11 % believed that it was not possible for a big tsunami to come to their area, given their own personal experience or other beliefs, such as that the presence of a strong protective breakwaters or dyke in their town would protect them. Some evacuees who hesitated to flee went to an undesignated location or to the upper floors of the building where they were at the time. This indicates that it is important to examine the time of evacuation, preparedness before a disaster, and evacuation behavior, which is analyzed in this study.
Vol. 33, No. 3, page 146 (2014)

3. DATA SOURCES Data were collected and gathered from May 18 to June 12, 2011 through the Internet and mobile telephone sites by a company specializing in weather and disaster data (Weathernews Inc., 2011). Weathernews, a company that specializes in dealing with disaster data, conducted several surveys and collected vast amounts of data using the Internet and mobile web sites. Particularly, data for behavior of the dead and missing were gathered from family, relatives, and/or friends/neighbors. As a result, Weathernews published a data report of inundated and non-inundated areas from Hokkaido, Aomori, Iwate, Miyagi, Fukushima, Ibaraki, and Chiba prefectures. It aimed to compare the evacuation behavior of the survivors and those that died using 1,153 data from the inundated area only. The percentage of the data gathered from the three prefectures most severely affected– Miyagi, Iwate, and Fukushima – was 85%: experiences from 522 people who survived and 631 people who died or were missing. Five questions were used in the study, regarding evacuation behavior and the individual preparations that were carried out, as well as age, occupation, gender, and address: (a) How long did it take for you to start to evacuate from the tsunami?; (b) What triggered you to start evacuating? (i.e., tsunami warning); (c) What do you believe are the reason for your survival (or the death) was?; (d) What kind of disaster preparations had you taken before the tsunami disaster?; and (e) What was your Age on 11 March 2011 (or that of the person who died): (≤19, 20~29, 30~39, 40~49, 50~59, 60~69, 70~) and what was/is your (or that of the person who died) Occupation, Address and Gender? In order to analyze the effectiveness of the tsunami evacuation principle open-ended questions were also used, allowing respondents to freely reply and further explain their behavior. It assumes that there are significant differences in behavior types and behavior frequency between survivors and the dead and missing. These differentiated behaviors of the non-survivors and the survivors can be included as potential factors explaining why some types of individuals, more than others, become victims of the disaster. In particular, the study identified two groups that show significant differences in whether they follow the tsunami evacuation principles or not. This study, therefore, considers the role of tsunami evacuation principles and compares the two groups. 4. ANALYSIS RESULTS 4.1 Evacuation starting time Fig. 1 shows a result of the analysis using the whole data from the survivors and the dead and missing. There is a clear difference between survivors, 66% of whom evacuated within 20 minutes; this is almost double than for the case of the dead and missing, where only 35% evacuated within this time. Within the group that did not or could not evacuate there are also clear differences, as only 11% of the survivors find themselves in this category, whereas 48% of the dead and missing did not or could not evacuate. The reasons that lead to the death of the 35% of people who evacuated within 20 minutes but still became victims include:
Vol. 33, No. 3, page 147 (2014)

(a) About thirty percent of them had difficulties related to the evacuation destination (refuge), such as it being far from the residential area, or it was an unsafe refuge (i.e., a building that collapsed). In contrast with the deaths of those who had refuge-related difficulties, 11% of survivors who did not evacuate also answered that they were already in a safe location. (b) Some individuals initially evacuated to the refuges, but about 20% went back to their houses or other places before the tsunami completely ended for a variety of purposes (i.e., move to a safer place, finding family members, collect belongings). The above differences between the survivors and the dead and missing indicate that early evacuation to a safe location are key factors that can increase the chances of survival against a major tsunami event.
Fig. 1 (a) Evacuation starting time of the survivors (NS: number of the survivors = 505), and (b) of the dead and missing (ND: responses for n umber of the dead and missing = 351).
4.2 Effect of age Age distribution for survivors and dead and missing are shown in Fig. 2. Among the survivors, 63% were less than 39 years or age, and only 3% over 60 years old. Among the dead and missing, only 29% were less than 39 years of age, and 46% were 60 years or older. The effect of age on fatality rate illustrates that people over 60 years old are more vulnerable in tsunami disasters, and is consistent with the findings in previous research (Yeh, 2010; Tatsuki, 2013).
Vol. 33, No. 3, page 148 (2014)
Immediately, 14%
(71)
~20mins, 52% (265)
More than 20mins; 22%
No evacuation , 11% (58) Immed
iately, 10% (36) ~20
mins, 25% (89) More
than 20mins, 16% (56)
35%
(a)
No evacuation,
48% (170) 66%
(b)

Fig. 2 (a) Age ratio of the survivors (NS = 464), and (b) age ratio of the dead and missing (ND = 479),
using gathered data. Fig. 3 (a) shows the evacuation starting time for the dead and missing over 60 years old. More than half (63%) did not or could not evacuate, and only 5% evacuated immediately. A possible reason for elderly people being the greatest fraction of the dead and missing persons is shown in Fig. 3 (b). Older persons had many difficulties in evacuating due to: 24% having evacuation transit difficulties (i.e., long distance to the refuge location), and 22% had physical health issues such as challenges in running fast. Furthermore, 14% had traffic issues (traffic congestion or rough roads), 12% were caring for others, and 11% other reasons (i.e., did not know where the shelters were located).
Fig. 3 (a) Evacuation starting time for those aged over 60 that died or went missing (N=152), and (b) answers to the question about the reasons why they died (N=110).
Vol. 33, No. 3, page 149 (2014)
-19yrs, 8% (38)
20-29yrs,
18% (81)
30-39yrs, 37% (172)
40-49yrs, 24% (113)
50-59yrs, 10% (45)
60-69yrs, 2% (9)
70yrs-, 1% (6)
-19yrs, 4% (20)
20-29yrs,
10% (47) 30-39yrs
, 15% (72)
40-49yrs,
3% (12)
50-59yrs,
22% (107)
60-69yrs,
21% (100)
70yrs-, 25% (121)
Immediately, 5%
(8) ~20mins
, 20% (31)
More than
20mins, 12% (18)
Evacuation place troubles,
24% (26)
Physical health issues, 22% (24)
Leaving evacuation area,
18% (20)
Traffic Issues, 14% (15)
Caring for
others, 12% (13)
Others , 11% (12)
(a) (b)
No evacuation, 63% (95)
63%
3%
(b) (a)
29% 46%

4.3 Effect of occupation Fig. 4 shows the difference in occupation between the two groups. Office workers constituted 31% of survivors but only 21% of the dead and missing. On the other hand, housewives (29%) and shops/small businesses workers (15%) make up nearly half of the dead and missing, as shown in Fig. 4 (b). There may have been less information and guidance provided for the housewives and workers in small businesses while office workers were more likely to receive support from colleagues and their workplace. Another possible reason for housewives accounting for the highest fraction in the dead and missing persons is because most wooden houses were swept away by the tsunami (National Police Agency on April 19, 2012). Additionally, 10% of the survivors were students, but constituted 5% of the dead and missing. The reasons for this could be similar to those for the case of office workers – students were more likely to receive education on evacuation and information from teachers. It shows that people with specific occupations that could make them receive less information on evacuation and support may be more vulnerable to tsunamis.
Fig. 4 (a) Survivors’ occupation (NS=394), and (b) the dead and missing (ND=372). The above data
excludes blank answers and items of less than one percent. 4.4 Predict the likelihood of death due to the tsunami Based on the results of each of the factors, it examined who was more vulnerable to a tsunami using a regression model (Riad et al., 1999). After excluding the fully unanswered questions, the sample size was 610: 74% survivors, 48% female and heterogeneous in age (mean 36.6 years, standard deviation 15.9 years). Table 1 attempts to predict which characteristics are more likely to increase the chances of death due to a tsunami. Only the significant findings will be mentioned in the remainder of this paper.
Vol. 33, No. 3, page 150 (2014)
Office workers
; 31%
Shops/ Small
business; 9%
Student; 10%
Fishing/
Fisheries; 7%
Construction;
6%
Medical staff;
6%
Fire fighter,
3%
Others; 8%
Office workers; 21%
Shops/ Small business; 15%
Student; 5%
Fishing/
Fisheries; 12%
Construction, 4%
Medical staff; 5%
Fire fighter,
3%
Others; 6%
(a) (b)
Housewife, 29%
Housewife, 20%

Table 1. Prediction of what characteristics increase the likelihood of death due to the tsunami
Likelihood of Death by the tsunami Model (1) Model (2) Age 0.75** (0.17) 0.75** (0.17) Gender 0.15 (0.39) 0.17 (0.39) Inundated Place types (outdoors) −0.06 (0.32) −0.05 (0.35) Evacuation Starting time 0.69** (0.12) 0.70** (0.13) Preparedness −0.1 (0.08) − − Participation in disaster prevention training before the disaster − − −0.87** (0.12)
Occupation Office workers (reference category) − − − − Housewife 0.49 (0.33) 0.45 (0.34) Shops/small business 0.67** (0.11) 0.65** (0.08) Students 1.92+ (1.02) 1.97* (1.00) Fishing/Fisheries 1.78** (0.26) 1.77** (0.29) Construction 0.48 (0.74) 0.47 (0.74) Medical staff 0.22 (0.21) 0.17 (0.23) Fire fighter 1.58+ (0.84) 1.62+ (0.85) Others 0.53** (0.11) 0.53** (0.14) Note: Number of observation = 610 (number of survivors = 457, number of non-survivors = 153). Preparedness (participated in disaster prevention training = 4, walk evacuation route=3, know evacuation route = 2, know evacuation place = 1, none of the above = 0). Participation in disaster prevention training before the disaster (participated = 1, no participated = 0). Occupation data excludes blank answers and items of less than one percent. Standardized regression coefficients are reported. Standard errors are in parentheses. To predict the likelihood of death, a conditional logistic regression model was developed with Pseudo R2 = 0.30, 0.31 in model (1), (2), respectively. + p<.10. * p<.05. ** p<.01. The strong predictors are age and evacuation starting time (p < .01): an elderly person is more vulnerable than a younger person; and the person who starts evacuation late is in more danger than an early evacuee. As for the other leading predictors, having an occupation in the sectors of shops/small businesses, fishing/fisheries, fire fighters, or being students increases the likelihood of death, compared to office workers. Furthermore, it shows how a person’s performance on preparedness differs depending on whether s/he participates in training or not. Preparedness of model (1) and the disaster prevention training before the disaster of model (2) in Table 1 compares how the person performs when participating in training versus when s/he does not: the higher level of preparedness was not significantly as helpful compared to the lower level. Hence, Table 1 exhibits how participating in a training was only effective for survival (-0.87, p < .01).
Vol. 33, No. 3, page 151 (2014)

In conclusion, assuming that other conditions are the same (e.g., similar tsunami wave in same community), initiating early evacuation led to a greater likelihood of survival despite a lack of preparedness. Elderly persons who had difficulty evacuating and/or those in specific occupations with no participation in training were more likely to become victims in a disaster. 4.5 Comparative analysis of evacuation behavior: ranking of behavior in survivors & non-survivors In this chapter, evacuation-disturbance behavior is referred to as an action that led a respondent’s death because of obstacles preventing their fleeing to safe places. Some of the evacuation-disturbance behavior during the disaster includes not evacuating and/or taking no action, evacuating too late, and/or being held back during evacuation. These were actions (or lack of actions) that led them to a path that brought about major injuries or death. Success-induced behavior during evacuation, in contrast, had the opposite effect. A typical example for success-induced behavior is evacuating without hesitation. This includes many cases in which no fatal damage came about as a result. According to the definition of evacuation- disturbance or success-induced behavior, the frequencies of each of the behavior groups were analyzed. Tables 2 and Table 3 summarize ranks of evacuation-disturbance and success-induced behavior based on the frequency of such behavior. Based on Tables 2 and Table 3, it is clear that initiating early evacuation is vital to safety in a tsunami. Regarding the success-induced behavior in Table 8, some persons who were not expecting a tsunami managed to evacuate as a result of having been verbally warned by those around them. It is therefore crucial for residents who could be affected by tsunamis to understand the importance of initiating evacuation early. Regarding the evacuation-disturbance behavior shown in Table 7, despite tsunami warnings, many persons who were on low ground at the time of the earthquake did not have time to evacuate to higher places. There were also cases of persons losing their lives due to failing to perform necessary evacuation behavior. It is furthermore important to stay in safe locations that have been designated for official tsunami evacuation. After tsunami alarms were issued, many persons relocated to refuges but then went back to their houses before the tsunami completely ended. Such evacuation-disturbance behavior placed them at considerable risk.
Table 2. Ranking of evacuation-disturbance behavior
Rank Behavior Frequency 1 Tied up on the road (traffic jam) 26.3% 2 Help other people 22.4% 3 Do work and duty for rescue 13.9% 4 Do not evacuate due to no/wrong information 13.7% 5 Find family/relatives 9.7% 6 Ignore warnings based on past experiences 8.9% 7 Leave the assigned place 5.1%
Vol. 33, No. 3, page 152 (2014)
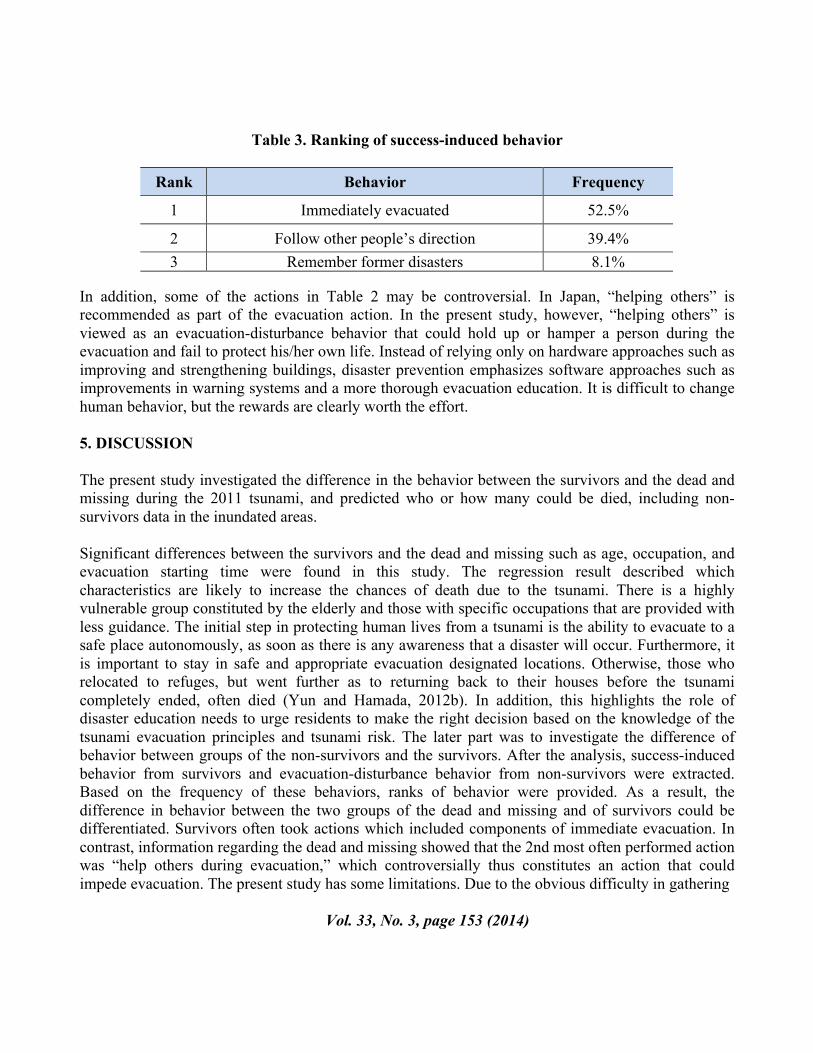
Table 3. Ranking of success-induced behavior
Rank Behavior Frequency
1 Immediately evacuated 52.5%
2 Follow other people’s direction 39.4% 3 Remember former disasters 8.1%
In addition, some of the actions in Table 2 may be controversial. In Japan, “helping others” is recommended as part of the evacuation action. In the present study, however, “helping others” is viewed as an evacuation-disturbance behavior that could hold up or hamper a person during the evacuation and fail to protect his/her own life. Instead of relying only on hardware approaches such as improving and strengthening buildings, disaster prevention emphasizes software approaches such as improvements in warning systems and a more thorough evacuation education. It is difficult to change human behavior, but the rewards are clearly worth the effort. 5. DISCUSSION The present study investigated the difference in the behavior between the survivors and the dead and missing during the 2011 tsunami, and predicted who or how many could be died, including non-survivors data in the inundated areas. Significant differences between the survivors and the dead and missing such as age, occupation, and evacuation starting time were found in this study. The regression result described which characteristics are likely to increase the chances of death due to the tsunami. There is a highly vulnerable group constituted by the elderly and those with specific occupations that are provided with less guidance. The initial step in protecting human lives from a tsunami is the ability to evacuate to a safe place autonomously, as soon as there is any awareness that a disaster will occur. Furthermore, it is important to stay in safe and appropriate evacuation designated locations. Otherwise, those who relocated to refuges, but went further as to returning back to their houses before the tsunami completely ended, often died (Yun and Hamada, 2012b). In addition, this highlights the role of disaster education needs to urge residents to make the right decision based on the knowledge of the tsunami evacuation principles and tsunami risk. The later part was to investigate the difference of behavior between groups of the non-survivors and the survivors. After the analysis, success-induced behavior from survivors and evacuation-disturbance behavior from non-survivors were extracted. Based on the frequency of these behaviors, ranks of behavior were provided. As a result, the difference in behavior between the two groups of the dead and missing and of survivors could be differentiated. Survivors often took actions which included components of immediate evacuation. In contrast, information regarding the dead and missing showed that the 2nd most often performed action was “help others during evacuation,” which controversially thus constitutes an action that could impede evacuation. The present study has some limitations. Due to the obvious difficulty in gathering
Vol. 33, No. 3, page 153 (2014)

data from the dead and missing, it used witnesses’ statements, people who were around them at during the evacuation process. Unlike structures, human damage and impact depend on how people make a decision to behave during disasters. To prepare against future disasters, people can be formally trained to accurately identify whether a given behavior path would be helpful during a disaster. Therefore, this paper contributes to provide a better understanding of the factors differentiating the survivors and the dead and missing, and to better improve the estimation of fatality rate. Based on these results, more effective evacuation warning messages and preparedness against future earthquake and tsunami can be developed, considering high vulnerability groups and evacuation behavior principles. REFERENCES Cabinet Office, Government of Japan, 2011. White Paper on Disaster Management 2011 Executive
Summary (Provisional Translation). Dash, N., & Gladwin, H., 2007. Evacuation Decision Making and Behavioral Responses: Individual
and Household. Natural Hazards Review, 8(3), 69-77. doi:10.1061/(ASCE)1527-6988(2007)8:3(69).
Esteban, M., Tsimopolou, V., Mikami, T., Yun, N.Y., Suppasri, A., & Shibayama, T., 2013. Recent Tsunamis Events And Preparedness: Development Of Tsunami Awareness In Indonesia, Chile And Japan. International Journal of Disaster Risk Reduction, 5, 84-97.
Fujinawa, Y., & Noda, Y., 2013. Japan's Earthquake Early Warning System on 11 March 2011: Performance, Shortcomings, and Changes. Earthquake Spectra, 29(S1), S341-S368. doi: 10.1193/1.4000127.
Goto, Y., 2012. Fact-finding about Evacuation from the Unexpectedly Large Tsunami, Japan Association for Earthquake Engineering, pp. 1617-1628.
Gregg, C. E., Houghton, B. F., Paton, D., Lachman, R., Lachman, J., Johnston, D. M., & Wongbusarakum, S., 2006. Natural warning signs of tsunamis: human sensory experience and response to the 2004 Great Sumatra Earthquake and Tsunami in Thailand. Earthquake Spectra, 22(S3), 671-691.
Ozaki, T., 2012. JMA’s Tsunami Warning for the 2011 Great Tohoku Earthquake and Tsunami Warning Improvement Plan, Journal of Disaster Research, Vol.7 sp, pp.439-445.
Papathoma, M., Dominey-Howes, D., Zong, Y., & Smith, D., 2003. Assessing tsunami vulnerability, an example from Herakleio, Crete. Natural Hazards and Earth System Science, 3(5), 377-389.
Quarantelli, E. L., 1985. Social support systems: Some behavioral patterns in the context of mass evacuation activities.
Riad, J. K., Norris, F. H., & Ruback, R. B., 1999. Predicting Evacuation in Two Major Disasters: Risk Perception, Social Influence, and Access to Resources1. Journal of Applied Social Psychology, 29(5), 918-934.
Scawthorn, C. Earthquake Engineering Handbook, 2002.
Vol. 33, No. 3, page 154 (2014)

Sorensen, J. H., 1991. When shall we leave? Factors affecting the timing of evacuation departures. International Journal of Mass Emergencies and Disasters, 9(2), 153-165.
Tatsuki, S., 2013. Old Age, Disability, and the Tohoku-Oki Earthquake. Earthquake Spectra 29, S403-S432.
Weathernews Inc. 2011. Report on the survey of the 2011 Great East Japan Earthquake and Tsunami. http://weathernews.com/ja/nc/press/2011/110908.html published on September 2011(in Japanese).
Yeh, H., 2010. Gender and age factors in tsunami casualties. Natural Hazards Review 11, 29-34. Yun. N.Y. & Hamada. M., 2014. Evacuation Behavior and Fatality Rate of Residents during the 2011
Great East Japan Earthquake and Tsunami, Earthquake Spectra In-Press. doi: http://dx.doi.org/10.1193/082013EQS234M
Yun, N.Y., and Hamada, M., 2012. Evacuation Behaviors in the 2011 Great East Japan Earthquake, Journal of Disaster Research, 7sp, 458-467.
Vol. 33, No. 3, page 155 (2014)

ISSN 8755-6839
SCIENCE OF TSUNAMI HAZARDS
Journal of Tsunami Society International
Volume 33 Number 3 2014
SIMULATION OF TSUNAMI FORCE ON ROWS OF BUILDINGS IN ACEH REGION
AFTER TSUNAMI DISASTER IN 2004
Radianta Triatmadja Civil and Environmental Engineering,
Tsunami Research Group, Research Centre for Engineering Science
Universitas Gadjah Mada, Yogyakarta, 55281, Indonesia [email protected]
Benazir Civil and Environmental Engineering,
Tsunami Research Group, Universitas Gadjah Mada,
Yogyakarta, 55281, Indonesia [email protected]
ABSTRACT
After the Indian Ocean Tsunami 2004 in Aceh, houses and other buildings were reconstructed by
government and Non-Governmental Organizations (NGO). The new buildings near the coastline are
open directly to similar tsunami attack. The layout of such new residential are normally arranged and
aligned as rows of buildings. The front rows of the buildings suffer more tsunami force due to their
location that are closer to the beach and the effect of the reflection from the adjacent buildings. This
research aims to analyze the tsunami force on buildings of different types, and the effect of other
buildings nearby. The research was conducted using a physical model at the Hydraulic and Hydrology
Laboratory, Research Centre for Engineering Science, Universitas Gadjah Mada Indonesia. The
physical model simulations were carried out in a flume of 24 m long, 1.45 m wide, and 1.5 m high, that
was facilitated with tsunami generator based on dam break system. The models of the buildings were
made of plywood and were placed in a row perpendicular to the flume. The distance between the
buildings was varied to observe the effect of the gaps. The results show that the force on the building
depends on the gap between the buildings. Although the effect of the gap was more significant on low
buildings, the effect of force on high buildings was more sensitive to the change of the gap size. Simple
equation for practical use is proposed to calculate the tsunami force on building with the effect of nearby
buildings.
Keywords: Tsunami; building; force; pressure, gaps; openings, simulations
Vol. 33, No. 3, page 156 (2014)

1 INTRODUCTION
The huge Indian Ocean Tsunami in 2004 has caused severe damage to infrastructures and loss of
lives. Aceh, a province of Indonesia, suffered the greatest losses in this catastrophe. The incident has
made Aceh people realize that they are vulnerable to tsunamis. After the tsunami disaster, Aceh once
again was struck by a tsunami in the area of Simeulue and Nias Islands on 26 March 2005. Another
earthquake measuring over 8 on the Richter scale occurred in Aceh on 11 April 2012, which resulted in
a low tide in Ulee Lheue Beach Banda Aceh. Although no tsunami was generated, it has made Acehnese
became more prepared against such horrible hazards.
Takahashi et al, (2007) classified the level of damage of buildings in Aceh into four districts. In
District 1, which is the coastal area, almost the entire buildings in the region were completely destroyed
by the tsunami. A lot of new buildings were built in this area during the reconstruction. These new
residential areas, schools, hotels, and industrial areas are directly open to the sea (Figure 1) especially
when coastal forests that serve as buffer zones are no longer available due to the 2004 tsunami.
A coastal forest is an alternate natural measure to reduce the tsunami hazard but it needs
considerable time to grow and achieve the required strength so as to function properly. Proper
arrangement of buildings at coastal areas may contribute to reducing the damage caused by tsunami.
For instance, such layout is needed in order to provide protection to weaker buildings by properly
designed stronger buildings. For example, the weaker houses were those of tsunami victims that were
built by the government and Non-Government Organizations (NGOs).
Unfortunately, with the present arrangement, many of the houses would be the first to be damaged
by the force of tsunami waves. When the weaker buildings are destroyed or are lifted up by the tsunami,
they may be brought further inland as debris, hit other buildings, and thus create more damage and
greater losses of lives. Houses that were built close to each other as shown in Figure 2 may obstruct
tsunami flows, which subsequently may increase the tsunami force upon them. A number of formulae
are available for computing the tsunami force on either piles or walls for example USAEWS (1990).
Asakura (2002), Triatmadja and Nurhasanah (2012). Nakano (2010) proposed the computation of force
on relatively low building by waves which may overtop them. However, the available formulas do not
take into account the effect caused by buildings nearby. In this paper, the effect of the layout of the
buildings, especially the distance between the building and the nearby buildings or the size of the gaps
relative to the size of the buildings, were studied.
Vol. 33, No. 3, page 157 (2014)

Figure. 1. View of new buildings after reconstruction around the coastal area of Ulee Lheue Banda
Aceh. The houses are recently built for tsunami victims (taken from newly built escape building on
January 2013).
Figure 2. View of some new buildings after reconstruction in a coastal zone in Banda Aceh.
Vol. 33, No. 3, page 158 (2014)
Gap

2 LITERATURE REVIEW
2.1 Tsunami front speed
According to FEMA (2005), tsunami flow depth is generally shallower than the depth of normal
flow such as rivers at the same flow rate. Tsunami surge speed on land may be described by Eq. (1)
𝑈 = 𝑘√𝑔ℎ. (1)
where U is celerity of tsunami, g is the gravitational acceleration, and h is the surge depth or surge
height. The coefficient k represents the surge Froude number (Fr). The surge Froude number that is
suggested by FEMA (2005) is approximately equal to 2. The surge speed due to dam break at a non-
zero downstream depth is hardly affected by friction bed as suggested by Eq. (2) following Chanson
(2005).
√ℎ0
ℎ3=
1
2
𝑈
√𝑔ℎ3(1 −
1
𝑋) + √𝑋. (2)
where 𝑋 =1
2(√1 + 8
𝑈2
𝑔ℎ3− 1) and h3 is the initial of downstream water depth, with
ℎ0
ℎ3= 𝑋, and h is the
surge height or depth.
Triatmadja and Nurhasanah (2012) indicated that obstacles such as buildings might hinder
tsunami flows and create backwater or higher water depth upstream of the obstacles. In such situation,
it may be expected that the obstacles themselves are subject to higher tsunami forces. The force on
single building may be calculated based on many available formulas, however the maximum force
acting on a group of buildings may depend on the layout of the buildings and the surrounding
environment. This is discussed in the following section.
2.2 Tsunami force on a vertical wall
The first force that hits a building is the impact force. The force could be very large and may be
written as 𝐹𝑖 = 𝐶𝑖𝜌𝐴𝑈2. (3)
where Ci is the impact coefficient that depends on the shape of the surface of impact and the angle of
impact. The drag force of wave on the building follows Eq. (4) (Dean and Dalrymple, 1984).
𝐹𝐷 =1
2𝐶𝐷𝜌𝐴𝑈2. (4)
where CD is the drag coefficient, A is the projected area, and in this case, U is the velocity. The value
of CD depends on the Reynolds number and the shape of the building. FEMA P-55 (FEMA, 2005)
recommended that CD = 2.0 for a rectangular pile and that CD = 1.2 for a circular pile. Instead of using
U, the surge height is preferred for its availability and ease of measurement. USA-EWES and CERC
(1990) and Asakura et al. (2002) suggested that surge force follows Eq. (5).
Vol. 33, No. 3, page 159 (2014)

𝐹 = 4.5𝜌𝑔ℎ2 (5)
Eq. (5) implies that the building should be higher than three times the surge height (h) so as not
to be overtopped by a tsunami. Such building may be called “high building”. In a certain situation where
the tsunami wave height is almost the same as the building’s height, such as those in Aceh, the tsunami
may overtop the building and Eq. (5) should not be used. Such overtopped building is hereafter called
“low building”. The constant, which is 4.5 in Eq. (5) may vary considerably with the distance of the
surge from the shore. Triatmadja and Nurhasanah (2012) suggested the use of Eq. (2) with Cf as the
combination of both impact and drag forces as in Eq. (6).
𝐹𝑖 = 𝐶𝑓𝜌𝐴𝑈2. (6)
where Cf varies from 0.6 to 1.03 for low buildings and high buildings respectively.
Based on Triatmadja and Nurhasanah (2012), to accommodate the effect of openings within the
building, the force on the building with openings can be written as:
𝐹 = 𝐶𝑓𝜌(1 − 𝑛2)𝐵ℎ𝑈2. (7)
where n is the porosity(opening). In this case, Cf is also expected to vary with the layout of the
partitions within the buildings.
For a high building an analytical approach of simplified problem may be carried out as follows.
The tsunami wave’s front height and velocity are assumed to be uniform. When a tsunami wave hits a
wall, the water level upstream of the wall may be calculated using the Method of Characteristics as
indicated in Figure 3. The solid wall represents row of buildings without gaps.
Figure.3. (a) Tsunami surge approaches vertical wall, (b) Tsunami surge hit the wall and was
reflected.
At the point A in Figure 3, it follows that
𝑈1 + 2𝐶1 = 𝑈2 + 2𝐶2 (8)
where Cn = √𝑔ℎ𝑛. Assuming that U2 equals zero when there is no space or gap between the buildings,
Eq. (8) may be written as:
Vol. 33, No. 3, page 160 (2014)
U+C
h1 h2
1 2
A

𝐹𝑟1√𝑔ℎ1 + 2√𝑔ℎ1 = 2√𝑔ℎ2
or ℎ2
ℎ1= (
𝐹𝑟1+2
2)
2 (9)
The subscripts denote the location of measurements. Since the velocity exactly in front of the building
is zero, the force on the buildings may be written as:
𝐹 =1
2𝜌𝑔 ((
𝐹𝑟1+2
2)
2ℎ1)
2
(10)
For Fr=2, 𝐹 = 8 𝜌𝑔ℎ12, or simply 𝐹 = 8 𝜌𝑔ℎ2 which is 77% more than that of Eq. (5). The gap between
the buildings enables the tsunami to flows through where U2 becomes greater than 0 resulting in reduced
h2 and the force on the buildings subsequently.
3 EXPERIMENTAL SET-UP
Physical experiments were conducted in a wave flume of 24 m long, 1.45 m wide and 1.5 m high.
The flume was divided into two sections with the upstream part served as the reservoir for generating a
tsunami while the downstream part was used to simulate tsunami propagation and tsunami force on
buildings. The gate that separates the flume was equipped with a quick release mechanism. The flume
was also equipped with a pump to fill the reservoir and an outlet to drain the downstream part of the
flume. The experimental setup in this research was similar to the physical model used by Triatmadja
and Nurhasanah (2012).
With the above arrangement, a dam break surge may be generated to imitate a tsunami wave. This
was carried out by opening the gate quickly. In order to measure the surge front celerity, a series of
wave recorders were installed at selected stations (Sta). The distance between the adjacent stations,
from Sta 1 to Sta 4, was 1 m, as depicted in Figure 4.
Figure 4. Experimental set-up
Vol. 33, No. 3, page 161 (2014)
3 2 1 4
Top Crane
Load Cell
Wave Probe
Model
Reservoir
Gate
Quick Release
Mechanism 330 kg
1
m

The model buildings were of square shape made of plywood. There were two types of models
namely low buildings of 20 cm x 20 cm x 20 cm (width x length x height) in size and high buildings of
20 cm x 20 cm x 60 cm. The models were arranged in the flume either as single building (no nearby
buildings) or as a row of buildings separated by gaps.
When simulating the force on row of buildings, the size of the buildings and the gaps were made
uniform to simplify the model lay out. A model building was installed in the center of the flume on
which tsunami force was measured. Two models of half width building size were installed at sidewalls
representing the adjacent buildings. These sidewalls were made movable and parallel to the wall of the
flume to represent mirrors or reflective boundary conditions (Figure 5). The distance between the
sidewalls may be adjusted to suit the required gaps between the buildings. The lengths of the movable
sidewalls were 2.4 m, of which the 1.4 m was upstream of the model buildings and the rest was
downstream of the model buildings. The arrangement assured that the maximum force on the building
was recorded before the backwater reached the upstream end of the sidewalls.
Figure 5. Detail lay out of the model in the wave flume.
4. TSUNAMI SURGE PROFILES AND FRONT CELERITIES
Varying water depth in the basin varied the tsunami surge heights. These were 50 cm, 60 cm, and
70 cm. Typical results of the surge are provided in Figure 6. The arrivals of the surges at each station
were used to calculate the surge speed as in Eq. (11).
U =
𝑥1−2𝑡1−2
+𝑥2−3𝑡2−3
+⋯𝑥𝑛−𝑛+1𝑡𝑛−𝑛+1
𝑛𝑡. (11)
where xn-n+1is the distance between station n and station n+1, tn-n+1 is the required duration for the surge
to move from station n to station n+1, and nt is the number of spaces between the probes in the wave
flume.
Vol. 33, No. 3, page 162 (2014)
(a) (b)
Tes
ted
bu
ild
ing
20 cm 20 cm
20 cm 20 cm
Tes
ted
bu
ild
ing
Flume bed
Movable walls Movable walls
Testing area
Gap variations
Movable walls Movable walls Testing area
20 cm
60 cm
20 cm
60 cm

Figure 6 indicates that the surge level fluctuated with time and along the flume. It may be said
that the front depth (the average water depth of the front during the first one second of measurement)
was the same between station 1, 2, and 3. At station 4, approximately 10 cm from the building model,
the water depth significantly higher due to backwater. The tsunami surge speeds are shown in Table 1.
Figure 6. Tsunami surge profiles at station 1 (Sta 1) to station 4 (Sta 4) at different reservoir depths
Table 1. Tsunami surge characteristics
h0 h3
Average surge
height
Average
surge celerity
Calculated
surge height
Calculated
surge celerity Fr
(Experiment) (Experiment) based on Eq. (2) based on Eq. (2)
50 cm 2 cm 14.89 cm 2.40 m/s 14.32 cm 2.39 m/s 1.99
60 cm 2 cm 16.17 cm 2.76 m/s 16.09 cm 2.67 m/s 2.19
70 cm 2 cm 17.05 cm 3.08 m/s 17.75 cm 2.93 m/s 2.38
Vol. 33, No. 3, page 163 (2014)
0
5
10
15
20
25
30
35
0 1 2 3 4 5 6 7 8 9 10Tsu
na
mi
surg
e h
eig
ht
(cm
)
Time (s)
Reservoir depth= 70 cm
Sta 1Sta 2Sta 3Sta 4
(a)
0
5
10
15
20
25
30
35
0 1 2 3 4 5 6 7 8 9 10Tsu
na
mi
surg
e h
eig
ht
(cm
)Time (s)
Reservoir depths = 60 cm
Sta 1
Sta 2
Sta 3
Sta 4
(b)
0
5
10
15
20
25
30
35
0 1 2 3 4 5 6 7 8 9 10 11 12Tsu
na
mi
surg
e h
eig
ht
(cm
)
Time (s)
Reservoir depths= 50 cm
Sta 1Sta 2Sta 3Sta 4
(c)

From Table 1, it may be said that the present experiment agrees well with the theoretical solution by
Chanson’s (2005). The range of Froude numbers in the present study was approximately from 2.0 to
2.4.
4 TSUNAMI FORCE ON SINGLE BUILDING
Tsunami force on buildings may be approximated using a number of equations as discussed
previously. For low building, Eq. (5) may not be suitable, as the overflow water does not contribute to
the force. For low buildings where the height of the buildings are almost the same as the height of the
surge, Triatmadja and Nurhasanah found that Cf values were 0.69, 0.62, and 0.53 at Fr equals 2.13, 2.30,
and 2.53 respectively. For high buildings Cf value was reported to be 1.03 at Fr= 2.13. Similarly the
average Fr in the present study was 2.2 and hence the results of the present study are comparable to that
of Triatmadja and Nurhasanah.
Eq. (4) may also be applicable where CD equals 2.0 (Dean and Darlymple, 1984) or 1.25 for ratio
between the inundation depth and the width of the building is 1 to 12 (FEMA, 2005). The experimental
results are given in Figure 7 together with predicted forces based on Eq. (4), Eq. (5), and Eq. (6). It may
be said that in general the existing formulae under predict the experimental data yet, the differences are
not significant at low buildings. Eq. (5) tends to under predict the experimental data for higher Fr. This
is because the dynamic force, which actually depends on surge velocity and depth, has been simplified
by replacing U with h. However, U is related to both Fr and h, and hence replacing U with h implies a
constant Fr. Therefore, when in reality Fr increases, Eq. (5) under predicts the force and vice versa.
Figure 7. Experiment versus estimated surge force on low and high buildings.
Vol. 33, No. 3, page 164 (2014)
0.20
0.40
0.60
0.80
1.00
1.20
1.40
1.50 1.70 1.90 2.10 2.30 2.50
Fex
p/F
theo
ry a
nd
exi
stin
g fo
rmu
lae
Fr
Fexp/FTriatmadja & Nurhasanah (2012), cf = 0.6 (Overtopping Buildings)
Fexp/FDean & Darlymple (1984), Cd = 1.25
Fexp/F based on Triatmadja & Nurhasanah (2012) cf = 1.03 (Non Overtopping Buildings)
Fexp/F based on Dean & Darlymple (1984), Cd = 2.0
Fexp/F based on Asakura et al. (2002) (Non Overtopping Buildings)

5 TSUNAMI FORCE ON ROW OF LOW AND HIGH BUILDINGS
Rows of similar buildings (houses) with spaces or gaps in between are common in a newly
designed residential complex as found in Aceh after reconstruction following the tsunami disaster in
2004. In this case, tsunami may penetrate the building complex through the gaps whilst at the same time
the buildings reflect the waves to create backwater as discussed previously. Smaller gaps reduce more
wave energy downstream and so the front buildings may be regarded as a protection to the downstream
buildings. However, smaller gaps create higher backwater and higher force on the front buildings. The
deceleration of surge flow through rows of buildings may be perceived as the deceleration of the surge
through a large building with openings. The force of which is given in Eq. (7). The force per unit area
(P) based on Eq. (7) may then be formulated as:
𝑃 =𝐶𝑓(1−𝑛2)𝜌𝐵ℎ𝑈2
(1−𝑛)𝐵ℎ= 𝐶𝑓(1 + 𝑛)𝜌𝑈2. (12)
Eq. (12) suggests that the average pressure on a building area alone (not including the openings)
is higher than the average force on solid rectangular building of the same size.
Figure 8. (a) Front view of row of low buildings and (b) Rear view of row of high buildings during the
experiment
Low buildings may be overtopped easily and hence, the backwater upstream of the buildings is
limited to certain height after which the sum of the flow over the buildings and through the gaps balances
the tsunami surge flux. On the other hand, there is no flow over the high buildings that cause higher
backwater. Hence the effect of the gap size becomes more significant.
Realizing the importance of certain variables namely gap width, projected area of the building,
projected area of adjacent buildings, tsunami surge velocity, and density of the water, a dimensional
analysis was performed to group such important variables into non dimensional parameters.
Vol. 33, No. 3, page 165 (2014)
(a) Half size building
Movable wall
Model
tes
ted
(b)

Figure 9 shows the results of the experiment and their relations with the non-dimensional
parameters. Eq. (13) was determined based on non-dimensional parameters to fit the experimental data,
𝐹 = 𝐶𝑓𝑔𝜌𝑈2(𝐴𝐴′)0.535𝐺−0.14 ; 0.01 < AA'/G4 < 3500 (13)
where A is the projected area hit by tsunami, A’= B h’ is the projected area of the adjacent building, B
is the width of single building, h’ is the height of the building, G is the gap between the buildings. The
value of Cfg is 1.0 for h/H < 1.33 (low building) and 1.6 for h/H > 1.34 (high building). As can be
observed in Figure 9, the equations fit quite well with the data for a large range of AA’/G4.
Figure 9. Relation between non-dimensional parameter AA’/G4 and F/U2G2
Eq. (13) was compared with the experimental data for low buildings and with other existing
formulae in Figure 10. For large gaps the agreement was satisfactory at high Fr and approximately 20%
less than the experiment at lower Fr. At small gaps Eq. (13) fit better for lower Fr, and approximately
15% higher than the experimental at larger Fr. Eq. (7) over predicts the experimental data by less than
10% except at large gaps where the discrepancy is nearly 30% for small Fr. The use of Asakura’s et. Al
equation (Eq. 5) directly on the problem is shown to be in appropriate. Eq. (5) was meant to be applied
to single building without any disturbance from the surrounding. The inclusion of Eq. (5) in the figure
is merely to provide comparison between tsunami forces on single building without any disturbance
from the surrounding and those with the effect of the surrounding. As can be seen in the figure that as
the gap becomes wider, the effect of the gap becomes less significant. Note that Eq. (5) fits better to the
experimental data for Fr close to 2.0. As Fr increases, Eq. (5) under predicts the experimental data.
Vol. 33, No. 3, page 166 (2014)
0.01
0.1
1
10
100
1000
0.001 0.01 0.1 1 10 100 1000 10000
F/ρ
U2G
2
AA'/G4
Low buildings High buildings
F/(U2G2) =1.6 (AA'/G4)0.535
F/(U2G2) =(AA'/G4)0.535

Similar comparison is given in Figure 11 for high building. In average the performance of Eq. (13) is
similar to Eq. (7).
Figure 10. Comparison of Eq. (5), Eq. (7), and Eq. (13) with the experimental data on low building.
Eq. (5) is compared only with tsunami force on high buildings. Higher Fr is indicated by larger
symbol.
Figure 12 shows the increasing tsunami force on low buildings as a function of relative gap width.
The increasing force is calculated as the ratio between the force with the effect of nearby building and
the force of single building. It is noted that tsunami force may increase approximately up to more than
60% when G/(B+G) = 0.46. Example of such a row of buildings is depicted in Figure 2. In the future,
the owner or the resident of these buildings may build additional rooms next to the main building for
garages or sleeping rooms, which narrow down the space between the buildings. In this case, tsunami
force on the building is expected to increase. Figure 12 indicates that for G/(B+G) = 0.1 the force on
the building is approximately 85% higher. The percentage increase of force relative to reducing
G/(B+G) is higher for high buildings as tsunami surge may only flow through the gaps and hence the
reduction of the gap is more effective in increasing the force. The experimental results indicated that
the maximum increase is nearly 90% more than that of single building. The maximum increased of the
force on single high building may be calculated using Eq. (10) and Eq. (5) or Eq. (6) based on the data.
For Fr =1.99, the maximum increased was found to be 76% (using Eq. (5)) and 73% (using Eq. 6) which
were relatively close to the experiment. For higher Froude number, the maximum increased force may
be calculated using Eq. (10) and Eq. (6) to give 96% and 81% increased force for Fr = 3.08 and 2.6
respectively. These values are good approximation to the
Vol. 33, No. 3, page 167 (2014)
0.50
0.60
0.70
0.80
0.90
1.00
1.10
1.20
1.30
1.40
1.50
-2.00 -1.50 -1.00 -0.50 0.00 0.50 1.00 1.50 2.00 2.50 3.00 3.50 4.00
Fex
p/F
(Eq
. 1
0 a
nd
oth
ers)
Log (AA'G-4)
Asakura et al. (2002), Fr = 2.38 Asakura et al. (2002), Fr = 2.19
Asakura et al. (2002), Fr = 1.99 Triatmadja & Nurhasanah (2012), Cf = 0.6, Fr = 2.38
Triatmadja & Nurhasanah (2012), Cf = 0.6, Fr = 2.19 Triatmadja & Nurhasanah (2012), Cf = 0.6, Fr = 1.99
Based on Eq. (13), Fr = 2.38 Based on Eq. (13), Fr = 2.19
Based on Eq. (13), Fr = 1.99

experimental data despite the assumption used in Eq. (10) where the speed and the height of the surge
were constant whilst in reality the speed reduces with the increasing surge height behind the front
(Lukkunaprasit et. al, 2009).
Figure 11. Comparison between Eq. (7), Eq. (13) and the experimental data on high building. Higher
Fr is indicated by larger symbol.
Figure 12. Relative increase of tsunami force on low and high buildings due to surrounding buildings
Vol. 33, No. 3, page 168 (2014)
0.50
0.60
0.70
0.80
0.90
1.00
1.10
1.20
-2.00 -1.00 0.00 1.00 2.00 3.00 4.00 5.00
Fex
p/F
(Eq.7
and E
q. 13)
Log (AA'G-4)
Triatmadja & Nurhasanah (2012), Cf = 1.03, Fr = 2.38
Triatmadja & Nurhasanah (2012), Cf = 1.03, Fr = 2.19
Triatmadja & Nurhasanah (2012), Cf = 1.03, Fr = 1.99
Based on Eq. (13), Fr = 2.38
Based on Eq. (13), Fr = 2.19
Based on Eq. (13), Fr = 1.99
0.00
10.00
20.00
30.00
40.00
50.00
60.00
70.00
80.00
90.00
100.00
0.00 0.10 0.20 0.30 0.40 0.50 0.60 0.70
Fo
rce
incr
ease
d (
%)
G/(G+B)
High buildings, Fr = 2.38
High buildings, Fr = 2.19
High buildings, Fr = 1.99
Low buildings, Fr = 2.38
Low buildings, Fr = 2.19
Low buildings, Fr = 1.99

6 CONCLUSION
The tsunami force on buildings depends on the surrounding adjacent buildings. The gaps or space
between buildings have a significant effect on the tsunami surge force. Such force may be calculated
using Eq. (13). The maximum force on buildings where the tsunami surge is totally reflected can be
approximated using Eq. (10). Houses in a residential complex such as those in Aceh should be designed
by considering the effect of nearby buildings since even a relatively small tsunami may bring about
large force that endangers the houses and hence the residents.
ACKNOWLEDGMENTS
The research was fully funded by The Directorate of Research and Public Service, Directorate
General of Higher Education, Ministry of National Education and Culture of Indonesia (DP2M, DIKTI,
Kementerian Pendidikan dan Kebudayaan Nasional Indonesia) FY 2012. We would like to express our
sincere gratitude for the funding. The Hydraulic and Hydrology Laboratory of The Center for
Engineering Science Universitas Gadjah Mada is acknowledged for its support throughout the research.
Mr. Kuswandi’s help in preparing the model and running the simulation is acknowledged.
REFERENCES
Asakura. R., Iwase. K., Ikeya. T., Takao. M., Kaneto. T., Fuji. N., Ohmori. M., (2002), The Tsunami
Wave Force Acting on Land Strctures, Coastal Engineering.
Chanson. H.,(2005), Hydraulic Model Reports Ch55/05, University of Queensland.
Dean. R.G., and Dalrymple. R.A., (1984), Water Wave Mechanics for Engineers and Scientists, World
Scientific Publishing, Singapore
FEMA P-55, (2005), Coastal Construction Manual, Volume II, Principles and Practices of Planning,
Siting, Designing, Constructing, and Maintaining Buildings in Coastal Areas, FEMA.
Lukkunaprasit. P., Ruangrassamee. A., and Thanasisathit. N., (2009), Tsunami Loadings On Buildings
With Openings, Science of Tsunami Hazards, Vol. 28, No. 5, p 303-310.
Nakano.Y., (2010), Design Load Evaluation For Tsunami Shelters Based On Damage Observations
After Indian Ocean Tsunami Disaster Due To The 2004 Sumatra Earthquake, Science of Tsunami
Hazard, International Journal of the Tsunami Society, Vol. 29. No. 1, pp. 11-20.
Takahashi. M., Tanaka. S.,Kimura R., Umitsu. M., Tabuchi. R., Kuroda. T., Ando. M., Kimata. F.,
(2007), Restoration After The Sumatra Earthquake Tsunami In Banda Aceh: Based On The
Results Of Interdisciplinary Researches By Nagoya University, Journal of Natural Disaster
Science, Volume 29, Number 2, 2007, pp53-61
Triatmadja. R., and Nurhasanah. A., (2012), Tsunami Force on Buildings with Opening and
Protection, Journal of Earthquake and Tsunami, vol. 6, No. 4 (2012).
US Army Engineer Waterways Experiment Station and Coastal Engineering Research Center (1990),
Wave Forces on a Wall Shoreward of the Still-Water Line, Coastal Engineering Technical Note.
Vol. 33, No. 3, page 169 (2014)

ISSN 8755-6839
SCIENCE OF TSUNAMI HAZARDS
Journal of Tsunami Society International
Volume 33 Number 3 2014
NOVEL TSUNAMI BARRIERS AND THEIR APPLICATIONS FOR
HYDROELECTRIC ENERGY STORAGE, FISH FARMING, AND FOR LAND RECLAMATION
Hans J. Scheel
Scheel Consulting, CH-8808 Pfäffikon, Switzerland [email protected] www.hans-scheel.ch
ABSTRACT
The tsunami hazard can be mitigated if the destructive waves generated from earthquakes and landslides can be reflected by a stable submerged vertical barrier before striking coastal communities or important structures. Building such deep walls by conventional submarine technology is difficult. The present study describes the principle and the erection of such submarine defensive walls by a relatively simple efficient and economic technology. This technology is based on lowering high-strength steel fences with horizontal anchors, or two parallel steel fences with distance holders, into the sea and fixing them with rocks deposited from top. Dredged material like gravel or sand can be used for additional filling. This Tsunami-Flooding Barrier (TFB) extends a few meters above sea level and carries on top a concrete supply and service road protected on both sides against storm waves by concrete walls. Replaceable surge stoppers (parapets, wave return walls) prevent overtopping and erosion of the seaward barrier face. The TFBs protect the coastline against tsunami and the highest storm waves from hurricanes, but also can provide protection from oil spills or other contaminations from the ocean and thus protect flora, fauna, coral reefs and beaches. Channels and gates allow navigation and can be closed quickly upon a tsunami or storm warning. The construction costs can be eventually compensated by using the reservoirs between coast and barriers for hydroelectric energy storage (using pump-turbines in the barriers) or for fish-farming, or alternatively the reservoir can be filled with rocks, rubble, gravel, sand and covered with soil in order to reclaim new land. Tidal energy can be generated by installing turbines within these barriers.
Vol. 33, No. 3, page 170 (2014)

Also, this submarine architecture may be applied to protect pillars of bridges and offshore platforms, and for erecting “roads” into the sea to connect near-shore platforms and wind-parks with the coast and additionally include oil, gas, gasoline pipelines and electricity lines.
Keywords: Tsunami and flooding barrier, hydroelectric energy storage, fish-farming, tidal energy, land reclamation, submarine architecture
INTRODUCTION
Tsunami and flooding catastrophes have increased with time because the coastal population density has increased and because the number and intensity of tropical storms have increased, presumably due to climate change (Rauch 2014). The most recent destructive events were the 2004 Indian Ocean tsunami with more than 200,000 people killed and the March 11, 2011 Tohoku tsunami with about 20,000 fatalities – the latter with collateral, long term consequences from the Fukushima-Dai-Ichi nuclear power plant catastrophe. Major flooding catastrophes caused by hurricane Katrina 2005 in Louisiana, by Sandy 2012 in New York / New Jersey and by typhoon Haiyan 2013 in the Philippines had caused together 8,500 fatalities and damages of 179 billion USD. Fortifications at the coast and even the largest breakwaters could not withstand the enormous forces of overtopping tsunami and storm waves (Takahashi et al. 2000) - as will be specifically discussed with the example of the world’s largest breakwater at Kamaishi bay. Bryant (2008) has given an overview about the tsunami hazard and specifically discussed the risk for large cities with population above 15 million like Los Angeles, Mumbai, New York, Osaka and Tokyo, for more than 50 cities with population of more than 2 million people, and for many coastlines. Hopefully there will be no temporal and geographic coincidence of a mega-tsunami with a hurricane/cyclone, which would cause immense fatalities and damage. The expensive tsunami warning systems summarized by Annunziato et al. (2012) and a fast tsunami assessment modeling system (Annunziato 2007) will in case of timely warning reduce the loss of lives, but cannot prevent the huge coastal damages. The historical data of NOAA/NGDC (2014) and predicted probabilities of recurrence (Potter 2013) will indicate the urgency of definitive installation of tsunami and flooding protection systems. Levin and Nosov (2009) presented the physics of tsunami and Strusinska (2011) reviewed in her thesis recent investigations about tsunami wave characteristics and countermeasures. Coastal protection structures were reviewed by Burchardt and Hughes (2011), whereas Takahashi (2002) presented construction and stability features of partially vertical breakwaters. Srivastava and Sivakumar Babu (2009) had proposed a reinforced vertical earth wall to protect against tsunami which however will have little effect as will become clear below. Effective tsunami protection barriers and their efficient and economic construction have been described previously (Scheel 2013.a, 2014.a, b). Extended vertical barriers along coastlines will not only protect lives and properties, but also have great advantages, which eventually will compensate for the construction costs by projects such as the proposed hydroelectric energy storage which uses huge seawater reservoirs near the coast and pump-turbines inside the barriers. Potential additional benefits could be the generation of tidal and wave energy, land reclamation and large-scale fishing farms.
Vol. 33, No. 3, page 171 (2014)
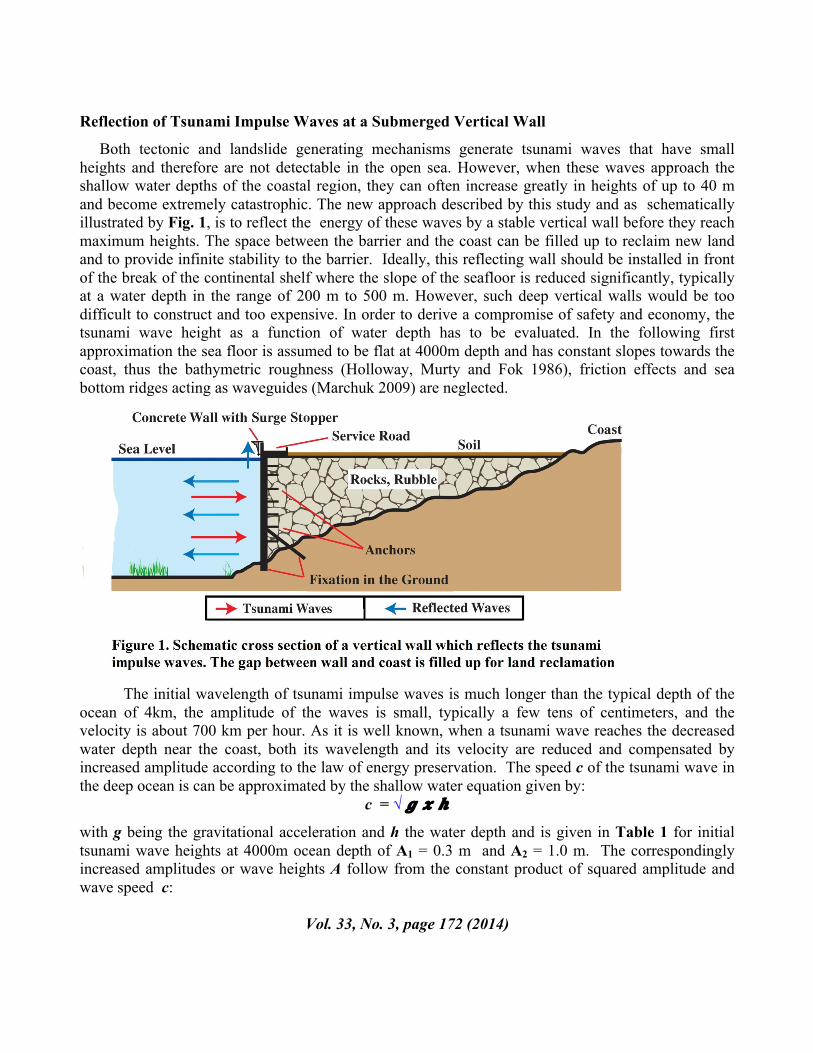
Reflection of Tsunami Impulse Waves at a Submerged Vertical Wall
Both tectonic and landslide generating mechanisms generate tsunami waves that have small heights and therefore are not detectable in the open sea. However, when these waves approach the shallow water depths of the coastal region, they can often increase greatly in heights of up to 40 m and become extremely catastrophic. The new approach described by this study and as schematically illustrated by Fig. 1, is to reflect the energy of these waves by a stable vertical wall before they reach maximum heights. The space between the barrier and the coast can be filled up to reclaim new land and to provide infinite stability to the barrier. Ideally, this reflecting wall should be installed in front of the break of the continental shelf where the slope of the seafloor is reduced significantly, typically at a water depth in the range of 200 m to 500 m. However, such deep vertical walls would be too difficult to construct and too expensive. In order to derive a compromise of safety and economy, the tsunami wave height as a function of water depth has to be evaluated. In the following first approximation the sea floor is assumed to be flat at 4000m depth and has constant slopes towards the coast, thus the bathymetric roughness (Holloway, Murty and Fok 1986), friction effects and sea bottom ridges acting as waveguides (Marchuk 2009) are neglected.
The initial wavelength of tsunami impulse waves is much longer than the typical depth of the ocean of 4km, the amplitude of the waves is small, typically a few tens of centimeters, and the velocity is about 700 km per hour. As it is well known, when a tsunami wave reaches the decreased water depth near the coast, both its wavelength and its velocity are reduced and compensated by increased amplitude according to the law of energy preservation. The speed c of the tsunami wave in the deep ocean is can be approximated by the shallow water equation given by:
c = √ 𝒈 𝒙 𝒉 with g being the gravitational acceleration and h the water depth and is given in Table 1 for initial tsunami wave heights at 4000m ocean depth of A1 = 0.3 m and A2 = 1.0 m. The correspondingly increased amplitudes or wave heights A follow from the constant product of squared amplitude and wave speed c:
Vol. 33, No. 3, page 172 (2014)

wave speed c: 𝑨𝟐 𝒙 𝒄 =𝒄𝒐𝒏𝒔𝒕𝒂𝒏𝒕
and are shown as function of water depth h in Fig. 2 for the two examples of original wave height of A1 = 0.3 m and A2 = 1.0 m. In this figure the positions of proposed tsunami barriers are indicated for depth below mean sea level of 20m, 30m, 40m and 200m. The highest safety is achieved with the 200m deep barrier, but this requires great construction efforts and material transport. The following treatment will be based on the economic TFB barrier of 30m depth, which for most coastlines will give sufficient protection. If from historical studies and geophysical research larger initial tsunami impulse waves cannot be excluded, then TFB of greater depth have to be considered. Also in case of the rare coincidence of a mega-tsunami with a cyclone a wall height of 50m would be preferable.
Breakwaters with different configurations (Takahashi 2002) have preferably been built near the coast or within bays so that they had to withstand the enormous forces of the tsunami wave fronts and of storm surges. A large fraction of breakwaters are composed of caissons sitting on rubble mounds or foundations. Despite theoretical and experimental studies such breakwaters frequently failed because the caissons slit or tilted (Takahashi et al. 2000). A prominent example is the Kamaishi breakwater
Vol. 33, No. 3, page 173 (2014)

which had been celebrated, after 31 years of construction at cost of 1.3 billion USD, as the world’s largest breakwater for the Guinness Book of World Records in 2010. In the 2011 Tohoku Tsunami it failed so that the harbor and the lower part of Kamaishi city were partially destroyed and caused about 1000 fatalities. Besides non-optimized design with caissons on large foundation mound, the slopes on both coastal sides of the breakwater caused the development of large tsunami wave-fronts which was further enhanced by the funneling or focusing effect of the Kamaishi Bay. It will be shown below that a tsunami-flooding barrier to be erected outside the bay would provide safety at significantly lower cost and definitely prevents the funnel effect to increase the tsunami power. If the barriers are not too far from the shore then also the rolling effect of large sea waves from storms will be reduced and thus partially attenuates these waves. Navigation can be arranged by gates in the barrier, which can be closed upon warnings for tsunamis, storm surges or oil-slips .
Table 1. Tsunami Wave Heights and Wave Velocities for original Tsunami Speed of 713km per hour at Ocean Depth of 4000 m
Water Depth Speed (km per hour) Wave Height -----------------------------------------------------------------------------------------------
4000 m 713 0.30 m* 1.00 m**
200 m 160 0.63 m 2.11 m
40 m 71 0.95 m 3.16 m
30 m 62 1.02 m 3.40 m
20 m 50 1.13 m 3.76 m
*Assumed typical value
**Assumed high value
Construction of Tsunami-and Flooding Barriers
Deep-sea construction of barriers is quite demanding - but in principle possible by applying special types of saltwater-resistant concrete. The recently invented novel submarine architecture allows to build above the mentioned stable tsunami and flooding barriers (TFB) very efficiently at relatively low cost. The main components are high-strength steel fences and rocks, which can be used, in the three different technologies described in the following section. In all cases the seafloor has to be dredged to remove soft material to sufficient depth to either introduce the steel pipes and the barrier directly or to form a foundation onto which the barrier can be placed. Divers observe the process, by video cameras, or by remotely operated vehicles (ROV), or by autonomous underwater vehicles. In the first technology a single high-strength steel fence with attached horizontal anchors is inserted into the sea and fixed at the sea floor as shown in Fig. 1. Simultaneously rocks are inserted which stabilize the steel fence and keep it in vertical position. The horizontal connection of the steel fences is achieved by vertical steel pipes, preferably filled with concrete, which are first inserted into the ground. The steel fences are fixed to the pipes by ring hooks and bolts, as shown in Fig. 3. These pipes facilitate repair, if required, by introducing new fences in front of the barrier and connecting
Vol. 33, No. 3, page 174 (2014)

them. However, with a proper type of steel and wire thickness, a minimum barrier life of hundred years can be expected. Instead, the pipes strong steel profiles can be used for horizontal fence connection. The rocks should have edges and corners in order to minimize their moving in the future. The rocks can further be stabilized by inserting gravel or sand, or by inserting horizontal steel fences every three to five meters, deposited to rock thickness. Furthermore the settling of the rocks can be accelerated by vibration, for example by hitting the sides of the wall with heavy weights.
The second technology is based on two parallel steel fences with distance holders which are simultaneously inserted into the sea and which again are stabilized with rocks inserted from the top into the gap between the fences. Also these fences are horizontally connected by vertical steel pipes, rings, hooks and bolts. These double-fence barriers will be important to build large sea reservoirs for applications like tidal energy generation, hydroelectric energy storage and fish farming, as discussed below. In the third technology large elongated gabions, baskets of steel fence filled with rocks, are pre-fabricated before they are inserted into the sea to erect a horizontally long vertical compact barrier. Steel ropes horizontally and vertically connect these gabions in order to prevent their sliding or tilting as observed with caissons of breakwaters. Large amounts of rocks are needed in view of very long tsunami-flooding barriers such as those with depth below 30m and extension of 8m above sea level and a thickness ranging from 5.6m to 20m. Rocks can be obtained from a nearby quarry which, after being removed and created cavities can be used to form a large reservoir for hydroelectric energy storage as discussed below. Other filling materials are rubble, industrial waste, concrete blocks etc. An alternative filling could be obtained by dredging gravel or sand from the seafloor, and in this case the outflow from the barrier has to be prevented by steel plates or by saltwater-resistant fabric inside the steel fences. All metal components of the barrier like fences, pipes, rings, ropes should have the same
Vol. 33, No. 3, page 175 (2014)

composition in order to prevent electrolytic reactions and corrosion. Saltwater-resistant steel, for example, low-carbon steels with high chromium and molybdenum concentration, possibly also containing niobium, will be used, for example US steel 316L/316LN or European steel with numbers 1.4429, 1.4462, 1.4404 or 1.4571 (V4A). Besides being corrosion resistant, these steels have the advantage of a very high tensile strength. The wire thickness of the steel fences should be 3mm to 4mm. The fences should have a certain elasticity depending on their local application, for example in case of double fence barriers the sea-facing fence will need better performance than the fence on the harbor side. The normal fences can be produced in many countries. However, for the barrier section extending above sea level, a specially elastic high-strength steel fence is recommended to withstand the frequent storm surges, as for example the fence ROCCO of Geobrugg, Switzerland. An example of the strength of ROCCO fence is shown in Fig. 4 where falling rocks were stopped. The stability of the steel-fence-rock barriers can be increased by steel ropes, chains or steel beams crossing in front of the barrier and being attached to the steel pipes and to the fences.
On top of the steel-fence-rock barrier, a concrete road (Fig. 5) will be of advantage and serve first in the construction phase as supply road and later as control and service road, which also may be opened for the public. This road is protected against sea waves by concrete walls, a wall of at least 1m, and better than 2m thicknesses on the seaside. Steel beams extend out of this concrete wall and hold surge stoppers (parapet) in order to reduce overtopping by storm waves and to prevent erosion of the upper part of the TFB and of the concrete wall (Scheel 2013a, 2014a,b). These surge stoppers of typically 5 m length are transported by means of hooks and are fixed at the upper beam and also at the
Vol. 33, No. 3, page 176 (2014)

lower end to the TFB. The advantage of these surge stoppers is that they can be replaced, an advantage compared to the earlier proposed fixed “bullnose”, “wave return wall” or “recurve” (Kortenhaus et al.2003, Daemrich et al. 2006). A cross section of a tsunami-flooding barrier with service road, concrete walls and surge stopper is shown in Fig. 5. The double-fence barrier filled with rocks is further stabilized on the harbor side with rocks stabilizing the horizontal anchors. This barrier has a height below sea level of 30 m and has a thickness between 5.6 m and 20 m. The indicated foot reduces scouring, the removal of sand or gravel from below the barrier by sea currents.
Earthquakes or collision by large ships may cause local damage or destruction with the consequence that repairs of the barrier may require great efforts. In order to reduce the complexity of repair, weak spots like gaps may be foreseen within the barrier to facilitate the repair. These gaps are covered by concrete bridges and closed with fences or nets allowing water exchange but prevent large fish to escape or to enter. This barrier with weak spots is shown in Fig. 6.
Vol. 33, No. 3, page 177 (2014)

The surface roughness of the seaside of the barrier as well as its elasticity will determine the degree of reflectivity of the tsunami impulse waves. If for instance there would be a long flat barrier to protect Honshu island of Japan, the reflected impulse waves could travel across the Pacific Ocean and hit Canada and the US. In order to prevent this the barriers could have an angle slightly tilted downwards to reflect in the direction of the Japanese trench, or slightly upward to transform the kinetic energy of impulse waves partially to potential energy to form normal water waves. Otherwise the rough surface of the fence-rock structure will reduce reflectivity and assist to dissipate a significant fraction of the tsunami energy. These described aspects require further investigations for validation. The height of the tsunami-flooding barrier may be divided in order to save rock material and steel fence (Scheel 2013a, 2014a,b). The terrace barrier shown in Fig. 7 built by single-fence technology and horizontal anchors fixed by rocks nevertheless allows to reclaim new land.
Vol. 33, No. 3, page 178 (2014)

Double-Pontoon Technology
Depending on the slope of the continental shelf, the position of 30m-deep barriers will be far out in the sea so that construction of stable vertical walls - including transport of fences, rocks and concrete and working from ships - will be very demanding and only possible at a relatively quiet sea. A relatively simple and efficient technology was invented which facilitates the erection of tsunami-flooding barriers (Scheel 2013.b, 2014.b) whereby the sea waves are damped. First at the coast a stable ramp road is built with sufficient depth so that two parallel pontoons can be attached. In order to carry the heavy loads of trucks with steel-fence rolls and with rocks, these middle pontoons are connected with large external assisting pontoons by means of a steel frame and hanging on steel chains as shown in Fig. 8.
Vol. 33, No. 3, page 179 (2014)

Furthermore the central and peripheral pontoons are connected by steel beams in the middle and at the end and thus allow to lower steel fences in the gap between central and assisting pontoons and between the fixation steel beams. The latter coincide with the position of the vertical steel pipes, which are lengthened after the concrete road is finished. Trucks with rolls of steel fences move onto the central double-pontoon and insert the fences on both sides as shown in Fig. 9.
Vol. 33, No. 3, page 180 (2014)
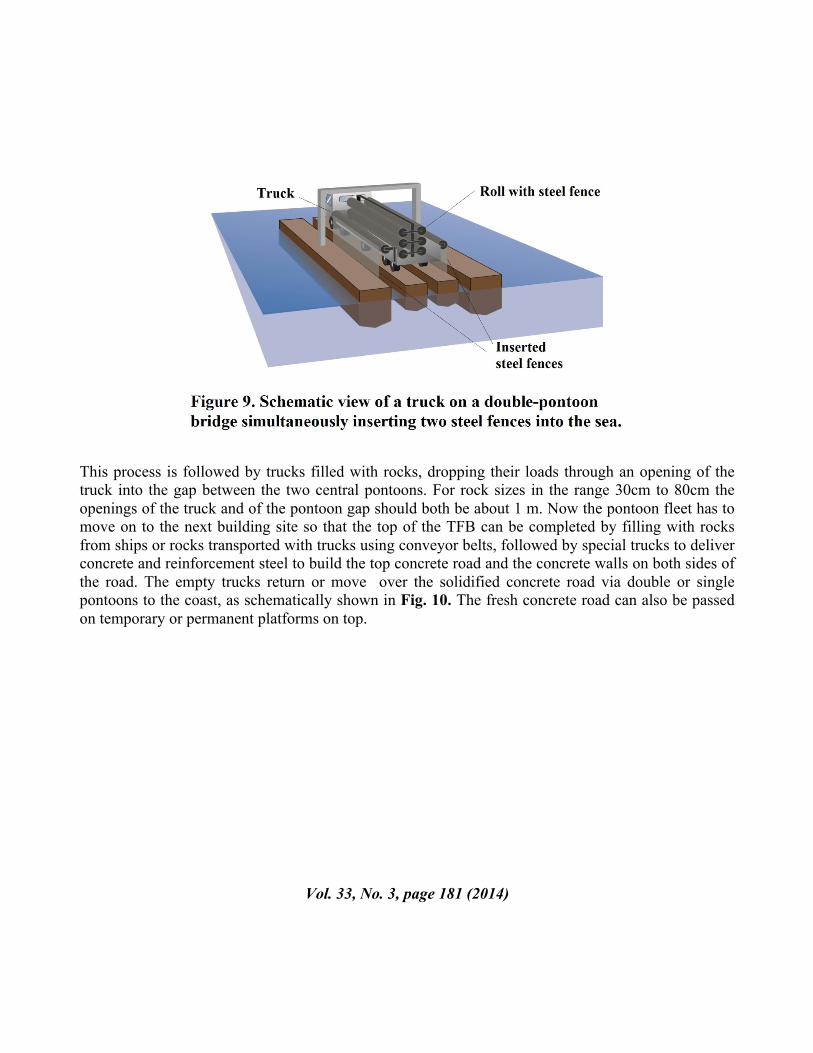
This process is followed by trucks filled with rocks, dropping their loads through an opening of the truck into the gap between the two central pontoons. For rock sizes in the range 30cm to 80cm the openings of the truck and of the pontoon gap should both be about 1 m. Now the pontoon fleet has to move on to the next building site so that the top of the TFB can be completed by filling with rocks from ships or rocks transported with trucks using conveyor belts, followed by special trucks to deliver concrete and reinforcement steel to build the top concrete road and the concrete walls on both sides of the road. The empty trucks return or move over the solidified concrete road via double or single pontoons to the coast, as schematically shown in Fig. 10. The fresh concrete road can also be passed on temporary or permanent platforms on top.
Vol. 33, No. 3, page 181 (2014)

Most of this barrier construction work will be done in seasonal periods of few storms, as for instance in the summer. However, one has to be prepared for storms with waves up to 10m or even higher. Wave attenuation is achieved by large-area stable steel fences floating on the sea by pontoons which are fixed on the seafloor by foundations, anchors, and/or by heavy weights connected by steel chains and steel beams (Scheel 2013b, 2014b). The optimum size (typically between 100 and more than 500m in both horizontal directions) and the water permeability, defined by the openings of the fence, have to be optimized for the specific sea area. The costs of such wave attenuators including fixation may pass 10 million USD, but the fences can be re-used and also be applied in other areas like harbors. These costs can be reduced for temporary wave attenuation by replacing steel fence by wood or polymers with openings. However, these horizontal wave attenuators will not help to stop the tsunami waves, but some wave attenuation can be achieved by vertically hanging steel fences fixed in the bottom of the sea.
Cost Estimates
The protection of coastlines by these new TFB barriers requires tens or even hundreds of km of their length so that such large projects become the obligation of governments, UN Organizations, World Bank, or they can be considered by insurance companies or by wealthy investors or sponsors.
Vol. 33, No. 3, page 182 (2014)
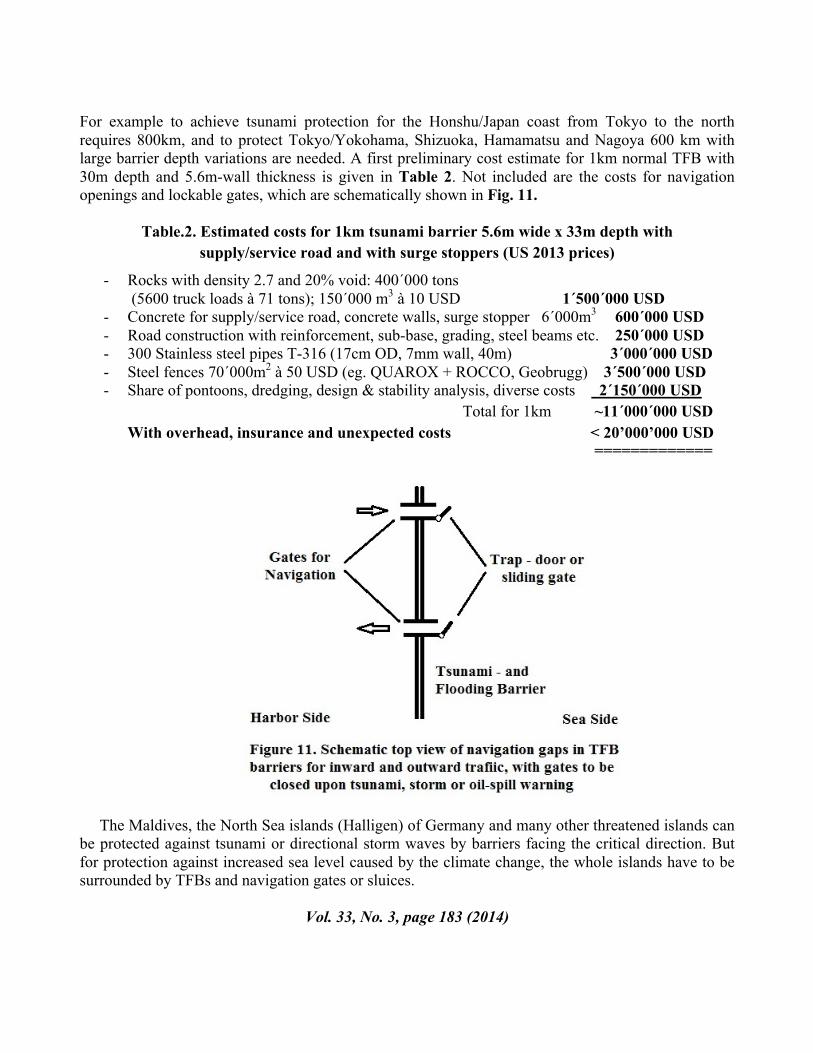
For example to achieve tsunami protection for the Honshu/Japan coast from Tokyo to the north requires 800km, and to protect Tokyo/Yokohama, Shizuoka, Hamamatsu and Nagoya 600 km with large barrier depth variations are needed. A first preliminary cost estimate for 1km normal TFB with 30m depth and 5.6m-wall thickness is given in Table 2. Not included are the costs for navigation openings and lockable gates, which are schematically shown in Fig. 11.
Table.2. Estimated costs for 1km tsunami barrier 5.6m wide x 33m depth with supply/service road and with surge stoppers (US 2013 prices)
- Rocks with density 2.7 and 20% void: 400´000 tons (5600 truck loads à 71 tons); 150´000 m3 à 10 USD 1´500´000 USD
- Concrete for supply/service road, concrete walls, surge stopper 6´000m3 600´000 USD - Road construction with reinforcement, sub-base, grading, steel beams etc. 250´000 USD - 300 Stainless steel pipes T-316 (17cm OD, 7mm wall, 40m) 3´000´000 USD - Steel fences 70´000m2 à 50 USD (eg. QUAROX + ROCCO, Geobrugg) 3´500´000 USD - Share of pontoons, dredging, design & stability analysis, diverse costs 2´150´000 USD
Total for 1km ~11´000´000 USD With overhead, insurance and unexpected costs < 20’000’000 USD =============
The Maldives, the North Sea islands (Halligen) of Germany and many other threatened islands can be protected against tsunami or directional storm waves by barriers facing the critical direction. But for protection against increased sea level caused by the climate change, the whole islands have to be surrounded by TFBs and navigation gates or sluices.
Vol. 33, No. 3, page 183 (2014)

In the following section two specific protection systems will be discussed along with preliminary cost estimates. A practically definite protection of Kamaishi can be achieved by a barrier outside the bay where the funneling effect of the bay is prevented and where the catastrophic tsunami waves have not yet developed, as this is shown in the self-explanatory Fig. 12. It should be noted that the costs are less than 25% of the original Kamaishi large breakwater costs and less than half of its planned repair costs (of which the effectiveness against large tsunami is doubted).
The second example is a barrier to protect the New York Bight, which had been terribly affected by hurricane Sandy, see Fig. 13. The 42km barrier outside the bay would cost less than 2% of the estimated 65 billion USD damage of Sandy whereby the 286 fatalities are not considered. However with the large lockable gates for the significant navigation the total costs of the barrier may double. These barrier installation costs may eventually be at least partially compensated by the applications discussed below.
Vol. 33, No. 3, page 184 (2014)
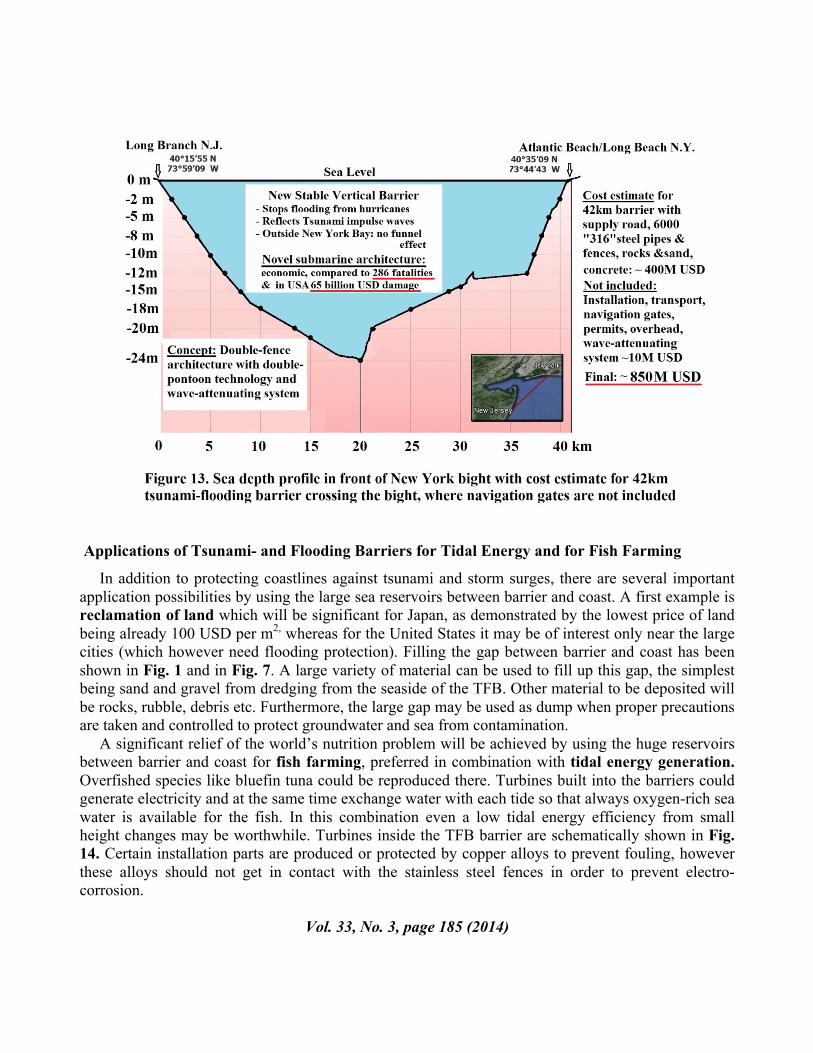
Applications of Tsunami- and Flooding Barriers for Tidal Energy and for Fish Farming
In addition to protecting coastlines against tsunami and storm surges, there are several important application possibilities by using the large sea reservoirs between barrier and coast. A first example is reclamation of land which will be significant for Japan, as demonstrated by the lowest price of land being already 100 USD per m2, whereas for the United States it may be of interest only near the large cities (which however need flooding protection). Filling the gap between barrier and coast has been shown in Fig. 1 and in Fig. 7. A large variety of material can be used to fill up this gap, the simplest being sand and gravel from dredging from the seaside of the TFB. Other material to be deposited will be rocks, rubble, debris etc. Furthermore, the large gap may be used as dump when proper precautions are taken and controlled to protect groundwater and sea from contamination. A significant relief of the world’s nutrition problem will be achieved by using the huge reservoirs between barrier and coast for fish farming, preferred in combination with tidal energy generation. Overfished species like bluefin tuna could be reproduced there. Turbines built into the barriers could generate electricity and at the same time exchange water with each tide so that always oxygen-rich sea water is available for the fish. In this combination even a low tidal energy efficiency from small height changes may be worthwhile. Turbines inside the TFB barrier are schematically shown in Fig. 14. Certain installation parts are produced or protected by copper alloys to prevent fouling, however these alloys should not get in contact with the stainless steel fences in order to prevent electro-corrosion.
Vol. 33, No. 3, page 185 (2014)

The size of the reservoirs allow their division them into sections for different fish sizes, to move the fractions of fish sizes from section to section, and to harvest the final size at the last section. Supply roads separate large fishing reservoirs and allow navigation from the fishing harbor to the open sea as shown in Fig. 15 where a short horizontally inclined vertical barrier prevents propagation of tsunami waves. An example of a supply road is shown schematically in Fig. 16, the concrete walls are of reduced thickness, and surge stoppers are not needed. All openings to the open sea can be locked by gates in case of tsunami warning or oil-spill warning
Vol. 33, No. 3, page 186 (2014)
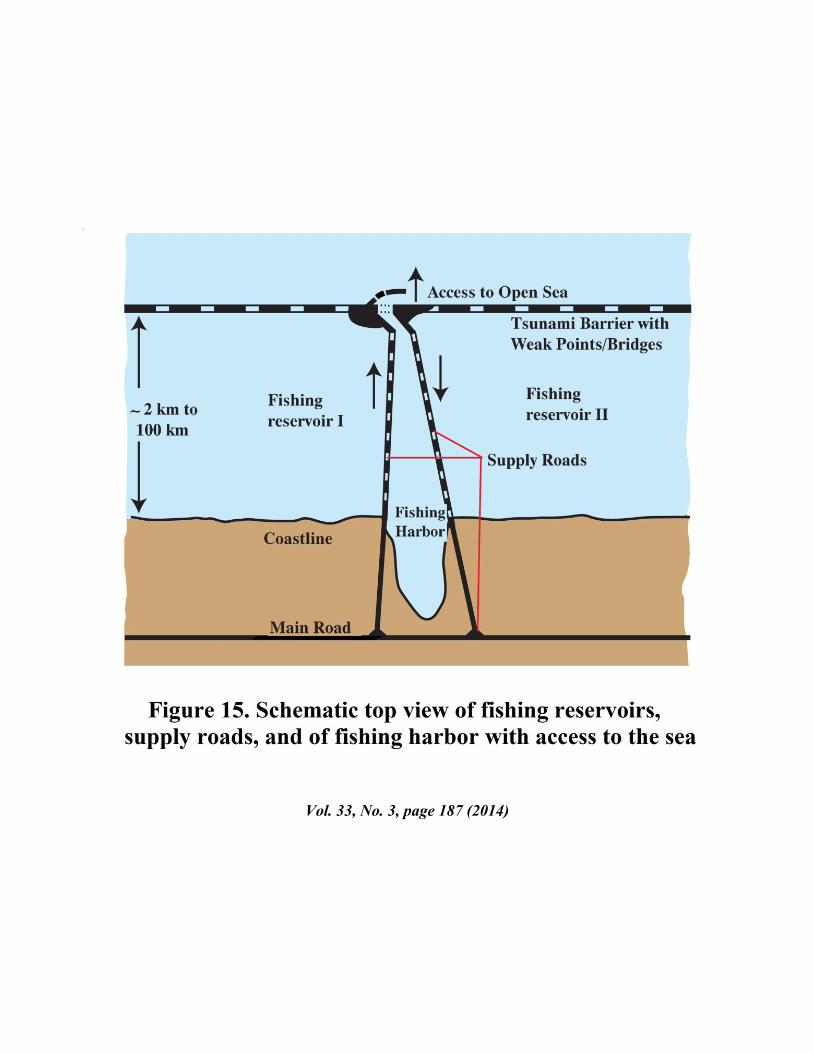
Vol. 33, No. 3, page 187 (2014)

Applications of TFB Barriers for Pumped Hydroelectric Energy Storage
The storage of energy is a widespread problem, which will increase with the development of wind, and solar energy, which inevitably is intermittent. So far, most important hydroelectric energy storage with lakes filling the valleys is approaching its limit due to geographic limitations and to the resistance of people which have to be dislocated. A barrier system for a successful combination of tidal energy and pumped energy storage was installed in Rance, Northern France in 1967, has a capacity of 240 MW, and is still generating electricity for stabilizing the grid. Nevertheless, the use of barriers in the sea has been hindered by their reputation of high construction costs. This may change with the new technology presented in this paper. The new sea reservoirs offer practically unlimited storage capacity, especially when they are arranged at the coasts near the large cities in combination with flooding protection. Fig. 17 shows a schematic top view of large sea reservoirs, I for tidal
Vol. 33, No. 3, page 188 (2014)

energy, and II and III for hydroelectric energy storage where water is pumped with low-cost surplus electricity from II into the storage reservoir III to an upper level of say 12m to 15m. Turbines generate electricity by the potential energy when needed by using the higher water level in reservoir III. A larger potential energy difference can be achieved when a quarry in a nearby mountain or at an elevated site is established in order to produce rocks for building the TFB barriers and at the same time to provide a hydroelectric storage reservoir at a higher level. Here either the rock itself establishes the barrier for the “rock reservoir”, or a barrier is built with fence-rock architecture. Instead of separated pumps and turbines there are advantages with recently developed combined pump-turbines. A specific application of TFB barriers could solve the Fukushima-reactor problem of radioactive water. Large separated reservoirs in the sea with concrete bottom could take up the contaminated water in the first reservoir; pass water through a decontamination stage to the next reservoir and so on until the water of the final reservoir can be released through a long pipe into the Japan trench respectively into the Kuroshio current. This last water may still contain tritium which has a short lifetime, is anyhow found in natural water, and which thus cannot be detected after dilution in the sea.
Protection of Submarine and Off-Shore Buildings by Fence- Rock Architecture
With expected higher sea level due to climate change and with higher intensity of tropical storms the risks for offshore platforms, for wind farms and for bridge pillars will increase. Single-fence-rock structures and double-fence-rock structures used for the TFB barriers will, with geometric modifications, also protect submarine and offshore installations (Scheel 2013a, b, 2014a, b). The
Vol. 33, No. 3, page 189 (2014)

construction is done in analogy to the TFB construction: annular connected fences or double fences with distance holders are filled with rocks or other solids to build a massive wall for protection. The thickness of the structure and the height depend on the maximum possible waves and the maximum expected collision from ships or floating bodies. In general one can expect that a thickness of 1m to 5m around the platform pillars or around the whole platform or around bridge pillars will be sufficient, and the height above sea level may be in the range between 2m and 10m. An interesting aspect is the possibility to efficiently build roads into the sea, for instance to near-shore islands, platforms or wind-farms and to provide thereby reliable transmission of oil, gas and electricity. With the 2012 discovery by Japanese scientists of rare-earth minerals near the coral reef island Minamitorishima the interest in deep-sea mining increased. Also here the steel-fence-rock architecture may become of interest as it allows to produce marking spots and lines and to construct deep-sea walls, fenced areas and buildings, which may facilitate the mining process. In general, geographic markers can be established on the bottom of the sea. Here also, coral reef barriers should be mentioned which can be protected against tsunamis by the submarine architecture with TFB barriers to be built in appropriate distance and depth including the possibility to protect barrier reefs against oil and other contamination from the sea.
Conclusions
The tsunami-flooding barriers will save innumerable lives and protect property and infrastructure and can be constructed with support of governments and organizations. The construction costs will partially be compensated by applications, which are relevant for energy and for food problems of mankind. At the same time, such big projects will stimulate and get major industries involved and thus provide job growth. Such barriers could also allow to withstand some of the oncoming problems of climate change - like sea level rise and greater intensity tropical storms - and thus may help survival for islands threatened by such changes. The new submarine architecture will also protect offshore platforms and other installations in the sea. A main aspect is that the tsunami-flooding barriers can protect fauna, flora, beaches and even coral reefs against contamination.
Acknowledgment The author thanks H. Schüttrumpf/RWTH Aachen, A.Strusinska/LWI Braunschweig and M. Toulios/NTUA Athens for valuable suggestions.
Vol. 33, No. 3, page 190 (2014)
REFERENCES
Annunziato, A.(2007), The Tsunami Assessment Modeling System by the Joint Research Centre, Sci. Tsunami Hazards 26 (2), 70-92.
Annunziato, A., Franchello, G, and Groeve,T.(2012), Response of the GDACS system to the Tohoku earthquake and tsunami of 11 March 2011, Sci. Tsunami Hazards, 31, 283-296.
Arikawa T., Sato M., Shimosako K., Hasegawa I., Yeom G.S., and Tomita T.( 2012),Failure mechanism of Kamaishi breakwater due to the Great East Japan Earthquake Tsunami, in Proc. Coastal Engineering 33, 1-13.
Bryant,E.(2008), Tsunami, the Underrated Hazard, 2nd ed. Chichester UK: Springer & Praxis Publishing. Burcharth H.F. and Hughes S.A.(2011), Types and functions of coastal structures, Engng. Manual, US Army Corps of Eng. Rep. EM 1110-2-1100 Part IV change 3, ch. 2, September 2011. Christian C. and Vennel R.( 2012), Efficiency of tidal turbine farms, Proc. Coastal Engineering 33, 1-10.
Daemrich K.F., Meyering J., Tack G., and Zimmermann C. (2006), Overtopping at vertical walls and parapets-regular wave tests for irregular simulation, Proc. First International Conference on the Application of Physical Modeling to Port and Coastal protection, Coastlab Porto, Portugal.
EPRI (2011), The Electric Power Research Institute (EPRI), Energy storage-packing some power, The Economist, March 3, 2011.
Holloway G., Murty T., and Fok E. (1986), Effects of Bathymetric Roughness upon Tsunami Travel Time, Sci. Tsunami Hazards 4(3)165-172.
Kortenhaus A., Pearson J., Bruce T., Allsop N.W.H., and Van der Meer J.W. (2003), Influence of parapets and recurves on wave overtopping and wave loading of complex vertical walls, Proc. Coastal Structures ASCE, Reston, Virginia, 369-381.
Levin, B. and Nosov, M.(2009), Physics of Tsunamis, Springer Science +Business Media B.V.
Marchuk A.G.(2009), Tsunami Wave Propagation along Waveguides, Sci. Tsunami Hazards 28 (5) 283-302.
NOAA/NGDC (assessed 17.7.2014), Global Historical Tsunami Database, National Geophysical Data Center, NOAA.
Potter, N.L.(2013), “Hanging Ten”; Measuring Big Wave Intensities, Sci. Tsunami Hazards 32(3)195-212.
Rauch E. (2014), Munich Re’s Perspective on Climate Change in the Light of the 5th IPCC Assessment Report, 16th Meeting of The Geneva Association’s Annual Circle of Chief Economists 26 – 27 February 2014, Munich.
Vol. 33, No. 3, page 191 (2014)

Scheel H.J. (2013), Structure and method for protection against tsunami-waves and high sea-waves caused by storms, WIPO/PCT No. WO 2013/030810 A1, March 7, 2013.
Scheel H.J.(2013a), Submarine construction for tsunami and flooding protection, for fish farming, and for protection of buildings in the sea, EP Patent Appl. 13162698.8, April 8, 2013.
Scheel H.J.( 2013a), Submarine construction for tsunami and flooding protection, for fish farming, and for protection of buildings in the sea, U.S. Patent Appl. 13/861, 608, April 12, 2013.
Scheel H.J.(2013b), Double-pontoon-bridge construction of submerged barriers and of off-shore roads, WIPO/PCT Patent Appl. PCT/IB2013/059511, October 21, 2013.
Scheel H.J.( 2014a), New type of tsunami barrier, Natural Hazards, 70, 951-95.
Scheel H.J.( 2014b), Submarine construction for tsunami and flooding protection, for tidal energy and energy storage, and for fish farming, Patent Applications in 9 countries, February 8, 2014.
Srivastava, A., and Sivakumar Babu, G.L.(2009), Analysis and Design of Reinforced Earth Wall for Shore Protection System against Tsunami, Sci. Tsunami Hazards 28(3)186-204.
Strusinska, A.( 2011), Hydraulic Performance of an Impermeable Submerged Structure for Tsunami Damping, Stuttgart: IBIDEM-Verlag.
Takahashi S.(2002), Design of vertical breakwaters, short course of hydraulic response and vertical walls, in Proc. 28th International Conference on Coastal Engineering, Cardiff, Wales UK, July 7, 2002.
Takahashi S., Shimosaki K., Kimura K., and Suzuki A.(2000), Typical failures of composite breakwaters in Japan, Proc. 27th International Conference on Coastal Engineering, ASCE, 1885- 1898.
Vicinanza D., Stagonas D., Müller G., Norgard J.H., and Andersen T.L.(2012), Innovative breakwater design for wave energy conversion, Proc. Coastal Engineering, 33, structures 1, 1-12.
Vol. 33, No. 3, page 192 (2014)

ISSN 8755-6839
SCIENCE OF TSUNAMI HAZARDS
Journal of Tsunami Society International
Volume 33 Number 3 2014
Copyright © 2014 - TSUNAMI SOCIETY INTERNATIONAL
TSUNAMI SOCIETY INTERNATIONAL, 1741 Ala Moana Blvd. #70, Honolulu, HI 96815, USA.
WWW.TSUNAMISOCIETY.ORG