geographic technologies applied to marine spatial planning and integrated coastal zone management
DESCRIPTION
Calado, H. & A. Gil (Editors). 2010. "Geographic Technologies applied to Marine Spatial Planning and Integrated Coastal Zone Management". CIGPT - Geographic Information and Land Planning Research Center. University of the Azores. Ponta Delgada, Portugal. 166 pp. ISBN: 978-972-8612-64-1Keywords: Marine Spatial Planning, Integrated Coastal Zone Management, Geographic Technologies, Marine Resources, GIS, Remote Sensing, Oceanography, Marine Biology, Marine Geology, SDI."Geotechnologies are revolutionizing the management of marine resources. What used to be hidden or inaccessible via traditional methods are now made available through remote sensing, tracking technologies and global positioning systems. These technologies enable the mapping and documentation of ecosystem characteristics for each location such as marine habitats, types of species, living and mineral resources, sea bottom morphology, and environmental condition. The capability of superimposing and analyzing these new data for each location and among various locations ensures a greater alignment with the ecosystem-based approach, which is defined as the overarching principle by the European Commission."TRANSCRIPT


3

4
Scientific EditorsHelena CaladoArtur Gil
Scientific Committee Agustín LoboAldino CamposAna Cristina CostaArtur GilChristopher DamonDavid JohnsonFátima AlvesFátima NavasHelena CaladoNicole SchaeferJorge GonçalvesPeter AugustRui Pedro Julião
Graphic DesignDDDD. Lda
ISBN: 978-972-8612-64-1 August 2010
CIGPT - Centro de Informação Geográfica e Planeamento TerritorialUniversidade dos AçoresRua da Mãe de Deus 13A9501-801 Ponta DelgadaPortugal
5
Sponsors

6
“The problems of ocean space are closely interrelated and need to be considered as a whole”UNCLOS,1982
The introduction of the United Nations Convention on the Law of the Sea (UNCLOS) from 1982 summarizes in a sentence, most of the challenges that Planners face when working on the maritime space. The multidimensional character, the interrelations with fuzzy borders, and mostly, the abysm of the unknown, transform the marine realm with a fantastic opportunity to be creative in exploring new methods for the planning field.
The sea has always been part of our imaginary references and a structural part of our societies: first it was a barrier that no one dare to cross, but also a food and salt supplier; then it challenged men to establish latitude, and mostly longitude, in order to navigate and reduce distances for trading; it kept the world apart until the beginning of the nautical discoveries, but gave us romances, poems, drawings and the most peculiar nautical charts…and yet, we still know very little about ocean space.
The marine technologies are developing faster, the remote observation systems are more reliable, and yet we are not aware of the real ocean carrying capacity or the ecosystem limits to mitigate negative impacts of land based human activities. Coastal zones have already been understood as fragile and the need for specific strategies and planning tools defined. Now, it is time to move to maritime space: navigation, fisheries, recreation, oil and gas exploitation, marine protected areas, wind and wave energy systems, archaeological sites, etc, the sea supports a growing number of uses and activities. Similar to land based
activities these uses can, sometimes, coexist and be developed in different time schedules and levels (surface, water column…) and in some cases multiple uses are beneficial or complementary and others are exclusive. However, the magnitude and extent of their impacts is very different from those on land. The notion of competing (and even conflicting) spatial consuming marine uses and activities lead to the development of management and planning tools adapted to maritime space.
The definition presented on the “MSP Good Practice” (UNESCO-IOC, 2008) of Marine Spatial Management is: “a public process of analyzing and allocating the spatial and temporal distribution of human activities in marine areas to achieve ecological, economic, and social objectives that usually have been specified through a political process. Characteristics of marine spatial planning include ecosystem-based, area-based, integrated, adaptive, strategic and participatory.”
Marine Spatial Management can be considered as a more complex process then land use planning, but it can profit from its technologies and methods. On a first approach, its fundamental to understand the international regulations as those provided by UNCLOS, and the regional seas based organisation, conventions and treaties. Also the European Union has developed several sectored policies concerning marine resources. Therefore law, rules and regulations, national and international, are the first base for Ocean zoning.
The following step will require a strong scientific approach, as it must rely on scientific quality data concerning resources and physical conditions of marine areas. The characterization
Editorial

7
of the existing activities must not be considered the only basis for planning. The resources, their value (economical and non economical) and also their potential for exploitation are as valuable indicators for decision makers. This effort will require an integrated approach and a commom base for knowledge sharing. Geo technologies provide this platform. Spatial representation of maritime uses and activities, as well as resources distribution is a challenging theme. The geo references to different dimensions are more complex and still a developing subject.
Looking at this book we can have a glimpse of this complexity by the different subjects that our authors provided: from administrative layers to marine bird areas, we have a world of spatial representations of marine sectors and themes. These papers present the base for marine spatial planning: the resources, the problems, the conflicts and the management guidelines to face them. Being sector based or thematically approach they will be fundamental to provide the ultimate piece that a marine spatial planner aims: the zoning map. Probably the first zoning map for Ocean Space, was produced with “Tordesilhas Treaty” were Portugal and Spain divided the world, in an imaginary line in the Ocean, to be discovered and colonies to be claimed. The world is far more complex now! But we know the world can not be divided, as also marine uses and activities. Management schemes, Zoning maps, conflict solving Rules, Codes of conduct, they all rely on the same basis: the human need to solve their problems, face their limitations and aim for a better, healthier and vibrant future for next generations. This path is made of several steps on integration, sharing, commitment and science based.
For helping pursuing this goal and take another step to knowledge, also for their contribution to Marine Spatial Planning development, we thank all those involved in this special issue!
Helena Calado

8
Foreword
Perched upon the long, wavy spine we call the Middle Atlantic Ridge, barely visible on the map and easily overlooked amidst the blue of the depth charts, the Azores islands are, nevertheless, the epitome of what science really becomes: integration. Minuscule specks of rock, their roots, however, encroach deep in the grinding force of three tectonic plates: to understand the Azores-land we have to integrate the movements of half the world. Lost in the vastness of the ocean, they, however, split currents and dictate the fate of streams: to understand the Azores-sea we have to integrate the long, coiling path of the Gulf Stream. Whipped by roaring storms or caressed by cool breezes, they, however, master the influence of the winds over continents: to understand the Azores-air we have to integrate trade-winds and anticyclones.And this is what this book on Geographic Technologies applied to Marine Spatial Planning and Integrated Coastal Zone Management” is all about: integration. Information from every quadrant of
science constitutes the raw material for the construction of our understanding of the dynamics of the systems, and it is in the realm of the geographical sciences that those bits are chewed, digested, integrated. The outcome is rich, for it springs out of the most varied contributions; the applications are, for that matter, many and enriching, for they touch a wide range of aspects intersecting the life of humans. Our efforts, though, have for quite a long time been skewed, when trying to fit nature to our needs; fortunately, however, our endeavour has shifted toward our fitting in the natural framing surrounding us. Such a shift in paradigm could hold the secret for our survival, by fostering sustainability through a well woven network of interests, always under the all-encompassing eye of a global view. Only through integration will this goal be achieved; hence the relevance of the continuous search for more appropriate instruments and more adequate systematizations.
António M. de Frias MartinsCIBIO Azores Unit Director &
PI of Island Biogeography and Conservation Research Group
Expectant beneficiary of your work

9
SHALLOW HYDROTHERMAL VENTS AND MARINE PROTECTED AREAS WITHIN THE AZORES ARCHIPELAGOP. Aguiar & A.C. Costa
SPATIAL ASSESSMENT AND IMPACT OF ARTISANAL FISHERIES’ ACTIVITY IN CAP DE CREUSA. Purroy, S. Requena, R. Sardá, J.M. Gili & E. Serrão
EMPIRICAL MODELLING OF BALEARIC SHEARWATER (Puffinus mauretanicus) CENSUS DATA FOR THE PORTUGUESE ATLANTIC A.Bio, A.Meirinho, I. Ramírez & P. Geraldes
GIS-BASED MARINE BIODIVERSITY MAPPING FOR ASSESSMENT OF COASTAL AND MARINE PRIORITY AREAS FOR CONSERVATIONA.Z. Botelho, H. Calado & A.C. Costa
SALMON FARMING IN CHILEAN PATAGONIA: A GROWING THREAT FOR COLD WATER CORALS?L. Fillinger, G. Försterra, V. Häussermann & C. Richter
BUILDING A MARINE SPATIAL DATA INFRASTRUCTURE TO SUPPORT MARINE SPATIAL PLANNING IN U.S. WATERSC. Fowler, B. Smith & D. Stein
GEOGRAPHICAL INFORMATION SYSTEMS (GIS) AS A TOOL FOR THE ENVIRONMENTAL EVALUATION AND MANAGEMENT OF THE COASTAL AREA OF TAZACORTE, LA PALMA (CANARY ISLANDS, SPAIN)L.M. García, C. Sangil, L. Concepción, R.F. de León, J.B. Diez & I.Y.G. Rodríguez
EVALUATION OF MODIS DATA FOR MAPPING OIL SLICKS - THE DEEPWATER HORIZON OIL SPILL CASE (2010)M. Gianinetto, P. Maianti, R. Tortini, F. Rota Nodari & G. Lechi
SYSTEM APPROACH FOR COASTAL ZONE MANAGEMENT: APPLICATION IN SOUTHEAST COAST OF TERCEIRA ISLAND AND GUADIANA ESTUARYM.H. Guimarães, A. Mascarenhas, C. Sousa, T. Dentinho & T. Boski
ANALYSIS OF EPI-BENTHOS DISTRIBUTION AND THEIR POSSIBLE ASSOCIATION TO GARY KNOLL’S PINGO-LIKE-FEATURES ON THE CANADIAN BEAUFORT SHELF: A SMALL-SCALE CASE STUDYK. Jerosch, V.E. Kostylev & S.M. Blasco
GEOGRAPHIC INFORMATION TECHNOLOGIES FOR INTEGRATED COASTAL ZONE MANAGEMENT IN COLOMBIA: A NATIONAL EXPERIENCEP. Lozano-Rivera, C. García-Valencia & A.L. Rodríguez
GOVERNANCE ISSUES FOR OCEAN SUSTAINABILITY: APPROACH TO AZOREAN MARINE JURISDICTIONSL. Paramio
GIS APPLICATIONS IN MARINE RESOURCES MANAGEMENT:EXAMPLES OF SPATIAL MANAGEMENT MEASURES FROM BERMUDAJ.M. Pitt & M.L. Shailer
ASSESSMENT OF WATER-LOGGING EXTENT USING RS AND GIS TECHNIQUES AND ITS POSSIBLE REMEDIAL MEASURES AT THE KOPOTAKSHO BASIN AREA, BANGLADESHS. Rahman, S.H. Rahman & Md.W. Ullah
IDENTIFICATION OF MARINE IMPORTANT BIRD AREAS IN PORTUGALI. Ramírez, J. Andrade, A.Meirinho, P. Geraldes & B. Lascelles
DEVELOPMENT OF A METHODOLOGY TO EVALUATE THE FLOOD RISK AT THE COASTAL ZONEP.D. Raposeiro, C.J. Fortes, M.T. Reis & J.C. Ferreira
DATA REQUIREMENTS AND TOOLS FOR MARINE SPATIAL PLANNINGK.A. Stamoulis
WORKING TOWARD A MULTIPURPOSE MARINE CADASTRE IN THE U.S. TO SUPPORT MARINE SPATIAL PLANNINGD. Stein, C. Fowler, C. Taylor, B. Smith & A. Bode
A PICTURE IS WORTH A THOUSAND WORDS-USE OF GPS ENABLED CAMERA IN GEOSPATIAL MAPPINGA. Wadwani
ECOLOGICAL ASPECTS OF BRINE DISCHARGE INTO SHALLOW BRACKISH BAY - A CASE STUDY OF PUCK BAY, BALTIC SEAA. Wochna
Book Chapters
10
15
23
31
38
46
53
61
68
78
86
94
103
112
120
129
138
148
155
158

10
ABSTRACT
There has been a crescent interest on the scientific, cultural and socio-economical value of the Azorean hydrothermal vents by the Regional Government that has sparked the public interest on these unique ecosystems. The Azores are a privileged region in what concerns hydrothermal systems since it is possible to find most ecological variants of these systems in close proximity (from terrestrial hotsprings to deep-sea vents, passing by shallow marine vents). The shallow marine thermal ecosystems are subject to higher human pressure than their deep-sea counterparts due to their close proximity to the islands. However, at present time, it is the deep-sea Azorean thermal sites that possess a more coherent protection status (Menez Gween and Lucky Strike) since they are considered SAC under the Habitats Directive. Among the shallower vent sites only D. João de Castro hydrothermal vents field is under protection status due to the ecosystem itself (SAC). A revision and a comparison of the protection status of the nine shallow Azorean marine hydrothermal vent sites are here discussed.
Index Terms - Hydrothermal vents; Azores; sustainable development; MPAs
1. INTRODUCTION
The Azores Archipelago is a rich area in hydrothermal vent habitats. Within close proximity it is possible to find not only terrestrial but also several marine hotsprings. Further more, the marine hotsprings environments span from the shoreline to deep-sea vents.
According to the areas defined by the Azores Regional Network of Protected Areas [1] all Azorean shallow marine
vent sites should be considered within the Island Park delineation, with the exception of the hydrothermal vent fields at D. João de Castro Seamount that fall within the Azores Marine Park domain.
Unfortunately, not all shallow vent sites were included within the Island Park, and in the cases in which they were included such was not done with the goal of protecting the hydrothermal ecosystem itself. The later resulted in a protection status miscellaneous that should be reviewed in order to obtain the same conservation status and management level for all shallow marine hydrothermal sites across the archipelago.
On other hand, the protection and conservation status of Azorean deep-sea vents is better defined since two of the three Azorean deep-sea hydrothermal vent filed areas (Menez Gween and Lucky Strike) are classified as SACs [2] within the context of the European “Habitats directive” framework.
2. SHALLOW MARINE VENTS IN THE AZORES
There are a total of nine shallow marine hydrothermal vent sites identified within the Azores Archipelago (Table I). Some of these areas are characterized by an intense degasification in addition to a moderate to high thermal anomaly. One can find the highest variety and number of shallow hydrothermal sites near S. Miguel Island, in the eastern islands group. The western shallow hydrothermal site is found at Flores Island shoreline and is known as Lagedo hostsprings.
SHALLOW HYDROTHERMAL VENTS AND MARINE PROTECTED AREAS WITHIN THE AZORES ARCHIPELAGOP. Aguiar & A.C. CostaResearch Center in Biodiversity and Genetic Resources (CIBIO-Azores), University of Azores, Ponta Delgada, Portugal. E-mail: [email protected].

11
Contrarily to the deep-sea hydrothermal vents protected areas none of the protection levels established for the shallow marine hydrothermal sites were acquired in order to value and protect the hydrothermal ecosystem it self. Even in the case of the hydrothermal vents located at the D. João de Castro seamount the SAC status was attributed primarily according to the habitat category of Reef [3] and only afterwards it was also classified within the other type of sensitive habitats under the “Submarine structures made by leaking gases”.
The shallow marine hydrothermal sites of Lagedo (Flores), Carapacho (Graciosa), Ferraria (S. Miguel) and Ladeira da Velha (S. Miguel) were previously classified as IBAs [4-6].
In Faial Island, the Espalamaca degasification low temperature hydrothermal field is also integrated in a larger protected area designated Baixa do Sul (Canal Faial-Pico) recently classified as a SAC and integrated in the PNIFAI within the sector FAI010. The marine hydrothermal site of Varadouro, also in Faial Island, is located right at the shoreline near the Varadouro village, immediately on the outside limit between two protected sectors of the PNIFAI [7].
Ferraria, Mosteiros, and Ladeira da Velha/Porto Formoso on S. Miguel Island, as well as Espalamaca (Faial) are classified as Protected Areas for Resources Management within the framework of the respective Island Park premises [6-7]. Carapacho (Graciosa) and Lagedo (Flores) are classified as Protected Areas
Table 1 - List of all shallow marine hydrothermal sites within the Azores Archipelago with island location and protection status.
for Habitat or Species Management [4-5]. Varadouro is outside Faial Island Park limits and Ribeira Quente is also not included within S. Miguel Island Park limits [6-7]. According to the present legislation minerals or other geological extractions are either forbidden or conditioned according to a previous technical appreciation at Carapacho, Ferraria, and Ladeira da Velha. Scuba diving touristic activity is also done under specific conditions, after technical approval, at Ferraria [5-6]. It is not clear for the other shallow marine hydrothermal sites which are the use restrictions for its utilization. Such guidelines are essential tools and need to be added to the management plans for all these areas.
3. UNIQUE ECOSYSTEMS
The diversity gradient between the shallow marine hydrothermal ecosystems and the surrounding “common coastal marine environment” is very steep. The unique microbial communities at these sites form vast microbial mats that blend with sea-sponges and algal cover at the ecosystem limits. This biological mixture of two worlds results on a unique ecosystem powered by the two types of primary production on Earth (based on solar energy- photosynthesis; and based on mineral energy- chemosynthesis). Such environmental constraints allow for the co-existence of a high variety of metabolisms and lead to the prediction of a higher microbial diversity at shallow marine hydrothermal sites when compared with the deep-sea microbial communities [8].
Comparatively to the deep-sea and to the terrestrial counterparts, the Azorean Shallow Marine Vents Ecosystem has not been the target of many ecological studies. However, it is possible to say, based on the existing publications, that this ecosystem has a distinct community patterns from the surrounding coastal marine environment even at the invertebrate community level [8-9] worthier of further studies.

12
4. SHALLOW HYDROTERMAL VENTS WITHIN THE AZOREAN SUSTAINABLE DEVELOPMENT CONTEXT
Given the present socio-economic settings the Azores Regional Government is keen on validation of the Azorean natural thermal resources as a mean to promote the archipelago sustainable development being on geothermal energy as a renewable resource or a motor for technical and touristic innovation and development.
4.1. Touristic development
Since early times the Azores are known for their “Caldeiras” and thermal waters. According with a few schollars Thomas Hicking was the first true thermal tourist at the archipelago [10]. Nevertheless the Azorean thermal waters (hydrothermal areas) start to be studied from the scientific perspective at the end of the 18th [11]. The exuberance of the warm seawater near Carapacho or Ferraria was not left unnoticeable.
4.1.1. Wellness tourismHistorically some of these shallow hydrothermal sites have been explored for therapeutically purposes. In some cases there were thermal bath houses constructed within the hot springs vicinity (Varadouro, Carapacho, Ladeira da Velha, and Ferraria) [8, 10]. The decline of the patients number and the disbelief on the therapeutically properties of these hydrothermal sites lead to the closure of the thermal bath houses and to the lack of specialized medical doctors within this field.
Recently, the public demand for alternative natural treatments as well as for the wellness-spa tourism increased and sparked the investment on this sector. Ferraria, Carapacho, and Varadouro thermal bathhouses were or are being recovered as well as the hydrothermal fluids caption systems for the thermal fluids adjacent to these areas. The sustainable exploitation of
such hydrothermal resources within the wellness tourism may lead to an economical and social improvement however it demands an investment on scientific knowledge of the fluid chemistry but has so far lacked on the biological and ecological contextualization for such areas. In order to better promote a sustainable use this resources it would be necessary to develop special management plans for this area that emphasis the maintenance of the hydrothermal ecosystem equilibrium.
Related to this sector, even though not directly, is the usage of marine hydrothermal fluids and “hydrothermal sand” and/or “mud” for cosmetic treatments [12, 13]. In this case the study of the thermal microbial communities and their end products are studied and in some cases recreated in controlled environments in order to mass produce exfoliating or hydrating products just to name a few, that than can be used in treatment spas as well as at the comfort of our homes. Such environmental mining of organisms from these ecosystems may have small impact on the ecosystem itself at the time of the sample extraction. In this case the protection and management measures should be implemented to guarantee that a percentage of the profit of the eventual mass production of these resources reverts for the local community development.
4.1.2. Eco-tourism The constant search for new touristic products to offer within the Azores will eventually lead to a higher number of scuba diving touristic operators offering a “dive within the Azorean natural champagne”. While such offer may increase people’s awareness of the uniqueness of such habitats will also increase the human impact at the sites. The close proximity to the shoreline as well as the shallow depth at which most vents are found increases the vulnerability of theses unique ecosystems. The geological degasification structures are a unique site mingled with the remaining biodiversity of the Azores subtidal marine

13
system. Thus far only Ferraria has a level of protection that refers usage restrictions for scuba diving activity. It would be necessary to promote good practices among touristic diving operators that may offer this product as a way to preserve the habitat equilibrium without compromising the region sustainable development. In addition it would be important to determine a carrying capacity for each shallow marine vent site to facilitate management measures and to cause the least impact possible.
4.2. Biotechnological development
On the last decades quite a few companies specialized on screening for marine organisms enzymes. This type of mining is once more a low impact activity when it is carried on by knowledgeable personal. The need for protection status and management measures in this sector are not necessarily to maintain the ecosystem integrity but mostly to guarantee and promote a regional sustainable development trough the balanced exploitation of such natural resources. The seas cover 70% of the planet earth. The oceans comprise a wide range of ecosystems and habitats that harbor a large biological diversity that may equal a large chemical and genetic diversity. Less than 1% of all marine microorganisms has, thus far, been successfully cultured and therefore offer a unique opportunity to find new enzymes. Last estimates from marine biotechnology indicated that it was worth $2.48bn year. Extreme marine ecosystems enabled the biology to evolve and adapt to high/low temperature (e.g. hydrothermal vents – superheated water); high salinity and even high pressure to name a few characteristics, the Azorean shallow marine vents are no exception [14] and together with the Azores deep-sea and with the terrestrial hydrothermal vents can be a pivot on the biotechnological development of the region. Besides the enzyme mining it is necessary to better understand the biogeochemical cycling of these systems since the hydrothermal fluid mineral
nucleation or mineral concentrations is many times carried on not by a single microorganisms but by a natural consortia that catalyzes the minerals deposition [13].
5. UNIFYING CARACTER
The long Azorean thermal heritage was reflected on a recent census conducted at S. Miguel Island from which it is possible deduct that Azorean society values the preservation and management of their hydrothermal areas specially the shallow marine vent fields and recognizes that they need to be better protected from a conservation status perspective in order to promote a sustainable development. The main value attributed to these hydrothermal systems is related to their unique geological features paired with the mineral depositions integrated in the both touristic sectors reported above. Less people are aware of their high economical value within the biotechnological context [15].
There is no doubt that the Azorean hydrothermal systems are of high level of importance for the Azores Regional Government and that this class is aware of its importance in the biotechnological market. Their protection status is however confusing at this stage with a higher protection level for deep-sea vents hydrothermal sites that due to their location are less impacted, than the protection settings for shallow marine vents, whose location near the islands shoreline put them in at higher vulnerability risk. Ferraria and Ribeira Quente, followed by Carapacho are the best known shallow marine hydrothermal sites near shore [15]. Unfortunately, Ribeira Quente hydrothermal vent field is not included within any reserved or protected area of S. Miguel Island Park [6] at present. By other hand, the current shallow hydrothermal fields were not purposely included in the Island Park protected areas, which resulted in a status miscellaneous that needs to be reviewed in order to obtain the same conservation status for all shallow marine vents across

14
[13] Câmara J., J. Medeiros, and P. AGUIAR, “Estudo comparativo da composição química de lamas e biofilmes termais das Furnas” in Actas do Encontro Internacional de Termalismo e Turismo Termal e III Fórum Ibérico de Águas Engarrafadas e Termalismo p.419-424, 2009.[14] Aguiar, P., C.L. Pereira, C.M. Loureiro, and L. Amaral-Zettler. Bacteria communities at shallow marine thermal vents within the Azores archipelago at the light of the 454 V-tag pyro-sequencing. ICoMM Spring meeting Actas, Woods Hole, MA, EUA. 2009[15] Gaspar C., H. Cabral, J. P. Raposo, T. Sousa, and P. Aguiar, “Nascentes Termais e o seu significado na cultura Açoriana”, Actas do Encontro Internacional Termalismo p.431-436, 2009.
the archipelago. If the protection level was given to the ecosystem itself a base line management policy could be more easily implemented as for example for the Transylvania hydrothermal vents SAC [3]. As a stepping-stone in this process we propose the development of a geo-referenced layer with general ecosystem information on all shallow marine vent sites within the Azores archipelago.
6. REFERENCES
[1] Decreto Legislativo Regional nº15/2007/A from [2] Addendum to Directiva Habitats nº92/43/CEE (2009/1001/UE) from 22 December 2009[3] Directiva Habitats nº92/43/CEE from 21 May 1992[4] Proposal for Flores Island Park by Decreto Legislativo Regional- waiting approval[5] Decreto Legislativo Regional nº45/2008/A from 05 November 2008[6] Decreto Legislativo Regional nº19/2008/A from 08 July 2008[7] Decreto Legislativo Regional nº46/2008/A from 07 November 2008[8] P. Aguiar, Microbial ecology of Azorean hotsprings as revealed by culture and Molecular techniques, Portland State University, Portland, OR, 2005.[9] S. P. Ávila, Processos e padrões de colonização e dispersão dos Rissoidae (Mollusca: Gastropoda) dos Açores. PhD Thesis, University of the Azores, Ponta Delgada, 2005.[10] Motta de Sousa, J. M. O Vale das Furnas. Almedina. Coimbra, 2008. [11] Mosely, H. N., “Notes on freshwater Algae obtained at the boiling springs at Furnas, St. Michael’s, Azores, and their neighbourhood”, J Linn Soc Botany nº 14, pp.321-325, 1874[12] Quintela A., S.F.P. Almeida, D. Terroso, E. F. Silva, F. Rocha, and V. FORJAZ, “Microalgas colonizadoras de Lamas Vulcânicas Açorianas Durante a Maturação”, Actas do Encontro Internacional de Termalismo e Turismo Termal e III Fórum Ibérico de Águas Engarrafadas e Termalismo p.329-336, 2009.

15
ABSTRACT
North western Mediterranean is characterized by a high fishing activity and consequently, the awareness to preserve and protect high ecological important areas has been recently on the scope. Cape Creus is lately being subjected of study in order to assess its values in the frame of European Directives. By combining existing data of artisanal fisheries’ components together with gathered seabed components, a spatial distribution of fishing activity is pretended. A spatial approach has been the main tool when assessing the consistency of fishing pressure onto the seabed. Benthic communities seem to be more affected when overlapping of fishing types occur. Consequently, alternating parceling and seasonal closures among fishing gear types, to minimize the impact onto benthic communities as also setting no-take zones is strongly suggested. The establishment of a MPA in the near future has to be seen for all stakeholders as one step contributing to the sustainability of the ecosystem, once the potential impact of this fishing activity is shown. Mid-scale benefits by means of reducing fishing pressure in the area will enhance both alternative income solutions and spillover offset as a result of habitat recovery.
Keywords: métier, GIS, fishing spatial activity, MPA, fisheries management.
INTRODUCTION
European directives are strongly encouraging to increase the number of marine protected areas in each European country. MPAs have been envisaged not only as a potential tool for conservation
but also as safeguard against most fishing practices, either commercial or recreational, as for tourist attractions; which all together contribute to the decline of biological resources [3]. Cape Creus area is currently being studied in order to evaluate its potential ecological value to become the first MPA offshore from the 1LIFE+Indemares Project, in the frame of the Habitat Directive and Natura 2000 Network as well as the 2Biodiversity Law at the national level. In order to define a first step on the fisheries’ domains in Cap de Creus, an instrumental study pretends to be done by taking advantage of the stocktacking conducted by the FAO-COPEMED Project. Fishing activities increasingly participate in habitat destruction, accidental mortality of non target species, changing functioning and structuring of ecosystems and causing evolutionary shifts in the demography of populations [12]. A direction towards the participation of all stakeholders in fisheries management needs to be taken; worldwide, fishing is affecting the seabed habitat on the continental shelf [10]. The fishing behavior in space and time resulting in a particular area will mark off the habitat impact in a patchy distribution; likewise, levels of disturbance vary among habitat types as a result of fishing intensity and frequency [10]. It is clear that any fishing gear will disturb the sediment and resident community at some degree but not all fishing methodologies affect habitats in the same way. Bottom-fishing activities involving mobile fishing gear have a physical impact on the seabed and the biota living there [10]. Consequently, it is important to know the intensity of the disturbance which will depend on used gear, sediment type and water depth [10].
SPATIAL ASSESSMENT AND IMPACT OF ARTISANAL FISHERIES’ ACTIVITY IN CAP DE CREUSA. Purroy1, S. Requena1, R. Sardá2, J.M. Gili1, E.Serrao3
1 Institute of Marine Sciences, CSIC (ICM-CSIC). Passeig Maritim de la Barceloneta, 37-49. E-08003, Barcelona (Spain), E-mail: [email protected] Centre for Advanced Studies of Blanes, CSIC (CEAB-CSIC). C/ d’accés a la Cala St. Francesc, 14. E-17300, Blanes (Spain)3 Universidade do Algarve. Campus de Gambelas P-8005-139, Faro (Portugal)
“This work was presented by the first author in order to complete the requirements to achieve the degree of Master of Science in Marine Biodiversity and Conservation, within the ERASMUS MUNDUS Master Programme EMBC”.
16
habitat conservation; thus, achieving a well understanding of key communities and fisheries’ distribution is a first step for an integrated management with the main stakeholders, the fishermen.
By taking advantage of the stocktaking of the main fishery components associated with artisanal fisheries, a compilation with other existent regional information from the area is intended in order to find out the main goal. GIS software has been used as the main tool aiming to obtain the most complete conception of the spatial fishing activity in Cap de Creus and to assess the incidence of gears on an unprotected ecosystem. The focus on determining the degree of impact of certain areas according to the coexistence of one or more fishing gears will serve a priori to assess the vulnerability of the existent community types. There is expectation in the relationship between outstanding communities and less exploited areas.
MATERIAL & METHODSStudy area: Cap de Creus
Historically, Cap de Creus has been the first maritime-terrestrial park to be established in Spain in 1998, representing the marine domain in a 22% [11]. Even if the protection figure is already existent, it is intended to extend the protected area to offshore waters comprising shelf, shelf-break and canyon. By considering the depth gradient, a more complete scheme of the system can be offered.
Cap de Creus canyon is the western canyon of the conspicuous underwater canyon system found in the Gulf of Lions. It is an area of complex bathymetry and very nutrient rich from the outflow of several rivers (Rhône River from Gulf of Lions, and the local rivers Ter, Fluvià and Muga). It starts at the continental shelf at about 90-100m depth and it extends up to 5Km off the coast (42°18’49.202 N – 003°34’ 6.000 E). The canyon is oriented northwest-southeast giving a V-shape structure breaking into the open sea. In total is about 95Km long and presents a maximum depth of 2150m.
Accordingly, an approach throughout the spatially definition of fishing activities and their overlapping will serve to value the existent communities’ status. Thus, this is an essential tool to be taken into consideration when analyzing the proposed area to be protected. In order to define the real effort invested in a resource, artisanal fisheries are defined by combining fishing arts, target species, fishing geographical zones and seasonality, the concept of métier is applied [6]. The Mediterranean is characterized by a high diversity of fishing gears and target species; artisanal fisheries are mostly coastal owing boats with a maximum size of 12m and small capital investment [4]. The EU Mediterranean fleet is represented in an 80% by artisanal fisheries [5]. From the point of view of fisheries exploitation, the continental shelf and the shelf-break are the most interesting areas where most of the resources can be found. Coastline and continental shelves host wide range of habitats. Most types of artisanal fisheries extend from the coastline onwards into the continental shelf, decreasing in their frequencies as distance and depth increase [7]. Fishermen’s local knowledge determines seasonality in relation to species behavior and its abundance along the year [15].
The use of GIS tools is often used to account for spatial predictions [15, 9]. In here, an approach to assess vulnerable and less damaged communities combined with spatial coincidence in time of fishing gears has been done.
OBJECTIVES
When studying marine areas for conservation purposes, one of the main objections is to localize the anthropogenic pressure exercised in the area. Fishing tradition has distinguished this area since the old times; however, during the last decades fishing pressure is an evident fact. Just like in other fishing regions in Europe, the Mediterranean faces the problem of reconciling the economic activity with sustainable fish stocks and

17
Winds are strongly a limiting factor in this area. Their high frequency and intensity mark the fishing activity in Cap de Creus which preclude going out in the sea. North from Cape Creus northerly winds dominate the scene along with the rough conditions from the Gulf of Lions, especially during winter season. The so-called Tramontane and Mistral winds (northwest and northern winds respectively) are characterized to be the most frequent, strong, dry, cold and reaching persistences up to several days [14]. In turn, the noted episodes of vertical water mixing along the coast are responsible of the water nutrient enrichment. In Gulf of Roses, Tramontane and south-west and western winds dominate the area, whereas heading south winds lose their intensity.
Regarding the substrate, variability along the coastal region is clearly observed. It ranges from rocky, dark and high coast to lower coast areas. Sandy and muddy bottoms seem to dominate the area, however a mixture of sandy and muddy bottoms as also gravel and rocks complete the substrate composition. In addition, protected seagrass beds can be found on those coastal areas where well-conserved communities of Posidonia oceanica are developed. The southern part of the canyon, in front of Roses Bay, is the broadest and most extensive part of the shelf due to river deposition processes.
Underwater canyons present many areas acting as deep reefs, in where many species form structures where others find refuge. High abundance of corals are present in the rocky bottoms whereas in the deepest parts Maërl beds abound (concentration of species of calcified red seaweed), commonly associated to a high diversity of sessile species. In other cases in the Atlantic has been seen how deep cold corals are an ideal habitat for juvenile and larvae of several fish species. Many of these species have a high commercial value, thus acting again as a refugee from fishing pressure, by allowing the recovery of stocks in depletion. The high regime of currents mentioned above allows the high concentration of particles in the water
The Liguro-Provenzal-Catalan current (aka Northern Current) from the Gulf of Lions, the input from the above mentioned rivers together with strong dominant north winds causing water mixing, make of this area a highly productive zone. Consequently, it is an area conducive to the agglomeration of pelagic fish among others.
The presence of free water currents coming from the Gulf of Lions collide with the outstanding Cape Creus causing its displacement from the coast and allowing littoral currents between this and the coast. Another phenomenon is the deep convection occurring in winter when a maximum in surface salinity combined with strong, cold and dry northerly winds and a cyclonic circulation, known as the Western Mediterranean Deep Water formation [14]. This process produces dense water which sinks to the bottom as a section of newly formed deep water. The cascading effect is been reported as an alternative mechanism to deep water formation in the northern Catalan Sea [8]. Ulses et al. (2008) [16] refer to water cascading and to marine storms as two mechanisms responsible of regulating shelf-slope exchanges causing downwelling to submarine canyons. During winter, the cooling from northwesterly winds destratify and increase in density water from the shelf enabling the plunging down the slope.
The current system along the Gulf is strengthen and accelerated by the wind, receiving the south westernmost part of the Gulf, the highest intensity. In this extremity, the narrowing of Cap de Creus shelf together with the offshore limitation by Cape Creus Canyon, result in a larger acceleration of currents. A well-figured simulation of currents in the area can be found in Ulses et al. (2008). The spreading of continental influence on waters is preferred for spawning as shown in studies with anchovy by Salat (1996), coinciding with the water stratification period in spring and summer, which otherwise would be nutrient poor.

18
location of fishing gears and the related items. ArcView and ArcCatalog 9.3 GIS (ESRI Corp., Redlands, California) software in combination with the Spatial Analyst extension has been used to spatially distribute the data and to obtain the resulting maps.
Data structure and analysisAll the information used in this case study has been obtained from public sources and institutions. In order to frame the area of interest based on the available information, a fishnet of 500x500m square cell (0.25 Km2) has been created. The fishnet has been set over the study area and those grids associated to the inland part have been deleted, thus containing each grid associated qualitative marine data. The result obtained is a 4581-cell grid covering a surface area of 1145.25 Km2. This methodology has been recently used to merge sparse data to map bird communities [3] or to mark out the boundaries of MPA in the Mediterranean [14]. Cell grids provide harmonization and reduce the complexity of spatial datasets, particularly when combined, due to each cell has a unique cell code identifying resolution, row and column.
Information processing:Adaptating available existent layer files in order to convert those using GIS extensions and applications to suit to the fishnet of study. Geoprocessing tools (Spatial joining, merging, dissolving and clipping) have allowed fusing and combining the information ensuring that each cell grid encloses each feature. The selecting tool from the attribute table has permitted to map for each of the selected variables in study.
Coverage layers referring to bathymetry, substrate and bionomy have been provided by CSIC scientists who had previously created these layers for other projects.
Layers referring to Coastline, European rivers, ports and others have been obtained from available European and regional sources (such as DARP –Department of Agriculture & Fisheries).
column, serving to feed many organisms. Additionally, cetacean species are also associated to underwater canyons such are finback whales and bottlenose dolphins and striped dolphins.
Topography of the area is already very precise but biology still needs to be defined. Due to the previous projects HERMES (UE) and DEEP CORAL (National Project), a bioprospection from Cap de Creus canyon has been done. However, a deeper study on the ecology and biology will allow establishing more adequate protection measures. By using ROV and manned submergible vehicle images, a high abundance of cables and abandonment fishing gears has been detected showing the impact of fishing activities in the area. It is known that the past trawling activity destroyed many areas on the continental shelf and slope; this is supported by the presence of surviving species in similar habitats, which are known to be in unreachable areas, far from the fishing pressure. The impoverished mud communities in the continental shelf might be a consequence of: i. major activity of bottom trawling by boats, ii. instability of the substrata which is mainly composed by carcasses of bivalves and detritus, together with the slope of the area make colonization and settlement of sessile species even harder [11].
Data collectionThe information regarding artisanal fisheries in Cap de Creus was obtained throughout questionnaires circulated around fishermen in the area of Catalonia between December 2000 and March 2001 by the regional FAO consultant. The surveys consisted in interviewing either the majors or the secretariat of the fishing guilds and fishermen representing the main métiers in the area in order to fill in a sheet for each of them. The use of surveys to the fishing communities has been seen in other studies [13, 9] to provide a good assessment for fisheries.
Spatial structureThe GIS software allows the spatial
19
by excluding thus, minor gears. The added values can then be ranged from 0 to 4. The lack of fishing gears detected in an area obtains the value of 0, for those areas where only one fishing gear acts 1 is the given value, when two of the gears overlap get a value of 2, and when up to three of the fishing gears coincide the rating is 3. A value of 4 has not been obtained meaning that in any area the confluence of all arts has been recorded. The resulting map reflects the limitations in the coexistence of particular fishing types, i.e. trammel nets and longlines hardly coincide due to the incompatibility of their fishing methodologies.
Key communitiesOnce the spatial distribution of fishing types and the value regarding the degree of impact of such activities have been set, it was time to assess the local communities. The existent major communities to preserve include coral reefs, sponge gardens or maërl beds (calcareous algae) as other hard substratum communities.
DISCUSSION
To protect not only species but also communities there is a need to know those habitats exposed to more exploitation than others. In this study one can see how the seabed experiences different levels of fishing activity; those areas subjected to a greater effect correspond to areas relatively undisturbed by natural perturbations (i.e. muddy areas) unlike areas suffering of high environmental influence with unconsolidated sediment being predominant. It is important knowing the benthic characteristics to ensure that fishing closures in no-take or partially protected areas do not cause a displacement to other vulnerable areas. An opportunity for protection of particular areas where ecologically important species have been recorded is by taking into consideration spatial distribution when managing.
The partition of fishing activities is an effective approach for habitat conservation. Both, areas used
The coordinate reference system employed is the Universal Transverse Mercator (UTM), UTM zone 31, using the World Geodetic System 84 (WGS84) as the geodetic datum for storage and analysis.
RESULTS
A complete map has resulted from combining layers with the data regarding type of substrate (bottom quality), bathymetry and fishing zone. Consequently, each cell grid contains a value attributed to each characteristic, allowing their combination for a spatial scale. The resulting spatial distribution for each fishing gear type acting on the area of Cap de Creus has been obtained by using a total number of 73 métiers. Accordingly, the composition of artisanal fisheries’ gear in the Mediterranean is commonly dominated by trammel nets gillnets and longlines as also seen in other studies [2]. The use of one versus the other may vary with the fishing season, target species’ behavior and particularly in this area, due to the environmental conditions; hereby, the provided data by métiers is considered to be more accurate when spatially distributing their action of activity because it encompasses the local tradition. Notwithstanding, to generally assess the potential influence for each type of gear, the métier concept has been eventually grouped when visualizing the results. Because the purpose of study pays particular interest in analyzing the offshore part of the area of Cape Creus and in more detailed the proposed area to protect from the LIFE+Indemares Project, a focus in the already known key communities has been made, as the most well conserved, representative and emblematic communities.
Overlap valueAn overlap value has been set to define the coincidence in space of two or more fishing gears and to detect the degree of impact over the system (see Figure 1). Only those gears previously considered as acting in a broader scale over the area of study for protection have been considered

20
the existence of activity of three gear types. Therefore, there is a relationship of well-conserved communities and the incidence degree of fishing activities. Because of the extent of fishing activities in the local economy and the urgency in protecting certain marine habitats and species, MPA planning and management should be conducted on a multidisciplinary basis [1].
CONCLUSION
This study is intended to be an approach for artisanal fisheries; however, for more concise results regarding global fishing activities, such vessel monitored system data (VMS) to assess fishing by semi-industrial and industrial fleets should be recovered. Notwithstanding, it is important to note that most of the semi-industrial fleet move away from Cape Creus, off to waters from the Gulf of Lions. In addition, environmental (i.e. currents), socioeconomic (i.e. type of fishing gear) and geophysical (i.e. narrowness of the shelf) components in the area, make of artisanal fisheries the prevailing activity.
There is an ongoing need to review artisanal fisheries in the Mediterranean through recurring debates on the future status of fisheries. Bearing in mind that data used for this case study was collected between December 2000 and March 2001 and that fishing activity’s consequences are observable on a large-scale, continuous monitoring must be highlighted in order to promote a responsible development respecting both the environment and fisheries.
Conservation needs to be seen from a more integrated and proactive perspective, assuming the relation of protected spaces with the surrounding territories and with human uses. Looking for coherent ways of territorial ordination will keep the functions and natural services. Involving local communities in taking the most profit of the economic potential of MPAs needs to be highlighted when planning with stakeholders [1].
exclusively by unique fishing gears (i.e. parceling) or areas shared seasonally by two or more participants (i.e. considering target species’ behavior) have seen to work and to avoid conflict among the several sectors [10]. Thus, this is an excellent consideration when managing areas where ecologically important species have been recorded, to ensure their protection and the sustainability of the ecosystem. This seems to work well for benthic communities; nevertheless, to fully protect mobile species and their habitats it is urgent to identify the so-called Essential Fish Habitats, which not only encompass areas for nursery and spawning, but areas as relevant to keep up other stages of their life cycles such are food or predator avoidance sites [10]. A spatial overlap implies a greater impact onto the carrying capacity of the system and an impoverishment in the seabed. This reflects the degree of impact that destructive gear cause over habitats. Contrarily, by analyzing those areas with less confluence of different fishing gears, one can see a higher abundance of key communities for protection. Some benthic communities characterized by providing abundant biogenic structures are considered rich epifauna and thus as target species for conservation [10]; these include coral reefs, sponge gardens or maërl beds (calcareous algae) as other hard substratum communities. These communities are most well-conserved, representative and emblematic. In Cape Creus, cold coral, brachiopoda, ceriantharia, pennatulacea, gorgonians, sponges and detritic littoral sandy mud habitats are the key communities known up to date (see Figure 2).
When comparing bionomy and overlap value maps, it is seen how areas with higher ecological interest coincide with less overlapping of fishing gears, with values ranging from 0 to 2. The percentage of coverage of either one or none type of fishing reach a 60%, the confluence of 2 fishing gear correspond to 29% whereas only an 11% of the major area of study from the LIFE+Indemares Project shows
i) LIFE+INDEMARESLIFE07/AT/E/000732 ii) Law 42/2007, December 13th, Natural and Biodiversity Heritage

21
profondes 215:165-189[10] Forcada A, Valle C, Sánchez-Lizaso JL, Bayle-Sempere JT, Corsi F (2010) Structure and spatio-temporal dynamics of artisanal fisheries around a Mediterranean marine protected area. ICES Journal of Marine Science 67:191-203[11] Kaiser MJ, Collie JS, Hall SJ, Jennings S, Poiner IR (2002) Modification of marine habitats by trawling activities: prognosis and solutions. Fish and Fisheries 3:114-136[12] Orejas C, Gili JM (2009) Caracterización física y ecológica de la franja costera, plataforma continental y cañón submarino de Cap de Creus, Spanish Council for Scientific Research[13] Pikitch EK, Santora C, Babcock EA, Bakun A, Bonfil R, Conover DO, Dayton P, Doukakis P, Fluharty D, Heneman B, Houde ED, Link J, Livingston PA, Mangel M, McAllister MK, Pope J, Sainsbury KJ (2004) Ecosystem-Based Fishery Management. Science 305:346-347[14] Requena S (2009) Georeference compilation of information for the identification of possible SPAMI’s in the Mediterranean areas beyong national jurisdiction. Regional Activity Center for Specially Protected Areas (RAC/SPA) UNEP, Tunis[15] Rocha F, Gracia J, González ÁF, Jardón CM, Guerra Á (2004) Reliability of a model based on a short fishery statistics survey: application to the Northeast Atlantic monkfish fishery. ICES Journal of Marine Science 61:25-34[16] Salat J (1996) Review of hydrographic environmental factors that may influence anchovy habitats in northwestern Mediterranean. Scientia Marina 60 (Supl.2):21-32[17] Stelzenmüller V, Maynou F, Martín P (2007) Spatial assessment of benefits of a coastal Mediterranean Marine Protected Area. Biological Conservation 136:571-583[18] Ulses C, Estournel C, Bonnin J, Durrieu de Madron X, Marsaleix P (2008) Impact of storms and dense water cascading on shelf-slope exchanges in the Gulf of Lion (NW Mediterranean). Geophysical Research 113
REFERENCES
[1] Badalamenti F, Ramos AA, Voultsiadou E, Sánchez-Lizaso JL, D’Anna G, Pipitone C, Mas J, Ruiz Fernández JA, Whitmarsh D, Riggio S (2000) Cultural and socio-economic impacts of Mediterranean marine protected areas. Environmental Conservation 27(2):110-125[2] Cadiou G, Boudouresque CF, Bonhomme P, Le Diréach L (2009) The management of artisanal fishing within the Marine Protected Area of the Port-Cros National Park (northwest Mediterranean Sea): a success story? ICES Journal of Marine Science 66:41-49[3] Carboneras C, Requena S (2010) GIS Mapping of seabird distribution - A Pan Mediterranean perspective. 39th CIESM Proceedings, Venice, Italy 10-14 May 2010, Rapp. Comm. Int. Mer. Medit 39, p. 468[4] Claudet J, Pelletier D (2004) Marine protected areas and artificial reefs: A review of the interactions between management and scientific studies. Aquatic Living Resources 17:129-138[5] Colloca F, Crespi V, Cerasi S, Coppola SR (2004) Structure and evolution of the artisanal fishery in a southern Italian coastal area. Fisheries Research 69:359-369[6] COM (2002) 535 final. Communication from the Comission to the Council and the European Parliament laying down a Community Action Plan for the conservation and sustainable exploitation of fisheries resources in the Mediterranean Sea under the Common Fisheries., Brussels[7] Coppola (2006) Inventory of artisanal fisheries communities in the central and western Mediterranean. In: Department FF (ed) Studies and Reviews General Fisheries Commision for the Mediterranean 77[8] Demestre M, Lleonart J, Martín P, Peitx JA, Sardà F (1986) L’Oceanografia. II. Recursos pesquers de la mar catalana, Vol 9. Diputació de Barcelona. Servei del medi Ambient, Barcelona[9] Fieux M (1974) Formation d’eau dense sur le plateau continental du Golfe du Lion. Colloques Internationaux du CNRS sur la formation des eaux océaniques

22
Fig. 2 - Existent key communities in the study area from Cape Creus
Fig. 1 - Overlap value in the study area from Cape Creus

23
ABSTRACT
Marine Spatial Planning for seabird protection requires identification of Important sea Bird Areas and, therefore, insight into bird distributions and status. Generally based on transect counts from ships, distribution maps can be built considering spatial patterns as well as bird-environment relationships. Balearic Shearwater May and October densities in the Portuguese Atlantic area were modelled using: geostatistical, multiple regression and regression kriging methods. While kriging reproduced the observed patterns best, regressions with environmental variables allowed better understanding of bird distributions, which could be related to batimetry, distance from coast, chlorophyll a and sea surface temperature. Regression kriging performed better than regression. Regression also enabled bird density prediction where and when observations were missing. Applications of our models to a vaster area and later time period, which constitute spatial and temporal extrapolations of the models, failed to reproduce important spatial patterns.
Index Terms — seabirds, GLM, kriging, regression kriging, GIS
1. INTRODUCTION
Seabirds are the most threatened of all birds worldwide [1] and pelagic seabirds, which visit land only for short periods of time, are the least known, yet most representative of ocean ecosystems [2]. They are threatened by anthropogenic activities causing loss of feeding grounds
and prey, fisheries bycatch and oil spills within their foraging grounds and migratory routes [3, 4].
Recently, Marine Protected Areas have been extended to protect off-shore marine areas, instead of protecting only breeding colonies on land [2]. Marine distributions are, however, technically difficult to study and monitor, and highly variable, as birds are very mobile, occurring associated to dynamic habitat features like food availability. To understand and model seabird distribution, ecologically meaningful approaches are needed, such as the characterization of bird-habitat relationships, relating observed bird presences or densities to environmental conditions [5, 6]. The idea is to gain insight into the causes of distribution patterns, to be able to understand observed patterns and to estimate distributions for the extremely vast area that could not be sampled, or for other time periods or potential scenarios.
Multiple regression models have been used for this purpose, generally including oceanographic variables, such as water depth and distances to breeding colonies or the shore [6], and sea surface temperature and chlorophyll a concentration, which are considered useful proxies of water mass distributions, frontal systems, and ocean productivity [7], characterizing the oceanographic habitats of seabirds [e.g. 8, 6]. These regression models tend, however, to explain only a small part of the observed variability, suggesting that the model has an inadequate structure or complexity, or that it misses (unknown or unavailable) factors affecting species distribution. Part
EMPIRICAL MODELLING OF BALEARIC SHEARWATER (Puffinus mauretanicus) CENSUS DATA FOR THE PORTUGUESE ATLANTICA. Bio1, A. Meirinho2, I. Ramírez2 & P. Geraldes2
1CIMAR/CIIMAR – Centro Interdisciplinar de Investigação Marinha e Ambiental, Universidade do Porto, Rua dos Bragas 289, 4050-125 Porto, Portugal. Email: [email protected]. 2SPEA – Sociedade Portuguesa para o Estudo das Aves, Avenida da Liberdade, nº 105, 2º Esq, 1250-140 Lisboa, Portugal.

24
of the non-modelled variability may have spatial structure, or autocorrelation, which can be geostatistically modelled and used to improve regression predictions [9]. This method, generally called regression kriging, allows a better spatial estimation or interpolation for a sampled area, but does not allow predictions for non-sampled periods.
In the present study spatial and temporal patterns of Balearic Shearwater (Puffinus mauretanicus) distribution off the Atlantic Portuguese coast were assessed. Transect-observation data collected
in May and October were modelled with species-environment multiple regressions, through geostatistical analysis and through regression kriging, combining regression model estimates with the estimated spatial autocorrelation component of their residuals. Observed and modelled spatial patterns and bird densities were compared, considering the modelled time periods and sample sites. Regression models were further validated on an external data set, predicting bird densities for May and October of one year that had not been used for model building.
2. MATERIALS AND METHODS
2.1. Censuses
According to the International Union for the Conservation of Nature and Natural Resources (IUCN), the Balearic Shearwater, Puffinus mauretanicus (Lowe, 1921), is a Critically Endangered seabird which is endemic of the Balearic archipelago where it breeds [10]. In Portugal, this species occurs year-round with higher abundances during autumn/winter and when migrating to their breeding territory [11, 12]. They flock mainly on the Atlantic coast between Figueira da Foz and Aveiro, and the area between Cascais and Cabo da Roca, occasionally forming groups of more than 1000 birds. For modelling, we considered May and October records, pooling data from 2005 to 2007. Predictions for the whole study area were done on 2008 data. Data were obtained from the Marine IBA LIFE Project [2], with surveys based on a modified version of Tasker’s
methodology [13], as recommended by the European Seabirds at Sea Group [14]. Data were collected in transects defined by a period of time (normally 5 minutes). All birds in contact with the water inside the pre-defined transect were counted, and birds in flight were counted taking regular snapshots to not over-estimate the density.
2.2. Environmental data and GIS
To allow bird density estimations for the whole area of interest, we considered only variables available for that area: batimetry (courtesy of the Portuguese Hydrographical Institute), distance from the Portuguese coast, mean monthly chlorophyll a (CHLO) and mean monthly night-time sea surface temperature (SST) (Table 1). Sample CHLO and SST values were extracted from the mapped MODIS Aqua satellite level 3 products (http://oceancolor.gsfc.nasa.gov), with cell-size of ~4x4 km, considering the respective month (May or October) and years (2005
Table 1 - Summaries of environmental data at the sampling sites, used for modelling, and those for the whole study area, used for spatial and temporal extrapolation. Mean values are given, with minimum and maximum values in brackets.
25
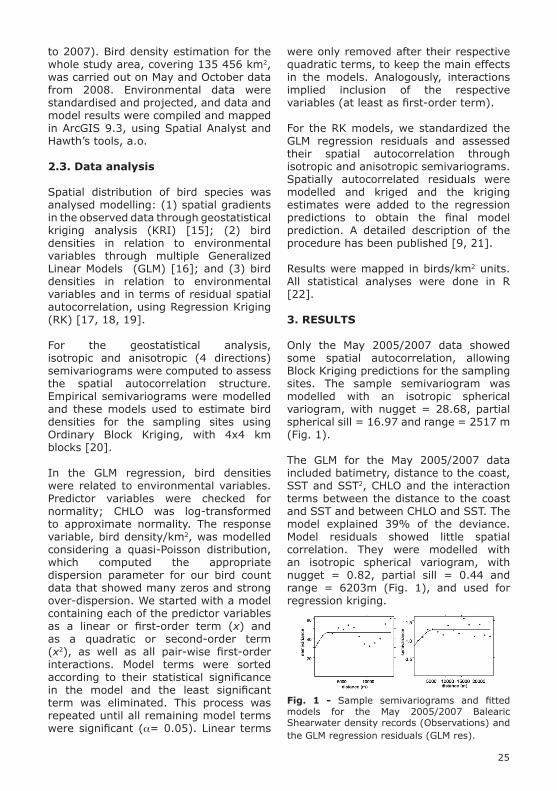
Fig. 1 - Sample semivariograms and fitted models for the May 2005/2007 Balearic Shearwater density records (Observations) and the GLM regression residuals (GLM res).
to 2007). Bird density estimation for the whole study area, covering 135 456 km2, was carried out on May and October data from 2008. Environmental data were standardised and projected, and data and model results were compiled and mapped in ArcGIS 9.3, using Spatial Analyst and Hawth’s tools, a.o.
2.3. Data analysis
Spatial distribution of bird species was analysed modelling: (1) spatial gradients in the observed data through geostatistical kriging analysis (KRI) [15]; (2) bird densities in relation to environmental variables through multiple Generalized Linear Models (GLM) [16]; and (3) bird densities in relation to environmental variables and in terms of residual spatial autocorrelation, using Regression Kriging (RK) [17, 18, 19].
For the geostatistical analysis, isotropic and anisotropic (4 directions) semivariograms were computed to assess the spatial autocorrelation structure. Empirical semivariograms were modelled and these models used to estimate bird densities for the sampling sites using Ordinary Block Kriging, with 4x4 km blocks [20].
In the GLM regression, bird densities were related to environmental variables. Predictor variables were checked for normality; CHLO was log-transformed to approximate normality. The response variable, bird density/km2, was modelled considering a quasi-Poisson distribution, which computed the appropriate dispersion parameter for our bird count data that showed many zeros and strong over-dispersion. We started with a model containing each of the predictor variables as a linear or first-order term (x) and as a quadratic or second-order term (x2), as well as all pair-wise first-order interactions. Model terms were sorted according to their statistical significance in the model and the least significant term was eliminated. This process was repeated until all remaining model terms were significant (a= 0.05). Linear terms
were only removed after their respective quadratic terms, to keep the main effects in the models. Analogously, interactions implied inclusion of the respective variables (at least as first-order term).
For the RK models, we standardized the GLM regression residuals and assessed their spatial autocorrelation through isotropic and anisotropic semivariograms. Spatially autocorrelated residuals were modelled and kriged and the kriging estimates were added to the regression predictions to obtain the final model prediction. A detailed description of the procedure has been published [9, 21].
Results were mapped in birds/km2 units. All statistical analyses were done in R [22].
3. RESULTS
Only the May 2005/2007 data showed some spatial autocorrelation, allowing Block Kriging predictions for the sampling sites. The sample semivariogram was modelled with an isotropic spherical variogram, with nugget = 28.68, partial spherical sill = 16.97 and range = 2517 m (Fig. 1).
The GLM for the May 2005/2007 data included batimetry, distance to the coast, SST and SST2, CHLO and the interaction terms between the distance to the coast and SST and between CHLO and SST. The model explained 39% of the deviance. Model residuals showed little spatial correlation. They were modelled with an isotropic spherical variogram, with nugget = 0.82, partial sill = 0.44 and range = 6203m (Fig. 1), and used for regression kriging.

26
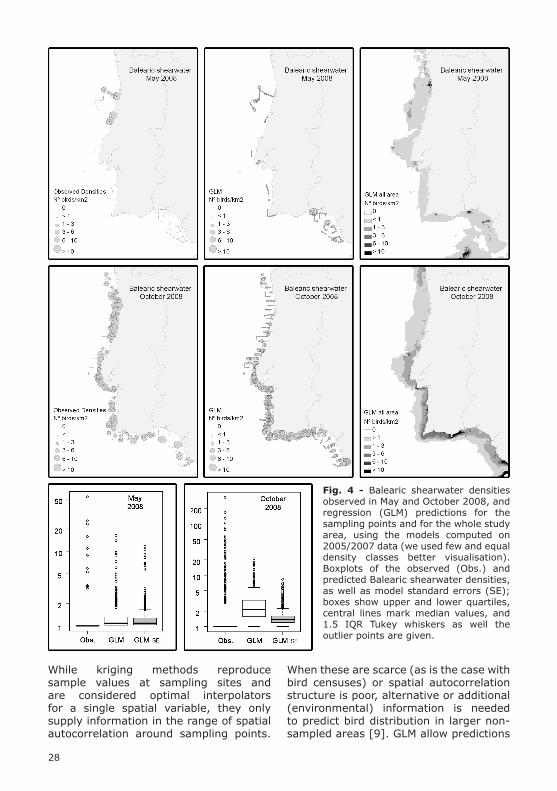
Fig. 2 - Maps of Balearic Shearwater densities observed in May 2005/2007, and respective regression (GLM), kriging (KRI) and regression kriging (RK) predictions (we used few and equal density classes for better visualisation). Boxplots of observed (Obs.) and predicted Balearic shearwater densities, as well as model standard errors (SE) and variances (VAR); boxes show upper and lower quartiles, central lines mark median values, and 1.5 IQR Tukey whiskers as well the outlier points are given.
Fig. 3 - Maps of Balearic Shearwater densities observed in October 2005−2007, and respective regression (GLM) predictions (we used few and equal density classes for better visualisation). Boxplots of observed (Obs.) and predicted densities, as well as model standard errors (SE); boxes show upper and lower quartiles, central lines mark median values, and 1.5 IQR Tukey whiskers as well the outlier points are given.

27
October 2005/2007 data and GLM residuals did not allow variogram modelling. The October GLM included batimetry, distance to the coast, SST, CHLO and the interaction terms between batimetry and CHLO and between the distance to the coast and SST, explaining 25.9% of the deviance.
Model predictions for the sampling points did not consistently reproduce the observed species distribution patterns. For the May data (Fig. 2), regression failed to predict bird accumulation near the central east coast, which was partially predicted by the kriging model. Regression kriging reproduced the observed distribution better. For October only regression models were feasible. The GLM failed to predict most densely occupied sites in the north (Fig. 3). While mean densities for the 2005/2007 data were approximately the same for observations and all model predictions (~0.9 for May and ~0.8 for October), the ranges of model predictions were always smaller than those of the observed densities and medians were higher, showing the smoothing effect of the modelling procedures. For the May 2005/2007 data (Fig. 2), the GLM produced the smoothest results with the highest errors, whereas RK results were closer to the observed densities, both in terms of range and distribution. KRI estimates showed higher (median) values and lower errors (variance), but cannot be directly compared to the regression procedures as kriging tends to reproduce values at the sampling points (point- instead of block-kriging would exactly reproduce the observations, without any variance). For the October 2005/2007 data (Fig. 3), predictions did clearly overestimate bird densities at most sampling sites, though the model error was relatively small.
Considering the application of the 2005/2007 models to the 2008 data, GLM predictions showed different spatial distributions than those observed (Fig. 4). Using the May 2008 environmental data, the May 2005/2007 model missed bird concentrations in the lower north coast and predicted excessive densities in the
south. Considering October 2008, the October 2005/2007 model predicted too low densities for the Northern west coast. In terms of density values, GLM prediction ranges were again smaller than those of the observed densities; predictions tended to overestimate densities at most sample points; and, October predictions diverged more from observations, though with a comparatively small prediction error (Fig. 4).
4. DISCUSSION
Results showed that regression and regression kriging, based on the Balearic Shearwater ship-borne transect counts and on general environmental data, were able to reproduce part of the spatial patterns observed. In spite of being indirect variables, distance from shore, depth, chlorophyll a and sea surface temperature explained 26% to 39% of the observed variability in bird densities; good percentages for this type of data [2]. However, near Portugal, species distribution is mainly determined by migration paths and feeding behaviour (the species feeds mostly on shoaling Clupeiforms) and models could be improved with data on fish densities, instead of the chlorophyll a concentrations which serve as proxies for primary production and, therefore, prey availability.
28
While kriging methods reproduce sample values at sampling sites and are considered optimal interpolators for a single spatial variable, they only supply information in the range of spatial autocorrelation around sampling points.
When these are scarce (as is the case with bird censuses) or spatial autocorrelation structure is poor, alternative or additional (environmental) information is needed to predict bird distribution in larger non-sampled areas [9]. GLM allow predictions
Fig. 4 - Balearic shearwater densities observed in May and October 2008, and regression (GLM) predictions for the sampling points and for the whole study area, using the models computed on 2005/2007 data (we used few and equal density classes better visualisation). Boxplots of the observed (Obs.) and predicted Balearic shearwater densities, as well as model standard errors (SE); boxes show upper and lower quartiles, central lines mark median values, and 1.5 IQR Tukey whiskers as well the outlier points are given.

29
for non-sampled areas or periods, but results should be considered with care, as such predictions constitute, in fact, an extrapolation of the model. We demonstrated this, validating our models on data of a later year. Here, as could be expected, model predictions failed to identify some of the observed species hotspots. Possible reasons are: the limitations of the model, in terms of complexity and explanatory variables (even for the modelled data much of the variance is not explained by the model); and, environmental differences between the modelled and predicted periods, particularly for May, where the 2008 samples exceeded the distances from shore and depths of the data used for modelling. The presented methods should thus be used with care in the interpolation of vaster areas or for predictions of possible future scenarios, especially when scenarios differ significantly from the modelled situations. But they can nevertheless help to identify general patterns and aid Marine Spatial Planning, e.g in. the determination of Important Bird Areas, which are generally based on more than one methodology (e.g. censuses from boats and shore) and delimited according to relatively simple criteria; for Balearic Shearwater: a site with a minimum of 66 birds or regular presence of the species. 5. ACKNOWLEDGMENTS
We would like to thank the Marine IBA LIFE Project team, particularly the bird observers; this project was financed by the EU (LIFE04NAT/PT/000213).
6. REFERENCES
[1] S. H. M. Butchart, A. J. Stattersfield, L. A. Bennun, S. M. Shutes, H. R. Akçakaya, J. E. M. Baillie, S. N. Stuart, C. Hilton-Taylor and G. M. Mace, “Measuring Global Trends in the Status of Biodiversity: Red List Indices for Birds,” PLoS Biology, vol. 2, no. 12, p. 383, 2008.[2] I. Ramírez, P. Geraldes, A. Meirinho, P. Amorim and V. Paiva, Áreas Marinhas Importantes para as Aves em Portugal. Important áreas for seabirds in Portugal, LIFE04NAT/PT/000213 Project, Sociedade
Portuguesa Para o Estudo das Aves, Lisbon, Portugal, 2008.[3] D. J. Anderson, K. P. Huyvaert, D. R. Wood, C. L. Gillikin, B. J. Frost and H. Mouritsen, “At-sea distribution of Waved Albatrosses and the Galápagos Marine Reserve,” Biological Conservation, vol. 110, pp. 367–373, 2003.[4] S. K. Hooker and L. R. Gerber, “Marine reserves as a tool for ecosystem-based management: the potential importance of megafauna,” BioScience, vol. 54, pp. 27–39, 2004.[5] J. Jahncke, K. O. Coyle and G. L. Hunt, Jr., “Seabird distribution, abundance and diets in the eastern and central Aleutian Islands,” Fisheries Oceanography, vol. 14, suppl. 1, pp. 160–177, 2005.[6] M. Louzao, K. D. Hyrenbach, J. M. Arcos, P. Abelló, L. Gil de Sola and D. Oro, “Oceanographic habitat of an endangered Mediterranean procellariiform: implications for marine protected areas,” Ecological Applications, vol. 16, pp. 1683-1695, 2006.[7] A. Longhurst, Ecological geography of the sea. Academic Press, San Diego, California, USA, 1998.[8] L. B. Spear, L. T. Ballance and D. G. Ainley, “Response of seabirds to thermal gradients in the tropical Pacific: the thermocline versus the Equatorial Front,” Marine Ecology Progress Series, vol. 219, pp. 275–289, 2001.[9] E. J. Pebesma, A. M. F. Bio and R. N. M. Duin, “Mapping sea bird densities on the North Sea: combining geostatistics and generalised linear models”. In: W. J. Kleingeld and D. G. Krige (eds.), Geostatistics 2000 – Cape Town. Proceedings of the Sixth International Geostatistics Congress held in Cape Town, South Africa, April 2000, vol. 2, pp. 654–663, 2000.[10] D. Oro, J. S. Aguilar, J. M. Igual and M. Louzao, “Modelling demography and extinction risk in the endangered Balearic Shearwater,” Biological Conservation, vol. 116, pp. 93–102, 2004.[11] J. M. S. Petronilho, J. V. Vingada, M. Ferreira, N.A.C. Paulino, C. Eira, R. A. Costa and P. J. Q. Tenreiro. “Seabird census along the Figueira da Foz – Aveiro coastline (Portugal),” Airo, vol. 14, pp.

30
Computing. R Foundation for Statistical Computing, Vienna, Austria (url http://www.R-project.org), 2005.
94-100, 2004.[12] M. Poot, “Large numbers of staging Balearic Shearwaters Puffinus mauretanicus along the Lisbon coast, Portugal, during the post-breeding period, June 2004,” Airo, vol. 15, pp. 43-50, 2005.[13] M. L. Tasker, P. H. Jones, T. Dixon and B. F. Blake, “Counting Seabirds at Sea from ships: a review of methods employed and suggestion for a standardized approach,” The Auk , vol. 101, pp. 567-577, 1984.[14] K. Camphuysena and S. Garthe, Recording foraging Seabirds at Sea – Standardised recording and coding of foraging behaviour and multi-species foraging associations, IMPRESS report #2001-001, EC Quality of Life and Management of living resources, 21 pp., 2004.[15] N. A. C. Cressie, Statistics for Spatial Data, Wiley, New York, USA, 1993.[16] P. McCullagh and J. A. Nelder, Generalized Linear Models, Chapman and Hall, London, 1989.[17] C. A. Gotway and W. W. Stroup, “A generalized linear model approach to spatial data analysis and prediction,” Journal of Agricultural, Biological, and Environmental Statistics, vol. 2, no. 2, pp. 157-178, 1997. [18] T. F. A. Bishop and A. B. McBratney, “A comparison of prediction methods for the creation of field-extent soil property maps,” Geoderma, vol. 103, pp. 149-160, 2001. [19] M. G. Mardikis, D. P. Kalivas and V. J. Kollias, “Comparison of interpolation methods for the prediction of reference evapotranspiration - an application in Greece,” Water Resources Management, vol. 19, pp. 251-278, 2005.[20] E. J. Pebesma, “Multivariable geostatistics in S: the gstat package,” Computers & Geosciences, vol. 30, pp. 683-691, 2004.[21] E. J. Pebesma, R. N. M. Duin and P. A. Burrough, “Mapping sea bird densities over the North Sea: spatially aggregated estimates and temporal changes,” Environmetrics, vol. 16. pp. 573–587, 2005.[22] R Development Core Team, A Language and Environment for Statistical

31
ABSTRACT
Conservation measures are needed to be taken to restrict and prevent impacts of human and natural pressures on coastal and marine ecosystems. Ecosystem-based management (EBM) considers the whole ecosystem as a functional entity. A biodiversity-based spatial distribution pattern enables the identification of the most sensitive and potentially threatened areas. Integration of the biological and socio-economic information in a GIS assists development of restricted use zones and enables a strong baseline for management decisions. A guideline is established for the definition of coastal and marine priority areas for conservation based on biodiversity evaluation criteria in São Miguel island, Azores.
This study proposes an integrated management strategy, with application of modeling analysis together with decision support towards an ecosystem conservation approach.
1. INTRODUCTION
In the Azores archipelago there are several initiatives focusing on biodiversity and its conservation. In addition to knowing the geographic patterns of biodiversity, we need planning and development guidelines for the region in order to ensure that future human activities do not jeopardize biologically sensitive areas.
Biodiversity conservation and its management are main goals when natural amenities are strongly valued. For effective biological conservation
in marine ecosystems, we need a solid scientific baseline from which to work, clear planning and development guidelines, and a transparent decision-making system based on best available data. Resource management decisions cannot be made without considering their social and economic ramifications. With increasing pressure on coastal and marine systems, there is an urgent need to develop a marine spatial planning (MSP) framework based on social, economic and environmental values to support sustainable decisions. Furthermore, efforts must be made to improve policies and instruments for marine and coastal planning and management.
Spatial planning is widely applied to terrestrial systems although its translation to the marine realm has only recently begun. Differences between terrestrial and marine environments have significant impact for spatial planning implementation success: (a) Multi-dimensionality – essential processes and spatial patterns occur not only on the surface, but also on the seafloor and in the water column (three dimensions) and can change rapidly; (b) Mobility – most of maritime activities doesn’t have permanent structures, they use only a common space; (c) Complex governance – maritime activities are regulated by sectoral laws, plans and licences instead of the integrated planning approach traditionally used to guide land use [5].
An ecosystem-base management (EBM) is a solution to improve existing management frameworks; but the actual process of “doing” ecosystem management is still under development.
GIS-BASED MARINE BIODIVERSITY MAPPING FOR ASSESSMENT OF COASTAL AND MARINE PRIORITY AREAS FOR CONSERVATIONA. Z. Botelho, H. Calado & A. C. CostaCCPA – Environmental Protection and Conservation Center / CIBIO – Research Center in Biodiversity and Genetics Resources - Biology Department of the University of the Azores. E-mail: [email protected] – Research Center in Biodiversity and Genetics Resources - Biology Department of the University of the Azores.

32
measures to achieve three objectives: 1) the conservation of biological diversity, 2) the sustainable use of its components, and 3) sharing the benefits derived from the use of genetic resources. By committing to a Global Program of Work on Protected Areas, over 180 countries adopted the goal of establishing comprehensive, ecologically representative and effectively managed national and regional systems of protected terrestrial areas by 2010 and of protected marine areas by 2012. The marine network consists of marine and coastal protected areas, where threats are managed for the purpose of biodiversity conservation and/or sustainable use.
General awareness for the need of coastal and marine conservation arose as a result of European policies and demands regarding protection and management of natural sensitive areas, namely the Bird Directive (79/409/EEC of 2 April) and Habitat Directive (92/43/EEC of 21 May).When applying terrestrial-based assessments to marine areas, problems arise as demonstrated by the difficulties to implement the Habitats Directive (92/43/EEC) in the marine environment. “How to do it?” and “Where and in what level should marine protected areas be assigned?” are some of the most frequent questions. Criteria developed for identifying terrestrial species and habitats for conservation cannot be easily applied to the marine environment [2]. The tridimensionality of marine environments increases the difficulty of its management. The selection of protected areas was often based on a very ad-hoc, opportunistic, or even arbitrary matter. The chance of selecting the areas with the highest intrinsic biological and ecological value through these methods is small [11], [12].
In 2005, the European Commission (COM(2005)505 final) developed a Marine Strategy Directive that recognizes the need for a strategy for the protection and conservation of the European marine environment with the overall aim to promote sustainable use of the seas and conservation of marine ecosystems
EBM is an integrated approach that considers the entire ecosystem, including humans and their activities, as well as the cumulative impacts of different activities [9].
Protection of the marine environment is necessary to achieve biodiversity conservation and maintain a healthy ecosystem that can support sustainable economical and social activities, yet maintain delivery of essential ecosystem services. Biodiversity valuation is one component of EBM that will allow defining marine protected areas in order to preserve marine habitats.
MSP integrates ecological and social dimensions of ecosystems and fosters implementation of successful management strategies for coastal and marine areas based on scientific knowledge. The ultimate goal of our project is the development of a marine spatial planning effort in a GIS format that is based on a hierarchy of uses and restrictions derived from a vision of sustainable use of natural resources in the Azores. Specifically, we are developing a marine management plan with a zoning scheme based on potential and sustainable use of marine resources. In this paper we present the strategy adopted and the ongoing work in order to achieve this objective.
2. INTERNATIONAL LEGAL FRAMEWORK - MARINE ENVIRONMENT
The international conservation policies, together with the extensive use of coastal land for industry, housing and tourism catalyzed the need to develop coastal and marine planning and management.
Recognition of the challenge of maintaining biodiversity amidst growing human pressures culminated at the World Summit (Rio de Janeiro, Brazil in 1992) where the Convention on Biological Diversity (CBD) was first opened for adoption by national governments. By ratifying that convention, all members committed to implement national and international

33
isolated. This reinforces the need to guarantee sustainable use and protection of natural resources.
Until now, the marine environment was never seen as a transdisciplinary system that required integration of diverse components in a planning framework. The present project aims to overcome this issue and apply MSP to marine and coastal areas in Azores. Therefore, we have initiated a MSP process with the long-term goal of achieving coastal zone and marine management throughout the archipelago.
In the Azores, coastal and marine conservation public awareness has been heightened with the implementation of the Bird and Habitats Directives, leading to the classification of several protected areas that include coastal and marine areas. It has classified 13 Special Protected Areas (SPAs) and 17 Special Areas of Conservation (SACs) in coastal and marine environments under the Natura 2000 network.
Only few classification demands take in account coastal or marine criteria and consequently, they do not sustain an adequately application into marine ecosystems. However, in 2007 the European Commission published the “Guidelines for the establishment of the Natura 2000 network in the marine environment - Application of the Habitats and Birds Directives” (EC, 2007), a document that reveal some details on the establishment of marine network of conservation areas under Natura 2000. The initial list of SAC within the Directive 92/43/EEC, was reviewed and an updated list was published by the Commission decision (2009/1001/EU – 22 December 2009), including some marine areas in the vicinity of the Azores (e.g. PTMAZ0002 - Lucky Strike; PTMAZ0001 - Menez Gwen) for which it will be necessary to establish conservation priorities and conservation measures.
The regional legal framework on protected areas presents has diverse and confusing
[4]. The Marine Strategy introduced the principle of ecosystem-based marine spatial planning and provided a supportive framework for national initiatives toward spatial planning designed for achieving a good status of the marine environment by 2021.
The “Green Paper on Future Maritime Policy for European Oceans and Seas” (2006) aims to provide the basis for a future maritime policy for Europe. Green Paper is a maritime policy document that allows the development of a well-balanced and coherent suite of sea-based policies and activities that reassure mutual reinforcement of economic growth and social welfare on the one hand and good status of the marine environment and its resources on the other hand [3]. In this document MSP is seen as a key means to manage maritime space and their uses, while safeguarding biodiversity. The Maritime Policy concludes that a spatial planning system should be conducted through an ecosystem-based approach and established for offshore activities in all waters under jurisdiction of its Member States.
With the adoption of the Blue Paper (2007) by the European Commission a proposal of an Integrated Maritime Policy (IMP) for the EU and a detailed Action Plan was established; MSP was deemed to be the fundamental instrument to achieve marine and coastal conservation. In 2008, a communication from the commission called “Roadmap for Maritime Spatial Planning: Achieving Common Principles in the EU” was formulated with the aim to facilitate the development of MSP and encourage its implementation at national and EU levels. Key principles for MSP were established to encourage the development of a common approach among Member states (COM(2008) 791 final) [6].
3. AZORES – COASTAL AND MARINE CONSERVATION
The Azores archipelago, as oceanic islands, is vulnerable, fragmented and

34
Zoning terrestrial areas in Azores is already a common practice in the planning and management process, but zoning protected areas is still a relatively new enterprise, especially when applied to marine protected areas (MPAs).
The present challenge is to bring concepts into practice and to test plans and management measures in order to make the necessary adjustments to achieve the envisaged conservation goals under a sustainable use policy.
4. BIODIVERSITY VALUATION
Biodiversity valuation is one of the most important factors that permits distinguishing different marine areas; thus, it is necessary to compile all the information available for a study area in order to make an accurate assessment of the richness and unique properties of local biodiversity.
Information can be retrieved from a database that derived from Atlântico (2003-2005) and Bionatura (2007-2008) INTERREG III B Azores, Madeira and Canarias projects that accomplished a detailed distribution of species in these archipelagos. These syntheses were based on published studies. The software Atlantis Tierra 2.0 is being used to compile all this information on certain taxonomic groups, including marine invertebrates present in coastal and marine areas in the Azores.
The biodiversity database gives information on which areas species were observed and recorded. It allows the use of conservation and environmental management metrics such as species richness, rarity and complementarities at a spatial resolution of 500m unit cells along the coast.
The aim of the project was to improve knowledge about the Macaronesian biodiversity and its spatial distribution patterns in order to contribute to a sustainable management and conservation of natural values. Spatial distribution data
aims for protection and management.. In order to simplify the legal status and level of protection, the Regional Legislative Decree n.º 15/2007/A of 25 June promotes the integration of the protected areas in Azores into one Natural Park for each island (NPI). The NPI integrate the areas previously protected into the following classifications: Natural Reserve, Natural Monument, Protect area to the management of habitats or species, Protected Landscape Area, and Protected Area for Management of resources, for which levels of protection are established.In 1995, the concern of the scientific community resulted in a proposal to conserve marine areas in Azores by Santos et al. (1995) [13]. At present, there is an increasing awareness of the need for a more objective valuation procedure due to the perceived limitations of the existing methods for assessing the value of marine ecosystems in certain regions. To improve the rate of actions implementation, scientific criteria to identify ecologically and biologically significant areas and guidance for designing MPA networks are needed.
The Conference of Parties for the CBD, in their 9th meeting (COP9 - 2008) adopted the scientific criteria for identifying ecologically or biologically significant marine areas in need of protection in open-ocean waters and deep-sea habitats. Guidance for selecting areas to establish a representative network of MPAs, including in open ocean waters and deep-sea habitats was also presented. A scientific experts’ workshop was performed in Azores allowing the selection of the following scientific criteria: 1. Uniqueness; 2. Special importance for life history stages of species; 3. Importance for threatened, endangered or declining species and/or habitats; 4. Vulnerability, fragility, sensitivity, or slow recovery; 5. Biological productivity; 6. Biological diversity; 7. Naturalness. The MPA network criteria established in Azores workshop are: 1. Ecologically and biologically significant areas; 2. Representativity; 3. Connectivity; 4. Replicated ecological features; 5. Adequate & viable sites.
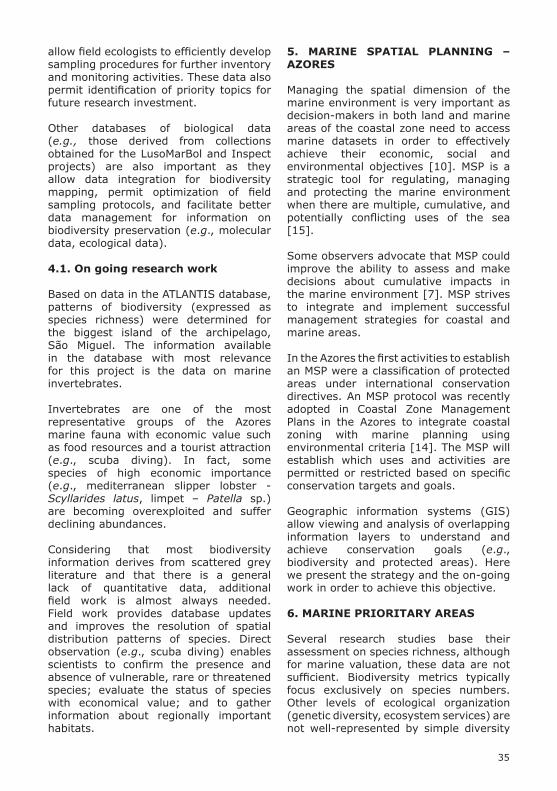
35
5. MARINE SPATIAL PLANNING – AZORES
Managing the spatial dimension of the marine environment is very important as decision-makers in both land and marine areas of the coastal zone need to access marine datasets in order to effectively achieve their economic, social and environmental objectives [10]. MSP is a strategic tool for regulating, managing and protecting the marine environment when there are multiple, cumulative, and potentially conflicting uses of the sea [15].
Some observers advocate that MSP could improve the ability to assess and make decisions about cumulative impacts in the marine environment [7]. MSP strives to integrate and implement successful management strategies for coastal and marine areas.
In the Azores the first activities to establish an MSP were a classification of protected areas under international conservation directives. An MSP protocol was recently adopted in Coastal Zone Management Plans in the Azores to integrate coastal zoning with marine planning using environmental criteria [14]. The MSP will establish which uses and activities are permitted or restricted based on specific conservation targets and goals.
Geographic information systems (GIS) allow viewing and analysis of overlapping information layers to understand and achieve conservation goals (e.g., biodiversity and protected areas). Here we present the strategy and the on-going work in order to achieve this objective.
6. MARINE PRIORITARY AREAS
Several research studies base their assessment on species richness, although for marine valuation, these data are not sufficient. Biodiversity metrics typically focus exclusively on species numbers. Other levels of ecological organization (genetic diversity, ecosystem services) are not well-represented by simple diversity
allow field ecologists to efficiently develop sampling procedures for further inventory and monitoring activities. These data also permit identification of priority topics for future research investment.
Other databases of biological data (e.g., those derived from collections obtained for the LusoMarBol and Inspect projects) are also important as they allow data integration for biodiversity mapping, permit optimization of field sampling protocols, and facilitate better data management for information on biodiversity preservation (e.g., molecular data, ecological data).
4.1. On going research work
Based on data in the ATLANTIS database, patterns of biodiversity (expressed as species richness) were determined for the biggest island of the archipelago, São Miguel. The information available in the database with most relevance for this project is the data on marine invertebrates.
Invertebrates are one of the most representative groups of the Azores marine fauna with economic value such as food resources and a tourist attraction (e.g., scuba diving). In fact, some species of high economic importance (e.g., mediterranean slipper lobster - Scyllarides latus, limpet – Patella sp.) are becoming overexploited and suffer declining abundances.
Considering that most biodiversity information derives from scattered grey literature and that there is a general lack of quantitative data, additional field work is almost always needed. Field work provides database updates and improves the resolution of spatial distribution patterns of species. Direct observation (e.g., scuba diving) enables scientists to confirm the presence and absence of vulnerable, rare or threatened species; evaluate the status of species with economical value; and to gather information about regionally important habitats.

36
The classification and biotope/habitat mapping had been developed and reported as an important tool for marine planning [2].
Human uses and activities with direct and indirect impacts on study areas will be assessed and these include: fisheries, natural resource extraction, aquaculture, tourism, recreation, shipping, transportation, high human population density on shore, and certain infrastructures (e.g., waste water treatment sites, ports, industrial sites). Interviews with local fishing communities will assist in developing use and intensity maps that would contribute to delineating marine protected areas.
Species richness and species distributions will be included in the GIS database along with locations of particular geological features, habitats and biotopes. Integration using GIS can reveal potentially sensitive areas that are under studied deficit or areas where higher biodiversity is observed. Moreover, potential impacts to marine resources will also be identified in each spatial unit. Integration of indicators of ecosystem condition, biodiversity, and threats to marine habitats will be integrated and the GIS and contribute to identifying MPA’s.
7. FINAL REMARKS
Threats to the coastal zone integrity are expected to increase from future development and increasing human population densities. Our study will result in guidelines that ensure protection and restoration of natural resources and ecosystem services in coastal and marine systems in the Azores. Zoning of marine areas will be proposed based on potential and sustainable use of marine resources. We will present various use scenarios for the study area based on different economic development and conservation perspectives. Compatible human uses will be provided for each management unit, including the delineation of “no-take areas” where this is the most prudent recommendation in order to preserve
metrics. Because of that, biodiversity by itself is not a complete measure of marine valuation. Criteria for identification of the most valuable marine areas should be based on integrated data that go beyond species counts.
Biological valuation maps can also be used as baseline maps for future spatial planning in the marine environment. Areas with high biological value tend to also provide high socio-economic and ecosystem service benefits. They also indicate areas of high environmental quality that have not been degraded by pollution, sedimentations, or habitat disturbance.
Habitat and species mapping from coastal to marine areas in São Miguel (0 to -30 meters depth) will be included in the GIS database. Sampling will occur between July 2010 and September 2011 on the seabed and in the water column. Visual census by scubadivers along 1,5m transects will be done to evaluate presence and abundance of macrofauna. Surveys for macroinvertebrates will be done in 5m transect and fish surveys in 20m long transects. Algal cover will be assessed in 50x50cm quadrats at three different depths: <5m, 5-25m, >25m [8]. This procedure will be performed whenever when seafloor slope is not too steep.
For comparative purposes, data will be taken in a variety of sites among classified and protected areas (Natura 2000 Network and Regional Network of Azores Protected Areas – e.g., Caloura), other marine areas in the vicinity of MPAs, and unprotected areas.
Vulnerable and rare habitats will be surveyed for the study area. We will also identify threatened, rare and endemic species. Dominant species for each site will also be measured. Marine communities are comprised of biotic and abiotic components such as benthic substrate, topography, temperature, salinity and hydrologic conditions. These parameters will be recorded for each site.
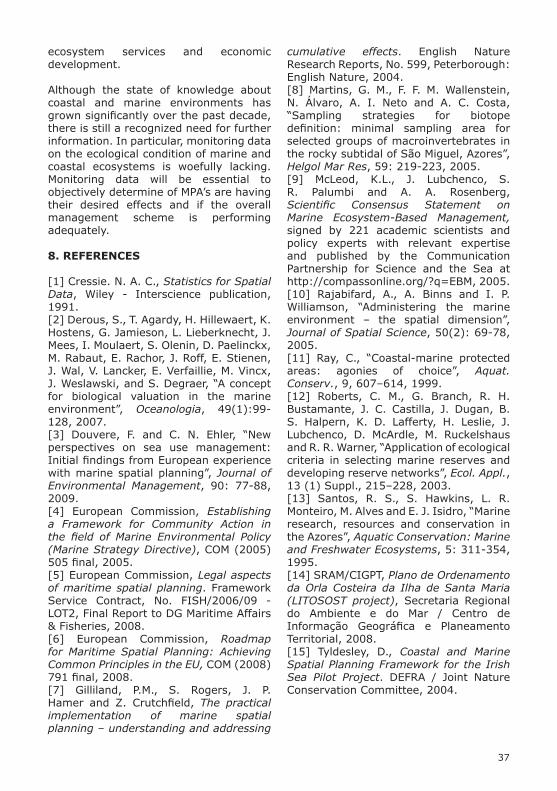
37
cumulative effects. English Nature Research Reports, No. 599, Peterborough: English Nature, 2004.[8] Martins, G. M., F. F. M. Wallenstein, N. Álvaro, A. I. Neto and A. C. Costa, “Sampling strategies for biotope definition: minimal sampling area for selected groups of macroinvertebrates in the rocky subtidal of São Miguel, Azores”, Helgol Mar Res, 59: 219-223, 2005.[9] McLeod, K.L., J. Lubchenco, S. R. Palumbi and A. A. Rosenberg, Scientific Consensus Statement on Marine Ecosystem-Based Management, signed by 221 academic scientists and policy experts with relevant expertise and published by the Communication Partnership for Science and the Sea at http://compassonline.org/?q=EBM, 2005.[10] Rajabifard, A., A. Binns and I. P. Williamson, “Administering the marine environment – the spatial dimension”, Journal of Spatial Science, 50(2): 69-78, 2005.[11] Ray, C., “Coastal-marine protected areas: agonies of choice”, Aquat. Conserv., 9, 607–614, 1999.[12] Roberts, C. M., G. Branch, R. H. Bustamante, J. C. Castilla, J. Dugan, B. S. Halpern, K. D. Lafferty, H. Leslie, J. Lubchenco, D. McArdle, M. Ruckelshaus and R. R. Warner, “Application of ecological criteria in selecting marine reserves and developing reserve networks”, Ecol. Appl., 13 (1) Suppl., 215–228, 2003.[13] Santos, R. S., S. Hawkins, L. R. Monteiro, M. Alves and E. J. Isidro, “Marine research, resources and conservation in the Azores”, Aquatic Conservation: Marine and Freshwater Ecosystems, 5: 311-354, 1995.[14] SRAM/CIGPT, Plano de Ordenamento da Orla Costeira da Ilha de Santa Maria (LITOSOST project), Secretaria Regional do Ambiente e do Mar / Centro de Informação Geográfica e Planeamento Territorial, 2008.[15] Tyldesley, D., Coastal and Marine Spatial Planning Framework for the Irish Sea Pilot Project. DEFRA / Joint Nature Conservation Committee, 2004.
ecosystem services and economic development.
Although the state of knowledge about coastal and marine environments has grown significantly over the past decade, there is still a recognized need for further information. In particular, monitoring data on the ecological condition of marine and coastal ecosystems is woefully lacking. Monitoring data will be essential to objectively determine of MPA’s are having their desired effects and if the overall management scheme is performing adequately.
8. REFERENCES
[1] Cressie. N. A. C., Statistics for Spatial Data, Wiley - Interscience publication, 1991.[2] Derous, S., T. Agardy, H. Hillewaert, K. Hostens, G. Jamieson, L. Lieberknecht, J. Mees, I. Moulaert, S. Olenin, D. Paelinckx, M. Rabaut, E. Rachor, J. Roff, E. Stienen, J. Wal, V. Lancker, E. Verfaillie, M. Vincx, J. Weslawski, and S. Degraer, “A concept for biological valuation in the marine environment”, Oceanologia, 49(1):99-128, 2007. [3] Douvere, F. and C. N. Ehler, “New perspectives on sea use management: Initial findings from European experience with marine spatial planning”, Journal of Environmental Management, 90: 77-88, 2009.[4] European Commission, Establishing a Framework for Community Action in the field of Marine Environmental Policy (Marine Strategy Directive), COM (2005) 505 final, 2005.[5] European Commission, Legal aspects of maritime spatial planning. Framework Service Contract, No. FISH/2006/09 - LOT2, Final Report to DG Maritime Affairs & Fisheries, 2008.[6] European Commission, Roadmap for Maritime Spatial Planning: Achieving Common Principles in the EU, COM (2008) 791 final, 2008.[7] Gilliland, P.M., S. Rogers, J. P. Hamer and Z. Crutchfield, The practical implementation of marine spatial planning – understanding and addressing

38
ABSTRACT
Chilean Patagonia´s coastal ecosystems support unique populations like shallow, cold water corals. At the same time Chile is the second largest producer of farmed salmon in the world and its aquaculture is intensifying. Three geographic areas can be distinguished based on the level of exploitation: the northern fjords heavily used for aquaculture, the southern coast currently under development, and central Patagonia not exploited yet. Three species of scleractinians and one stylasterid coral have been discovered in shallow depths.
Scleractinians are more abundant in Northern Patagonia while Stylasteridea occur mainly in the south. Sedimentation and eutrophication caused by aquaculture have potential impacts on corals, but investigations are needed to confirm this. Corals and salmon farms distributions overlap in the north and will overlap in the south as aquaculture expands. The potential threats need to be addressed through regulations, development of Marine Protected Areas and enhancing research capacity before irreversible damages manifest.
Index Terms— Scleractinia, Stylasteridae, cold water corals, aquaculture impact, Chilean fjord
1. INTRODUCTION
In the last decade, commercial fish farms have expanded in the southern Chilean fjord region. Fish aquaculture is a rapidly growing industry in the country and Chile is currently the second largest producer of cultured salmon after Norway, accounting in 2008 for 31% of the world production [15].
Several species of cold water corals belonging to the Scleractinia [11], [16], [17] and to the Stylasteridea [20] have been found along the southern Chilean coasts. In contrast to other populations observed elsewhere [27] dense populations of cold water corals live in surprisingly shallow waters in Chile. These conditions make them more accessible for research and in situ observation, but at the same time more accessible also to potential sources of pollution.
Benthic ecosystems in Chilean fjords are poorly known and it is uncertain if human activities are jeopardizing those communities [17]. Nevertheless, fish farming is rapidly expanding in the region and may pose a serious threat to the unique biota living in the area [21]. For example, with few government restrictions at the present time [2], Chilean aquaculture is spreading to the southern part of the country into relatively pristine marine environments [8].
The primary focus of this paper is to describe where and how salmon farms might impact cold water corals in Chilean Patagonia. We also identify planning and research actions that should be adopted to ensure that the expansion of fish aquaculture does not occur at the expense of Chile’s fragile coastal ecosystems.
2. SALMON FARMING IN SOUTHERN CHILE
Aquaculture is a well-developed industry in Chile and is the fourth largest economic activity in the country [8]. Species cultivated include algae and mollusks, but fish have become the dominant product over the past 15 years (Figure 1). In 2008, 630 000 tons of fish have been produced
SALMON FARMING IN CHILEAN PATAGONIA: A GROWING THREAT FOR COLD WATER CORALS?L. Fillinger1, G. Försterra2, V. Häussermann2 & C. Richter1
1 Alfred Wegener Institute for Marine and Polar Research, Bremerhaven, Germany. E-mail: [email protected] Huinay Scientific Field Station, Puerto Montt, Chile.
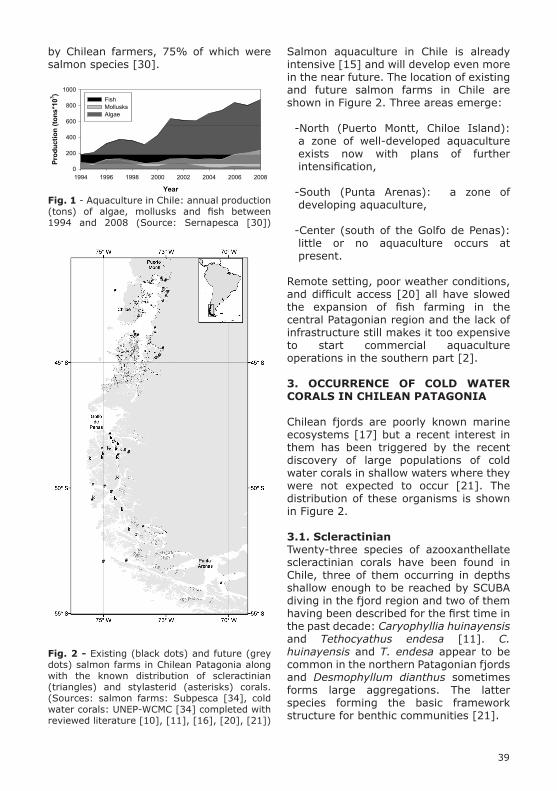
39
Fig. 2 - Existing (black dots) and future (grey dots) salmon farms in Chilean Patagonia along with the known distribution of scleractinian (triangles) and stylasterid (asterisks) corals. (Sources: salmon farms: Subpesca [34], cold water corals: UNEP-WCMC [34] completed with reviewed literature [10], [11], [16], [20], [21])
by Chilean farmers, 75% of which were salmon species [30].
Year
1994 1996 1998 2000 2002 2004 2006 2008
Prod
uctio
n (to
ns*1
03 )
0
200
400
600
800
1000FishMollusksAlgae
Fig. 1 - Aquaculture in Chile: annual production (tons) of algae, mollusks and fish between 1994 and 2008 (Source: Sernapesca [30])
Salmon aquaculture in Chile is already intensive [15] and will develop even more in the near future. The location of existing and future salmon farms in Chile are shown in Figure 2. Three areas emerge:
-North (Puerto Montt, Chiloe Island): a zone of well-developed aquaculture exists now with plans of further intensification,
-South (Punta Arenas): a zone of developing aquaculture,
-Center (south of the Golfo de Penas): little or no aquaculture occurs at present.
Remote setting, poor weather conditions, and difficult access [20] all have slowed the expansion of fish farming in the central Patagonian region and the lack of infrastructure still makes it too expensive to start commercial aquaculture operations in the southern part [2].
3. OCCURRENCE OF COLD WATER CORALS IN CHILEAN PATAGONIA
Chilean fjords are poorly known marine ecosystems [17] but a recent interest in them has been triggered by the recent discovery of large populations of cold water corals in shallow waters where they were not expected to occur [21]. The distribution of these organisms is shown in Figure 2.
3.1. ScleractinianTwenty-three species of azooxanthellate scleractinian corals have been found in Chile, three of them occurring in depths shallow enough to be reached by SCUBA diving in the fjord region and two of them having been described for the first time in the past decade: Caryophyllia huinayensis and Tethocyathus endesa [11]. C. huinayensis and T. endesa appear to be common in the northern Patagonian fjords and Desmophyllum dianthus sometimes forms large aggregations. The latter species forming the basic framework structure for benthic communities [21].

40
This is described in the following section.
4. IMPACT OF AQUACULTURE ON COLD WATER CORALS IN CHILEAN PATAGONIA
4.1. Aquaculture inputs and outputsSalmon aquaculture is conducted in floating cages (net pens) and as such directly in contact with the surrounding water [5], [9]. This kind of culture facilitates the introduction of various components in the natural environment. Several chemicals are used in fish farming: antibiotics and antiparasitics are added to the food or into the water to keep the salmons fit and antifouling treatments prevent the net pens from being clogged with algae and mollusks [5], [7].
Salmon farming also affects the surrounding water and associated ecosystems through the input of fish feed and the output of processed products (feces, excreted metabolic wastes) [8], [5]. With 5% to 20% of the feed being uneaten and lost under the cages (reviewed in [5]) fish farms are known to release large amounts of particulate organic and inorganic matter in the surrounding waters [3]. Next to the increased sedimentation rates, high loads of organic matter and nutrients can cause oxygen depletion and low pH in and above the bottom [5], [28]. Low dissolved oxygen in bottom waters is heavily influenced by stratification of the water column. Where mixing of oxygen-rich surface water and oxygen-poor bottom water is low, like in some fjords, hypoxia can develop and the pH is likely to decrease [24].
Concerning the nutrient load, Soto and Norambuena [33] were unable to detect any significant nutrient increases in the water column near fish farms in Chile. They concluded that strong mixing in the water column distributed and diluted nutrients in the fjord. However, samples taken in Norway [3] and in Sweden [1] showed eutrophication as a result of aquaculture operations. Even though the overall nutrient loads were small in
The shallowest coral found to date was an individual of D. dianthus discovered in 8 m depth. Typically, larger banks of these corals are found below 20 m on steep slopes or overhanging ledges [16].
Concerning their distribution, there seems to be a north-south gradient in the distribution of scleractinian corals along the Patagonian coast with all three species described above being more abundant in the north [21]. Scleractinian corals might be absent from the Golfo de Penas and some continental fjords south of it because of their sensitivity to sedimentation. The Gulf region and most southern fjords are under strong influence from glacier run-off which carries a high sediment load [21].
3.2. StylasterideaThirteen stylasterid species have been recorded in Chile but only two of them occur along the coast and Errina antarctica is the only one to have been observed at SCUBA depth so far [20]. E. antarctica is quite common south of the Golfo de Penas. In some areas it can form reef-like structures in channels with a moderate to strong current, typically at depths below 10 m [20], [21]. The distribution of stylasterids also seems to follow a latitudinal gradient but reverse to the one observed for scleractinian corals as E. antarctica only scarcely occurs north of the Golfo de Penas [21].
3.3. Threats to corals in ChileLongline fishing [6] and bottom trawling have a negative impact on deep corals offshore [21], while in shallow environments the harvesting of the stylasterid coral E. antarctica by divers has negative impacts on their populations. Furthermore, in shallow areas where intensive harvesting of corals occurs, the surrounding habitats are damaged by boat anchors used by the commercial divers. E. antarctica is sold locally as souvenirs [20], [21].
Aquaculture is also believed to be a significant source of disturbance to cold water coral communities in Chilean fjords.

41
comparison to other sources, the local effects were significant.
4.2. Potential impacts of aquaculture on coralsDue to the difficultly in studying cold water corals, their biology remains largely unknown [27]. For this reason,
information available on warm water corals, especially Scleractinian have been taken into account to assess likely effects of pollution resulting from fish farming on cold water corals. A listing of the potential impacts of salmon aquaculture on corals is presented in Table 1.
Table 1 - List of potential impacts of aquaculture on cold water corals. Data in grey are known for warm water corals only.
42
supporting the shallowest occurrence of cold-water corals. Although management of such a system mandates a precautionary principle, severe alterations of the environment have taken place in the course of the rapid spread of intense aquaculture. [5], [8], [9], [21].
Fish farms already occur above and in vicinity of massive coral aggregations [21] (Figure 2). This is particularly the case around the already well-developed fish farming region in northern Patagonia where even more aquaculture concessions are intended to be created. In the southern region, developing aquaculture doesn’t seem to threaten any corals yet but the apparent absence of cold water corals may be due to the lack of biological surveys in the area. Scleractinian and stylasteridean corals are quite abundant south of the Golfo de Penas, which so far hasn’t been intensively exploited for aquaculture.
5. CONCLUSIONS
The salmon farming industry is rapidly growing in importance in the Chilean economy [4]. The Chilean government has not exercised much regulatory oversight over the industry and this might result in negative ecological impacts to some aspects of the coastal and marine systems [9]. We recommend that an investment be made to enhance research on the impact of aquaculture on Chilean ecosystems with special focus on cold water coral communities. In addition, the research community needs to analyze aquaculture practices that might enhance the sustainability of the industry; for example, adopting an Integrated Multi Trophic Aquaculture (IMTA) approach [9] or retaining salmon farm waste and use it as fertilizers in terrestrial agriculture systems [29].There are signs that the Chilean government is beginning to recognize the importance of protecting its coastal waters. The first marine protected area (MPA) in Chile was created in 2003: the Franscico Coloane National Park near Carlos III Island on the southern tip
Chemicals released in the environment might interact with the corals directly or with associated species. As such, antibiotics may trigger pathogens resistance to coral defenses [35] and this way disturb the natural bacterial fauna associated to cold water corals [22]. Antifoulants are likely to have lethal effects on several coral development stages [25], [31].
Little is known about cold water corals sensitivity to sedimentation [27] however the exclusive occurrence of Chilean scleratinian corals in low sediment fjords and on vertical and overhanging substrate in Chilean Patagonia lead some authors to conclude that they grow better in environments where sediment deposition rates are low [16], [21].
In analogy to warm water corals [14], high sediment deposition might have lethal effects on Lophelia pertusa [18], a deep water scleractinian. If this is found to be true, cold water corals might be vulnerable to large amounts of sediment originating from fish aquaculture pens. Even if they might be able to cope briefly with the resulting hypoxia [13], associated low pH might hinder their calcification. We don’t know yet if high nutrient concentrations have an impact on cold water corals. There is evidence, however, that competition between algae and warm water corals as well as bioerosion are increased in nutrient-enriched waters [23]. Furthermore, their growth and calcification rates decrease and their reproduction success is reduced in nutrient-enriched systems [14], [19].How long lasting are the damages of fish farming to cold water coral populations is unknown. Recovery of corals is possible after the closing of a fish farm but recovery rates are highly variable between sites and the underlying mechanisms are not understood [5].
4.3. Spatial overlap between coral distributions and salmon farms
The Patagonian fjords support a rich biodiversity. They are globally unique in
43
Häussermann, “Fishing in troubled waters – evidence for higher diversity and high abundance of cold water corals along the Chilean coast”, pp. 234 in Brock R. and R. Y. George, eds. Deep-sea corals science and management. 3rd Int.Symp. Deep-Sea Corals, Miami, FL, 2005.[7] Burridge L., J. Weis, F. Cabello and J. Pizarro, “Chemical use in salmon aquaculture: a review of current practices and possible environmental effects”. WWF Report. 2008. Available from: www.worldwildlife.org/what/globalmarkets/aquaculture/WWFBinaryitem8842.pdf[8] Buschmann A.H, V.A. Riquelme, M.C.Hernandez-Gonzalez, D. Varela, J.E. Jimenez, L.A. Henriquez, P.A. Vergara, R. Guinez and L. Filun, “A review of the impacts of salmonid farming on marine coastal ecosystems in the southeast Pacific”, ICES Journal of Marine Science, vol.63, pp.1338-1345, 2006.[9] Buschmann A.H, F. Cabello, K. Young, J.Carvajal, D.A. Varela and L. Henriquez, “Salmon aquaculture and coastal ecosystem health in Chile: Analysis of regulations, environmental impacts and bioremediation systems”, Ocean & Coastal Management, vol.52, pp.243-249, 2009.[10] Cairns S. D, “Antarctic and Subantarctic Scleractinia”, Antarct. Res. Ser., vol. 34, pp. 1–74, 1982.[11] Cairns S.D., V. Haeussermann and G. Foersterra, “A review of the Scleractinia (Cnidaria, Anthozoa) of Chile, with the description of two new species”, Zootaxa, vol. 1018, pp. 15-46, 2005.[12] Conama, Comision Nacional del Medio Ambiente, Gobierno de Chile, www.conama.cl[13] Dodds L.A., J.M. Roberts, A.C. Taylor, F. Marubini “Metabolic tolerance of the cold water coral Lophelia pertusa (Scleractinia) to temperature and dissolved oxygen change” Journal of Experimental Marine Biology and Ecology,vol 349, pp. 205-214, 2007. [14] Fabricius, K.E. “ Effects of terrestrial runoff on the ecology of corals and coral reefs: review and synthesis”, Marine Pollution Bulletin, vol. 50, pp. 125-146, 2005.[15] Food and Agriculture Organization, The state of world fisheries and
of Patagonia. A second MPA is being considered for an area near Chiloe Island in Northern Patagonia [12]. This project is motivated, in large part, by whale conservationists and protection planned at the level of a multiple use MPA. If applied seriously, it might yield positive effects for protecting cold water coral ecosystems. We recommend that areas where cold water corals are known to occur be considered as a possible MPA site. It is urgent that the scientific community and Chilean government act as fast as possible to ensure that we allow development of salmon aquaculture in a manner that does not damage Chile’s fragile cold water coral ecosystems.
6. ACKNOWLEDGEMENT
Many thanks to Simon Blyth from the UNEP for helping us so nicely and quickly getting the GIS dataset on cold water corals. We are also grateful to our reviewers, who have supported us during the preparation of this article. This is publication number 49 of Huinay Scientific Field Station.
7. REFERENCES
[1] Ackefors, H. and M. Enell, “Discharge of nutrients from Swedish fish farming to adjacent sea areas”, Ambio, vol.19, no.1, pp.28-35, 1990.[2] Asche, F., T. Bjorndal and E.H. Sissener, “Relative productivity developpement in salmon aquaculture”, Marine Resource Economics, vol. 18, no. 2, pp. 205-210, 2003.[3] Aure, J. and A. Stigebrandt, “Quantitative estimates of the eutrophication effects of fish farm ing on fjords”, Aquaculture, vol. 90, pp. 135–156, 1990.[4] Bjorndal, T. “The competitiveness of the Chilean Salmon aquaculture industry” Aquaculture Economics and Management, vol. 6, no. 1, pp. 97-116, 2001.[5] Black K.D., H.P. Kupka and M. Holmer, “Salmon Aquaculture dialogue – working group report on benthic impacts and farm siting Tacon A.C.G.” in Fraser, S., ed. International Aquafeed Directory, 2008.[6] Bravo, A., G. Försterra, and V.

44
[23] Loya, Y. and E. Kramarsky-Winter, “In situ eutrophication caused by fish farms in the northern Gulf of Eilat (Aqaba) is beneficial for its coral reefs: a critique”, Mar. Ecol. Prog. Ser., vol. 261, pp.299-303, 2003.[24] Mulsow, S., Y. Krieger and R. Kennedy, “Sediment profile imaging (SPI) and micro-electrode technologies in impact assessment studies: Example from two fjords in Southern Chile used for fish farming”, Journal of Marine Systems, vol.62, pp.152-163, 2006.[25] Negri A.P., L.D Smith, N.S. Webster and A.J. Heyward “Understanding ship grounding impact on a coral reef: potential effects of antifoulant paint contamination on coral recruitment” Marine Pollution Bulletin, vol. 44, pp. 11-117, 2002. [26] Roberts, J.M., O.C. Peppe, L.A. Dodds, D.J. Mercer, W.T. Thomson, J.D. Gage and D.T. Meldrum “Monitoring environmental variability around cold water coral reefs: the use of a benthic photolander and the potential of seafloor observatories”, pp.483-502 977 in Freiwald, A. and J.M. Roberts, eds, Cold-water corals and ecosystems. Springer-Verlag, Berlin Heidelberg, 2005.[27] Roberts, J.M, A. Wheeler and A. Freiwald, “Reefs of the deep: the biology and geology of cold water coral ecosystems”, Science, vol. 312, pp.543-547, 2006. [28] Rudolph A., P. Medina, C. Urrutia and R. Ahumada, “Ecotoxicological sediment evaluations in marine aquaculture areas of Chile”, Envir. Monit. Assess., vol.155, pp.419-429, 2008.[29] Salazar F.J. and R.C. Saldana, “Characterization of manures from fish cage farming in Chile”, Bioresource Technology, vol. 98, pp.3322-3327, 2007.[30] Sernapesca: Servicio Nacional de Pesca, Gobierno de Chile, www.sernapesca.cl[31] Smith, L.D., A.P. Negri, E. Philipp, N.S. Webster and A.J. Heyward, “The effects of antifoulant paint contaminated sediments on coral recruits and branchlet” Marine Biology, vol. 143, pp. 651-657, 2003.[32] Soto D. and F. Norambuena F., “Evaluation of salmon farming effects
aquaculture 2008, Food and Agriculture Organization, Rome, 2009.[16] Försterra, G. and V. Häussermann, “First report on large scleractinian (Cnidaria: Anthozoa) accumulations in cold-temperate shallow water of south Chilean fjords”, Zool. Verh. Leiden, vol.345, no.31, pp.117-128, 2003.[17] Försterra, G., L. Beuck, V. Häussermann and A. Freiwald “Shallow water Desmophyllum dianthus (Scleractinia) from Chile: characteristics of the biocenoses, the bioeroding community, heterotrophic interactions and (palaeo)-bathymetrical implications” pp937-977 in Freiwald, A. and J.M. Roberts, eds, Cold-water corals and ecosystems. Springer-Verlag, Berlin Heidelberg, 2005.[18] Gass, S.E. and J.M. Roberts, “The occurence of the cold water coral Lophelia pertusa (Scleractinia) on oil and gas platforms in the North Sea: colony growth, recruitment and environmental control on distribution” Marine Pollution Bulletin,vol. 52, pp. 549-559, 2006. [19] Harrison P.L. and S. Ward, “Elevated levels of nitrogen and phosphorus reduces fertilization success of gametes from scleractinian reef corals”, Mar. Biol., vol.139, pp.1057-1068, 2001.[20] Häussermann, V. and G. Försterra, “Extraordinary abundance of hydrocorals (Cnidaria, Hydrozoa, Stylasteridae) in shallow water of the Patagonia fjord region”, Polar Biology, vol. 30, pp.487-492, 2007.[21] Häussermann, V. and G. Försterra, “Large assemblages of cold-water corals in Chile: a summary of recent findings and potential impacts”, pp. 195 -207 in George R. Y. and S. D. Cairns, eds, Conservation and adaptive management of seamount and deep-sea coral ecosystems, Rosenstiel School of Marine and Atmospheric Science, University of Miami, Miami, 324 p., 2007.[22] Kellogg C. A., J.T. Lisle and J.P. Galkiewicz“Culture independent characterization of bacterial communities associated with the cold-water coral Lophelia pertusa in the Northeastern Gulf of Mexico” Applied and Environmental Microbiology, vol.75, pp. 2294-2303, 2009.

45
on marine systems in the inner seas of southern Chile: a large-scale mensurative experiment”, Journal of Applied Ichthyology, vol.20, pp.493-501, 2004.[33] Subpesca: Subsecretaria de Pesca, Gobierno de Chile,www.subpesca.cl. Dataset concesiones de acuicultura updated on the 14.04.2010.[34] UNEP-WCMC, “Cold water corals extracted from version 2.0 of the global point dataset compiled by the UNEP World Conservation Monitoring Centrer (UNEP-WCMC)”, Sourced from A. Freiwald, Alex Rogers and Jason Hall-Spencer and other contributors. For further information email: [email protected], 2005.[35] Vizcaino M.I., W.R. Johnson, N.E. Kimes, K. Williams, M. Torralba, K.E. Nelson, G.W Smith, E. Weil, P.D.R. Moeller, and P.J. Morris “Antimirobial resistance on the coral pathogen Vibrio coralliilyticus and Carribean sister phylotypes isolated from a diseased octocoral” Microbial Ecology, vol. 59, pp. 646-657, 2010.
46
ABSTRACT
Marine spatial planning (MSP) is emerging as a practical process to help achieve the ecological, economic, and societal objectives of U.S. ocean management. Coastal and ocean data have unique challenges that need to be addressed. Ambulatory boundaries, 4-D data needs, and difficulty acquiring these data in the marine environment are some of the challenges not traditionally faced by land-based planners. To realize the full benefits of MSP, the process will require accurate and authoritative geospatial data from all sectors. Since MSP is an ecosystem-based approach, data are required at various resolutions. “Best available” and “science-based” data are often stated as necessary, but not often defined. How the MSP process will be implemented in the U.S. remains to be seen, but significant work has already begun on developing a national marine spatial data infrastructure (MSDI) for the U.S. This paper discuses the history, institutional and technological challenges, and ongoing development of the U.S. MSDI.
Index Terms - marine spatial planning, marine data, marine spatial data infrastructure
1. INTRODUCTIONDemand for ocean space is outstripping the current policy frameworks designed to manage how humans use the marine environment. In response, marine spatial planning (MSP) processes are being used around the globe to replace fractured single-sector approaches to management. The new processes attempt to ensure that the ecological and socioeconomic services that oceans provide and that societies depend upon, are protected for future generations [1]. Sound MSP, however, requires the availability and analysis of
timely geospatial data originating from credible sources. An evolving effort to build a marine spatial data infrastructure (MSDI) is tackling the complex challenges associated with providing authoritative geospatial data for the U.S. across a suite of data themes.
Since the early 1990s, the primary focus of U.S. national spatial data infrastructure has been directed toward terrestrial themes, leaving marine data largely underdeveloped. The rapid increase in interest in MSP is uncovering this issue resulting in more attention from a broader audience. There has been incremental progress on the core cadastral data that constitute the foundation of the MSDI (i.e., jurisdictional boundaries and limits). More complex data themes with less well-defined or, in some cases, nonexistent spatial attributes and legal foundation are currently being developed for incorporation into the MSDI framework (i.e., georegulations, marine habitat and biodiversity, human use, and geology and seafloor). These data are crucial to the success of MSP as is shown by their inclusion in planning efforts in U.S. states like Massachusetts, Rhode Island, and Oregon, following the use of analogous data in efforts on the international stage in countries like Belgium, the Netherlands, and Germany [2].
The objectives of this paper are to describe the key data themes of the MSDI, the progress to date, and complexities and challenges associated with each. The paper will also detail some applications of these data and outline the next steps needed to continue moving the MSDI forward in support of the shifting paradigm in ocean management that is manifesting itself in MSP processes.
BUILDING A MARINE SPATIAL DATA INFRASTRUCTURE TO SUPPORT MARINE SPATIAL PLANNING IN U.S. WATERSC. Fowler 1, B.Smith 2 & D. Stein 1
1 National Oceanic and Atmospheric Administration (NOAA),Coastal Services Center, Charleston, South Carolina. E-mail: [email protected] IM Systems Group, on contract at the NOAA Coastal Services Center,Charleston, South Carolina.

47
planning on the U.S. outer-continental shelf. In direct response to the act, the FGDC Marine Boundary Working Group coordinated the development of a mapping system called the Multipurpose Marine Cadastre (MMC)1. The significance of using the term “cadastre” in U.S. policy is that it gives MSDI data development an additional requirement to ensure data are from authoritative or trusted government sources. This formed a fundamental operating tenet of the work that followed on the MSDI.On December 14, 2009, President Obama’s Interagency Ocean Policy Task Force released its Interim Framework for Effective Coastal and Marine Spatial Planning for review, which offers a comprehensive, integrated approach to planning and managing uses and activities [5]:“Under the Framework, coastal and marine spatial planning would be regional in scope, developed cooperatively among Federal, State, tribal, local authorities, and regional governance structures, with substantial stakeholder and public input.”The data needed to support MSP reside within a heterogeneous community across government and scientific organizations. To make effective use of these varied data sources, regional and federal partners must collaborate to identify priorities, employ mechanisms to integrate compatible data, manage quality, and enable exchange of spatial information using consistent techniques. To address this need, the task force called for a national information system to establish and implement consistency in data products. This guidance from the task force focuses even greater attention on the evolving MSDI and greatly influences data priorities, processes, scales, and access.
3. DATA THEMES
“Improved decision-making”, “ecosystem-based”, science-based,” “best-available”, and “managing human activities to reach societal goals”, all are terms that have
2. Background
A number of activities have shaped the current thinking on what constitutes the MSDI. In 1990, the U.S. Federal Geographic Data Committee (FGDC) was created and charged with developing a national spatial data infrastructure for the U.S. with much of the emphasis focused on terrestrial data themes [3].
In 1999 the National Oceanic and Atmospheric Administration (NOAA) led the development of the first regional ocean planning information system and began to systematically address MSP data issues and requirements [4]. Data were found to be sparse or nonexistent, primarily because of the technological limitations of acquisition. A primary marine data source, the official nautical chart, was not easily adaptable to MSP needs. Standards developed for land (i.e., cadastral) didn’t address all aspects of marine data. Data were spread across multiple agencies and not often accessible.
To address these issues, the FGDC Marine Boundary Working Group was established in 2001 [www.csc.noaa.gov/mbwg]. This federal work group provides a venue for communicating about and coordinating marine and coastal geospatial issues such as standards, partnerships, and access. The group began systematically working through federal geospatial data and related policy issues needed to support the MSDI. Federal agencies with offshore responsibility represent a broad spectrum of traditional (i.e., navigation, fishing, and energy) and nontraditional (i.e., radio spectrum) ocean uses are included in the work group. In addition, because U.S. territorial waters encompass individual coastal states, work started soon after to coordinate better across state and federal jurisdictions.
The Energy Policy Act of 2005 accelerated the development of the MSDI. The act mandated the development of a mapping system to support alternative energy
1 Similar to the nation’s land-based parcel system, a marine cadastre describes the spatial extent, rights, restrictions, and responsibilities of U.S. waters.

48
[4] Data should be served from as close to the source agency as technologically possible. Vision is that all data will eventually be served at source using Web service2 technology.[5] Data must have FGDC-compliant metadata.[6] Data should be built on national or international standards where they exist.[7] Data have value across multiple issues and jurisdictions and should be created once and used as many times as needed.[8] Data life cycle should prescribe update process but not wait for data to be perfect. Build on existing data and improve over time.
3.1 Jurisdictions Boundaries and Limits
In the MSDI, jurisdictional boundaries and limits refers to the set of data defining areas or zones managed for official purposes. This includes the internationally recognized limits such as those specified by the United Nations Convention on the Law of the Sea (UNCLOS), including the Territorial Sea and Exclusive Economic Zone (EEZ), to more local zones such as marine sanctuaries or parks.
Marine jurisdictions are similar to their land-based counterparts in that, in order to map the boundary, the law must be interpreted in a spatial context [4]. Where the marine environment diverges is that marine boundaries generally have no demarcation or physical evidence to mark the space (e.g., monument, pin, or fence). As GPS technology evolves, the delimitation of the marine boundary is becoming more accurate, but the challenge lies where the “old world” mapping meets the “new world.” Regulations and laws refer to these old boundaries and the MSDI is working to reconcile differences. For example, historically the U.S. territorial limits were mapped to reflect
been used to describe requirements for MSP data. The reality is that all geographic data are an abstraction of reality. Trade-offs have to be made in data development, updates, resolution, and in the techniques for presenting the data. Since MSP is a continuous process [6] the goal for developing the U.S. MSDI is to begin with fundamental data and to increase the complexity and accuracy over time as requirements become better understood.
The data are currently divided thematically into the supporting areas of jurisdictional boundaries and limits, federal georegulations, navigation and marine infrastructure, geology and seafloor, habitat and biodiversity, and human use. Each theme has its own unique challenges (addressed below) but the following operating tenets apply broadly across the themes:
[1] Data are issue-neutral and should be able to be viewed and queried as necessary to support decision-making. [2] Efficient electronic access to data should be provided using well-described formats that can be broadly assimilated by stakeholders.[3] A foundation of authoritative and trusted data sources should come from agencies with legislative mandates or responsibility for data. Fig. 1 - Marine Spatial Data Infrastructure Themes
2 Industry standard web services allow different applications to utilize each other’s data independent of software
or operating system utilizing XML. Federal agencies are implementing web services to support national geospatial
mandates, but institutional and IT security challenges still exist requiring interim system approaches for providing
data access.

49
makers understand ocean use conflicts and compatibilities. To accomplish this spatial analysis requires a defined geography of the regulation data layers in a form suitable for use in GIS.
Fig. 2 - Georegulation of the Marine Plastics Pollution Research and Control Act.
Once developed, georegulations can be a valuable part of the MSDI and contribute to the broader MSP process. Creating georegulations involves researching the federal and state policy framework in the area of interest and creating spatial “footprints” of the geographic area where individual policies apply. The development of a georegulation requires careful scanning of the text for any geographic reference. This could be something as easy to map as defined latitude and longitude to something more challenging such as “all navigable waters” Because policy makers, not geographers, generally write regulations, the challenge is to adequately capture the geography intended by each individual law. Georegulations offer the ability to visualize the spatial extent of regulations and analyze intersections with other data layers. Georegulations are often built on jurisdictional boundary data and therefore must reflect the best practices of these underlying data. When added to the MSDI, these data bring the ability to
the relatively straightforward technology of the times – the 3-mile distance that a cannon ball could be fired. Today, UNCLOS uses terminology to define jurisdictions, such as a tidal datum of mean high water (MHW). The lines sound plausible until an attempt is made to create them digitally. MHW is the average of all the high waters over a 19-year cycle. Even though tide gauges are extremely accurate in measuring MHW at a point location, the entire length of shoreline is still a modeled value. The ambulatory nature of official boundaries like MHW has a ripple effect all through the development of data for MSP. With changing sea level, it becomes even more important to develop the MSDI in a way that accommodates ambulatory data.
Why should the MSDI care about exactly where a boundary like MHW is located? Jurisdictions and regulations are tied to the lines, and ultimately, money and activities are allowed or denied based on these boundaries. Recently, the first offshore wind energy permit in the U.S. was held up as the line between state and federal jurisdiction (tidal datum) was determined. The transition to clearly define boundaries with coordinates cannot happen overnight, but the MSDI must facilitate access to the latest and most accurate data, continue to facilitate partnerships that improve data and reduce conflicts, and encourage projects that document best practices for offshore data development [7].
3.2 Georegulations In MSP, much attention is applied to geospatial data development of physical and environmental components, but the legal regime is an often-overlooked and equally important regime to represent in the process. In context with other resource data, the regulations, laws, and management structures help decision
3 Charts must portray any known bottom feature shallow enough to present a hazard to shipping but do not need
to indicate any deeper aspects of the bottom
4 ENCs are built to an International Hydrographic Office (IHO) specification called S-57.

50
MSP. Ecosystems and the services they provide need to be represented in a way that supports the MSP process of considering ecological and socioeconomic objectives in concert. Multiple approaches to assessing ecological or biological values of marine areas have been developed and applied to MSP efforts [9, 10]. The availability and quality of these data, however, vary greatly across regions, creating challenges for development of the MSDI for marine habitat and biodiversity.Unlike boundaries that are relatively consistent across geography, biology is intimately tied to local conditions. For example, many of the key habitats and species that would be relevant to a specific planning scenario in the Northeastern U.S. do not exist on the West Coast. This reality confounds the thought process surrounding which data are logical to include when describing habitat and biodiversity at a national scale. Additionally, there is no single classification scheme accepted by the U.S. government for marine habitat that provides a framework to support visualization of these data at a common level across the U.S.
To deal with these challenges and realities associated with nascent MSP efforts, the approach to building marine habitat and biodiversity data into MSDI is to use habitat and species designations associated with laws like the Endangered Species Act and the Magnuson-Stevens Fisheries Conservation and Management Act. This approach is in keeping with the legal-responsibilities information conveyed in the core marine cadastral data. Users can determine which of these authoritative data sets are relevant to their specific MSP process.
3.5 Geology and Seafloor
The MSDI includes bathymetric contours, undersea place names, physical substrate sample locations, and sediment grain size distribution maps. These data apply to everything from the basic need to know water depth, to more complex issues like correlating physical characteristics of the
more easily visualize compatibilities and inconsistencies in federal or state policy.
3.3 Navigation and Marine Infrastructure
Navigation and marine infrastructure data are considered baseline information for any marine-related application. This theme consists of common navigational and infrastructure data such as shipping lanes, fairways, wrecks and obstructions, and oil platforms. Planners in the marine environment need to know where these data exist in order to avoid potential conflicts. The official U.S. nautical chart is developed to support safe navigation and have a known navigation or “shoal” bias inherent in its production3. [8] Building this theme as part of the MSDI presents several unique challenges, the most notable being that the data are organized by individual chart geography across multiple scales. Ideally, to construct a seamless navigation and marine infrastructure theme for the U.S., data would require reconstruction from source data. This is a painstakingly detailed task of determining which agency collected the original chart information. U.S. chart data are becoming more broadly available in the Electronic Navigational Chart (ENC) format4 but are still not specifically designed for MSP and extensive manipulation.
Another important data set in this theme is the one that represents true vessel locations termed Automated Information System (AIS) data. Transponders on ships send signals picked up by receivers on land used to track commercial vessel movement in U.S. waters. AIS data are proving vital to MSP efforts, as demonstrated in the Massachusetts Ocean Plan, and provide a more realistic view of commercial shipping ocean use than traditional chart products [9].
3.4. Marine Habitat and Biodiversity
Application of spatial data to describe and characterize the complexity of marine ecosystems is essential to implementing
51
on human uses, especially in comparison to other complex data themes like marine habitat and biodiversity [11]. Human uses can be broken down into broad categories like commercial and recreational fishing, industrial and military and non-consumptive (i.e., paddle sports, scuba diving, recreational boating, etc.).
Considering where humans are using the ocean and what areas and resources they are depending on is critical to making transparent and informed management decisions supported by the public [12]. The challenge inherent in pursuing this ideal is a general paucity of data that depict human use patterns in our oceans both current, and historical. Similar to the case of the geology and seafloor data theme, collecting human use data often requires resource- and time-intensive methods of surveying users directly or via the Internet. Since many recreational activities do not require any kind of permit or registration, users can be difficult to locate and contact for data collection.There are efforts to address this lack of human use data for specific initiatives in the U.S. The California Ocean Uses Atlas project [mpa.gov/dataanalysis/atlas] and Open OceanMap tool [www.ecotrust.org/ocean/OpenOceanMap.html] are both good examples. These efforts are focused on addressing specific needs related to local initiatives, however, and do not contribute directly to the larger national-level MSDI needs. The data that presently populate this theme are associated with energy leases and sand and gravel extraction areas. More work is needed to ensure that efforts undertaken to increase our understanding of human activities in the ocean produce spatially explicit results that support mapping and monitoring.
4. NEXT STEPS
Efforts to uncover and address issues associated with jurisdictional boundaries and limits, development of methods and data for georegulations, and compilation of marine navigation and infrastructure data for MSDI all support current MSP
seafloor to habitat for species of concern. These data are essential to multiple steps in MSP processes, but challenges like limited availability or access, and lack of consistency in data products, present obstacles to their inclusion in the MSDI.Many of the publicly available geology and seafloor data sets with large coverage areas are of insufficient resolution to support MSP at the scale with which it is occurring, or are derived from data that are decades old. Remote collection of marine geology and seafloor data are more costly than the terrestrial equivalent, which can be done with aircraft or satellites. Advances in technology have closed the gap, but highly accurate surveys on land have been conducted for a longer period than those focused on the bottom of the ocean. Energy exploration and national security needs have both resulted in a large amount of data that are often unavailable to the public, and therefore, to support MSDI development either.
Strong partnerships need to be fostered between government agencies and offices that may not have traditionally collaborated. To benefit the users of geology and seafloor data, the MSDI should consider the state and regional data needed to support decision-making at these scales where MSP in the U.S. is most likely to continue occurring. Compiling and serving spatial footprints and essential attribute information for existing geology and seafloor data, similar to the georegulation approach, would be a valuable addition to the MSDI. This approach will allow users to determine if information exists in areas they are interested in. This will also keep the responsibility of data maintenance and storage with the providers, allowing the MSDI resources to be focused on other needs.
3.6 Human Use
There is general agreement that understanding human use patterns in the ocean is important to making informed management decisions. However, there is very little spatial information available

52
Journal for Environmental Management, Volume 90: 77-88, 2009.[3] M. Lockwood and C. Fowler, ”Significance of Coastal and Marine Data within the Context of the US National Spatial Data Infrastructure,” Marine and Coastal Geographic Information System, Taylor & Francis, London, 2000.[4] C. Fowler and E. Treml, “Building a marine cadastral information system for the United States – a case study” Computer, Environment and Urban Systems, (25) pp.493-507, 2001.[5] The U.S. White House Council for Environmental Quality, Interim Framework for Effective Coastal and Marine Spatial Planning, 2009.[6] Ehler, C. and F Douvere. Marine Spatial Planning: a step-by-step approach toward ecosystem-based management, IOC Manual and Guides, No. 53, Paris: UNESCO, 2009.[7] FGDC Marine Boundary Working Group, Marine Managed Areas: Best Practices for Marine Boundaries, [www.csc.noaa.gov/products/mb_handbook] U.S. Government, 2006.[8] W. Smith and D. Sandwell, “Conventional Bathymetry, Bathymetry from Space, and Geodetic Altimetry”. Oceanography, Vol 17 (1) The Oceanography Society, 2004.[9] Executive Office of Energy and Environmental Affairs, Commonwealth of Massachusetts,. Massachusetts Ocean Management Plan, Boston, Massachusetts, USA, 2009.[10] S. Derous, T Agardy, H., K.Hillewaert Hostens, G. Jamieson, L. Lieberknecht, J.Mees., I. Moulaert, S. Olenin, D. Paelinckx, M. Rabaut, E. Rachor, J. Roff ,E. Stienen, J. van der Wal, V.Van Lancker, E. Verfaillie , M. Vincx, J. Weslawski, and S. Degraer, “A Concept for Biological Valuation in the Marine Environment”, Oceanologia, 49 (1), pp. 99–128, 2007.[11] K. St Martin, and M. Hall-Arber, “The Missing Layer: Geo-technologies, Communities, and Implications for Marine Spatial Planning,” Marine Policy, 32, pp. 779-786, 2008.[12] Eastern Research Group, Marine Spatial Planning Stakeholder Analysis NOAA Coastal Services Center, Charleston, SC, 2010.
processes and can be visualized through MMC. The work to unravel the complexities associated with the geology and seafloor, marine habitat and biodiversity, and human use data themes is just beginning. Strengthening the balance of the MSDI themes to increase their utility to evolving MSP processes in the U.S. requires several areas of focus:- MSP in the U.S. is moving forward at regional and sub-regional scales. Future MSDI efforts must consider development of data sets and viewers that take advantage of locally available higher-resolution and more timely data that support MSP efforts at the scale at which they are occurring.- Realizing the full potential of MSDI requires addressing the challenge of portraying uncertainty associated with spatial data. Since all data model reality, it is important to find ways to convey how close to reality the depictions of various data sets are.- MSDI must be able to integrate the best science available to describe the complex multidimensional aspects of ecosystem processes and, in turn, inform science about the gaps needing attention. - The level of complexity inherent in the data themes discussed here requires there to be multiple data products in the MSDI that address issues specific to individual data types. Issues like standardization, authoritative sources, and user needs are still being resolved for the more complex data and will continue to shape the evolving MSDI.A great deal of progress has been made building the current MSDI. Continued work on the issues outlined here will ensure that the full potential of these vital data resources for advancing MSP is realized.
5. REFERENCES
[1] Douvere F. and C. Ehler, “Ecosystem-based Marine Spatial Management: An Evolving Paradigm for the Management of Coastal and Marine Places,” Ocean Yearbook, Volume 23: 1-26, 2009.[2] ] Douvere F. and C. Ehler,. “New Perspectives on Sea Use Management,”

53
ABSTRACT
GIS tools are nowadays essential for promoting adequate strategies for the use, management and conservation of littoral areas, especially in islands where human population increase and concentrate in littoral zone.
The present study therefore aimes to create an objective protocol for an ecological zonation, using terrain information derived from multibeam data and biological variables. These data is applied for geographical conservation regions classifications, using a decision support tool. As a result, we identify 46 priority conservations sites from the area studied, based on biological and ecological values.
Index Terms— Marine Zonation, Geographical Information Systems, benthic communities, Marxan, La Palma, Canary Islands.
1. INTRODUCTION
Antropogenic activities, such as habitat modification, pollution and the overexploitation of living resources, continue to have a detrimental effect on global biodiversity levels and ecosystems [1], [2]. Furthermore, a significant proportion of the human population inhabits in coastal areas or close to aquatic systems which are particularly vulnerable to disturbance [3].
In 2002 UNESCO declared the entire territory of La Palma as Biosphere Reserve with the objective of achieving
biodiversity conservation, sustainable development and logistical support. But even so over the last years, economic activities and infrastructures in the Island have increased in the coastal zone. In consequence, it is vital for long-term sustainable development of these areas that the natural habitats are preserved and managed in conjunction with economic development. To achieve this goal, it is an important task to develop a successful system capable of assessing the quantity, quality and functional value of marine systems, thus should contain firstly a delimitation and classification of the habitats according to their physical, chemical and biological characters [4].
The management and protection of marine waters can be developed at different spatial scales, ranging from broad (regional seas, marine landscapes) to fine scale (habitats and species) [5]. The different scales require different variables for their analysis. The studies of regional sites must include oceanographic variables, but in a smaller scale where these conditions are similar, the study of variables derived from seabed terrain is a priority. At present there are a wide variety of techniques for mapping benthic areas. With the advent of multibeam technology [6] new possibilities are now available, as they provide full details of bathymetry data necessary for the production of Digital Terrain Models (MDT) and essential for the study of the marine habitats.
However, biotic information like macrobenthic spatial distribution is
GEOGRAPHICAL INFORMATION SYSTEMS (GIS) AS A TOOL FOR THE ENVIRONMENTAL EVALUATION AND MANAGEMENT OF THE COASTAL AREA OF TAZACORTE, LA PALMA (CANARY ISLANDS, SPAIN)L.M. García1,2, C. Sangil1,2, L. Concepción1, R.F. de León1, J.B. Diez2 & I.Y.G. Rodríguez 1 La Palma World Biosphere Reserve Consortium, La Palma, Canary Islands, Spain. E-mail: [email protected] La Laguna University, Tenerife, Canary Islands, Spain.
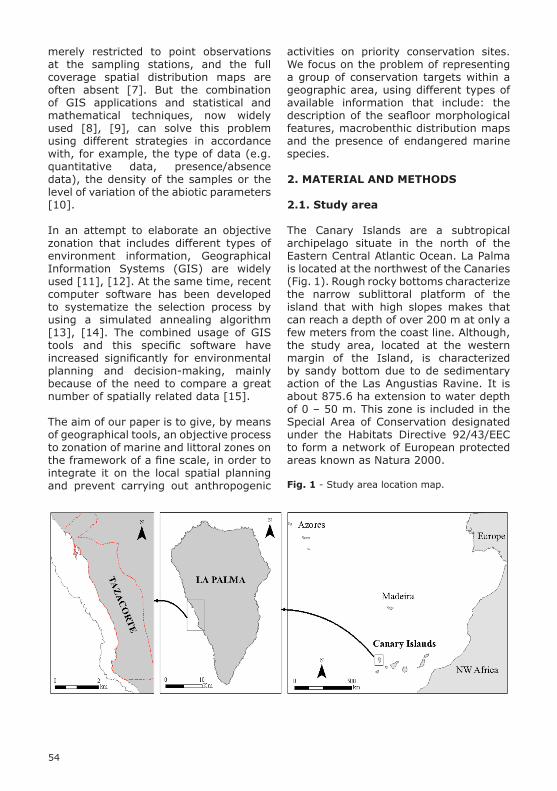
54
activities on priority conservation sites. We focus on the problem of representing a group of conservation targets within a geographic area, using different types of available information that include: the description of the seafloor morphological features, macrobenthic distribution maps and the presence of endangered marine species.
2. MATERIAL AND METHODS
2.1. Study area
The Canary Islands are a subtropical archipelago situate in the north of the Eastern Central Atlantic Ocean. La Palma is located at the northwest of the Canaries (Fig. 1). Rough rocky bottoms characterize the narrow sublittoral platform of the island that with high slopes makes that can reach a depth of over 200 m at only a few meters from the coast line. Although, the study area, located at the western margin of the Island, is characterized by sandy bottom due to de sedimentary action of the Las Angustias Ravine. It is about 875.6 ha extension to water depth of 0 – 50 m. This zone is included in the Special Area of Conservation designated under the Habitats Directive 92/43/EEC to form a network of European protected areas known as Natura 2000.
Fig. 1 - Study area location map.
merely restricted to point observations at the sampling stations, and the full coverage spatial distribution maps are often absent [7]. But the combination of GIS applications and statistical and mathematical techniques, now widely used [8], [9], can solve this problem using different strategies in accordance with, for example, the type of data (e.g. quantitative data, presence/absence data), the density of the samples or the level of variation of the abiotic parameters [10].
In an attempt to elaborate an objective zonation that includes different types of environment information, Geographical Information Systems (GIS) are widely used [11], [12]. At the same time, recent computer software has been developed to systematize the selection process by using a simulated annealing algorithm [13], [14]. The combined usage of GIS tools and this specific software have increased significantly for environmental planning and decision-making, mainly because of the need to compare a great number of spatially related data [15].
The aim of our paper is to give, by means of geographical tools, an objective process to zonation of marine and littoral zones on the framework of a fine scale, in order to integrate it on the local spatial planning and prevent carrying out anthropogenic

55
For the creation of the macrobenthic distribution map and the delimitation of the distribution area as polygons with vector format, we used the sample points and the seafloor morphological features.
2.4. The presence of marine endangered species.
The presence of marine endangered species is an important information about the biodiversity to classify the priority conservation zones. In this part of the study we used the information collected by Concepción [20] about the location in La Palma of the marine species included in the “Catálogo de Especies Amenazadas de Canarias” (List of Endangered Species in the Canaries) elaborated by the local authorities. This study revises and situates all the marine species registered in La Palma except marine mammals, birds and reptiles. The presence of these species in the study area was register and collected as points in vector format.
2.5. Database and GIS.
All the recorded information about physical and biotic parameters with different format was included in the same database of the study area. For this purpose it was necessary to elaborate a regular grid over the study area with a resolution of 250 m. From this 200 cell or units of 62.5 ha were obtained. This unit size was selected because macrobenthic distribution maps were collected at this scale. Each cell included the average value for seafloor morphological features, the total extension of benthic communities and the presence of endangered species. This information units or cells were used for the zonation process.
2.6. Ecological Zonation.
The zonation was based on the information included in the grid data base and the use of the MARXAN, a computer tool for designing priority conservation areas which includes heuristic and simulated annealing algorithms [14]. This software is designed entirety to generate networks
2.2. Seafloor morphological features.
The quantitative topographic variables that describe the seabed were obtained form the Digital Elevation Model (DEM). DEM was elaborated by Medina-Villaverde et al. [16] using sidescan sonar, and single-beam and multi-beam echosounders. Five parameters features were extracted, using the spatial algorithms implemented in ArcGIS 9.2 software and the Spatial Analyst extension. All of them have a resolution of 5 m. Slope, or the maximum rate of change, was calculated in degrees. Aspect was calculated as the direction of the cell’s slope and measured in degrees. Benthic Position Index (BPI) was calculated using ArcGIS extension Benthic Terrain Modeler (BTM) Version 1.0 [17]. The BPI allows classifying the pixels in crests, depressions, flats and slopes. Roughness is a measure of terrain complexity and was calculated with a Jenness Enterprises [18] for Arc View 3.2. This information about topography and texture, in conjunction with video camera direct observations, allows the classification of the type of substrate in hard and soft substrate.
2.3 Macrobenthic communities map.
For the creation of the macrobenthic distribution map it was necessary to carry out sampling surveys consisting in going through the entire study area with a small boat which has a video camera system, with the method described by Barquín et al. [19], between 9th and 18th November 2009. During the cruise we acquired visual samples with the video camera about the presence of the communities and substrate types, and took the precise position of the samples by means of a GPS. On board the information is included using the OziExplorer software, tracking the GPS position on real time.
In total 192 samples were taken during five days on the area studied, with an average distance of 98 m between them. The information was identified and mapped as sample points with the GIS applying the ArcGIS 9.2 software.
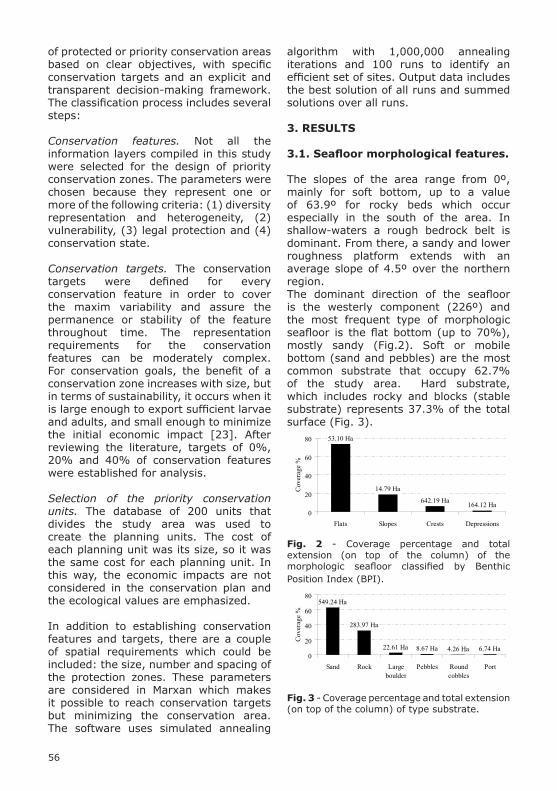
56
algorithm with 1,000,000 annealing iterations and 100 runs to identify an efficient set of sites. Output data includes the best solution of all runs and summed solutions over all runs.
3. RESULTS
3.1. Seafloor morphological features.
The slopes of the area range from 0º, mainly for soft bottom, up to a value of 63.9º for rocky beds which occur especially in the south of the area. In shallow-waters a rough bedrock belt is dominant. From there, a sandy and lower roughness platform extends with an average slope of 4.5º over the northern region.The dominant direction of the seafloor is the westerly component (226º) and the most frequent type of morphologic seafloor is the flat bottom (up to 70%), mostly sandy (Fig.2). Soft or mobile bottom (sand and pebbles) are the most common substrate that occupy 62.7% of the study area. Hard substrate, which includes rocky and blocks (stable substrate) represents 37.3% of the total surface (Fig. 3).
164.12 Ha642.19 Ha
14.79 Ha
53.10 Ha
0
20
40
60
80
Flats Slopes Crests Depressions
Cov
erag
e %
Fig. 2 - Coverage percentage and total extension (on top of the column) of the morphologic seafloor classified by Benthic Position Index (BPI).
6.74 Ha4.26 Ha8.67 Ha22.61 Ha
283.97 Ha
549.24 Ha
0
20
40
60
80
Sand Rock Largeboulder
Pebbles Roundcobbles
Port
Cov
erag
e %
Fig. 3 - Coverage percentage and total extension (on top of the column) of type substrate.
of protected or priority conservation areas based on clear objectives, with specific conservation targets and an explicit and transparent decision-making framework. The classification process includes several steps:
Conservation features. Not all the information layers compiled in this study were selected for the design of priority conservation zones. The parameters were chosen because they represent one or more of the following criteria: (1) diversity representation and heterogeneity, (2) vulnerability, (3) legal protection and (4) conservation state.
Conservation targets. The conservation targets were defined for every conservation feature in order to cover the maxim variability and assure the permanence or stability of the feature throughout time. The representation requirements for the conservation features can be moderately complex. For conservation goals, the benefit of a conservation zone increases with size, but in terms of sustainability, it occurs when it is large enough to export sufficient larvae and adults, and small enough to minimize the initial economic impact [23]. After reviewing the literature, targets of 0%, 20% and 40% of conservation features were established for analysis.
Selection of the priority conservation units. The database of 200 units that divides the study area was used to create the planning units. The cost of each planning unit was its size, so it was the same cost for each planning unit. In this way, the economic impacts are not considered in the conservation plan and the ecological values are emphasized.
In addition to establishing conservation features and targets, there are a couple of spatial requirements which could be included: the size, number and spacing of the protection zones. These parameters are considered in Marxan which makes it possible to reach conservation targets but minimizing the conservation area. The software uses simulated annealing

57
Fig. 4 - Distribution map of the macrobenthic communities.
3.4. Ecological Zonation.
Fifteen conservation features, that represent environmental complexity and the presence of relevant communities and species, were identified. Table 2 includes the conservation features with they targets and percentages included in the proposed priority conservation zones. These conservation features were selected to respond to the criteria previously described: (1) diversity representation and heterogeneity, (2) vulnerability, (3) legal protection and (4) conservation state. The surrounding zone of Tazacorte Port was excluded for the analysis. All macrobenthic community distributions and endangered species were included as conservation features except sea urchin communities and ports communities because correspond to degradation or non-balancing states of the communities. The roughness was selected from the seafloor morphological features as a measure of terrain complexity.
3.2. Macrobenthic communities.
Firstly, we expect to represent in this study the communities based on definitions of the European Nature Information System [21]. Although most of the ones considered in this study aren’t included in this classification, this paper proposes new categories for the Canary region.Eight communities were observed (Table 1). The most common was the brown garden eel (Heteroconger longissimus) community that occupies almost 40% of the area, the second were frondose algal communities (22.7%) and third, infralittoral fine sand. The other communities have an extension below 7%. The distribution maps are showed in Fig. 4.
Table 1 - Macrobenthic communities observed in the study area with total extension (ha) and coverage percentage (%).
3.3. Marine endangered species.
Seven endangered species were registered in the study area (Fig. 5): the arthropod Scyllarides latus, the echinoderm Echinaster sepositum, three fishes Gaidropsarus guttatus, Gymnothorax miliaris and Hippocampus hippocampus and two seaweeds Cystoseira abies-marina and Gelidium arbuscula. The position on the map of these species is represented as point layer except the seaweed represented as lines across the intertidal zone. Most of the species were located on rocky surfaces in depths ranging from 13-25 m.

58
rocky with high complexity bottom that correspond with the gorgonian and black coral communities.
Fig. 6 - Ecological zonation of the study area.
4. DISCUSSION
The proposed protocol is repeatable and objective; it forms a good alternative to the currently used methodologies which imply marine reserve design decisions. The representation and area calculations of benthic habitats, communities and species have been the fundamental step for the delimitation of protected zones. At present there is a wide variety of methodologies for benthic habitat mapping [3], but the technique applied in this study for the sampling is simple, with a low-cost and allows to analyse large areas in short time. Other mapping tools as the habitat suitability modelling [23], [10] are very usefull but the large amount of samples taken and the clear delimitation of the communities in our study do not need the application of these techniques.Suitable environmental variables (bathymetry, slope, substrate, roughness
The best solution selects 46 planning units as priority conservation zones, that represent 287.5 ha and 23% of the study area (Fig. 6). This scenario met all conservation goals and even overrepresented in some cases. Most of the selected units are located in the littoral zone with rocky bottoms and seaweed communities and deep
Fig. 5 - Distribution map of the marine endangered species.
Table 2 - Conservation features using in ecological zonation.

59
allows an easy application in other areas.
6. ACKNOWLEDGEMENTS
The work reported here is part of the Marcopalma proyect, supported by Fundación Biodiversidad and GISMACAN proyect co financed by Canary Islands Government and EU (FEDER). Additional support was provided by Tazacorte Townhall. This is a contribution of the Biodiversidad Group of La Palma World Biosphere Reserve Consortium in collaboration with La Laguna University We also thank Roberto Cáceres for his assistance in the sampling.
7. REFERENCES
[1] Loreau, M., S. Naeem, P. Inchausti, J. Bengtsson, J.P. Grime, A. Hector, D.U. Hooper, M.A. Huston, D.G. Raffaelli, B. Schimd, D. Tilman, D.A. Wardle, “Biodiversity and ecosystem functioning: current knowledge and future challenges”, Science 294, pp. 804–808, 2001.[2] Jackson, J.B.C., M.X. Kirby, W.H. Berger, K.A. Bjorndal, L.W. Botsford, B.J. Bourque, R.H. Bradbury, R. Cooke, J. Erlandson, J.A. Estes, T.P. Hughes, S. Kidwell, C.B. Lange, H.S. Lenihan, J.M. Pandolfi, C.H. Peterson, R.S. Steneck, M.J. Tegner, R.R. Warner, “Historical overfishing and the recent collapse of coastal ecosystems”, Science 293, pp. 629–638, 2001.[3] Diaz R.J., M. Solan and R.M. Valente, “A review of approaches for classifying benthic habitats and evaluating habitat quality”, Journal of Environmental Management, 73: pp. 165-181, 2004.[4] Kostylev V.E., Todd B.J., Fader G.B.J., Courtney R.C., Cameron G.D.M.and Pickrill R.A. “Benthic habitat mapping on the Scotian Shelf based on multibeam bathymetry, superficial geology and sea floor photographs”, Marine Ecology Progress Series, 219: pp. 121-137, 2001.[5] Verfaillie E., S. Degraer, K. Schelfaut, W. Willems, V.V. Lancker, “A protocol for classifying ecologically relevant marine zones, a statistical approach”, Estuarine, Coastal and Shelf Science, 83: pp. 175-185, 2009.
and morphology seafloor features) were selected as the most important variables for determining the distribution of the macrobenthos. They have already been indicated in many other studies [3] [5]. However the use of only these variables could imply an oversimplification of reality. Many other environmental variables could also contribute: surface temperature, hydrodynamics turbidity or primary productivity [10]. But this data are more difficult to obtain and even more expensive to measure.
It is an important consideration in the mapping process to use terms or benthic communities names based on definitions of the EUNIS classification, since it is crucial to use the same terms to make possible an integral zonation and management of the marine and coastal zones of La Palma or even the complete Canaries region.
Finally, the use of MARXAN software has been powerful tool for integrating the abiotic and biotic data in the decision-making. In Canary Islands no design of delimitation of marine protected areas has applied a decision support tool, in spite of the fact that the archipelago has 3 marine reserves, being one of them the largest of Europe. In terms of further research, the use of this tool is essential for marine reserve network design in La Palma. 5. CONCLUSIONS
This paper proposes an objective ecological zonation applied to small scale. Description of seafloor morphological features, macrobenthic community distribution and presence of vulnerable or protected species are fundamental information for the classification of the coastal zones.
The coastal and marine area studied in this project has a good representation of the marine biodiversity and ecology of the Island and show clear relationship between abiotic variables and the occurrence of macrobenthic species. The methodology is straightforward and
60
networks”, In: Quantitative methods for conservation biology. Eds. Ferson, S. and Burgman, M., Springer-Verlag, New York, pp: 291-305, 2000.[15] Leslie H. M. Ruckelshaus, I.R. Ball, S. Andelman and H. P. Possingham, “Using siting algorithms in the design of marine reserve networks”, Ecological applications, 13 (1): pp. 185-198, 2003.[16] Medina Villaverde, J.M. (coord.), Biocenosis. Estudio Ecocartográfico del Litoral de la isla de La Palma. Ministerio de Medio Ambiente. Madrid, 2005.[17] Wright, D. J., E.R. Lundbland, E.M. Larkin and R.W. Rinehart. Benthic Terrain Modeller Toolbar. Oregon State University Davey Jones Locker Seafloor Mapping/Marine GIS Lab, 2005.[18] Jenness, J. Surface Areas and Ratios From Elevation Grid (surfgrids.avx) Extension for ArcView 3.xdVersion 1.2. Jenness Enterprises. Available online at: http://www.jennessent.com/arcview/grid tools.htm, 2010.[19] Barquín Diez, J., G. González-Lorenzo and M. C, Gil-Rodríguez, “Un método de estudio de bionomía bentónica utilizado en las costas canarias para fondos poco profundos”. Vieraea, 31: pp. 219-231, 2003.[20] Concepción Francisco L., C. Sangil Hernández, L. Martín García and R. Fernández de León. Registro de especies marinas amenazadas en la isla de La Palma (Islas Canarias). Consorcio Insular de la Reserva Mundial de La Biosfera La Palma, Fundación Biodiversidad, Gobierno de Canarias y Cabildo de La Palma. 113 pp., 2009.[21] EUNIS Habitat Classification. European Environment Agency. Available online at: http://eunis.eea.europa.eu/, 2010.[22] Airamé S., J E., Dugan, K D. Lafferty, H. Leslie, D A. McArdle, and R.R. Warner. “Applying ecological criteria to marine reserve design: A case study from the California Channel Islands”, Ecological Applications, 13 (1): 170-184 pp., 2003.[23] Hirzel A, G.L. Lay, V. Helfer, C. Randi and A. Guisan, “Evaluating the ability of habitat suitability models to predict species presence”, Ecological Modelling, 199 (2): pp. 142-152.
[6] Kenny, A.J., Cato Il, Desprez M., Fader G., Schüttenhelm R.T. E. and Side J., “An overview of seabed-mapping technologies in the context of marine habitat classification”. ICES Journal of Marine Science 60: pp 411-418, 2003.[7] Young, A., “MESH maps come online. A framework to support seabed habitat mapping”, Hydro International, 11: pp 6-9, 2007. [8] Galparsoro I., A. Borja, J. Bald, P. Liria and G. Chust, “Predicting suitable habitat for the European lobster (Homarus gammarus), on the Basque continental shelf (Bay of Biscay), using Ecological-Niche Factor Analysis”, Ecological Modelling, 220: pp. 556-567, 2009.[9] Jerosch K, M. Schlüter and R. Pesch, “Spatial analysis of marine categorical information usingo indicator kriging applied to georeferenced video mosaics of the deep-sea Hakon Mosby Mud Volcano”, Ecological Informatics 1: pp. 391-406, 2006.[10] Degraer S., E. Verfaillie, W. Willems, E. Adriaens, M. Vinex and V.V. Lancker, “Habitat suitability modelling as a mapping tool for macrobenthic communitites: An example from the Belgian part of the North Sea”, Continental Shelf Research, 28: pp. 369-379, 2008.[11] Pérez O. M., T. C. Telfer and L. G. Ross, “Use of GIS-Based Models for Integrating and Developing Marine Fish Cages within the Tourism Industry in Tenerife (Canary Islands)”, Coastal Management Journal, pp. 365-366, 2003.[12] Fraschetti S., A. Terlizzi, S. Bussotti, G. Guarnieri, P. D’Ambrosio and F. Boero, “Conservation of Mediterranean seascapes: analyses of existing protection schemes”, Marine Environmental Research, 59: pp. 309-332, 2005. [13] Ball, I.R., H.P. Possingham and M. Watts, “Marxan and relatives: Software for spatial conservation prioritization”, 14: pp. 185-195 in Spatial conservation prioritisation: Quantitative methods and computational tools. Eds Moilanen, A., K.A. Wilson, and H.P. Possingham. Oxford University Press, Oxford, UK, 2009.[14] Possingham, H.P., I.R. Ball, and S. Andelman. “Mathematical methods for identifying representative reserve

61
ABSTRACT
In this paper Moderate Resolution Imaging Spectroradiometer (MODIS) multispectral imagery is used for oil spills mapping as an integration to radar data. MODIS images of the northern Gulf of Mexico (USA) are analyzed to study the sea anomalies from visible to thermal infrared in order to detect a reported oil slick. A simple Fluorescence/Emissivity Index and RGB false color bands combination are applied to detect fluorescence and emissivity anomalies due to oil spills in particular sun glint conditions. A monitoring system of sea surface may be built using high temporal resolution imagery as MODIS data. Applying the proposed index and RGB bands combination, also suitable on night-time overpasses, it’s possible to further increase the availability of clouds free images using optical sensors.
Index Terms — Deepwater Horizon, oil spill, Remote Sensing, MODIS, thermal infrared.
1. INTRODUCTION
Petroleum products play a fundamental role in modern society, particularly in the transportation, plastics, and fertilizer industries and there are typically ten to fifteen transfers involved in moving oil from the oil field to the final consumer. Oil spills can occur during oil transportation or storage and spillage can occur in water, ice or on land. Marine oil spills can be highly dangerous since wind, waves and currents can scatter a large oil spill over a wide area within a few hours in the open sea [8]. The detection of oil slicks is an important Remote Sensing objective
for both exploration and environmental applications. For exploration, persistent or recurrent oil slicks can point out the presence of undersea oil seeps. For environmental applications, early detection of anthropogenic oil slicks can make possible timely protection of critical habitats and helps identify polluters [17].The environmental impacts of oil spills can be considerable. Oil spills in water may severely affect the marine environment causing a decline in phytoplankton and other aquatic organisms. Phytoplankton is at the bottom of the food chain and can pass absorbed oil on to the higher levels. Oiled birds suffer from behavioral changes and this may result in the loss of eggs or even death. The livelihood of many coastal people can be impacted by oil spills, particularly those whose livelihood is based on fishing and tourism [14].
On April 20th, 2010, an explosion occurred to the Deepwater Horizon offshore oil platform, located about 80 km off the coast of the Louisiana, USA. After a two days fire (Figure 1), the drilling rig sank on April 22nd, causing a massive oil spill in the northern Gulf of Mexico that we estimated on April 29th to be at least 5,840 km2. The spill was originated by the oil rig placed about 1.5 km under the sea surface, and could reach an estimated total amount of millions of barrels until the flow will be stopped. The oil spill rapidly expanded during the initial 8-day period and covered a very large area along the coast of Louisiana, extending approximately north to south for 120 km. Sediments in the region are generally thick, with the greatest sediment load carried by the Mississippi
EVALUATION OF MODIS DATA FOR MAPPING OIL SLICKS - THE DEEPWATER HORIZON OIL SPILL CASE (2010)M. Gianinetto, P. Maianti, R. Tortini, F. Rota Nodari & G. LechiPolitecnico di Milano, Laboratory of Remote Sensing (LaRS), Building Environment Sciences and Technologies (BEST) Department, Piazza Leonardo da Vinci 32, 20133 Milano, ItalyE-mail: [email protected]

62
11], the evaluation of slick thickness [7, 9] and the classification of the oil type, in order to estimate environmental damages and take appropriate response activities [12].
In the visible (VIS) region of the electromagnetic (E.M.) spectrum, oil has a higher surface reflectance than water [6], but also shows limited nonspecific absorption tendencies. Sheen shows up silvery and reflects light over a wide spectral region down to the blue. However, oil has no specific characteristics that distinguish it from the background [12]. Therefore, techniques that separate specific spectral regions in the VIS do not increase detection capability.
Oil is optically thick and absorbs solar radiation re-emitting a portion of this radiation as thermal energy, primarily in the 8-14 µm region. In thermal infrared (TIR) images, thick oil appears hot, intermediate thicknesses of oil appear cool, and thin oil or sheens are not detectable [12]. Specific studies in the TIR show that there is no spectral structure in this region [17]. Tests on a number of IR systems show that emulsions are not always visible in the IR, and cameras operating in the 3 to 5 µm range seem to be only marginally useful [10].
2.2. Limitations of optical satellite sensors for oil slicks detection
Optical satellite sensors provide a synoptic view of the affected area, but several problems are associated with relying on those for oil spill Remote Sensing. Besides a lower spatial resolution than airborne images (an extremely important matter when the oil is distributed in sparse windows and patches over large areas), atmospheric transmission in the ultraviolet (UV) region in which oil fluoresces [17] is poor, making satellite observations unprofitable in that E.M. region [3]. Another limitation is due to the timing and frequency of overpasses and the absolute need for clear skies to perform optical image collection. The chances of the overpass and the clear
River [19]. Moreover, on April 30th the oil slick reached the Mississippi river delta, approaching the Delta National Wildlife Refuge and the Breton National Wildlife Refuge. Since the Mississippi river delta systems support a variety of coastal habitats [13], the spilled oil will adversely affect these fragile ecosystems, including endangered and threatened species.
Previous studies showed the potentialities of the Moderate Resolution Imaging Spectroradiometer (MODIS) for environmental monitoring (e.g. rapid response flood mapping [18]). The study area is shown in Figure 1, in which it’s possible to notice a smoke plume coming out from the platform fire. In this paper we assess the capability of MODIS for oil spills detection and mapping. This work aims at demonstrating the great potential of coastal and marine environment monitoring using high temporal resolution MODIS datasets, in particular to identify anomalies over the sea surface and to evaluate their evolution in narrow time ranges.
Fig 1 - April 21, 2010 - MODIS true color composition image of the study area. The white cross indicates the oil platform coordinates; the box indicates the zoom area on the platform fire and smoke plume.
2. BACKGROUND
2.1. Spectral properties overview
Remote Sensing data have been employed by a large number of researchers to investigate oil spills, focusing mainly on the mapping of the areal extent [1, 2, 4,
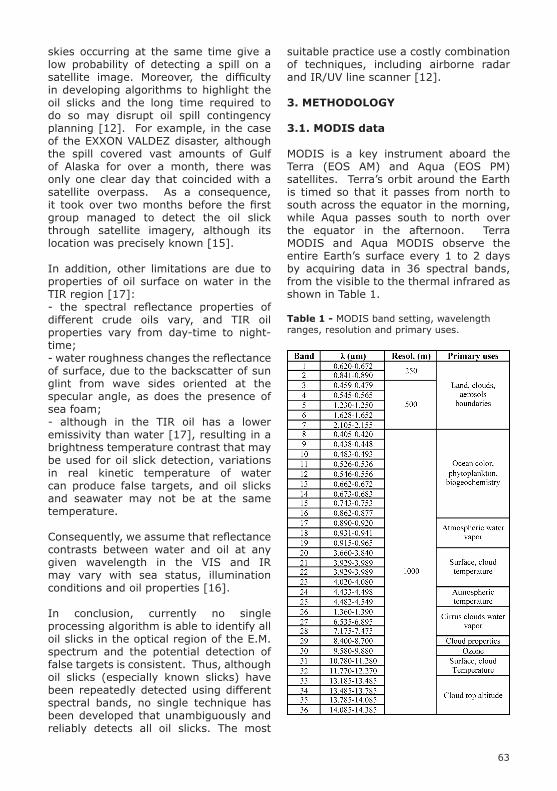
63
suitable practice use a costly combination of techniques, including airborne radar and IR/UV line scanner [12].
3. METHODOLOGY
3.1. MODIS data
MODIS is a key instrument aboard the Terra (EOS AM) and Aqua (EOS PM) satellites. Terra’s orbit around the Earth is timed so that it passes from north to south across the equator in the morning, while Aqua passes south to north over the equator in the afternoon. Terra MODIS and Aqua MODIS observe the entire Earth’s surface every 1 to 2 days by acquiring data in 36 spectral bands, from the visible to the thermal infrared as shown in Table 1.
Table 1 - MODIS band setting, wavelength ranges, resolution and primary uses.
skies occurring at the same time give a low probability of detecting a spill on a satellite image. Moreover, the difficulty in developing algorithms to highlight the oil slicks and the long time required to do so may disrupt oil spill contingency planning [12]. For example, in the case of the EXXON VALDEZ disaster, although the spill covered vast amounts of Gulf of Alaska for over a month, there was only one clear day that coincided with a satellite overpass. As a consequence, it took over two months before the first group managed to detect the oil slick through satellite imagery, although its location was precisely known [15].
In addition, other limitations are due to properties of oil surface on water in the TIR region [17]:- the spectral reflectance properties of different crude oils vary, and TIR oil properties vary from day-time to night-time;- water roughness changes the reflectance of surface, due to the backscatter of sun glint from wave sides oriented at the specular angle, as does the presence of sea foam;- although in the TIR oil has a lower emissivity than water [17], resulting in a brightness temperature contrast that may be used for oil slick detection, variations in real kinetic temperature of water can produce false targets, and oil slicks and seawater may not be at the same temperature.
Consequently, we assume that reflectance contrasts between water and oil at any given wavelength in the VIS and IR may vary with sea status, illumination conditions and oil properties [16].
In conclusion, currently no single processing algorithm is able to identify all oil slicks in the optical region of the E.M. spectrum and the potential detection of false targets is consistent. Thus, although oil slicks (especially known slicks) have been repeatedly detected using different spectral bands, no single technique has been developed that unambiguously and reliably detects all oil slicks. The most

64
4. IMAGE PROCESSING
4.1. Pre-processing
All MODIS images were supplied atmospherically corrected and resampled to a unique value of 1 km of spatial resolution. They provide directional hemispherical reflectance (ρ) from band 1 to 19 and directional emissivity (ε) from band 20 to 36. Every single scene was georeferenced to allow the overlay with ancillary vector data (i.e. coastline, localization of the platform).
4.2. Oil slick detection on MODIS day-time VIS and IR data
Spatiotemporal variations in the thermodynamic properties of oil and seawater have been mapped in order to identify oily surfaces. Although sun-glint and wind sheen may create a similar impression to an oil sheen, we assume that any observed anomaly is caused by the oil spill.For opaque bodies the transmittance is negligible and Kirchhoff’s law can be written in the following simplified form [3]:
The oil seeping from the sea bed passes from a colder to a hotter status during the ascension. We assume that its temperature gets to equilibrium once oil has reached the marine surface and remains constant regardless of its spatial distribution. Thus, we can further simplify Kirchhoff’s law in the following:
During the day oil has a lower emissivity and higher UV fluorescence than water. To enhance the contrast between the oil slick and the surrounding seawater a Fluorescence/Emissivity Index (FEI) has been developed on MODIS data and was defined as follows:
64 MODIS scenes from April 20th to May 5th, 2010 from both Terra and Aqua satellites day-time and night-time overpasses were acquired. Among these, 16 images are cloud free over the slick and are potentially appropriated for the aim of this study. Table 2 shows a subset of data actually processed in this study.
Table 2 - Date, time of acquisition and satellite of the processed images.
Date Time (GMT) SatelliteApril 21, 2010 19:20 AquaApril 29, 2010 07:30 AquaApril 29, 2010 16:55 TerraMay 05, 2010 04:10 Terra
3.2. Approach
Previous works demonstrated that although real differences in temperature between oil slicks and nearby seawater caused by differing absorption of sunlight may disguise the effects of emissivity differences, the spectral behavior of oil slicks and seawater in the 8-14 µm atmospheric window is distinctly different and surprisingly unaffected by variables that might be expected to alter them [17]. Even then, real water temperature differences due to currents may introduce false targets. Thus, the only unambiguous difference between spectra of oil slicks and seawater lies in the different shapes of their spectral curves, usually referred to as their spectral signatures, making night-time measurements desirable because less dependent upon the observation conditions. Oil absorbs the solar radiation and emits a part of it as thermal energy mainly in the TIR (8-14 μm). Oil has a lower emissivity than water in TIR; therefore, at these wavelengths, it has a distinctively different spectral signature compared to the background water [17].In this study we aim at detecting the slick at first during day-time exploiting reflectance properties of oil and seawater and subsequently during night-time analyzing the IR emissivity information.

65
Fig. 2 - April 29, 2010 - MODIS day-time grayscale composition image of FEI. The white cross indicates the oil platform coordinates.
On the same day-time MODIS image, a RGB false color visualization was performed by combining bands 23, 31 and 29 respectively (Figure 3). This combination clearly highlights the slick from the background and the obtained result is consistent with Figure 2.The same band combination was performed on a MODIS image acquired during the previous night (Figure 4). The oil slick seems to be well highlighted from the surrounding pixels. Moreover, the location, shape and extension of the slick have a good correspondence with both the previous results.
Fig. 3 - April 29, 2010 - MODIS day-time IR false color composition image. The white cross indicates the oil platform coordinates.
This normalized index is based on the relationship between blue and TIR ranges, respectively band 3 and band 31 in MODIS data, combining the theoretically higher blue range component of oil, due to fluorescence induced by λ < 0.400 µm sunlight rays [4], and the lower emissivity in the TIR. The higher is the value of the contribution of blue and the lower is the one of emissivity, the greater will be the FEI values.
4.3. Oil slick detection on MODIS IR data
Given that the information from IR should theoretically be useful to discriminate materials with different emissivity values, the intra-image emissivity variation on seawater surface was used on MODIS night-time data. The different spectral features of oil and seawater in this region can be enhanced with an appropriate IR bands visualization. For example, it is possible to combine emissivity values taken from mid-wavelength and thermal range limits, and on the edge between these two spectral regions. This visualization can also be performed on night-time images, potentially increasing the availability of clouds free images on the study area.
5. RESULTS AND DISCUSSION
The considered dataset (acquired from April 20th, 2010 to May 5th, 2010 by both Terra and Aqua satellites day-time and night-time overpasses) is almost centered on the investigated sector and clearly shows anomalies close to the Louisiana coast: as sun-glint conditions emphasize the contrast against the surrounding marine water, applying the FEI index to the day-time MODIS data of April 29, 2010 it was possible to detect in the sea a curved plume brighter than the surrounding seawater and expanding from the platform coordinates (Figure 2). This anomaly seems to be corresponding for geographical position and shape to the oil slick reported in those days.

66
in particular sun glint conditions. In case of massive oil spills, MODIS sensor may highlight anomalies using a geometric resolution of 1 km.
The Fluorescence/Emissivity Index, calculated using MODIS bands 3 and 31, may represent an interesting mean to identify and discriminate oily substances floating on the sea surface, as enhancing the results obtainable using only visible data. Moreover, an appropriate RGB false colors bands composition of infrared emissivity data (bands 23, 31 and 29 respectively) highlights the oil slick in both day-time and night-time images. This also allows to detect the presence of potential clouds coverage, that could represents false targets.
In conclusion, MODIS data may give a significant contribution for a marine and coastal monitoring system, also considering the availability of several daily acquisitions from Terra and Aqua satellites. A limitation of a MODIS data based monitoring system remains the meteorological conditions, as cloud cover may prevent radiance penetration from sea surface, but using infrared data from night-time overpasses the frequency of acquisition of clear sky scenes may sensibly improve.
7. ACKNOWLEDGEMENTS
The authors would like to acknowledge NASA Goddard Space Flight Center - LAADS Web program for the availability of free MODIS data.
8. REFERENCES
[1] K.G. Al-Hinai, M.A. Khan, A.E. Dabbagh, and T.A. Bader, “Analysis of Landsat Thematic Mapper data for mapping oil slick concentrations - Arabian Gulf oil spill 1991”, The Arabian Journal for Science and Engineering, 18(2), pp. 85-93, 1993.[2] C. Bentz, and F.P. de Miranda, “Application of remote sensing data for oil spill monitoring in the Guanabara
Fig. 4 - April 29, 2010 - MODIS night-time IR false color composition image. The white cross indicates the oil platform coordinates; the dark line indicates the coastline.
Whereas on day-time images clouds were filtered out exploiting reflectance information, night-time data can be affected by potential clouds coverage. However, Figure 5 shows the proposed RGB bands combination on a cloudy image, in which the slick keeps the same hue as in Figure 3 and 4, while clouds are well distinguishable from oil.
Fig. 5 - May 05, 2010 - MODIS night-time IR false color composition image. The white cross indicates the oil platform coordinates; the dark line indicates the coastline.
6. CONCLUSIONS
The importance and complexity of the marine environment requires a continuous and multidisciplinary study. Multispectral thermal sensors like MODIS seem appropriate to investigate processes occurring at sea [5], especially
67
Maracaibo, Venezuela”, EOS Transactions American Geophysical Union, 84(33), pp. 313-319, 2003.[12] M.N. Jha, J. Levy, and Y. Gao, “Advances in Remote Sensing for oil spill disaster management: state-of-the-art aensors technology for oil spill surveillance”, Sensors, 8, pp. 236-255, 2008.[13] J.F. Martin, E. Reyes, G.P. Kemp, H. Mashriqui, and J.W. Day Jr., “Landscape modeling of the Mississippi delta”, BioScience, 52(4), pp. 357-365, 2002.[14] NOAA (National Oceanic and Atmospheric Administration) website. http://response.restorat ion.noaa.gov/. See Topic: Emergency Response, Responding to Oil Spills. Last accessed on May 20, 2010.[15] J.A. Noerager, and R.H. Goodman, “Oil tracking, containment and recovery during the EXXON VALDEZ response”, Proceedings of the 1991 Oil Spill Conference, American Petroleum Institute, Washington D.C., pp. 193-203, 1991.[16] Z. Otremba, and J. Piskozub, “Modeling of the optical contrast of an oil film on a sea surface”, Optics Express, 9, pp. 411-416, 2001.[17] J.W. Salisbury, D.M. D’Aria, and F.F. Sabins Jr,”Thermal infrared remote sensing of crude oil slicks”, Remote Sensing of Environment, 45(2), pp. 225-231, 1993.[18] P. Villa, and M. Gianinetto, “Inundated area delineation using MODIS data: towards a global scale geo-database of flood events”, The International Archives of the Photogrammetry, Remote Sensing and Spatial Information Sciences, XXXVI(4) - Goa (India), unpaginated CD-ROM, 2006.[19] E.C. Witt III, C.D. Adams, J. Wang, D.K. Shaver, and Y. Filali-Meknassi, “Soil and sediment chemistry in the Mississippi river delta following hurricane Katrina”, in Science and the Storms: the USGS Response to the Hurricanes of 2005, U.S. Department of the Interior, USGS National Wetlands Research Center, Lafayette (Louisiana), pp. 207-212, 2008.
Bay, Rio de Janeiro, Brazil”, IGARSS’01 proceedings, 1, pp. 333-335, 2001.[3] P.A. Brivio, G. Lechi, and E. Zilioli, Principi e metodi di Telerilevamento, Edizioni Città Studi - De Agostini, Milano (Italy), 2006.[4] F. Dessì, M.T. Melis, L. Naitza, and A. Marini, “MODIS data processing for coastal and marine environment monitorning: a study on anomaly detection and evolution in Gulf of Cagliari (Sardinia, Italy)”, The International Archives of the Photogrammetry, Remote Sensing and Spatial Information Sciences, XXXVII(B8) - Beijing (China), pp. 695-698, 2008.[5] W.E. Esaias, M.R. Abbott, I. Barton, O.B. Brown, J.W. Campbell, K.L. Carder, D.K. Clark, R.H. Evans, F.E. Hoge, H.R. Gordon, W.M. Balch, R. Letelier, and P.J. Minnett, “An overview of MODIS capabilities for ocean science observations”, IEEE Transactions on Geoscience and Remote Sensing, 36(4), pp. 1250-1265, 1998.[6] M.F. Fingas, and C.E. Brown, “Remote sensing of oil spills”, Sea Technology, 38, pp. 37-46, 1997.[7] M.F. Fingas, C.E. Brown and J.V. Mullin, “The visibility limits of oil on water and Remote Sensing thickness detection limits”, Proceedings of the Fifth Thematic Conference on Remote Sensing for Marine and Coastal Environments, Environmental Research Institute of Michigan, Ann Arbor (Michigan), pp. II 411-418, 1998.[8] M. Fingas, The basics of oil spill cleanup, CRC Press LLC, Boca Raton (Florida), 233 pp., 2001.[9] R.H. Goodman, “Application of the technology in North America”, in The Remote Sensing of Oil Slicks, John Wiley and Sons, Chichester (United Kingdom), pp. 39-65, 1989.[10] G.L. Hover, “Testing of infrared sensors for U.S. Coast Guard oil spill response applications”, Proceedings of the Second Thematic Conference on Remote Sensing for Marine and Coastal Environments: Needs, Solutions and Applications, ERIM Conferences, Ann Arbor (Michigan), pp. I-47-58, 1994.[11] C. Hu, F.E. Muller-Karger, C.J. Taylor, D. Myhre, B. Murch, A.L. Odriozola, and G. Godoy, “MODIS detects oil spills in Lake

68
ABSTRACT
System Approach Framework (SAF) includes a sequence of steps with the overall purpose to develop a self-evolving, holistic research approach for integrated appraisal of Coastal Systems so that the existing scientific knowledge can be available to support deliberative and decision-making processes aimed at improving the sustainability of Coastal Systems by implementing Integrated Coastal Zone Management (ICZM) policies. The main goal is to achieve equilibrium between Ecological, Social and Economic sectors of the Coastal System and to explore it´s dynamics, as well as, the possible consequences of alternative policy scenarios. Achieving this objective requires a reorganization of the science required to comprehend the interactions between multifaceted natural and social systems at different spatial and temporal scales including the overall economic evaluation of alternative policies. The present work explains SAF using practical examples of its application in two distinct national coastal environments: Southeast coast of Terceira Island and Guadiana Estuary.
Index Terms - System thinking, multidisciplinary approach, integrated coastal management
1. INTRODUCTION
Human activities have incessantly threatened the stability of our present society due to the continual and fast degradation of natural resources, which support our existence through its goods and services. The need to stop this degradation is imperative, while its
impact has been recognizing worldwide by inequalities in economic and social circumstances that, in turn, generates political pressures. Going back in human history the susceptibility of humans to the exhaustion of its resource is well documented [1] and the same behavior has been registered in modern society [2, 3]. Coastal zone due to its population is one of the most important human habitats, as well as, in great risk.
Due to this, Sustainable Development has become one of the most important global achievements. Eu policies reveal this agenda by the distinct action: Bird and Habitat directives, Agenda 21, Lisbon and Göteborg Strategies, Water Framework Directive, Sustainable Impact Directive, Integrated Coastal Zone Management (ICZM) recommendations and forthcoming Maritime Strategy and new ICZM directive. From EU recommendation for ICZM we can conclude that to achieve sustainable development there is a need to better integrate scientific knowledge into policies at the most appropriate level [4]. Taking this to account, the present framework wants to contribute to this process.
System Approach Framework (SAF) includes a sequence of steps with the overall purpose to develop a self-evolving, holistic research approach for integrated appraisal of Coastal Systems so that the existing scientific knowledge can be available to support deliberative and decision-making processes aimed at improving the sustainability of Coastal Systems by implementing Integrated Coastal Zone Management (ICZM) policies. This framework is based on
SYSTEM APPROACH FOR COASTAL ZONE MANAGEMENT: APPLICATION IN SOUTHEAST COAST OF TERCEIRA ISLAND AND GUADIANA ESTUARY
M.H. Guimarães1,2, A. Mascarenhas2, C. Sousa2, T. Dentinho1 & T. Boski21 Gabinete de Gestão e Conservação da Natureza, Universidade dos Açores, 9701-851, Angra do Heroísmo, Portugal2Centro de Investigação Marinha e Ambiental, Faculdade de Ciência do Mar e Ambiente, 8005-139, Faro Portugal
69
makers have in the SAF process: they are involved since the first stage of the process by identifying the most relevant policy issue, as well as, the possible decisions. In the more advance stages of SAF process stakeholders are ask to work together with the product developed so that refinements can be done. In the end of the process they receive an adapted, interactive information portfolio.
SAF is being tested in 18 case studies along Europe under the umbrella of SPICOSA Project - Science and Policy Integration for Coastal Systems Assessment, in the 6th framework program, priority 1.1.6.3: Global Change and Ecosystems. One of the goals of SPICOSA project is to create an operational Systems Approach Framework for assessments of policy alternatives in Coastal Zone Systems. The SAF emerges from existing knowledge and progress with new knowledge. A SAF Portfolio consisting of generic assessment methodologies, specific tools, models, and new knowledge useful for ICZM, will be created in a manner that is comprehensible and updateable for future Costal Zone (CZ) researchers and professionals. In addition, SPICOSA will produce new curricula, training modules and opportunities for academics and professionals involved in Sustainability Science and ICZM implementation.
The aim of this article is to present the ongoing work that has been developed in two case studies in Portugal: Guadiana Estuary case study and Southeast coast of Terceira Island in Azores archipelago. Guadiana Estuary is a case study included in SPICOSA project and the work developed is quite advance since the project started in 2007. Terceira Island case study is included in a PhD project that tests SAF approach in terms of methodologies and particularities by comparing its application in two distinct ecological and socio economic realities. The work in Terceira Island started in 2009 so comparison of results is not yet possible. For this reason, the main goal of this article is to present SAF approach giving particle examples.
several concepts including systems thinking and multidisciplinary assessment framework that explores and applies methodologies in the ecological, social and economic fields of research.
With systems we can look at connections between elements, at new properties that emerge from these connections and feedbacks, and at the relationships between the whole and the part [5]. This worldview is referred to as “systems thinking”. The roots of systems thinking go back to studies on systems dynamics at MIT led by Jay Forrester in 1956, who was also the inventor of magnetic-core memory, which evolved into the random access memory used in all computers today. With his background in electrical and computer engineering, Forrester has successfully applied some of the same engineering principles to social, economic and environmental problems. In more recent years, system approach and analysis has been spread through distinct disciplines and tools (e.g. in management, [6]; in environmental management, [7]; and in applied mathematics, [8]).
SAF main goal is to achieve a balance between Ecological, Social and Economic sectors of the Coastal System so that its dynamics can be explore, as well as, the potential consequences of alternative policy scenarios. Achieving this objective requires a reorganization of the science required to comprehend the interactions between multifaceted natural and social systems at different spatial and temporal scales including the overall economic evaluation of alternative policies.
SAF can be included in the category of tools defined as Decision Support Systems (DSS) since the aim is to produce information useful for distinct end-users. End-users include politicians making the final decision, experts advising decision makers, bodies in charge of policy preparation, implementation or monitoring and stakeholders influence or influencing the process. Importance and effectiveness of this tool is enlarged by the role that stakeholders and decision-

70
earliest colonization [15, 16]. In recent years pressures on littoral and offshore resources have grown [17] with the subsistence or artisanal exploitation to more commercial operations. The coast line of Terceira Island is characterized by cliffs that vary from small to moderate heights interrupted by small bays, above all through east and south sides (figure 2). The northern coast is constantly submitted to the wave action, and on the other hand, the eastern part is protected from these actions [18]. This way it was possible to emerge a wetland that attracted many kind of sea birds exclusive from this place, and form a long beach with 3 kilometers length; unique in Azores, and with a dune field of 13 meters width. In our days this wetland is reduce to a small fraction. Human activities mainly related construction drained the wetland and the habitat disappeared some decades ago as well as the beach, only remaining a small strip of sand.
2. CASE STUDIES
Guadiana is one of the most important rivers on Iberian Peninsula, whose total length is 730 km of which the last 200 km forms a natural border between Portugal and Spain. Brackish conditions can be observed circa 40 km upstream of the river mouth. Mértola in the Portuguese margin is the last point of tidal influence and defines the end of the estuarine area (fig. 2). Guadiana estuary catchment basin is the fourth largest in the Iberian Peninsula, ca.67,500 km2 [9]. The climate, typically Mediterranean, is classified as semiarid, being arid in July and August, and temperate-humid from November to January [10]. Accordingly, the Guadiana area shows clear seasonal and inter-annual variations, characterized by severe droughts and heavy floods. The Guadiana basin is under increasing pressure for exploitation of water resources, especially since the 1960s, with the construction of dams and reservoirs that affect the river and its tributaries. The existence of more than forty dams along the river causes a severe decrease of river flow which is leading to significant impacts on the estuarine hydrodynamics, sediment transport and water quality [11, 12]. A number of environmental problems, such as eutrophication, untreated wastewater discharges, and habitat destruction, are presently taking place.
The Azorean archipelago is located in the North Atlantic Ocean between 37-40o N latitude and 23–31o W longitude (Fig. 3) and the closest point to mainland Europe is around 1,400 km [13]. It is composed of nine volcanic islands of relatively recent origin (varying between 0.25 and 8 Myr, although most areas are less than 1 Myr old). Terceira is the third largest island, with c. 402 km2 and a maximum altitude of 1,021 m. The climate is temperate oceanic, characterized by mild temperatures, moderate to high rainfall, and high atmospheric humidity [14]. The Azores were uninhabited until colonized by the Portuguese in the 15th Century. Man has exploited littoral, near shore and offshore living resources since the
Fig. 1 - Guadiana Estuary geographic location (source: Google earth)

71
designated by system design. This stage involves the identification of the structure, function and dynamics of the system. The conceptualization can begin with a very raw definition that becomes increasily accurate during the process. The development of the conceptual model and the identified policy issue is a schematic way that facilitates the development of scenarios and outputs. In this stage is also important to identified the necessary information and methods that should be use to pass from a concept to a formal structure, that includes mathematical formalization of the cause and effect relation identified.
To define the system we also need to define a question we want to address. This question can be of any nature but it is usually related with a dysfunction, impact or change in the system that is causing ecological, economic and or social problems. This question is designated by policy issue that requires a prognostic helpful to the process of deliberation and decision making. From this policy issue we can identify the impacts on the ecological and socio economic system, as well as, the human activities that are causing this change.
System design includes a series of tasks; definition of the policy issue, system definition, elaboration of the conceptual model, design of information base and the scale of the problem. All subtask are interrelated but can be identified individually. The definition of the policy issue is primarily a social process that describes a series of interconnected social changes that impact what we designate by the ecological system, separating human activities from the rest of the ecosystem. Hence this first task must be supported by social tools that can helps us understand the patterns of though and behavior of the society of the study area, the way this society is organized including rules and the relations among groups.
Going into the practical application of this stage, the definition of the policy issue was performed using different techniques
Fig. 2 - Geographic location of Azores, Terceira Island and Praia da Vitoria city.
3. METHODOLOGY AND RESULTS
SAF concept follows the common sequential strategy described by Jeffers (1978) presenting the following attributes: 1) it can be functional to any type of system hence its suitable for any system investigation, 2) the approach is holistic and hierarchical. It considers the entire system but it´s possible to focus the analysis on first-order functions and deeper into the system if required, 3) iteration and rescaling is a requirement in order to insure a balance between effort, precision and resolution, 4) it’s multidisciplinary, 5) it gives high significance to information flows in the system which facilitates the enclosure of controls and constrains that human society implies, finally, 6) it is suitable for modeling and scenario building. Figure 4 presents a scheme of SAF process showing that the research design starts by defining the problem and from there tries to understand the chain of cause and effects that exist.
Fig. 3 - System Approach sequence of steps. (Adapted from SPICOSA work document)
5.1. System design
SAF application starts with the stage

72
Fig. 4 - Q sort questionnaires: a) individual response b) group response.
Results haven´t been analyzed in detail so it´s is too premature to identified the policy issue. However, from a first analysis of the data the highly ranked issues are related with the maintenance and optimization of wetlands existing in the area, the impact of the industrial park that surrounds these wetlands, the impact of heavy construction and of garbage deposition.
Fig 5 - Evolution of conceptualization of the system using conceptual models: a) Conceptual map of Guadiana estuary case study using CMAP® tools (source: spicosa project) b) simple conceptual map of Terceira island case study.
5.1. System Formulation
In this second step the aim is to represent the operation of the system in qualitative and quantitative terms. During the formulation step, the conceptual map might be adapted and changed. This iterative process is also consider in SAF as
in each case study. This process started with stakeholder’s identification of each system. Ultimately all residents are stakeholders; however the identification was narrowed to governmental institutions with responsibilities in the decision making, human activities affecting the system and Non Governmental Institutions (NGO) acting in the area. In Guadiana estuary one-to-one meetings were undertaken so that the project could be presented and stakeholders could engage with SAF application. After this meeting a questionnaire was sent by email so each participant could rank from a predefined list of possible policy issues the most relevant ones. This list was produce by a team of researchers and it was based on problems identified in previous works. From data treatment of these questionnaires the identified policy issue was: water and sediment quality of Guadiana Estuary related with untreated wastewater and river runoff control by dams existing along the river and tributaries.
In Terceira Island we have used participative methodologies that included the application of Q-sort methodology [19] and small group meetings. The process started with semi-directed interviews to key stakeholders; review of these interviews extraditing the different policy issues; application of Q sort questionnaire (fig. 5a) where each individual ranked the identified policy issues taking into account its relevance. This process was also performed in small groups (fig. 5b) where stakeholders were asked to perform the same ranking all together. These groups included 3 to 6 stakeholders from different categories (researchers, governmental institutions, NGO, economic activities, etc).
a) b)
a)
b)

73
the influence of wastewater treatment levels and different river discharge regimes on fecal coliforms concentration (fig. 7). So the output of this model is ecological although the inputs are derived from Human activities.
Fig. 6 - Output of the ecological component model in ExtendSim®
The socioeconomic model was developed using Cost-Benefit Analysis [20] and Economic Base Theory [21]. These two approaches have been defined so that distinct stakeholder’s needs could be answered. The application of Cost-Benefits Analysis (CBA) is in consonance with the requirements of Water Framework Directive (WFD) and can contribute to the challenge that each member state has. This directive calls for an economic analysis of water use, in order to promote cost effective measures. In addition, the WFD presents a clear concern for the social cost of implementing regulatory approaches and enhances the need to develop strategies that secure social benefits.
The effectiveness and short-term cost of reducing bacterial loadings were analyzed by comparing the costs with the benefits of each possible scenario. At the moment the defined scenarios are related to the level of waste treatment, from bad (6% removal rate), fair (50%; removal rate) to good (99% removal rate) and with the level of river runoff that can go from ecological minimum river discharge (2m/s), half of the actual river discharge, actual river discharge to double of the actual river discharge. The term actual represents the registered river discharge from 2002 until 2007 in Pulo do Lobo station localized in Guadiana River immediately before the estuarine area that is being modeled. One the benefits side we included the revenues
it can be observed in scheme of figure 4 that show connection between the distinct steps (thin arrows). This iterative process is due to two main reasons: data available to represent the system and stakeholders needs in terms of process, scenarios and outputs.
Formulation step requires the use of a platform that allows the conversion of a qualitative conceptual system to a quantitative system. The software used in this task is ExtendSim®, a simulation tool that allows the development of dynamic models of real-life processes in a wide variety of fields. ExtendSim® allows the use of building blocks, the exploration of the processes involved in the blocks, how they relate and how the system behaves after a change in the assumptions. Building blocks can be divided in six basic groups: decision variables, state variables, exogenous variables, random variables and output variables. Still in the system design all the variables are put in one of these categories so that we can formulate the system, prepare scenarios and present the outputs. ExtendSim® software has been use along all case studies of SPICOSA project and will also be use in system formulation of Terceira case study. Until this moment practical examples can only be demonstrated in Guadiana Estuary.
Although SAF aims to be an integrated approach, at this stage of the proceedings, each component is formalized separately so that the simulations model can be produced and validated previously to integration. In Guadiana estuary the ecological component allows us to understand how water quality reacts to distinct inputs of fecal coliforms. Within the model the user can define these inputs by changing river runoff and wastewater discharges. For these results the estuary was approached as a sequence of three interconnected segments: upper, middle and lower estuarine sectors. The transport of a given contaminant along the estuary (across sectors) was simulated through the advection-diffusion equation. With this simulation model we can understand
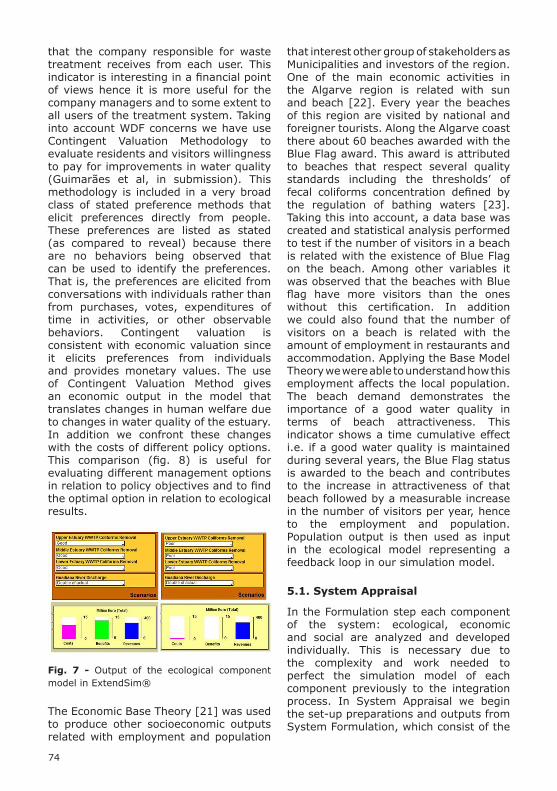
74
that interest other group of stakeholders as Municipalities and investors of the region. One of the main economic activities in the Algarve region is related with sun and beach [22]. Every year the beaches of this region are visited by national and foreigner tourists. Along the Algarve coast there about 60 beaches awarded with the Blue Flag award. This award is attributed to beaches that respect several quality standards including the thresholds’ of fecal coliforms concentration defined by the regulation of bathing waters [23]. Taking this into account, a data base was created and statistical analysis performed to test if the number of visitors in a beach is related with the existence of Blue Flag on the beach. Among other variables it was observed that the beaches with Blue flag have more visitors than the ones without this certification. In addition we could also found that the number of visitors on a beach is related with the amount of employment in restaurants and accommodation. Applying the Base Model Theory we were able to understand how this employment affects the local population. The beach demand demonstrates the importance of a good water quality in terms of beach attractiveness. This indicator shows a time cumulative effect i.e. if a good water quality is maintained during several years, the Blue Flag status is awarded to the beach and contributes to the increase in attractiveness of that beach followed by a measurable increase in the number of visitors per year, hence to the employment and population. Population output is then used as input in the ecological model representing a feedback loop in our simulation model.
5.1. System Appraisal
In the Formulation step each component of the system: ecological, economic and social are analyzed and developed individually. This is necessary due to the complexity and work needed to perfect the simulation model of each component previously to the integration process. In System Appraisal we begin the set-up preparations and outputs from System Formulation, which consist of the
that the company responsible for waste treatment receives from each user. This indicator is interesting in a financial point of views hence it is more useful for the company managers and to some extent to all users of the treatment system. Taking into account WDF concerns we have use Contingent Valuation Methodology to evaluate residents and visitors willingness to pay for improvements in water quality (Guimarães et al, in submission). This methodology is included in a very broad class of stated preference methods that elicit preferences directly from people. These preferences are listed as stated (as compared to reveal) because there are no behaviors being observed that can be used to identify the preferences. That is, the preferences are elicited from conversations with individuals rather than from purchases, votes, expenditures of time in activities, or other observable behaviors. Contingent valuation is consistent with economic valuation since it elicits preferences from individuals and provides monetary values. The use of Contingent Valuation Method gives an economic output in the model that translates changes in human welfare due to changes in water quality of the estuary. In addition we confront these changes with the costs of different policy options. This comparison (fig. 8) is useful for evaluating different management options in relation to policy objectives and to find the optimal option in relation to ecological results.
Fig. 7 - Output of the ecological component model in ExtendSim®
The Economic Base Theory [21] was used to produce other socioeconomic outputs related with employment and population

75
the present simulation model. In Appraisal step an intense process of interaction with stakeholders occurs so that feedback on the simulation model design and output. This is the stage that Guadiana estuary is at the moment. Around 8 meetings with distinct stakeholders groups have been perform. The results of this work are still being process and will not be presented here.
5.1. System OutputThis step starts after the process of iteration of the model, scenarios and stakeholders needs. In this step all necessary information is organized for policy deliberation and dissemination to the non-science end-users community. This step can be achieved using distinct formats adequate to each reality and necessities. Formats can varies from qualitative descriptions, dynamic indicators, error and effectiveness critique, recommendations forecast scenarios with multiple policy options, economic analyses of scenarios, and interactive deliberations conducted with the policy end-users, with stakeholders and with the public. The preparation of a diversity of formats of this end product has to do with the distinct targets of SAF: governance, discussion forum, end users and public.
6. DISCUSSION AND CONCLUSIONS
Comparison among case studies is not possible at the moment due to the early stage of Terceira island case study. However it is possible to say that SAF application in Guadiana Estuary allowed us to understand some interesting issues arising from the challenge of working in multidisciplinary arena. Ecological, social, economic and modeling field follow very different assumption and methodologies which can make SAF application difficult. However the use of a common platform related with the modeling is a stimulus to find a common ground among disciplines. Hence the requirement of passing from a conceptual model to a simulation models forces disciplines to find common solutions. In addition, modeling produces
integration of all components in a single component designated by Ecological-Social-Economic component (ESE). The distinct models are coupled to construct the simulation model. This step can be very challenging not only in terms of multidisciplinary approach but also in modeling task mainly due to the distinct units and time steps use in each ESE component.
After the acquisition of a valid ESE model we need to arrange the model and it´s outputs to serve the main goal; utility in simulating management questions. Model outputs and significance must be put in a format rapidly understandable by non-scientist, which implies that indicators and interpretative material must be prepared. This will help the synthesis of the model results including the difference between each scenario.
In Guadiana case study the ecological and socioeconomic model were linked using the threshold of fecal coliforms for bathing waters (fig. 5). The model starts the simulation of a certain scenario with an initial population driven from the National Institute of Statistic. The simulation runs for 6 years, each year the model gives an ecological output; daily concentration of fecal coliforms. This output is then compared with the water bathing regulation. This is the first link between the distinct components. Fecal coliforms concentrations are checked against the water quality thresholds used for the attribution of Blue Flag award. During the bathing season if the standards are respected the beach is considered a Blue Flag beach. This output is used to calculate people’s willingness-to-pay for water quality improvement and is also used to predict the amount of visitors that will visit the beach each year. This is then linked with employment and then with population. For this reason the ecological component of this integrated model uses simulated population values from the second year until the end of the simulation, which represents an interesting feedback loop between components. In figure 5a) we can observe the conceptual model of

76
Journal of the European Communities. p. 4.[5] Voinov, A., System science and modeling for ecological economics. 2008: Elsevier.[6] Blake, R.R., Mouton J. S. , he Managerial Grid: The Key to Leadership Excellence. Houston: Gulf Publishing Co.. 1964.[7] Jorgensen, S.E., Environmental management in the 21st century. Environmental Science & Technology, 1999. 33(17): p. 376[8] Murota, K., Matrices and Matroids for Systems Analysis Vol. Algorithms and Combinatorics 20. 2000: Springer.[9] Chicharo, M.A., L. Chicharo, and P. Morais, Inter-annual differences of ichthyofauna structure of the Guadiana estuary and adjacent coastal area (SE Portugal/SW Spain): Before and after Alqueva dam construction. Estuarine Coastal and Shelf Science, 2006. 70(1-2): p. 39-51.[10] Morales, J.A., 1993. Sedimentologia del estuario del Guadiana (SW Espana e Portugal), University of Sevilla, Spain.[11] Euronatura and IIDMA, Aplicação da directiva-quadro da água e Convenção Luso-Espanhola de 1998 na Bacia Hidrográfica do Guadiana. . 2003, Euronatura: Lisboa.[12] Brandao, C. and R. Rodrigues, Hydrological simulation of the international catchment of Guadiana River. Physics and Chemistry of the Earth Part B-Hydrology Oceans and Atmosphere, 2000. 25(3): p. 329-339.[13] Aranda, S.C., et al., Assessing the completeness of bryophytes inventories: an oceanic island as a case study (Terceira, Azorean archipelago). Biodiversity Conservation, 2010: p. 16.[14] Azevedo, E.B., Modelação do Clima Insular Escala Local. Modelo CIELO aplicado ilha Terceira, in University of Azores, Angra do Heroísmo. 1996, University of Azores: Angra do Heroísmo.[15] Serpa, J., 1886. A industria Piscatoria nas Ilhas Fayal e Pico, in Opusculos Açorianos. 1886, Imprensa Academica: Coimbra. p. 1-18.[16] Sampaio, A., 1904. Memoria sobre a Ilha Terceira. Angra do Heroismo:
a series of generic blocks that can be used in other case studies due to the possibility of analyzing similar process (e.g. nutrients dispersion) or the same methods (e.g. discount factor in CBA). These results prove the possibility of SAF application to other coastal areas.
Other advantage of this approach, as well as, limitation is the data requirement. The need to find and compile data can be a difficult task and might limit the number of relation explained by the model. On the other hand it is also an exercise of integration and a reason to increase communication and collaborations among institutions.
Looking deeper into all the social process occurring within SAF we can conclude that deliberation and decision making is not limited to the choice among scenarios obtained by the simulation model. Deliberation and decision making are complex processes that have a distinct time frame difficult follow with a simulation model; however all the interaction that SAF approach requires is an important contribution on this process because it promotes discussion among stakeholders including the scientific community. In addition, it is visible the learning process occurring by presenting the simulation model in its integrated structure.
7. BIBLIOGRAPHY
[1] Diamond, J., Collapse: How Societies Choose to Fail or Succeed. 2005: Penguin. 592.[2] Imhoff, M.L., et al., Global patterns in human consumption of net primary production. Nature, 2004. 429(6994): p. 870-873.[3] Vitousek, P.M., et al., Human domination of Earth’s ecosystems. Science, 1997. 277(5325): p. 494-499.[4] COUNCIL, RECOMMENDATION OF THE EUROPEAN PARLIAMENT AND OF THE COUNCIL of 30 May 2002 concerning the implementation of Integrated Coastal Zone Management in Europe, in 2002/413/EC, T.E.P.A.T.C.O.T.E. UNION, Editor. 2002, 2002/413/EC: Official

77
Imprensa Municipal.[17] Santos, R.S., et al., Marine research, resources and conservation in the Azores. Aquatic Conservation-Marine and Freshwater Ecosystems, 1995. 5(4): p. 311-354.[18] Morton, B., J.C. Britton, and A.M. Frias Martins, Ecologia Costeira dos Açores. 1998 São Miguel, Açores, Portugal: Sociedade Afonso Chaves[19] Stephenson, W., The Study of Behavior: Q-Technique and Its Methodology. Psychometrika, 1954. 19(4): p. 327-333.[20] Pearce, D., G. Atkinson, and S. Mourato, 2006. Cost-Benefit Analysis and the Environment - recent developments. 2006: OECD Publishing.[21] Looye, J.W., COMMUNITY ANALYSIS AND PLANNING TECHNIQUES - KLOSTERMAN,RE. Journal of the American Planning Association, 1992. 58(1): p. 120-121.[22] Dias, J.M.A., Evolução da zona costeira portuguesa: Forçamento antrópicos e naturais. Encontros científicos, 2005. 1: p. 8-28.[23] FEE, A.B.A.d.E., Critérios Bandeira Azul para Zonas Balneares. 2009. p. 39.
78
ABSTRACT
The study focuses on a unique geologic environment throughout the Canadian Beaufort Shelf and its likely role as a unique arctic habitat. Pingo-like-features (PLFs) are bathymetric features formed by gas-driven sediments derived from decomposing gas-hydrate associated with Holocene sea level rise. They are unique habitats arising more than 15m off the seafloor, with a small diameter of about 80-90m. Based on multibeam data and video analysis this paper details the distribution of epibenthos living on top of the PLFs and in the vicinity surrounding two PLFs. We, attribute to the PLFs a role as a distinct habitat in the Beaufort Sea. We found a considerably higher number of species at or near PLFs than at the reference station at a distance of several hundreds. Furthermore, we located more sessile species on the shallower and wider PLF which possibly indicates less activity and age than the steeper and higher PLF’s.
Index Terms - pingo-like-features, epibenthos, habitat mapping, GIS, Beaufort Sea
1. INTRODUCTION
It is well known that benthic distribution and community features, such as composition, diversity, and standing stock, are influenced by a complex of abiotic and biotic factors. The food supply of the majority of benthic faunas depends on the availability of organic matter, ultimately originating from the autotrophic production in the upper euphotic layer of the water column
[17]. There are exceptions to this rule, e.g., cold seeps where biogenic or thermogenic organic matter is being provided from deeper layers of the seafloor. The correlation of unique benthic assemblages to a definite methane-driven geochemical environment, building definite biogeochemical habitats, has been proven in several studies (e.g. [2], [11], [15], [16]).
To date, the Beaufort Shelf is known as an area of free gas occurrence and mud volcanism, as shown by the presence of actively venting gas on sub-bottom data and the observation of gas bubbles at the sea surface in the vicinity of the volcanoes. Sediment cores taken in 2003 contained high amounts of methane and ice nodules[12]. Gas voids were present in push cores [14]. Discrete dome-shaped bathymetric features that have been described as diapirs, mud volcanoes or pingo-like-features (PLFs) are known to be formed by gas-driven sediment expansion and movement. They occur on the Canadian Beaufort Shelf and other shelves (e.g. offshore California [13] and the mid-Norwegian Margin [9]. Venting methane, freshwater ice uplifted over older sediments on the PLF, and depressions surrounding some PLFs containing younger sediments, can be considered as a consequence of thermal warming of subsurface gas hydrate in permafrost associated with the Holocene transgression of the Arctic Shelf [12].
So far, 384 PLFs have been mapped since 2001 by the Geological Survey of Canada (GSC) using multibeam, sidescan sonar, and single-channel seismic systems.
ANALYSIS OF EPI-BENTHOS DISTRIBUTION AND THEIR POSSIBLE ASSOCIATION TO GARY KNOLL’S PINGO-LIKE-FEATURES ON THE CANADIAN BEAUFORT SHELF: A SMALL-SCALE CASE STUDYK. Jerosch, V.E. Kostylev & S.M. Blasco
Geological Survey of Canada,(Atlantic), Natural Resources Canada, Bedford Institute for Oceanography, 1 Challenger Drive, Dartmouth, NS, B2Y 4A2, Canada. E-mail: [email protected].
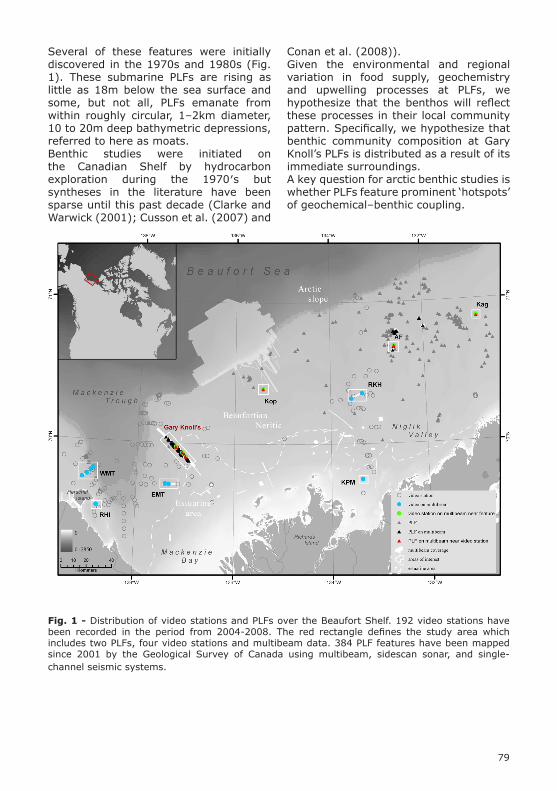
79
Conan et al. (2008)).Given the environmental and regional variation in food supply, geochemistry and upwelling processes at PLFs, we hypothesize that the benthos will reflect these processes in their local community pattern. Specifically, we hypothesize that benthic community composition at Gary Knoll’s PLFs is distributed as a result of its immediate surroundings. A key question for arctic benthic studies is whether PLFs feature prominent ‘hotspots’ of geochemical–benthic coupling.
Several of these features were initially discovered in the 1970s and 1980s (Fig. 1). These submarine PLFs are rising as little as 18m below the sea surface and some, but not all, PLFs emanate from within roughly circular, 1–2km diameter, 10 to 20m deep bathymetric depressions, referred to here as moats.Benthic studies were initiated on the Canadian Shelf by hydrocarbon exploration during the 1970′s but syntheses in the literature have been sparse until this past decade (Clarke and Warwick (2001); Cusson et al. (2007) and
Fig. 1 - Distribution of video stations and PLFs over the Beaufort Shelf. 192 video stations have been recorded in the period from 2004-2008. The red rectangle defines the study area which includes two PLFs, four video stations and multibeam data. 384 PLF features have been mapped since 2001 by the Geological Survey of Canada using multibeam, sidescan sonar, and single-channel seismic systems.
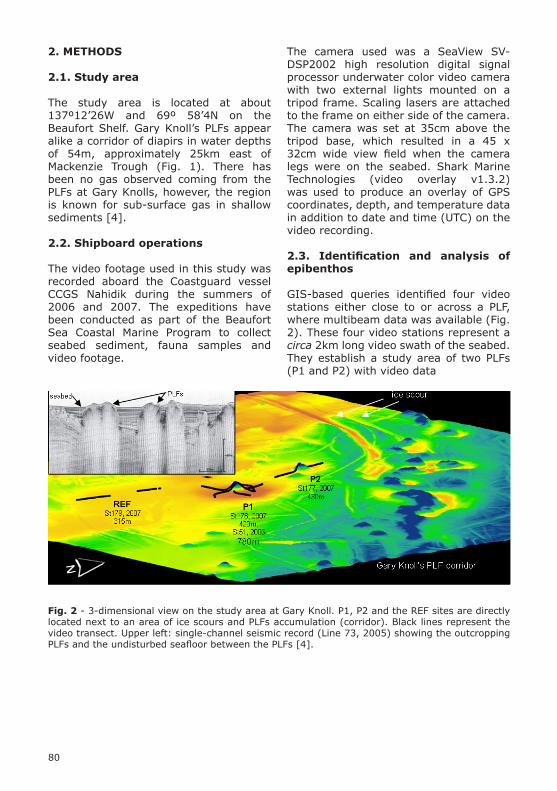
80
Fig. 2 - 3-dimensional view on the study area at Gary Knoll. P1, P2 and the REF sites are directly located next to an area of ice scours and PLFs accumulation (corridor). Black lines represent the video transect. Upper left: single-channel seismic record (Line 73, 2005) showing the outcropping PLFs and the undisturbed seafloor between the PLFs [4].
2. METHODS
2.1. Study area
The study area is located at about 137º12’26W and 69º 58’4N on the Beaufort Shelf. Gary Knoll’s PLFs appear alike a corridor of diapirs in water depths of 54m, approximately 25km east of Mackenzie Trough (Fig. 1). There has been no gas observed coming from the PLFs at Gary Knolls, however, the region is known for sub-surface gas in shallow sediments [4].
2.2. Shipboard operations
The video footage used in this study was recorded aboard the Coastguard vessel CCGS Nahidik during the summers of 2006 and 2007. The expeditions have been conducted as part of the Beaufort Sea Coastal Marine Program to collect seabed sediment, fauna samples and video footage.
The camera used was a SeaView SV-DSP2002 high resolution digital signal processor underwater color video camera with two external lights mounted on a tripod frame. Scaling lasers are attached to the frame on either side of the camera. The camera was set at 35cm above the tripod base, which resulted in a 45 x 32cm wide view field when the camera legs were on the seabed. Shark Marine Technologies (video overlay v1.3.2) was used to produce an overlay of GPS coordinates, depth, and temperature data in addition to date and time (UTC) on the video recording.
2.3. Identification and analysis of epibenthos
GIS-based queries identified four video stations either close to or across a PLF, where multibeam data was available (Fig. 2). These four video stations represent a circa 2km long video swath of the seabed. They establish a study area of two PLFs (P1 and P2) with video data

81
steep (<12.5º). Video swath lengths have been defined as video transect meters (mv) according to the morphological slope zones of the PLFs (top, and periphery), and the nearby relatively flat REF station.
3.2. Epibenthos distribution at Gary Knoll’s pingos
In general, we found a considerably higher number of species at or near PLFs (P1: 3.52/mv; P2: 4.74/mv) than at a distance of several hundred meters (REF: 0.94/mv.) Furthermore, P1 shows a higher species richness (11 families) than P2 and REF (7 families each). Despite the gas-hydrate decomposing environment there was no visual evidence for chemosynthetic species on the videos. Analysis of the distribution of several groups of benthic megafauna on and near the features has shown that the relative abundance of benthic invertebrates depends on the seabed slope and distance to PLFs. Analyzing the species distribution according to slope and not to the location, we see that at both PLFs the relative abundance of Echinodermata., Mollusca and Coelenterata prefer a moderate to steep slope (Tab. 1). All observed fishes and Annelida were located near P1 on a flat seafloor (Fig. 4). All Species recorded in the reference area seems to prefer the flat regions.We selected four families (Crinoidea, Asteroidae, Ophiuroidea and Anthozoa) for further analysis, because
close or across these features and one reference video station (REF) 350-1300m away.Fauna was identified and quantified from the video image to the lowest possible taxonomic level and logged using a GSC-developed computer program into a text-file which was joined with ship’s navigation data. Total abundance of epibenthic macrofauna was recorded for each transect. Multibeam data were used to calculate the slope and to divide the study area into zones of slope gradients (steep, moderate and flat) in order to differentiate the ‘hot-spot’ areas and reference areas surrounding the PLFs closely.
3. RESULTS
3.1. Slope and video data distribution
Multibeam bathymetric data and video transects have enabled the detailed assessment of the epibenthos distribution on the specific morphology of two PLFs on the Canadian Beaufort Shelf. PLFs are widespread across the shelf between 140ºW and 130ºW (384 known PLFs) (Fig. 1). Along the northeastern shelf and at the Gary Knoll’s corridor they accumulate significantly - at Gary Knoll’s 147 PLFs appear in an area of 44 km2 (see extract in Fig. 2), which is 3-4 PLFs per square kilometer. The slope analysis has shown that the PLFs have a periphery with moderate slope values, followed by a steep ascent and have a flattened top.The designated areas in this study - P1, P2 and REF - for a habitat analysis are located closely to ice scours and the PLFs accumulation (corridor). The heights of P1 and P2 from their crest to their 2 m deep moats are 18m and 15m, respectively and their diameter 82m and 92m, respectively. Therefore, P1 has a significantly higher slope gradient than P2. The REF station is in a consistently flat surrounding. According to the distribution of slope values we classified the slope grid into three major slope zones following Jenk’s Natural Breaks method [9]: flat (<3.81º), moderate (3.81º - 12.5º) and

82
Table 1 - (above) Relative and absolute abundance of major epibenthic groups related to slope at and near Gary Knoll’s PLFs P1 and P2 (mv: video swath meter). Species richness is higher at the steeper P1 than at P2 and REF. The number of species is significantly higher at or near PLFs than at REF.
Fig. 3 - charts (left) Relationship between relative abundance of major groups of benthic megafauna and seabed slope on and around bathymetric features. Two nearby pingos on Gary Knoll’s and the surrounding reference seabed station is shown.
these taxa were the most abundant at the sampling stations. The analysis was done with regard to their location on the PLFs (on top, in the periphery or in the surrounding area). Anthozoa occur considerably more often in the surrounding area of P1 and on top of P2
than at REF. The three Echinodermata families have been recorded as extremely abundant on top and in the periphery of P1. Conversely, all of these species showed highest abundances in the surrounding area of P2.
Gary Knoll - Pingo 1
0
0.2
0.4
0.6
0.8
1
1.2
0 5 10 15 20 25 30 35 40
Slope
Rel
ativ
e ab
unda
nce
Annelida Anthozoa Asteroidea
Crinoidea Isopoda Ophiuroidea
Polychaetea Expon. (Ophiuroidea) Expon. (Anthozoa)
Gary Knoll - Pingo 2
0
0.2
0.4
0.6
0.8
1
1.2
0 5 10 15 20 25 30 35 40
Slope
Rel
ativ
e ab
unda
nce
Annelida Anthozoa Asteroidea
Crinoidea Isopoda Ophiuroidea
Polychaetea Expon. (Ophiuroidea) Expon. (Anthozoa)
Gary Knoll - Reference
0.0
0.2
0.4
0.6
0.8
1.0
1.2
0.0 5.0 10.0 15.0 20.0 25.0 30.0 35.0 40.0
Slope
Rel
ativ
e ab
unda
nce
Bivalvia Anthozoa GastropodaAsteroidea Isopoda OphiuroideaPycnogonida Expon. (Ophiuroidea)

83
Fig. 4 - Quantitative and qualitative mapping on Gary Knoll’s PLFs P1, P2 and REF of all species recorded. Left: Echinodermata (except Ophiuridae) appear to be more abundant at the PLF sites. Center: Ophiuridae arise extremely abundant on all three test regions. Right: remaining Phyla occur considerably in a higher number and type of species close to the tops of the geological features.
The species distribution supports this hypothesis. We identified more mobile species (Asteroidae, Ophiuroidea) on the peak of P1, whereas sessile Anthozoa are more abundant on top of P2. Is there thus a general distribution pattern on active versus inactive PLFs? Or does the observed distribution pattern just reflect an enhanced food supply caused by the additional current exposed location of the steeper and higher P1? So far, a large number of PLFs has been detected on the Beaufort Shelf. Since the Beaufort Shelf is part of an extensive oil drilling program and there is a lack of knowledge regarding PLFs as marine habitats, it is important to carefully analyze PLF epifauna and to establish the role of PLFs as unique seabed habitats. This knowledge supports the assessment of the impact of proposed offshore pipeline routes and exploration drill sites on the Beaufort Sea ecosystem.
4. DISCUSSION AND CONCLUSION
PLFs hold particular interest to the oil and gas industry, and environmentalists and scientists, due to their association with possible greenhouse gas emissions, potential hydrocarbons at depth, geohazards, and unique ecosystems. In this small-scale case study we have shown that because of the differences in the species structure in the PLFs versus REF, there is evidence for PLFs as unique habitats (see Figure 4 and Table 2). However, the question remaining is whether or not species distribution is a result of methane hydrate seepage or current activity over the PLF feature. P1 is steeper and shows higher species richness when compared to P2 and REF. This may suggest the influence of geochemical activity as a result of methane hydrate release at P1.

84
Beaufort Sea Mapping Program, Geological Analysis”, Report of the Geological Survey of Canada, Atlantic, 2006.[5] Campbell, A., Blasco, K., White, M., Campbell, P., Burke, R. and Blasco, S.M., “2005 Beaufort Sea Mapping Program, Geological Analysis”, Report of the Geological Survey of Canada, Atlantic, 2007.[6] Clarke, K.R., Warwick, R.M., “Change in marine communities: an approach to statistical analysis and interpretation”, 2nd edition. PRIMER-E Ltd., Plymouth, 2001.[7] Conlan K. Aitken, A., Hendrycks E., McClelland, C., Melling, H. “Distribution patterns of Canadian Beaufort Shelf macrobenthos”, Journal of Marine Systems 74, 864–886, 2008.[8] Cusson, M., Archambault, P., Aitken, A., “Biodiversity of benthic assemblages on the Arctic continental shelf: historical data from Canada”, Mar. Ecol., Prog. Ser. 331, 291–304, 2007.[9] Hovland, M., Svensen, H., “Submarine pingoes: Indicators of shallow gas hydrates in a pockmark at Nyegga, Norwegian Sea”, Marine Geology 228, 15–23, 2006.[10] Jenks, G.F., “The Data Model Concept in Statistical Mapping”, International Yearbook of Cartography 7: 186-190, 1967.
5. ACKNOWLEDGEMENTS
We thank the officers and crew, the shipboard scientific party for excellent support during CCGS Nahidik cruises to the Gary Knoll’s PLFs in 2006 and 2007. The Natural Sciences and Engineering Research Council Canada (NSERC) provided support in granting a Visiting Fellowship in Canadian Government Laboratories as a part of the IPY.
11. REFERENCES
[1] Atkinson, E.G., Wacasey, J.W., “Benthic invertebrates collected from the western Canadian Arctic, 1951 to 1985”, Can. Data Rep. Fish. Aquat. Sci. 745, 1989.[2] Boetius, A., Ravenschlag, K., Schubert, C.J., Rickert, D., Widdel, F., Gieseke, A., Amann, R., Jørgensen, B. B., Witte, U., Pfannkuche, O., „A marine microbial consortium apparently mediating anaerobic oxidation of methane“, Nature, 407: 623-626, 2000.[3] Berger, T.R., “Northern Frontier, Northern Homeland. The report of the Mackenzie Valley Pipeline Inquiry”, Volume One. Ministry of Supply and Services Canada, 1977.[4] Blasco, K., White, M., Campbell, P., Oickle, E., Burke, R., Blasco, S.M., “2004
Table 2 - Relative (per video transect meter [mv]) and absolute quantification of Echinodermata and Anthozoa according to their location: on top, in the periphery or in the surrounding of the PLFs. The variation in the relative abundance shows a relation between occurrence and slope.

85
[11] Jerosch, K., Schlüter, M., Foucher, J.P., Allais, A.G., Klages, M., Edy, C. „Spatial distribution of mud flows, chemoautotrophic communities, and biogeochemical habitats at Håkon Mosby Mud Volcano”, Marine Geology, 243, 1-17, 2007.[12] Paull, C.K., Ussler III, W., Dallimore, S.R, Blasco, S.M., Lorenson, T. D., Melling, H., Medioli, B.E., Nixon, F.M., McLaughlin, F.A. “Origin of pingo-like features on the Beaufort Sea shelf and their possible relationship to decomposing methane gas hydrates”, Geophys. Res. Lett., 34, L01603, 2007.[13] Paull, C.K., Normark, W.R., Ussler III, W, Caress, D.W., Keaten, R.. “Association among active seafloor deformation, mound formation, and gas hydrate growth and accumulation within the seafloor of the Santa Monica Basin, offshore California”, Marine Geology 250, 258–275, 2008.[14] MacKillop, K., pers. com., 2008[15] Niemann, H., Lösekann, T., de Beer, D., Elvert, M., Nadalig, T., Knittel, K., Amann, R., Sauter, E., Schlüter, M., Klages, M., Foucher, J.P., Boetius, A.,. “Novel microbial communities of the Håkon Mosby mud volcano and their role as a methane sink”. Nature 443, 854–858, 2006.[16] Sibuet, M., Olu-Le Roy, K., “Cold seep communities on continental margins: structure and quantitative distribution relative to geological and fluid venting patterns”. In: Wefer, G., Billett, D., Hebbeln, D., Jørgensen, B. B., Schlüter, M., Van Weering, T. (Eds.), Ocean Margin Systems, Springer-Verlag, Berlin-Heidelberg, p. 235-251. 2002.[17] Tyler, P.A., “Conditions for the existence of life at the deep-sea floor: an update”, Oceanogr. Mar. Biol Annu. Rev. 33:221–244, 1995.[18] Wacasey, J.W., Atkinson, E.G., Derick, L., Weinstein, A., “Zoobenthos data from the southern Beaufort Sea”, 1971–1975. Fish. Mar. Serv. Data Rep. 41, 187 pp, 1977.

86
ABSTRACT
Several ecologic, economic and institutional processes converge in coastal areas that require especial planning and management. The study area of this research is the Colombian coastal zones, northwest corner of South America. We describe the results from several Integrated Coastal Zone Management (ICZM) projects carried out between 2000-2010 by the Marine and Coastal Research Institute. The methodology is based on the national initiative COLMIZC (Colombian Integrated Coastal Management Methodology) that is supported on the use of transversal tools such as Geographic Information Systems and Remote Sensing. The progress of the ICZM plans is described on Environmental Coastal Units (UAC in Spanish). In general, 22% of coastal areas have been addressed by ICZM studies that have identified a variety of coastal and marine geomorphologic features, ecosystems and land use units. Moreover, potential management units provided to the decision makers include measures such as protection, ecosystems recovery, sustainable and development. Another important outcome is the identification and location of problems and conflicts present in the coastal zones. GIS offers diverse advantages related with facility for processing large amounts of data, selection, definition and rate criteria for environmental zoning. Nevertheless, we found some limitations on this approach related to information availability and differences in temporal and space scales. Colombia’s IZCM process is still in progress, further work will include areas without ICZM and more detailed studies on submerged zones.
Index Terms— Integrated Coastal Zone Management, GIS, Remote Sensing, Colombia
1. INTRODUCTION
In a general context, part of the importance of coastal zone areas lies on that 72% and 20% of the earth’s surface is covered by seas and coastal areas respectively, and that approximately 60% of the world’s population lives in coastal areas [1]. Coastal areas are also spaces where several ecological, economic and institutional processes convey conferring the need for particular planning and for specific management that respond to these specific environments. Such strategies should reconciliate ecosystem’s conservation, the use of natural resources provided by such environments and aim the sustainable development of these areas.
Colombian coastal zones are defined as a national space with natural, demographic, social, economical and cultural characteristics, where interaction processes between sea, land and air occur; where biodiversity supply goods and services that support activities such as fishing, tourism, shipping, harbor development, mining exploration; and where urban and industrial settlements are placed. It is a natural, unique, fragile and limited natural resource of our country that demands and adequate management in order to assure its conservation, its sustainable development and its traditional communities’ cultural values [2-4].
Considering the above, it becomes clear that some of the causes originating this
GEOGRAPHIC INFORMATION TECHNOLOGIES FOR INTEGRATED COASTAL ZONE MANAGEMENT IN COLOMBIA: A NATIONAL EXPERIENCE
P. Lozano-Rivera, C. García-Valencia, A. L. RodríguezMarine and Costal Research Institute “Jose Benito Vives de Andreis”, Cerro Punta Betín, Santa Marta Colombia, AA 1016. E-mail: [email protected].

87
and rocky shorelines; with the typical productivity of tropical marine and coastal ecosystems.
Coastal zone pressures from population growth are not clearly evident in Colombia as they are in other parts of the word. However, there is a great threat over coastal resources particularly on certain areas where coastal ecosystems are at a critical state [2]. This pressure is developing mainly as consequence of the land use patterns, which in most of the cases are incompatible with natural ecosystems’ sustainability.
Along the Colombian coastal zones, in general, is evident the expansion of unplanned activities such as tourism, waste disposal (domestic and industrial), destruction and/or habitat loss, loss of biodiversity related to flora and fauna overexploitation, coastal erosion and conflicts arising from incompatible productive activities. Although the situation cannot be compared with the global situation, population growth along the Colombian Caribbean has been the most significant at the national level. Barranquilla, Santa Marta and Cartagena, the main urban areas have shown a considerable population growth.
The ICZM process in Colombia has been developed using the Environmental Coastal Units (UAC by its Spanish acronym) which are defined as: environmental units, geographically continuous, with clearly defined ecosystems, that require a unique visualization and management in order to bring together local and sub regional territorial entities. Currently the Colombia coastal zones are divided into ten UAC (Figure 1), five in the continental Caribbean, one in insular Caribbean and four in the Pacific coastal zones.
2.2. Methods
The method applied promotes the adoptions of ICZM in Colombia and proposes an environmental approach to coastal zone planning. This methodology is compound by the following steps:
situation are related to deficient planning processes and lack of management strategies accord to the needs of these areas. For this reason proper planning and management strategies are required in order to: 1) solve problems and conflicts related to the several interests from different users; 2) establish the environmental cost and impacts caused by human activities 3) set up guidelines that improve coastal resources; 4) Identify coastal spaces of particular interests, as well as resources at risk to guarantee their protection and conservation; 5) place the different uses and activities in such a way that are not incopatible
Geographic information technology is a wider concept of (computerized) tools for handling spatial data, including multimedia tools. Geo-information technologies integrate information with their location (x and y coordinates). The capacity of geo-information technologies to integrate information make them very useful tools to support ICZM [5].
The present document shows the results from diverse studies on Integrated Coastal Zone Management (ICZM) carried out at various locations of the Colombian coastal zones between 2000 and 2010. In those studies geographic information technologies such as Geographic Information System GIS and remote sensing, have been successfully applied for collecting, organizing, visualizing and integrating marine and coastal information [6-12]. We present as well the advance of environmental and management units knowledge and the progress of ICZM application.
2. MATERIALS AND METHODS
2.1. Study area
There are 3.882 km of shorelines along the Colombian Pacific, Caribbean and insular zones; the Caribbean shoreline is 1642 km. [13]. There are several types of ecosystems including mangrove forests, beaches, coastal lagoons, coral reefs, sedimentary sea beds, sea grasses,
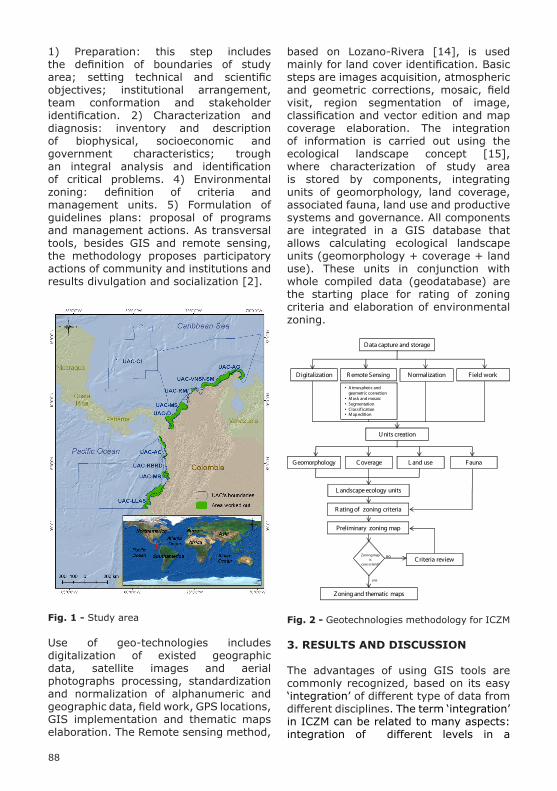
88
based on Lozano-Rivera [14], is used mainly for land cover identification. Basic steps are images acquisition, atmospheric and geometric corrections, mosaic, field visit, region segmentation of image, classification and vector edition and map coverage elaboration. The integration of information is carried out using the ecological landscape concept [15], where characterization of study area is stored by components, integrating units of geomorphology, land coverage, associated fauna, land use and productive systems and governance. All components are integrated in a GIS database that allows calculating ecological landscape units (geomorphology + coverage + land use). These units in conjunction with whole compiled data (geodatabase) are the starting place for rating of zoning criteria and elaboration of environmental zoning.
Data capture and storage
Digitalization R emote Sensing Normalization Field work
• A tmospheric and geometric correction
• Mask and mosaic• Segmentation• Classification• Map edition
Units creation
Geomorphology C overage L and use Fauna
L andscape ecology units
R ating of zoning criteria
Preliminary zoning map
Zoning map is
consistent?C riteria review
Zoning and thematic maps
no
yes
Fig. 2 - Geotechnologies methodology for ICZM
3. RESULTS AND DISCUSSION
The advantages of using GIS tools are commonly recognized, based on its easy ‘integration’ of different type of data from different disciplines. The term ‘integration’ in ICZM can be related to many aspects: integration of different levels in a
1) Preparation: this step includes the definition of boundaries of study area; setting technical and scientific objectives; institutional arrangement, team conformation and stakeholder identification. 2) Characterization and diagnosis: inventory and description of biophysical, socioeconomic and government characteristics; trough an integral analysis and identification of critical problems. 4) Environmental zoning: definition of criteria and management units. 5) Formulation of guidelines plans: proposal of programs and management actions. As transversal tools, besides GIS and remote sensing, the methodology proposes participatory actions of community and institutions and results divulgation and socialization [2].
Fig. 1 - Study area
Use of geo-technologies includes digitalization of existed geographic data, satellite images and aerial photographs processing, standardization and normalization of alphanumeric and geographic data, field work, GPS locations, GIS implementation and thematic maps elaboration. The Remote sensing method,

89
more effort to be completed.
The main GIS request from scientists, technicians or decision makers is an inventory of areas. Table 1 describes the total area of Colombian coastal zones, emerged and submerged areas; it shows as well the percentage of advance in ICZM by UAC.
We identified along the Caribbean the following geomorphology units: dunes fields, beaches, alluvial fan, alluvial plain, coastal lagoon, swamp, mangrove swamp, salt marsh, sandbanks, sand bars, ancient beaches, hills and mountains, continental shelf, marine terraces, spurs, and escarpments. Along the Pacific coast the geomorphology is dominated by escarpments, cliffs, beaches, deltas, sandbars, alluvial valleys, swamps and mangrove swamps. Land cover units include urban and suburban areas, bare soil, grasslands, crops, aquaculture ponds, stubbles, shrub vegetation, swamps, mangrove forest, tropical rain and dry forest, forest plantation, herbaceous vegetation, water bodies, salt marshes, sedimentary and reef bottoms with coral formations, rocky coastline, beaches and beach vegetation.
Land use units are mostly agricultural, livestock, aquaculture, artisanal and industrial fisheries, transport, tourism, general services and trade, hunting, and port development.
government, integration of government and non-government agencies and institutions, spatial integration of land-based activities and marine issues, and integration of science and management. These different types of integration require large sets of data from several disciplines. A substantial amount of this data has a spatial component and GIS becomes an essential tool for supporting information analysis at the different levels. Moreover, GIS allows incorporating field data and historic information in a fast and efficient way and supports most of ICZM steps.
There are some inherent technical limitations from the application of geoinformation tools that we had to solve trough the development of the ICZM projects. Usually we had to use different types of remote sensing products according to information requirement and satellite images availability, causing dissimilarities between spatial, temporal and spectral resolutions. Governmental information availability is frequently of limited access or in an inadequate format forcing time for adapting or creating data in order to incorporate into GIS. In addition we observed difficulties to estimate areas due to the combination of multi scale and multi source information.
Currently, we have worked on nine UAC along the Colombian coastal areas. The advance on this process during 2000-2010, is shown in Figure 3; there are only two UAC where the entire ICZM process has been concluded (characterization, diagnosis, zoning and guidelines for a Management Plan). In three UAC the planning process is completed; in four UAC the characterization process has begun; and in one UAC the process has not started. If these results are express in terms of percentages of area, ICZM studies have achieved near of 22% of Colombia coastal zone, including emerged and submerged areas. Along the Caribbean and the Pacific coasts the advance is 15% and 74%, respectively. In the Caribbean the low advance can be explained by the presence of insular marine area (UAC-CI), which will require

90
Environmental zoning units have been classified in five categories: 1) Protection zones: areas indexed into the National Protection Area System or areas susceptible to be protected. These zones allow their ecologic auto regulation and
ecosystems have not been significantly distorted. Main recommended activities on protected areas are ecotourism, scientific research and educational programs. 2) Strategic ecosystems recovery zones: show high deterioration conditions,
Fig. 3 - ICZM progress in Colombia by UAC
Table 1 - Areas of ICZM progress by UAC
0 1 2 3 4
UAC-AG
UAC VNSNSM
UAC-RM
UAC-MS
UAC-D
UAC-CI
UAC-AC
UAC-RBRD
UAC-MB
UAC-LLAS
Pacific coastal zone
Caribbean coastal zone
Characterization Zoning Management PlanDiagnosis

91
activities of ICZM, INVEMAR has developed a structured information system where geographic and alphanumeric data is available for users. This system has evolved during the past 10 years since the production of printed thematic maps to the development of internet map services (www.invemar.org.co).
4. CONCLUSIONS
After these 10 years of work on ICMZ using GIS, we conclude that the characterization of coastal areas according to their biotic, physic and governance characteristics is one of most important contributions. The opportunity to offer useful information (e.g. environmental indicators, thematic cartography) to decision maker is another significant result from this process. In addition, GIS successfully supports selection, definition and criteria rate to be used on environmental zoning, facilitates and makes more dynamic the generation of environmental units making them more coherent and realistic, helping on planning and decision making development. GIS allows us processing large amount of (spatial) data in a structured and organized way, integrating different types and sources of data using location as a common identifier.
Nevertheless, there are limitations when using GIS for ICZM. Some of those limitations include availability of baseline cartography, historical data and satellite images (adequate spectral, temporal and spatial resolution) as well as the dissimilarities on temporal and spatial scale of data sources.
We consider the ICZM process in Colombia is still in progress although this national experience has taught us lessons on the application of geo-technologies. Further work will include the study of those areas without ICZM progress and more detail on submerged zones.
5. ACKNOWLEDGEMENTS
The authors wish to thanks the Marine and coastal Research Institute especially to the
low auto regulation capacity, land use conflicts and potential community agreement for recover activities. 3) Sustainable use zone, these areas have high natural resource supplies which allow rational use trough traditional productive techniques. Main recommended activities in these areas are subsistence activities for rural populations, improvement of live conditions trough activities such as transport, artisanal fishing or aquiculture. 3) Sustainable production zone: these areas are suitable for economic productive development due to their aptitude and potentialities (e.g. agriculture, livestock and forest extraction). These zones foresee higher technological level and high natural resource intervention. 4) Industrial, port and service development zone: these areas are related with infrastructure, ports and services activities or present these potentialities. These zones require efficient social, economical and environmental activities development. 5) Urban and rural development zone: urban areas and population settlements. Main activities are commercial, business and services.
Through geoinformation analysis and participatory activities were also identified environmental problems along the coastal zone. Such problems are integrated to GIS trough landscape ecology units. The main problems identified were: water contamination, coastal erosion, population settlements on risk areas, deforestation, habitat loss, land use change, inappropriate productive techniques for resource extraction, unsustainable productive and extractive activities, over exploitation of hydro biological resources and wild fauna, loss of natural landscape, deficient tourism development, unsuitable urban growth, deficient income distribution, land property concentrated in few, poor productive project investment, deficient community and institution management participation, deficient coordination between institutions and, low environmental planning, among others.
As part of the divulgation and socialization
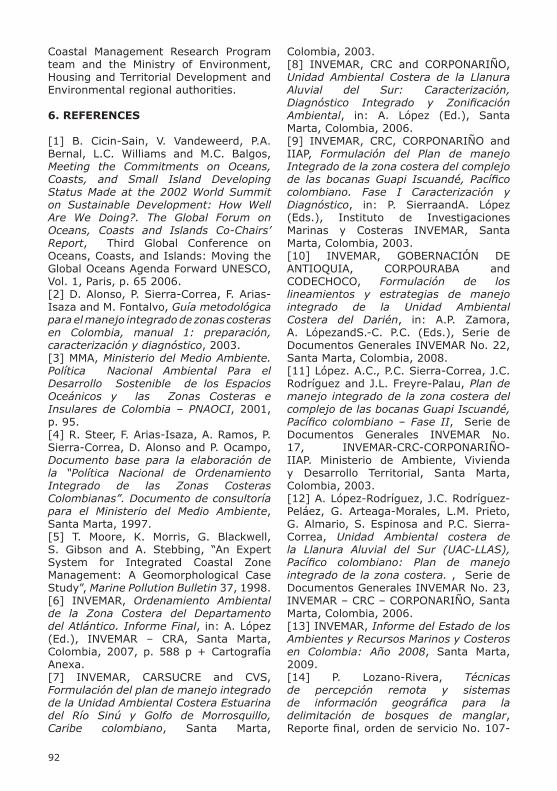
92
Colombia, 2003.[8] INVEMAR, CRC and CORPONARIÑO, Unidad Ambiental Costera de la Llanura Aluvial del Sur: Caracterización, Diagnóstico Integrado y Zonificación Ambiental, in: A. López (Ed.), Santa Marta, Colombia, 2006.[9] INVEMAR, CRC, CORPONARIÑO and IIAP, Formulación del Plan de manejo Integrado de la zona costera del complejo de las bocanas Guapi Iscuandé, Pacífico colombiano. Fase I Caracterización y Diagnóstico, in: P. SierraandA. López (Eds.), Instituto de Investigaciones Marinas y Costeras INVEMAR, Santa Marta, Colombia, 2003.[10] INVEMAR, GOBERNACIÓN DE ANTIOQUIA, CORPOURABA and CODECHOCO, Formulación de los lineamientos y estrategias de manejo integrado de la Unidad Ambiental Costera del Darién, in: A.P. Zamora, A. LópezandS.-C. P.C. (Eds.), Serie de Documentos Generales INVEMAR No. 22, Santa Marta, Colombia, 2008.[11] López. A.C., P.C. Sierra-Correa, J.C. Rodríguez and J.L. Freyre-Palau, Plan de manejo integrado de la zona costera del complejo de las bocanas Guapi Iscuandé, Pacífico colombiano – Fase II, Serie de Documentos Generales INVEMAR No. 17, INVEMAR-CRC-CORPONARIÑO-IIAP. Ministerio de Ambiente, Vivienda y Desarrollo Territorial, Santa Marta, Colombia, 2003.[12] A. López-Rodríguez, J.C. Rodríguez-Peláez, G. Arteaga-Morales, L.M. Prieto, G. Almario, S. Espinosa and P.C. Sierra-Correa, Unidad Ambiental costera de la Llanura Aluvial del Sur (UAC-LLAS), Pacífico colombiano: Plan de manejo integrado de la zona costera. , Serie de Documentos Generales INVEMAR No. 23, INVEMAR – CRC – CORPONARIÑO, Santa Marta, Colombia, 2006.[13] INVEMAR, Informe del Estado de los Ambientes y Recursos Marinos y Costeros en Colombia: Año 2008, Santa Marta, 2009.[14] P. Lozano-Rivera, Técnicas de percepción remota y sistemas de información geográfica para la delimitación de bosques de manglar, Reporte final, orden de servicio No. 107-
Coastal Management Research Program team and the Ministry of Environment, Housing and Territorial Development and Environmental regional authorities.
6. REFERENCES
[1] B. Cicin-Sain, V. Vandeweerd, P.A. Bernal, L.C. Williams and M.C. Balgos, Meeting the Commitments on Oceans, Coasts, and Small Island Developing Status Made at the 2002 World Summit on Sustainable Development: How Well Are We Doing?. The Global Forum on Oceans, Coasts and Islands Co-Chairs’ Report, Third Global Conference on Oceans, Coasts, and Islands: Moving the Global Oceans Agenda Forward UNESCO, Vol. 1, Paris, p. 65 2006.[2] D. Alonso, P. Sierra-Correa, F. Arias-Isaza and M. Fontalvo, Guía metodológica para el manejo integrado de zonas costeras en Colombia, manual 1: preparación, caracterización y diagnóstico, 2003.[3] MMA, Ministerio del Medio Ambiente. Política Nacional Ambiental Para el Desarrollo Sostenible de los Espacios Oceánicos y las Zonas Costeras e Insulares de Colombia – PNAOCI, 2001, p. 95.[4] R. Steer, F. Arias-Isaza, A. Ramos, P. Sierra-Correa, D. Alonso and P. Ocampo, Documento base para la elaboración de la “Política Nacional de Ordenamiento Integrado de las Zonas Costeras Colombianas”. Documento de consultoría para el Ministerio del Medio Ambiente, Santa Marta, 1997.[5] T. Moore, K. Morris, G. Blackwell, S. Gibson and A. Stebbing, “An Expert System for Integrated Coastal Zone Management: A Geomorphological Case Study”, Marine Pollution Bulletin 37, 1998.[6] INVEMAR, Ordenamiento Ambiental de la Zona Costera del Departamento del Atlántico. Informe Final, in: A. López (Ed.), INVEMAR – CRA, Santa Marta, Colombia, 2007, p. 588 p + Cartografía Anexa.[7] INVEMAR, CARSUCRE and CVS, Formulación del plan de manejo integrado de la Unidad Ambiental Costera Estuarina del Río Sinú y Golfo de Morrosquillo, Caribe colombiano, Santa Marta,

93
07, INVEMAR, Santa Marta, 2007.[15] A. Etter, Introducción a la Ecología del Paisaje: un marco de integración para los levantamientos rurales, Santa Fé de Bogotá, 1990.

94
ABSTRACT
Ocean governance issues had developed disconnected approaches, the actual interest about resolving the depletion of the environmental system and implications at global development scales leads us to seek new forms to improve ocean sustainability. Apply “sustainability perspectives” at the ocean governance, is a crucial challenge, to design and develop a sound ocean governance model. This paper describes the initial stage for Azores ocean governance system, through general marine issues and presents developing and existent institutional and legal structures. The initial goal of these structures will be identifying strategic priorities for making adequate sustainable and integrated policies for marine Azorean development.
Index Terms— Ocean Governance, Sustainability, Ocean issues, legal dimension, institutional dimension.
1. INTRODUCTION
Recently, human use of the ocean at global level has increased exponentially reflecting a pattern of intensification of historical activities, as well as the emergence of new uses. Following this tendency to use the ocean is the concentration and a significant population growth near the ocean, with increasing demand for food, energy and economic opportunities. The cumulative impact of these developments increases the number of conflicts between ocean uses areas and is an imminent threat to ocean ecosystems sustainability. Moreover, this intense use of the oceans and seas by all sectors, combined with climate change, powers the pressure exerted on the marine environment. Structuring ocean
governance now appears as a way to establish the foundations of institutional mechanisms, policies and programs for current approaches to this process. Problems arising from current ocean uses patterns seriously threaten the viability of the marine environment, leading different countries to reconsider the governance systems of ocean uses [1]
Actual political developments at regional and national level for integration at a holistic level the marine affairs, are in the top of the ocean global agenda. These advances seek to establish national ocean frameworks in coherence with the Law of the sea Convention (UNCLOS) dispositions. In this sense, the actual great interest is promoted in part by the UNCLOS, based in the article 76º of the LOS, that have invited all assignant countries to presented proposal for extend their marine jurisdictions (beyond the actual 200 nautical miles) and consequently its resources exploration. Other actual concerns, such as climate change and global financial crisis, showed implications at different governance levels, threatening political structures and relations. For the ocean these implications affect the strategic priorities and measures; one example could be limited financing and exploration necessities. This entire situation has implications for the role of the ocean and the way it is governed, possible threats to sustainability, and a need to raise awareness concerning approaches capable of maintaining ocean systems and where necessary restoring them [2]
2. GOVERNANCE FOR OCEAN SUSTAINABILITY
Actual ocean governance looks to the
GOVERNANCE ISSUES FOR OCEAN SUSTAINABILITY: APPROACH TO AZOREAN MARINE JURISDICTIONSL. ParamioCIBIO- Research Center in Biodiversity and Genetic ResourcesUniversity of Azores, 9500-855 Ponta Delgada, Portugal. Email: [email protected]
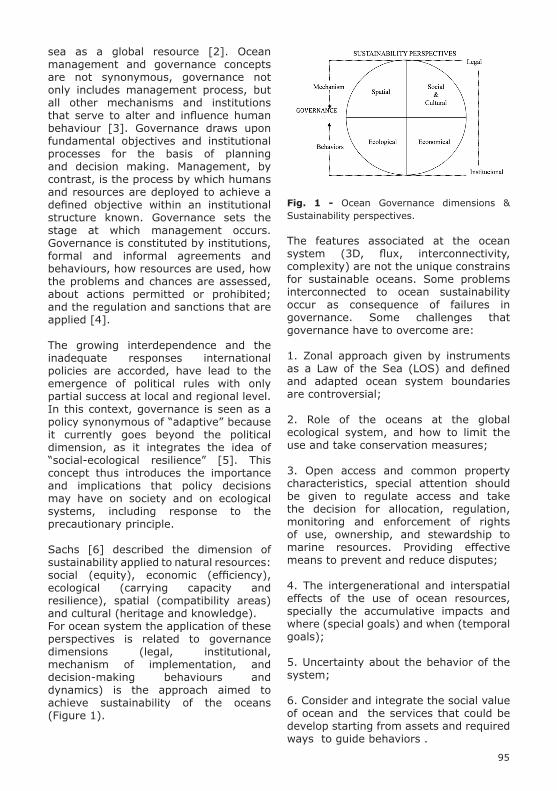
95
Fig. 1 - Ocean Governance dimensions & Sustainability perspectives.
The features associated at the ocean system (3D, flux, interconnectivity, complexity) are not the unique constrains for sustainable oceans. Some problems interconnected to ocean sustainability occur as consequence of failures in governance. Some challenges that governance have to overcome are:
1. Zonal approach given by instruments as a Law of the Sea (LOS) and defined and adapted ocean system boundaries are controversial;
2. Role of the oceans at the global ecological system, and how to limit the use and take conservation measures;
3. Open access and common property characteristics, special attention should be given to regulate access and take the decision for allocation, regulation, monitoring and enforcement of rights of use, ownership, and stewardship to marine resources. Providing effective means to prevent and reduce disputes;
4. The intergenerational and interspatial effects of the use of ocean resources, specially the accumulative impacts and where (special goals) and when (temporal goals);
5. Uncertainty about the behavior of the system;
6. Consider and integrate the social value of ocean and the services that could be develop starting from assets and required ways to guide behaviors .
sea as a global resource [2]. Ocean management and governance concepts are not synonymous, governance not only includes management process, but all other mechanisms and institutions that serve to alter and influence human behaviour [3]. Governance draws upon fundamental objectives and institutional processes for the basis of planning and decision making. Management, by contrast, is the process by which humans and resources are deployed to achieve a defined objective within an institutional structure known. Governance sets the stage at which management occurs. Governance is constituted by institutions, formal and informal agreements and behaviours, how resources are used, how the problems and chances are assessed, about actions permitted or prohibited; and the regulation and sanctions that are applied [4].
The growing interdependence and the inadequate responses international policies are accorded, have lead to the emergence of political rules with only partial success at local and regional level. In this context, governance is seen as a policy synonymous of “adaptive” because it currently goes beyond the political dimension, as it integrates the idea of “social-ecological resilience” [5]. This concept thus introduces the importance and implications that policy decisions may have on society and on ecological systems, including response to the precautionary principle.
Sachs [6] described the dimension of sustainability applied to natural resources: social (equity), economic (efficiency), ecological (carrying capacity and resilience), spatial (compatibility areas) and cultural (heritage and knowledge).For ocean system the application of these perspectives is related to governance dimensions (legal, institutional, mechanism of implementation, and decision-making behaviours and dynamics) is the approach aimed to achieve sustainability of the oceans (Figure 1).

96
international level specially, security and ocean surveillance.
As a political unity autonomous regions have some powers related to the management of marine resources and the use of ocean space, institutional arrangement is based in a autonomy framework that implies the exercise of their own legislative and executive powers, as well as administrative and financial autonomy [8] always in coherence with the rights approves by Azores statutes.
On the other hand Azores is considered in EU as an Ultraperipheral Region (UPR), which benefits from the EU and its institutions on the basis of a special effort to adapt policies and actions that have an impact on these regions according to their unique conditions. In this respect some political incentives are given with a goal to integrate at community level in sectoral policies such as fisheries are always in negotiation state.
3.2. Azorean Ocean Issues
Different sea issues are highlighted below to provide a general characterization of the Azorean sea, all are interrelated and focus only in main characteristic points:
3.2.1. Culture and heritageFrom the beginning of Azorean history, the islands served as supply bases and stopovers for ships in their long ocean voyages to the New World. This provides historic ties with influence on culture and society: for example, whaling was an important activity for the Azorean population which have a important relation with migratory flux.
3.2.2. FisheriesFisheries are an important economic activity on all islands. Fishing methods are highly traditional among Azorean fishermen,. The sizable EEZ, has access conflicts boundaries and measures to manage this area. Demersal fishing is the most important fishery at economic level, besides tuna which supports the canning industry, In this sense research
7. Consider globalization because sometimes it ignores environmental externalities. Ocean use is particularly susceptible to this problem. [7]
3. APPROACH TO AZORES SEA
3.1. Characterisation
The Azores Islands in the North Atlantic Ocean, located between 36º to 41º N and 25º to 31º W, are an archipelago composed by nine volcanic islands divided into 3 groups: eastern group (S. Miguel and Sta. Maria), central group (Graciosa, Terceira,S. Jorge, Pico and Faial) and western group ( Flores and Corvo). With a total land surface of 2325 km2 and a sea territory that represents the biggest sub-area of Portugal Economic Exclusive Zone being the largest sub-area in Europe with 953,633 km2 [9]. Azores is an autonomous region of Portugal with a fair degree of political and financial leeway. The geographical and administrative features mark the basis of governance regimes, for Azores peculiarities showing important implications in ocean governance. Some of them are:
Insular regions have an important component of isolation, this characteristics is remarked by own history, distance to the mainland, furthermore by territorial fragmentation, these peculiarities are reflected in a different temporal scale for the development and in the society dynamic.
The inherent oceanic character of island groups has an influence on governance regime, which should be clearly oriented towards the sea environment on which they depend for development. An important privilege is given by this allocation and the unique biophysical and environmental conditions being a research platform in different areas, oceanography, geology, biology. Other characteristics are implicit at this point as a geo-strategical allocation in the Atlantic, as a boundary/bridge between America and Europe, with difference political implications at the
97
In the beginning Azores marine research had been carried out by foreign scientists, studies by Azorean scientist started to increase in the early 1980s when the University of Azores was created [10]. This issue has great potential, at the moment we may consider that research in Azores seas is mainly developed in the University of Azores by Oceanography and Fisheries Department (DOP), and by other research centres at the University of Azores. Several international projects have cooperation with the Azores University and its research centres. Research needs focus not only offshore, coastal research studies have great importance too.
Azores was proposed as excellent platform to support oceanographic research in the wider Atlantic [12]. A proposal to create a centre for resources and sustainability is under consideration..
3.2.5. TransportsMaritime transport is the principal entry for goods at the islands but the maritime transportation structure is not consolidated, especially between islands. Azores is one of the desirable destinations.
3.2.6. RecreationMaritime leisure activity has seasonal characteristics, influenced by climacteric conditions, developing primarily between the months of May and October. [11]
The importance of the Azores for sailing is particularly important at Faial island. Whale watching started in 1993; since thenactivity has been continuously growing and has now become a successful industry in the Azores. The conversion of whale fisheries to whale watching tourism in the Azores has been a successful initiative, with whalers providing much aid and expertise to scientific researchers, even to the extent that former whalers are employed by many of the whale watching companies [12]. Diving is a growing activity
Research tourism is an activity in practice at Azores, some restriction are being developing at the moment specially in
projects search for measures to mitigate impacts. [10] Fisheries and its industry have important export value.
3.2.3. Marine Conservation The Azores Ecosystem is part of the Macaronesia bio-geographical region. Conservation priorities are supported by the great number of instruments that exists to manage natural resources. Oceanographic conditions from the gulf stream generate an arm nominated Azores Current which brings unique conditions as it transports water of equatorial and tropical origin into the colder northern waters, with high salinity , high temperature and low nutrient regime [11]. For marine biodiversity the marine fauna and flora has a low number of endemic species, with the majority of the Azorean coastal and marine biota being very modern and comprising species that have arrived predominantly from the eastern Atlantic, especially the area between southern Europe (Lusitanian Region) and northwest Africa (Mauretanian Region), including the Mediterranean, but also contains species from other Atlantic sources. Azores archipelago is considered as important areas for several species of marine birds, species of marine turtles occurs in Azores. In terms of marine mammals, the region is a privileged location for sighting whales and dolphins. [10]
All this natural heritage is protected by an innovative conservation instrument, the regional network of protected areas, that conveys a homogeneous status on all existing legal areas (including Natura Network) and no legal environmental figures (Ramsar and Important Bird Areas), with a management unit for each island (included territorial waters, 12 nautical miles) and one more for all. ”Azorean marine waters” (EEZ), denominated Azores Marine Park.
Other legal specific instruments exist to protect and manage coastal and marine areas and species.
3.2.4.Research

98
manganese were found at continental shelf south of the Azores. Marine biotechnology is a young sector of knowledge and therefore should be considered as part of research and development. Life around deep hydrothermal vents has a wide range of potential applications: antibiotic, catalyzes, etc [11].
4. AZORES GOVERNANCE SYSTEM
To make the approach to Azores ocean governance framework is necessary to consider it at an international, regional and national level (Table 1). At international level the development and evolution of ocean governance are sustained in:1. A first global framework based on principles of international law: the Law of the Sea (LOS); Chapter 17 of Agenda 21, Action Plan (1992) at the United Nations Conference on Environment and Development (UNCED) and Plan of Implementation adopted at World Summit on Sustainable Development (WSSD) in Johannesburg in 2002, which establishes the general principles and rules for global application.
2. A second framework comprising regulatory regimens consisting in a variety of instruments for the implementation of general rules at the global level: for example, regulatory tools that address specific sources of pollution; multilateral environmental agreements and regional levels, for example, Regional Seas Conventions.
At regional level for Atlantic and for Azores to the conventions are: Agreement on the implementation of conservation measures of offshore resources, adopted by the FAO Conference in 1993, states marine biological resources and sets international conservation and management. OSPAR Convention is one of the regional instruments that have most contributed to the preservation of Azores marine environment designating marine protected areas and elaborate measures to conservation.
We have to take in consideration
marine protected areas as hydrothermal vents and banks.
3.2.7. Maritime infrastructures and defense
Ports have core of military along of history with the capitanias that have competence of defense and management of ports and marinas. In Azores there are two principal ports, Ponta Delgada and Angra de Heroismo but there is a growing interest in the construction of ports and harbours for coastal development [11].
3.2.8 Coastal systemCoastal areas have occupation, especially in small Islands. For ocean development the role of the coastal areas has a great importance to support the activities and the governance process (distance, infrastures, etc.) Other coastal problems are associated such as erosion, and the rise of sea level.
3.2.9 Areas beyond national jurisdictionThese areas provide a challenge to governance, with limitations to control and management, both in terms of physical conditions and at legal level. The Portuguese task group for continental shelf extension presented a proposal for extension with two particular areas that correspond to hydrothermal vents, Lucky Strike and Rainbow, with a great importance in resources (mineral and biological) [11] and at this moment are being clasificated as Natura Network Sites. Actually this point is a challenge at legal level, between European directives and Law of the Sea disposition.
3.2.10..Future uses:Some potential uses could be:Allocation of wind farms needs research. Islands have a high potential of wave energy due to fairly regular waves generated by wind movement and even stronger. A tentative enterprise was developed at Pico Island but proved unsuccessful.
Prospecting is one potential sector, iron magnesia nodules, with high composition

99
(Figure 1) a clear Institutional structure need coherence with a legal dimension. Azores institutional ocean governance is framed at the National structure. At the beginning of 2010 Azores approved its own institutional schedule that would allow coordinate of affairs for an integrate governance of the Azorean sea. Some of the principal competences of the coordination group CIAMA are: support European Marine Strategy and harmonization with regional instruments, relation with national structures (see figure 2), coordination, implementation and monitoring measures at cross-policies related with maritime affairs, develop a marine spatial plan (POEMA).
European Community (EC) level. Two driving instruments exists to implement the protection and use of marine waters, Water Framework Directive, for coastal water quality and Marine Strategy Framework Directive, for the rest of EEZ of each member State. Natura Network by “Birds” and “Habitats” Directives reports protection on coastal and marine habitats for 19 Special Areas of Conservation (SAC) and 15 Special Protection Areas (SPA)
At national level, Portugal have developed sectoral rather than unified policies for coastal and ocean domains, only after 2004 and following the European recommendations were out two documents outlining strategies, the bases for the National Integrated Coastal Zone Management Strategy and the National Strategy for the Oceans.. National Programme for Territorial Planning policy (2006) is the overarching instrument to regulating the organization and utilization of national territory. Two other types of instruments at higher level are the special land-use plans, comprising among ocean domains: coastal zone management plans, protected areas, and the sectoral plans that have territorial incidence, as marine spatial plans [13].
At the regional level, Azores ocean governances system are now developing as the basis for ocean governance. Nevertheless, some sectoral instruments related to ocean domain have already been developed. These are supported by jurisdiction and spatial domains, in this way territorial planning is assured by means of regional territorial management plans; In particular coastal zone management plans (CZMP) are developed practically for the nine islands. Azores Maritime Spatial Plan (AMSP) begins now to be elaborated. These instruments, together with the Azores Regional Protected Area Network, including Azores Marine Park, will be a spatial legal framework for all Azorean Marine waters (Table 1).
In accordance with the perspective of sustainability and governance process

100
5. CONCLUSIONS
Establishing structures with a legal dimension of ocean governance are a critical first step towards sustainable development and an ecosystem approachHowever, it is necessary to define the mechanism and dynamics for such a process. Azores is now in the early phases
of designing such programmes and they must be development in a strategic way to ensure the sustainability of the sea of Azores. The unique component of the Azorean archipelago must be well understood to allow policy makers scope to give these proper emphases.
Table 1 - Legal Framework to support ocean governance structure for Azores.
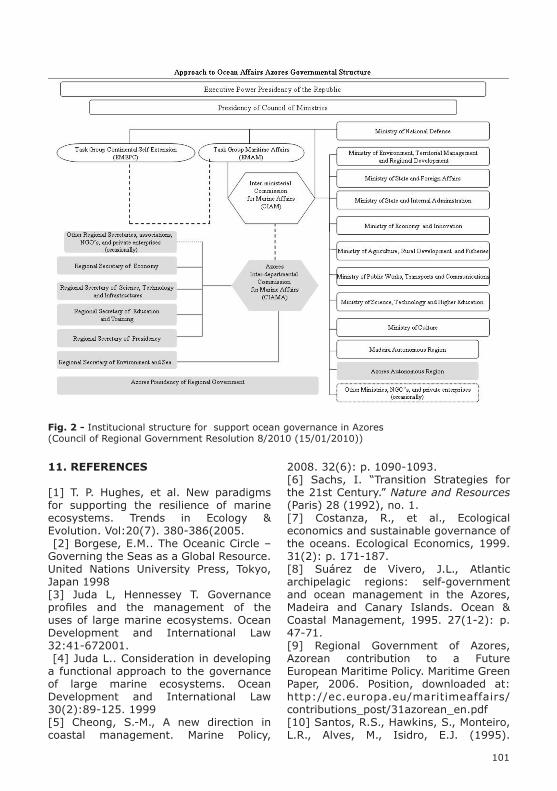
101
11. REFERENCES
[1] T. P. Hughes, et al. New paradigms for supporting the resilience of marine ecosystems. Trends in Ecology & Evolution. Vol:20(7). 380-386(2005. [2] Borgese, E.M.. The Oceanic Circle – Governing the Seas as a Global Resource. United Nations University Press, Tokyo, Japan 1998[3] Juda L, Hennessey T. Governance profiles and the management of the uses of large marine ecosystems. Ocean Development and International Law 32:41-672001. [4] Juda L.. Consideration in developing a functional approach to the governance of large marine ecosystems. Ocean Development and International Law 30(2):89-125. 1999 [5] Cheong, S.-M., A new direction in coastal management. Marine Policy,
2008. 32(6): p. 1090-1093.[6] Sachs, I. “Transition Strategies for the 21st Century.” Nature and Resources (Paris) 28 (1992), no. 1.[7] Costanza, R., et al., Ecological economics and sustainable governance of the oceans. Ecological Economics, 1999. 31(2): p. 171-187.[8] Suárez de Vivero, J.L., Atlantic archipelagic regions: self-government and ocean management in the Azores, Madeira and Canary Islands. Ocean & Coastal Management, 1995. 27(1-2): p. 47-71. [9] Regional Government of Azores, Azorean contribution to a Future European Maritime Policy. Maritime Green Paper, 2006. Position, downloaded at: http://ec.europa.eu/maritimeaffairs/contributions_post/31azorean_en.pdf[10] Santos, R.S., Hawkins, S., Monteiro, L.R., Alves, M., Isidro, E.J. (1995).
Fig. 2 - Institucional structure for support ocean governance in Azores(Council of Regional Government Resolution 8/2010 (15/01/2010))
102
Marine research and conservation in the Azores. Aquatic Conservation: Marine and Freshwater Ecosystems, vol. 5, pp. 311-354.[11] SaeR/ACL,2009. O Hypercluster da Economia do Mar. Um domínio de potencial estratégico para o desenvolvimento da economia portuguesa[12] O’Connor, S., Campbell, R., Cortez, H., & Knowles, T., 2009, Whale Watching Worldwide: tourism numbers, expenditures and expanding economic benefits, a special report from the International Fund for Animal Welfare, Yarmouth MA, USA, prepared by Economists at Large. Downloaded: http://www.ifaw.org/Publications/Program_Publications/Whales/asset_upload_file639_55365.pdf [13] Carneiro, G., The parallel evolution of ocean and coastal management policies in Portugal. Marine Policy, 2007. 31(4): p. 421-433.

103
ABSTRACT
GIS technologies have many roles in marine resources management. This paper discusses their role in the delineation of closure areas for spatial management of resource extraction, providing examples of different types of closures with various objectives in a variety of locations. The benefit of being able to calculate the exact size of closed areas in order to further the case for closure and measure progress towards management goals is noted. The role of GIS in communicating management measures to the public is also highlighted, focusing on the timely creation of readily understandable maps that can be distributed electronically and the production of data that can be combined with navigational instruments. These improvements in communications also promote adaptive management and assist enforcement.
Index Terms - Marine resources management, spatial management, time / area closures, GIS, Bermuda
1. INTRODUCTION
Geographic Information Systems (GIS) technologies have many roles in marine resources management. They provide a powerful tool for storing, manipulating, analysing and comparing spatial data to enable the assessment and monitoring of marine resources, as well as patterns of resource use. For resource managers, an important output application of GIS is in the spatial management of extractive activities.
Closing off certain areas to extractive activities, whether it be fully or partially,
permanently or on a temporary basis, has long been an important tool in both terrestrial and marine resource management. In the marine context, the practice goes back millennia, with the customary tenure systems of Pacific island communities often involving areas that were closed to fishing [1]. Closing areas of the sea as a technical measure to control fishing has a relatively long history in the west as well [2], and Bermuda’s first Fisheries Act in 1912 included provisions for closing specified areas to fishing [3].
Spatial closures can be utilized to address a variety of fisheries management objectives, but their effectiveness depends on the life history of the stock as well as regulations in place outside of the closure area. For relatively sedentary stocks, closing an area to harvest activities creates a refuge that protects a portion of the biomass, as a kind of insurance in case other management measures fail [4, 5, 6]. However, it is generally recognized that closing areas to fishing may simply lead to the redistribution of effort without reducing fishing mortality, and that, if harvest reduction is required, the use of closures should be one tool in a suite of management measures that control catch and effort [2, 4, 5, 6, 7].
The theoretical benefits of harvest refugia, also known as fishery reserves, go beyond the protection of individuals, as the population inside the closed areas may then supplement the stock outside via the supply of recruits or through the migration of adults (spillover) once densities reach certain levels [6, 8]. However, the evidence supporting these benefits is somewhat equivocal, with positive results dependent on life history
GIS APPLICATIONS IN MARINE RESOURCES MANAGEMENT: EXAMPLES OF SPATIAL MANAGEMENT MEASURES FROM BERMUDAJ.M. Pitt1 & M.L. Shailer2
1Department of Environmental Protection, P.O. Box CR52, Crawl CRBX, Bermuda2Department of Conservation Services, P.O. Box FL588, Flatts FLBX, Bermuda.E-mail: [email protected].
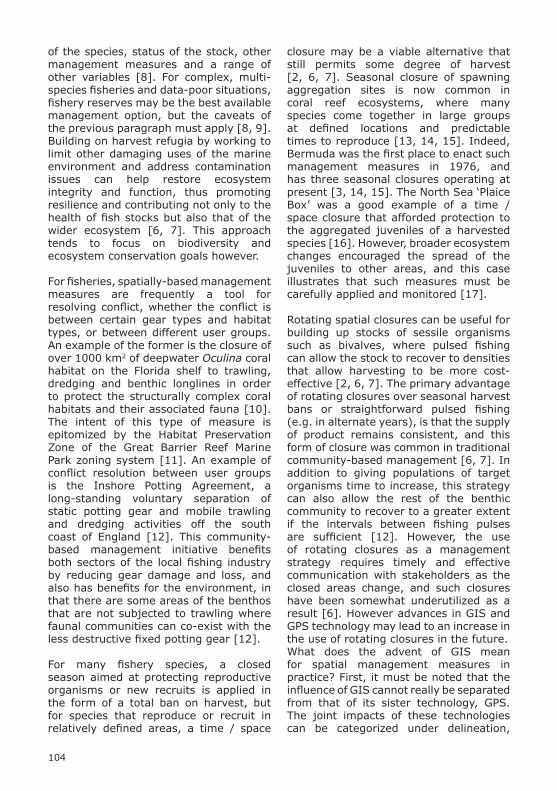
104
closure may be a viable alternative that still permits some degree of harvest [2, 6, 7]. Seasonal closure of spawning aggregation sites is now common in coral reef ecosystems, where many species come together in large groups at defined locations and predictable times to reproduce [13, 14, 15]. Indeed, Bermuda was the first place to enact such management measures in 1976, and has three seasonal closures operating at present [3, 14, 15]. The North Sea ‘Plaice Box’ was a good example of a time / space closure that afforded protection to the aggregated juveniles of a harvested species [16]. However, broader ecosystem changes encouraged the spread of the juveniles to other areas, and this case illustrates that such measures must be carefully applied and monitored [17]. Rotating spatial closures can be useful for building up stocks of sessile organisms such as bivalves, where pulsed fishing can allow the stock to recover to densities that allow harvesting to be more cost-effective [2, 6, 7]. The primary advantage of rotating closures over seasonal harvest bans or straightforward pulsed fishing (e.g. in alternate years), is that the supply of product remains consistent, and this form of closure was common in traditional community-based management [6, 7]. In addition to giving populations of target organisms time to increase, this strategy can also allow the rest of the benthic community to recover to a greater extent if the intervals between fishing pulses are sufficient [12]. However, the use of rotating closures as a management strategy requires timely and effective communication with stakeholders as the closed areas change, and such closures have been somewhat underutilized as a result [6]. However advances in GIS and GPS technology may lead to an increase in the use of rotating closures in the future.What does the advent of GIS mean for spatial management measures in practice? First, it must be noted that the influence of GIS cannot really be separated from that of its sister technology, GPS. The joint impacts of these technologies can be categorized under delineation,
of the species, status of the stock, other management measures and a range of other variables [8]. For complex, multi-species fisheries and data-poor situations, fishery reserves may be the best available management option, but the caveats of the previous paragraph must apply [8, 9].Building on harvest refugia by working to limit other damaging uses of the marine environment and address contamination issues can help restore ecosystem integrity and function, thus promoting resilience and contributing not only to the health of fish stocks but also that of the wider ecosystem [6, 7]. This approach tends to focus on biodiversity and ecosystem conservation goals however. For fisheries, spatially-based management measures are frequently a tool for resolving conflict, whether the conflict is between certain gear types and habitat types, or between different user groups. An example of the former is the closure of over 1000 km2 of deepwater Oculina coral habitat on the Florida shelf to trawling, dredging and benthic longlines in order to protect the structurally complex coral habitats and their associated fauna [10]. The intent of this type of measure is epitomized by the Habitat Preservation Zone of the Great Barrier Reef Marine Park zoning system [11]. An example of conflict resolution between user groups is the Inshore Potting Agreement, a long-standing voluntary separation of static potting gear and mobile trawling and dredging activities off the south coast of England [12]. This community-based management initiative benefits both sectors of the local fishing industry by reducing gear damage and loss, and also has benefits for the environment, in that there are some areas of the benthos that are not subjected to trawling where faunal communities can co-exist with the less destructive fixed potting gear [12].
For many fishery species, a closed season aimed at protecting reproductive organisms or new recruits is applied in the form of a total ban on harvest, but for species that reproduce or recruit in relatively defined areas, a time / space

105
compliance, and GIS facilitates this in several ways, from paper maps to web-based maps and downloadable data layers. Using a variety of proprietary and open source software, GIS data layers can be converted into formats for use with Google Earth and many commonly used GPS chartplotters. Provided the converted data adheres to appropriate standards of accuracy, incorporation of closure boundaries into onboard GPS devices can also aid enforcement. In highly developed fisheries utilizing vessel monitoring systems (VMS), GIS can also be used to analyse VMS data for compliance with closed areas [18].
2. DESCRIPTION OF CASE STUDY LOCATION
Bermuda is a small pseudo-atoll island chain located in the western north Atlantic at 32° 20’ N and 64° 45’ W. It is the location of the northern-most coral reefs in the Atlantic Ocean. For the purposes of managing marine resources, Bermuda waters are divided into the shallow platform which tops the ancient volcano that created the island, and offshore waters. The official delineation between these areas is considered to be the break at the 200 m depth contour, at which point the sides of the volcanic pedestal slope steeply to depths of 1000 m and greater over a lateral distance of 2 - 5 km. The area of the shallow platform is 991 km2, and this compares to a total land area of 53.7 km2 (Figure 1). These proportions illustrate the importance of the marine environment and its associated resources to the Bermudian people.
An interesting feature of the Bermuda platform is the series of algal-vermetid cup reefs, or ‘breakers’, that ring the platform in the vicinity of the 10 m depth contour [19]. These reefs frequently break the surface, forming a visible natural delineation between the shallower and deeper areas of the platform (Figure 1). Of the total platform area, 545.6 km2 is shallower than 10 m, while 445.4 km2 is at depths of 10 – 200 m (Figure 1).
communication and enforcement.
In Bermuda, at least, boundaries of closed areas were traditionally based on distances that had to be estimated visually, compass bearings and lines of sight from landmarks, depth contours that required continuous monitoring of a depth sounder for compliance, and intervals of latitude and longitude as marked on Admiralty Charts. These limited options often resulted in closures that were larger than strictly necessary, with ambiguous boundaries which were awkward to enforce. However, while GIS can be used to delineate complex boundaries based on conceptual definitions, closure areas should be easy to recognize and enforce, and the use of visible features to help define boundaries is desirable. Unfortunately, in the absence of man-made markers, distinguishing features of the marine environment are usually under water and often not visible to those on the surface. Remote sensing products such as aerial photos and satellite imagery can be used in a GIS to digitize these features and put closure areas in a spatial context that users can understand and recognise while on the water.
Another advantage of GIS technology is the ability to calculate the exact extent of closure areas, and express these areas as a percentage of the total area available. Such figures can be used to further the case for closure or evaluate progress towards habitat protection goals.
Informed consultation on proposed management measures, and compliance with existing ones, are both difficult to achieve when the system is too complex for stakeholders to understand [18]. Perhaps the most important role of GIS in marine resources management is in the creation of maps to clearly explain existing, changing and newly proposed regulated areas to members of the public, along with their underlying rationale [18]. Using layers, options for the location and dimensions of proposed closures can be readily compared and evaluated.Sharing quality mapping data improves

106
popular activity. The legislation protects plants and animals that are attached to the seabed from harvest or damage. The total area encompassed under this designation is 131 km2, or 13 % of the Bermuda platform. These areas are now largely redundant since the protection of all hard and soft coral species from harvest under a Protected Species Order. They are, however, a classic illustration of the traditional methods for delineating closed areas based on latitude and longitude lines on the Admiralty Chart (the North Shore Preserve) and lines of sight from terrestrial landmarks (the South Shore Preserve) (Figure 2).
Fig. 2 - The north and south shore coral reef preserves (hatched areas) and Protected dive sites (circles). Note the concentration of the protected dive sites in the vicinity of the ‘breaker’ line.
4.2. Protected dive sites
Beginning in the late 1980s and culminating in 2000, a series of 29 popular dive sites were closed to all fishing and collecting activity. Two factors influenced these closures. First, there was a need to install permanent moorings at the most popular sites in order to reduce the amount of damage being done to the coral reef by the anchors of the various dive and tour boats that used these sites. Second, it was felt that some separation of marine tourism and fishing activities was warranted, and that unless the areas around the moorings were closed to harvesting, then fishing boats would use them as well.
Fig. 1 - The Bermuda Platform, delimited by the 200 m depth contour and showing the 10 m depth contour to illustrate the approximate distribution of the ‘breaker’ reefs.
3. SOFTWARE AND METHODS
All Bermuda’s current marine closure areas have now been digitized using ESRI’s ArcGIS Desktop software (version 9.3.1). Based on boundary descriptions from the relevant legislation, or direct communication with staff of the Marine Resources Section, polygon shapefiles of each area were digitized using standard GIS techniques, and are stored and managed within the Department of Conservation Services’ file-based spatial information infrastructure. When a boundary description included reference to an existing feature, such as a shipping channel or depth contour, a scanned and georeferenced version of the U.K. Hydrographic Office’s Admiralty Chart number 334 was used as the reference layer. The GIS database also includes a georeferenced aerial photograph from 2004 for reference.
4. EXAMPLES
4.1. Coral Preserves
Designated in 1966 under the Coral Reef Preserves Act, the two coral reef preserves (hatched areas in Figure 2) are the oldest regulated marine areas currently in force. Their goal was to protect corals and the structural integrity of important areas of coral reef habitat when the advent of SCUBA diving made collection of corals a

107
irregularity of this zone, and noting that the total area encompassed under this management measure is 244 km2, or 25 % of the Bermuda platform, reinforces the extent of the area. This also provides a counter argument for those who would like to see greater restrictions. In addition, having the GIS layer available to distribute to users makes it possible for them to compare the GPS co-ordinates of their fishing locations with those of the management zone in order to confirm that their activities are not infringing on the zone.
Fig. 3 - The 1 nm / 1.85 km spearfishing exclusion zone around the islands.
4.4. Management of the Spiny Lobster Harvest
The spiny lobster fishery has both commercial and recreational components. As such, the management of harvesting activities needs to focus not only on the target organisms but also needs to include some spatial separation of conflicting user groups. Both types of harvest require a licence from the Department of Environmental Protection, and minor changes to management measures can be instituted through changes in the Terms and Conditions associated with these licences. This approach allows a more timely response to any changes noticed in the stock, and facilitates adaptive management. This approach would not be feasible, however, without the availability of GIS to create and distribute revised maps.
Since the moorings were the starting point for this initiative, they were also used as the basis for the closure areas. Depending on the location and primary uses of the different sites, closures were designated based on a radius of between 100 m and 1 km. Most sites have a radius of 300 m, five sites have a radius of 500 m or 600m, and there is a single site with a 1 km radius of protection (Figure 2). For the purposes of developing maps for public distribution, polygon layers of these protected areas were generated with an ArcDesktop buffer analysis using the designated radius for each site. The GPS co-ordinates of the buoy at each dive site were used as the input point for the buffers.
The total area encompassed under this management measure is 13.7 km2, or just 1.4 % of the Bermuda platform. That the percentage of the platform under full permanent protection is so small, and that most of this area falls within a single habitat zone (Figure 2), are primary motivating factors for developing comprehensive marine spatial planning.
4.3. Management of Spearfishing
The nearshore zone in which spearfishing is prohibited is a longstanding management measure which removes spearfishers from swimming areas in order to reduce the likelihood of injuries to swimmers. As with many measures that separate conflicting user groups, there is also an environmental benefit in that the fish species particularly targeted by this method enjoy at least a partial harvest refuge in this area. However, although banning spearfishing within 1 nautical mile (1.85 km) of the island is theoretically simple, the complex coastline results in this measure being less clear cut that it might at first seem.The spearfishing exclusion zone was generated in ArcGIS using a 1 nautical mile (1.85 km) buffer analysis of the existing Bermuda islands shoreline shapefile, available from the Ministry of Works and Engineering. The visual representation helps spearfishers appreciate the

108
% plus 18 % of the shallow platform area inside the 10 m depth contour.
4.5. Evolution of seasonal spawning aggregation closures off the east end
Seasonally protected area closures were established in the 1970s to protect spawning aggregations of Red hinds, Epinephelus guttatus [15]. Initially these areas were cones based on lines-of-sight and compass bearings (hatched areas in Figure 5) but this system unnecessarily restricted activities in areas close to shore when the important spawning activity needing protection was taking place close to the edge of the platform. Use of the 200 m depth contour as the outer limit of the closures still permitted trolling along the platform edge, however. The two areas off the east end of the island were redesigned in 2005, following the 2004 discovery of a Black grouper, Mycterperca bonaci, spawning aggregation in the area between the two original cones.The 200 m depth contour remains as the outer limit, but the amalgamated site is now a band whose inner margin is a straight line approximately 2 km in from the platform edge, with the northern and southern boundaries simply delimited by sets of co-ordinates (solid area to the right in Figure 5). The area now covered by the Northeastern Seasonally Protected Area is 36.9 km2, all of which lies between 20 m and 200 m. This compares to a total of 58.2 km2 covered by the former northeast and southeast areas. Evolving from the cone system to the more technical offshore band opens up a lot of nearshore space where fishing may now take place. While not having a visible feature to set the boundaries against could make enforcement more complicated, with almost every vessel equipped with GPS technology, users can easily determine where they are in relation to this closure area, so this was considered a reasonable approach.
The southwestern seasonal closure area has been left as a line-of-sight cone covering 112.5 km2. Of this, 21.2 km2 lie within the shallow area inside the
Fig. 4 - Inshore areas where lobster harvest is not permitted at all (light grey), and the additional reservoir area where commercial lobster fishing is not permitted (dark grey).
Spiny lobsters undertake significant migrations across the Bermuda platform, but are known to settle in inshore waters [20]. Accordingly, the lobster fishing exclusion area, where no harvest is permitted, follows the entire inshore line of the islands and extends northward to the South Channel (light grey area, Figure 4).
Recreational harvesters noose lobsters while free-diving, so this activity is limited to relatively shallow waters, and the commercial lobster harvest is reported based on offshore versus inshore areas, delineated by the ‘breaker’ line at the 10 m depth contour. The Lobster Reservoir, where commercial lobster trap fishing is not permitted but recreational harvest may take place, was digitized according to the specifications of the Senior Marine Resources Officer, using the U.K. Hydrographic Office Admiralty Chart number 334 as a reference. It is directly adjacent to the northern boundary of the lobster fishing exclusion area, and follows the North Shipping Channel for much of its boundary (dark grey area, Figure 4). The eastern margin follows the boundary of the North Shore Coral Preserve (see 4.1), previously established along longitude line 64° 50’ W. Spiny lobsters therefore receive full protection from harvest in 81.7 km2 of inshore waters, and protection from commercial harvest in an additional 96.1 km2, equating to 15

109
The total area encompassed under this management measure is 1.7 km2, or 0.2 % of the Bermuda platform.
Fig. 6 - Blue striped grunt Fish Aggregation Area.
5. DISCUSSION
The designation of closed areas is an attempt to balance the wants and needs of the resource users and the mandate of managers to ensure that the resource is used wisely. The use of GIS, in conjunction with available GPS technology, improves flexibility in the delineation of closure areas, as in the case of the northeastern seasonally protected area (see 4.5), reducing unnecessary closed areas and improving stakeholder equity.
GIS also facilitates enhanced communications with stakeholders by providing a visual representation of the issues and assigning numbers to previously nebulous areas (see 4.3). This can improve stakeholder understanding and help generate support for management measures. GIS has a key role in communicating management measures to the public, because it facilitates the timely creation of readily understandable maps that can be printed or distributed electronically. This is critical for adaptive management, as illustrated by the case of the lobster fishery (see 4.2), for efficient changeover to new regulations (see 4.5), and for utilizing temporary closure measures, as for the Blue striped grunt Aggregation Area (see 4.6).
breakers, while 91.2 km2 are in waters of between 10 m and 200 m depth. GIS was used to create maps for distribution when the areas were changed in 2005. The total area presently managed through these annual seasonal closures is 149.5 km2, or 15 % of the Bermuda platform.
Fig. 5 - Current (solid) and former (hatched) Seasonally Protected Areas to the east and west of Bermuda.
4.6. Blue striped grunt Fish Aggregation Area closure
An example of a nearshore seasonal closure, the Blue striped grunt Fish Aggregation area has been closed for the months of May and June each year since 2007, and is regulated using a provision of the Fisheries Act 1972 which enables the temporary prohibition of fishing in any area demonstrated to be a fish aggregation area for up to 90 days at a time, based on published notification in the Official Gazette. This temporary measure is being used pending confirmation of the exact nature and spatial extent of what is almost certainly a spawning aggregation [21], at which time a permanent Protected Areas Order may be created under the Fisheries Act. The area extends from the shoreline and utilises existing features such as the navigation channel and a line of sight to the Bermuda Radio tower. This closure area was digitized in accordance to the boundary descriptions published in the official gazette, using the Admiralty Chart number 334 as a reference layer for the location of the shipping channel and the land based reference points.

110
Herpetologists Special Publication No. 4, Allen Press, Kansas, U.S.A., 1999.[4] Sumaila, U.R., S. Guenette, J. Alder, D. Pollard and R. Chuenpagdee, Marine protected areas and managing fished ecosystems, Chr. Michelsen Institute for Development Studies and Human Rights, Bergen, Norway, 1999.[5] S.N. Murray, R.F. Ambrose, J.A. Bohnsack, L.W. Botsford, M.H. Carr, G.E. Davis, P.K. Dayton, D. Gotshall, D.R. Gunderson, M.A. Hixon, J. Lubchenco, M. Mangel, A. MacCall, D.A. McArdle, J.C. Ogden, J. Roughgarden, R.M. Starr and M.J. Tegner, “No-take Reserve Networks: Sustaining Fishery Populations and Marine Ecosystems”, Fisheries, vol. 24, pp. 11-25, 1999.[6] Jennings, S., M.J. Kaiser, and J.D. Reynolds, Marine Fisheries Ecology, Blackwell Science, Oxford, U.K., 2001.[7] King, M., Fisheries Biology Assessment and Management, Second Edition, Blackwell Publishing, Victoria, Australia, 2007.[8] Russ, G.R., “Yet another review of marine reserves as reef fishery management tools”, Chapter 19 / pp. 421- 443 in P.F. Sale (editor), Coral Reef Fishes, Elsevier, California, U.S.A., 2002.[9] C.M. Roberts, and N.V.C. Polunin, “Marine Reserves: Simple Solutions to Managing Complex Fisheries?” Ambio, vol. 22, no. 6, pp. 363-368, 1993.[10] J.K. Reed, “Deep-water Oculina coral reefs of Florida: biology, impacts, and management, Hyrdobiologia, vol. 471, no. 1-3, pp. 43-55, 2002.[11] J.C. Day, “Zoning: lessons from the Great Barrier Reef Marine Park”, Ocean & Coastal Management, vol. 45 pp. 139–15, 2002.[12] R.E. Blyth, M. J. Kaiser, G. Edwards-Jones and P.J.B. Hart, “Implications of a zoned fishery management system formarine benthic communities”, Journal of Applied Ecology, vol. 41, pp. 951–961, 2004.[13] Y. Sadovy de Mitcheson, A. Cornish, M. Domeier, P.L. Colin, M. Russell, and K.C. Lindeman, “A Global Baseline for Spawning Aggregations of Reef Fishes”, Conservation Biology, vol. 22, no. 5, pp. 1233–1244, 2008.
More efficient and effective communication in turn improves compliance. Electronic maps illustrating management changes can be made available instantly over the internet and, as Government increasingly takes its services online, electronic distribution fits in with new business processes. With up-to-date maps of management areas readily accessible, the onus is now on users to ensure that they stay informed and abide by the regulations. A recent agreement with leading GIS software provider ESRI will permit the development of a web-based GIS to share this information in an interactive manner.
Having these closure areas captured in a GIS assists enforcement by making the closure boundaries, converted into .gpx files or tracks, available for incorporation into the GPS navigation systems of both fishers and wardens (J. Edmunds, pers. comm.). This simplifies judgement as to whether or not fishers are in violation. While vessel monitoring systems (VMS) have many benefits, Bermuda is not yet in a position to implement such a measure.Lastly, the separate maps shown here illustrate the complex nature of the various spatial management measures in existence in Bermuda. The next phase will be to use GIS to incorporate the management measures discussed here into a new, integrated marine spatial management plan over the course of the next 10–15 years.
6. REFERENCES
[1] R. E. Johannes, “The Renaissance of Community-based Marine Resource Management in Oceania,” Annual Review of Ecology and Systematics, vol. 33, pp. 317-340, 2002.[2] Waugh, G., Fisheries Management: Theoretical Developments and Contemporary Applications, Westview Press, Colorado, U.S.A., 1984.[3] Smith-Vaniz, W.F., B.B. Collette and B.E. Luckhurst, Fishes of Bermuda: History, Zoogeography, Annotated Checklist, and Identification Keys, American Society of Ichthyologists and

111
7. ACKNOWLEDGEMENTS
The authors would like to acknowledge the assistance of Dr. Tammy Trott, Senior Marine Resources Officer, during the preparation of this manuscript.
[14] B.E. Luckhurst, “Evaluation of fisheries management and conservation measures taken to protect grouper spawning aggregations in the wider Caribbean: Case studies of Bermuda, Belize and Cayman Islands”, Proceedings of the Gulf and Caribbean Fisheries Institute, vol. 58, pp. 281-282, 2007.[15] B.E. Luckhurst and T.M. Trott, “Seasonally-Closed Spawning Aggregation Sites for Red Hind (Epinephelus guttatus) : Bermuda’s Experience over 30 years (1974–2004)”, Proceedings of the Gulf and Caribbean Fisheries Institute, vol. 61, pp. 331-336, 2008.[16] G. J. Piet and A. D. Rijnsdorp, “Changes in the demersal fish assemblage in the south-eastern North Sea following the establishment of a protected area (“plaice box”)”, ICES Journal of Marine Science: Journal du Conseil, vol. 55, no. 3, pp.420-429, 1998.[17] O.A. van Keeken, M. van Hoppe, R.E. Grift and A.D. Rijnsdorp, “Changes in the spatial distribution of North Sea plaice (Pleuronectes platessa) and implications for fisheries management”, Journal of Sea Research, vol. 57, no. 2-3, pp. 187-197, 2007.[18] Carocci, F., G. Bianchi, P. Eastwood, and G. Meaden, Geographic Information Systems to support the ecosystem approach to fisheries: Status, opportunities and challenges, F.A.O. Fisheries and Aquaculture Technical Paper No. 532, F.A.O. Rome, 2009.[19] A. Logan, “Holocene reefs of Bermuda”, Sedimenta, vol. XI, 63 pp., 1988.[20] B.E. Luckhurst, T. Trott, N. Simmons and S. Manuel, “Movement Patterns of Tagged Spiny Lobsters Panulirus argus on the Bermuda Reef Platofrm”, Proceedings of the Gulf and Caribbean Fisheries Institute, vol. 53, pp. 76-82, 2002.[21] T.M. Trott, J.M. Pitt and B.E. Luckhurst, “Occurrence and Management of a Spawning Aggregation of Blue striped grunt (Haemulon sciurus) in Bermuda”, Proceedings of the Gulf and Caribbean Fisheries Institute, vol. 62, in press.

112
ABSTRACT
Since 2000, water-logging had been a regular phenomenon for the hundreds of villages adjacent to the Kopotaksho River in Jessore and Satkhira district of Bangladesh. The analysis of satellite images revealed that over the years water-logging problem had increased, as in 1999, the water-logged area was about 865 hectares; in 2000, 2003, 2006 and 2008 it was about 12867, 12238, 11723 and 19467 hectares respectively. Upstream freshwater flow reduction, unplanned and unauthorized structural interventions and regular encroachment at the upstream and downstream of the Kopotaksho River were the main causes of this unwanted prolonged water-logging. Ecological and social environment has been degrading as the people of the waterlogged area have been experiencing settlement, economic, health and sanitation problem due to four to seven months prolonged water-logging. Alternative Drainage routes and Tidal River Management (TRM) technique were suggested for the long-term possible remedial measures and participatory TRM practice was identified as the best possible long-term remedial option to diminish water-logging problem at the Kopotaksho Basin Area.
Water-logging, Sedimentation, Landsat TM, Participatory, TRM
1. INTRODUCTION
Water-logging is a form of flooding within the embankments caused by hydro-geophysical factors where water
remains stagnant for long time due to increased sedimentation of Riverbeds and reduced height differential between embankment and peak water level [1]. Water-logging has been affecting about millions of people in Bangladesh during the past two decades leading to a large scale damages of crop, employment, livelihoods and national economy [2]. Water-logging is a form of flooding within the embankments caused by hydro-geophysical factors where water remains stagnant for long time due to increased sedimentation of Riverbeds and reduced height differential between embankment and peak water level [3]. Water-logging involves deterioration of drainage condition in coastal Rivers of south-western Bangladesh causing difficulties towards maintaining livelihoods [4].
River Kopotaksho is one of the main arteries of the water resources system located in the south west region of Bangladesh. It is flowing from north to south over the most matured part of the Gangetic delta. Its total length is around 200 kilometer from Tahirpur to its confluence with the Sibsa River. This River drains an area of about 1,067 square kilometer spread over nine upazilas in Jhenidah, Jessore, Satkhira and Khulna district. Numerous existing drainage channels/khals in south-west region drain out water through the Kopotaksho River.About two hundred years ago, the Mathabhanga River supplied fresh water throughout the year to the Kopotaksho River [5]. Since then, the Mathabhanga River had remained a flood spill channel, deteriorating over time. The Farakka
ASSESSMENT OF WATER-LOGGING EXTENT USING RS AND GIS TECHNIQUES AND ITS POSSIBLE REMEDIAL MEASURES AT THE KOPOTAKSHO BASIN AREA, BANGLADESH
S. Rahman1*, S. H. Rahman2 & Md. W. Ullah3
1*Junior Environmentalist, Center for Environmental and Geographic Information Services (CEGIS), House # 6, Road # 23/C, Gulshan-1, Dhaka-1212, Bangladesh. E-mail: [email protected] Professor, Department of Environmental Sciences, Jahangirnagar University, Dhaka-1342, Bangladesh.3Deputy Executive Director, Center for Environmental and Geographic Information Services (CEGIS), House # 6, Road # 23/C, Gulshan-1, Dhaka-1212, Bangladesh.
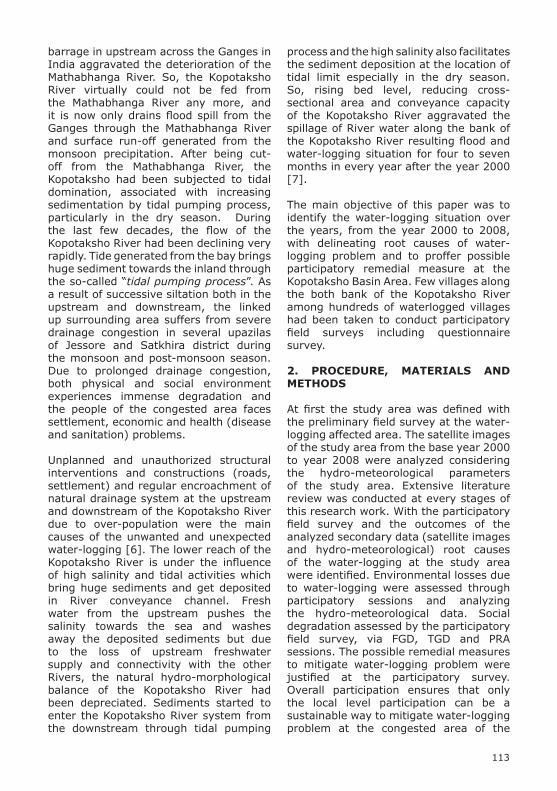
113
process and the high salinity also facilitates the sediment deposition at the location of tidal limit especially in the dry season. So, rising bed level, reducing cross-sectional area and conveyance capacity of the Kopotaksho River aggravated the spillage of River water along the bank of the Kopotaksho River resulting flood and water-logging situation for four to seven months in every year after the year 2000 [7].
The main objective of this paper was to identify the water-logging situation over the years, from the year 2000 to 2008, with delineating root causes of water-logging problem and to proffer possible participatory remedial measure at the Kopotaksho Basin Area. Few villages along the both bank of the Kopotaksho River among hundreds of waterlogged villages had been taken to conduct participatory field surveys including questionnaire survey.
2. PROCEDURE, MATERIALS AND METHODS
At first the study area was defined with the preliminary field survey at the water-logging affected area. The satellite images of the study area from the base year 2000 to year 2008 were analyzed considering the hydro-meteorological parameters of the study area. Extensive literature review was conducted at every stages of this research work. With the participatory field survey and the outcomes of the analyzed secondary data (satellite images and hydro-meteorological) root causes of the water-logging at the study area were identified. Environmental losses due to water-logging were assessed through participatory sessions and analyzing the hydro-meteorological data. Social degradation assessed by the participatory field survey, via FGD, TGD and PRA sessions. The possible remedial measures to mitigate water-logging problem were justified at the participatory survey. Overall participation ensures that only the local level participation can be a sustainable way to mitigate water-logging problem at the congested area of the
barrage in upstream across the Ganges in India aggravated the deterioration of the Mathabhanga River. So, the Kopotaksho River virtually could not be fed from the Mathabhanga River any more, and it is now only drains flood spill from the Ganges through the Mathabhanga River and surface run-off generated from the monsoon precipitation. After being cut-off from the Mathabhanga River, the Kopotaksho had been subjected to tidal domination, associated with increasing sedimentation by tidal pumping process, particularly in the dry season. During the last few decades, the flow of the Kopotaksho River had been declining very rapidly. Tide generated from the bay brings huge sediment towards the inland through the so-called “tidal pumping process”. As a result of successive siltation both in the upstream and downstream, the linked up surrounding area suffers from severe drainage congestion in several upazilas of Jessore and Satkhira district during the monsoon and post-monsoon season. Due to prolonged drainage congestion, both physical and social environment experiences immense degradation and the people of the congested area faces settlement, economic and health (disease and sanitation) problems.
Unplanned and unauthorized structural interventions and constructions (roads, settlement) and regular encroachment of natural drainage system at the upstream and downstream of the Kopotaksho River due to over-population were the main causes of the unwanted and unexpected water-logging [6]. The lower reach of the Kopotaksho River is under the influence of high salinity and tidal activities which bring huge sediments and get deposited in River conveyance channel. Fresh water from the upstream pushes the salinity towards the sea and washes away the deposited sediments but due to the loss of upstream freshwater supply and connectivity with the other Rivers, the natural hydro-morphological balance of the Kopotaksho River had been depreciated. Sediments started to enter the Kopotaksho River system from the downstream through tidal pumping

114
pattern of the waterlogged area and athwart dispersal of water over the years using digital image processing software, ERDAS Imaging 8.6.
At first, the collected satellite images were transformed into Bangladesh Transverse Mercator (BTM) projection to conduct analysis with ease. After georeferencing with collected GPS data and projecting the images into the same projection parameters (BTM), images of different years were overlaid to extract the real situation of the water-logging condition at the Kopotaksho Basin Area from the year 2000 to 2008. The collected images were mainly classified with unsupervised classification. Then the waterlogged area from the year 2000-2008 was identified with subsequent expert discussions and experience gained from the participatory field visits. Congregated Local knowledge from the questionnaire survey and participatory sessions were incorporated to delineate the waterlogged area of the year 2008 as very coarse resolution MODIS images (MODIS: Moderate Resolution Imaging Spectro-radiometer) were analyzed to delineate waterlogged area for that year.
All the GIS layers used in this study were derived from the analysis of collected images exporting as coverage files using aforementioned digital image processing software and then transformed into shapefile (.shp) layers using GIS software, ArcGIS 9.2. Illustration of final maps and waterlogged area calculation were conducted in ArcGIS 9.2 platform.
3. RESULTS AND DISCUSSION
Human interventions such as construction of bridges narrowing down the River sections, construction of cross-dams for different purposes over the years aggravated the situation. Adams Williams (1919) in his book on the History of the Rivers in the Ganges Delta warned that any interventions considered for the tidal River system should be done cautiously [5]. According to the local people there were no water-logging problem in 1994
Kopotaksho basin (Fig. 1). Fig. 1 - Steps of the research work
Temporal Satellite images of different resolutions were used and analyzed to identify the water-logging extent over the years from the year 2000 to 2008. The following satellite images (Table 1) were analyzed to conclude the extent of water-logging over the years at the Kopotaksho Basin Area.
Table 1 - List of satellite images used in this study
Satellite Image
Resolution (m) Date Source
Landsat 7 ETM+ 30 15.11.1999 USGS
Landsat 5 TM 30 28.11.2000 CEGIS
Landsat 7 ETM+ 30 16.12.2003 USGS
Landsat TM 30 27.02.2006 SPARRSO
MODIS Image 250 15-
29.10.2008 USGS
2.1. Processing of Satellite Images
Digital image processing of satellite images (from year 2000 to 2008) was executed to visualize the overall change

115
during dry season. According to Uttaran (2008) [10], about 50 thousand water-logging affected people were taken into asylum at the adjacent shelter centers. People of the surveyed area were not prepared for such extent of water-logging in the year 2008 and about 210 villages of the Kopotaksho Basin Area were severely get affected by flood and then four to seven months prolonged water-logging (Figure 2a & 2b). According to the participatory survey, in the year 2008, the extent of the water-logging had been increased significantly comparing the year of 2003 (Table 2).
Table 2 - Comparison of water-logging problem in the year of 2003 and 2008
Damage/Loss 2003 2008
District Jessore and Satkhira
Jessore, Satkhira and Khulna
(part)
UpazilaJhikargacha, Manirampur, Keshabpur
Jhikargacha, Manirampur, Keshabpur,
Kolaroa, Tala and Paikgacha
Union* 16 55
Affected Villages* 73 426
Waterlogged Area* (km2) 126.87 223.89
Affected People* 101800 845000
[Source: * Participatory Social Survey, Uttaran]
The main problem was not only the rainfall, as in 2007, total rainfall reduced about 20% from the year 2000 and in the year 2008 it was 35% low to that of the year 2000. Before the water-logging occurred in 2008, the people of the study area had experienced a prolonged drought from the last two years which had a significant impact on agriculture sector of the Kopotaksho Basin Area. The climatic variability was quite apparent
at the Kopotaksho Basin Area but this was started from 1999. In 1999, it was in small scale (8.65 km2) but in the year 2000 waterlogged area had increased significantly (Figure 3a). The main reason of the flooding in the year 2000 was an unusual upstream water supply and heavy rainfall over the south-west region of Bangladesh. Sudden flood of the year 2000 in the south-western region of
Bangladesh had increased the intensity of water-logging at the Kopotaksho Basin Area [8]. According to the participatory survey, the cross dams built after the flood in 2000 might be liable for further deterioration of the River through siltation in the Riverbed and causing the drainage congestion. Since 2000, widespread drainage congestion turned into a regular phenomenon along the long stretch of the Kopotaksho River starting from Jessore district in the north to Satkhira district in the south. The worst victims of this prolonged water-logging problem were the people of Jhikargacha, Manirampur and Keshabpur upazilas of Jessore district and Kalaroa, Tala upazilas of Satkhira district in Bangladesh. Due to huge sedimentation at the downstream and non-availability of upstream flow in the dry season, the Kopotaksho River had been facing water-logging problem [9].
The main causes of water-logging were increase of sedimentation rate on River bed due to upstream fresh water flow reduction, increase of sedimentation process due to construction of adversely affecting bridges, sluice gates and other local constructions along and over the Kopotaksho River, decrease of tidal dominant area due to downstream polders
Fig. 2 - (a) People’s initiative, wooden overpass to cross at Saraskathi Bazaar; (b) Water-logging at the study area (Inundated Eid-Gagh at Sarsa)

116
Fig. 3 - Waterlogged area over the years from 2000 to 2008; (a) Waterlogged area in 1999 and 2000; (b) Water-logging extent in 2003; (c) Waterlogged area in 2006; (d) Waterlogged area in 2008

117
of Tala upazila and about 22 km from Patkelghata to Paikgacha (Kopilmoni) is about to be abandoned due to high sediment deposition (Figure 4). Figure 4: Temporal tidal water
distribution limit in the Kopotaksho River If this decrepit scenario of Kopotaksho River continues, within next decade, the Kopotaksho River would have been abandoned up to the Sibsa reach at its downstream. Most of the khals over the waterlogged area were used to drain into the Kopotaksho River. Khals of the waterlogged area in some locations were getting deeper than the River so natural flushing of water stopped. Fish barricades (Komar and Patta) causes silt deposition on Riverbed which stimulate water-logging. As the drainage capacity has declined over the years, the floodwater could not drain out properly and water-logging occurs every year (Figure 5).
According to the social survey, from the year 2005 to 2008, rapid mount of Kopotaksho River bed level had been observed at the Surighat of Keshabpur to Kopilmoni of Paikgacha, 25 km of the Kopotaksho course-way. Formation of sediment humps at the middle reach (44 to 130 km) of Kopotaksho River impede tidal penetration and now tidal influence couldn’t reach up to the upstream as before (Figure 4), and at downstream, Riverbank erosion and tidal water dispersion at local report divulged about 189 villages (92 locations of 134 km River course-way) were affected by water-logging in the year of 2008. In 2008, about 200.00 km2 land of 41 unions, 75,000 households and 0.4 million people were severely affected by water-logging in Jessore and Satkhira district [10].
from the last few years and asymmetrical behavior of climatic variables (rainfall, temperature) indicated a sign of changing climatic pattern of the study area.
3.1. Comparison of water-logging extent at the Kopotaksho Basin Area from 2000 to 2008
Before the year 2000, water-logging was not a concern for the Kopotaksho Basin Area. Analyzing satellite images, in 1999, it was found that about 8.65 km2 of land inundated at a limited scale, which rose up to 128.67 km2 in 2000 (Figure 3a). Due to the continuous sedimentation and improper human interventions aggravated the bed level inclination of the Kopotaksho River. The water-logging situation in 2003 (122.38 km2) was as resembling as the year 2000 (128.67 km2) with some extent of Keshabpur upazila area was inundated in 2003 (Figure 3b).
After the flood 2000 and over the last seven-eight years water-logging has been emerged as a serious problem even in the dry season. The extracted information from the Landsat TM image for the year 2006 revealed that as it was about 117.23 km2 (Figure 3c). But the water-logging condition of year 2008 was quite unusual compared to the year 2000, 2003 and 2006 (Figure 3d). The affected area due to water-logging was about 194.67 km2 and was identified using coarse resolution image (MODIS image) and participatory social survey (Table 3).
Table 3 - Extent of inundation over the years (1999-2008) at the Kopotaksho Basin Area derived by analysis of satellite images
Water-logging Extent
Year
1999 2000 2003 2006 2008*
Waterlogged area
(in km2)8.65 128.67 122.38 117.23 194.67
[* Participatory Survey]
About 50 km of Kopotaksho River had already been dilapidated from the Jhapa of Manirampur upazila to Patkelghata
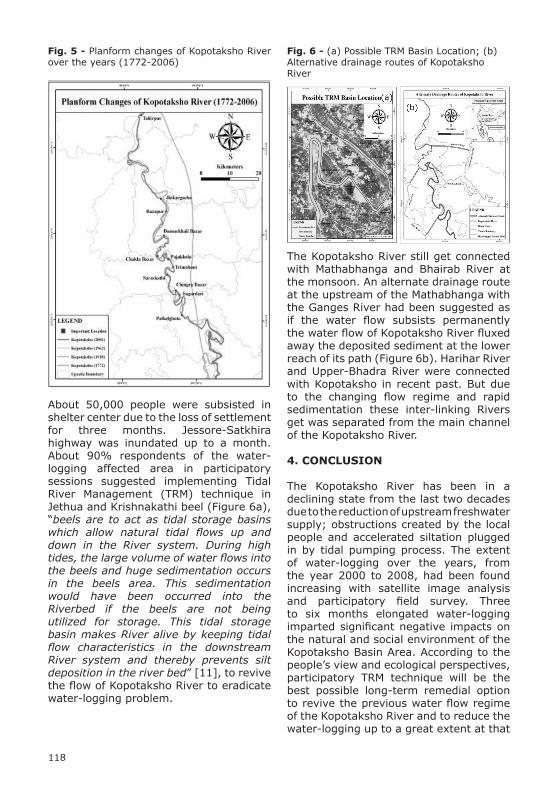
118
The Kopotaksho River still get connected with Mathabhanga and Bhairab River at the monsoon. An alternate drainage route at the upstream of the Mathabhanga with the Ganges River had been suggested as if the water flow subsists permanently the water flow of Kopotaksho River fluxed away the deposited sediment at the lower reach of its path (Figure 6b). Harihar River and Upper-Bhadra River were connected with Kopotaksho in recent past. But due to the changing flow regime and rapid sedimentation these inter-linking Rivers get was separated from the main channel of the Kopotaksho River.
4. CONCLUSION
The Kopotaksho River has been in a declining state from the last two decades due to the reduction of upstream freshwater supply; obstructions created by the local people and accelerated siltation plugged in by tidal pumping process. The extent of water-logging over the years, from the year 2000 to 2008, had been found increasing with satellite image analysis and participatory field survey. Three to six months elongated water-logging imparted significant negative impacts on the natural and social environment of the Kopotaksho Basin Area. According to the people’s view and ecological perspectives, participatory TRM technique will be the best possible long-term remedial option to revive the previous water flow regime of the Kopotaksho River and to reduce the water-logging up to a great extent at that
Fig. 5 - Planform changes of Kopotaksho River over the years (1772-2006)
About 50,000 people were subsisted in shelter center due to the loss of settlement for three months. Jessore-Satkhira highway was inundated up to a month. About 90% respondents of the water-logging affected area in participatory sessions suggested implementing Tidal River Management (TRM) technique in Jethua and Krishnakathi beel (Figure 6a), “beels are to act as tidal storage basins which allow natural tidal flows up and down in the River system. During high tides, the large volume of water flows into the beels and huge sedimentation occurs in the beels area. This sedimentation would have been occurred into the Riverbed if the beels are not being utilized for storage. This tidal storage basin makes River alive by keeping tidal flow characteristics in the downstream River system and thereby prevents silt deposition in the river bed” [11], to revive the flow of Kopotaksho River to eradicate water-logging problem.
Fig. 6 - (a) Possible TRM Basin Location; (b) Alternative drainage routes of Kopotaksho River

119
Baseline of Re-excavation of Kopotaksho River Project, Center for Environmental and Geographic Information Services (CEGIS), Bangladesh Water Development Board (BWDB), Dhaka, June, 2004.[8] SWMC, Late Monsoon Flood in the South West Region of Bangladesh, Flood Report, November, Bangladesh Water Development Board, Ministry of Water Resources, Dhaka, 2000.[9] Kranti, Feasibility Study of Re-Excavation of Kopotaksho River, Final Report, Bangladesh Water Development Board (BWDB), Desh-Upadesh Limited, 2000.[10] Uttaran, Water logging in the South West Coastal Region of Bangladesh, Water Logging in News Media, Khulna, 2008.[11] Ullah, W. M. and Rahman, R., Tidal River Management: A Sustainable Solution to Drainage Congestion in the Coastal Region, Bangladesh Environment, 2002, pp. 1022-32, 2002.
Kopotaksho Basin Area, some people also had suggested River dredging in specific locations with khal excavation, inter-linking with adjacent Rivers and establish re-connectivity with the Mathabhanga River, etc.
ACKNOWLEDGEMENTS
Authors are thankful to Mr. A.Z.Md. Zahedul Islam, Principal Scientific Officer, SPARRSO, Mr. Golam Rahman, Principal Scientific Officer, SPARRSO and Mr. Md. Fazlul Haque, Principal Scientific Officer, SPARRSO, for their generous supports.
REFERENCES
[1] Islam, S., Fakir, H.A., Ahmed, F.H. and Shawpan, S.S.A., 2004. Bangladesh Dakkhin Paschim Upokul Anchaler Jolaboddhota O Koroniyo ( in Benglali), Uttaran, Satkhira, p65-72.[2] Mirza, M.M.Q., Ahmad, Q.K. and Ahmed, A.U., Adaptation Options for Managing Water Related Extreme Events under Climate Change Regime: Bangladesh Perspectives, Climate Change and Water Resources in South Asia, Balkema Press, Leiden, pp. 255-278, 2005.[3] Islam, S., Fakir, H.A., Ahmed, F.H. and Shawpan, S.S.A., Bangladesh Dakkhin Paschim Upokul Anchaler Jolaboddhota O Koroniyo (in Bangla), Uttaran, Satkhira, pp. 65-72, 2004.[4] Rahman, A., Beel Dakatia: The Environmental Consequences of a Development Disaster, University Press Limited, Dhaka, 1995.[5] Williams, C.A., History of the Rivers in the Gangetic Delta (1750-1918). Netherlands Engineering Consultants (NEDECO), Calcutta, Bengal Secretariat Press, pp. 40-43, 1919.[6] Rahman, S., Rahman, S.H. and Ullah, W. M., Assessment of Environmental Degradation due to Water-logging and its Possible Remedial Measures at Kopotaksho Basin Area (Unpublished M.S. Dissertation), Department of Environmental Sciences, Jahangirnagar University, Dhaka-1342, 2009.[7] CEGIS, Environmental and Social

120
ABSTRACT
The Important Bird Areas (IBA) programme of BirdLife International seeks to identify, document and conserve sites that are key for the long-term viability of bird populations. BirdLife International has successfully implemented a network of terrestrial IBAs and has obtained general recognition that these sites represent prime sites for bird conservation. This European network of IBAs has formed an important scientific reference for the designation of Special Protection Areas (SPAs) under the Wild Birds Directive of the European Union. The identification of marine Important Bird Areas started in the early 90’s [1] [2] but had a major boost in 2004 thanks to the approval of two major LIFE-funded Projects in Spain and Portugal [3] [4]. To assist with tackle some of these issues, and to draw together existing experience, several workshops were organised by BirdLife during the period 2004-2010 at a national and regional level to develop guidance and propose methodologies. These methodologies have been just now compiled into a single document [5]. This paper summarises the marine identification methods proposed by BirdLife International using the example of the marine IBA PTM02 (Berlengas). Index Terms - seabirds, IBAs, conservation, Berlengas
1. INTRODUCTION
Seabirds come in many shapes and sizes, from the very small storm petrels to the great albatrosses with the biggest wingspan in the bird world. Despite these differences, all seabirds depend greatly on the marine environment for food
gathering, migration and/or roosting. The world’s oceans are open and dynamic systems that pose few physical barriers to the dispersal and migration of many seabirds: seas are not separated as are the continents. Seabird conservation issues need therefore to be addressed globally, which led BirdLife International to establish a Global Seabird Conservation Programme in 1997. Understanding the at-sea movements of seabirds requires a multidisciplinary approach that combines direct and indirect data gathering methods with statistical analyses and spatial distribution prediction models. The combination of direct and indirect data, plus the development of a standard IBA identification criteria, allows scientists to identify hotspots of seabird activity, and also to draw limits (the IBA approach is site-based and therefore should only be applied to those bird species for which a site-based approach is appropriate) and apply numerical thresholds that will later define the marine IBA national networks.Portugal posses the eleventh’s largest EEZ of the world, and therefore has a very important role to play in the field of seabird conservation. In 2004, and over a 4-year period, the Sociedade Portuguesa para o Estudo das Aves (SPEA), BirdLife parntner in Portugal, coordinated a LIFE-funded Project that ended with the publication of the first Portuguese marine IBA inventory in 2008 [3].
The Berlengas archipelago is mainland’s Portugal only known seabird colony. It holds important populations of Cory’s shearwater Calonectris diomedea borealis with 800 pairs, approximately 2.400 individuals (Miguel Lecoq personal communication, unpublished data), Madeiran storm-petrel Oceanodroma
IDENTIFICATION OF MARINE IMPORTANT BIRD AREAS IN PORTUGALI. Ramírez1, J. Andrade1, A. Meirinho1, P. Geraldes1 & B. Lascelles2
1 SPEA – Sociedade Portuguesa para o Estudo das Aves, Avenida da Liberdade, nº 105, 2º Esq., 1250-140 Lisboa, Portugal. E-mail [email protected] BirdLife International – Girton, 3-4 Wellbrook Way, Cambridge CB3 0NA, United Kingdom

121
distribution of seabirds occurring at the Berlengas archipelago are shown, different data-collection methods are presented and a final IBA proposal is made.
castro and, being relatively close to mainland Portugal, represents a unique scenario for the application of the marine IBA methodology.In the present study, spatial and temporal
Cory’s shearwater was the only species fitted with tracking devices in Berlenga. Two different types of devices where used: compass-loggers and GPS-loggers (for a detailed description of each device please see [5]). Only one device was attached per bird and per trip, but the same bird can carry it more than once during a breeding season. As detailed in Table 1, a total of 168 tracks were obtained in Berlenga from 123 birds. Compass-loggers were set to record data every 5 seconds for the duration of a trip, while GPS-loggers were programmed to record a position every 10 minutes. These settings were chosen according to the devices memory or battery-life and so as to achieve the desired precision while maximising data collection. Cory’s did not show any particular abnormal behaviour while carrying the devices. Each individual was weighted before and after logger deployment to assess the body-mass and over 90% of birds returned with same or higher body-weight. These data is similar to that of [6].Some prior assumptions on the arrangement of the data: a)Data-sets were divided the into short (less than 4 days) and long (more than 5 days) foraging trips, based on the frequency
2. MATERIALS AND METHODS
2.1 Individual tracking of Calonectris diomedea borealis
of occurrence of the trip duration; b)For compass-loggers data were used the birds’ actual diving locations to perform the kernel analysis. It was possible to filter the feeding events thanks to the temperature sensor on these devices; c)For GPS-loggers (which don’t have a temperature sensor) were used positions where speed was measured as less than 10km/h (again based on the frequency of occurrence of the foraging speed distributions) to identify the areas of most interest at-sea (these included areas where birds were landing, on the water’s surface or taking off, i.e. feeding); d)A kernel analysis was preformed for each single campaign and then joined the kernel density contours into a single shapefile (p.e. at Berlengas 6 different shapefiles were produced with the 50% kernel of birds´ dives from the short trips and then intersected to produce one single shapefile); e)Rafting locations were selected by filtering both compass and GPS-logger locations (using the temperature sensor registry for the compass, and locations with an instantaneous speed of 0 km/h for the GPS-loggers) prior to returning to their breeding colonies. Again kernel analysis were conducted for each campaign and then joined into a single shapefile.
Table 1 - Summaries of Cory’s shearwater tracked with compass-loggers and GPS-loggers at Berlengas colony between 2005 and 2008.
Year No. of birds Compass-logger GPS-logger No. of tracks
2005 16 16 0 242006 43 17 23 442007 59 32 18 85
2008 5 5 0 15
Total 123 70 41 168

122
Kernels for these sites where used as follows: a)75% contour density kernel of diving positions during short trips (compass-loggers); b)50% contour density kernel of diving positions during long trips (compass-loggers; with the only exception of offshore IBAs); c)100% contour density kernel of rafting locations.
2.2 Aerial surveys
A total of 24 aerial surveys were carried during the LIFE Project, totalling 4143 km, during the 2005-2007 period [3]. These surveys were carried out in coastal areas and up to 20 nautical miles offshore, following the methodology defined by [7]. This type of survey was mainly directed towards migrating populations, as its fast execution allows vast areas to be assessed for density and specific diversity in a short space of time. Specific surveys were also carried out on local wintering populations, to determine more accurately the use of these areas. The main objective of aerial surveys was to complement the information obtained from marine surveys, mainly the coastal zones between 0 and 20 nautical miles from the coast. Areas nearer the coast (generally between 0 and 3 nautical miles) are not easily covered by marine surveys due to the draught of the ships used in investigation and so aerial surveys complement these data. Another advantage is the ability to travel long distances in a relatively short period of time. This makes it a suitable tool for assessing migration routes or the main wintering areas of seabirds present along the continental coast. A more thorough assessment of both methods (aerial and marine surveys) can be found in [7].Data obtained from aerial surveys was not modelled because it was collected in a different grid format than that used in boat surveys (due to speed differences).Instead, the available aerial data was used to calculate population sizes per sector of the mainland coast and mean densities for seasons when aerial surveys had taken place (See aerial sectors in Fig. 1).
Significant tracking data
The team agreed that significant data (meaning having enough data to consider defining a marine IBA solely on the basis of the tracking data) was achieved when any of the following conditions were reached: >20 different birds tracked; >30 bird trips recorded; >1 year of tracks from the same colony; >2 different tracking efforts for more than 10 different birds at one colony. The areas/islands considered as having significant tracking data where: Corvo and Faial in Azores and Berlengas in mainland.
Kernels of bird activities for these sites where used as follows: a)50% contour density kernel of diving positions during short trips (compass-loggers); b)50% contour density kernel of diving positions during long trips (compass-loggers); c)50% contour density kernel of foraging/resting positions (GPS-loggers) by selecting the lower speed periods of the GPS-logger tracks; d)50% contour density kernel of foraging/resting positions obtained from long trips (GPS-loggers); e)100% contour density kernel of rafting locations (both for compass and GPS-loggers).
The 50% figure requires fewer tracks to reach a stable maximum value, which is an important asset when identifying Marine IBAs, nevertheless, it is important to have a good sample size of tracks to make sure the hotspots identified by each single track coincide and do not vary too much.
Non-significant tracking data
The team agreed that if none of the above conditions occurred, the site should be classified as having no-significant tracking data. However the data available in these other locations should be used only as an indication of likely locations of birds and used to complement other sources of data.
Areas included in this category where: Vila islet and Praia islet (Azores) and Desertas and Selvagens islands (Madeira).

123
order. The 95th percentile means that 95% of occurrences have a value below the selected standard, in other words, 5% of the highest occurrences in the sample.
2.3 Boat surveys
Marine and air surveys of seabirds were the main method for data collection at sea. The Marine IBA LIFE Project based its marine surveys on boats, under the European Seabirds At Sea (ESAS) methodology [7]. Data was collected in transects defined by a period of time (normally 5 to 10 minutes) and were expressed in density (birds/km). All birds in contact with the water inside the pre-defined transect were counted. Birds in flight were counted by carrying out regular snapshots, so as not to over-estimate the density.In order to make proper use of the ESAS methodology, the presence of the seabirds must not be influenced by the presence of the observer’s vessel. Therefore, the use of fishing boats was avoided, as they could attract seabird presence and bias the final results. Trained observers were placed on board of as many vessels as possible, following an opportunistic approach and therefore using different platforms, from oceanographic cruises to hired big-game fishing medium-sized boats. An extra effort was made to collect data during breeding periods and, whenever possible, surveys were repeated in order to obtain robust sequential data for later analysis of the distribution of seabirds in space and time. Table 2 presents the total number of surveys carried within the project.
Direct observations counts obtained from the aerial surveys were used to help define marine IBA boundaries and to complement other data sources. The direct observations were presented as densities per km2 for each specie, and the final maps used in the marine IBA delimitation process included only the observations belonging to the 95 percentile of number of birds recorded for each species (more detailed direct observations from European Seabirds At Sea). Percentile is a value that divides the total frequency into 100 equal parts put into ascending
Table 2 - Summary of boat surveys carried out during the period 2004-2007.
Year 2004 2005 2006 2007 2004-2007
Total nº of birds observed 1154 43824 68221 72808 186007
Distance travelled (km) 259 13207 19729 30148 63343
Area (km2) 78 3962 5923 9062 19025
Hours of observation 14 794 1105 1889 3802
Nº of bird species identified 12 64 62 81 102
Fig. 1 - Sectors and strips analysed with aerial surveys. Sectors North, West, SouthWest and South. Strips < 3Nm (A), < 15 Nm (B) and < 3000 m bathymetry (C).
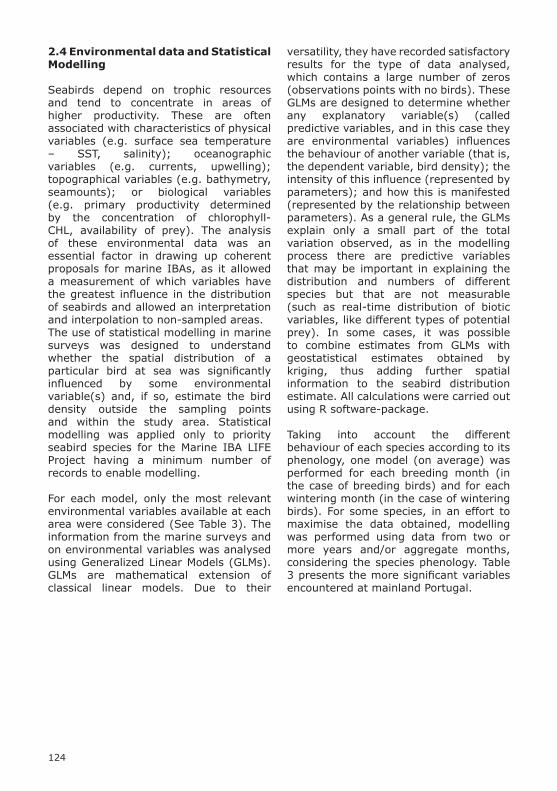
124
versatility, they have recorded satisfactory results for the type of data analysed, which contains a large number of zeros (observations points with no birds). These GLMs are designed to determine whether any explanatory variable(s) (called predictive variables, and in this case they are environmental variables) influences the behaviour of another variable (that is, the dependent variable, bird density); the intensity of this influence (represented by parameters); and how this is manifested (represented by the relationship between parameters). As a general rule, the GLMs explain only a small part of the total variation observed, as in the modelling process there are predictive variables that may be important in explaining the distribution and numbers of different species but that are not measurable (such as real-time distribution of biotic variables, like different types of potential prey). In some cases, it was possible to combine estimates from GLMs with geostatistical estimates obtained by kriging, thus adding further spatial information to the seabird distribution estimate. All calculations were carried out using R software-package.
Taking into account the different behaviour of each species according to its phenology, one model (on average) was performed for each breeding month (in the case of breeding birds) and for each wintering month (in the case of wintering birds). For some species, in an effort to maximise the data obtained, modelling was performed using data from two or more years and/or aggregate months, considering the species phenology. Table 3 presents the more significant variables encountered at mainland Portugal.
2.4 Environmental data and Statistical Modelling
Seabirds depend on trophic resources and tend to concentrate in areas of higher productivity. These are often associated with characteristics of physical variables (e.g. surface sea temperature – SST, salinity); oceanographic variables (e.g. currents, upwelling); topographical variables (e.g. bathymetry, seamounts); or biological variables (e.g. primary productivity determined by the concentration of chlorophyll-CHL, availability of prey). The analysis of these environmental data was an essential factor in drawing up coherent proposals for marine IBAs, as it allowed a measurement of which variables have the greatest influence in the distribution of seabirds and allowed an interpretation and interpolation to non-sampled areas.The use of statistical modelling in marine surveys was designed to understand whether the spatial distribution of a particular bird at sea was significantly influenced by some environmental variable(s) and, if so, estimate the bird density outside the sampling points and within the study area. Statistical modelling was applied only to priority seabird species for the Marine IBA LIFE Project having a minimum number of records to enable modelling.
For each model, only the most relevant environmental variables available at each area were considered (See Table 3). The information from the marine surveys and on environmental variables was analysed using Generalized Linear Models (GLMs). GLMs are mathematical extension of classical linear models. Due to their

125
In order to identify primary or supplementary layers, the following criteria were defined:Primary: a) Tracking datasets with large sample sizes collected over multiple seasons/year; b) At-sea survey data collected in a systematic way recording presence/absence; c) Land-based counts collected over multiple years.Supplementary: a) Tracking datasets with small sample sizes (e.g. <5 tracks from one season/year); b) Bycatch data; c)At-sea distribution data collected from fishing boats or from ad-hoc surveys; d) Habitat suitability models.Only once suitable weightings were been applied it was possible to begin site identification. Overlaying the data layers will identify areas of commonality and hence the most likely sites; these sites were then assessed against IBA thresholds. As a general rule, no marine IBA should be identified on the basis of supplementary quality data alone, and that sites identified where two primary data layers coincide or overlap are the strongest cases for recognition as IBAs. See [5] for more details.
3. RESULTS
As for the Berlengas Marine IBA, the species that triggered IBA criteria was the Cory’s shearwater. The main source of data used to define this IBA were density kernels obtained from data-loggers (see Figure 2). Direct observations obtained from ESAS boat surveys were used in two different ways: densities – nº birds/
2.5 Data Analysis
The steps followed to identify a marine IBA site when undertaking a marine IBA programme, once data was collected is presented below:
a) Creation of Geographical Information System (GIS) layers of these data on a species by species basis. Environmental variables and seabird distributions at sea should be organised to allow comparison between different months/seasons. If it is not possible to convert data into a GIS-compatible format, these can still be used as supporting information.b) Determine which layers should be regarded as primary and supplementary for identification and delineation (apply weightings as appropriate). c) Identify candidate sites for each species (using the methodologies and guidance that follows to ensure a consistent approach). d) Apply IBA criteria and thresholds to candidate sites on a species by species basis, to confirm they merit being identified as marine IBAs. e) Delimit final boundaries for sites triggering IBA criteria. When appropriate, overlap sites for different species located in the same area to merge them into a single marine IBA. Re-apply IBA criteria for the final delimited area as required. f) Produce IBA site description and propose IBA in the World Bird Database. g) IBA reviewed and confirmed or rejected by BirdLife Secretariat.
Table 3 - Summary of significant variables identified by statistical modelling at mainland Portugal per species.
Species Year Period Significant variables
Puffinus mauretanicus
2005 June-August DepthDistance to shore
2006 June-AugustDistance to shore
Sea Surface TemperatureChlorophyll-a concentration
Morus bassanus 2005 December-February
DepthDistance to shore
Chlorophyll-a concentrationCalonectris diomedea 2005 June-August
DepthSea Surface Temperature
Chlorophyll-a concentration

126
The last data source used to identify this MIBA was aerial census, also the 95 percentile was used, totaling 2 birds/km2. Finally, all primary layers were overlaid using ArcGIS 9.3 and limits were drew following the two-independent layer approach. Before final publication, a straight sided polygon was defined instead of the irregular one defined by the overlaying technique. This was decided as to facilitate easy navigation and management by the relevant authorities. See Figure 6 for final results.
As for marine IBA criteria application, a population estimate of the total IBA area was defined using data from bibliography and direct at-sea censuses.
km2 (Figure 3) and birds on water – nº birds feeding or resting (Figure 4). The 95 percentile threshold of observed densities for this specie was 26 birds/km2. This threshold wasn’t applied to the “birds in water” layer, as this layer was used just to check what the main spots where birds were observed feeding or resting overlapped with the other data layers. The most significant GLM for Calonectris diomedea in this area was for the summer of 2005. This was also the most robust model, and was based on the most data obtained within the Cory’s breeding season (Figure 5).
Fig. 2 - Analysis of kernels derived from data-loggers in Calonectris diomedea in Berlengas showing areas used for rafting, short trips and long trips.
Fig. 3 - ESAS Direct Observations for Calonectris diomedea – Density (P95 Threshold = 26 birds/km2).
Fig. 4 - ESAS Direct observations – Number of birds on water (Calonectris diomedea).

127
4. DISCUSSION
Results shown above suggest that it is possible to map the at-sea behavior of most of the seabird species occurring in Portugal. It also shows that a site-approach is feasible for many Portuguese areas within the EEZ. There are two major limitations to the abovementioned protocol: a) Seabird size could prevent the deployment of data-loggers and therefore a “tracking” layer won’t be available for medium or small-sized birds that so far cannot carry tracking devices without compromising their own safety; b) At-sea direct data (e.g. boat or plane census) must be large.
As explained above, the identification of the 95 percentile proved quite essential
Fig. 5 - Prediction model for summer 2005 (P95 Threshold = 10 birds/km2).
Fig. 6 - View of the Core Area Marine IBA proposed for Berlengas.
in order to filter out the significant data from a vast dataset. If planes and boats are not widely available for observers to board, the prediction models used will be weak, as well as population assessments, that will later be the base for the marine IBA criteria threshold definition.
5. ACKNOWLEDGMENTS
We would like to thank the Marine IBA LIFE Project team, particularly the bird observers and Vitor Paiva, Martin Poot and Peter van Horssen; this project was financed by the EU (LIFE04NAT/PT/000213).
6. REFERENCES
[1] H. Skov, J. Durinck, M. F. Leopold & M.L. Tasker, “Important Bird Areas for seabirds in the North Sea”. BirdLife International, Cambridge. Copenhagen. 1995.[2] J. Durinck, H. Skov, F. P. Jensen & S. Pihl, “Important marine areas for wintering birds in the Baltic Sea”. Ornis Consult Report. Copenhagen. 1994.[3] I. Ramírez, P. Geraldes, A. Meirinho, P. Amorim & V. Paiva, “Áreas Importantes para as Aves Marinhas em Portugal – Important Areas for seabirds in Portugal”. Projecto LIFE04 NAT/PT/000213 – Sociedade Portuguesa para o Estudo das Aves (SPEA). Lisboa. 2008.[4] J. M. Arcos, J. Bécares, B. Rodríguez & A. Ruiz, “Áreas Importantes para la Conservación de las Aves marinas en España”. Projecto LIFE04NAT/ES/000049 – Sociedad Española de Ornitología (SEO/BirdLife). Madrid. 2009.[5] BirdLife International. Marine Important Bird Areas toolkit: standardised techniques for identifying priority sites for the conservation of seabirds at-sea. BirdLife International, Cambridge UK. Version 1.1: May 2010.[6] J. M. Igual, M. G. Forero, G. Tavecchia, J. Gonzalez-Solis, A. Martinez-Abrain, K. Hobson, X. Ruiz & D. Oro, “Short term effects of data-loggers on Cory’s shearwater Calonectris diomedea”. Marine

128
Biology 146, 619 - 624. 2005.[7] C. J. Camphuysen & S. Garthe, “Recording foraging seabirds at sea: standardised recording and coding of foraging behaviour and multi-species foraging associations”. Atlantic Seabirds 6(1):1-32. 2004.

129
DEVELOPMENT OF A METHODOLOGY TO EVALUATE THE FLOOD RISK AT THE COASTAL ZONEP.D. Raposeiro1,2, C.J. Fortes2, M.T. Reis2, J.C. Ferreira1
1 Universidade Nova de Lisboa – FCT/DCEA 2 Laboratório Nacional de Engenharia Civil – Núcleo de Portos e Estruturas Marítimas.E-mail: [email protected]
ABSTRACT
This paper illustrates the methodology developed to evaluate the risk of flooding of a coastal area, as well as the application of such methodology to Vale do Lobo beach, situated in the Loulé Municipality, a Portuguese coastal area under significant touristic pressure. The methodology is based on four main steps: a) division of the study area into sub-areas with similar characteristics in terms of coastal defense; b) determining the probability of exceedance of pre-set thresholds of flood levels for each study area; c) establishment of qualitative factors related to the consequences of exceedance of pre-set thresholds of flood levels; d) combination of the above steps for expeditious assessment of flood risks. The determination of flood levels follows the methodology presented in [10] and [11], which is based on the transference of the Faro wave-buoy regime to the study area by using the SWAN model integrated in a geographic information system (GIS).
Index Terms — Geographic information systems, numerical models, coastal planning and management, risk and vulnerability, Vale do Lobo beach
1. INTRODUCTION
The impact of climate change on coastal zone has manifested itself in different ways, including the rise in sea level and increase in number and intensity of phenomena causing risk of flooding. Given the geographic location and concentration of people and infrastructure along the coast, these phenomena are revealed today as genuine challenges in managing the Portuguese coast.
The greater or lesser exposure of infrastructure or the population to events that may cause harm is crucial for risk assessment. This is important because it is possible to identify coastal areas with a high degree of vulnerability to energetic activities of the sea, but without major risks due to lack of human occupation, equipment or natural resources, or otherwise, that is, areas of low vulnerability index, but high human occupation, which confers a high risk. Within this context, the term risk is defined as the probability of an adverse event multiplied by its consequences, [2] and [16].
The extent of the Portuguese coast, the severity of the sea conditions and the concentration of population and economic activities in its coastal zone, justify the importance of carrying out wave induced risk studies. For a correct assessment of these risks, the determination of shares of flooding is essential.
Indeed, emergency situations caused by adverse sea conditions are frequent and put in danger the safety of persons and goods, with a negative impact for society, economy and natural heritage.
The detailed research on the sea waves, currents and tide levels at the local level is essential to improve the methodologies for risk assessment, increasing the reliability of results and enabling timely issue of alerts and the preparation of mitigation plans.
Thus, in this paper, a methodology to evaluate the risk associated with the flooding of coastal areas is proposed, which is essential for the proper planning
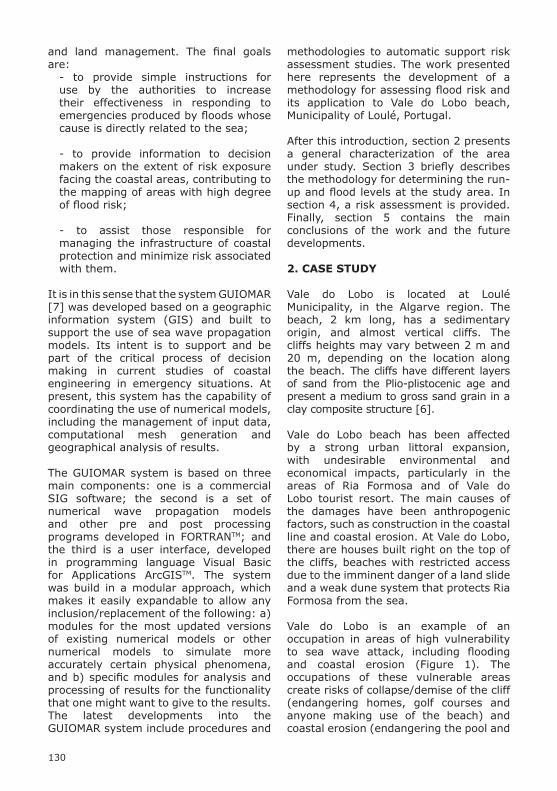
130
and land management. The final goals are:
- to provide simple instructions for use by the authorities to increase their effectiveness in responding to emergencies produced by floods whose cause is directly related to the sea;
- to provide information to decision makers on the extent of risk exposure facing the coastal areas, contributing to the mapping of areas with high degree of flood risk;
- to assist those responsible for managing the infrastructure of coastal protection and minimize risk associated with them.
It is in this sense that the system GUIOMAR [7] was developed based on a geographic information system (GIS) and built to support the use of sea wave propagation models. Its intent is to support and be part of the critical process of decision making in current studies of coastal engineering in emergency situations. At present, this system has the capability of coordinating the use of numerical models, including the management of input data, computational mesh generation and geographical analysis of results.
The GUIOMAR system is based on three main components: one is a commercial SIG software; the second is a set of numerical wave propagation models and other pre and post processing programs developed in FORTRANTM; and the third is a user interface, developed in programming language Visual Basic for Applications ArcGISTM. The system was build in a modular approach, which makes it easily expandable to allow any inclusion/replacement of the following: a) modules for the most updated versions of existing numerical models or other numerical models to simulate more accurately certain physical phenomena, and b) specific modules for analysis and processing of results for the functionality that one might want to give to the results. The latest developments into the GUIOMAR system include procedures and
methodologies to automatic support risk assessment studies. The work presented here represents the development of a methodology for assessing flood risk and its application to Vale do Lobo beach, Municipality of Loulé, Portugal.
After this introduction, section 2 presents a general characterization of the area under study. Section 3 briefly describes the methodology for determining the run-up and flood levels at the study area. In section 4, a risk assessment is provided. Finally, section 5 contains the main conclusions of the work and the future developments.
2. CASE STUDY
Vale do Lobo is located at Loulé Municipality, in the Algarve region. The beach, 2 km long, has a sedimentary origin, and almost vertical cliffs. The cliffs heights may vary between 2 m and 20 m, depending on the location along the beach. The cliffs have different layers of sand from the Plio-plistocenic age and present a medium to gross sand grain in a clay composite structure [6].
Vale do Lobo beach has been affected by a strong urban littoral expansion, with undesirable environmental and economical impacts, particularly in the areas of Ria Formosa and of Vale do Lobo tourist resort. The main causes of the damages have been anthropogenic factors, such as construction in the coastal line and coastal erosion. At Vale do Lobo, there are houses built right on the top of the cliffs, beaches with restricted access due to the imminent danger of a land slide and a weak dune system that protects Ria Formosa from the sea.
Vale do Lobo is an example of an occupation in areas of high vulnerability to sea wave attack, including flooding and coastal erosion (Figure 1). The occupations of these vulnerable areas create risks of collapse/demise of the cliff (endangering homes, golf courses and anyone making use of the beach) and coastal erosion (endangering the pool and
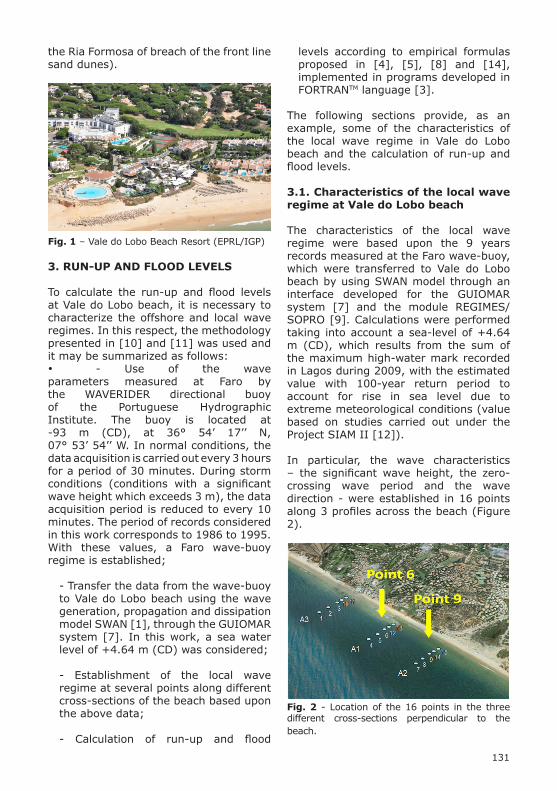
131
the Ria Formosa of breach of the front line sand dunes).
Fig. 1 – Vale do Lobo Beach Resort (EPRL/IGP)
3. RUN-UP AND FLOOD LEVELS
To calculate the run-up and flood levels at Vale do Lobo beach, it is necessary to characterize the offshore and local wave regimes. In this respect, the methodology presented in [10] and [11] was used and it may be summarized as follows: • - Use of the wave parameters measured at Faro by the WAVERIDER directional buoy of the Portuguese Hydrographic Institute. The buoy is located at -93 m (CD), at 36° 54’ 17’’ N, 07° 53’ 54’’ W. In normal conditions, the data acquisition is carried out every 3 hours for a period of 30 minutes. During storm conditions (conditions with a significant wave height which exceeds 3 m), the data acquisition period is reduced to every 10 minutes. The period of records considered in this work corresponds to 1986 to 1995. With these values, a Faro wave-buoy regime is established;
- Transfer the data from the wave-buoy to Vale do Lobo beach using the wave generation, propagation and dissipation model SWAN [1], through the GUIOMAR system [7]. In this work, a sea water level of +4.64 m (CD) was considered;
- Establishment of the local wave regime at several points along different cross-sections of the beach based upon the above data;
- Calculation of run-up and flood
levels according to empirical formulas proposed in [4], [5], [8] and [14], implemented in programs developed in FORTRANTM language [3].
The following sections provide, as an example, some of the characteristics of the local wave regime in Vale do Lobo beach and the calculation of run-up and flood levels.
3.1. Characteristics of the local wave regime at Vale do Lobo beach
The characteristics of the local wave regime were based upon the 9 years records measured at the Faro wave-buoy, which were transferred to Vale do Lobo beach by using SWAN model through an interface developed for the GUIOMAR system [7] and the module REGIMES/SOPRO [9]. Calculations were performed taking into account a sea-level of +4.64 m (CD), which results from the sum of the maximum high-water mark recorded in Lagos during 2009, with the estimated value with 100-year return period to account for rise in sea level due to extreme meteorological conditions (value based on studies carried out under the Project SIAM II [12]).
In particular, the wave characteristics – the significant wave height, the zero-crossing wave period and the wave direction - were established in 16 points along 3 profiles across the beach (Figure 2).
Fig. 2 - Location of the 16 points in the three different cross-sections perpendicular to the beach.

132
Methodology Cross-section
Rmax (m)
FL (m CD)
MASE (1989) - [8]
A1 6.60 9.56
A2 6.91 9.87
NIELSEN & HANSLOW (1991) - [10]
A1 2.71 6.40
A2 2.88 6.57
TEIXEIRA (2009) – [11]
A1 2.70 6.39
A2 2.87 6.56
To illustrate the calculations performed for the run-up and flood levels, the authors have only considered in this work the results obtained for Point 6 (cross-section A1) and Point 9 (cross-section A2), located just upstream of the surf zone.
3.2. Run-up analyses for Vale do Lobo beach
The calculation of the run-up on beaches is done in most cases by using essentially empirical formulations based on field measurements or tests on two-dimensional scaled models of constant, smooth and impermeable slopes (beaches) [15]. In previous work, [10] and [11], and herein, the run-up on the beach of Vale do Lobo was estimated using the formulas proposed in [4] and [5], developed on the basis of physical model test results, and also in [8] and [14], developed based on field data (Figure 3). Note that the formula presented at [14] is based on field data collected specifically for the study area considered in this work.
0
1
2
3
4
5
6
7
23-12-1988 12-01-1989 01-02-1989 21-02-1989 13-03-1989
Rm
ax (m
)
Date
Cross-section A1 - Série de JAN 1989 a MAR 1989
Mase (1989)Nielsen & Hanslow (1991)Teixeira (2009)
Fig. 3 - Run-up values, Rmax, obtained at cross-section A1, for the series of wave data between January and March 1989, using the formulations of Mase (1989) - [4], Nielsen & Hanslow (1991) - [8] and Teixeira (2009) - [14], all with the wave conditions at Faro wave-buoy.
3.3. Calculation of the flood levels
Once the run-up values for given wave conditions have been estimated, the flood levels, FL, can be determined assuming that they result simply from the sum of the contributions of the astronomical tide, AT, of meteorological elevations, MS, and of the run-up, R:
FL = AT + MS + R (eq. 1)
The astronomical tide can be accurately estimated for the majority of the locations. In general, tides can be
predicted by harmonic analysis, which is the superposition of many sinusoidal components with amplitudes and frequencies determined by a local analysis of the measured tide.
The meteorological elevations may be obtained from the difference between the values of the water level measured by tide gauges and the corresponding ones estimated for the astronomical tide. These elevations are considered to be induced by strong or long duration winds and/or by abnormal high or low atmospheric pressures.
In this work, due to the lack of tide gauge data for the period between 1986 and 1995, we extrapolate the two full years of recorded tide, RT, for the whole period of nine years under study. R-values considered correspond to the estimates of Rmax obtained with the methods presented in [4], [8] and [14] for the conditions of sea waves for the period 1986 to 1995.
Table 1 shows the maximum values of FL in the cross-sections A1 and A2 for the conditions mentioned above. Table 1 shows that the maximum value of FL is very similar for the methods described in [8] and [14] and much lower than the value obtained by the methodology shown in [4], since the later is based on tests on impermeable slopes. For the methods presented in [8] and [14], the contribution of Rmax for FL is less than the contribution of AT+MS, while for the method in [4] it is not.
Table 1 – Maximum flood levels estimated with different methodologies for cross-sections A1 and A2.
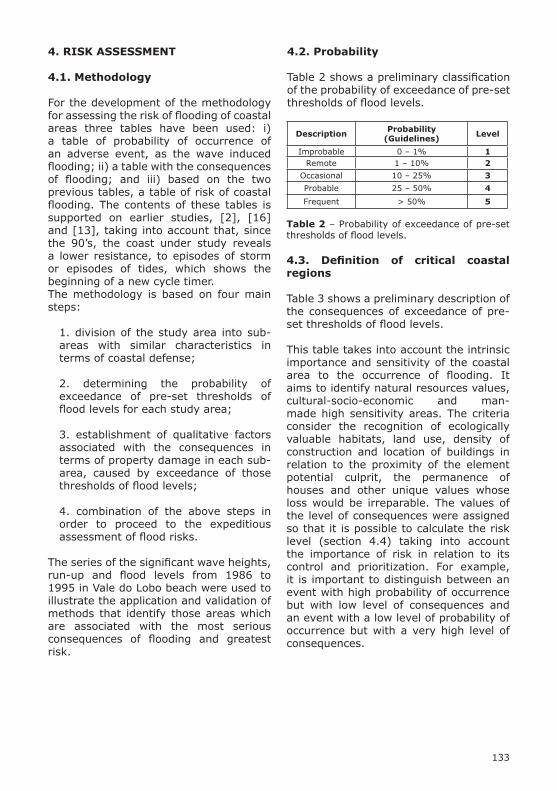
133
Description Probability (Guidelines) Level
Improbable 0 – 1% 1Remote 1 – 10% 2
Occasional 10 – 25% 3
Probable 25 – 50% 4
Frequent > 50% 5
4. RISK ASSESSMENT
4.1. Methodology
For the development of the methodology for assessing the risk of flooding of coastal areas three tables have been used: i) a table of probability of occurrence of an adverse event, as the wave induced flooding; ii) a table with the consequences of flooding; and iii) based on the two previous tables, a table of risk of coastal flooding. The contents of these tables is supported on earlier studies, [2], [16] and [13], taking into account that, since the 90’s, the coast under study reveals a lower resistance, to episodes of storm or episodes of tides, which shows the beginning of a new cycle timer. The methodology is based on four main steps:
1. division of the study area into sub-areas with similar characteristics in terms of coastal defense;
2. determining the probability of exceedance of pre-set thresholds of flood levels for each study area;
3. establishment of qualitative factors associated with the consequences in terms of property damage in each sub-area, caused by exceedance of those thresholds of flood levels;
4. combination of the above steps in order to proceed to the expeditious assessment of flood risks.
The series of the significant wave heights, run-up and flood levels from 1986 to 1995 in Vale do Lobo beach were used to illustrate the application and validation of methods that identify those areas which are associated with the most serious consequences of flooding and greatest risk.
4.2. Probability
Table 2 shows a preliminary classification of the probability of exceedance of pre-set thresholds of flood levels.
Table 2 – Probability of exceedance of pre-set thresholds of flood levels.
4.3. Definition of critical coastal regions
Table 3 shows a preliminary description of the consequences of exceedance of pre-set thresholds of flood levels.
This table takes into account the intrinsic importance and sensitivity of the coastal area to the occurrence of flooding. It aims to identify natural resources values, cultural-socio-economic and man-made high sensitivity areas. The criteria consider the recognition of ecologically valuable habitats, land use, density of construction and location of buildings in relation to the proximity of the element potential culprit, the permanence of houses and other unique values whose loss would be irreparable. The values of the level of consequences were assigned so that it is possible to calculate the risk level (section 4.4) taking into account the importance of risk in relation to its control and prioritization. For example, it is important to distinguish between an event with high probability of occurrence but with low level of consequences and an event with a low level of probability of occurrence but with a very high level of consequences.

134
Table 3 – Consequences of exceedance of pre-set thresholds of flood levels.
Description Consequences (Guidelines) Level
Insignificant Places with geotechnical characteristics relatively stable, natural sand beach, squats in habitats of low ecological value; local paths or drainage ditches 1
MarginalSites with soil geotechnical characteristics of weak or processing any type of woody vegetation or other that would give some stability, areas occupied by habitat conditions weak plant
2
SeriousPlaces to infrastructure and coastal protection, local structures relevant to economic activities, local geotechnical characteristics very weak, unstable and low resistance to breakdown, areas occupied by some habitats with ecological interest.
5
CriticalPlaces with permanent human habitation (urban planned); local geotechnical characteristics very weak, very unstable and very low resistance to breakdown, without stabilizing vegetation, sites with natural elements of great value whose loss would be difficult to compensate.
10
Catastrophic Places with permanent human occupation; sites absolutely unique and of tremendous value, the loss would be irreparable, beach-dune system. 25
Table 4 – Risk level.
Risk Level Consequences1 2 5 10 25
Probability
1 1 2 5 10 252 2 4 10 20 503 3 6 15 30 754 4 8 20 40 1005 5 10 25 50 125
Table 5 – Assessment of the acceptability of the risk level.
Level Description Risk Mitigation (Guidelines)
1 – 3 Negligible Insignificant risk; no further consideration needed.
4 – 10 Acceptable Risk can be considered acceptable/tolerable provided the risk is managed.
15 – 30 Undesirable
Risk should be avoided if reasonably practicable; detailed investigation and cost/programme
benefit justification required; top level approval needed; monitoring essential.
40 – 125 Unacceptable
Intolerable risk; it is mandatory to undertake risk mitigation (e.g. eliminate the source of risk,
change the probability and/or consequences, transfer risk).
4.4. Risk
Risk is the product of the probability of an adverse event by the value assigned to its consequences. The methodology presented here is a qualitative assessment of the risk of flooding being the degree of risk the product of the probability of flooding (Table 2) by the consequences of flooding (Table 3). The array provided by the product of these two variables is presented in Table 4 while Table 5 describes the assessment and acceptability of the obtained level of risk.

135
+0 m (CD) +0 m (CD)
Fig. 4 - Flood level +3 m (CD). Fig. 5 - Flood level +6.5 m (CD).
+0 m (CD)
Cliffs line
Atlantic Ocean
50
Fig. 6 - Risk map +3 m (CD). Fig. 7 - Risk map +6.5 m (CD).
After the assessment of the risk impact into the areas affected by the flooding, the use of the GIS and its database, allows a quick, precise and efficient creation of flood maps, and its respective risk maps. For the creation of the flood maps, it is required to identify the areas below the pre-set threshold of flood level, while its respective risk map provides the associated risk level for each sub-zone of the areas of study.
In this work and for illustrative purposes only, two scenarios were considered:
- Scenario 1 - Occurrence of flood levels exceeding the threshold of +3 m (CD); - Scenario 2 - Occurrence of flood levels exceeding the threshold of +6.5 m (CD).
Figures 4 to 7 present the flood and risk maps for these two scenarios, for cross-section A2. As it can be seen, at the central part of the beach, where the cliffs have a lower crest level, the risk level is higher than at both ends of the beach.
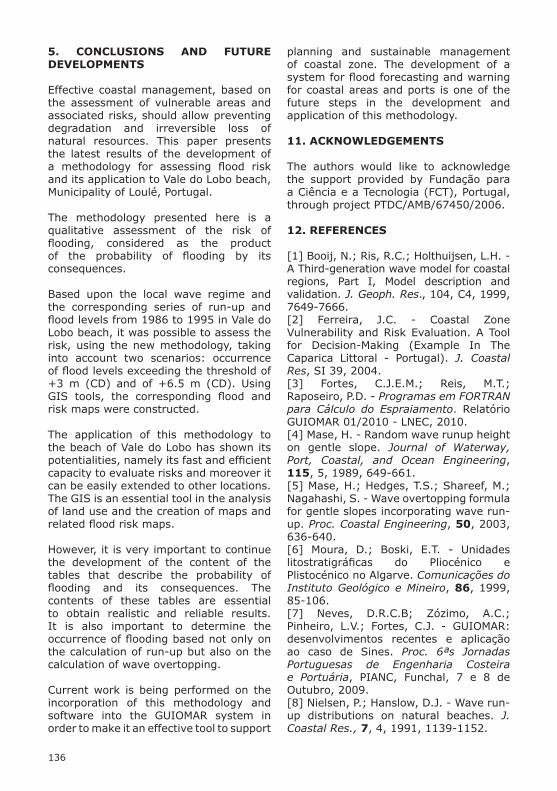
136
5. CONCLUSIONS AND FUTURE DEVELOPMENTS
Effective coastal management, based on the assessment of vulnerable areas and associated risks, should allow preventing degradation and irreversible loss of natural resources. This paper presents the latest results of the development of a methodology for assessing flood risk and its application to Vale do Lobo beach, Municipality of Loulé, Portugal.
The methodology presented here is a qualitative assessment of the risk of flooding, considered as the product of the probability of flooding by its consequences.
Based upon the local wave regime and the corresponding series of run-up and flood levels from 1986 to 1995 in Vale do Lobo beach, it was possible to assess the risk, using the new methodology, taking into account two scenarios: occurrence of flood levels exceeding the threshold of +3 m (CD) and of +6.5 m (CD). Using GIS tools, the corresponding flood and risk maps were constructed.
The application of this methodology to the beach of Vale do Lobo has shown its potentialities, namely its fast and efficient capacity to evaluate risks and moreover it can be easily extended to other locations. The GIS is an essential tool in the analysis of land use and the creation of maps and related flood risk maps.
However, it is very important to continue the development of the content of the tables that describe the probability of flooding and its consequences. The contents of these tables are essential to obtain realistic and reliable results. It is also important to determine the occurrence of flooding based not only on the calculation of run-up but also on the calculation of wave overtopping.
Current work is being performed on the incorporation of this methodology and software into the GUIOMAR system in order to make it an effective tool to support
planning and sustainable management of coastal zone. The development of a system for flood forecasting and warning for coastal areas and ports is one of the future steps in the development and application of this methodology.
11. ACKNOWLEDGEMENTS
The authors would like to acknowledge the support provided by Fundação para a Ciência e a Tecnologia (FCT), Portugal, through project PTDC/AMB/67450/2006.
12. REFERENCES
[1] Booij, N.; Ris, R.C.; Holthuijsen, L.H. - A Third-generation wave model for coastal regions, Part I, Model description and validation. J. Geoph. Res., 104, C4, 1999, 7649-7666.[2] Ferreira, J.C. - Coastal Zone Vulnerability and Risk Evaluation. A Tool for Decision-Making (Example In The Caparica Littoral - Portugal). J. Coastal Res, SI 39, 2004.[3] Fortes, C.J.E.M.; Reis, M.T.; Raposeiro, P.D. - Programas em FORTRAN para Cálculo do Espraiamento. Relatório GUIOMAR 01/2010 - LNEC, 2010.[4] Mase, H. - Random wave runup height on gentle slope. Journal of Waterway, Port, Coastal, and Ocean Engineering, 115, 5, 1989, 649-661.[5] Mase, H.; Hedges, T.S.; Shareef, M.; Nagahashi, S. - Wave overtopping formula for gentle slopes incorporating wave run-up. Proc. Coastal Engineering, 50, 2003, 636-640.[6] Moura, D.; Boski, E.T. - Unidades litostratigráficas do Pliocénico e Plistocénico no Algarve. Comunicações do Instituto Geológico e Mineiro, 86, 1999, 85-106.[7] Neves, D.R.C.B; Zózimo, A.C.; Pinheiro, L.V.; Fortes, C.J. - GUIOMAR: desenvolvimentos recentes e aplicação ao caso de Sines. Proc. 6ªs Jornadas Portuguesas de Engenharia Costeira e Portuária, PIANC, Funchal, 7 e 8 de Outubro, 2009.[8] Nielsen, P.; Hanslow, D.J. - Wave run-up distributions on natural beaches. J. Coastal Res., 7, 4, 1991, 1139-1152.

137
[9] Pinheiro, L.; Fortes, C.J.; Santos, J.A.; Neves, M.G. - Caracterização de regimes de agitação marítima utilizando a ferramenta SOPRO. Proc. 8º Congresso da Água, APRH, Figueira da Foz, 13 a 17 de Março, 2006.[10] Raposeiro, P.D.; Reis, M.T.; Fortes, C.J.E.M.; Ferreira, J.C. - Methodology for estimating run-up and flooding at the costal zone using the GUIOMAR system: application to Vale do Lobo beach. CoastGis2009, Brazil, 30 Sept-2 Oct, 2009.[11] Raposeiro, P.; Reis, M.T.; Fortes, C.J.E.M.; Ferreira, J.C. - Análise de cotas de inundação na praia de Vale do Lobo. 10º Congresso da Água, APRH, Alvor, 22 a 24 de Março, 2010.[12] Santos, F.D.; Forbes, K.; Moita, R. (Eds.) - Climate Change in Portugal: Scenarios, Impacts and Adaption Measures – SIAM. Gradiva, Lisboa, Portugal, 2002.[13] Simm, J.; Cruickshank, I. - Construction Risk in Coastal Engineering. Thomas Telford, London, 1998.[14] Teixeira, S.B. - Demarcação do leito e da margem das águas do mar no litoral sul do Algarve. Administração da Região Hidrográfica do Algarve. Faro, 2009.[15] USACE - Coastal Engineering Manual. Coastal and Hydraulics Laboratory, U.S. Army Engineer Research and Development Center, Vicksburg, Miss., 2003.[16] Varnes, D.J. – Landslide hazard zonation: a review of principles and practice. UNESCO, Paris, 1984.

138
ABSTRACT
Marine spatial planning (MSP) is an international initiative to address conflicting objectives of conservation and resource development and usage in marine spaces. At this time MSP exists more as a concept then a well defined framework, therefore continued development of theory and methods is essential. A critical component of marine spatial planning is spatial data collection and analysis. Geotechnology has made this data more accessible and provided tools to organize, analyze, and integrate it into the MSP process. A review of the current literature reveals the technological and methodological tools that are best suited for marine spatial planning as well as suggests areas for further research in order to better inform this process.
Index Terms— marine, spatial, planning, data, tools
1. INTRODUCTION
Marine spatial planning is a concept that is rapidly gaining momentum. Regional MSP projects are currently underway in the United States and abroad. According to the United Nations Educational, Scientific, and Cultural Organization, “marine spatial planning is a public process of analyzing and allocating the spatial and temporal distribution of human activities in marine areas to achieve ecological, economic, and social objectives that are usually specified through a political process” [1]. In June of 2009 the Obama administration created a Task Force to develop a framework for coastal and marine spatial planning. In December of that year, the US Interagency Ocean Policy Task Force released an Interim Framework for Effective Coastal and Marine Spatial Planning. They
summarize coastal and marine spatial planning (CMSP) as “a public policy process for society to better determine how the oceans, coasts, and Great Lakes are sustainably used and protected now and for future generations.” CMSP encompasses nearly identical concepts as MSP and may be more accurate given that coastal and marine space and processes are inextricably linked and should not be considered as distinct in a planning process. For the purpose of simplicity however, the more widely used term of MSP will be used in this paper.
A primary goal of marine spatial planning is to support current and future uses of ocean ecosystems and maintain the availability of valuable ecosystem services for future generations [2]. An MSP process also addresses the legal, social, and economic aspects of governance, including the designation of authority, stakeholder participation, financial support, enforcement, monitoring, and adaptive management. Key steps include defining and analyzing existing and future conditions and preparing a spatial management plan [1]. These critical steps are facilitated by the use of software tools or other well-defined spatially-explicit methodologies which we will collectively refer to as “tools”. They fall into three major categories as relevant to MSP and will be the basis upon which this review is organized. The categories are: 1) data collection; 2) data management and analysis; and 3) decision support.
The practice of marine spatial planning is made possible by the increasing availability of high quality spatial data. Various software and other tools allow for the management and analysis of this data and give practitioners the ability to create alternate management scenarios
DATA REQUIREMENTS AND TOOLS FOR MARINE SPATIAL PLANNINGK.A. StamoulisUniversity of Hawai’i at Manoa, Geography Department. E-mail: [email protected].

139
information. An area that is less developed and often represents a knowledge gap in MSP is (spatial) information about human activities [4]. With the current proliferation of MSP initiatives this “missing layer” is increasingly becoming addressed through various techniques. A critical consideration for the collection of data for MSP is the issue of scale. Data sets should be of similar scale as the planning units. It is often unproductive to collect fine-scale data sets for small parts of the management area, because when put together they are frequently not compatible [1]. Types of spatial data that are necessary for marine spatial planning include administrative, ecological, environmental, and human use. Each of these main data types will be discussed in turn along with key sources and tools utilized for their collection.
2.1. Administrative
Administrative data includes jurisdictional boundaries and government regulations. Maritime boundaries and limits delineate the extent of a nation’s exclusive rights and control over the maritime areas off its coast. The boundaries may include a 12 nautical mile territorial sea, a 24 nautical mile contiguous zone, a 200 mile exclusive economic zone, and the continental shelf. Government regulations regarding coastal and marine areas apply to specific legislative and jurisdictional zones and can be represented as spatial footprints. The combination of jurisdictional boundaries and the regulations that apply to the areas they delineate are essential for MSP.
The Multipurpose Marine Cadastre is an online spatial database provided by the NOAA Coastal Services Center (CSC) and the US Minerals Management Service [5]. It is a useful tool for the retrieval of administrative layers needed for MSP efforts including jurisdictional boundaries, restricted areas, laws, and marine infrastructure. The Legislative atlas is a component of the Digital Coast produced by the CSC and provides the spatial footprint for a range of coastal and ocean laws, policies, and regulations
upon which planning decisions are made. It is important to remember that MSP is not a simple linear progression but rather a dynamic process with many feedback loops. Analyses of existing and future conditions will evolve as new information is identified and incorporated into the planning process. Understanding and utilization of the proper tools is essential for successful MSP endeavors. The purpose of this review is to present and describe the kinds of tools that are available for MSP and provide examples from the current literature. Much discussion has occurred regarding MSP policy, frameworks, and best practices. A comprehensive review of data requirements and available tools is timely.
2. DATA COLLECTION
The collection of pertinent spatial data is critical to the marine spatial planning process. For the purpose of this review we will make a distinction between the tools and technologies used for collecting primary data and the tools utilized by MSP practitioners to define, manage, and analyze this information. Ehler and Douvere [1] identify five primary sources for MSP relevant data which include scientific literature; expert scientific opinion or advice; government sources; local knowledge; and direct field measurement. Most spatial planning efforts rely heavily on the first three sources; however local knowledge is increasingly recognized as an important source of information. Direct-field measurements are typically outside the scope of MSP practitioners, though are sometimes necessary if significant knowledge gaps are identified. Current technology and methods have made available a great deal of spatially-explicit data for use in MSP, especially in terms of ecological and environmental information. Palumbi et al. [3] describe the application of some of the tools currently used in oceanography and marine ecology to inform the design of ocean reserves which have implications for all aspects of MSP. Remote sensing data is a major source of ecological and environmental
140
remote sensing from satellites records the same data on the scale of whole ocean basins. On a much smaller scale, land-based remote sensing techniques, such as Coastal Ocean Dynamics Application Radar, allow precise measurements of surface currents within a few kilometers of shore [3]. Marine environmental and circulation patterns are important for determining different uses for marine spaces. In addition, knowledge of ocean currents can allow us to infer dispersal patterns for marine larvae, which is particularly important for the design of marine reserves. Oceanographic maps for different parameters at appropriate scales are useful for MSP. These are obtainable through US government agencies such as the NOAA National Ocean Service (NOS) and the NASA Physical Oceanography Distributed Data Archive Center (PO.DAAC).
2.4. Human Use
Data regarding human activities in marine spaces is instrumental for marine spatial planning. The social seascape however, is largely undocumented and often represents a “missing layer” in decision making [4]. Human uses of ocean and coastal areas encompasses a broad range of activities which can include: fishing (commercial and recreational), aquaculture, marine transportation and shipping, oil and gas development and exploration, sand and gravel mining, offshore renewable energy, military operations, scientific research, as well as a range of recreational activities. Some of these activities are site specific and can be mapped fairly easily, others such as fishing and recreational uses, can be variable in time and space. Due to the proliferation of ecosystem-based management and marine spatial planning, researchers have begun to focus on quantifying and mapping these activities. Vessel monitoring systems (VMS) are used to define principle areas for fisheries [15-17]. Participatory mapping draws on stakeholder and local knowledge to locate fishing communities at sea [4] as well as collect other MSP relevant information
[6]. Both of these tools are accessible via the internet. They share an online GIS, in which a user zooms into and selects their area of interest to identify available data resources for that region which they then have the option to download. A GIS application is necessary to view and analyze the downloaded spatial data.
2.2. Ecological
Ecological data necessary for MSP include biodiversity, animal distributions, and habitat information. This data is essential for identifying sensitive or ecologically important areas, otherwise known as biological valuation. In most cases these types of data are collected by scientific and/or government organizations. Various methods are used to generate ecological distribution and biodiversity data as part of inventory and monitoring projects. The scale and extent of these datasets however, are often small and patchy, making them unsuitable for larger scale MSP endeavors. Benthic habitats are also important indicators of ecological value. This information is increasingly obtained through remote sensing methods, allowing data collection on large scales (see Diaz et al. [7] for a review of methods). Recent research has focused on the relationship between benthic habitat and marine life assemblages [8-10]. Studies indicate that benthic habitat parameters may be used as predictors for diversity and abundance of fish and corals [11-14]. This has important implications for MSP as it represents large scale, low cost means of collecting information useful for biological valuation.
2.3. Environmental
The marine environment is dynamic and complex, and patterns and trends exist on different time scales. An understanding of ocean and near shore physical parameters is important for MSP. Oceanographic information can include sea surface height, temperature, ocean winds, circulation, currents, and water chemistry. While historically much of this data was collected directly by ships, today
141
[5]. These are valuable resources for obtaining MSP relevant data which are updated on a continual basis.Analyzing existing and future conditions represents another critical part of the MSP process. Various tools have been developed for this purpose, all of which fall under the realm of Geographic Information Science (GISc) which is the foundation of Geographic Information Systems (GIS). Of the four primary data types discussed previously, ecological and human use data require additional analysis to maximize their usefulness in a MSP framework. These analyses include mapping important biological and ecological areas, human use mapping, and the assessment of possible conflicts and compatibilities among human activities. Second order analysis draws on ecological, human use and environmental data to assess possible conflicts and compatibilities among human activities and the natural environment.
Biological valuation mapping (BVM) is a type of analysis that compiles and summarizes all available biological and ecological information for a study area, and allocates an overall biological value to subzones. BVM provides a baseline map of biological and ecological information and calls attention to areas which have particularly high significance. This informs provision of a higher degree of risk aversion for those areas in a MSP process [1]. Derous et al. [26-28] provide a framework for marine biological valuation based on a review of existing criteria and the consensus reached by a discussion group of experts. This concept was developed and utilized to conduct a biological valuation map of the Belgian part of the North Sea [29]. The Commonwealth of Massachusetts adapted this concept to produce a biological value map for its waters as part of its ocean management plan development process [30].
Human use data that is obtained as part of a MSP process needs to be standardized into spatial layers that can then be overlaid in a GIS to identify existing or potential
[18]. Questionnaire surveys [19] and shipboard surveys [20] have been used to collect information about marine recreational activities.
3. DATA MANAGEMENT AND ANALYSIS
Data management is nearly as important to successful marine spatial planning as are the data themselves. Information and data collected and created in the MSP process may remain underused without careful management. Organizing and managing spatially-explicit databases is typically the most time-consuming aspect of planning activities. Data models and other resources exist to assist practitioners during this phase. A well organized inventory of available data facilitates analysis and subsequent planning steps. It should be refined during the planning process to reflect modified objectives and new sources of information.
A geodatabase or spatial database is designed to store, query, and manipulate geographic information and spatial data. This is the preferred method for managing MSP data specific to a particular area or project. Guidance on the theory and practice of designing geodatabases is provided by Arctur and Zeller [21]. A data model such as ArcMarine provides a basic template to implement a MSP geodatabase, and facilitates the process of extracting, transforming, and loading data. Users can build upon the common marine data types provided by the model to suit the needs of their project [22]. Regional and national initiatives to manage and make accessible coastal and MSP relevant data, utilize spatial data infrastructures (SDI) [23,24]. An SDI is a system or framework that facilitates the exchange of spatial data. Benefits of developing SDIs include improved access to data, reduced duplication of effort in collecting and maintaining data, better availability of data, and interoperability between datasets [24]. Examples of SDI’s for the United States include the NOAA Coastal Services Center - Digital Coast [25] and Multipurpose Marine Cadastre

142
management strategies [33]. They can also be made available online to further facilitate user collaboration. The primary benefits of good DSS are the ability to centralize and manage spatial data, the speed of processing those data, and the ease of use and clarity for the users. Governing bodies must still make decisions among alternative solutions, but these alternatives can be defined and understood more quickly and easily. The need for DSS increases with the number of planning objectives and potential tradeoffs. Conversely, the amount of data, technical challenges, and cost of tool implementation also increase [33].
Development of DSS has been primarily for the purpose of conservation and more specifically, for the sighting of marine reserves. There are multiple examples from the literature that describe the use of DSS to produce and evaluate marine reserve placement scenarios. Airame et al. [34] used a computer-based siting tool (DSS) called SITES to generate potential options for the no-take reserve network in the California Channel Islands. The computer used previously compiled geographic information to create a network of randomly placed reserves and then improved it slightly, searching progressively for layouts that were closer to the specified criteria. The outputs were used as a starting point for discussions about where to implement individual reserves, and what trade-offs would be necessary in different potential network configurations. Other examples demonstrate the effectiveness of combining siting tools and GIS data in designing marine reserves in the Gulf of Mexico [35] and the Florida Keys [36]. These studies make it clear that there are multiple approaches to implementing marine reserves in a particular area. Sarkar et al. [37] provide a review of conservation planning tools that can help inform potential users about their theory and utility. Almost all of the theory for spatial conservation planning has been focused on identifying no-take reserves. This trend has been translated into tool development such that most available
conflicts between human activities. These are complex processes across a variety of scales and to be properly represented should integrate a temporal as well as a spatial component. Unfortunately, little research has been conducted on the social or human geography of the oceans and it may well be necessary for MSP practitioners to utilize some of the techniques presented in the previous section to generate appropriate data. Ehler and Douvere [1] suggest a matrix method for identifying conflicts and compatibilities among existing human activities. The next step would be to integrate this information into maps of human-uses to locate conflict areas and for comparison with other spatial attributes. Spatial analysis of human activities is a critical part of MSP and a proportional amount of effort should be spent on this phase.Assessing conflicts and compatibilities between human activities and the natural environment follows, informed by previous analyses of ecological and human use data. A framework for evaluating the interactive and cumulative impacts of human activities is provided by Halpern et al. [31]. In a related study, Halpern et al. [32] generated a global map of human impacts on marine ecosystems. The maps produced by this research can help to inform MSP efforts, though the scale is likely too broad for most marine planning efforts. The analytical process however, could be adapted to delineate human impacts at a finer scale.
4. DECISION SUPPORT
Another key step in the MSP process is identification and evaluation of alternative management measures. It is in this capacity that interactive decision support systems (DSS) have played an increasingly important role. Decision support systems constitute a class of interactive computer-based information systems that support decision-making activities. Interactive DSS can integrate, share, and contrast many people’s ideas about planning options and help managers and stakeholders to visualize tradeoffs between different

143
has been under constant development over the last quarter of a century [43-46]. During this time the approach has grown to become the most widely applied ecosystem modeling technique [47]. The most recent version of Ecospace (EwE6) incorporates a new optimization module based on a seed cell selection approach, where the spatial cell selection process is influenced by geospatial information [48]. The new sampling procedure may be complementary to the Marxan approach in that Ecospace provides a robust evaluation of ecological processes, including spatial connectivity, due to its trophic modeling foundation. These topics are not fully developed in the Marxan analysis. Christensen et al. [48] advocate that the two approaches, with their unique advantages and limitations, be applied in conjunction. Further research should reveal the efficacy of the updated Ecospace approach and how it compares with the already well established Marxan with Zones.
5. CONCLUSIONS
Technological advances have enabled us to gather and share information about our environment at an unprecedented rate. We use geographic information science to manage and explore this wealth of spatial data. Marine spatial planning is a marriage of geographic information science, environmental management, and land use planning. It is a complex, data intensive process. Spatial analysis lies at the heart of MSP and is surpassed in importance only by stakeholder participation. To a large extent, the success of a MSP effort depends on the abundance and quality of its data, and the capacity for its analysis. Various tools can enable and facilitate different aspects of MSP. It is in the interest of all involved to make the best use of the technology available.
The scope and scale of the data collected for MSP are important considerations, and should as much as possible match the scope of the planning area and the scale of planning units. Given that many
DSS are designed to identify one type of zone (ie. marine reserves). Marine spatial planning seeks to develop multi-use zoning schemes for which a broad range of objectives are represented. Therefore, an optimization tool or framework that allows for multiple zones is necessary.Marxan is the most widely used conservation planning software in the world [38]. It uses the simulated annealing algorithm [39] to minimize the total cost of a reserve system, while achieving a set of conservation goals. Similar to other reserve siting tools it provides two zoning options for each planning unit: reserve and non-reserve. A new extension called Marxan with Zones generalizes this approach by providing multiple zoning options for each planning unit. Each zone then has the option of its own actions, objectives and constraints. The purpose is to minimize total cost while ensuring a variety of (user-defined) conservation and multi-use objectives [38]. Marxan provides a flexible approach capable of incorporating large amounts of data and use categories. It is computationally efficient, and lends itself well to enabling stakeholder involvement in the site selection process [40]. This tool has been used for the design of multiple-use marine parks in both Western Australia and California [41]. Currently Marxan with Zones is being utilized to produce planning scenarios for a MSP effort led by The Nature Conservancy in the Birds Head Seascape, Indonesia [33].
One shortcoming of the Marxan approach is its inability to deal with issues of demographic connectivity. Marxan considers that including into a reserve system a site that contains a particular feature will ensure the persistence of that feature, even though surrounding sites may not have the same protection, and may therefore be ecologically compromised [36]. For this reason, the evaluation of the ecological components and tradeoffs of alternate planning scenarios may be better provided by another freely available DSS, Ecospace [42]. Ecospace is the spatial component of Ecopath which is an ecosystem modeling approach that

144
and the organization and cooperation of stakeholders is paramount. Second, it is an analytical process, and this component is nearly as critical for success. The stakes are high as we increasingly look to the development of ocean and coastal resources to support global consumption of food and energy. Successful management of our marine spaces is less of a choice then a necessity.
6. REFERENCES
[1] C. N. Ehler, and F. Douvere, Marine Spatial Planning: A step-by-step Approach toward Ecosystem-based Management, UNESCO, 2009. [2] F. Douvere, “The importance of marine spatial planning in advancing ecosystem-based sea use management,” Marine Policy, vol. 32, pp. 762-771, 2008.[3] S.R. Palumbi, S.D. Gaines, H. Leslie, and R.R. Warner, “New wave: high-tech tools to help marine reserve research,” Frontiers in Ecology and the Environment, vol. 1, pp. 73-79, 2003. [4] K. St. Martin and M. Hall-Arber, “The missing layer: Geo-technologies, communities, and implications for marine spatial planning,” Marine Policy, vol. 32, pp. 779-786, 2008. [5] NOAA CSC a (n.d.). Multipurpose Marine Cadastre. Retrieved from http://www.csc.noaa.gov/digitalcoast/tools/mmc/index.html[6] NOAA CSC b (n.d.). Digital Coast: Legislative Atlas. Retrieved from http://csc-s-maps-q.csc.noaa.gov/legislativeatlas/index.html[7] R.J. Diaz, M. Solan, and R.M. Valente, “A review of approaches for classifying benthic habitats and evaluating habitat quality,” Journal of Environmental Management, vol. 73, pp. 165-181, 2004.[8] J.A. García-Charton and Á. Pérez-Ruzafa, “Spatial pattern and the habitat structure of a Mediterranean rocky reef fish local assemblage,” Marine Biology, vol. 138, pp. 917-934, 2001. [9] A.M. Friedlander, E.K. Brown, P.L. Jokiel, W.R. Smith, and K.S. Rodgers, “Effects of habitat, wave exposure, and marine protected area status on coral reef fish assemblages in the Hawaiian
MSP projects have a large scope, it can be difficult to obtain datasets that are consistent across the area of interest. This issue is particularly pronounced for ecological and human use data. Though biological valuation provides a method to standardize disparate ecological datasets, a consistent source is more ideal. Remote sensing has increasingly provided us with benthic habitat models, attributes of which can be used as a proxy for ecological “value”. In light of the growing need for MSP, benthic habitat mapping, as well as research to increase understanding of its relationship to marine life, should be prioritized. Unfortunately, no convenient proxy exists for the delineation of human activities in marine spaces, though information about human actions is relatively accessible given a moderate amount of effort. The growing necessity for MSP should provide the incentive.
Geographic information science has provided the tools needed to manage and analyze data for MSP. Practitioners should make full use of this capability and utilize geodatabases to maintain integrity of their spatial data in a consistent and accurate manner. Analytical methods such as biological valuation mapping allow for summarization of a wide range of datasets for major planning components, enabling more efficient comparisons between them. Interactive decision support systems, such as Marxan with Zones, can create alternate spatial management scenarios, along with a clear evaluation of the tradeoffs associated with each, making them available for the consideration of stakeholders. Proper use of these tools can greatly streamline the MSP process and support its iterative nature.
Marine spatial planning represents a new global paradigm in spatial management. Though its roots lie in the familiar realm of land use planning, it presents many unique challenges and opportunities. As the practice of MSP continues, there will be continual insight into its organization, tools, and best practices. First and foremost, MSP is a collaborative process

145
analysis: drawing on fishermen’s knowledge for marine protected are planning in California,” Marine Policy, vol. 28, pp. 335-349, 2004. [19] V. Cummins, J. Gault, C. O’Mahoney, K. Kopke, P. Griffin, E. Walsh, and D. O’Suilleabhain, “Establishing information needs for planning and assessment of recreation activity in the coastal environment: a case study from Cork Harbour, Ireland,” 2008. [20] T. Dalton, R. Thompson, and D. Jin, “Mapping human dimensions in marine spatial planning and management: An example from Narragansett Bay, Rhode Island,” Marine Policy, vol. 34, pp. 309-319, 2010. [21] D. Arctur and M. Zeller, Designing Geodatabases: case studies in GIS data modeling, ESRI Press, Redlands, CA, 2004. [22] D.J. Wright, M.J. Blongewicz, P.N. Halpin, and J. Bremen, Arc Marine: GIS for a Blue Planet, ESRI Press, Redlands, CA, 2007. [23] A. Rajabifard, A. Binns, and I. Williamson, “Administering the Marine Environment the Spatial Dimension,” Journal of Spatial Science, vol. 50, pp. 69-78, Dec. 2005. [24] L. Strain, A. Rajabifard, and I. Williamson, “Marine administration and spatial data infrastructure,” Marine Policy, vol. 30, pp. 431-441, 2006.[25] NOAA CSC c (n.d.). Digital Coast. Retrieved from http://www.csc.noaa.gov/digitalcoast/index.html[26] S. Derous, “Marine biological valuation as a decision support tool for marine management,” Ghent University, 2008. [27] S. Derous, T. Agardy, H. Hillewaert, K. Hostens, G. Jamieson, L. Lieberknecht, J. Mees, I. Moulaert, S. Olenin, D. Paelinckx, M. Rabaut, E. Rachor, J. Roff, E. Stienen, J. vanderWall, V. Lancker, E. Verfaillie, M. Vincx, J. Weslawski, and S. Degraer, “A concept for biological valuation in the marine environment,” Oceanologia, vol. 49, pp. 99-128, 2007. [28] S. Derous, M. Austen, S. Claus, and N. Daan, “Building on the concept of marine biological valuation with respect
archipelago,” Coral Reefs, vol. 22, pp. 291-305, 2003. [10] B. Gratwicke and M.R. Speight, “Effects of habitat complexity on Caribbean marine fish assemblages,” Marine Ecology Progress Series, vol. 292, pp. 301–310, 2005. [11] L.M. Wedding, A.M. Friedlander, M. McGranaghan, R.S. Yost, and M.E. Monaco, “Using bathymetric lidar to define nearshore benthic habitat complexity: Implications for management of reef fish assemblages in Hawaii,” Remote Sensing of Environment, vol. 112, pp. 4159-4165, 2008.[12] S.J. Pittman, J.D. Christensen, C. Caldow, C. Menza, and M.E. Monaco, “Predictive mapping of fish species richness across shallow-water seascapes in the Caribbean,” Ecological Modelling, vol. 204, pp. 9-21, 2007. [13] S.J. Pittman, B.M. Costa, and T.A. Battista, “Using Lidar Bathymetry and Boosted Regression Trees to Predict the Diversity and Abundance of Fish and Corals,” Journal of Coastal Research, pp. 27-38, 2009. [14] B.K. Walker and L.K.B. Jordan, “Relationship of Reef Fish Assemblages and Topographic Complexity on Southeastern Florida Coral Reef Habitats,” Journal of Coastal Research, pp. 39-48, Dec. 2009. [15] C.M. Mills, S.E. Townsend, S. Jenning, P.D. Eastwood, and C.A. Houghton, “Estimating high resolution trawl fishing effort from satellite-based vessel monitoring system data,” ICES Journal of Marine Science, vol. 64, 2007. [16] H.O. Fock, “Fisheries in the context of marine spatial planning: Defining principal areas for fisheries in the German EEZ,” Marine Policy, vol. 32, pp. 728-739, 2008. [17] J. Lee, A.B. South, and S. Jennings, “Developing reliable, repeatable, and accessible methods to provide high-resolution estimates of fishing-effort distributions from vessel monitoring system (VMS) data.,” ICES Journal of Marine Science, vol. 67, 2010. [18] A. Scholz, K. Bonzon, R. Fujita, N. Benjamin, N. Woodling, P. Black, and C. Steinback, “Participatory socioeconomic

146
C.R. Margules, T. Fuller, D.M. Stoms, A. Moffett, K.A. Wilson, K.J. Williams, P.H. Williams, and others, “Biodiversity conservation planning tools: present status and challenges for the future,” Annual Review of Environment and Resources, vol. 31, pp. 123-59, 2006. [38] M.E. Watts, I.R. Ball, R.S. Stewart, C.J. Klein, K. Wilson, C. Steinback, R. Lourival, L. Kircher, and H.P. Possingham, “Marxan with Zones: Software for optimal conservation based land- and sea-use zoning,” Environmental Modelling & Software, vol. 24, pp. 1513-1521, 2009. [39] S. Kirkpatrick, “Optimization by simulated annealing: Quantitative studies,” Journal of Statistical Physics, vol. 34, pp. 975-986, 1984. [40] I.R. Ball, H.P. Possingham, MARXAN (V1.8.2): Marine Reserve Design Using Spatially Explicit Annealing, a Manual, 2000.[41] C.J. Klein, C. Steinback, M. Watts, A.J. Scholz, and H.P. Possingham, “Spatial marine zoning for fisheries and conservation,” Frontiers in Ecology and the Environment e-View, 2009.[42] C. Walters, D. Pauly, and V. Christensen, “Ecospace: Prediction of Mesoscale Spatial Patterns in Trophic Relationships of Exploited Ecosystems, with Emphasis on the Impacts of Marine Protected Areas,” Ecosystems, vol. 2, pp. 539-554, 1999. [43] J.J. Polovina, “Model of a coral reef ecosystem,” Coral Reefs, vol. 3, pp. 1-11, 1984. [44] V. Christensen and D. Pauly, “ECOPATH II -- a software for balancing steady-state ecosystem models and calculating network characteristics,” Ecological Modelling, vol. 61, pp. 169-185, 1992. [45] C. Walters, V. Christensen, and D. Pauly, “Structuring dynamic models of exploited ecosystems from trophic mass-balance assessments,” Reviews in Fish Biology and Fisheries, vol. 7, pp. 139-172, 1997. [46] C. Walters, D. Pauly, V. Christensen, and J.F. Kitchell, “Representing Density Dependent Consequences of Life History Strategies in Aquatic Ecosystems: EcoSim II,” Ecosystems, vol. 3, pp. 70-83, 2000.
to translating it to a practical protocol: Viewpoints derived from a joint ENCORA-MARBEF initiative,” Oceanologia, vol. 49, pp. 579-586, 2007. [29] S. Derous, A Biological Valuation Map for the Belgian Part of the North Sea, Biology Department, University of Ghent, Ghent, Belgium , 2007.[30] T. Callaghan, B. Carlisle, E. Chambliss, K. Ford, T. French, D. Sampson, and P. Vella, Development of an Ecological Valuation Index for the Massachusetts Ocean Management Plan, 2010.[31] B.S. Halpern, K.L. McLeod, A.A. Rosenberg, and L.B. Crowder, “Managing for cumulative impacts in ecosystem-based management through ocean zoning,” Ocean & Coastal Management, vol. 51, pp. 203-211, 2008. [32] B.S. Halpern, S. Walbridge, K.A. Selkoe, C.V. Kappel, F. Micheli, C. D’Agrosa, J.F. Bruno, K.S. Casey, C. Ebert, H.E. Fox, R. Fujita, D. Heinemann, H.S. Lenihan, E.M.P. Madin, M.T. Perry, E.R. Selig, M. Spalding, R. Steneck, and R. Watson, “A Global Map of Human Impact on Marine Ecosystems,” Science, vol. 319, pp. 948-952, 2008. [33] TNC Global Marine Team, “Best Practices for Marine Spatial Planning” In Marine Spatial Planning in Practice: Lessons learned and best practices, TNC Marine Spatial Planning Workshop, Santa Cruz, California, 2009.[34] S. Airamé, J.E. Dugan, K.D. Lafferty, H. Leslie, D.A. M4Ardle, and R.R. Warner, “Applying ecological criteria to marine reserve design: a case study from the California Channel Islands,” Ecological Applications, vol. 13, pp. 170-184, 2003. [35] M.W. Beck and M. Odaya, “Ecoregional planning in marine environments: identifying priority sites for conservation in the northern Gulf of Mexico,” Aquatic Conservation: Marine and Freshwater Ecosystems, vol. 11, pp. 235-242, 2001. [36] H. Leslie, M. Ruckelshaus, I.R. Ball, S. Andelman, and H.P. Possingham, “Using siting algorithms in the design of marine reserve networks,” Ecological Applications, vol. 13, pp. 185-198, 2003. [37] S. Sarkar, R.L. Pressey, D.P. Faith,

147
[47] V. Christensen and C.J. Walters, “Ecopath with Ecosim: methods, capabilities and limitations,” Ecological Modelling, vol. 172, pp. 109-139, 2004. [48] V. Christensen, Z. Ferdaña, and J. Steenbeek, “Spatial optimization of protected area placement incorporating ecological, social and economical criteria,” Ecological Modelling, vol. 220, pp. 2583-2593, 2009.

148
ABSTRACT
Multiple U.S. federal agencies are collaborating to build a marine information system called the Multipurpose Marine Cadastre (MMC). The MMC is a multiagency effort to build a GIS-based marine information system for U.S. waters that provides authoritative geospatial data and supporting information to inform decision-making on a range of ocean issues. At its core, the MMC contains marine cadastral data, which encompass the spatial extent, usage, rights, restrictions, and responsibilities of marine areas, as well as other framework data needed to support planning, management, and conservation of submerged lands and marine spaces. The combination of marine cadastral, biological, geo-physical, ocean use, and legal authority data provides users with the spatial context needed to address issues such as alternative energy siting, aquaculture, submerged lands leasing, marine conservation, and marine spatial planning (MSP). This paper will demonstrate how spatial data are being organized and integrated into the MMC; and how the MMC can be used to support MSP.
Keywords - Marine Cadastre, Marine Spatial Planning, Decision-Support Tools, Marine Spatial Data Infrastructure
1. INTRODUCTION
Human uses of ocean resources are increasing dramatically, outgrowing the laws, policies, and human resources needed to manage them. More frequent conflicts are unavoidable as demands to use the oceans increase for offshore
energy, marine aquaculture, commercial and recreational fishery products, maritime commerce and trade, national security operations, and other activities. At risk is the health of our ocean ecosystems and the benefits they provide to coastal communities and national economies [1].
There is a compelling need to develop the capacity—in data, tools and policies—to manage the full range of current and emerging ocean uses in U.S. waters [1].
Fig. 1 - MMC Web Map Viewer – Southeast Coast [2]
Recent policy developments such as the Energy Policy Act of 2005 have mandated the development of a mapping and information systems to support renewable energy development in U.S. waters. Additionally, the Interim Framework for Effective Coastal and Marine Spatial Planning (2009) calls for a national information management system to inform marine spatial planning. In direct response to the Energy Policy Act of 2005, the U.S. Federal Geographic Data Committee (FGDC) Marine Boundary Working Group developed the Multipurpose Marine Cadastre (MMC). The project is being co-led by the U.S. Minerals Management Service and the National Oceanic and Atmospheric Administration (NOAA). The MMC, through its Web map viewers and
WORKING TOWARD A MULTIPURPOSE MARINE CADASTRE IN THE U.S. TO SUPPORT MARINE SPATIAL PLANNINGD. Stein1, C. Fowler1, C. Taylor2, B. Smith3 & A. Bode4
1 National Oceanic and Atmospheric Administration (NOAA), Coastal Services Center (CSC), Charleston, South Carolina. E-mail: [email protected] U.S. Minerals Management Service, Herndon, Virginia.3 IM Systems Group, Charleston, South Carolina.4 The Baldwin Group, Charleston, South Carolina.
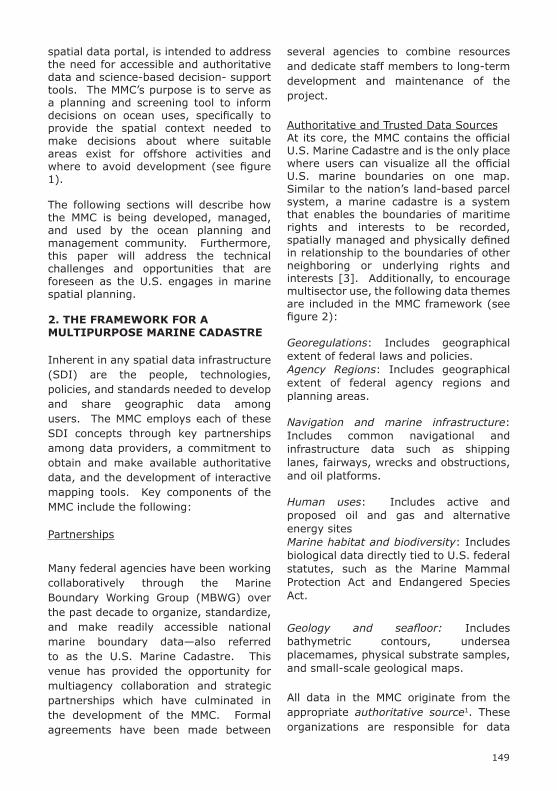
149
several agencies to combine resources and dedicate staff members to long-term development and maintenance of the project.
Authoritative and Trusted Data SourcesAt its core, the MMC contains the official U.S. Marine Cadastre and is the only place where users can visualize all the official U.S. marine boundaries on one map. Similar to the nation’s land-based parcel system, a marine cadastre is a system that enables the boundaries of maritime rights and interests to be recorded, spatially managed and physically defined in relationship to the boundaries of other neighboring or underlying rights and interests [3]. Additionally, to encourage multisector use, the following data themes are included in the MMC framework (see figure 2):
Georegulations: Includes geographical extent of federal laws and policies.Agency Regions: Includes geographical extent of federal agency regions and planning areas.
Navigation and marine infrastructure: Includes common navigational and infrastructure data such as shipping lanes, fairways, wrecks and obstructions, and oil platforms.
Human uses: Includes active and proposed oil and gas and alternative energy sitesMarine habitat and biodiversity: Includes biological data directly tied to U.S. federal statutes, such as the Marine Mammal Protection Act and Endangered Species Act.
Geology and seafloor: Includes bathymetric contours, undersea placemames, physical substrate samples, and small-scale geological maps.
All data in the MMC originate from the appropriate authoritative source1. These organizations are responsible for data
spatial data portal, is intended to address the need for accessible and authoritative data and science-based decision- support tools. The MMC’s purpose is to serve as a planning and screening tool to inform decisions on ocean uses, specifically to provide the spatial context needed to make decisions about where suitable areas exist for offshore activities and where to avoid development (see figure 1).
The following sections will describe how the MMC is being developed, managed, and used by the ocean planning and management community. Furthermore, this paper will address the technical challenges and opportunities that are foreseen as the U.S. engages in marine spatial planning.
2. THE FRAMEWORK FOR A MULTIPURPOSE MARINE CADASTRE
Inherent in any spatial data infrastructure (SDI) are the people, technologies, policies, and standards needed to develop and share geographic data among users. The MMC employs each of these SDI concepts through key partnerships among data providers, a commitment to obtain and make available authoritative data, and the development of interactive mapping tools. Key components of the MMC include the following:
Partnerships
Many federal agencies have been working collaboratively through the Marine Boundary Working Group (MBWG) over the past decade to organize, standardize, and make readily accessible national marine boundary data—also referred to as the U.S. Marine Cadastre. This venue has provided the opportunity for multiagency collaboration and strategic partnerships which have culminated in the development of the MMC. Formal agreements have been made between
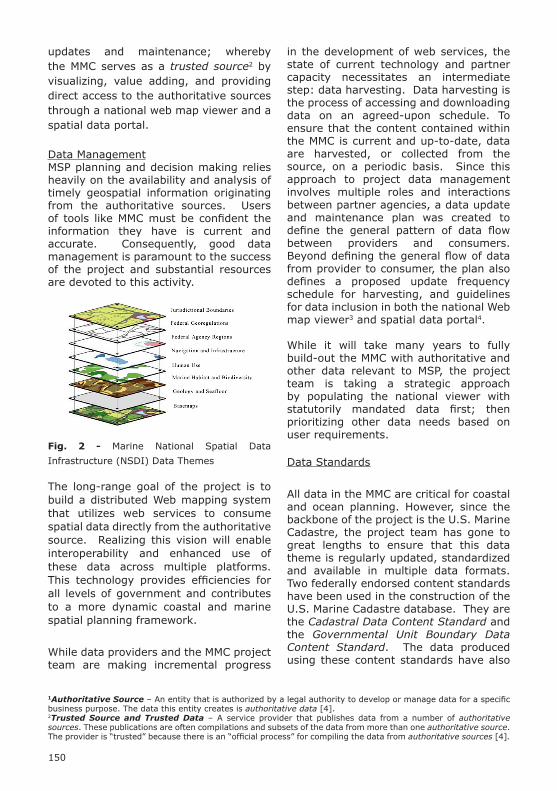
150
in the development of web services, the state of current technology and partner capacity necessitates an intermediate step: data harvesting. Data harvesting is the process of accessing and downloading data on an agreed-upon schedule. To ensure that the content contained within the MMC is current and up-to-date, data are harvested, or collected from the source, on a periodic basis. Since this approach to project data management involves multiple roles and interactions between partner agencies, a data update and maintenance plan was created to define the general pattern of data flow between providers and consumers. Beyond defining the general flow of data from provider to consumer, the plan also defines a proposed update frequency schedule for harvesting, and guidelines for data inclusion in both the national Web map viewer3 and spatial data portal4.
While it will take many years to fully build-out the MMC with authoritative and other data relevant to MSP, the project team is taking a strategic approach by populating the national viewer with statutorily mandated data first; then prioritizing other data needs based on user requirements.
Data Standards
All data in the MMC are critical for coastal and ocean planning. However, since the backbone of the project is the U.S. Marine Cadastre, the project team has gone to great lengths to ensure that this data theme is regularly updated, standardized and available in multiple data formats. Two federally endorsed content standards have been used in the construction of the U.S. Marine Cadastre database. They are the Cadastral Data Content Standard and the Governmental Unit Boundary Data Content Standard. The data produced using these content standards have also
updates and maintenance; whereby the MMC serves as a trusted source2 by visualizing, value adding, and providing direct access to the authoritative sources through a national web map viewer and a spatial data portal.
Data ManagementMSP planning and decision making relies heavily on the availability and analysis of timely geospatial information originating from the authoritative sources. Users of tools like MMC must be confident the information they have is current and accurate. Consequently, good data management is paramount to the success of the project and substantial resources are devoted to this activity.
Fig. 2 - Marine National Spatial Data
Infrastructure (NSDI) Data Themes
The long-range goal of the project is to build a distributed Web mapping system that utilizes web services to consume spatial data directly from the authoritative source. Realizing this vision will enable interoperability and enhanced use of these data across multiple platforms. This technology provides efficiencies for all levels of government and contributes to a more dynamic coastal and marine spatial planning framework.
While data providers and the MMC project team are making incremental progress
1Authoritative Source – An entity that is authorized by a legal authority to develop or manage data for a specific business purpose. The data this entity creates is authoritative data [4].2Trusted Source and Trusted Data – A service provider that publishes data from a number of authoritative sources. These publications are often compilations and subsets of the data from more than one authoritative source. The provider is “trusted” because there is an “official process” for compiling the data from authoritative sources [4].

151
3. THE MULTIPURPOSE MARINE CADASTRE AS A DECISION-SUPPORT TOOL: CASE STUDIES
MMC was designed to be used as a screening tool for offshore activities. Two early implementing agencies are the NOAA National Marine Fisheries Service (NMFS) and the U.S. Minerals Management Service. The NMFS Habitat Conservation Division, located in Santa Rosa, California, is using the MMC to evaluate ocean energy projects in California; and the U.S. Minerals Management Services is using the MMC as a screening tool for renewable energy projects. Additionally, coastal states engaging in MSP efforts are using the MMC’s authoritative data to support their planning efforts and industry is beginning to use the MMC to identify areas suitable for development.
3.1 Permit Review for Hydrokinetic Activities
In evaluating a license application for an ocean energy project in northern California, the NMFS Habitat Conservation Division used the MMC to determine the proximity of the proposed project to a variety of marine species and habitats. The tool is being used to evaluate whether these projects would impact a number of ecological resources, which include designated essential fish habitat and threatened- and endangered-species habitat. The agency’s findings were as follows: the project, as originally proposed, would impact numerous salmonid species and marine mammal species protected under the Endangered Species Act; it would be located within designated essential fish habitat and a habitat area of particular concern; and it would be situated within the migration corridor for several important species that are part of the West Coast commercial salmon fishery. As a result of the findings,
been made available in Open Geospatial Consortium endorsed transfer standards, including Web Map Service5 (WMS) and Keyhole Markup Language (KML).
Additionally, all data contained in the web map viewer includes metadata using the FGDC Content Standard for Digital Geospatial Metadata, as well as data sheets which provide a laypersons overview of each data set.
Data Visualization and Analysis
Data visualization is another key component of the MMC effort. A comprehensive Web mapping application was built on the ESRI ArcServer platform that enables viewing, analysis, and map-making. The Web mapping application was designed to visualize the data in the MMC and is currently being used by regulatory agencies to review permits for offshore activities and by coastal states engaging in coastal and marine spatial planning. Some of the custom functionality includes point, line, and polygon buffering; measuring tools; coordinate input; screen capture; and freehand drawing (see figure 3).
Fig. 3 - MMC Functionality–Coordinate input and Get URL [2]
3National Web Map Viewer – Web map viewer for the MMC that visualizes the U.S. Marine Cadastre and other nationally relevant spatial data. www.csc.noaa.gov/mmc/4Spatial Data Portal – Catalog of spatial data found in the web map viewer, plus additional data sets that are relevant to MSP. The portal refers users directly to the authoritative source. www.csc.noaa.gov/mmc/5Web Map Service – The OpenGIS Web Map Service Interface Standard (WMS) is an HTTP interface for requesting geo-registered map images from one or more distributed geospatial databases.

152
a state, provides landmark reference points, shows potential issues for the siting of renewable energy development, highlights information gaps between federal agencies and state agencies, and provides an interactive tool the task forces can use to discuss and visually illustrate concerns and issues. As more information is added, the utility of the MMC will continue to grow in this area.
3.3 Industry Interaction with the MMC
The Renewable Energy Program of the U.S. Minerals Management Service has introduced the MMC to state and industry planners interested in developing wind and wave energy projects in state and federal offshore waters.
To date, industry has been able to use the MMC to provide an overview of potentially important issues associated with the siting of an offshore wind facility. For instance, a manager within a development company can visualize the location of shipping fairways where development is unlikely and determine the proximity of a proposed development to various resources without engaging technical staff members or vetting contracts. This allows managers to identify if studies may be needed at the onset of a project plan or to quickly determine if the area is not conducive for development. As offshore wind and wave energy development in the U.S. becomes a reality, there will be many opportunities to engage with this sector.
3.4 MMC Use in Incident Response
The MMC is being used by the U.S. Minerals Management Service (MMS) and other federal agencies to view and download authoritative data sets during the Gulf of Mexico oil spill. Specifically, the MMC is being used by MMS, NOAA, and the U.S. Coast Guard to combine map services with other data sets being used by some of the incident response teams. Although the MMC was originally envisioned as a tool for renewable energy
the division created a variety of maps using the MMC-supported information, and four conservation divisions worked cooperatively to provide comments and recommendations in response to the application.
In a similar example, a preliminary permit application was filed for a wave energy project to be located off the California coast. When the NMFS Habitat Conservation Division compared the proposed project area to the data included in the MMC Web map viewer, the agency found that the proposed project footprint extended into a major shipping lane and into two national marine sanctuaries. The U.S. Coast Guard and NOAA’s Office of National Marine Sanctuaries were notified of these potential conflicts. As a result, the NMFS worked cooperatively with NOAA Sanctuaries to write a joint comment letter and motion of intervention. The applicant corrected the coordinates of the proposed project as a result of these documents and comments submitted by the U.S. Coast Guard (see figure 4).
Fig. 4 - Wave Energy Proposals in northern California [2]
3.2 State and Regional Interaction with the MMC
The MMC has recently been utilized as a part of the Minerals Management Service’s state renewable energy task forces largely because of the increase in processing speed of the MMC application. The MMC visually illustrates the offshore areas of
153
Ocean Council, regional planning bodies, and other agencies to develop a regional engagement strategy in keeping with the Interim Framework and any resultant policy.
5. FUTURE DIRECTION
Successful planning and delivery of products and services for MSP requires coordination between national-scale priorities and capabilities and local- and regional-level practitioner needs. The MMC is in a position to bridge the gap between national and regional data priorities by providing authoritative data and technical support to enable regional entities as they engage in MSP. However, a substantial level of effort must be devoted to maintaining existing data and developing new data and products that meet diverse user requirements while building the National Marine Spatial Data Infrastructure. The following are data and tool enhancements that are envisioned as the project moves forward.
As the MMC becomes more widely known, and regional groups and states adopt their own sets of tools, the MMC team envisions that the authoritative data provided within the MMC will be ingested directly into an increasing number of specialized viewers and decision-support tools. To support this use, it will become imperative that existing data be maintained and updated on a frequent basis; that new data be included that enhance regional applications; and that data be provided in multiple formats, including Web Map Services.
In addition to the above data enhancements, MSP will require innovative, intuitive, and flexible decision-support tools enabling ocean managers and stakeholders to visualize and compare the ecological and socioeconomic implications of alternative scenarios for siting ocean uses across areas, depths, and time. These include analytical and visualization tools that enable MSP planners and stakeholders to (1) understand, visualize, and evaluate
planning, it is turning out to be invaluable for oil and gas incident response.
4. IMPLICATIONS FOR MARINE SPATIAL PLANNING
On December 14, 2009, President Obama’s Interagency Ocean Policy Task Force released its Interim Framework for Effective Coastal and Marine Spatial Planning, which offers a comprehensive, integrated approach to planning and managing uses and activities. The Ocean Policy Task Force defines coastal and marine spatial planning as a comprehensive, adaptive, integrated, ecosystem-based, and transparent spatial planning process, based on sound science, for analyzing current and anticipated uses of ocean, coastal, and Great Lakes areas [5]. Under the Framework, coastal and marine spatial planning would be regional in scope, and developed cooperatively among federal, state, tribal, and local authorities, and regional governance structures, with substantial stakeholder and public input [5].
It is envisioned that the MMC could be used in multiple steps of the MSP process, as defined by Ehler and Douvere in their step by step approach to marine spatial planning [6]. Ready access to authoritative foundational data layers is essential for defining and analyzing existing and future conditions, preparing coastal and marine spatial plans, and monitoring and evaluating plan performance. As MSP becomes formalized in the U.S., these process steps will be supported by a host of visualization and analysis tools.
Additionally, the Interim Framework for Effective Coastal and Marine Spatial Planning calls for national CMSP information management system along with centralized or regional portals that connect to CMSP information [5]. The MMC can play a key role by integrating regional data into its map viewers, and conversely, by providing framework data to regional viewers and desktop applications. The MMC project team plans to work closely with the U.S. National

154
AdministrationInfrastructure Requirements,” UN-FIG Conference on Land Tenure and CadastralInfrastructure for Sustainable Development, Melbourne, Australia, (1999).[4] FGDC Subcommittee for Cadastral Data “Authority and Authoritative Sources: Clarification of Terms and Concepts for Cadastral Data Version 1.1,” (2008). [5] The U.S. White House Council for Environmental Quality, Interim Framework for Effective Coastal and Marine Spatial Planning, (2009). [6] Ehler, Charles, and Fanny Douvere, Marine Spatial Planning: a step-by-step approach toward ecosystem-based management, Intergovernmental Oceanographic Commission and Man and the Biosphere Programme, IOC Manual and Guides No. 53, ICAM Dossier No. 6 Paris: UNESCO, (2009).
the consequences of alternative ocean use scenarios under varying environmental and socioeconomic conditions and over multiple time horizons; (2) facilitate compatible uses; and (3) monitor and evaluate effectiveness of coastal and marine spatial plans [1].
To meet the diverse requirements of MSP and renewable energy planning in the U.S., the MMC team will focus on the following future activities:
- Development of tools to enable users to locate optimal marine space for ocean activities based on weighted criteria
- Development of tools to identify all spatial data within a user-defined marine space
- Development of standardized marine base maps to promote consistency in “look and feel” across multiple platforms
- Engagement in cross-sector demonstration projects focused on decision support tools to facilitate the MSP process
It will take a suite of practical decision support tools and authoritative data to meet the objectives of MSP. It is envisioned that through the work of the MMC and the continued development of related decision-support tools, managers and practitioners will have the necessary data and analytical capabilities to foster proactive decision- making in the marine environment.
1. REFERENCES
[1] National Oceanic and Atmospheric Administration (NOAA), “NOAA Internal Reports on Coastal and Marine Spatial Planning,” (2009). [2] National Oceanic and Atmospheric Administration (NOAA) and U.S. Minerals Management Service (MMS), Multipurpose Marine Cadastre Website – http://www.csc.noaa.gov/mmc/ (2010).[3] Robertson B., Benwell G., and Hoogsteden C., “The Marine Resource:

155
ABSTRACT
For geospatial mapping, use of GPS is very common. However, the receivers do not provide adequate information on the condition of the feature. The availability of high resolution GPS enabled camera is allowing users to take photographs of features along with location, date/time and transfer directly into GIS. The photographs are embedded with attribute information allowing scientists to actually review the feature in GIS and Google Earth.
Keywords - GPS, GPS Enabled Camera
1.INTRODUCTION
The primary reason for collecting GPS/GIS data is to find the location (WHERE), date and time (WHEN) and feature and attribute information (WHAT). I call it the 3 W’S of GPS/GIS Data collection. While the latest GPS receivers with memory and appropriate software capture the attribute and feature information, a lot of feature description and information is left to operator’s judgments. For example if you are collecting data on wildlife, the operator may fill in under attribute column “LARGE” for size of animal (See Figure 1). Or data collection operator may say several penguins in the colony but has to write long texts to say how many are standing, how many are sleeping (See Figure 2). Or describe the size of wingspan as medium (See Figure 3).
Now imagine you are the scientist and are viewing this data in the office and trying to interpret how “LARGE” is large, or how many penguins are standing. Of course, you will try to make the best estimate in your mind of the attribute data but what if you had an actual picture
Fig. 1 - Large Size Wildlife Data Collection
Fig. 2 - Populations Data Collection
of the animal? Won’t that make your job much easier and more efficient? After all as they say “A PICTURE IS WORTH A THOUSAND WORDS”. Due to this reason and the availability of low priced digital cameras, GIS professionals are capturing actual pictures of condition of the assets to prove/disprove something or show the actual condition. However in the past, it has been difficult to link the actual photograph to the location data and bring the data into GIS software.
A PICTURE IS WORTH A THOUSAND WORDS-USE OF GPS ENABLED CAMERA IN GEOSPATIAL MAPPINGA. WadwaniApplied Field Data Systems Inc, Houston, TX, USA. E-mail: [email protected].

156
For marine applications one can use this package in studying pollution, wildlife, coastal zones, water quality sampling, bio diversity, ecology, etc. All one has to do is to take the picture and enter the associated attribute data on the picture for further analysis in the office. The data can also be imported into GIS for additional analysis in studying pollution, wildlife, coastal zones, water quality sampling, bio diversity, ecology etc.
Below are some examples of how the actual pictures with GPS and other attributes data will look like.
Fig. 4 - Example of Wildlife Geo-referenced Photo
Over the last few years high resolution digital cameras have been introduced with GPS and Compass options and software to link actual photographs to GIS AND GOOGLE EARTH directly. The position data with date and time is printed on the picture itself. For example, one can embed the species of the penguins, air temperature, water temperature, wind speed, etc. All the data required to study the migration pattern of penguins. So instead of reading notes, the scientist can look at the pictures and analyze the data.
Some of the cameras have video and recording option and capability to add tele-photo lens, The GPS modules are WAAS enabled so in the USA one is able to get 2 meter accuracy. For better accuracy, one can use a standalone GPS receiver offering better accuracy and transfer the position data to the camera via the BLUETOOTH option. These cameras are an excellent tool for handling the 3 W’S of GPS / GIS data collection. With this package one can actually see the condition of the feature on a PC without having to go to the field or ask operators further questions. It allows one to prove or disprove something. This package has become a necessary tool for various MAPPING applications. Fig. 5 - Example of Environmental Monitoring
Geo-referenced Photo
Fig. 3 - Medium Size Wildlife Data Collection

157
The pictures above show the position data, data and time and also OPERATOR NAME (AW), WATER QUALITY (CLEAN OR DIRTY), WHAT IS THE POLLUTANT (HOUSEHOLD / STORM WATER) AND NO ACTION is required. All these attributes are embedded in the picture for anyone in back office to review and make decisions.
2. CONCLUSION
In conclusion the use of GPS enabled camera is increasing rapidly. Several GPS manufacturers are now offering a camera built into their hand held units. The use of this package is rapidly growing in all areas of GIS mapping. With more manufacturers introducing this type of technology, a user has additional wider selection of products and in the long run prices will drop. Over all this technology will very soon become a mandatory tool for GIS mapping.
3. REFERENCES
[1] Ricoh 500 SE Manual 2010

158
ABSTRACT
In coastal area of Poland an Underground Gas Storage in salt domes is planned to be formed. Brine from salt caverns lixiviation is planned to be disposed to the Puck Bay – an inert bay of Baltic Sea included in NATURA 2000 protection network. In the article theoretical considerations about potential environmental impact of brine on natural waters are presented. The influence of salinity increase on organisms living in specific conditions of brackish waters is discussed. In conditions of weak water dynamics the stratification may be formed, creating density gradient by the bottom. In the simultaneous situation of high productivity in surface layer and connected high mineralization of organic matter by the bottom, conditions of oxygen depletion may occur. A threat of hypoxia conditions in the investigated area is identified. A location of a discharge site with higher water dynamics and lesser biological value is proposed.
Index Terms— Brine disposal, brackish waters, coastal eutrofica tion, hypoxia, semi-enclosed bay
1. INTRODUCTION
Brine is a highly salinated water produced during several processes, most often sea water desalination and cavern leaching. This technological effluent, usually produced in great amounts, may be disposed in different ways depending on location of the investment, costs and capabilities. Brine of high quality, highly saturated and with low level of impurities, may be used in chemical processing for Na and Cl or table salt production. However, most often brine is discharged into natural waters: rivers, seas or
oceans, as there is no restrictions about its quality nor brine production efficiency and lowest costs are involved [15]. In the case of introduction of brine into natural receiver the influence of the inflow of highly salinated water on the ecosystem must be known and considered. As there is a number of desalination plants in parts of the world with poor freshwater resources, many research was performed on ecological effects associated with brine discharge from this process [among others: 26, 17, 11]. Research on the environmental impact of brine discharge from lixiviation of underground gas storages were performed by Quintino et al. [21]. The experiment showed that not only increased salinity but also the ionic composition of the brine has influence on organisms living in affected environment. Effects of brine discharge on environment depend not only on the physico-chemical properties of the effluent, but also on hydrographical and biological features of the receiver. Shallow and enclosed bays, especially with abundant in wildlife are recognized as sensitive to brine introduction due to limited water exchange. Locations with the lowest sensitivity – exposed open sea, are characterized by high capability of brine dilution and dispersion, by rapid water exchange and high energy [8, 1]. Brine plume dispersion in natural waters was modeled and described, inter alia, in reports: [6], [10], [12] and articles: [1], [27], experimental observations were presented by Shiau et al. [27]. Zemke et al. [31] described alternative solution of brine disposal in geological structures by injection into deep aquifer. This method and the use of evaporation ponds are useful opportunity in the inland areas [2, 3].
ECOLOGICAL ASPECTS OF BRINE DISCHARGE INTO SHALLOW BRACKISH BAY - A CASE STUDY OF PUCK BAY, BALTIC SEAA. WochnaInstitute of Oceanography, University of Gdansk, Al. Pilsudskiego 46, 81-378 Gdynia, Poland. E-mail: [email protected].

159
for brine spreading are poor, the investor is obliged to discharge brine with the usage of diffusers initially diluting brine with sea water. The diffusing system will consist of 48 nozzles for proper dilution of the highly salinated water outflowing the pipeline, the maximum allowable discharge rate is 300 m3 per hour, what gives 7200 m3 per day. With brine salinity 250 kg/m3, 1800 tons of salt may be daily introduced to the bay. Theoretically brine induced salinity should not exceed 0,5 PSU, as restricted in permission of brine discharge to this protected area, what was confirmed by modeling results [25]. For brine dispersion in Puck Bay periods with different hydrological and meteorological conditions were chosen, however, most of simulations lasted 10 days and none exceeded two months, what seems very short comparing the planned period of discharge – twelve years. The modeling results were not verified as no brine have been introduced to the reservoir.
For cavern lixiviation a treated wastewater will be used, so together with brine some amounts of organic matter will be released. In the neighborhood of pipeline transporting brine, another pipeline, introducing treated wastewater from nearby treatment plant, will be placed (Fig. 1). As outflows of pipelines will be in a distance of 500 meters, the inflow of positive buoyancy wastewater must be considered in the environmental impact analysis. As described later this may significantly influence oxygen conditions in the area of brine discharge.
Fig. 1 - Facilities involved in brine discharge to the Puck Bay.
In Poland there are plans of creating an Underground Gas Storage facility in the coastal region, and brine produced during cavern leaching is going to be discharged to the Puck Bay, a semi-enclosed bay of a Baltic Sea. In twelve years 14,96 million m3 of brine with salinity 250 PSU will be introduced to the bay. Baltic is an example of brackish sea and average salinity in the Puck Bay is on the level of 7,5 PSU [14], more than 30 times lower than brine salinity. Even though degraded by great amounts of nutrient introduced with sewage, rivers and atmospheric deposition in previous century, the environment of this semi enclosed bay is characterized by the highest aquatic biodiversity in Polish coast. Specific hydrological conditions in different parts of the bay allow for coexistence of marine and fresh water organisms in one basin. The state of bay waters improved after building the wastewater treatment plants and discharge of part of treated wastes to the open sea, however, the eutrofication and resulting algae blooms are still every year problem [14].
As Puck Bay is one of the most biologically valuable areas in Poland [9] and is included in EU environmental protection network - Natura 2000, acute investigation of the influence of highly salined water on this important and unique marine life need to be conducted. In the article the impact of increased salinity on organisms living in and around the Puck Bay is discussed and potential threats connected with brine discharge to this specific environment are identified. At the beginning a short description of parameters of discharge is given, at the end brine disposal location with lower environmental risk is proposed and its advantages and disadvantages are presented.
2. BRINE DISCHARGE TO THE PUCK BAY - GENERAL REMARKS
Brine will be discharged to the bottom of the Puck Bay to the depth of 8 meters, 2300 meters from the coast, in the period of twelve years. Since the bay is a sheltered reservoir and natural conditions

160
Fig. 2 - Dependence of number of species on the salinity of water [adopted from 22].
4. POTENTIAL INFLUENCE OF BRINE ON WATER CONDITIONS - FORMATION OF STRATIFICATION
Due to higher density than naturally occurring waters brine, even diluted, will follow towards the bottom. In the conditions of weak water dynamic, brine spreading and mixing may be low enough for stratification formation. Accumulation of brine by the bottom and resulting stratification may have severe consequences as it limits vertical mass and gas exchange between water if difference of density is high enough. Stratification forming and consequent hypoxia effect resulting from brine discharge to shallow bay was investigated by Hodges et al. [10] and Ritter and Monatagna [23, 24]. From the field studies Hodges et al. [10] concluded that a thin-layer stratification can occur in a shallow embayment (3-5 meters), which is generally vertically mixed, and may induce hypoxia. Hypoxia events are determined by the length of time sediments are isolated from the ambient water by the saline layer. The scheme of the processes that may occur when high-salinity water is introduced into a shallow embayment is illustrated in figure 3. Described hypoxic events were intermittent, usually overnight or early morning, local and persisted rather for hours than days or weeks. It
3. INFLUENCE OF SALINITY INCREASE ON PUCK BAY ECOSYSTEM
Waters of the Puck Bay are characterized by low salinity, from 3.84 to 8.00 PSU, what creates specific conditions for organisms. The number of species occurring in this range of water salinity is much lower comparing to ocean and fresh waters (Fig. 2). The specific ecosystem of the Puck Bay is represented by species originating from ocean waters that were able to adopt to low salinity, freshwater and migratory species [14]. The salinity rise due to brine, if on the planned level (0,5 PSU), should not have significant influence on organisms of the Puck Bay. There may be some changes in species composition but probably they will be in the range of natural variations, alike the primary production of phytoplankton [13]. The occurrence of freshwater species is connected with inner Puck Bay and with river inflow areas where the brine effects should be the least. Still, no laboratory experiments were performed, and effect of a continuous exposure of organisms living in Puck Bay to changed conditions is unknown. The laboratory research should give the knowledge of salinity tolerance limits of organisms of the bay and investigate the influence of the ionic composition of the brine, that slightly differs from the bay waters. Such studies would enable proper predictions of changes in marine life of the Puck Bay, accurate assessment of the risk to this ecosystem. The Puck Bay and its surrounding are very important for birds and an indirect effect of brine on birds by changes on their food base (fishes, benthos, underwater plants) should be considered. Nevertheless, if the influence on marine organisms will not be critical this indirect influence should be insignificant [13].

161
discharge that may limit vertical mixing and prevent dissolved oxygen from penetration through the water column what will enhance depletion of available dissolved oxygen.
Crucial in this consideration is whether shallow Puck Bay would remain well-mixed in the presence of a brine discharge. The modeled salinity increase (0,5 PSU) is much lower than the one in mentioned research [10], however the depth at which brine will be released is bigger. The model results show that there may be a situation when brine will remain by the bottom, with salinity differences between bottom and surface on below 1 PSU. Effler et al. [7] documented the river salinity stratification induced by the ionic pollution related impacts on dissolved oxygen. During the inflow of ionic pollution the salinity difference between upper and lower layer was 1,9 PSU and severe DO depletion in the lower river layer occurred. Few years after the inflow of pollution finished the salinity gradient remained at the level of 0,4 PSU and was high enough for stratification formation and oxygen concentration depletion even to 1 mg/L. Hypoxia conditions occurred only during low flow of the river and had shorter extend, but was not eliminated [7].
As hypoxia creates physiological stress that is poorly tolerated by most animals and may significantly decrease quality of biological conditions in Puck Bay, the dissolved oxygen content of bottom waters should be constantly monitored during brine discharge, at least in the period of the biggest risk of oxygen depletion occurrence. According to observations the oxygen saturation of the Puck Bay waters is very unstable [5]. Authors suggests that the oxygen balance is seriously disturbed. On the shore the situation is most unstable: during summer intense phytoplankton blooms occur in the pelagic layer and oxidation of the deposited organic matter occurs. The salinity stratification limiting the transport of oxygen to bottom layers may intensify problems with oxygen balance.
was indicated in that under well-mixed conditions, development of low oxygen conditions is generally attributable to excessive nutrient loading.
The phenomenon of salinity stratifications and resulting problem with dissolved oxygen by the bottom was widely described in the estuary areas, where fresh, usually nutrients rich waters interact with saline ocean waters [16, 29, 19]. Usually the bottom hypoxia and anoxia occurs in summer due to additional, except saline, thermal stratification [30, 28] and excessive primary production – algae blooms [18, 4], even in shallow areas potentially well mixed.
In case of brine discharge to the Puck Bay it is crucial that in a distance of 500 meters from the end of discharging pipeline there will be a wastewater released. A great amount of nutrients to the surface waters will be introduced in the area around the brine discharge. This will lead to high primary production (algae blooms) and high biomass of chlorophyll A in the late spring and summer and consequently high amounts of organic matter by the bottom.
Fig. 3 - Conceptual development of thin-layer gravity currents and hypoxia in shallow estuary. Development or avoidance of hypoxia depends on wind-induced mixing [10].
The period of higher vegetation corresponds with weak winds and small water dynamic, what will result in weak conditions of brine spreading. Phytoplankton may cause the dissolved oxygen supersaturation in surface layer (enhanced bubble formation and release of oxygen into the air), but in deeper parts of the basin a lot of oxygen will be needed for mineralization processes of the great amount of organic matter. Brine

162
Fig. 4 - Near bottom current in Polish marine areas. The circle marks the proposed brine discharge site [9].
6. SUMMARY
In Poland 3,6 million tons of salt form underground caverns in the form of brine will be introduced to the Puck Bay - shallow enclosed part of the Baltic Sea with brackish waters. This basin, the most biologically significant on Polish coast, is included in the EU protection net NATURA 2000. Brine will be introduced in the bottom of the bay by the diffusing system initially diluting highly salinated with natural waters. The restrictions were imposed that the salinity increase cannot exceed 0,5 PSU, what will probably have insignificant influence on organisms in brackish water ecosystem. Nevertheless in shallow and semi-enclosed bay, in periods of low water dynamics a stratification may be formed due to accumulation of higher density water by the bottom. The co-existence of excessive algae blooms at the surface at the same time may result in oxygen depletion in the bottom layer, as high amounts of oxygen used in the intensive organic matter mineralization will not be supplied from atmosphere due to limitations of gas exchange through layer of the density gradient [10]. As in a 500 meter distance, treated wastewater rich in nutrients will be released, the spring and summer algae bloom will probably occur in surface layer in the brine discharge site. The oxygen depletion may have severe consequences to aquatic
The oxygen measurements should be performed rather in the distance of few kilometers around the diffusing system, as brine is going to be oxygenated so at the beginning there will be enough of oxygen for organic matter mineralization.
5. BRINE DISCHARGE TO THE OPEN BALTIC SEA
More environmentally safe solution would be to discharge brine to the less sensitive site than the inert, biologically important bay. The exposed open sea site on Polish coast was proposed by the president of Section of Sea Ecology of Ecological Committee of PAS, prof. J.M. Węsławski. This location is presented on the figure 4 and marked with a circle. The velocity of currents in this region is much higher than in Puck Bay, and generally this region is one of the most dynamic along the coast [9]. This solution would introduce brine into a big reservoir of the south Baltic Sea, and the impact of brine on the natural environment would be safe and insignificant. Moreover disturbance of waters and habitats that protected by Polish law (Seaside Landscape Park) and European environmental protection net Natura2000 would be eliminated. On the other hand this would require building over a 20 kilometer long pipeline through the Seaside Landscape Park and increase significantly the costs of the investment, that is why this alternative was rejected by the investor [raport]. In such circumstances precise and objective monitoring of the state of Puck Bay waters and life should be conducted, and any possible means of minimizing environmental risk should be undertaken.

163
Energy, Office of Petroleum Reserves, Washington, DC, 2006[7] S.W. Effler, S.M. Doerr, E.M. Owens, “Effect of reduced salinity input on river stratification and dissolved oxygen”, Water, Air, and Soil Pollution 95, 45–58, 1997[8] R. Einav, K. Harussi, D. Perry, “The footprint of the desalination processes on the environment”, Desalination, Vol. 152, pp. 141–154, 2002[9] G. Gic-Grusza, L. Kryla-Straszewska, J. Urbański, J. Warzocha, J.M. Węsławski, Atlas of Polish marine area bottom habitats. Environmental valorisation of marine habitats, Broker-Innowacji, 2009, Gdynia[10] B.R. Hodges, P.S. Kulis, C.H. David, Desalination brine discharge model. Final report, Center for Research in Water Resources, University of Texas at Austin, 2006[11] Th. Hopner and J. Windelberg, “Elements of environmental impact studies on coastal desalination plants”, Desalination, Vol. 108, pp.11–18, 1996 [12] S. A. Jenkins and J. Wasyl, Oceanographic Consideration for Desalination plants in Southern California Coastal Waters, Scripps Institution of Oceanography Technical Report No. 54., Marine Physical Laboratory, University of California, San Diego, 2005[13] L. Kruk - Dowigiałło, J. Nowacki, A.Osowiecki, R Opioła., T. Wandzel, R. Dubrawski, P. Brzeska,”Supplement to the Report on the Environmental Impact Assessment of the construction of Underground Gas Storage Kosakow”, Arch. of Marine Institute, Gdańsk, 2008 (in Polish)[14] K. Korzeniewski, The Puck Bay, UG, 1993, Gdańsk (in Polish)[15] A. Kunstman, K. Poborska-Młynarska, K. Urbańczyk, “Construction of storage caverns in salt deposits-geological and mining aspects”, Prz. Geol., Vol. 57, No. 9,pp. 819-828, 2009 (in Polish)[16] A.Y. Kuo, B. J. Neilson, “Hypoxia and salinity in Virginia” Estuaries 10, 277–283, 1987[17] S. Lattemann and Th. Hopner , “Environmental impact and impact assessment of seawater desalination”,
bottom life, so the constant monitoring of dissolved oxygen level in the period of vegetation (V-X) is needed. The constant observations of salinity increase will enable to stop the brine discharge if it would exceed allowable value of 0,5 PSU in respect to natural salinity changes.
The safest way of brine discharge to natural waters in Poland would a release to the open sea, where high dynamics and no protected areas are present. This variant is however connected with higher costs as over 20 kilometers long pipeline would have to transport brine. Considering high storing potential of salt deposits in the region, and probable future investments this solution may appear as the best and worth bearing additional costs.
7. REFERENCES
[1] I. Alameddine, M. El-Fadel, “Brine discharge from desalination plants: a modeling approach to an optimized outfall design”, Desalination, Vol. 214, pp. 241-260, 2007[2] M. Ahmed ,W. H. Shayya, D. Hoey and J. Al-Handaly, “Brine Disposal from Inland Desalination Plants. Research Needs Assessment”, Water International, Vol. 27, Issue 2, pp. 194 – 201, June 2002[3] M. Ahmed ,W. H. Shayya, D. Hoey, A. Maendran, R. Morris and J. Al-Handaly, “Use of evaporation ponds for brine disposal in desalination plants”, Desalination, Vol.130, Issue 2, pp. 155-168, 2000[4] D.L. Bergondo, D.R. Kester, H.E. Stoffel, W.L. Woods, “Time – series observation during the Low Sub-surface Oxygen Events in Narragansett Bay during summer 2001”, MarineChemistry, 97, 90-103, 2005[5] Bolałek J., Falkowska L., Korzeniewski K., Oxygen conditions [in] The Puck Bay, ed. Korzeniewski K., UG, 1993, Gdańsk (in Polish)[6] Brine Plume Modeling of Strategic Petroleum Reserve Expansion Sites, Appendix C, [in] Site Selection for the Expansion of the Strategic Petroleum Reserve, Final Environmental Impact Statement, V ol. 2, U.S. Department of

164
666(10), 1995[29] D.E. Virginia, J.K. Summers, J.M. Macauley, “Dissolved oxygen conditions in Northern Gulf of Mexico Estuaries”, Environ. Monitoring and Assessment, 57, 1–20,1999[30] B. L. Welsh, F. C. Eller, “Mechanisms Controlling Summertime Oxygen Depletion in Western Long Island Sound”,Estuaries, Vol. 14, No. 3, p. 265-278, 1991[31] J. Zemke, M. St wer, M. Borgmeier, Injection of Brine from Cavern Leaching into Deep Saline Aquifers: Long-Term Experiences in Modeling and Reservoir Survey, [in] Underground injection science and technology, Vol. 52, C-F. Tsang and J.A. Apps, Developments in Water Science, Elsevier Science, 2006
Desalination, Vol. 220, pp. 1–15, 2008[18] J. Lin, H. Xu, C. Cudaback, D. Wang, “Inter-annual variability of hypoxic conditions in a shallow estuary”, J. Marine Syst., 73, 169–184, 2008[19] N. P. Nezlin , K. Kamer , J. Hyde , E. D. Stein, “Dissolved oxygen dynamics in a eutrophic estuary, Upper Newport Bay,California”, Estuarine, Coastal and Shelf Science, 82 (2009) 139–151[20] A. Purnama, H.H. Al-Barwani, M. Al-Lawatia, “Modeling dispersion of brine waste discharges from a coastal desalination plant”, Desalination, Vol. 155, pp. 41–47, 2003[21] V. Quintino, A. M. Rodrigues, R. Freitas and A. Re, “Experimental biological effects assessment associated with on-shore brine discharge from the creation of gas storage caverns”, Estuarine, Coastal and Shelf Science, Vol. 79, pp. 525–532, 2008[22] A. Remane, “Die Brackwasserfauna”, Zoologischer Anzeiger (Supplement),7, 34–74, 1934[23] C. Ritter, P. A. Montagna, Cause and effect of hypoxia (low oxygen) in Corpus Christi Bay, Texas, Technical Report 2001-001, University of Texas at Austin, Marine Science Institute, 2001[24] C. Ritter, P. A. Montagna, “Seasonal hypoxia and models of benthic response in a Texas estuary”, Estuaries, Vol. 22(3), pp. 7-20, 1999[25] M. Robakiewicz, “Spreading of the brine discharged to the Puck Bay”, Inżynieria Morska i Geotechnika, No. 4/2009, pp. 250-261, 2009 (in Polish)[26] J.J. Sadhwani, J.M. Veza, C. Santana, “Case studies on environmental impact of seawater desalination”, Desalination, Vol. 185, pp. 1–8, 2005[27] B.S. Shiau, C.L. Yang and B.J. Tsai., “Experimental Observations on the Submerged Discharge of Brine into Coastal Water in Flowing Current”, Journal of Coastal Research, SI 50 Proceedings of the 9th International Coastal Symposium, pp. 789 – 793, 2007[28] A. Valle-Levinson, R.E. Wilson, R.L. Swanson, “Physical mechanisms leading to hypoxia and anoxia in Western Long Island Sound”, Environment International, Vol. 21, No. 5, 657-


166