geo-engineering problems in tunnelling through …
TRANSCRIPT
GEO-ENGINEERING PROBLEMS IN TUNNELLING THROUGH PANJAL
VOLCANICS, J & K
DISSERTATION
sutMfTreo fon PAMTIAL FULFILMENT OF THE REQUIREMCNTS FOR THE DEGflEE OF
Mnitti of ^^iloiSopiip in
Geology
IMRAN SAYEED
DEPARTMENT OF GEOLOGY ALIGARH MUSLIM UNIVERSITY
ALIGARH (INDIA)
1995

DS2602
iTftB ^9^b
»•« ^ ' ' '' PUlJlf

C E R T I F I C A T E
This is to certiiy that the thesis entitled "Geo-engineering Problems in Tunnelling
through Panjal Volcanics, J & K" submitted by Mr, Iniran Sayeed for the awaid of degree
of Master of Philosophy in Geology fi'om^Aligarh Muslinf University. Aligarh is a record of
bonafide work earned out by the candidate under our guidance at the Depaitmeut of Geoiogx.
AMU. Aligarh and at National Hydroelectric Power Coi"poration. New Delhi / Faridabad
To the best of our biowiedge, contents of the above thesis have not been submitted to any
other institute for the award of the degree.
(M.R. BANDYOPADHYAY) (NOiNlAN GHAM) Ex-Chief (Geology) Professor of Geology National Hydroelectric Power Coiporation Aligarh Mushin Universit} New Delhi / Faridabad. Aligarh. Co-Supervisor Supervisor

DEDICATED TO MY PARENTS
No,
1 .
1 . 1
2 .
2 . 1
2 . 2
2 . 3
2 . 4
2 . 4 . 1
2 . 4 . 2
2 . 4 . 3
3 .
3 . 1
3 . 1 . 1
3 . 1 . 2
3 . 2
3 . 3
3 . 3 . 1
Description
Acknowledgement
List of Tables
List of Plates
List of Photographs
List of Abbreviations
Preface
Introduction
Aims and Objectives
Geology of the Area
Geomorphology
Climate and Vegetation
Previous Works & Stratigraphy
Regional Structure
Murree Thrust
Panjal Thrust
Chullan Thrust
Field Investigations and Collection of Data
Engineering Geological Mapping
General
Study Area
Exploratory Drifting or Test Tunnelling
Exploratory Drilling
Rock Quality Designation (ROD)
Page No
i
iii
V
vi
vii
ix
1
8
12
12
14
15
23
24
24
25
32
32
32
34
36
39
42

3.4
3.4.1
3.4.2
4.
4.1
4.1.1
4.1.2
4.1.3
4.1.3.1
4.1.4
5.
5.1
5.2
5.2.1
5.2.2
5.3
5.4
5.4.1
5.4.2
5.5
5.6
6.
6.1
6.1.1
Presentation of Data 44
3-D Geological Maps of Drifts 44 and Tunnel
Geological Logs of Drill Holes 45
Engineering Properties 60
Strength and other Properties 60 of Rocks
Point Load Tests 60
Schmidt Hammer 63
Sonic Viewer 64
Field Seismic Velocities 65
Measurement of Insitu Stresses 66
Petrography 77
Megascopic Study (Group - I) 7 8
Microscopic Study (Group - I) 78
Texture 78
Mineralogy 7 9
Megascopic Study (Group - II) 80
Microscopic Study (Group - II) 80
Texture 80
Mineralogy 80
Metamorphism 81
Petrography vs Rock Strength 82
Rock Mass Classification 88 and Support Systems
Rock Mass Classification 88
Terzaghi's Rock Load 8 8 Classification

S.I.2 Geomechanics Classification (RMR) 92
6.1.2.1 Application of RMR System 94
6.1.3 Q-System 96
6.1.3.1 Application of Q-System 97
6.2 The Support System 98
6.3 Tunnelling Methodology 99
7. Conclusions 138
Bibliography 14 3

(i)
ACKNOWLEDGEMENT
I wish to record a deep sense of gratitude to my
Supervisor, Professor Noman Ghani for his sagacious guidance
and inminutable inspiration during the course of this study.
His easy accessibility and apt handling of different
problems has immensely helped in smooth completion of the
dissertation.
I am beholden to my Co-Supervisor, Mr. M.R.
Bandyopadhyay for guidance emanating from his long
experience. His prompt attention to various issues has been
of great benefit.
I am grateful to Professor Iqbaluddin, Chairman,
Department of Geology, AMU for his encouragement and kind
permission to use the facilities of the department.
I would like to thank NHPC Management for the kind
permission to undertake research work and utilize the
geological data generated in the field. Messers SWECO of
Sweden have readily confirmed that the geological documents
of the area can be used for research work which is also
acknowledged.
I am also thankful to Mr. A.K. Sood, Senior Manager,
Incharge (Geology), National Hydroelectric Power Corporation
for the encouragement and advice. Thanks are also due to

(ii)
Messers A.S. Walvekar and U.V. Hegde for their succour. I
am indebted to Dr. Gopal Dhawan for his constant
encouragement and useful suggestions.
Messers A. Sen, N.K. Mathur and S.L. Kapil have helped
in conducting tests in the geotechnical laboratory which is
acknowledged. My other colleagues have also given full
co-operation.
I am thankful to the Technical Staff of the Department
of Geology, AMU for their assistance in preparation of the
thesis.
Finally, I should not fail to acknowledge the
forbearance and encouragement of my family which has largely
been instrumental in completing the task.
s
(IMRAN SAYEED)

(iii)
List of Tables
No. Description Page No.
Appendix 1 10
Appendix 2 11
2.1 A Comparision of Stratiraphic 26 Succession by Lydekker & Wadia
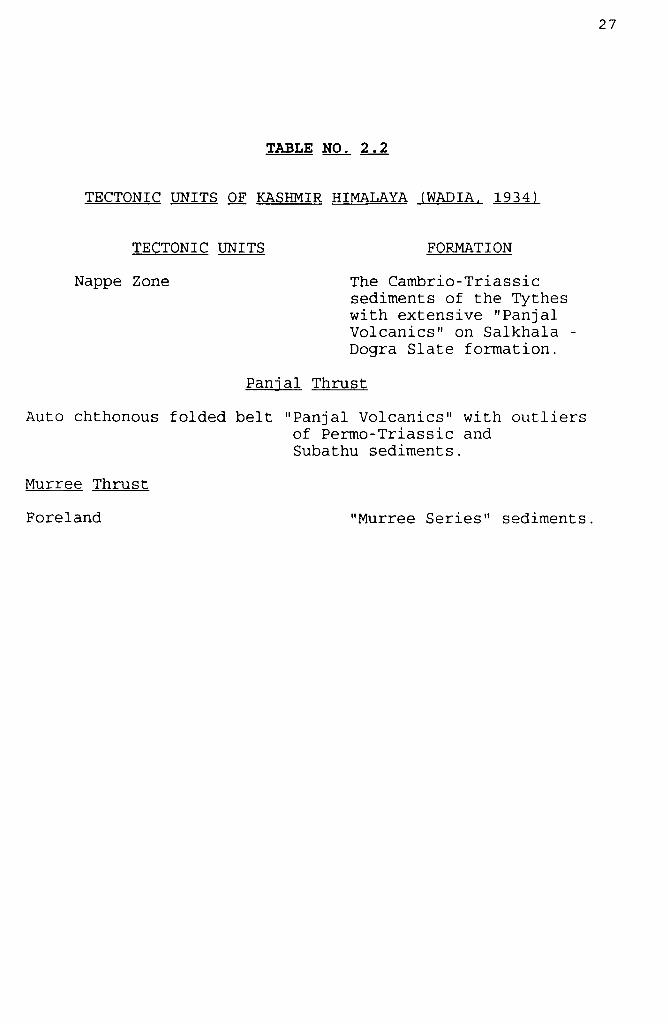
2.2 Tectonic Units of Kashmir Himalaya 27 (Wadia 1934)
2.3 Geological Succession in Uri Area 28 (Tikku & Dhar, 1982)
2.4 Geological Succession in Buniyar- 29 Uri
3.1 Recommended Scales for Geological 46 Mapping (U/G Works)
3.2 Sizes of Cores and Drilling 47 Accessories
3.3 Drill Holes in Power House Area 48
4.1 UCS by Bemek Rock Tester 69
4.2 UCS by Schmidt Hammer 70
4.3 Rock Mass Structure Types & 71 Intactness
4.4 Rock Mass Structure-Characteristics 72
5.1 to 5.8 Point Count Analyses 84 to 87
6.i Terzaghi's Rock Load Classification 105
6.2 Terzaghi's Rock Load Values 106 for Meta-Volcanics in Rajarwani
6.3 Geomechanics Classification (RMR ) 107
6.4 Effect of Dip & Strike in Tunnelling 106
6.5 Deere's Classification for Joint Sp. 108
6.6 to 6.11 Calculation of RMR in Cross-cuts 109 to 114

(iv)
6.12 to 6.17 Calculation of RMR in SPH-3 115 to 120
6.18 Rock Classes at Uri Project 121
6.19 Q- System 122
6.20 to 6.22 Calculation of Q-Value in Cross-cuts 123 to 125
6.23 RMR vs Q values 126
6.24 Geomechanics Classification Guide 127 for Excavation and Support
6.25 Rock Support for RMR Classes at 128 Uri Project.

(v)
List of Plates
No. Description Page No
2.1 Geological Sketch Map of Kashmir 30 Himalaya
2.2 Geological Map and Section of 31 Uri Project
3.1 Geolgical Map of Rajarwani Area 49
3.2 3-D Geological Map of Cross-cuts 50
3.3 Pole Plot of 206 In Meta-Volcanics 52 in Rajawani Area
3.4 Contours of Pole Concentrations 52 Determined from Plate 3.2
3.5 Pole Plot of 76 Discontinuities 53 in Meta-Volcanics in Cross-Cuts
3.6 Contours of Pole Concentrations 54 Determined from Plate 3.5
3.7 Drill Hole Log (RLCC-1) 55
3.8 Drill Hole Log (SPH-3) 56
3.9 Rock Classification and 57 Geological Mapping Format
4.1 Correction Chart for Is 50 73
4.2 Relationship of Schmidt No. & UCS 74
6.1 Correlation Between Q and RMR 129
6.2 Correlation Between Q and RMR 130 for Meta-Volcanics in Rajarwani
6.3 Stability Analysis-Rajarwani Drift 131
6.4 Stability Analysis-Cross-cuts 132
6.5 Permanent Support Recommendations 133 Based on Q-Value
6.6 Special Support Measures 134

(vi)
List of Photographs
No. Description Page No
3.1 Exposures of Meta-Volcanics 58
3.2 & 3.3 Portal of Access Tunnel to Power 59
House
3.4 Drill Cores kept in Core Boxes 59A
4.1 Bemek Rock Tester with Microprocessor 75
4.2 Schmidt Hammer with Cradle 75
4.3 Sonic Viewer with Printout 76 4.4 Carl Zeiss Microscope with Swift 76
Point Counter
6.1 Marking of Tunnel Periphery 135
6.2 Application of Shotcrete by Robot Arm 135
6.3 & 6.4 Installation of Swellex Bolts 136
6.5 Installation of Grouted Bolts 137

(vii)
List of Abbreviations
Alt. A.P. Avg. Ch. Conf. Cm. Deg. Dev. Dis. Discont. DPR El. ESE EW Geol. Geotech. GM >
G.S.I. G.S.U. H.P. HEP I.A.E.G.
I.S.R.M.T.T.
J. J&K Kar. Km. K.T.H. <
M,m Mah. M.B.T. Mech. Mem. mm. Mpa. MW Nat. NE N.G.I. NNE NHIA N.H.P.C.
No. NW
= = = = = —
= =
= = -— = = = = = = = = = =
—
—
= = — = = = = = --
= —
= = ---— =
—
= —
Altitude Andhra Pradesh Anerage Chainage Conference Centimeter Degree Development Dispersion Discontinuity, Discontinuities Detailed Project Report Elevation East South East East West Geological Geotechnical Ground Mass Greater than Geological Survey of India Geo Structural Unit Himachal Pradesh Hydroelectric Project International Association of Engineeing Geology Indian Society of Rock Mechanics and
Tunnelling Technology Journal Jammu and Kashmir Karnataka Kilometer Kungl Tekniska Hogskolan Less than Metre for Altitude, for distance Maharashtra Main Boundary Fault Mechanical Memoir Millimeter Megapascal Mega Watts National North East Norwegian Geotechnical Institute North North East National Highway lA
National Hydroelectric Power Corporation Number North West
(viii)
PB/PC = Porphyroblasts/Phenocrysts P.O.K. = Pakistan Occupied Kashmir pp = Particular Pages Proc, Procd. - Proceedings Res. = Resource R.M.R. - Rock Mass Rating R.Q.D. = Rock Quality Designation SE = South East Sem. = Seminar SI. = Slight SSW ^ South South West Strat. = Stratigraphy Sue. = Succession SW = South West Symp. - Symposium UCS = Uniaxial Compressive Strength UE = Undulatory Extinction U.P. = Uttar Pradesh V.Closely = Very Closely Weath. = Weathered WNW = West North West.

(ix)
PREFACE
The author is working with National Hydroelectric Power
Corporation headquartered at Faridabad (Haryana). The views
expressed in this dissertation are his own and not
necessarily of NHPC Management.
(IMRAN SAYSED)

CHAPTER I
INTRODUCTION
1. INTRODUCTION:
Man has been engaged in digging excavations since pre
historic times in search of minerals. The maiden efforts at
mining were unplanned and haphazard often resulting in
serious accidents. With the introduction of blasting
techniques and mechanisation, though slowly in the
beginning, deep seated large ore bodies could be exploited.
The mine openings were of temporary type initially, but
increased activity required a huge haulage system and more
equipment. Now, the underground mines were planned and the
concept of more stable openings came to be accepted
requiring underground design and rock support. Subsequently,
tunnelling works for communcations, hydroelectric power
plants having a healthucomponent of underground works and
underground storage caverns for oil and gas storage were
developed. However, it is ironical that most of the
literature on the subject of underground excavation
techniques, rock mass classifications, rock support, and
design is from river valley projects rather than from mining
case histories.
World's first underground power station was built in
the year 1899 on Snoqualmine Falls, Washington (U.S.A.) with
the object of avoiding freezing spray from the falls (Anon,
1951, cited from Hock & Brown, 1980) .
Now, underground excavation and rock support have come
to be recognised as full-fledged specialisation of
engineering geology and geotechnics. A survey of its
progress through 19th and 20th centuries reveals that at the
outset there was very little input of geology in planning,
design and construction of large engineering projects. It
was not until the failure of St. Francis dam in California
(U.S.A.) in 1928 that all civil engineers woke up to take
note of the importance of geology in engineering projects.
It was felt that a detailed study of the geological environ
ment around civil engineering structures was essential and
thus the subject of "Engineering Geology" was born (Krynine
and Judd, 1957). It was introduced as a subject in some
universities since, 1920's (Muller, 1988).
Engineering geology as it stands today, may be defined
as a branch of human knowledge that uses geologic
information combined with practice and experience to assist
the engineer in the solution of problems in which such
knowledge may be applicable. Engineering geology differs
from geology primarily in scope. When reinforced with useful
information from other earth sciences and adequate notions
of engineering, it is gradually being transformed into a new
branch of human knowledge - Geotechnics (Krynine and Judd,
1957). It is an established practice now to conduct a thor
ough geotechnical investigation before embarking upon plan-
ning, design and construction of large engineering struc
tures such as dams, tunnels, underground caverns, bridges
etc.
Indian history reveals that rock cut structures date
back to 3rd century B.C. The World famous rock cut temples
of Ajanta and Ellora in highly resistant Deccan Basalt is an
ample testimony. One of the underground chambers in Ajanta
caves measures 12 x 15 m and in Ellora caves, the Chaotya
Hall measures 26 x 14 x 10 m.
A list of important tunnels in J&K is given as appendix
1 at end of this chapter.
Underground Power Stations of India
In India, a number of power stations have been con
structed or are under planning or under construction as
listed in appendix 2. The table reveals that two out of
eleven are in operational stage, six out of ten in construc
tion stage and all except two in planning stage are located
in the Himalayas. This is not surprising because a major
portion of hydroelectric potential lies in the Himalaya due
to their rugged topography and perennial drainage coming
from heavy precipitation and a snow melt. Most of the under
ground power stations involve considerable tunnelling work.
Some Indian Case Histories
The Kolar Gold Fields, mined to a depth of 3 km have
experienced rock bursts, some of great severity. A National
Institute of Rock Mechanics was established there for

optimization of design and support of underground openings.
The Central Mining Research Station, Dhanbad is the National
Laboratory engaged in research and development activities in
mining.
India is also on the anvil of constructing underground
oil storage rock caverns at Uran near Bombay. Underground
repositories for nuclear waste are being constructed in many
advanced countries. In India too, it is planned to build
repositories which shall be 500-800 m below the ground in
massive water tight granite or gniess. As a result of ever
increasing environmental awareness, there is demand to built
underground structures - e.g. proposed Delhi Mass Rapid
Transport System (underground railway). With the increase in
technical expertise, the cost of making underground struc
tures can be reduced substantially.
In the Himalayas, construction of surface structures
like roads, power houses etc. causes great problems due to
instability of slopes (Virdi, 1982) . These can be solved to
a great degree by going underground. A very ambitious
project is a rail link between Udhampur and Srinagar which
shall involve major tunnelling effort.
In India, tunnelling problems in Chamera project were
due to weak carbonaceous schists and fractured rocks
(Bandyopadhyay and Dhawan, 1994), Loktak tunnel posed severe
problems due to methane gas and deformation of weak bands

(Tyagi and Sharma, 1982; Madan, 1990). There was an explo
sion in HRT of Loktak project claiming 17 lives. The tail
race tunnel of Salal hydroelectric project (Jainmu & Kashmir)
that passed through very closely jointed Sirban dolomites
resulted in high overbreaks and cavity formation.
Other major geotechnical problems relate to high hydro
static pressure and flowing conditions in tunnels (Bhabha
Hydel Project, Maneri Bhali Project, Stage II) necessitating
deviation of tunnel alignment; problems of high temperatures
Bhabha and Nathpa Jhakri Project) and poorly cemented Upper
Siwalik conglomerates (Khara Project) (ISRMTT News, 1993-
94) .
New Austrian tunnelling Method (NATM) was introduced at
Loktak project incorporating close monitoring of rock defor
mation with the help of instrumentation. The rock support
was made economical without compromising on safety. Excava
tion was carried out by AM-50 road header in Loktak project.
Modern techniques involving photointerpretation, remote
sensing, geophysical explorations, drilling, determination
of engineering properties, application of geomechanical
classifications, controlled blasting techniques, rock sup
port and instrumentation are being increasingly used to
solve tunnelling difficulties. The use of computers has
vastly improved the areas of design, construction management
and equipment planning. Yet, a great deal remains to be done
as our experience with modern technology is limited to a few
projects only.
As a result of long experience of field work and
collaborative projects with foreign experts, following
methodology has been evolved for investigation, design and
construction of underground openings (tunnels). Many of the
steps outlined below are currently being followed in case of
underground hydroelectric power stations and tunnels.
STAGE 1: Preliminary review of available geological
records of the area including topographical and geological
maps. Study of airphotos/images if available and application
of remote sensing methods. Formulation of a general lay-out
of the project based on the above and other engineering
considerations.
STAGE II:
The next stage is the reconnaissance field survey.
Limited traverses to identify grey areas and field checks
for airphoto and satellite image interpretations. Prelimi
nary lay-out is now decided and planning for surface geolog
ical mapping is done. An outline of sub-surface programme
may also be drawn.
STAGE III:
At this stage detailed engineering geological mapping
is carried out. The exploratory programme is firmed up.
Geophysical surveys are carried out and exploratory diamond
drilling is taken up which remains the most widely used
method in sub-surface investigations. However, percussion

drilling is also used to delineate overburden-bedrock
contact. Some test tunnels are also made for physically
checking the behaviour of rock. A continuous interaction
between engineering geologists and design engineers is
essential at this stage.
The necessary modifications are carried out in the lay
out based on geophysical findings. If required, the explora
tory programme can also be altered.
Sampling for ascertaining engineering properties in the
laboratory is done. Strength of intact rock material by
Point Load Index and by Schmidt Hammer may be done. Labora
tory and insitu tests for elastic parameters may also be
carried out. Insitu rock stresses are recommended to be
measured in case of large caverns.
STAGE IV:
This is the detailed design stage. The lay-out is
finalised and detailed designs are undertaken. The rock
supports are designed based on Rock Mass Rating (RMR), Rock
Mass Quality (Q), material properties, stress domain and
past experience. Moreover, the excavation methodology is
also formulated.
STAGE V:
Excavation for underground structures begins by way of
drill and blast techniques or machine tunnelling as decided
earlier. Rock mass classification is done for the excavated

rock surfaces so that the required support may be installed.
Close monitoring of the behaviour of rock is undertaken by
instrumentation. Adjustment in supports may be made to make
them economical and safe. Finally, concrete or steel lining
is done, if required by geotechnical or engineering
considerations.
1.1 AIMS AND OBJECTIVES:
The hydropower potential of India is estimated at
84,044 MW at 60% load factor (Naidu, 1992), out of which
about 20% has been exploited so far. Moreover out of the
total potential approximately 3/4 lies in the Himalaya.
However, a host of problems viz. working in a gamut of
rocks, closely jointed strata, clay seams and shear zones,
sudden on rush of ground water, over stressed rocks etc.
need to be tackled while undertaking underground works in
the Himalaya. Accurate predictions are difficult to make in
Himalayan formations in view of their folded and faulted
nature.
There are many times geological surprii'es in projects
resulting in cost and time overruns. Therefore proper
investigations, recording of experiences in tunnelling,
characterisations of rocks, classification of rock masses,
behaviour of rock support system prove to be immensely
beneficial in subsequent analysis for future underground
works.

The study area lies in the best developed part of Pir
Panjal Range of Kashmir Himalaya where a hydroelectric
project is being constructed. The work incorporates some
relatively newer methods of investigations, many of these
employed for the first time in the country. The quality of
tunnelling in this area is excellent. As many future under
ground works are to be undertaken in Panjal Volcanics
(Baglihar, Kishanganga projects for instance) their detailed
investigations, characterisation and understanding of prob
lems in tunnelling through them is expected to be of immense
benefit.
The access to the work site is through a double lane
national highway from Srinagar (Summer capital of J & K).
Baramulla is 50 km West of Srinagar, Buniyar and Uri are 75
km and 95 km respectively.
The Uri hydroelectric project is a run-of-the river
scheme consisting of 20 m high barrage over Jhelum near
Buniyar village, 1.7 km long open canal system, 10.5 km long
headrace tunnel, 22 m dia & 75 m high underground surge
shaft, pressure shafts, underground power house operating
under a gross head of 260 m and a 20 km long tail race
tunnel joining River Jhelum near Uri Town (Sayeed and Bist
1995; Sharma, et ai, 1995). Fifty percent of headrace
tunnel, entire power house complex and a part of TRT are
located in Panjal volcanics.
10
Appendix 1
List of Important Tunnels in J & K
Sr. Project Location Type of Tunnel Length Dia No. Km. ra
A.
1,
2.
3.
4.
5.
6.
OPERATIONAL AND UNDER CONSTRUTION.
Uri HEP
Dul-Hasti HEP Salal HEP
Up. Sindh HEP Becon
Indian Railways
Baramulla HRT TRT AC.
Kistawar HRT TRT
Riasi TRT-1 TRT-2
Sonamarg HRT
Banihal Road
Udhampur Rail
10 2 7 9 0 2 2, 2.
5 05 0 8 4 5 5 74
8.4 8.4 6.5, 8.3 8.3 11 11 4.75
7,8
2.75 5.0 2.75 5.0 7.9 6.5,5
B. UNDER PLANNING 1. Kishanganga Bandipore HRT 2. Sawalakot Batote HRT 3. Baglihar Chanderkot HRT
21.0 8.6 2.2
6.5
11
Apppendix 2
List of Underground Powerhouses in India (modified after ISRMTT news 1993-94)
Sr. No,
Project State River Capacity (MW)
OPERATIONAL STAGE
1. 2. 3. 4. 5. 6. 7. 8. 9. 10. 11.
B.
1. 2. 3. 4, 5. 6. 7. 8. 9. 10-.
Bhabha H.P. Chibbro U.P. MAithon Bihar Pench Mah. Koyana-1 & 2 Mah. Koyana Mah. Tillari Mah. Vaitrana Mah. Iddiki Kerala Varahi Kar. Kadamparai T.N.
CONSTRUCTION STAGE
Dul-Hasti J & K Uri J 5c K Chamera H.P. Nathpa Jhakr.H.P. Lakhwar U.P. Tehri U.P. Koel Karo Bihar Sardar Saro. Gujrat Srisailum A.P. Pallivasal Kerala
Bhabha Tons Damodar Pench Koyana Koyana Tillari Vaitrana Periyar Varahi Ailyar
Chenab Jhelum Ravi Sutlej Yamuna Bhagirathi Koel Karo Narmada Krishna Madirapurza
120 240 60 160 560 320 60 60
780 739 400
390 480 540 1500 300 1000 780
1450 900 190
CHAPTER II
GEOLOGY OF THE AREA
12
2. GEOLOGY OF THE AREA:
2.1 GEOMORPHOLOGY:
The valley of Kashmir famous for its picturesque
beauty, is oblong, 130 km long and 40 km wide. The altitude
ranges between 1500 and 1800 M. It is bounded on North to
North-Eastern side by the Great Himalyan Range and on South
to Western by the Pir Panjal Range, the chief watershed of
the region, separating the Jhelum basin from those of Chenab
and Ravi.
The hydropower project site which corresponds to study
area is located about 75 km to 95 km West of Srinagar on the
River Jhelum in Baramulla District. This river also named
"Votasta" drains the "Vale of Kashmir" and is an important
tributary of Indus. It emerges from a spring at Seshanag in
Banihal hills, flows for 110 km in the North-West direction,
passes through Srinagar before entering Wular Lake. From
Wular Lake it takes a sharp left turn towards South-West
cutting through the Pir Panjal Range. It is joined by Podur
River, some 10 Km dowstream of Wular and reaches the edge of
the valley near Baramulla Town. There onwards, it enters the
hills and gushes through a narrow defile known as Basmangal
(2130 m deep) with steep sides. Due to the steep bed fall
after Baramulla town, Jhelum provides attractive sites for
exploitation of its hydel potential. At Uri town, below the
defile, it runs parallel to Pir Panjal Range upto
Muzaffarabad where it is joined by the Kishanganga river.
13
Finally, it is joined by Trimmu in Pakistan. The total
length of the River Jhelum is about 725 km (Krishnan, 1982).
The catchment area encompases some high peaks (upto 5000 M)
but most of it is located between 1500 and 4000 M.
The border town of Uri in Baramulla District is also
the North extreme of Pir Panjal Range (Wadia, 1928) beyond
which the range loses its structural orographic distinction
although topographically it is continued further North-West
in the Kaz Nag range.
The study area exhibits rugged topography with
elevations ranging from 1200 to 3500 M. The main ridges in
the vicinity of the project area are with peaks Nilapash
(3051M) and Kani (3529M) trending NNE-SSW and form the water
divide of the area. The River Jhelum has carved out a deep
but wide valley after the Baramulla gorge. It generally
follows NE-SW direction in this area. The valley is dotted
with a number of fluvio-glacial terraces. Some of them are
situated at significantly higher elevations. Almost all the
habitation in this part of Jhelum valley is confined to such
terraces.
Several transverse nullahs cut deep sharp valleys in
the adjoining ridges. Some of the important nullahs are
Buniyar (Hapatkhai), Chandanwari, Kalas, Kutrui, Cherian,
Sukhikhasi, Bandy Rest House and Haji Peer. On the right
bank, the important brooks are - Pringle, Nurkhaw and
14
Dwaran. Only some of the nullahs are perennial, but all of
them are prone to flash floods during cloud bursts. They
bring in considerable muck in their wake occasionally
causing rock blocks on the national highway along the left
bank of the river. The discharge in the river is highest
during April-May (maximum about 1800 Cumecs) and lowest
during November-December (50 Cumecs).
The old approach cart road to Kashmir valley was
through Muzaffarabad-Uri-Baramulla on right bank of Jhelum.
Subsequently, another road was made on left bank which is
presently known as National Highway (NHIA) connecting
Srinagar with Uri.
2.2 Climate and Vegetation:
The Kashmir Valley is situated on the Northern extreme
of the tropical circulation (Persson & Rytters, 1990). Ac
cordingly, the monsoon period from June to September con
tributes only 25 percent of annual rainfall whereas Septem
ber to November is the driest season. The cold season which
is significant here, is from December to April. Most of the
precipitation is between January-April with April being the
time of heaviest rainfall. Sometimes the wet season over
shoots into the short spring & summer. During the cold
season, the percipitation is often in the form of snowfall.

15
The annual rainfall varies from 600-900 mm in the main
valley (Altitude. 1600-1900M) and 1200-1400 mm in the sur
rounding mountains (2500 M Altitude). The snow and rainfall
data is not available for higher elevations.
The area abounds in fruit trees mainly of peaches and
walnut in the vicinity of villages. The terraces consititute
main cultivable part.
Generally, the North facing hill slopes are covered by
forests of Chir (Pinus longifolia), Deodar (Cedrus deodara)
and the glue pine (Pinus excelsia), and the South facing
slopes are, as a rule, barren as covered only by grass or
shrub (Wadia, 1928). In the area under study too similar
situation prevails withthe North facing left bank having
vegetation whereas the South facing right bank being barren.
2.3 PREVIOUS WORKS AND STRATIGRAPHY:
One of the earliest workers was Lydekker (1876) who
took traverses in Kashmir Hamalaya. Subsequently, the
geology of Kashmir and hill tracts bordering Jhelum were
studied chiefly by Middlemiss (1911) and other workers. Some
of. the earliest published works utilised by Wadia (1928) in
his exploration and report on Poonch and adjoining areas
are:
(i) Middlemiss (1911) map of the Gulmarg, Golabagh Gondwana.
(ii) Lydekker's boundary of the Murree zone between Uri and
Muzaffarabad (now in POK).
16
Gansser (1964) has given a general account on geology
of Kashmir Himalaya, which he considers to be a part of
Punjab Himalaya lying in between Indus and the Satluj. A
more detailed account work in the study area was published
by Shah (1968, 1972, 1978 & 1979) and Fuchs (1975) .
More recently, when the investigations for Uri hydel
project began in 1975, the area between
Baramulla-Gantamulla-Buniyar-Uri was subjected to detailed
geological explorations by the officers of Geological Survey
of India during (1975 - 1987). (Ameeta, S.S. ; Chauhan,
R.P.S.; Dhar, y.R.; Kaul, V.K.; Sharda, Y.P.; Srivastava,
S.K.; Tiku, A.K.; & Waza, J.L.) The geologists of the Power
Development Department of J & K Government also carried out
geological investigations. From 1986-87 onwards, geologists
of the National Hydroelectric Power Corporation have worked
in greater detail in the area. The author was associated
with the investigations as resident geologist between 1987-
1992 and made several field trips from 1992 onwards. Earli
er, Walvekar (1988) of NHPC also carried out some geological
mapping in the area.
Lydekker's work underwent rigorous revision by Wadia
(1928) (table no. 2.1). Subsequently Wadia (1935) revised
his own observations and suggested broad tectonic units for
Kashmir Himalaya (table no. 2.2) . His map is presented in a
revised form (Krishan, 1982) as plate No. 2.1. Wadia first
grouped most of the paleozoic rocks into Pre Cambrian Dogra

17
Slates and later partly into Salkhalas on the basis of
absence of fossils and lithological dissimilarity with
Eastern Kashmir. He suggested the name Dogra Slates (after
Dogra Rajputs) for Lydekker's Panjal Slates forming a wide
zone of unfossiliferous black and greeen slates or phyl-
lites. They are co-extensive with the SW border of the Pir
Panjal Range from Uri to Banihal abutting upon the inner
margin of the Eocene belt of the range.
Wadia also noted the presence of enormous series of
basic lava flows on top of agglomeratic slates and tuffs
attaining a maximum thickness of nearly 1600 m. The flows
are lenticular free of intertrappean layers. In the Poonch
area, the thickness of flows is 610-915 m. On the basis of
upper and lower fossiliferous horizons their age has been
fixed from Upper Carboniferous to Upper Permain. Some flows,
however, extend upto Upper Triassic Limestone in NW Kashmir.
The traps are generally unconformably overlain predominantly
by Eocenes in this area. In some localities outliers of
Triassic Limestones are found. Eocene encompass a breadth of
3 to 5 km.
They are made up of limestomes and shales. The Murree
formation has strike about NW-SE to WNW-ESE over large
areas. The Murree zone is about 40 km broad towards NW
extremity and narrows to about 13 km at the SE extremity
near Rajouri (Wadia, 1928). The Jhelum from Uri to
Muzaffarbad follows the strike of Murrees.
18
It is significant that Wadia (1928) has put the
volcanic trap flows into two distinct types of widely-
separated ages:
(i) Dogra Slates - The lava flows of basic composition which
have undergone intensive alteration into chlorite schists
and (ii) Panjal volcanics - a much younger group of sub-
arially erupted lava flows of pyroxene andesite to basaltic
composition, covering an area of several thousand square kms
in Kashmir and North-Western Himalaya. The age of these
trappean flows has been fixed on the basis of
contemporaneity of some of the top flows with marine
fossiliferous Permo-Carboniferous limestones.
URI-BARAMULLA SECTION:
Wadia (192 8) has described the geology of the Jhelum
valley section of URI-BARAMULLA (Mem. G.S.I., 51(2) pp. 300-
302) which corresponds to the study area. The old approach
to Kashmir valley was from Rawalpindi and therefore he
travelled on the Jhelum Valley road from Uri towards
Baramulla. He also writes that he crossed this area several
times while surveying at Poonch. According to him two
furlongs North of Uri dak-bungalow on the opposite bank of
the river, steeply inclined Murree strata are in thrusted
contact with dark grey fossiliferous Nummulitic limestone
(which the author has also mapped) which in part develop
slight foliation and squeezing. The Murrees abut upon an
inverted syncline of Laki beds.
19
The Dogra Slate - Eocene boundary is crossed at
milestone 74' on the Uri-Baramulla - Srinagar road. The
slates are green coloured and phyllitic copiously
interbedded with the chloritised amygdaloidal basic lava-
flows. The strike near Datha Mandir (milestone '76') does
not show serious departure from the normal NW-SE strike of
Pir Panjal. Wadia writes that the slabs of ruins of Datta
Mandir are made up of the above mentioned lava.
Between Mathura and Rampur he records inward dips due
to rapid deviation of strike to E-W direction. The rocks are
dark coloured flaggy slates and phyllites, at times
schistose unchanged upto Rampur. Some distance West of
Rampur, a phyllitic coarse-grained grit, the metamorphosed
equivalent of original sandy shales is the most common rock.
There are isolated outcrops of Panjal Volcanics and
Agglomeratic slate on either side of Naushahra village
indicating presence of folding without much change in
principal rock, units upto the neck of the Jhelum gorge at
Baramulla from where Karewas make their appearance. Wadia
describes the straight narrow defile of the valley from Uri
to Baramulla (20 miles) as profound canon. Srikanta (1973)
has recognised existence of two sets Panjal volcanics in
Kashmir tectonic point of view. The layered pebbly mudstone
coglomerate artrose-guartzite sequence of Western Pir Panjal
has been grouped together as Gondwana by Wadia (192 8) and
subsequently (1934) as Tanawal Formation. Fuchs (1975) has
used the term Tanol (spelt earlier by Wyne) throughout
Kashmir Himalaya and treats it equivalent to Chail
Formation.
20
Shah (1979) classified the Tanawal Group of Poonch-
Section into three well marked formations.
However, Shah states that in proposing a stratigraphic
gap between two episodes of basic volcanics (i.e. of Dogra
Slate and Panjal Trap) Wadia was influenced by the absence
of fossiliferous horizons and the existence of such a gap in
the NW part of Kashmir. He also states that the term "Dogra
Slates" proposed by Wadia does not have a type area and all
sorts of slates have been put into it adding to the
confusion.
While working for Uri hydel project, Tiku and others
(Pers. Comm. Chauhan, R.P.S.) have proposed a stratigraphic
sequence for Buniyar-Uri area. Tiku has taken traverses in
the area between Datha Mandir-Mohura-Rampur and disagreed
with Wadia's interpretation of the rocks between Datha
Mandir and Muhura as Salkhalas. Not much lithological
changes except facies difference is found as one passes from
Datha Mandir to Mohura. Salkhala and Tanawals cannot be
distinguished on the basis of metamorphic grade because
carbonaceous or graphite schists and phyllites are also seen
in Tanawals near Chandanwari and Rampur. Wadia himself has
admitted "that the grade of raetamorphism of Tanawals is
sometimes higher than that of Puranas (Geology of India,
1953). The black carbonaceous phyllites/shales and gypsum
beds exposed on right bank Jhelum at Rishiwari, Nurkha and
Dara are not seen on left bank. Accordingly Wadia's
Sakhala^s have been included in Tanawals only.

21
Tiku and Dhar (1982) have given geological succession
(table no. 2.3) in Buniyar-Uri.
The present author is inclined to modify this
succession (table no.2.4) after carrying out intensive field
studies and studying new data available from ongoing
underground works. The revised geological map of the project
area prepared by the author is presented as plate no. 2.2.
SALKHALA SERIES : This is the oldest formation in the area
and belongs to Pre-Cambrian. It consists of phyllites,
carbonaceous schists, graphite, gypsum and limestones.
The Salkhalas are comparatively softer as compared to
Tanawals. As already mentioned, they are exposed on right
bank beyond Gingle village and in Buniyar nullah in upstream
reaches. The contact between Salkhalas and Tanawals as
exposed near Dwaran and Nurkhawah shows shearing and local
drag folds. The Salkhala are overlying the Tanawals
indicating a thrusted zone.
The Salkhalas trend from NE-SW to almost E-W direction
with 505 to 80^ dip in NNW to Northerly direction.
TANAWAL GROUP: This group is exposed from Buniyar to
Rajarwani village (about 5 km upstream of Uri Town). They
show considerable colour variation. They are greyish to
blackish when the percentage of carbonaceous material is
more. They are, however, slightly coarser than Salkhalas and
the Volcanics ranging from massive to schistose varieties.
Their individual grains are difficult to identify with the
22
naked eye. In some rocks, bands of graphite have been ob
served along strike of foliation as at Chandanwari and
Mohura villages. They trend almost N-S near Buniyar village
with steep sub-vertical dips. However, the trend swings as
one proceeds towards downstream and after Rampur attain ENE-
WSW to E-W strike. They dip 70M to 855 towards NNW to North
and also in South direction by virtue of tight folding. They
are generally considered to be of Carboniferous.
PANJAL VOLCANICS: The Panjal volcanics comprise green to
dark grey basic flows between Rajarwani and Bandy villages.
They are schistose thinly bedded and have abundant chlorite.
Massive traps are scarce. Volcanics are represented as sills
in the Tanawals (country) also.
TRIASSIC LIMESTONES: Between Rajarwani and Bandy villages,
thinly bedded and puckered limestones occur as outlier
surrounded by the meta-voncanics.
NUMMULITIC SERIES (EOCENE): The Ecocene of India represent
three types of facies, viz., deepsea, coastal and fluvitile
representing marine regression. In this area, Eocenes are
exposed between Bandy and Lagama villages, by dirty white
marble, yellowish limestomes, gypsum pockets, phyllites,
purple shales and grey compact limestone with a thin coaly
bed on the top.
Nummulites have been found in this area hence they are
named Nummulitic series. The Eocene belt is 2 to 3 km wide
with strike in NE-SW direction and dip 45^ to 65^ in NW. The

23
Eocene have thrusted contact (Panjal Thurst) with the Panjal
volcanics in the road section and with the Tanawals at
higher elevations near Bandi Brahmana village. They underlie
both these older formations.
MURREE GROUP: This is represented by chocolate coloured
siltstones and shales in alternating sequence. They manifest
beyond Lagama village and represent the era when sea was
being driven out of Kashmir Himalaya when the second great
upheaval took place (Krishnan, 1982) . The Murree thurst is
present between Murree Group and Eocenes. They are succeeded
by Siwaliks deposited in the foredeep in front of the
Himalaya. The Siwaliks are located far away from the study
area.
2.4 REGIONAL STRUCTURE:
In Kashmir, there is no thrust equivalent to the Main
Central Thrust of Central Himalaya. Wadia has reported two
thrusts on the Western boarder of Pir Panjal Range the
Murree Thrust at the foot of the range separating Eocenes
and Murrees and the Panjal Thrust separating Eocenes from
the slate zone. The two Thrusts may have split from the main
boundary fault (Shah 1978) . The Panjal Thrust, however,
appears as the nearest equivalent of MBF. But, according to
Sharma (1976) Panjal Thrust has no regional significance. A
number of workers consider Panjal Thrust as neither a zone
of maximum deformation nor of metamorphism. The Paraautoch-
thonous zone between Murree and Panjal Thrusts (Shah 1979)
24
Starts from Uri in Jhelum valley extending through Mandi
(Poonch) and Balfaiz, crossing the Srinagar-Jammu Highway-
near Pira and extending upto Ravi. The zone is widest in
Western part (Poonch Region) where it extends for several
kms. Though Shah has reported that at Uri-Srinagar National
Highway the zone becomes extremely narrow and the two
Thrusts come within a few meters with mylonised rocks, in
between. The author's observations are that the two Thrusts
are atleast 1.5 km away on the NHIA. The Eocene rocks
(Nummulitic series) occur between the two thrusts.
2.4.1 Murree Thrust:
The thrust between Murree and Eocene is exposed in the
NIHA is exposed in the NIHA road section near Laqama post
office. Black carbonaceous material (Coaly beds ?) have been
observed in the Lagama Rest House nullah section where the
contact is exposed.
2.4.2 Panjal Thrust:
Panjal Thrust separates Tanawals and Panjal volcanics
from the Eocene sediments in the study area. The younger
Eocenes are thrusted under the Tanawal & Panjal Volcanics.
It strikes NW-SE and, dips towards NE. It is clearly seen in
the NIHA road section near Bandy village. The volcanics in
close proximity to the thrust are thinly layered, schistose
and highly puckered. There is a hard dirty white marble band
and yellowish limestone towards the Eocene side. Some
25
pockets of gypsum are also seen. Close to the thrust,
phyllites are also seen and crushing is evident from the
occurrence of sheared rocks on either side of the contact.
2.4.3 Chullan Thrust:
The thrust separating Salkhalas from Tanawals is found
on right bank of Jhelum near Chullan village. Sheared rocks
and caught up patches of Tanawals have been observed along
this contact near Dwaran village.
Some other faults viz-Chandanwari fault and Mohura
fault are present in the area. The former one, present in
Chandanwari nullah in Tanawalas is accompanied by
carbonaceous material.
The strike of foliation of Tanawals between Buniyar and
Rampur is N-S with sub-vertical dips. From Rampur onwards,
it starts to swing from NVB E-STS 'W to E-W with dip of 70"
to 90** the foliations of Panjal volcanics range from NeCE-'
SeO'.'w to E-W and the dip is 60^ to SO'' in Northern
direction. The Eocene beds have NW-SE strike with 40f to 10^
dip in NE direction.
All the rock types are traversed by other joint sets
and some shear zones. The detailed description of the dis
continuities is separately dealt in subsequent chapters.

26
Table No. 2.1
A COMPARISON OF STRATIGRAPHIC SUCCESSION BY AND WADIA (1928)
LYDEKKER 1876
Lydekker
Granitoid gneiss axis
Panjal System Metamorphics, slate and trap
Wadia
intrusive
The zone of Panjal Trap, Agglomerate slates and tuffs with basic gabbroid intrusive bosses, sills & dykes.
- Conformity Lower Gondwaria. Moderately metamorphosed sandstones and shales.
Supra-Kuling Series (Trias) Limestones
- Conformity Ruling Series (Carboniferous) Limestones
Unconformity Dogra slates,cleavage slates & phyllites with interbedded trap and gneiss intrusions.
Thrust Plane
Eocene limestones and shales with inliers of agglomeratic slates, Panjal traps and Permo Trias.
27
TABLE NO. 2.2
TECTONIC UNITS OF KASHMIR HIMALAYA (WADIA, 1934)
TECTONIC UNITS FORMATION
Nappe Zone The Cambrio-Triassic sediments of the Tythes with extensive "Panjal Volcanics" on Salkhala -Dogra Slate formation.
Panjal Thrust
Auto chthonous folded belt "Panjal Volcanics" with outliers of PeriTio-Triassic and Subathu sediments.
Murree Thrust
Foreland "Murree Series" sediments.

TABLE 2.3
GEOLOGICAL SUCCESSION IN Iffil AREA (TIKKU & DHAR. 1982:
Formation
Recent to sub-recent
Murree Series
Lithiology
Slope wash, alluvium and flurio-glacial deposits.
Recent to Sub-recent
Greenish sandstone, Upper purple and maroon Oligocene shales, siltstone. to Lower
Miocene.
Murree Thrust
Quartzite band Thinly bedded limestones Eocene
Nummulitic Series Varigated green and purple coloured shales,schists or phyllites with lenticular limestones and a gypsum band.
Panjal Thrust
Limestone Outlier
Tanawal Series
Limestone Basic effusives Panjal Volcanics
Quartz-Schist and Chlorite schist and banded argillaceous guartzites.
Triassic Upper Carboniferous
Post Cambrian to Middle Carboniferous (?)
Fault
Salkhala Series Phyllite & Schists Pre-Cambrian

29
TABLE 2.4
GEOLOGICAL SUCCESSION IN BUNIYAR ^ URI
Formation Litholocp/
Slope wash, Alluvium fluvio-glacial deposits
Recent to Sub-Recent .
Murree Group Chocolate coloured Silt-stones and shales in alternating sequence.
Upper Oligo-cene & Lower Miocene
MURREE THRUST
Nummulitic Series Black carbonaceous band, Hard and compact. Grey limestone. Purple shales with inter-calations of limestones. Yellowish limestones. Dirty white marble. Gypsum pockets, phyllitesi?)
PANJAL THRUST
Limestone Outlier Thinly bedded grey folded limestone.
Triassic
Panjal volcanics Green to dark grey volcanics (Meta-volcanics) Chlorite-schists Carbonaceous schists
Lr. Triassic (?) to Mid. Carboniferous
Tanawal_Group
Salkhala Series
Quartzitic schists Carbonaceous schists Quartz-Mica-schists phyllites
Fault (?) •
Phyllites, Graphitic/ Carbonaceous schists, limestones, phyllites, gypsum.nes, phyllites, gypsum.
Carboniferous
Pre-Cambrian
30
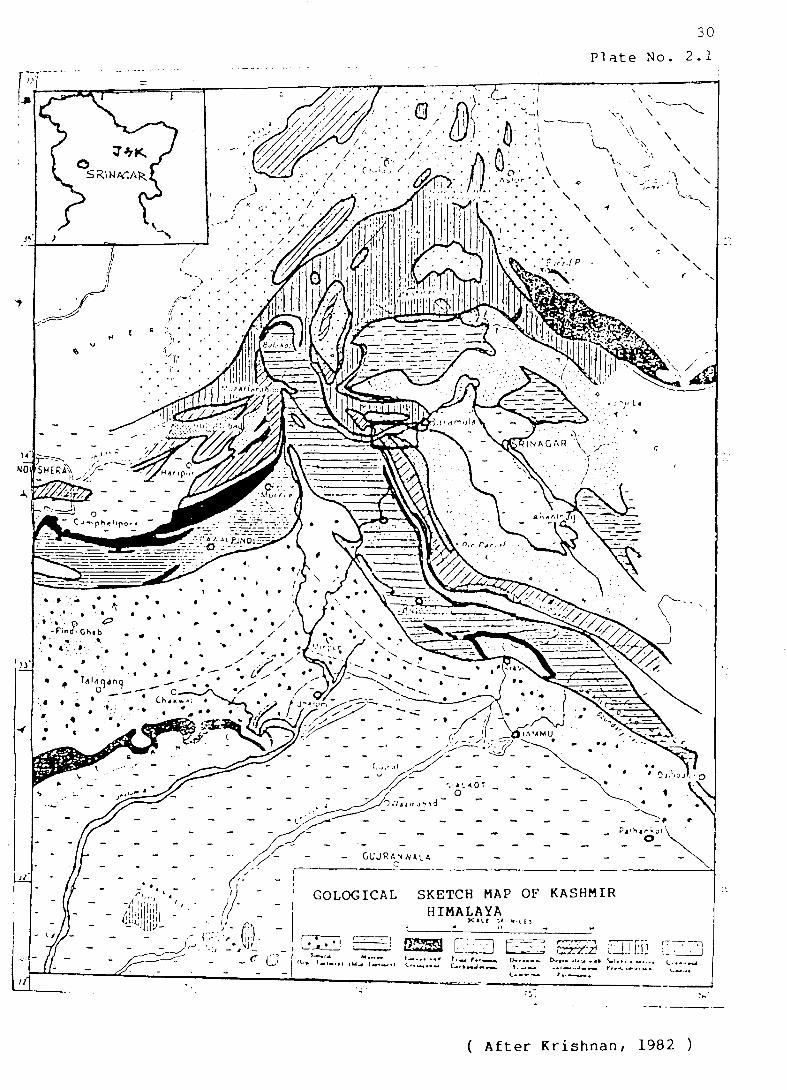
Pi ate No. 2.1
( After Krishnan, 1982 )
i 31
P l a t e No. 2 . 2 1
o->
D LLl
O cr a.
o
^
>
O UJ O
Q
UJ
UJ
c; I
2
v/1 UJ
a UJ
in u
1 I Z
5
o UJ z g in UJ
2:
I/)
o > in
_ j
z a. »
I 2
^0[ii0E
9SnOH d3A\0d
o o ~J f-M
o o r^ r j
O O O r\j
o o 00
^~
o o U5
9d313w Nl
o o *J
13
o o

CHAPTER III
FIELD INVESTIGATIONS AND COLLECTION OF DATA
32
3. FIELD INVESTIGATIONS AND COLLECTION OF DATA:
The fundamental requirement prior to starting a
tunnelling project is availability of topographic and
geological maps on suitable scale. Maps on 1:1,20,000 (1
Inch : 1 Mile), 1:50,000 or 1:25,000 are generally used as
base maps for regional geology and further correlation work.
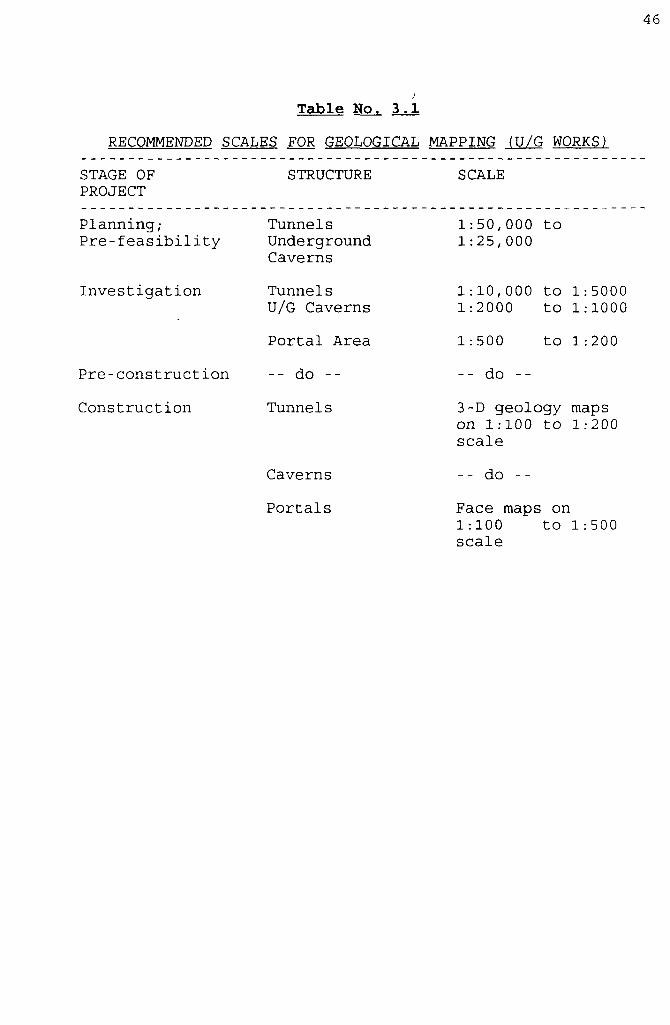
3.1 ENGINEERING GEOLOGICAL MAPPING
3.1.1 General:
Generally, the scales chosen for geological mapping of
engineering structures depend on the local geology and the
stage of the project, (viz. planning stage, investigation
stage, pre-construction stage, construction stage).
The recommended scales are given in table 3.1 which are
based on I.S. Code 6065, Part I, 1985).
For some of the areas contour plans on 1:25,000 are
available with Survey of India. However, plans larger than
this scale have got to be prepared as per the requirement.
Engineering geological mapping is one of the first
ground investigations. Various techniques for preparing
these maps have been described by Krynine and Judd, (1957) ,
Dearman and Fookes (1974), Legget (1962), Zaruba and Mencl
(1976), Hoek and Brown (1980), Shome (1989) and the UNESCO
guide. The author while carrying out engineering geological
mapping in various terrains like Ratnagari and Nasik
Districts of Maharashtra, Chamba District of Himachal
Pradesh and Baramullah District of Jammu & Kashmir has used
33
thedolite and telescopic alidate for precision mapping of
out crops and boundaries. In very rugged terrain, theodolite
with tripod stand is useful though telescopic alidate has
some other advantages in plotting and is recommended in less
rugged areas. Alongwith mapping of rock outcrops and
exposures, the classification of overburden into slope
wash/talus, terrace deposits etc. is carried out.
Ordinarily, areas with superficial overburden (say less than
1 m) are marked as outcrops. Shallow cover areas (between 1-
5 m overburden) may be separately marked depending on
engineering requirements, for instance, the depth to bed
rock below nullah beds covered with overburden is of utmost
importance while evaluating tunnel - nullah crossings. Slide
zones are shown separately.
In the outcrops and exposures, wherever feasible,
classification of rock quality is done. Weathered zones,
slump zones, schistose and fractured bands, shear zones can
be shown if they are large enough to be mapped.
It is essential to map structural data specially on
joints and infillings. An analysis of bedding or foliation
planes to work out folding pattern and general structure of
the area is important. Faults are also to be recorded
accurately. A format adopted by Dhawan (1992) is useful to
record information on discontinuities. Minor modifications
to suit local conditions (like more importance to
infillings) can be made.

34
Good outcrops and exposures can be used for rock mass
classification. However, in areas of high superincumbent
cover over the proposed underground structures, subsurface
information from drill holes on drifts should be obtained
and necessary corrections applied.
3.1.2 Study Area:
The area of underground power stations complex was
surveyed by Survey of India and 1:1000 scale contour plans
have been used for planning, design and geological mapping
detailed engineering geological mapping was carried out in
the power house area on the left bank of River Jhelum near
Rajarwani village using telescopic alidate (RK-1 - Wild).
The mapping from the river bank was extended right upto
E11750 to cover important engineering structures like under
ground surge shaft, pressure shaft etc. (plate 3.1). It also
indicates the locations of sub-surface explorations for
power house complex. The mapped area shows terrace deposits
between the river water level and National Highway lA (EL p
1325M). There is a major nullah known as Sukhi Khasi which
shows exposures of meta-volcanics (photo 3.1). It has made
a deep transverse depression in an otherwise broad but well
defined Jhelum valley aligned E-W. At higher elevations is a
fairly dense pine forest with slope wash material and rock
outcrops.
35
The nullah divides the geoenvironment of power house
area into two distinct regions -
(i) The Western side (downstream side w.r.t. River) and (ii)
the Eastern side of the nullah, (i) On the Western side of
nullah, the meta-volcanics outcrop as ridge with rocks
showing prominent steeply dipping foliation planes (SS' to
80^ due 340p to 360°). The slope of the ridge is fairly
steep. Locally, small sub-vertical cliffs of less weathered
volcanics are also seen.
On the other hand, the Eastern side of Sukhi Khasi
nullah, generally covered by slope wash material (5 to 10 m
thickness) with a wide slide prone area (plate no. 3.1)
devoid of pine trees which are abundant in the neighbouring
areas.
There are a few exposures (along road cuts) of very
closely foliated and schistose volcanics. However, a rocky
ledge at about 1700 M elevation shows closely foliated and
jointed meta-volcanics.
The attitude of joint sets recorded in the power house
area are as follows:
(i) 60° to 85^/335^ to 005" (Foliation joints).
(ii) 50* to 90* /210'' to 255^; (iii) 4C*' to 90'^'040^ to 100^' ( iv) 60^ t o 85<J/260^ t o 280° (v) 20° t o 40*^/060*" t o 090*' (v i ) 20^ t o 30^/170^ t o 180f

36
3.2 EXPLORATORY DRIFTING OR TEST TUNNELLING:
Though expensive in the preliminary stage, exploratory
drifting or test tunnelling is the most important and cost
effective method during the detailed investigation and
preconstruction stage (Hoek & Brown, 1980). It enables the
geologist to have first hand knowledge of actual rock
behaviour in underground opening which is otherwise not
possible through surface mapping or core drilling and is
helpful in working out subsurface geology with reasonable
accuracy. Moreover, the uncertainity of geological
predictions based on scanty field data may prove sometimes
to be very costly. For structures like large underground
caverns and important tunnels it is exigent that the area be
explored by drifts or shafts. The Indian Standard Code (IS
Code 10,060,1981) recommends intensive exploration by way of
drifts, core drillings and rock mechanic tests.
A reasonable size for a exploratory drift of less than
200 m length or less is 1.8 m width and 2.2 m height. For
longer drifts (> 200 m) wider sections (2.5 to 3.0 m) area
advisable to have enough room for tunnelling equipment.
In the study area, the proposed underground power
station was explored by a 420 m long exploratory drift
(Rajarwani drift - plate no. 3.1). The drift took-off from
EL 1320 at NHIA between Km 82 and Km 83 and went down to p
EL 1272 in a steep gradient. At chainage 420 m two cross
cuts- of 30 m length were made towards upstream (North or

37
Left side) and downstream (South or right) side.
Furthermore, the right cross-cut was extended by 85 m
towards S13°W to study the geology. The entire drift is made
in meta-volcanics which are greenish grey to grey and fine
grained. Two distinct types of meta-volcanics recognized are
as follows:
i) Close to moderately foliated and relatively hard and compact type,
ii) Very closely foliated to schistose of medium to low strength.
In the long drift which is running at an angle to
strike of foliation, mostly first type were mapped with sub
ordinate bands of second type in it. The foliation strike
ranged N75^ E - SVB 'W to E-W with 65° to 80" dip in 345". to
360® direction. Shear zones upto 25 cm thick and clay seams
upto 20 cm thick were seen to occur mostly in foliation
direction.
During the mapping of cross-cuts, it was noticed that
the meta-volcanics towards the left cross-cut are moderately
foliated and competent (first type). However, towards the
right side, the frequency of schistose bands increase (plate
3.2). A couple of shearzones of 25-50 cms width have been
mapped in d/s cross-cut. In very closely foliated rocks
(second type) thin clay seams along the foliation are not
uncommon. However, the clays are non-expanding type and
contain some silt faction. Furthermore, four small
exploratory drifts (of 35 to 50 m length) were also made in

38
the power house area (plate no. 3.1) to study the geology in
greater detail and firm up the appertunant
structures/tunnels in power house complex.
The 50 m long exploratory drift at the location of main
access tunnel (plate 3.1) was made to firm-up the location
of portal and ascertain tunnellibility in the beginning and
at crossing with NHIA. This portal represents an ideal
location having perfect overhead stability (requiring no (Photo 3.2 i 3.3)
rock support)/ and a worlcing platform (by easily removing
terrace deposits in front of the portal). This drift
encountered mostly moderate to closely foliated volcanics
representing fair conditions. A stereoplot of 206 planes
of geological discontinuities fromm Rajarwani drift and
other smaller drifts in the neighbourhood has been prepared
(plate no.3.3). Contours of equal pole concentrations have
been drawn and the figure thus obtained (plate 3.4) helps in
arriving at following joint families:
S-1 - 65^ -75^ •345«> to 000«"' S-2 = 50" 90< 210^ to 255*' S-3 = 40^, 90^ 040* to 100^
It is also observed that some low dipping joints are
occurring in Easterly and Westerly directions more or less
corresponding to S-2 and S-3. A few joints (random) in 17(/,
- 180<~ are also plotted.
A separate pole plot for cross-cuts has also been
prepared and contours of pole concentrations drawn (plate
nos. 3.5 and 3.6). It is quite apparent that in the cross-

39
cuts the concentrations of foliation joints is very-
significant and S-2 and S-3 are reduced to the status of
random joints. In other words this means that the moderate
to closely foliated volcanics contain two additional sets
joints (other than foliation joints) and some random joints
whereas the very closely foliated volcanics show only random
joints other than foliation joints. These thinly layered
bands have gently undulating foliation planes which can be
accounted to stressful conditions during the tectonic move
ments associated with the uplift of Himalayas. These rela
tively in competent volcanics have been thrown into undula
tions due to more plastic nature whereas the relatively more
competent less foliated bands would develop conjugate sets
of joints due to their more brittle nature.
3.3 EXPLORATORY DRILLING:
Exploratory drilling is an important tool
ofinvestigations as it is not possible to make test tunnels
at every desired location. Exploratory drilling aids in
ascertaining rock quality as well as thickness of overburden
depth to bed rock and fresh rock. The most popular method is
rotary diamond drilling. Various companies like Voltas,
Greaves Cotton are manufacturing drill rigs in India. Among
the leading international companies, the names of Craeliaus
and Atlas Copco are the foremost. In diamond drilling,
cylindrically shaped cores are obtained by rotational
process (40 to 1000 r.p.m. or more) using the rotary rig.

40
The samplers are known as core barrels which are single tube
or double tube. In the latter type, the inner tube retains
the core and usually does not rotate with the outer tube.
Moreover, the core does not get flushed by drill water. Both
type of core barrels have drill bits at their cutting ends.
After the core is annularly cut in rock media, the core
barrel helps in taking out core samples, the core catcher
inside the barrel aids in preventing the core from falling
down (Krynine and Judd ,1957).
Single tube core barrels are used for drilling in hard
competent rocks and large diameter holes. Double tube core
barrels must, however, be used in smaller diameter holes or
in fractured, soft or less competent rocks. In such
formations it is important that the cores are protected from
the erosive action of drill water. Specially in Himalayan
rock formations, it is strongly recommended that only double
tube core be used. Of late, even triple tube barrels have
also been introduced.
According to some, the average core recovery seldom
exceeds 30 to 50% (Shome et al ,1989), while drilling in
overburden or in crushed rock formations, holes are
protected from caving in by a steel casing. The diameters of
drill holes, casings, core barrels and cores are given in
table no. 3.2.
41
A total of seven holes (table no. 3.3) have been
drilled through the cross-cuts to ascertain rock conditions
in power house area (plate no. 3.1).
The drill holes are through meta-volcanics which have
very close, close and moderately foliated bands. The SPH-3
hole is more or less across the strike of foliation and SPH-
4 is at a small angle to the foliation.
A dark coloured carbonaceous material was encountered
in the SPH-1 (at 70.72 m), SPH-2 (69 to 73 m), SPH-3 (60.6
to 70.4 m, 110.2 to 110.6 m and 125.6 to 126.9 m). The most
significant observation from the holes was that there was a
general tendency of deterioration in quality towards South.
The inflow of groundwater into cross-cuts was around 150
- 6 - 7
1/min. The permeability was reported to be 10 to 10
m/sec.
Core Recovery:
The core recovery was 70% in RLCC-1 and 43% in RRCC-5.
However, with the use of modern Diamec 260E in the
subsequent holes (SPH) there were fewer zones of coreloss.
It is accepted by many geologists (Shome e^ al 1989) that
good core recovery is not possible in folded and jointed
Himalayan rocks by ordinary drilling techniques. It is
desirable that the cores are carefully preserved so that the
interpretation by geologists is more reliable.

3.3.1 ROCK QUALITY DESIGNATION (RQD):
Rock Quality Designation was proposed by Deree in 1964
as a quantitative index of rockmass quality based upon core
recovery by diamond drilling.
It can be defined as percentage of core recovered in
intact pieces of 100 mm or more in length in the total
length of the bore hole.
Hence: Length of core pieces > 100 mm
RQD(%) = 100 X
Length of bore hole
It is recommended that RQD be calculated for cores with
a minimum dia of 50 mm (Hoek & Brown, 1980) which nearly
corresponds to Nx size (54 mm). The same size has been
suggested by ISRM also. Although smaller dia holes are
strongly discouraged, there are many instances wnere the
driller and the field geologist may be forced to go for Bx
or Ax size holes. This is particularly true in case of
deeper holes and in areas of thick overburden cover. In Bx &
Ax drilling the core dia is 42 mm and 30 mm respectively.
Though RQD value should be independent of the core dia
because it is directly proportional to frequency of joints.
In practice, in smaller diameter cores there is a tendency
of breakage along fractures and the broken face may be
grounded by rotary movement of the barrel. The geologist
should carefully assess the mechanical breakage, if any,
while calculating RQD. Some workers like Henze (1971) have

43
mentioned about variable length measurements for different
diameter cores i.e., length for RQD be taken equal to twice
the dia of core, (eg: for Bx size 80 mm long core pieces be
counted instead of 100 mm.)
RQD remains a very important parameter of rock quality.
One of its greatest advantages is that it is very easy to
apply and used unversally to define rock quality.
Earlier, the RQD was calculated to be 70% for RLCC-1
and 57% in RRCC-5 suggesting that the rock quality in u/s
cross cut is better. Using, a more advanced drilling machine
the mean RQD was determined as 23% for SPH-1; 24% for SPH-2;
26% for SPH-3; 31% for SPH-4 and 21% for SPH-5. Furthermore,
the old holes were done by NW and BW core barrels yielding
54 mm and 42 mm core sizes whereas the new holes (SPH) v;ere
done by metric series having a hole dia of 76 mm and core
dia of 60 mm. Following conclusions can be drawn by the above data:
(i) There is a definite deterioration of rock quality
towards the South (plate no. 3.2) which is further proved by
the occurrence of carbonaceous/gougy material in holes (SPH-
1,. 2 and 3 drilled towards the South, (ii) RQD is more
independent of type of machine and accessories used, unlike
core recovery which is sharply affected by drilling methods.
RQD is generally calculated for each drill run (Hoek
and Brown, 1980) usually 1.5 or 3 m. Shorter runs are made
in poor rock formations. In RLCC-1 and RRCC-5 the RQD was
calculated for each run (plate no. 3.7). However, in the new

44
drill holes (SPH) the Swedish Geologist calculated RQD for
each meter. This method is possible when recovery is almost
100% or the core loss zones are well defined (photo 3.4).
Barton (1974) has suggested formation of structural
units with identical geology that can be supported by one
type of reinforcement. Similarly, the RQD can also be
calculated for individual structural rock units. This method
has been mentioned by ISRM also.
In case of SPH-3 (plate no. 3.8) moderate closely
foliated (type I) and very closely foliated bands (type II)
have been identified and RQD values of 43% and 13% are
worked for these two units. This indicates that in type I
will signify fair conditions whereas in type-II poor
conditions shall prevail.
3.3 PRESENTATION OF DATA:
3.3.1 3-D Geological Maps of Drifts and Tunnels:
The presentation of geological and geotechnical data in
proper format must be appreciated. In the conventional
system (IS Code:4453-1967, 1980) the plan of the drift
involved opening from centre line of the crown. Recently,
more convenient unfolding pattern (plate no. 3.2) using both
left and right invert lines has been developed.
Choubey and Dhawan (1990b) have outlined the advantages
of the later wherein the drift floor is not reproduced in
the geological and the crown is shown in a continuous manner

45
unlike the conventional method wherein the floor occupied
the central position with scanty geological information.
Moreover, the continuity of geological features is also
lost. Apart from the map of the tunnel the 3-D log should
also depict the characteristics of joints and other
parameters used in rock mass classifications. The
discontinuity details can also be reported on a separate
sheet and attached as annexure. It is also observed that
these maps should be able to record any special information
depending on site conditions or for a particular type of
tunnelling methodology. A format used in Uri Project (Sharma
et ai, 1995) is presented as plate no. 3.9. For obtaining a
continuous map (like plate 3.2) information from these
sheets has to be combined. However, the format enables
instant calculation of RMR and preparation of face log as
well.
3.3.2 GEOLOGICAL LOG OF DRILL HOLES:
Geological logs of drill holes, allow greater
standardisation. The logs of RLCC-1 and RRCC-5 (plate 3.7)
weje prepared as per format of NHPC's geotechnical field
book which, inturn, is based on Indian Standard Code.
However, in case of hole SPH-3 (plate no. 3.8) the format
was modified to accommodate data from point load tests and
RMR values. In case of drill hole logs also, too much
codification is not advisable. Certain departures have to be
made, sometimes, to accommodate additional information.
46
Table No. 3.1
RECOMMENDED SCALES FOR GEOLOGICAL MAPPING (U/G WORKS)
STAGE OF PROJECT
STRUCTURE SCALE
Planning; Pre-feasibility-
Investigation
Pre-construction
Construction
Tunnels Underground Caverns
Tunnels U/G Caverns
Portal Area
-- do --
Tunnels
Caverns
Portals
1:50,000 to 1:25,000
1:10,000 to 1:5000 1:2000 to 1:1000
1:500 to 1:200
-- do --
3-D geology maps on 1:100 to 1:200 scale
-- do --
Face maps on 1:100 to 1:500 scale

SIZES OF CORES AND DRILLING ACCESSORIES
47
Table No. 3.2
O W U . CORE
MoueMCXATxmf
RWT. RVSQ
e x EVA3. EVA!
OOU EWT
AJCVVL
AXAVV3. AV*! A M K AM09 AV>04
AXCrMV«krM( AMC3 Ad ACKJ
B X BVSG. BVVli
BVrCK BVV03
BW44
BXM
BXB (H^tt*^. BVVC3
D a BO-U
B 0 3
BXVA.
N X K X U
N W 0 4 NViOa
M 3 N O U
• < »
Kxvrt. por)
HC KX
HWCM
KX8 (V.V«ir^). HWCn
HQ
Hca HWG
CP P
PO pca
X
w J
Cor*
OMTMtar
O (mni
16.7
2 1 S
3 1 i
j a a
2SJ yxt 2tJ>
3XS
270
TJQ
t2a
*\o * 4 f l
GO
D&A
> 5 4
1 3 5
3 0 5
S 4 7
S 2 J
< 7 0
< ; 8
*S I
5 0 8
6 0 5
01 1
61 1
61 1
M i
61 1
76 , :
8 6 0
M O
83 1
Haim
CMmaUf
O D .
(rtvT<
» a
37 7
37 7
3 7 7
A72
« « 0
M O
4 & 0
4 8 0
4 8 0
M A
sog S0A
» A
SCO
&00
&oe 6 0 3
TS7
7S7
7S7
m 7 i 7
7t>7
7 5 8
02 7
tt? 7
e? 7
£ 0 3
8 6 J
0 6 3
W 2
) ? 2 8
122 8
W w V S l M r t M rod!
Wo*B V ^ t t B H tomwly d « V ^ M « l "X*
Q • • * » * r « i»*To a CO o» C C »«rt«« roch
'*>«« VVW*i« ira»io<ji h m w i i ^ ^ V ^ M t
•<* '«r t*g« h tpMcftng up o v w a i d r « r ^ terw
by r»mc>»«Tg r » f w o ^ r f y tor fr«ciL«rt icx3
W « * n g .
1
CABIMO
C w l r ^
DUmatw
CO {mrrd
Mi
4 4 0
401)
57 t
57 1
73 0
73 0
8 8 9
8 8 0
1143
1 U 3
10
(rtvn)
3 0 2
4 1 J
M.\
5 0 8
4 8 4
65 1
00 3
8 0 0
7 6 2
•
104 8
101 a
OEttKUUnOM
t
RX
EX .EW
!
Kt.
AW
BX
ow
NX
NW
HX
KW
f X - F l a h oouptod caung
No«c O t c s L M o tkncrMMd
• ( r f t T i c k n w i , partlaiArty «<
lh« m r M d i . W —hm oukvi It
•o<T»»i*>^ ttiotxjmi tn*n X
M r W i Okwng.
• Uo»tV OOntomii/Tg wtth
CXX>UA SUrxiTH
Metric Series
Popular Sizes
Hole dia 76 mm
Core dia 60 mm
Hole dia 36 ram
Core dia 20 mm
Also refer to IS Code 6926 (1973) (after Carter, T.G. (1995). Proc. Conf. Design & Const. U/G Str., ISRMTT pp.3-19)
48
T a b l e No. 3 .3
Drill Hole No.
RLCC-1
RRCC-5
SPH-1
SPH-2
SPH-3
SPH-4
SPH-5
Drill Holes
Length (m)
45.72
50.3
82.95
74.22
126.94
80.13
89.33
Drilling Agency
PDD, J&K Govt.
PDD, J&K Govt.
SWECO, Sweden
/ /
/ /
/ /
/ /
in Power
Brearing Deg.
-
-
160
235
176
54
2
House Area
Inc. Deg.
90
90
31
45
23
65
22
Mean RQD
70
57
23
24
26
31
21
Lugeon Value
33
30
0 - 60
-
0.20 - 60
1/WJT J
O UJ o cr» UJ O
»" > D ( _ 0 > Ol I J ' ^ 5 1 > r ) z c ~- - >^ 3) -
>
L J
O
o rn o r-o M
> ^ > u
o -n
z 0
51
Plate No. 3.3
W - -
--E
POLE PLOT OF 206 DISCONTINUITIES IN META-VOLCANICS RAJARWANI AREA
52
P l a t e No. 3 . 4
DISCONTINUITIES
^ IV. ^
S 3V.
II
- -E
6V.
9%
13'/.
16 V.
EH 5V.
CONTOURS OF POLE CONCENTRATIONS DETERMINED FROM PLATE 3.3

53
Plate No. 3.5
W----E
POLE PLOTI OF 76 DISCONTINUITIES IN META-VOLCANICS IN rROSS-ClITS

54
P l a t e No. 3 . 6
^
S
DISCONTINUITIES
3V.
6V.
II 1° l>
III . » !
• • < !
- -E
2 1 %
28 V.
30%
CONTOURS OF POLE CONCENTRATIONS DETERMINED FROM PLATE 3.5

• t fHOJ tC l P l a t e No. 3 , 7
:*^'
PROFORMA FOR PRESENTING DRILLING INFORMATION GEOLOGICAL LOG OF DRILL HOLE
HOLE NO.ILCC-I SHEET NO i
LOCATION Ponei!.VioiaiLt>R.iF-T U F T BEARING OF HOLE J^*^"^^ ^^^
COLLAR ELEVATION
CO ORDINATES
STARTED . ^ i - c - i - ^ ^ >
ANGLE WITH HORIZONTAL,
GROUNDELEVATION. COMPLETED
So"
2 . g - & - i c ^ - g ?
D
\ V
LITHOLOGY
DESCRIPTION
Ci)<» f«£-es €IKUC/^
SIZEOF COREPCS
c i s
t/ purao.1 i'f^O'v r
i c t m c a j <jj^^
A t «/ >^e^^^j.f/ed ^ti.ts
^ a o i e ^"^ " ^ y ^
o •"
/ 7 .
//-« (TV
» ^--» •
15_
^ t f ..^. (-/•'^ -J , Kot 5«>.ie <^« (pi>oi
'7V.r> i^"*.^ c^w^t,/•/^r*s7
So /y-K. Qi a
5^
tt>-J^ Co ' n, f'rs ^ ^-^^^^
/taJk-fc-j»Wi< k^^ f, dint
Ca'c'u. I'f'J O ft^.f
27
F EATUR E poUEB. Houifc CAVgRN
TOTAL DEPTH_Jt5172 j2K TYPE(S)OFCORE BARREL %mt^ DRILLING AGENCYPt>b>. T^i<g<.vr
STRUCTURAL C O N D I T I O N
DESCRIPTION
reiKt 9f\^MfcA
/^7 ro'/;;,!^-jA./o-<: y 7 8o' /ii^ CU
7h so' % (,/<
fr?o° xsfW
7to'2. i'^
(fro'-I A Via'.
7 S^ ^ • V ' i
7 5? '' A'^'^'^- C<i«
%
/^7 7 0 ' - 1 7 7 ^
i7 ry ' /<p^

??s01EC-T P l a t e No- 3 .8 PKoro i iMACon P R E S E N U N G U R I L L I N G I N F O R M A T I O N
GEOLOGICAL LOG OF DRILL HOLE
HOLE NO. 3 S H E E T N O . i
56
LOCATION PoWl^R. UoUif: M/fT CO ORDINATES_. BEARING OF HOLE. Jri.' ANGLE V ITH HORIZONTAL, p.^' COLLAR ELEVATION GRC^UNDELEVATIQN. STARTED. COMPLETED.
i^yz-0',-
F EATUR E.PotJ^A HCiJi^
TOTAL DEPTH. \z(,.9^m TYPE(5)0FC0RE BARREL^ r
LITHOLOGY
DESCRIPTION
SIZEOF C0REPC5
E E
o
oKf*
C'-Cl-aJr''o->r
12-
11
2i
QK(.i.n,^U , fyicU.- 7 7
STRUCTURAL CONDITION
DESCRIPTION RLL JOlMTS^Fol.. W.-<b. CoRt A y K
/^7 Sf'/^,p,^e^.
/Jo -^ jeuiJ] a^.e.
ACi£pJi. (u>'
DRILLING AGENCY.^/VA-<rg _
SUMMARY A N D ' INTERPRETATION'.
/J

ROCK CLASSIFICATION AND GEOLOGICAL MAPPING Location : AC^SS, TUNMPV 10 POlo€ 1 ^ ^Up t /^ fc Section : 2 - ^ 0 " Z ^ g ' " / Tvi •
57
Platje No. 3 . 9 Ref.No. J $ / 2 A - 0 Date : \h---Z'^%
A. RMR- CLASSIFICATION AND THEIR RATINGS
PARAMETER
SIrenglh of intact Uniaxial Comp rock mater ial , ressive strength rating
Drill core quality - ROD rating
Conditions of discontinuities
Rating
J- RANGE OF VALUES
>250MPa 100-250 MPa
very rough surfaces not continous.no separation unweathred wall rock
30
slightly rough surfaces separation
< l m m slightly weathered
walls 25
50-100 MPa I 25-50 MPa 5-25 1-5 <1 MPa
2 1 0
slightly I slickensided rough i surfaces or surfaces igouge <5mnn separation thick or <1 mm highly separation
weathered 1-5 mm wallL __ continuous
10
soft goug >5mm thick or separation >5mm continuous
Rock Type j
Tanawal schisl J Panial volcanics*>C[ Nummulitic shale
Ravelling ground Squeezing ground Swelling ground Rock bursts Eanhlike conditions
Abnormal conditions
Ground inflow per 10m water tunnel length
general conditions completely dry
<10 litres/min or
damp
10-21 litres/min or
wet
25-125 litres/mm or
ing
rating 15 10 d[iftpi
>125 litres/min or
flowing
B. RATING ADJUSTMENT FOR JOINT ORIENTATIONS
Stnke and dip orientations of joints
Tunnels
very
favourable
favourable
-2
Stnke Perpendicular to tunnel axis
Drue with dip
Dip 45-90
very
favourable
Dip 20-45 favourable
RMR VALUE
Drive against dip
Dip 45-90 Tair
Dip 20-45 unfavourable
Fair
w un
favourable
very
favourable
•10 -12
Strike psri l lel to tunnel Dip 0-20 axis I irresoective
of strike
H
Dip 45-90
very
unfavourable
Dip 20-45 fair unfavour
able
RMR Rating >60 Rock Class i(Goodi
>40 >20 <20
IIB[Fair] III [Poor) IV [Very poor]
LEGENDS
Foliation ' 7 i 5 * / > 5 * *
Ma;or|oinis C / ^
Clayfilled )0int
Crush zone
Geological o^errireak
(y j^ -

58
Photograph 3.1
Exposures of Meta-Volcanics at Sukhi Khasi Nullah-NHIA Crossing- Closely Foliated Joints and Other Joint Sets are Visible.


59
Photographs 3.2 and 3.3
Portal of Access Tunnel to Power House in Meta-Volcanics with Perfect Over head Stability. In Photo 3.2 the Contact of Tanawal and Panjal Volcanics is also visible.

59A
Photograph 3.4
Drill Cores kept in Core Boxes/ Zones of Core loss are clearly marked.
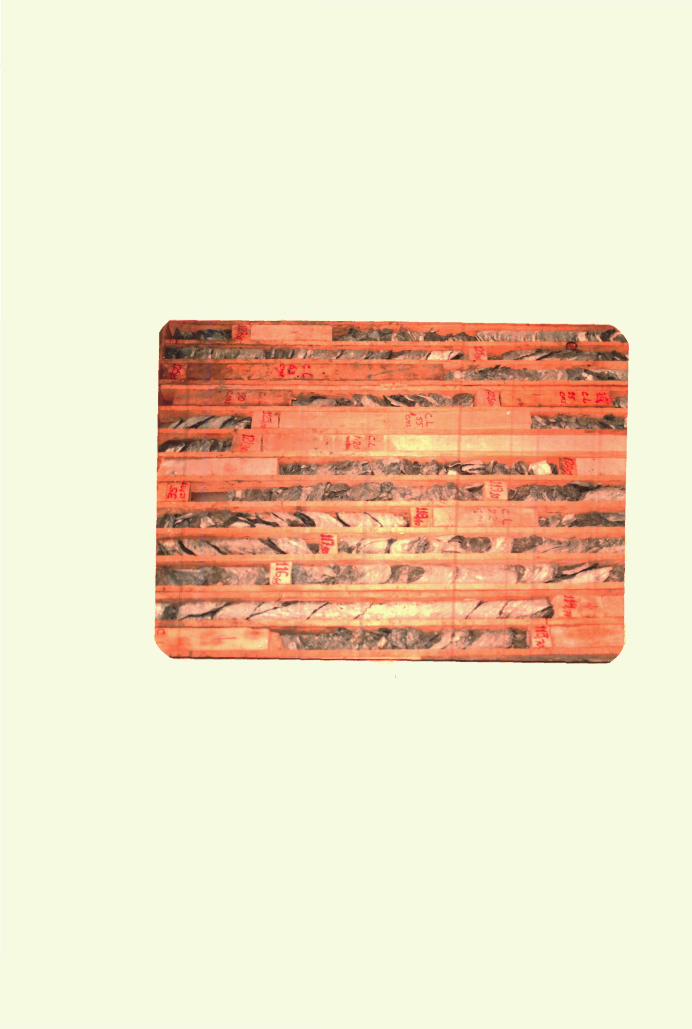
ukA^' ^ ^*%3dl^^>f^^-i/%d^.
tit ^ 0 ^ , /•

CHAPTER IV
ENGINEERING PROPERTIES

60
4. ENGINEERING PROPERTIES:
4.1. STRENGTH AND OTHER PROPERTIES OF ROCKS:
The strength of rocks is one of the most important
parameters for evaluating a rock medium for design of
underground openings. In many cases the stability of the
tunnels is related to strength of rock mass as is evident in
case of stress induced failures. Present day RMR-system of
geomechanical classification requires the input of point
load index or Uniaxial Compressive Strength (UCS). The
procedure of actual lab. measurement of UCS is rather
cumbersome and requires specialised equipment. Since, the
load required to break the specimen under point load
conditions is much less, the point load test has been
deployed instead of UCS.
4.1,1 POINT LOAD TEST:
This test is for strength classification of rock
materials requiring no special preparation and the procedure
is relatively simpler. It is necessary that the core samples
being tested have a length about 1.5 times the diameter. The
equipment for this test consists of two hardened steel
points on which core is loaded and pressure applied through
hydraulic pump. The pressure required to break the sample is
obtained from a gauge which is used alongwith diameter of
core samples to find out point load index (Broch and
Franklin, 1972). Moreover the point load has to be corrected
to IS50 (plate no. 4.1) (which refers to diameter 50 mm of

61
specimen so that UCS can be calculated (Bieniawski, 1975).
In India the equipment for point load index is manufactured
by AIMIL, Lawrance and Mayo etc.
BEMEK ROCK TESTER:
Manufactured by Geokon Instruments, Sweden, Bemek Rock
Tester (Photo 4.1) is more advanced version of point load
tester equipped with a microprocessor. It consists of four
main units.
- Scanner and Processor
- Loading Frame
- Hydraulic Pump
- Bridfe Box.
The hydraulic pump is delivered with hydraulic oil in
the system. It is connected to the loading frame by the
hydraulic hose. The pressure gauge on the hydraulic pump is
connected via the circuit either direct to the input on the
scanner or via the bridge box. The selection of contacts
depend upon test type and test set-up. The scanner can
either be connected to 220V AC main or 12V DC battery. The
miprocomputer has a general design with four basic
programmes:
Define Programme (D)
Check Programme (C)
Measure Programme (M)
Print Programme (P)
Further details are available in the equipment manual.
62
The samples are loaded between steel points on the
loading frame and pressure is applied hydraulically until
the specimen breaks. The instrument automatically calcuates
the point load Index (Is) and Is50 using the correction
chart (plate 4.1). It also gives Uniaxial Compressive
Strength (UCS) by the equation:
UCS = 24.IS50
The pressure manometer readings can be used in case the
logger is not working or is not available. The point load
index is given by :
Is = 800 /D^
where P is pressure required to break the sample (Mpa).
D is core diameter (mm).
In case of drill hole no SPH-3 (plate no. 3.8), 24
tests have been conducted at different levels in meta-
volcanics. Eleven samples were taken from moderately
foliated bands, eight from closely foliated and five from
very closely foliated. The mean values are given in table
4.1.
An effort was made to have sample moisture content in
samples more or less saturated as at site. The presence of
water does have an effect on the strength of rocks (Colback
and Wild, 1965). In case of shales and sandstones the
presence of water causes the UCS to drop by a factor of 2 as
compared to over dried specimens. Broch (1974) gave
following ratios of UCS of dry to saturated specimens:
63
Quartzdiorite 1.5; Gabbro 1.7; Gneiss (perpendicular to
foliation) 2.1; Gneiss (parallel to foliation) 1.6.
Therefore moisture content is an important factor while
assessing the UCS. The specimens if left in the laboratory
for various periods, produce scatter in experimental
results. Ideally, the specimen should have the same moisture
content while measuring UCS as would appear at the time of
excavation. Hoek and Brown (1980) have even recommended that
in case of doubt, the specimens be tested saturated rather
than dry. The rock cores should generally be stored in a
damp room to maintain a constant level of moisture in them.
4.1.2 Schmidt Hammer:
A convenient method of estimating UCS is by Schmidt
Hammer (Deere and Miller, 1966; Carlsson & Olsson, 1981).
This works on the amount of rebound from the measuring
surface. It is quite handy to use in field. The cores are
placed in the cradle (photo 4.2) end the hammer is slowly
but firmly pressed on the sample and the amount of rebound
from the sample is recorded on a graduated scale which is
knpwn as Schmidt Number. Since UCS and Schmidt Number have a
definite relationship the former can be calculated from
these values as given by Deere and Miller (1966) (plate no.
4.2). Eight samples from drill holes in Rajarwani area were
tested by Schmidt Hammer (table 4.2). The average UCS is 134
Mpa whereas after applying dispersion (from plate no. 4.2)
the average range is 82 - 185 Mpa. These samples of meta-

64
volcanics were moderately foliated.
The results of Schmidt Hammer in the range of 83-185
Mpa are comparable with results obtained by Bemek Rock
Tester. Thus the Schmidt Hammer has a fair reliability in
low to medium strength rocks.
4.1.3 Sonic Viewer:
Sonic viewer 170 (model 5228) developed by OYO
Corporation, Japan has been used for measuring dynamic
youngs Modulus, Poisons Ratio and Modulus or Rigidity on
rock samples. It is based on the principle of measurement of
Ultrasonic wave velocity in rock by attaching P and S wave
transducers to the core samples. The velocities of P and S
waves can be measured and can be used to calculate their
dynamic elastic constants. It is a compact instrument (photo
4.3) integrating measuring unit, CRT display unit, printer
unit and disk unit into it. The special features are CRT
display of data acquired by the instrument, printer output
and its storage on floppy diskettes.
Three meta-volcanics core samples of 60 mm diameter
from massive bands were prepared by cutting and levelling
their faces. The samples were from bore holes SPH-3 (length
116 mm), SSS-1 (length 112 mm) and SPH-4 (length 173 mm) of
Rajarwani area. The results incorporate travel times and
Pwave velocity (5.04 - 5.77 km/sec), S-wave velocity (2.70 -
3.39 km/sec). Poisons ratio (0.24 to 0.30), Modulus of
rigidity (G) (1.96 to 3.11 x 10^ Kgf/cm^), Young's Modulus

65
(E) = 5.11 to 7.68 X 10^ Kgf/cm^ and volume elasticity (k) =
4.25 X 5.17 10^ Kgf/cm^. These dynamic values when compared
with static values (CSMRS based on insitu tests) gave
modulus of elasticity as 2 to 6 x 10^ kg/cm^ which is
expectedly on lower side.
4.1.3.1 Field Seismic Velocities:
For delineation of overburden-bedrock interface in
Civil Engineering Projects, Seismic refraction surveys are
carried out. The field p-wave velocities are generally lower
than velocities through an intact sample due to the
occurrance of discontinuities in rockmass. As such, the
amount of difference in lab. field velocities is taken as a
measure of rock quality. In NHPC, the field seismic surveys
are carried out using 24-channel Terrolac Seismograph (ABEM,
Sweden).
The volcanics similar to those found in Rajarwani, gave
velocities 3.2 to 3.4 km/sec (Sen,1993) which are
significantly lower than the lab. velocities (5.04 to 5.77
km/sec) measured by Sonic Viewer.
Hwong (1978) proposed a classification of rockmass
structures and suggested methods of evaluation of rockmass
quality. He used the parameter of intactness of rockmass
calculated using velocities of elastic waves .-
I = Vm^/Vr^
where I is rockmass intactness Vr is velocity of longitudi
nal wave in rock specimen. Vm is velocity of longitudinal

66
wave in rockmass.
The I value of 0.377 was obtained for Panjal volcanics
which are useful in engineering geological evaluation (see
tables 4.3 & 4.4).
For I value range 0.30 - 0.60 11- category (table 4.3 &
4.4) attention is required with respect to combination of
rocks, occurrance, nature of bedding (foliation) surfaces
especially weak seams interbedding sliding surfaces, etc.
The description is in agreement with the field
characteristic of the area.
4.1.4 Measurement of Insitu Stresses:
Stresses in rockmass are due to superincumbent rock and
geological history. During underground excavations, the
stress field gets disturbed and at times, insitu stresses
exceed the strength of rockmass resulting in failures. The
softer rocks like shales and other thinly layered softer
formations may undergo squeezing whereas brittle rocks might
burst. Slabbing of side walls in steeply dipping rocks is a
phenomenon associated with excessive stresses. In order to
understand the problems associated with high stresses, their
measurement of insitu stresses is required. There are essen
tially three methods of measurement -
(i) Flat jack method (ii) By Over-Coring Techniques
(iii) By Hydrofracturing.
(i) Flat Jack Method: One of the oldest techniques, it
requires access to the underground location. Its main

67
disadvantage is measurement of stresses in rocks which are
disturbed highly by blasting. The vertical stresses at
Rajarwani were obtained as 3.3 to 3.9 Mpa and horizontal
stress values 4.3 to 4.6 Mpa (CSMRS) (Dhar, 1986).
(ii) Over-Corning Technique :
Developed in early seventies, various techniques of
using strain gauges have been described by Rocha & Silverio
(1969), Worotincki and Walton (1976) and Blackwood (1977).
An overcoring method developed by the Swedish State
Power Board known as "Hiltcher-Leeman Technique" has been
used in Rajarwani drift right cross-cut by the author, Rai,
A. & other NHPC officers. The measuring system consists of a
cylindrical probe device 60 mm in diameter and 1500 mm in
length. At the end of the probe a strain gauge carrier known
as rosette is attached. The vertical probe hangs through a
carrying cum-measuring cable. A magnetic compass is pushed
into the probe in the bore hole for orientation. The measur
ing unit remains on ground surface. The procedure involves
drilling of 76 mm dia hole and smaller 30 mm dia hole at the
required depth. Strain gauges are attached to the walls of
smaller hole by a probe device and initial readings (before
attachment) and subsequent readings (from the hole) are
taken through a cable attached to measuring unit. The probe
and cable are removed and once again 76 mm drilling is
carried out and the core alongwith strain gauges is ob
tained. Final readings from the core are taken by recon-

68
necting strain gauges (attached to the core) to the measur
ing unit. The readings are taken at prescribed intervals
and the data analysed by a computer programme to find out
the stress field. The results (also reported in Heiner,
1993) thus obtained give the following:
Beta/Bearing (Deg.)
Principal Stress 37.2/291.6 11 Mpa
Intermediate Stress 2.7/ 23.6 6.1 Mpa
Minor Stress 57/117.1 0.8
(NHPC Insitu Stress Measurements) Moreover the horizontal stresses (Max. 7.3 Mpa) were
reported to be more than Vertical stresses (Max 4.5 Mpa)
which should have been 9.5 Mpa as per theoretical
calculation. It is observed that the principal stress and
the maximum horizontal stress are aligned sub-parallel to
orographic trend at site. This is in consonance with the
observation of Hoek & Brown (1980) that the horizontal
stresses are parallel or normal to mountain chain.
Dhar (1986) had estimated that the stress field by
mountain stress analysis. His results are as follows :<^z
109.6 Kg/cm^/J^y = 75.6 Kg/cm^/Tx = 43.15 kg/cm^, principle
stress from joint analysis 1'1 = Bearing (Deg.) 110,
Inclination (Deg.) 20, '3'2 = 330, 79," 3 = 205, 12, principal
stress direction from drainage analysis -^1 (max) Bearing
(Deg.) 125; 3 (Minimum) 215.
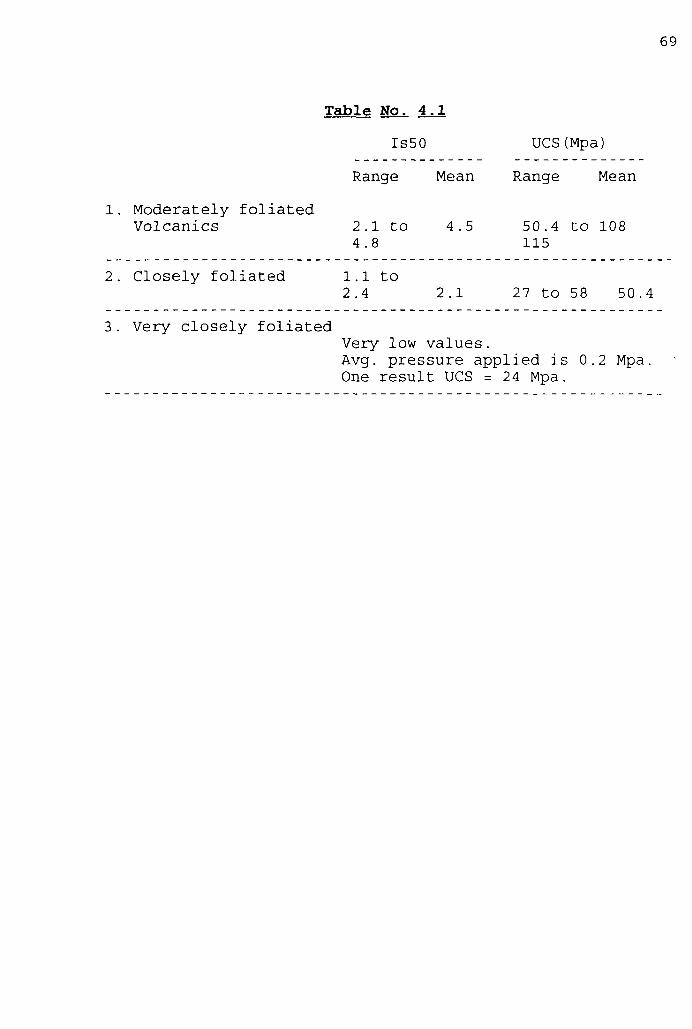
69
Table No. 4.1
Is50 UCS(Mpa)
Range Mean Range Mean
1. Moderately foliated Volcanics 2.1 to 4.5 50.4 to 108
4.8 115
2. Closely foliated 1.1 to 2.4 2.1 27 to 58 50.4
3. Very closely foliated Very low values. Avg. pressure applied is 0.2 Mpa. One result UCS = 24 Mpa.
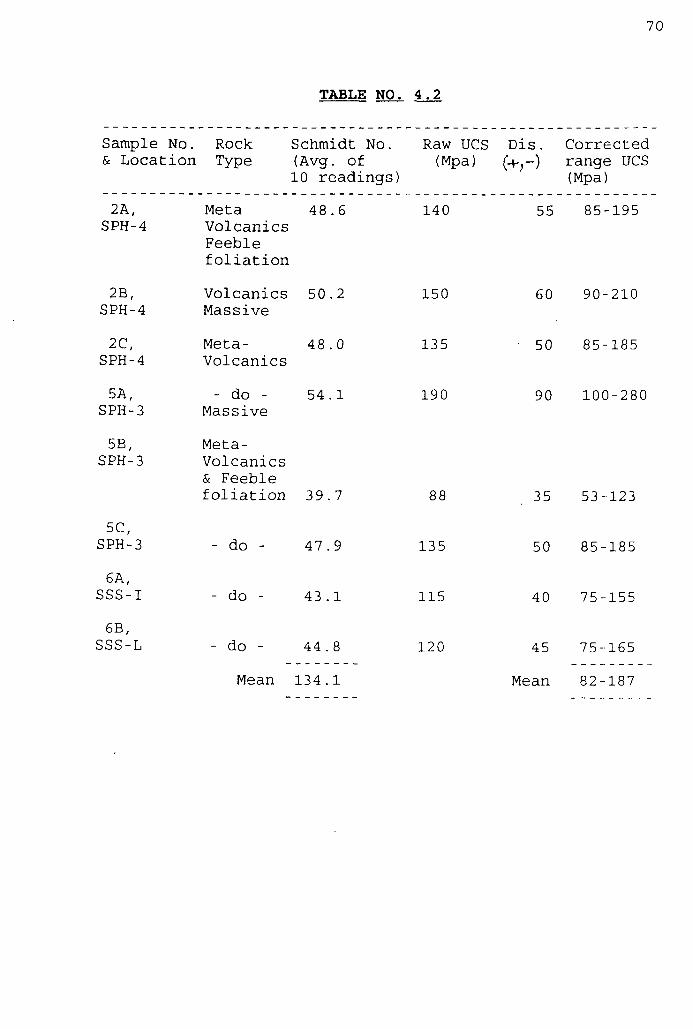
70
TABLE NO. 4.2
Sample No. Rock Schmidt No. Raw UCS Dis. Corrected Sc Location Type (Avg. of (Mpa) (-4-;-) range UCS
10 readings) (Mpa)
2A, SPH-4
2B, SPH-4
2C, SPH-4
5A, SPH-3
5B, SPH-3
5C, SPH-3
6A, SSS-I
6B, SSS-L
Meta Volcanics Feeble foliation
Volcanics Massive
Meta-Volcanics
- do -Massive
Meta-Volcanics & Feeble foliation
- do -
- do -
- do -
Mean
48
50
48
54
39.
47.
43.
44.
134.
.6
.2
.0
.1
.7
9
1
8
1
140
150
135
190
135
115
120
55 85-195
60 90-210
50 85-185
90 100-280
35 53-123
50 85-185
40 75-155
45 75-165
Mean 82-187
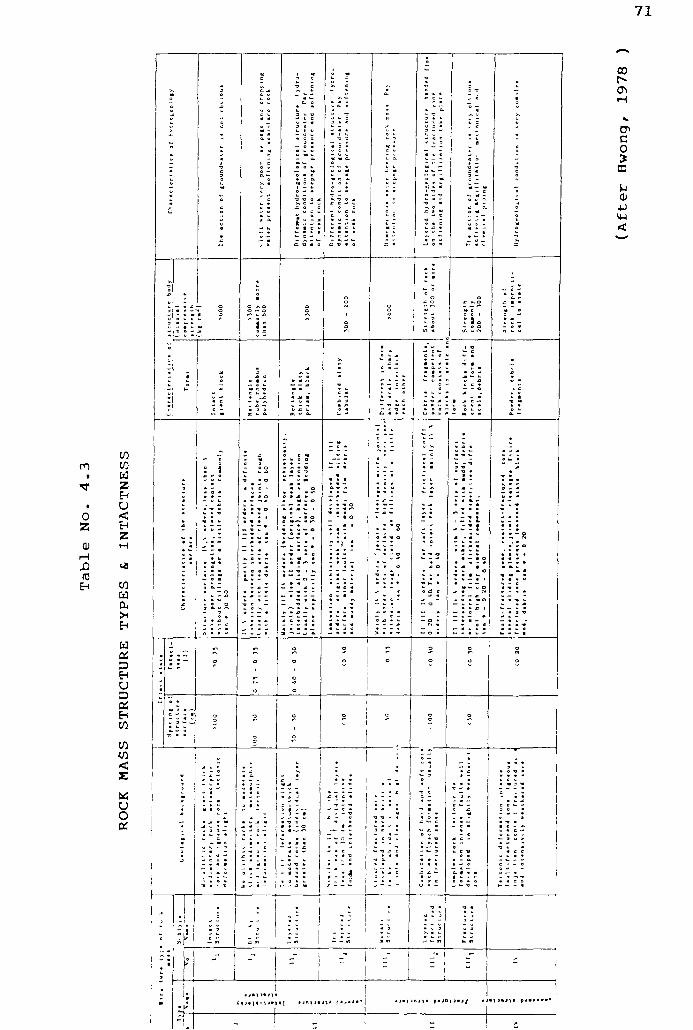
71
ro
O Z
(0 EM
w z E l u < E-i Z
u
> EH
Cs] Oi D E-t U D
a; EH
w
w
<
o !
1
1
z
I
I
1
I
i l l
I
I : •: ::
: i
i
I
i
1 .
1 •
'.'• t
i
J
j
'
•
\ i
i
i 1
• 1
I'll
ill i : .
m ?
s
: I
-
1 : . -IE
y
i
11
'-Si
r:
I
-.i
a n *
' ;
"
- 1 1
!ii i m
1
: . s ?
: = • : ' JT
CO.
• 4 5
: = •
mi
1
1
1: n
= :
^^: : ! : ' ---.': • • ] •
1:11 -li
: : • ^
lit]
s
? :
r ;
1!
1
111 ill
• - •
° • : " > i;:
Uf: ' . ' i
o
s i ° 1
:
z -- 1 1
m\ # i m i » i j * ( * i « * » i
- ,
r'
ill
i 5
1
: i -„-
'-]
w ° ; E-
. : 5
III
o
1
in
: : i
-
---.!
« — « e ^ ^ •
^ - « MO
— • • -
o
o
o
c « • • • t- r C
^ '
=
1 - j
1 ?
1
5
1 i:
iii
;1 = : H : .
Vzli
iii:
= ]? =
- 1
1 • 1 f i \ * p J O » « » » -
i
CO
en c o
u 0)
<

72
u H EH
w H w EH U <
u
0 . - 0 a. o c
c - -3 C k.
; a":
C u Jf O ? t. - u o J J k. C *
o o
, o
%, e
c; a
« c
^ » o
^ 0
c 0
-
a
» o
X
«
• a.
c • a
^
O
e • M
u V
a o
>s X,
* V
m
5
c TJ
« M
o
t
f
c
3 * : K - w < « « G •
X. a - •
C O * c * « * •
2r
M « p c •
O 3 • -* • • C
• o
fl Jt
e k q
X B a
• ». •
c M • -• 3 « "«
*. t c
I:
- « u «
• • — a. e w ^ « « *• fl - a «
w
«
k<
u
n
•
i .
• K
-* a
• ^< d
w
• k
• • J i
•
7
m e
m
^ c B .
• ^ £
X
*-
C
« 1*1
< e
t »
c tf
« c o
9
«
• >s
J»
^
• 0 z (U
H
u (0
Ctl « D EH U D OS E-t M
w w
£
US u o 05
- c a •
• 9 m
c t. t. « 3 «
C O - te • - J i O M ^ h. O w c o s e c *< L.
- B k
c *- •*
. — o
• 3 O • ^ —
• c - -a t . -
:- r
/• T ) « C C O C V , k O * W « U • - k
D * •« X C C • £ « « o o (rt -- - V c k
-O 3
* P a * o
a •• M -n
c • I c o - — b • « X • 3 « C - O J O
t> 3 0- *.
• • « e • « k • « *-G • k k
i i » * 1 ' " t M l - * « i u i j j n | j n j | « p j j 4 j ( « ] .# j n I j n J I « p.* j n I >« J j

73
P l a t e No. 4 . 1
l s (50 )
«n 3
30 AO 50 50 70 80 90 TOO
COREOIAMETER D . m m
CORRECTION CHART FOR Is 50
( From K.T-H., Stockholm )
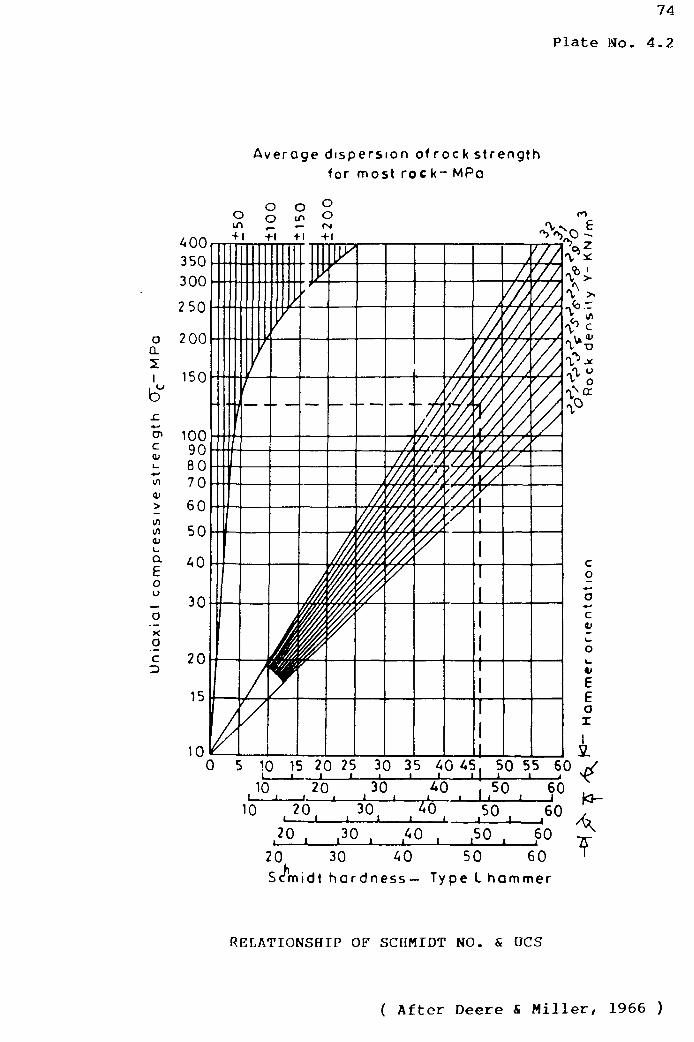
74
P l a t e N o . 4 . 2
Average d ispers ion of roc k s t rength for most roc k- MPa
o o +1
o ir •— + 1
O
o fSI
+1
a
Q.
I
en c
> in i/i
i_ a 6 o o
X O c 2
20 30 AG 50 60 Scmidt hardness— T y p e L h a m m e r
RELATIONSHIP OF SCHMIDT NO. & UCS
( A f t e r D e e r e & M i l l e r , 1966 )

75
Photograph 4.1
Bemek Rock Tester with Microprocessor
Photograph 4.2
Schmidt Hammer with Cradle

ftH. " ^ —iHt

76
Photograph 4.3
Sonic Viewer with Printout of Results.
Photograph 4.4
Carl Zeiss Microscope with Swift Point Counter.


CHAPTER V
PETROGRAPHY

77
5. PETROGRAPHY:
Petrography has an important role in engineering
geological studies especially in the complex Himalayan
Geology. It provides indications of major tectonic disturb
ances and demarcate areas of structural weaknesses. From
microscopic study of Panjal Volcanics, Wadia (1928) found
that the flows were chloritisede Samples from tunnels in
Mohura-Rajarwani area (refer plate no. 3.1) in Panjal vol
canics were studied petrographically and the results are
reported below:
Sample No. Location and Rock T' ,ype
1. URI-3 Headrace tunnel at Ch-8000m near Mohura village. Very closely foliated meta-volcanics.
2. URi-ii
3. URI-12
Access tunnel to surge shaft at chainage 730 m (near Rajarwani village). Moderately foliated meta-volcanics.
Access tunnel toStitge shaft at chainage 700m closely foliated meta-volcanics.
4. URI-13 Access tunnel to surge shaft at chainage 560m. Very closely foliated schistose meta-volcanics.
5. URI-14 Access tunnel to surge shaft at chainage 538m Moderate to closely foliated meta-voioa^nics .
>.? ?*>.y-

78
6.URI-15 Access tunnel to surge shaft at chainage 525m near Rajarwani village, closely foliated meta-volcanics.
7. URI-16 The same tunnel at chainage 523 m. Moderately foliated meta-volcanics.
8. URI-17B Headrace tunnel at chainage 8144m (near Mohura village) very closely foliated meta-volcanics (with carbonaceous material).
9. URI-19 Access tunnel to machine hall at chainage 63 m (Rajarwani area) very closely foliated schistose meta-volcanics.
5.1 MEGASCORIC STUDY (GROUP - I).
Sample Nos :- URI-11, URI-12, URI-14, URI-16,,
Feebly foliated hard and dark grey, compact, fine grained
volcanic rock with quartz calcite veins in URI-16. Sample No
URI-12 is closely foliated & shows preferred orientation of
flaky grains. The rock are composed of dark coloured miner
als .
5.2 MICRSCOPIC STUDY (GROUP -I):
5.2.1 Texture :
Mostly fine grained, a few clusters of larger grains
are seen. Schistisity is not well developed. Orientation of
grains with longest dimeasion aligned parallel to foliation
specially in micas. The bigger grain cumulates too are
elongated in foliation direction. They can be infered as
glomeroporphyritic texture with feeble Lepid^oblastic trend.

79
However, sample no. URI-12 shows a no. of bigger green
coloured grains which do not follow preferred direction. The
matrix is made of flaky grains aligned in foliation direc
tion. The texture varies from IcpidX'oblastic to proporphyro-
blastic.
5.2.2 MINERALOGY :
The minerals show intense alteration to calcite,
epidote etc with little or no feldspar left. The bigger
grains of calcites show glide twinning and rhombohedral
cleavage. They are elogated in foliation direction. Their
cleavage, twinking and high order white inference colours
distinguish then.
Epidotes of variety pistacite are eaisly identified.
They exhibit typical pleochroism in various shades of
greenish yellow colour. They show slight zoning also.
Quartz is about 20-35% of the rocks. The quartz grains in
many casa are completely surrounded by caleite grains which
can be attributed to crystalloblastic order where quartz is
at the bottom. In strained quartz grains UE angle is
estimated to be 26-30°. A small percentage of sericite
aligned along feebly developed folation'direction also
occurs. Chlorite is main mineral in simple No URI-14. It is
green coloured in plain polarised light, weakly pleochroic
with low to moderate relief. Under cross-polars bluish grey
interference colours can be seen.

80
In case of URI-12, chloritoids make bulk of the rock.
They are sub-hedral, greenish-brown with moderate to high
relief and weakly pleochroic on (001) sections. Under high
megnification rhombohedral cleavages are seen under
crossnicols. It can be recognised by anamolous interference
colours resulting from strong dispersion and absence of
extinction.
Some flaky chlorites of geenish colour are also
present. They have very low birefringence and show 'berlin
blue'interference colours.
On URI-16 also they are present in substantial
quantity. The rocks are identified as Meta-volcanics (Green
Schists).
5.3 MEGASCOPIC STUDY (GROUP II)
Sample Nos :-URI-3, URI-13, URI-15, URI 17B, URI-19.
Dark grey, fine grained, very closely foliated rocks with
dark coloured minerals. Sample No.15 is relatively softer.
5.4 MICROSCOPIC STUDY (GROUP II)
5.4.1 Texture :
Completly fine grained with very few big crystals.
Mostly platy and tabular grains are seem with a preferred
orientation of grains along schistosity. The texture can be
described as L^pidl^blastic
5.4.2 Mineralogy :
Chlorite is abundant (40-60%) in these samples.
Epidotes recognised by their yellowish - green weak

pleochroism, high relief and strong birefringence make up
about 20% of modal minerals. Quartz occurs as large grains
and smaller elongated crystals making the matrix. They are
upto 20% in some samples and have sutured contacts. One of
the quartz graims (in URI-13) clearly shows undualatory
extinction with range of UE 50-55 . Calcites are also
present with characteristic twinkling and glide twin planes.
Small flakes of Sericite aligned in foliation direction
indicate alteration. Black opaques are also identified. The
rocks are identified as Green Schists (Meta-volcanics).
5.5 METAMORPHISM :
Volcanic basalts under low grade of metamorphism
produce green schists with Chlorite-Epidote- Calcite mineral
assembalage. The effect of stress is evident by the presence
of strained quartz grains and the mineral chloritoid which
is dependent upon stress for stability. Though uncommon it
can be found in low grade metamorphic and hydrothermaly
altered volcanics. The latter show strong alteration
products in the form of calcite, chlorite and sericite.
Consequently, feldspars are conspicuous by their absence.
Sutured contacts of quartz is another significant
observation. Foliation is due to preferred orientation of
flaky minerals like mica and chlorite and elongation of
other grains. The Panjal volcanics have undergone low grade
metamorphism in this area. As such, they are referred to as
Meta-volcanics or Green schists.

82
5.6 PETROGRAPHY VS ROCK STRENGTH :
Ghosh (1980) correlated petrological characteristics
with engineering properties of Deccan Basalts. He has shown
a relation between percentage of phenocrysts with
compressive strength. In Uri area, compressive strength of
of foliation. Moderately foliated rocks have a mean UCS of
108 Mpa, closely foliated 50 Mpa and very closely foliated
less than 25 Mpa. It was observed that the percentage of
phenocrysts/porphyroblasts and ground mass also varies with
degree of foliation. A more detailed study was undertaken to
investigate further. The percentages of
phenocrysts/porphyroblasts were calculated using Swift point
counter attached to Carl Zeiss microscope (photo 4.4).
Overall, eight samples were studied in two groups.
Group I Group II
Moderate foliation Close to very close foliation
URI-11 URI-13
URI-12 URI-15
URI-14 URI-19
URi-16 URI-3
In model point counting of each sample a count of 1000
points was fixed for each run. For each sample, five runs
through repetition were carried out to minimise error and
their averages taken. It is seen that the scatter is less as

83
evident from table nos 5.1 to 5.8. These are considered ac
ceptable for the present study. The overall averages from
table no. 5.1 to 5.8 are reported below :-
Group I (moderately foliated) PC/PB = 21% , GM = 79% .
Group II (very closely foliated) PC/PB - 6% , GM = 94% .
The overall analysis reveals that the Uniaxial compres
sive strength of Group I varies between 64 and 115 Mpa with
mean being 108 Mpa, for Group II it varies between 27-58 Mpa
with mean at 50.4 Mpa. The increase in phenocrysts/por-
phyroblastas from 6% to 21% has caused increase in UCS from
50.4 to 108 Mpa.
Ghosh (1980) has observed that massive, dense varieties
of Deccan basalts have UCS of 119-280 Mpa which he considers
due to presence of 60-70% phenocrysts. An increase of 5% to
10% in phenocrysts causes UCS to rise by 20-25 Mpa.
The present study reveals that 14% increased (Group II
6%, Group I 21%) caused the UCS to rise by 50 Mpa which is
in fair confirmity with the observation of Ghosh.

84
Table No. 5.1
Sample No: URI-11
Moderately foliated meta-volcanics,magnification 10*.2 ,
average size of phenocrysts/porphyroblasts (PC/PB) >0.2 mm.
Run no.
Total count
PC/PB GROUND (GM)
PC/PB% GM%
I
1000
164 836
16.4 83.6
II
1000
181 819
18.1 81.9
III
1000
232 768
23.2 76.8
IV
1000
193 807
19.3 80.7
V
1000
162 838
16.2 83.8
MEAN
-
186.4 813.6
18.64 81.36
S.D.
-
28.5 28.5
2.85 2.85
Average % of PC/PB 19
Average % of GM 81
Table No. 5.2
Sample No. : URI-12
Moderately foliated meta - volcanics,
magnification used 10*0.2, size of PC/PB = 0.1 mm to 0.4 mm.
Run
I II III IV V MEAN S.D.
Total 1000 1000 1000 1000 1000 count
PC/PB 203 185 163 164 171 177.2 16.8 GM 797 815 -837 836 829 822.8 16.8
PC/PB% 20.3 18.5 16.3 16.4 17.1 17.72 1.68
GM% 79.7 81.5 83.7 83.6 82.9 82.28 1.68
Average % of PC/PB =17.7
Average % of GM =82.3

85
Table No. 5.3
Sample No. : URI-14
Moderately foliated meta - volcanics,
magnification used 10*0.2, size of PC/PB = two generation.
Run
Total count
PC/PB GM
PC/PB% GM%
I
1000
198 802
19.8 80.2
II
1000
205 795
20.5 79.5
III
1000
190 810
19.0 81.0
IV
1000
217 783
21.7 78.3
V
1000
202 798
20.2 79.8
MEAN
-
202.4 797.6
20.24 79.76
S,
9 9
0, 0,
.D.
.9
.9
.99
.99
Average % of PC/PB =20.0
Average % of GM =80.0
Table No. 5.4
Sample No. : URI-16
Moderately foliated meta - volcanics,
magnification used 10*.2, size of PC/PB = >0.1 mm
Run
Total count
PC/PB (GM)
PC/PB% GM%
I
1000
237 763
23.7 76.3
II
1000
270 730
27.0 73.0
III
1000
267 733
26.7 73.3
IV
1000
269 741
26.9 74.1
V
1000
264 736
26.4 73.6
MEAN
-
26! 740
26.1 74.0
S.D.
-
13.8 13.2
1.38 1.32
Average % of PC/PB = 2 6.0
Average % of GM =74.0
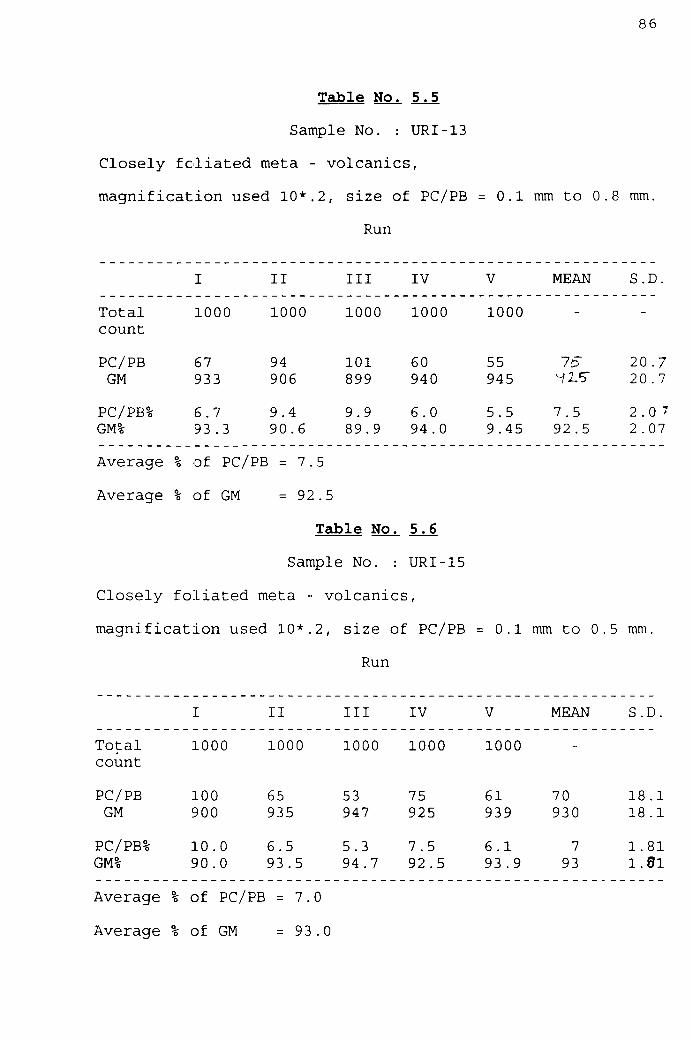
86
Table No. 5.5
Sample No. : URI-13
Closely foliated meta - volcanics,
magnification used 10*.2, size of PC/PB = 0.1 mm to 0.8 mm.
Run
Total count
PC/PB GM
PC/PB% GM%
I
1000
67 933
6.7 93.3
II
1000
94 906
9.4 90.6
III
1000
101 899
9.9 89.9
IV
1000
60 940
6.0 94.0
V
1000
55 945
5.5 9.45
MEAN
-
15 W2-5"
7.5 92.5
S.D.
-
20.7 20.7
2.07 2.07
Average % of PC/PB =7.5
Average % of GM =92.5
Table No. 5.6
Sample No. : URI-15
Closely foliated meta - volcanics,
magnification used 10*.2, size of PC/PB = 0.1 mm to 0.5 mm.
Run
Total count
PC/PB GM
PC/PB% GM%
I
1000
100 900
10.0 90.0
II
1000
65 935
6.5 93.5
III
1000
53 947
5.3 94.7
IV
1000
75 925
7.5 92.5
V
1000
61 939
6.1 93.9
MEAN
-
70 930
7 93
S.D.
-
18.1 18.1
1.81 1.91
Average % of PC/PB =7.0
Average % of GM =93.0

87
Table No. 5.7
Sample No. : URI-19
V- Closely foliated meta - volcanics,
magnification used 10*.2, size of PC/PB = 0.1 mm to 0.5 mm.
Run
Total count
PC/PB GM
PC/PB% GM%
I
1000
63 937
6.3 93.7
II
1000
37 963
3.7 96.3
III
1000
52 948
5.2 94.8
IV
1000
61 939
6.1 93.9
V
1000
57 943
5.7 94.3
MEAN
-
54 946
5.4 94.6
S.D.
-
10.3 10.3
1.03 1.03
Average % of PC/PB =5.4
Average % of GM =94.6
Table No. 5.8
Sample No. : URI-3
Very closely foliated meta - volcanics,
magnification used 10*.2, size of PC/PB = 0.1 mm to 0.6mm.
Run
Total count
PC/PB GM
PC/PB% GM%
I
1000
29 971
2.9 97.1
II
1000
29 971
2.9 97.1
III
1000
36 •964
3.6 96.4
IV
1000
37 963
3.7 96.3
V
1000
39 961
3.9 96.1
MEAN
-
34 966
3.4 96.6
S.D.
-
4.6 4.6
0.46 0.46
Average % of PC/PB =3.4
Average % of GM =96.6
CHAPTER VI
ROCK MASS CLASSIFICATION & SUPPORT SYSTEMS

88
6. ROCK MASS CLASSIFICATION & SUPPORT SYSTEMS
6.1 ROCK MASS CLASSIFICATION
Rock mass classification systems serve as an important
tool of communication between the field geologists and the
designers. The need to classify tunnelling media into units
of similar behaviour has been greatly felt for a long time.
The classification systems basically help in relating one's
own set of experience to conditions encountered by others.
They are a useful tool in the hands of designers for
understanding the behaviour of rockmass on which the rock
support can be based. Several classification systems of rock
mass have been proposed and numerous references are
available on their application. Some of the important
classification systems developed over the years are
discussed in the following paragraphs:-
6.1.1 Terzaghis Rock Load Classification:
The first systematical approach toward quantifiying the
tunnelling media came from Terzaghi in 1946 ( See Hoek and
Brown, 1980). He proposed a rock load classification on the
basis of his experience in steel supported railway tunnels
of Alps. He estimated rock loads in steel arches in various
types of ground.
A thorough geological survey before tunnel design was
emphasised to delineate rock defects which effect the
overall stability. The following tunnelling terms were given
by Terzaghi:-

89
(i) Intact Rock: Free of joints or hair cracks. During
blasting, there are two conditions in breaking, spalls may
drop off the roof several days or hours after the blasting.
This is spalling condition. The other is popping condition
involving spontaneous and voilent detachment of rock slabs
from the sides or roof.
ii) Stratified Rock: Comprising of individual strata with
little or no resistance against separation between them.
The strata may or may not be weakened by transverse joints.
In such rock, spalling condition is quite common,
(iii) Moderately Jointed Rock: Contains joints and hair
cracks, but the blocks between joints are intimately
interlocked requiring no lateral support on vertical walls.
In rocks of this type, both spalling and popping conditions
may be encountered.
(iv) Blocky and Seamy Rock: Consists of chemically intact
or almost intact rock fragments which are entirely separated
from each other and imperfectly interlocked. In such rocks,
vertical walls may require lateral support.
v) Crushed but Chemically Intact Rock: It has the
character of crusher run. If most or all the fragments are
as small as fine sand grains and no recentation has taken
place, crushed rock below the water table exhibits the
properties of a water bearing sand.

90
vi) Sqeezing Rock: Advancess slowly into the tunnel without
perceptible volume increase. A prerequisite for squeeze is a
high percentage of microscopic and sub-microscopic
particles of micaceous minerals or of clay minerals with a
low swelling capacity.
vii) Swelling Rock: Advances into the tunnel chiefly on
account of expansion. The capacity to swell seems to be
limited to those rocks which contain clay minerals, e.g.
monllollonite having high swelling capacity.
His description of the tunnelling media is relevent
even today, for instance, in case of intact and stratified
conditions spalling or popping in high cover/high stress
areas is known to occur. However the meta-volcanics of study
the area come under the Stratified Rock, Blocky and Seamy
Rock and even Squeezing Rock category. As explained in
previous chapters, Panjal Volcanics are strongly foliated
and can be classified as Stratified Rocks in stretches more
competent rocks, Blocky and Seamy Rocks in other stretches
and very closely foliated schistose bands can be identified
with Terzaghi's Squeezing Rock. As described in the
definitions given above, spalling failures, increased
support in walls and mild squeezing conditions have been
encountered in meta-volcanics.
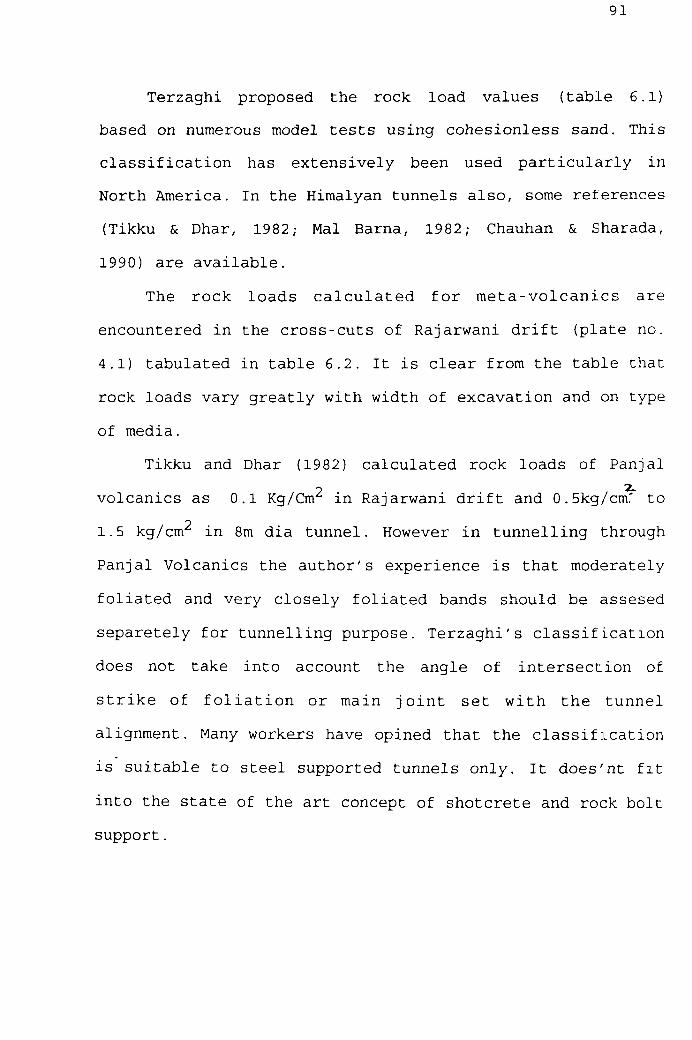
91
Terzaghi proposed the rock load values (table 6.1)
based on numerous model tests using cohesionless sand. This
classification has extensively been used particularly in
North America. In the Himalyan tunnels also, some references
(Tikku & Dhar, 1982; Mai Barna, 1982; Chauhan & Sharada,
1990) are available.
The rock loads calculated for meta-volcanics are
encountered in the cross-cuts of Rajarwani drift (plate no.
4.1) tabulated in table 6.2. It is clear from the table that
rock loads vary greatly with width of excavation and on type
of media.
Tikku and Dhar (1982) calculated rock loads of Panjal
volcanics as 0.1 Kg/Cm in Rajarwani drift and 0.5kg/cm.' to
1.5 kg/cm in 8m dia tunnel. However in tunnelling through
Panjal Volcanics the author's experience is that moderately
foliated and very closely foliated bands should be assesed
separetely for tunnelling purpose. Terzaghi's classification
does not take into account the angle of intersection of
strike of foliation or main joint set with the tunnel
alignment. Many workers have opined that the classification
is suitable to steel supported tunnels only. It does'nt fit
into the state of the art concept of shotcrete and rock bolt
support.

92
6.1.2 Geomechanic^ Classification or Rock Mass Rating (RMR) System:
This system was first proposed by Bieniawski of the
South African Council for Scientific and Industrial Research
in 1973 and subsequently modified (1976, 1979a) on the basis
of field experience and international procedures and
practices. The basic framework of the classification has
however, remained intact. The aims of the RMR system are as
follows (in Bieniawski, 1988):-
1. To identify the most significant parameters influencing
the behaviour of rock mass.
2. To divide a particular rock mass formation into a number
of rock mass classes of varying quality.
3. To provide basis for understanding the characterstics of
each class.
4. To derive qualitative data for engineering design.
5. To provide a common basis for communication between
engineers and geologists.
The following six parameters are used to classify a
rockmass:-
1. Uniaxial compressive strength of rock material.
2. Deere's rock quality designation (RQD)
3. Spacing of discontinuities.
4. Condition of discontinuties
5. Groundwater conditions.
6. Orientation of discontinuties.

93
The revised version of the classification is given in
table 6.3 Due care needs to be taken to use this version of
the system. Various parameters have been assigned ratings as
per their importance. He has also recommended that the
tunnelling media be divided into structural regions so that
certain features are more or less uniform with in each
region. Choubey and Dhawan {1990a) have also suggested
division of the rock media into Geo-structural units.
1. Strength of Intact Rock Material: The concept of Deere
and Miller (1966) of rock strength of intact rock material
has been utilised. Practical methods used for estimating
rock strength are (i) By Point Load Strength Index (Broch &
Franklin 1972, Bieniawski (1975)(ii), By Schmidt Hammer
(iii) By Manual Index (ISRM, 1978) for estimation of wall
strength when performed on walls of discontinuities.
A detailed account of various methods has been dealt
within the Chapter devoted to engineering properties. Rating
for this parameter is 0 to 15.
2. Rock Quantity Designation: Deere's RQD (1964) discussed
in Chapter III has rating 3 to 20. In case cores are not
available RQD = 115 - 3.3 JV (Palmstrom, 1982) can be used
(Jv = No. of joints per m^).
3. Spacing of Joints: The term joint includes all kinds of
discontinuities viz. joints, faults, bedding planes and
surfaces of weaknesses. Deere's classification for joint
spacing is used with slight modification (table 6.5). The

94
importance ratings are from 5 to 20.
4. Condition of Joints: This is a descriptive parameter
accounting for separation or aperture, continuity, surface,
roughness, wall condition (hard or soft), infillings etc.
For this parameter, the range of ratings is from 0 to 30.
5. Ground Water Condition: Ground water does influence the
stability of underground openings. The importance ratings
are given on the basis of observed rate of flow on the ratio
of joint water pressure to major principal stress or by
general qualitative assessment of groundwater conditions
(table 6.3). The ratings for this parameter range between 0
and 15.
The sum of ratings from the range of values for each
parameter gives raw score. This is then adjusted for joint
orientation (tables 6.3B and 6.4). Rockmass classes are
determined from total ratings and the characteristics of
different classes are given in section C and D of table 6.3.
6.1.2.1 Application of RMR System:-
This system has been very widely used in engineering
projects such as tunnels, slopes, foundations and mines.
However, most of the applications have been in the field of
tunnelling. In India a number of examples of the use of RMR
system for river valley projects are available (Jethwa et
al, 1981; Choubey & Dhawan, 1990b; Sharma et al, 1995). The
RMR Geomechanics Classification has also been used in Coal
mining (Ghouse and Raju, 1981, Abad et al 1983). The author

95
has applied the RMR system in cross-cuts of Rajarwani drift
of the hydroelectric project and then in access tunnel to
power house (plate no. 3.1) during the construction stage.
The cross drift was divided into different Geo-Structural
Units (plate no. 3.2) after 3-D geological mapping. Moderate
to closely foliated greenish grey volcanics and very closely
foliated to schistose volcanics were placed in different
Geo-Structural Units. Calculation of RMR for Geo-Structural
Unit I to XII is presented in table nos. 6.6 to 6.11.
The RMR system has also been applied on the drill hole
SPH-3 (plate no. 3.8 and table 6.12 to 6.17) after dividing
the entire medium into Geo-Structural Units. A new system of
geological logging of drill cores (plate no. 3.8) was
evolved recording moderately/closely foliated and very
closely foliated zones separately and working out the RQD
for each of the units separately.
It has been noted that in moderate to closely foliated
meta-volcanics in the drift, the RMR ranges from 5 7 to 3 9
(Class III - Fair) and in very closely foliated bands it
remains 38 to 19 (Class IV & V - Poor to Very poor).
In case of drill hole SPH-3 the ranges are 53 to 45
(Class III - Fair) and 32 to 12 (Class IV and V - Poor to
Very poor).
The cross drifts and SPH-3 are both aligned more or
less perpendicular to foliation trend and parallel to long
axes of main caverns of underground power station. It is

96
pertinent to mention here that in a situation where tunnel
or underground opening is aligned sub-parallel to main
discontinuities like foliation joints, the conditions have
to be classified as "very unfavourable" (table 6.4). As a
consequence, the overall raw RMR have to be lowered by 12
points bringing the tunnelling media into lower (Poorer)
rock classes.
Hoek and Brown (1980) have suggested that in some cases
where structural features dominate the rockmass, some
special consideration may have to be given to its geometry
vis-a-vis excavation. In Uri Project, the rock classes (of
Bieniawski) were modified to suit local geological
conditions (table 6.18).
As RMR values above 80 have not been recorded in
project area, in outcrops, or in any of the drill holes or
exploratory drifts, Bieniawski's 'Very Good' rock class (RMR
100-81) is absent. In view of strong foliation, specially in
the meta-volcanics, the fair rock class (RMR 41-60) was sub
divided into IIA and IIB based on intersection of strike of
foliation with tunnel alignment.
6.1.3 Q-System :
Barton, Lien and Lunde (1974) of the Norwegian
Geotechnical Institute proposed the Q-System on the basis of
a large number of case studies. The system gives an index
(Q) of tunnellibility of rock and utilizes the following
parameters:
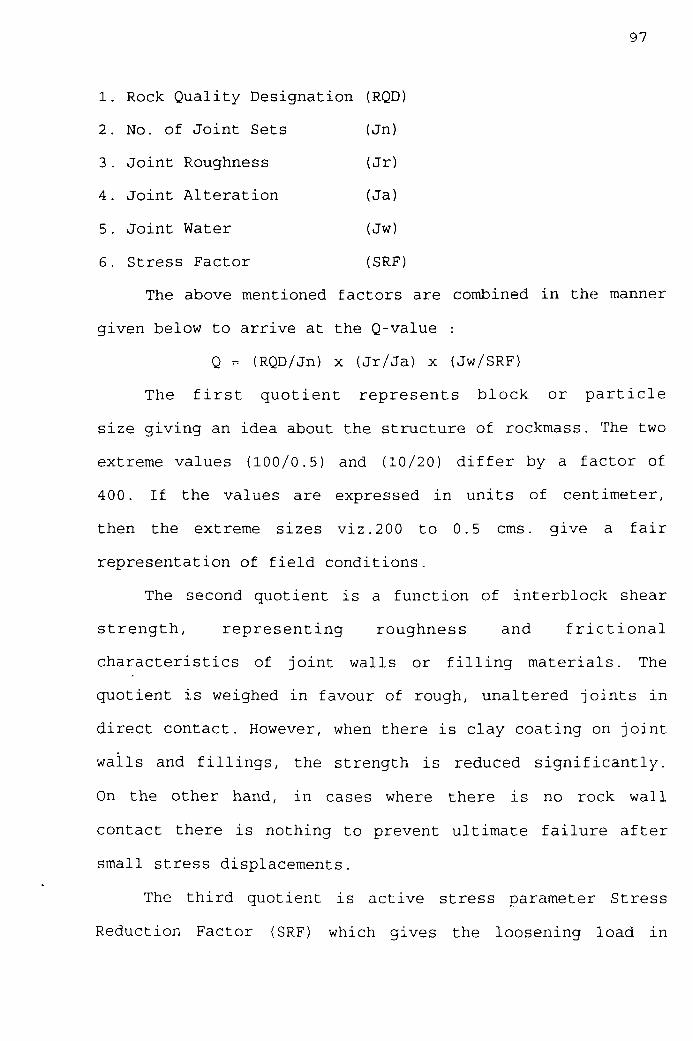
97
1. Rock Quality Designation (RQD)
2. No. of Joint Sets (Jn)
3. Joint Roughness {Jr)
4. Joint Alteration (Ja)
5. Joint Water (Jw)
6. Stress Factor (SRF)
The above mentioned factors are combined in the manner
given below to arrive at the Q-value :
Q - (RQD/Jn) X (Jr/Ja) x (Jw/SRF)
The first quotient represents block or particle
size giving an idea about the structure of rockmass. The two
extreme values (100/0.5) and (10/20) differ by a factor of
400. If the values are expressed in units of centimeter,
then the extreme sizes viz. 200 to 0.5 cms. give a fair
representation of field conditions.
The second quotient is a function of interblock shear
strength, representing roughness and frictional
characteristics of joint walls or filling materials. The
quotient is weighed in favour of rough, unaltered joints in
direct contact. However, when there is clay coating on joint
wails and fillings, the strength is reduced significantly.
On the other hand, in cases where there is no rock wall
contact there is nothing to prevent ultimate failure after
small stress displacements.
The third quotient is active stress parameter Stress
Reduction Factor (SRF) which gives the loosening load in
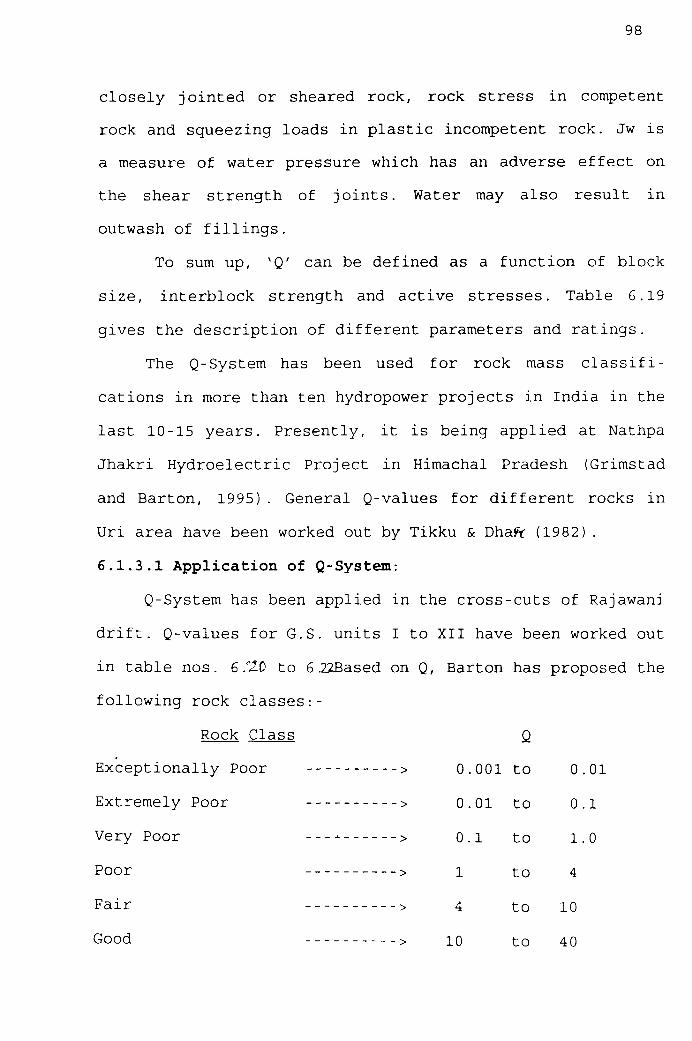
98
closely jointed or sheared rock, rock stress in competent
rock and squeezing loads in plastic incompetent rock. Jw is
a measure of water pressure which has an adverse effect on
the shear strength of joints. Water may also result in
outwash of fillings.
To sum up, 'Q' can be defined as a function of block
size, interblock strength and active stresses. Table 6.19
gives the description of different parameters and ratings.
The Q-System has been used for rock mass classifi
cations in more than ten hydropower projects in India in the
last 10-15 years. Presently, it is being applied at Nathpa
Jhakri Hydroelectric Project in Himachal Pradesh (Grimstad
and Barton, 1995). General Q-values for different rocks in
Uri area have been worked out by Tikku & Dhaff (1982) .
6.1.3.1 Application of Q-System:
Q-System has been applied in the cross-cuts of Rajawani
drift. Q-values for G.S. units I to XII have been worked out
in table nos. 6 .'20 to 6.22Based on Q, Barton has proposed the
following rock classes:-
Rock Class Q
Exceptionally Poor > 0.001 to 0.01
Extremely Poor > 0.01 to 0.1
Very Poor > 0.1 to 1.0
Poor > 1 to 4
Fair > 4 to 10
Good > 10 to 40

99
Very Good > 40 to 100
Extremely Good > 100 to 400
Exceptionally Good > 400 to 1000
The RMR & Q values (table 6.23) have been plotted on
the Bieniawski curve (1979) (plate nos. 6.1 and 6.2).
6.2 THE SUPPORT SYSTEM:
Presently the Ivindamental principle behind tunnel
support is to allow the rockmass to support itself as far as
possible. The first classification and systematic support
system of Terzaghi advocated the use of steel arches to
support dead load. This passive support approach was useful
in shallow tunnels where the dead weight of loosened rock
played an important role. However, in case of deeper
excavations the stress induced failures became important.
All the present support ideas encourage the participation of
rock in the support system. Wedge analysis is a popular
method for supporting free falling blocks due to presence of
discontinuities. Stereographic methods (plate nos. 6.3 &
6.4) are simple and reliable for general assessment of
structurally unstable wedges. However, the most practicable
approach towards tunnel support is by the use of rockmass
classification systems.
Bieniawski (1976, 1988) has proposed a guide for the
choice of support for underground ground excavations (table
6.24) .
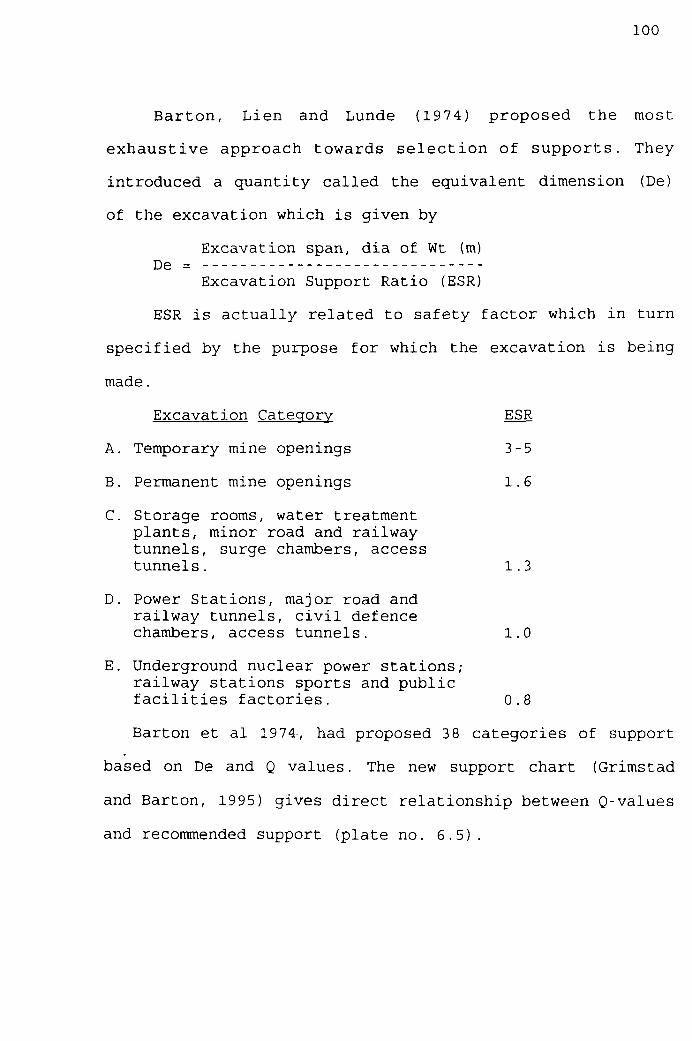
100
Barton, Lien and Lunde (1974) proposed the most
exhaustive approach towards selection of supports. They
introduced a quantity called the equivalent dimension (De)
of the excavation which is given by
Excavation span, dia of Wt (m) De =
Excavation Support Ratio (ESR)
ESR is actually related to safety factor which in turn
specified by the purpose for which the excavation is being
made.
Excavation Category ESR
A. Temporary mine openings 3-5
B. Permanent mine openings 1.6 C. Storage rooms, water treatment
plants, minor road and railway tunnels, surge chambers, access tunnels. 1.3
D. Power Stations, major road and railway tunnels, civil defence chambers, access tunnels. 1.0
E. Underground nuclear power stations; railway stations sports and public facilities factories. 0.8
Barton et al 1974-, had proposed 3 8 categories of support
based on De and Q values. The new support chart (Grimstad
and Barton, 1995) gives direct relationship between Q-values
and recommended support (plate no. 6.5).

101
New Austrian Tunnelling Method
(NATM) This technique developed by RabeCuiez, Packer &
Muller is principally suited to sqeezing conditions. It
relies on performance monitoring and is adapted to each new
project based on previous experience. In NATM the rockmass
is allowed to yield only enough to mobilize its optimum
strength, by utilizing light temporary support. With correct
timing of final support, this initial yielding is arrested
in time.
The support used in Uri Project (table 6.25) is a
combination of Bieniawski's guide and NATM. In carbonaceous
zones (SPH-3 Ch.118-125, RMR-12) and crushed rocks special
support measures have been adopted (plate no. 6.6) .
6.3 TUNNELLING METHODOLOGY:
A discussion on engineering geological and geotechnical
aspects of tunnelling shall not be complete without an
account of tunnelling methodology. The final success of a
tunnel project is largely dependent on the methodology
adopted for tunnelling apart from sound geological database
and support design. In Europe, North America and Australia
the methodology has progressed considerably in the last two
to three decades.
Primarily there are two types of tunnelling techniques
drill-and-blast and tunnel-boring machines.
The drill-and-blast method involves drilling of several
holes on the tunnel face, charging by gelatine sticks and

102
firing through detonators. The tunnel-boring machine
involves mechanical cutting and grinding of rock. It was
employed for the first time in the Himalyas at Dul-Hasti
Project in Jammu & Kashmir.
The sequence of drilling on tunnel face, charging of
holes, firing, ventilation, mucking and primary rock support
is described as a cycle.
(a) Marking of tunnel face: The periphery of the excavation
is marked on the rock face by precision so that the
alignment and elevation of the tunnel is maintained. The
blast holes are also marked on the face as per the blast
design (photo 6.1).
(b) Face drilling: A number of holes are required to be
drilled on tunnel face, about 85-95 for 8 m dia (D-shaped
access tunnel to power house). Introduction of two-three
bore drill jumbos has resulted in considerable time saving
and more efficient face drilling operation.
(c) Charging and Firing: The gelatine sticks are loaded in
the holes drilled and cleaned by blowing compressed air.
Subsequently, they are connected to short long delay
detonators and fired.
(d) Defuming: After the blast, the obnoxious gasses are
either sucked out or blown away by a ventilator system.
(e) Mucking: Mucking is the removal of broken rock after
blasting operation. This is a highly mechanized job wherein
plenty of time can be saved by deployment of efficient

103
loaders and a series of dumpers or tippers.
(f) Scaling and Geo-logging.- Scaling is the mechanised
removal of loose rocks from the freshly excavated section.
The tunnel walls and face are then washed for geological
mapping. The time available for geo-logging is generally 1/2
hour depending on the amount of scaling to be done. In this
short period the various parameters for working out RMR and
Q have to be assessed apart from mapping of geological
features and recorded in the format (plate no. 3.9) .
(g) Rock Support: The method adopted at Uri project involved
installation of primary rock supports based on the rock
classes worked out after calculation of RMR. This consists
of shotcrete (plain or fibre-reinforced) (photo 6.2) and
swellex rock bolts/grouted dowels, (photo 6.3 and 6.4) Full
complement of grouted dowels may be installed after 3-4
rounds so that during the cycle only initial stabilization
is achieved (photo 6.5).
Deployment of well maintained mobile equipment has been
a major feature of tunnelling in Uri. It has greatly helped
in cutting short cycle times. The time required for
different activities is on nex-. pane- (Sharma et al, 1995):
Steel fibre reinforced shotcreL;-; proved to be very
helpful in tunnelling through thinly foliated volcanics.
Swellex bolts also helped in providing • emporary but instant
support (photo 6 .30 .

104
Activity
Face Marking
Drilling
Charging & Firing
Defuming
Mucking
Scaling & Geologgi
Rock bolting & She
.ng
Jtcret: ing
Time in hours
0.50
2.50
0.75
0.50
3.00
0.75
4.00
12.00 hrs.
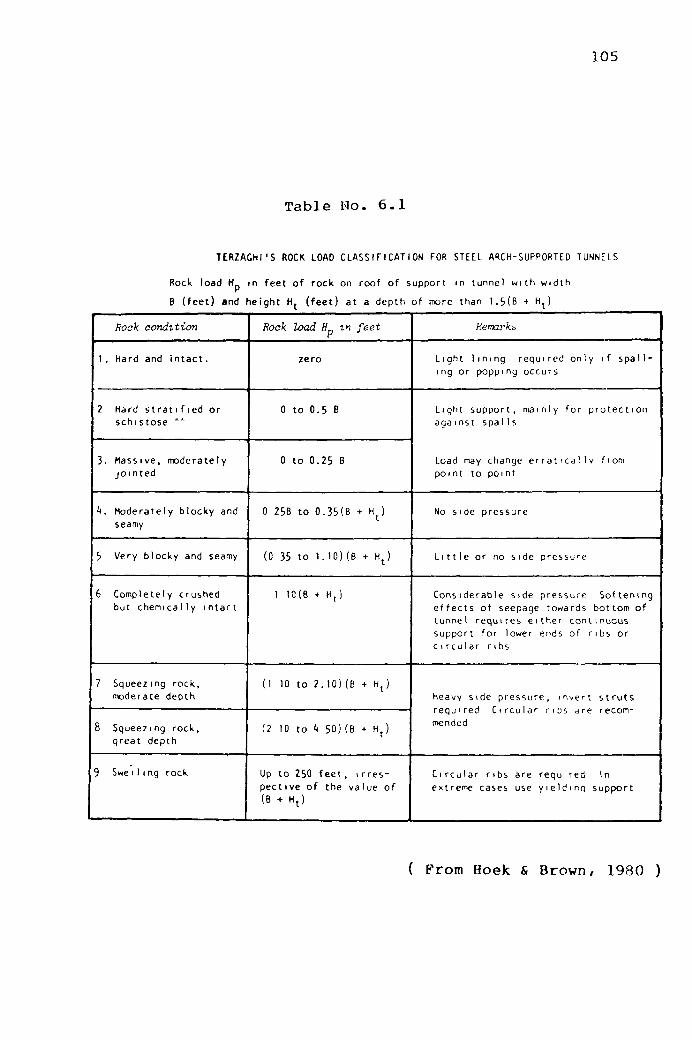
105
Table No. 6-1
TERZAGHI'S ROCK LOAD CLASSIFICATION FOR STEEL ARCH-SUPPORTED TUNNELS
Rock load H in feet of rock on roof of support in tunnel with width
B (feet) and height H^ (feet) at a depth
Rock condition
1. Hard and intact.
2 Hard stratifled or
schistose •"
3. Massive, moderately
jointed
h. Moderately blocky and
seamy
5 Very blocky and seamy
6 Completely crushed
but chemically intact
7 Squeezing rock,
moderate depth
8 Squeezing rock,
great depth
9 Swe11ing rock
Fock load H %n feet
zero
0 to 0.5 B
0 to 0.25 B
0 25B to 0.35(B + Hj.)
(0 35 to t.lO)(B + H^)
I 10(8 + Hj)
(1 10 to 2.10)(B + H^)
(2 10 to U 50)(B + Hj)
Up to 250 feet, 1rres-
pective of the value of
(B + Hj)
of more than 1.5(B + H^)
Remarkb
Light lining required only if spall-
ing or popping occurs
Light support, mainly for protection
aga1nst spa 11s
Load may change erratically fiom
point to point
No side pressure
Little or no side pressu'^e
Considerable side pressure Softening
effects of seepage towards bottom of
tunnel requires either continuous
support for lower ends of ribs or
c1rcular ribs
Heavy side pressure, invert struts
required Circular ribs are recom
mended
Circular ribs are requ red In
extreme cases use yieldinq support
{ From Boek & Brown/ 1980 )
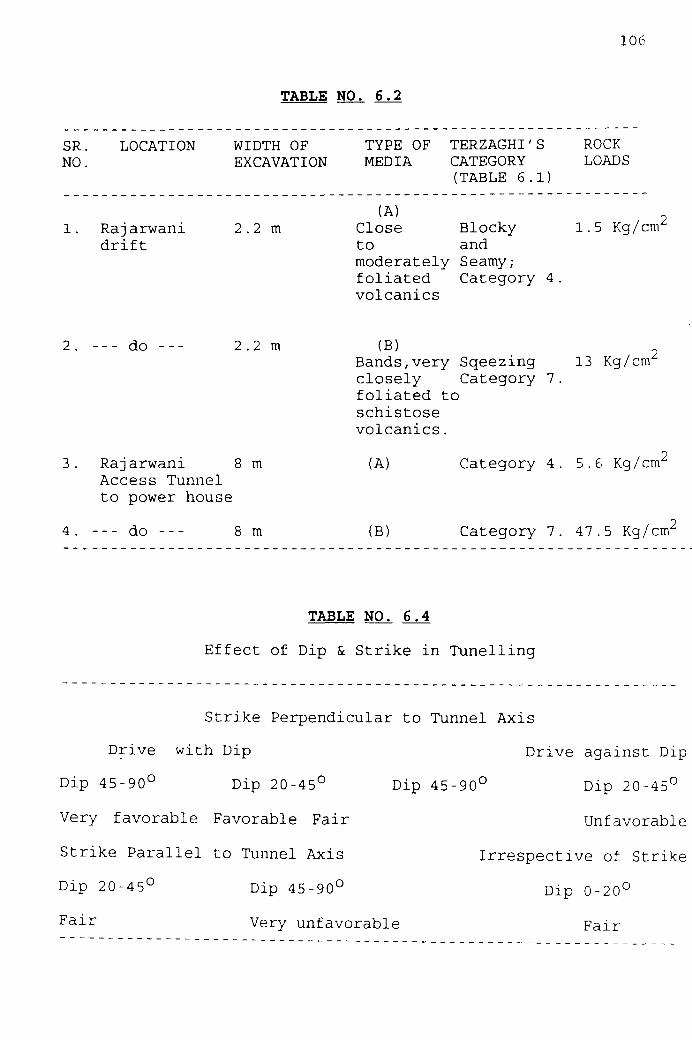
106
TABLE NO. 6.2
SR. NO.
1.
LOCATION
Rajarwani drift
WIDTH OF EXCAVATION
2.2 m
TYPE OF MEDIA
(A) Close to
TERZAGHI' CATEGORY (TABLE 6.
Blocky and
S
.1)
ROCK LOADS
1.5 Kg/cm
moderately Seamy; foliated Category 4. volcanics
2. do 2 .2 ra
Rajarwani 8 m Access Tunnel to power house
- do 8 m
(B) Bands,very Sqeezing 13 Kg/cm"" closely Category 7. foliated to schistose volcanics.
(A)
:B)
Category 4. 5.6 Kg/cm''
Category 7. 47.5 Kg/cm""
TABLE NO. 6.4
Effect of Dip & Strike in Tunelling
Strike Perpendicular to Tunnel Axis
Drive with Dip
Dip 45-90° Dip 20-45°
Very favorable Favorable Fair
Strike Parallel to Tunnel Axis
Dip 20-45° Dip 45-90°
Fai^ Very unfavorable
Drive against Dip
Dip 45-90° Dip 20-45°
Unfavorable
Irrespective of Strike
Dip 0-20^
Fair
o

Table No. 6.3
GEOMECHANICS CLASSIFICATION OF ROCK MASSES
( B i e n i a w s k i , 1988) ^ * CLASSIF ICATION PARAMETERS AND THEIR RATINGS
107
PARAMETER
Strenglh
o(
inlact roach
material
Poini loar)
st'englh t"c]t
Uniaxial compiesiive slrenglh
Rating
Orill c o r e Quality R O D
Rating
Spacing ol gisconiinuilir's
Rating
Condition ol aiscontmuitips
Rating
GrOLRd water
Inllow per 10 m tunnel length
Ratio —"^ i«(Or prtry;ip«l slreM
General conditions
RANGES OF VALUES
2bO M P a
l b
9iySi tOO%
?0
4 10 Ml d
1?
7 5 \ 90S
17
-/ 4 M I ' i
bO KH) MPd
I 1 / M P l
I or this low range uniamal cornprei
sixe test i j pralerrpr)
^b bfj MI 'a b ''b Ml^a
I 1 Ml 1 M P i
0
bOS 7 b S
n
?nn
?0
Very fough surfaces Not continuous No seperation
Un*e«thered wall rock
30
None
OR-
OR •
Completely dry
Rating 15
Oh 2 m
15
cW) 600 mm
10
' lightly rough surfaces Separation < 1 mm
S ghtiy w»«lherea waits
25
10 litres mm
OR -
0 0 0 1
OR -
Damp
10
S I ghtly rough suMaccs Separation 1 mm
H ghly woathered walls
20
0^
10 25 litres/mm
M 0 2
<'bS bOV ?r\
») .-OO mm
e
6u ini
Si icens.oed Surfaces OR Soti gouqt. b ' " - i ic
Gouge 5 mm th c> Qu OR
Separation t b mm b^Pa'anon t - .m ContmuO.iS Contmous
10 0
OR
2b 125 I Ires m m
1 2 0 :
125
11)
OH - u
Dripping P10* g
B HATING ADJUSTMENT FOR JOINT ORIENTATIONS
Strike and dip orientationt ol /oints
Ratings
Tunnels
Foundations
Slopes
Very
favourable
0
0
0
FavOuiable
2
2
5
Fair
5
7
25
UniavouraOiP , unlavoijraoe
10 12
'S , rb
50 1 -f-O
C ROCK MASS CLASSES DETERMINED FROM TOTAL RATINGS
Rating
Class No
Description
100—81
1
Very good rock
80 — 61
II
Good rock
60 — 41
III
Fair rock
* 0 — 3 \
IV
Poor rock
• 20
V
Very poor rock
D
*
M E A N I N G OF HOCK MASS CLAS
Class No
Average stand up time
Cotiei ion ol the rock mass
Fficlion i n g l e ol the rock mass
SES
1
10 years lor 15 mspan
400 kP«
> 45"
II
6months tor 8 mspan
300 • 400 ki'a
35* 45 '
III
I week lor 5 m span
2O0 - 300 kPa
2 5 ' - 35 '
IV
10 hours lor 2 5 mspan
too 200 kPa
15' 25°
V
30 minutes for 1 rr $par
100 kP«
15°

108
TABLE NO. 6.5
DEERE'S CLASSIFICATION FOR JOINT SPACING
Description Spacing of Joints Rockmass Grading
Very wide > 3 m Solid Wide 1 to 3 m Massive Moderately close 0.3 to 1 m Blocky/Seamy Close 50 mm to 300 mm Fractured Very close < 50 mm Crushed & Sheared

109
TABLE NO. 6.6
Calculation of RMR in Left Cross-cut
Parameter
Geo-Structural Unit :i 1
1. Strength of intact rock material
2. RQD
3. Spacing of discont.
4. Condition of discont
(Ch.O
Range of Values
to 26.5 m)
50-100 Mpa
50- 75%
200-600 mm
SI. rough Sep. < 1 mm High weath. walls
Wet
Very favourable
Ratin
7
13
10
20
7
57
0
RMR 57
Ground water
6. Rating adjustment
8
(Right Cross-Cut) Geo-Structural Unit ji il (Ch. 26.5 to 41 ml
7. Rating adjustment Fair
Geo-Structural Unit z. Ill (Ch. 43. to 46 ml
25 - 50 Mpa
- 5
RMR 52
1. Strength of intact rock material
2. RQD
3. Spacing of discont.
4. Condition of discont
5. Ground water
6. Rating adjustment
3 to 8 < 25% to 25 - 50%
< 60 mm to 60-200 mm 5 to 8
SI.rough,
Wet
Fair
High weath. 2 0
7
39 to 47 - 5 - 5
RMR 34 to 42
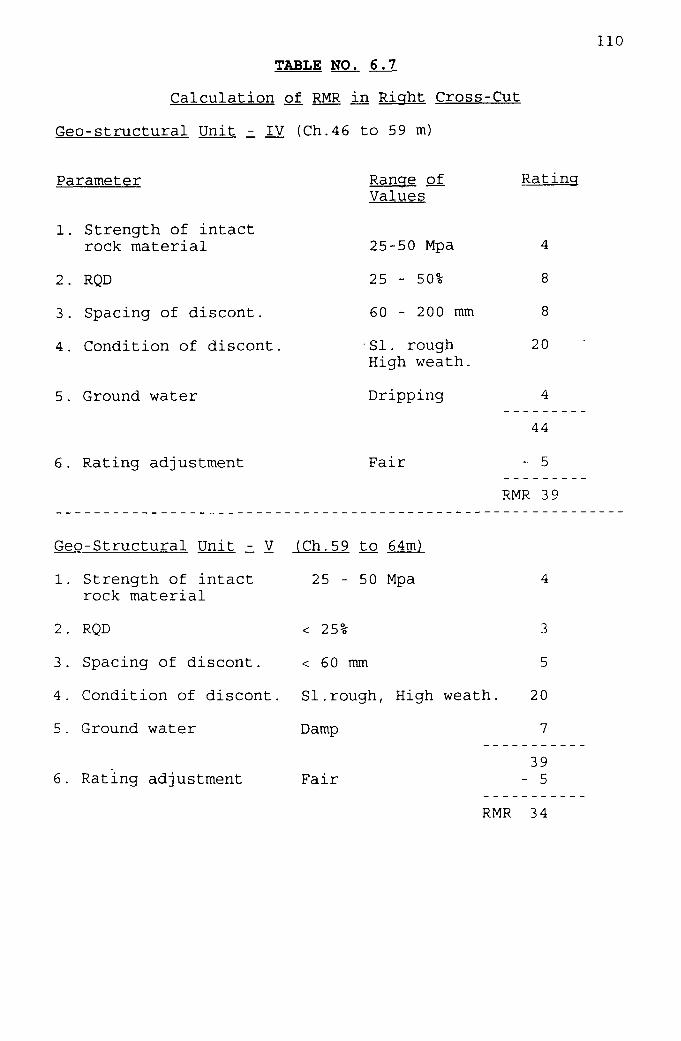
TABLE NO. 6.7
Calculation of RMR in Right Cross-Cut
Geo-structural Unit ji TV (Ch.46 to 59 m)
110
Parameter
1. Strength of intact rock material
2. RQD
3. Spacing of discont.
4. Condition of discont
5. Ground water
6. Rating adjustment
Ranqe of Values
25-50 Mpa
25 - 50%
60 - 200 mm
SI. rough High weath.
Dripping
Fair
Rating
4
8
8
20
4
44
- 5
RMR 3 9
Geo-structural Unit ji V (Ch.59 to 64m)
1. strength of intact 25 - 50 Mpa rock material
2 . RQD
3. Spacing of discont.
4. Condition of discont.
5. Ground water
6. Rating adjustment
< 25%
< 60 mm
SI.rough,
Damp
Fair
High weath.
RMR
3
5
20
7
39 - 5
34
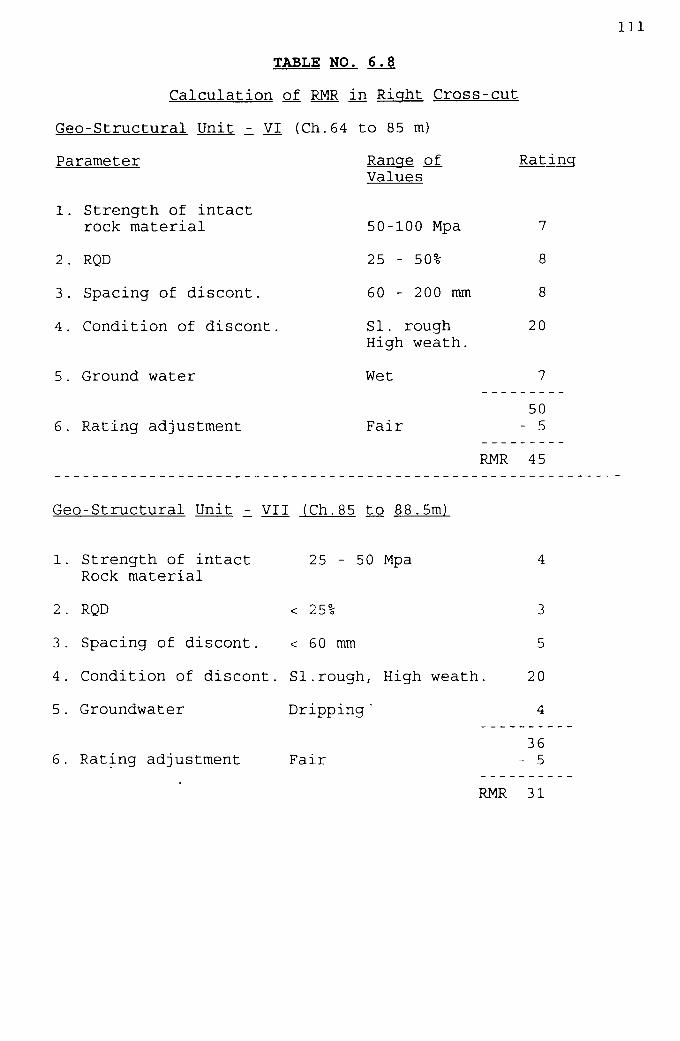
Ill
TABLE NO. 6.8
Calculation of RMR in Right Cross-cut
Geo-Structural Unit ji VI (Ch.64 to 85 m)
Parameter
1. Strength of intact rock material
2 . RQD
3. Spacing of discont.
4. Condition of discont.
5. Ground water
6. Rating adjustment
Ranqe of Values
50-100 Mpa
25 - 50%
60 - 200 mm
SI. rough High weath.
Wet
Fair
RMR
Ratinq
7
8
8
20
7
50 - 5
45
Geo-Structural Unit z. Y H (Ch.85 to 88.5m)
1. Strength of intact Rock material
25 - 50 Mpa
2. RQD < 25% 3
3. Spacing of discont. < 60 mm 5
4. Condition of discont. SI.rough, High weath. 20
5. Groundwater Dripping ' 4
6. Rating adjustment Fair 36 - 5
RMR 31
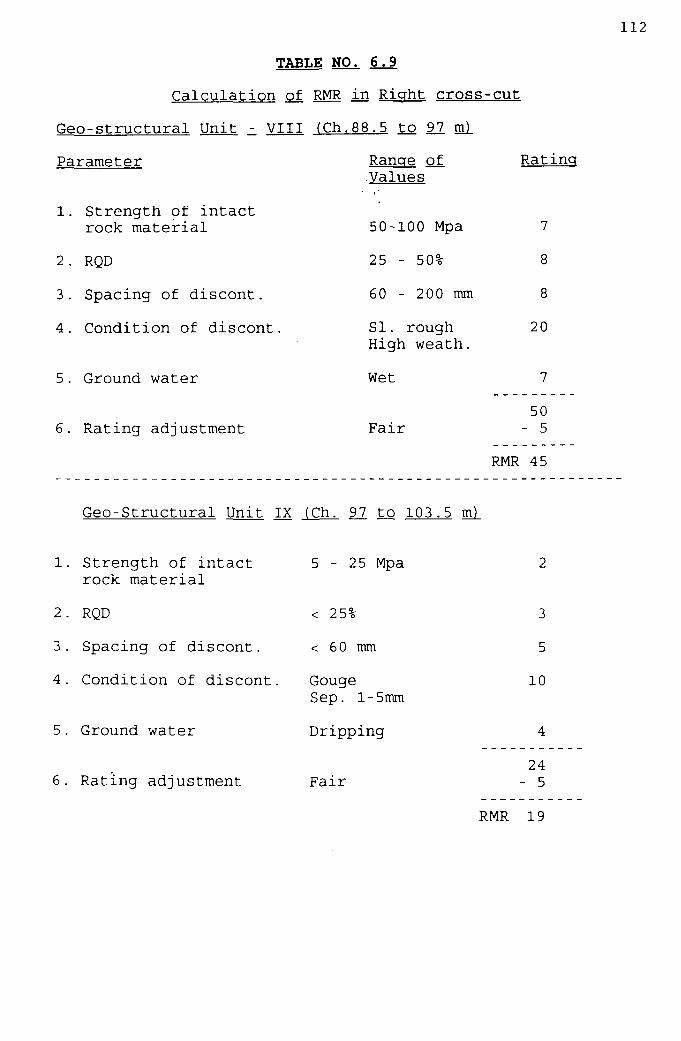
112
TABLE NO. 6.9
Calculation of RMR in Right cross-cut
Geo-structural Unit ^ VIII (Ch.88.5 to 92 ml
Parameter
1. Strength of intact rock material
2. RQD
3. Spacing of discont.
4. Condition of discont.
5. Ground water
6. Rating adjustment
Range of Values
50-100 Mpa
25 - 50%
60 - 200 mm
SI. rough High weath.
Wet
Fair
Ratinq
7
8
8
20
7
50 - 5
RMR 45
Geo-structural Unit IX (Ch. 92 to 103.5 m]
1. Strength of intact rock material
2. RQD
3. Spacing of discont.
4. Condition of discont,
5. Ground water
6. Rating adjustment
5 - 25 Mpa
< 25%
< 60 mm
Gouge Sep. l-5mm
Dripping
Fair
RMR
5
10
4
24 - 5
19

TABLE NO. 6.10
Calculation of RMR in Right Cross-Cut
Geo-Structural Unit z. X (Ch.103.5 to 111 .5 m)
Parameter
113
1. Strength of intact rock material
2. RQD
3. Spacing of discont.
4. Condition of discont.
5. Ground water
6. Rating adjustment
Range of Values
25 - 50 Mpa
25 - 50%
60 - 200 mm
SI. rough High weath. walls
Dripping
Fair
Rating
20
44 • 5
RMR 3 9
Geo-Structural Unit XI (Ch. 117.5 to 13£ m
1. Strength of intact Rock material
2 . RQD
3. Spacing of discont.
4. Condition of discont
5. Ground water
6. Rating adjustment
5 - 2 5 Mpa
< 25%
< 60 mm
Gouge Sep. l-5mm
Dripping
Fair
RMR
5
10
4
24 - 5
19
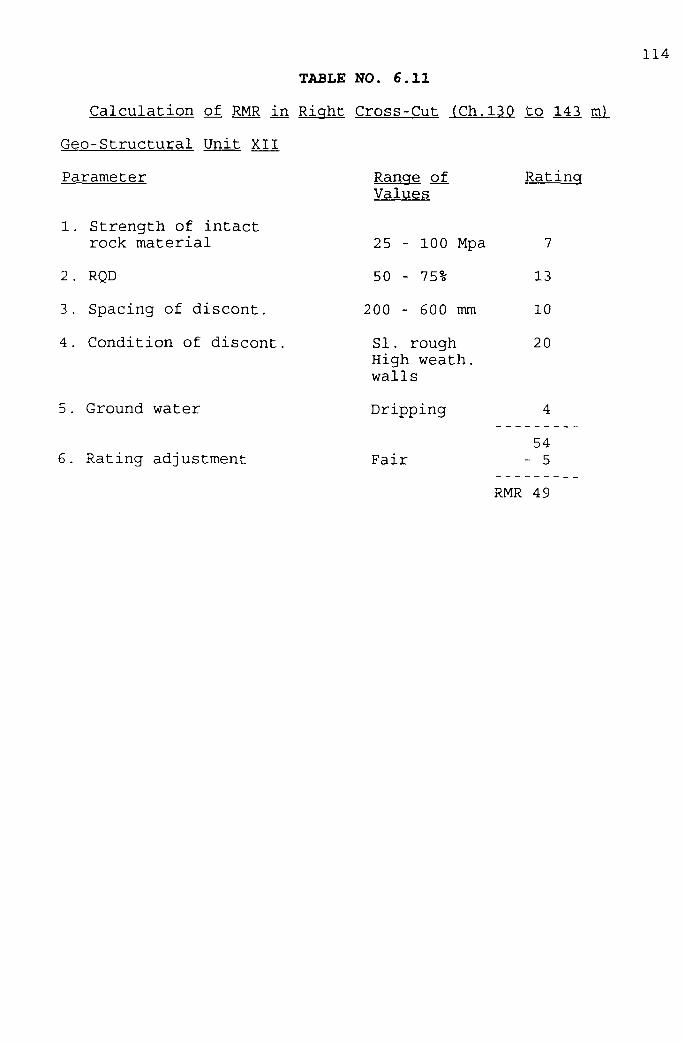
114
TABLE NO. 6.11
Calculation of RMR in Right Cross-Cut (Ch.l30 to 143 m)
Geo-Structural Unit XII
Parameter
1. Strength of intact rock material
2. RQD
3. Spacing of discont.
4. Condition of discont.
5. Ground water
6. Rating adjustment
Range of Values
25 - 100 Mpa
50 - 75%
200 - 600 mm
SI. rough High weath. walls
Dripping
Fair
Rating
7
13
10
20
4
54 - 5
RMR 4 9

TABLE NO. 6.12
Calculation of BMB. in SPH-3
Geo-Structural Unit 1 (Ch.O to 3.15 m)
Parameter
1. Strength of intact rock material
2. RQD
3. Spacing of discont.
4. Condition of discont.
5. Ground water
6. Rating adjustment
115
Ranqe of Values
50 - 100 Mpa
50 - 75%
60 - 200 mm
SI. rough High weath. walls
Damp
Fair
Rating
7
13
8
20
10
58 - 5
RMR 53
Geo-Structural Unit H (Ch. 3.15 to 26.4 m)
1. Strength of intact rock material
2 . RQD
3. Spacing of discont.
4. Condition of discont
5. Ground water
6. Rating adjustment
5 - 25 Mpa
< 25%
< 60 mir
Gougy Sep. 1-
Wet
Fair
I
5 mm
3
5
10
4
27 - 5
RMR 2 2

116 TABLE NO. 6.13
Calculation of RMR in SPH-3
Geo-Sructural Unit z. HI (Ch.26.4 to 29 m)
Parameter
1. Strength of intact rock material
2. RQD
3. Spacing of discont.
4. Condition of discont.
5. Ground water
6. Rating adjustment
Ranqe of Values
50 - 100 Mpa
50 - 75%
60 - 200 mm
SI. rough High weath. walls
Wet
Fair
RatincT
7
13
8
20
7
55 - 5
RMR 50
Geo-Structural Unit VJ (Ch.29 to 33 m)
5-25 Mpa 1. Strength of intact rock material
2. RQD
3. Spacing of discont.
4. Condition of discont.
5. Ground water
6. Rating adjustment
< 25%
< 60 mm
SI.rough High weath. walls
Wet
Fair
RMR
3
5
10
7
27 - 5
22

117 TABLE NO. 6.14
Calculation
Geo-Structural Unit - V
Parameter
1. Strength of intact rock material
2 . RQD
3. Spacing of discont.
4. Condition of discont.
5. Ground water
6. Rating adjustment
Geo-Structural
1. Strength of intact rock material
2. RQD
3. Spacing of discont.
4. Condition of discont.
(Ch.33
of RMR in i
to 67.3 m)
Ranqe of Values
50 - 100
25 - 50%
60 - 200
DPH-
Mpa
mm
SI. rough High weath. walls
Wet
Fair
Unit VI (Ch.67.3
5 -
< 25
< 60
25 Mpa
0, o
mm
Gougy Sep. l-5mm
to
3
Ratinq
I 7
8
8
20
7
50 - 5
RMR 4 5
83.6 ml
2
3
5
10
5. Ground water Wet 7
27 6. Rating adjustment Fair - 5
RMR 2 2

TABLE NO. 6.15
Calculation of RMR in SPH-3
Geo-Structural Unit - VII (Ch.83.6 to 96.3 ml
Parameter Range of Rating Values
1. Strength of intact rock material
2. RQD
3. Spacing of discont.
4. Condition of discont.
5. Ground water Damp 10
50 - 100 Mpa
25 - 50%
60 - 200 mm
SI. rough High weath. walls
7
8
8
20
53 6. Rating adjustment Fair - 5
RMR 4 8
Geo-Structural Unit VIII (Ch. 96.3 to 103.2 ml
1. Strength of intact 5 - 2 5 Mpa 2 rock material
2. RQD < 25% 3
3. Spacing of discont. < 60 mm 5
4. Condition of discont. Gouge 10 Sep. l-5mm
5. Ground water Wet 7
27 6. Rating adjustment Fair - 5
RMR 22

TABLE NO. 6.16 119
Calculation of RMR in SPH-3
Geo-Structural Unit z. IX (Ch.103.2 to I M ml
Parameter
1. Strength of intact rock material
2. RQD
3. Spacing of discont.
4. Condition of discont
5. Ground water
6. Rating adjustment
Range of Values
Damp
Fair
Rating
50 - 100 Mpa
50 - 75%
60 - 200 mm
SI. rough High weath. walls
7
13
8
20
10
58 5
RMR 53
Geo-Structural Unit X (Ch.llO to il8 ml
5 - 25 Mpa 1. Strength of intact rock material
2. RQD
3. Spacing of discont.
4. Condition of discont.
5. Ground water
6. Rating adjustment
< 25%
< 60 mm
SI.rough High weath, walls
Wet
Fair
3
5
20
7
37 5
RMR 32

TABLE NO. 6.17
Calculation of RMR in SPH-3
Geo-Structural Unit ji XI (Ch.118 to 125.5 m)
Parameter
1. Strength of intact rock material
120
2. RQD
3. Spacing of discont.
4. Condition of discont.
5. Ground Water
6. Rating adjustment
Ranae of Values
50 - 100 Mpa
25 - 50%
60 - 200 mm
SI. rough High weath. walls
Wet
Fair
Ratinq
7
8
8
20
7
50 - 5
RMR 45
Geo-Structural Unit XII (Ch.125.5 to 126.6 m)
1. Strength of intact 5-25 Mpa Rock material
2. RQD
3. Spacing of discont.
4. Condition of discont.
5. Ground water
6. Rating adjustment
< 25%
< 60 mm
Soft Gouge Sep. l-5mm
Wet
Fair
RMR
3
5
0
7
17 - 5
12
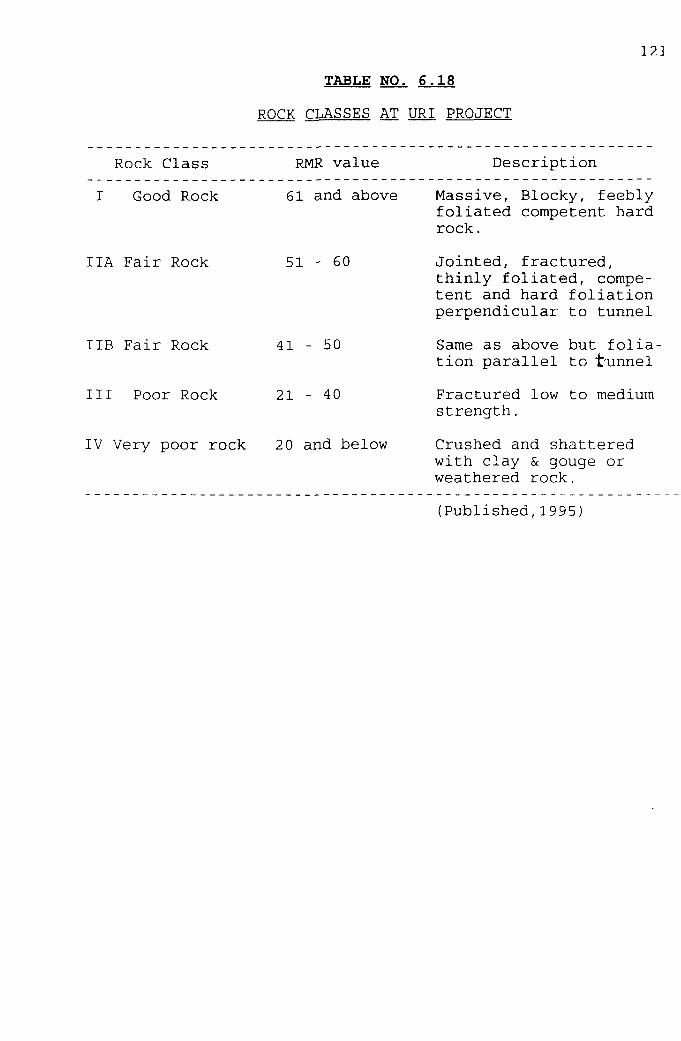
121
TABLE NO. 6.18
ROCK CLASSES AT URI PROJECT
Rock Class
I Good Rock
IIA Fair Rock
RMR value
61 and above
51 - 60
Description
TIB Fair Rock
III Poor Rock
41 - 50
21 - 40
IV Very poor rock 20 and below
Massive, Blocky, feebly foliated competent hard rock.
Jointed, fractured, thinly foliated, competent and hard foliation perpendicular to tunnel
Same as above but foliation parallel to tunnel
Fractured low to medium strength.
Crushed and shattered with clay & gouge or weathered rock.
[Published,1995)

T a b l e N o . 6 . 1 9
Q - SYSTEM
L22
1. ^ock OuAtrr D#»9r»«tioo
* I v ^ r y p o o r
t
C
D
t
^(X»
f > «
Good
LKC •*•<•«
Hot«- » WTwrt ROD « r»pori*d or »-^«T.^t3 »» «
v M u * of t o • u»«0 to r m ^ j v u C
I ) nOD nmrvmtm at I is. 1 0 0 t S SO *fC.
R O D
0 25
25 ftO
BO n
n »o • 0 »00
2 . J<Mnt S « 1 N u m b w
A |b>UKAJV« no or tww fDifXJ
8
C
O w fOTK M<
On» fOirt M l (»J« fwioom ^mj
D 1 I w o f o n k « u
[ 1 T»ofe>n i M O f t M nrvioMi p » x *
F 1 T>w** lOtr* M U
C 1 ! > • • • for * »«t i p k * >»rtoam i o r « i
H
J
ho^M or mora |cwV kou i v u o m n*«v«r fC»i«M]
J .
O S 1 0
12
15
Ou»ft*<J (OClL. M r r * M 1 JO
Hour 1 H v BitarMCScM* U M U 0 K J , t
1) f « pOTTkte. t * a 3 0 w J , 1
3 J o ^ t R o u g t w M M HumtMt J ,
1 « ; A a d « « * i « i M t u * t * * r f lU M « l w W mi»taft * • / * « rO cm r - r n -
M 1 Oocoot i ruou* p v Y j
j B 1 ouQt\ or V T M O U M i^^autrr^
, C 1 &moo>Ot urOiJ^vr^
0
I
f
0
t K A a n * 4 a « trvXiotvx)
^0^,9^^ or WT^^Ltm pUa-MT
ViHWCi p M n v
tkCkAfvAtOAd pUn«r
4
i
3
1 5
1 &
I 0
0 "
tf Mm i « c * . < . * f M « C M * » « t « . «*«h>rW
H
J
Zono coniM^^X) C*»y (nar^wota th«ck w w u o n 10
Vn-^f^ « e c k - w U c n r w c t
l«r i *V (Krv*»T or CTu»f^*0 l o r ^ ff*c» •rxxjQft IQ
P^"**<t ioc« -wol cnrn*ci
t 0
1 0
^K*« a AM ^Xi' rvnmmr, KMor« of Tw • ^ • • * r < lart •«( • ^ M t w ITw^ >TV
S J , - 0 & C*r> tw i j»*d lor piarw i *ck*r>o««d )0intJ h o v r g h^MtlCvu
4 JovTi Ahsrabon Numb«r
^ T c f * V hoo>»d h^r^ ftOt>-K>tXTtf^
'~~ 10 ' * OUftiU Of OD^OI*
} l > w i « « « d ;oint •*•§> tLnvca acstrw^ or*v
SigftWy Ollorvd fO«I " • A i N ( x v » o h * r w ^ m * ^ ( » l
focl_ • r e
(ftorvfcotiom-igl
iorT*<^n9 or lovf tncbon clwy r
**oArtt» or mic* AiAo c H , <in«rW ccMtJr^i ( •
anil l«lc gn»«L*ri J^rtp^la »fc. •no wn*> Ou*nt t>«« of 1
1 ^ Aoc* « « ^ y AA*«- WI«* «I*IWV/ fa^0U
f I S«r<dT P«a io«» ci*r-hfc« 4 M ^ a ^ a r v d rocL. cic
j S t rong^ Ov» '<on*oM« iM] rv j rv iof isrw^ cS«r m.o»n! I
U * ^ ^ n or low Ovw-coruo^dinon » o h » r w x ci»y
y fi4hf>gi Z.a mommonBc«ia
I lcoTMrxxAJi but < 5 ' i v n tNcli/>aM) V * K * o( J ,
^ o o n d ) on pvzTt of awaUir^ c l a ^ t a a ( M r t x l a i
and a c c v i i to w t t w arc
I cl M> a>c* w a J conlMrr i - A ^ M/>*Tmd ttfiick mdnmrm/ nibngtl
Zonal or bantl i ol (li»r)r»0'a(»<] or C/u»n*i1 rock aryj
cJav ! » » • G M J tor £l#»cTipi on o( cUy c o n d t 00)
2or>«i or tMnds of jrf ty or >.*ivJy-<rl#y k m « l d a y
f'acnon ir»or> aofiarw^)
OP I rh«:k conuououj jona» or t>*f>Oj o( d a y l»*a C H
H J lof 0«»cr pt on ol day cond I on) 10 13
o* U ?0
6 Jok\X W w t a r F U d u C T l o n F *cV>r
A
1
c
D
[
Dry a^jupCKTw « M^«^a r ^ o « t.a < & \MW\
kOC**y
k * > ^ ' J ,
< 1 I 1 0
Larpa >ahui>i or > ^ ^ [• • • • » 1 r comp«iao( lock •••«trt 2 i 10 1 Oi
L ^ j * Wfcow or t^^ t»»tm>j% a n * o ^ l W « ou i - i a j * i t ^ . . Q 1 Q I J
i«caoncr«*V N ^ rrflow or w B l f prataL^a ai
U a i l a ^ a«C«yw^ virtDt brrta
. t LkCaotKn^y r « ^ n h o w or ivsiar ( va tM^a
1 cora^vjne wn/xkj l notK«« 0 ^ Swcry
> 10 1 0 7-0 1
> 1 0 0 I -0 0 5
Not* tl f a a o n C is F w a crud4 • a t ' n « i a i tnc>aa»a J_ •' oramaffa iTt«aak«ai
Jl StwoH^ protMama c*ka*d t>r ic* lormat on ara nor can»<d**»d
6 S tTcu FUAjCDon Factof SRF
»l tVaiai^MJj J M M Krw^ACtM* • f c a M O o a . I W M C / I m a r cawja k>«>a>%^f ttt rmc*
w*MU mtimm m^wtmi O mMC*imtm^
ca*y (k«r«»graiad tock v«r> K K M « au-rOLrMbng tock laoy oapcN
&«X}ka —aialAaii lortaa CorH**^ '» c<«r O* C^at«,a»Y
(hs~-jrgracad rock lOapth o* a«c»va»on 1 &Omi
ruagraiad tock laapl^ «< a•c«w•(>or^ > 5C>m|
J ULtftipta V w w Jor«« tn corr>o»'»^ • « • U s t a r " * * ' * *»» '
• ^ r o i > ^ 0 i ^ rock l»r>v 0ap(M
WiQla l/iaM IOr>«l ^ COrr\(M|»rx (OCk lc iar - r r *« l lOaplfi 0 '
aica«aiK>rt « &C>nl
(•nota »n*ar tona i nt. COmpvtwni fOCk tca>r f
a x a v a i x M > ftOmt
I L O O M ooiir* fowMi rtaav«r ^wmaO V awo*' CwOa aie la'^y
oapini
3 ^
Noia U fU4uc« I h a M «*kMa or SftF fry J * * 0 X .1 if^a .
on*y ««fKi*nca bwi do r»oc rtiar^^CI ir*» ae(avat>
1 Viaar lonak
H Low auaM I t^M**C* 0 0 * ^ fO>-NI
*>4*d>on ao^aa tavot^atM lUaM
^*cn avaaa vwy ^•0'»l aKucn^a
Uiw«lly f»v«>^at)*« lo atabtHv m a r
tM t^ lavo^aota tor w a * aiaUkrv
>-*odaiaia «aM»>ng atiar > 1 NCM^ M
maaai/MV rock
S ' l b t x ^ ano iQCk C K > I I allar I
rrwNuial tn *wa*/vw fock
300 to 0 01-0 3
H%»<ty roc* tK^ai t n a«^ D^xiil •'<d
•"vnaO • • • (^rT '' ^c da'ormationi a
/TMaa/w* rock
Noia •) for u tor^ fy ar^aoirocx vnjrfi l l ' a a * t'«kl (i( rriaan^adJ w ' ^ n
5 » • , * o , J 10 foduca # , to 0 J i o , Whart 0 , / o , > 10 raOixra c ,
lo 0 ^ 0 ^ wSora ff - i r < o n f » i * d Cornprainon airariotn c mna C , a «
tf>a m « ^ and minor pnnopal « f » i i a i ond C, - ma«imi.*n l ang jnua
• t r a i l ta i t imaiad Ircxn t U a u c tr<«orYl
h i F«w c a M f»ce»d» a v a ^ y * wh* r« daoih ol -crewo 6aiow ii^ftaca >• l a i
rh«n utw^ wid lh S t^gat t S^F a X J a a M from 2 fi 10 3 lor a i ^ h c: i i a i
l i a a H I
O kWd lOLraanng rock prai iLra
avy »Qu*«nno rock prata^x*
t R F
I C a i a l of lOuaaong rock may occv* (o* Oaoifi M > 3^0 C (S "5'^ • t
* / I 99 I I Rock mata eomp-a* *" *" anangin can t-a • 11 m. iaO l.om
g - 0 7 r 0 " * ( M P a l whoia r - rock d a n » ' y •« k N / m ' (S r^5h 193 31
d7 5 w * ^ T r r v c l - c A « m ^ a / a w * * F * f *ct^«Ty <**o*rMl>nf •
R ) »Ald iwalJing rock p>ai»k««
S j Hit'Tf f*t%i*^ tock txaisijta
NoiG J and J , Classi f icat ion is app l ied t o the j om i se i of d iscon i inu i t v IhsT <$ least f avou rab la for s i a b ' l n y b o t h I f o m the point o ' v iew of O f i e n i a l i o n and shear res is tance r (whore r - o^ t an (J / J , 1
ROD J -SRF
( From G r i m s t a d & B a r t o n , 1995 )

TABLE NO. 6.20 123
Calculation ol Q ji value in Left cross-cut
Geo-Structural Unit 1 (Ch.O to 26.5 m)
Q = (RQD/Jn) X (Jr/Ja) x (Jw/SRF)
Q = (60/6) X (1/2) X (0.66/1)
Q = 3.3
(Right Cross-cut) Geo-Structural Unit II (Ch.26.5 to 43 m)
Q = 3.3
In Bieniawski is RMR system, the rating adjustment
factor for G.S.-I and G.S.-II was different but in Q-system
G.S.-I & G.S.-II are similar units.

124 TABLE NO. 6.21
Calculation of Q value (Right Cross-cut!
Geo-Structural Unit III (Ch.43 to 46 m)
Q = (20/3) X (1/4) X (0.66/1)
Q = 1.1
Geo-Structural Unit IV (Ch.4 6 to 59 m)
Q = (30/6) X (1/4) X (0.66/1.0)
Q = 0.825
Geo-Structural Unit V (Ch.59 to 64 m)
Q = (15/3) X (1/4) X (0.66/1)
Q = 0.825
Geo-Structural Unit VI (Ch.64 to 85 m)
Q = (60/6) X (1/4) X (0.66/1)
Q = 1.65
Geo-Structural Unit VII (Ch.85 to 88.5 m
Q - (15/3) X (1/4) X (0.66/1)

125
TABLE NO. 6.22
Calculation of. Q :: value (Right Cross-cut)
Geo-Structural Unit VIII (Ch.88.5 to 92 ml
Q = (60/6) X (1/4) X (0.66/1)
Q = 1.65
Geo-Structural Unit IX (Ch.97 to 103.5 mj_
Q = (10/3) X (1/4) X (0.66/2.5)
Q = 0.22
Geo-Structural Unit X (Ch.l03.5 to 117 mi
Q = (50/6) X (1/4) X (0.66/1)
Q = 1.38
Geo-Structural Unit XI (Ch.ll7 to I M ml
Q = (5/3) X (1/8) X (0.66/2.5)
Q = 0.055
Geo-Structural Unit XII (Ch.l30 to 141 ml
Q = (60/6) X (1/4) X (0.66/1)
0 = 1.65
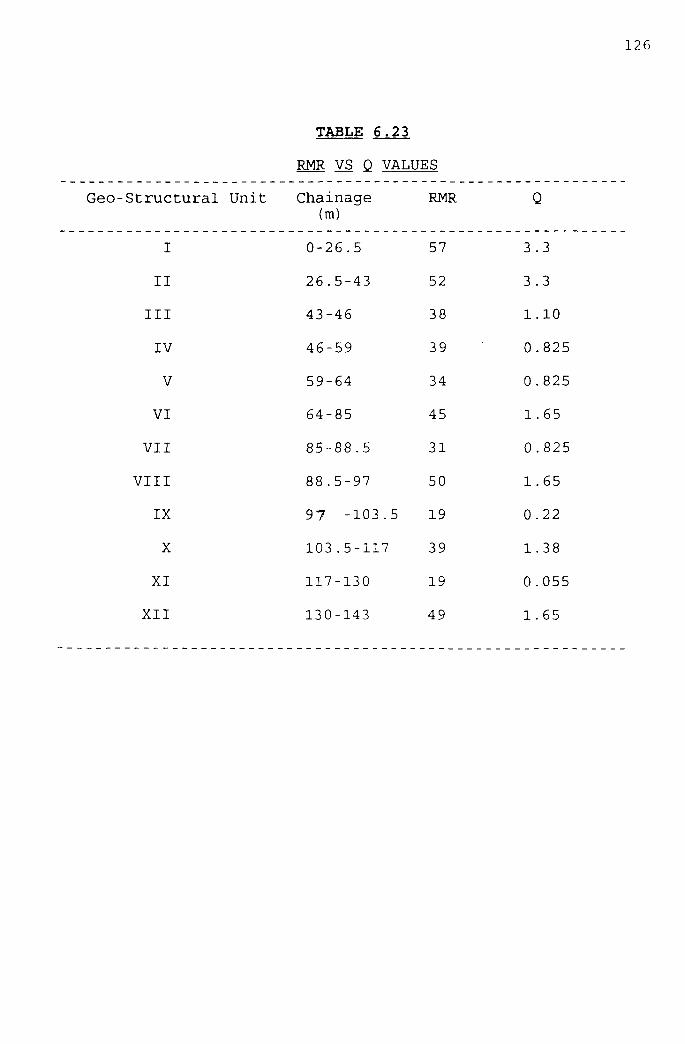
126
TABLE 6.23
RMR VS Q VALUES
Geo-Structural Unit Chainage RMR Q
(m)
I 0-26.5 57 3.3
II 26.5-43 52 3.3
III 43-46 38 1.10
IV 46-59 39 0.825
V 59-64 34 0.825
VI 64-85 45 1.65
VII 85-88.5 31 0.825
VIII 88.5-97 50 1.65
IX 97 -103.5 19 0.22
X 103.5-117 39 1.38
XI 117-130 19 0.055
XII 130-143 49 1.65
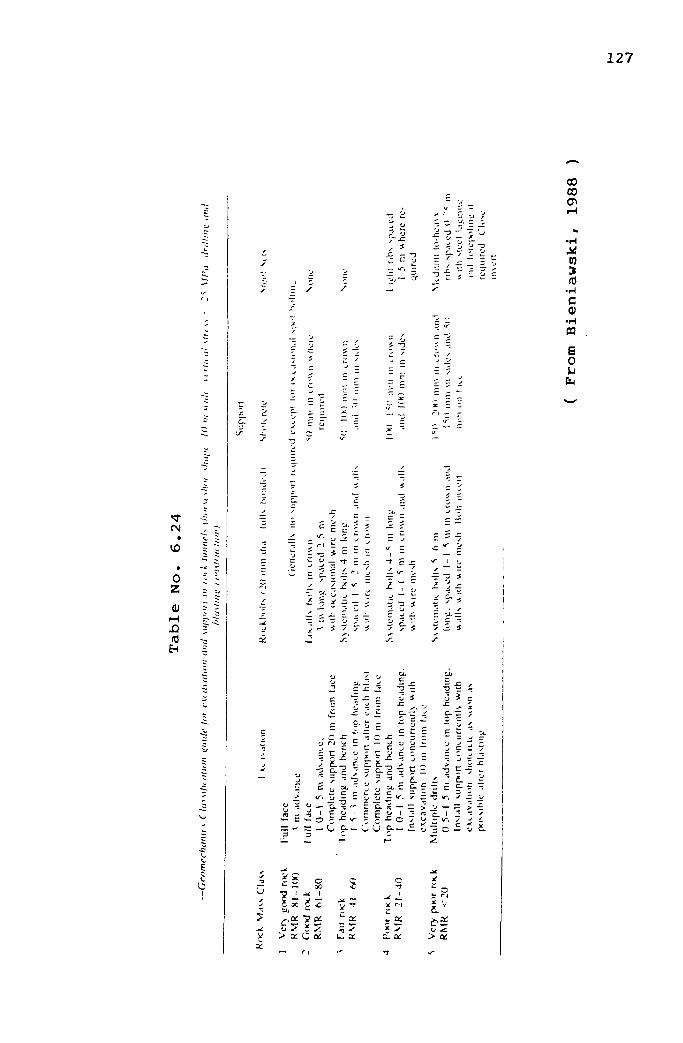
127
CO CO
X
n (0
c •H 03
5 0 U
fM
VO
O
i2 (0
EH
• £5 •" J. i
5 ^ *
ill
.- =? r -c i -c -J £
C -c ^ -; C -C
II h
1 ; c v c c E ^
T3 i c ~
o n: c £. c 3
^ 1 y
£
f
% > ( :-;
2 ^ " — ^
-3 «r,
t ^ CL 1 — V-,
5 £_ C
^ 3 ^
5 r
— • =
> r
:; = " = - 0 t - -o !J 9 - - - u ' S c - D £.
> or: O li:
- T
_ ' i '"' ^ ' J 7 X on
0 *- '~t
i ^ £. ^2 0 -d
> Qi
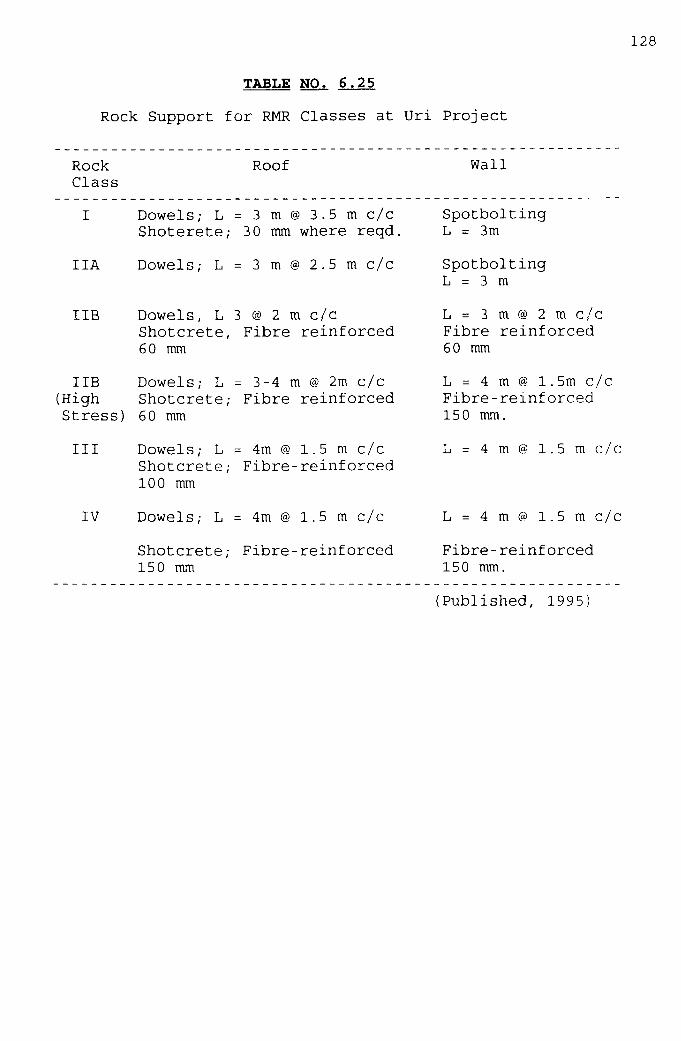
128
TABLE NO. 6.25
Rock Support for RMR Classes at Uri Project
Rock Class
Roof Wall
I Dowels; L = 3 m @ 3 . 5 m c/c Shoterete; 3 0 mm where reqd.
IIA Dowels; L = 3 m @ 2 . 5 m c/c
IIB Dowels, L 3 @ 2 m c/c Shoterete, Fibre reinforced 60 mm
IIB Dowels; L = 3-4 m @ 2m c/c (High Shoterete; Fibre reinforced Stress) 60 mm
III Dowels; L ^ 4m @ 1.5 m c/c Shoterete; Fibre-reinforced 100 mm
IV Dowels; L = 4m @ 1.5 m c/c
Shoterete; Fibre-reinforced 15 0 mm
Spotbolting L = 3m
Spotbolting L = 3 m
L = 3 m @ 2 me/e Fibre reinforced 60 mm
L = 4 m @ 1.5m c/c Fibre-reinforced 150 mm.
L = 4 m @ 1 . 5 m c/c
L = 4 m @ l . 5 m c/c
Fibre-reinforced 150 mm.
(Published, 1995:

\ 1
^A ^ ^
^ ^ 5 ^ I'
UJ
(5 Hi Z CT •« \
J O
o ^ ^ ^ r o
< ^ -o
b w ^ '^Kiii,v^ ^ v i o s::tN'yH:)^woB^
P l a t e
JD
<ri i> <n H
% •H ^ Q :» (0
•H c <u
•H CO
u 01
•u «M <
N o .
C4 0> < i H
c Q > (0
JC
o 0 Q
i H
< % M > ^
129
6 . 1
£ on a z < a z u u EH U CQ
Z o H EH < U
o u
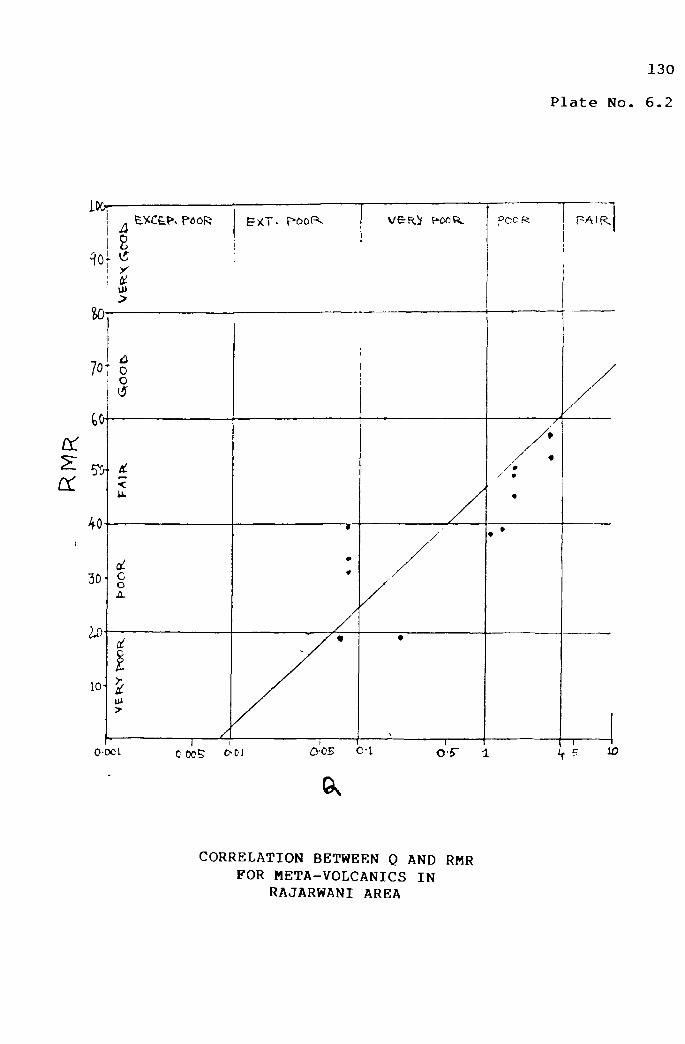
130
P l a t e No. 6 .2
IPO-! . £.-<(:&<>. POOR
^0
So-
70-
a: 4n-
30-
y-"
10-
Y
>
' 0
o "J
< u.
c o
I
1
e x T - F*O0F^ ve-Rii wx>5<
1
1 t
t
/ / •
1 I
/
/
•
• • - • 1
•
POCft
/
/ « /• / «
•
j PAIR-I
/
1 0-OCl C 0 0 5 t>CJ O-05 O-L o r 10
Ov
CORRELATION BETWEEN Q AND RMR FOR META-VOLCANICS IN
RAJARWANI AREA
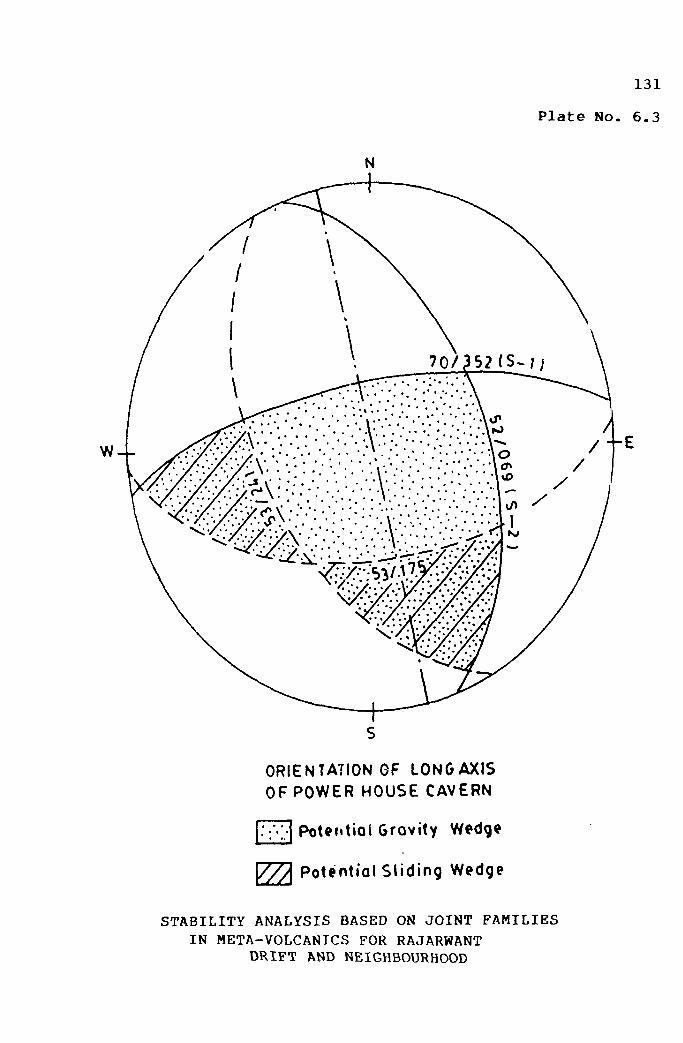
131
P l a t e No. 6 . 3
W-4-
ORIENTATION GF LONGAXIS OF POWER HOUSE CAVERN
Pot?iitio( Gravity Wedge
7Z\ Potential Sliding Wedge
STABILITY ANALYSIS BASED ON JOINT FAMILIES IN META-VOLCANICS FOR RAJARWANT
DRIFT AND NEIGHBOURHOOD

132
P l a t e No. 6 . 4
/fE
ORIENTATION OF LONGAXIS OF POWER HOUSE CAVERN
»>ot*ntiol Gravity Wedge
Potential Sliding Wedge
STABILITY ANALYSIS BASED ON JOINT FAMILIES IN META-VOLCANICS FOR CROSS-CUTS
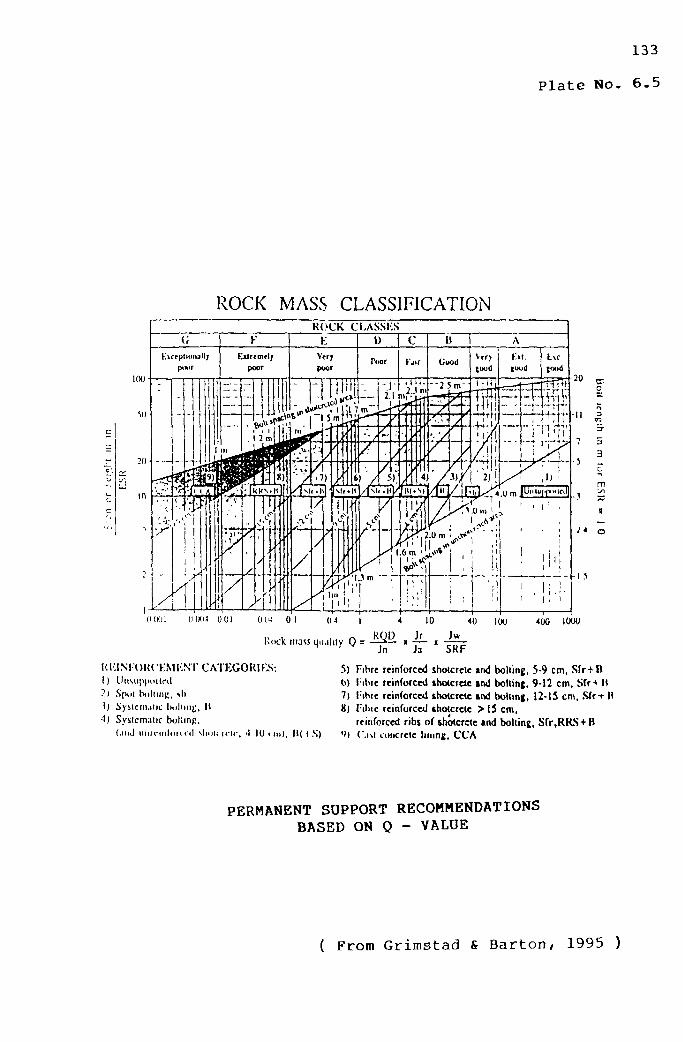
133
P l a t e No. 6 . 5
ROCK MASS CLASSIFICATION KOCK CLASSICS
Kicrplionallj'
p ntr
Earemel/
poor
u
0 u-i 0 I 40 100 400 1000
Jn Ja SKF
I) 2i
4)
INI ()U('i;Mi;yr CATKGORU-S:
Sy^lcin.ilic IHIIIIIIJ;, It
Systcmalic boMinp.
5) Fibre reinforced shotcrele itid boiling, 5-9 cm, Sfr+B 0) l-ibie ttinforcetl thoicrcie iixl boltlnt, 9-12 cm. SU^ l« 7( I'lhte reinforced thotcrctc IIKI bolting, 12-15 cm, Sfr-f II 8) I-ihic reinforced Kho(crc(e > 15 cm,
reinforced ribs of sholcrtte «nd boiling, Sfr.RRS+B (.iiid u i i inr i l .mr. l vhoi, n i r . •) lU .M I ) , I I ( I .S) <)) C m concrcic lining. CCA
PERMANENT SUPPORT RECOMMENDATIONS BASED ON Q - VALUE
( From Grimstad & Barton/ 1995 )
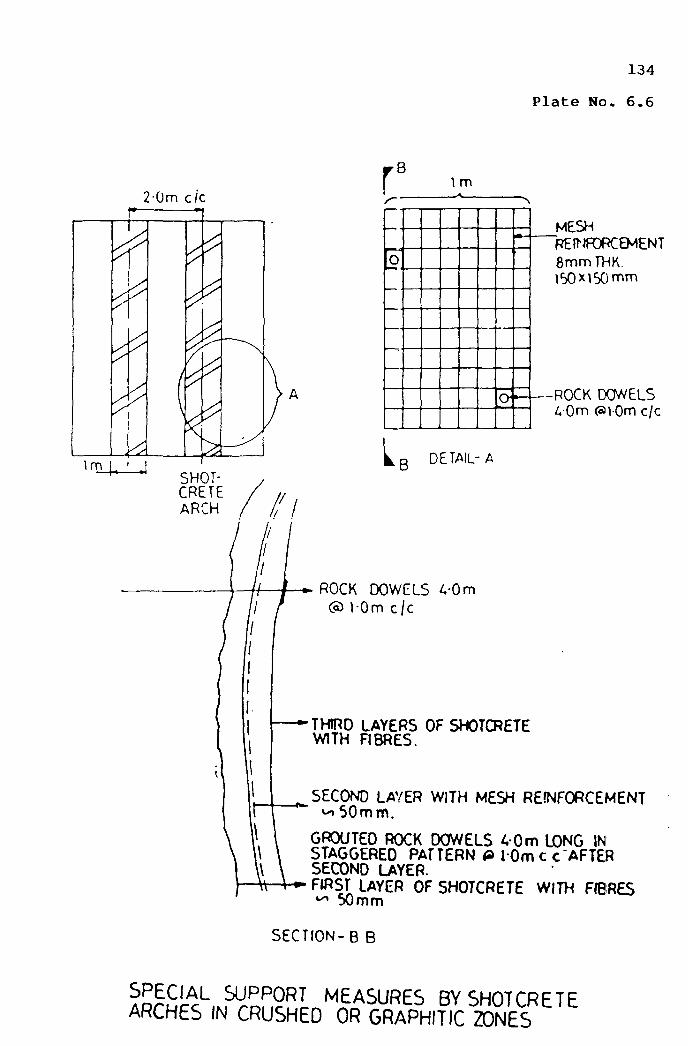
134
P l a t e No. 6 . 6
•B
2-Om c/c I
0
L,
1m
>
^ DETAIL- A
o-
•
%
MESH FTEH ff ^EMENT 8mm TV-IK. l50xi5C)mm
ROCK DOWELS z.Om (SiiOm c/c
ROCK DOWELS A-Om (5) 10m c/c
THIRD LAYERS OF SHOTCRETE WITH FIBRES.
SECOND LAYER WITH MESH REINFORCEMENT ^ 5 0 m m .
GROUTED ROCK DOWELS A-Cm LONG INI STAGGERED PATTERN <» iQm c c AFTER SECOND LAYER.
"^F(RST LAYER OF SHOTCRETE WITH FBRES ^ 50mm
SECTION-B B
ADr£!r^^,Kr^nr.9^^ MEASURES BY SHOTCRETE ARCHES IN CRUSHED OR GRAPHITIC ZONES

135
Photograph 6.1
Marking of Tunnel Periphery and Blast holes in Tunnel through Meta-Volcanics. The Foliation joints are paralled to tunnel Alignment.
Photograph 6.2
Application of Shotcrete by Robot Arm. The Operator is Seated Away from the Unstable Area.


136
Photographs 6.3 & 6.4
Installation of Swellex Bolts which is Fast and Convenient. In Photograph 6.3/ Parallel Blast Holes on Tunnel Roof are Visible which Shows that the Blast Design & Methodology are Good.


137
Photograph 6.5
Installation of Grouted Bolts in Meta-Volcanics After Initial Stabilization By Swellex Bolts and Fibre Reinforced Shotcrete has been Achieved.

CHAPTER VII
CONCLUSIONS

138
7. CONCLUSIONS
The study on meta-volcanics has been undertaken with the
purpose of characterising them for engineering application
and to study problems associated in tunnelling through them.
It has brought out the importance of geological mapping and
sub-surface investigations in firming up of alignment and
ascertaining tunnelling conditions.
A detailed review of the procedure and scale of mapping
for different structures has been done. For tunnel
alignments generally 1:5000 to 1:10,000 scales are
recommended whereas for portal development 1:500 to 1:1000
scale maps are required.
The methodology of core drilling has been discussed.
The importance of utilizing proper equipment and accessories
has been demonstrated. Difference in core recovery by use of
different machines in same type of Panjal volcanics has been
shown. The method of calculating RQD and its usage in
engineering geological applications has been spelt out. A
new method of calculating RQD for different units i.e.,
moderately foliated volcanics and very closely foliated
volcanics has been employed. The mean RQD for the two types
of meta-volcanics are 43% and 13% respectively. Different
methods of calculation of uniaxial compressive strength have
been discussed. UCS of meta-volcanics has been calculated by
Bemek Rock tests and Schmidth Hammer. The values for
139
moderately foliated volcanics by the two methods viz. 50-110
Mpa and 80-185 Mpa are quite comparable.
Petrographic studies have also been carried out on
moderate, close and very closely foliated volcanics. It is
clear that they have got metamorphosed and belong to green
schist facies. The flaky minerals viz. micas and chlorites
are aligned in preferred orientation. It is found that a
relationship exists between the percentage of
phenocrysts/prophyroblasts and compressive strength. Their
increase in percentage from 6 to 21 has caused increase in
compressive strength from 50 to 108 Mpa. The results also
indicate that an increment of 14% in prophyroblasts has
caused UCS to increase by 50 Mpa which is in complete
agreement with the observation on Deccan blasts (Ghosh,
1980) .
The study of seismic velocities through intact rock
samples in laboratory and their comparison with field
velocities has also been carried out. Sonic viewer has been
used to find out P and S wave velocities (5.04 - 5.77 km/sec
and 2.702 - 3.39 km/sec) through meta-volcanic samples. The
microprocessor based equipment has also given dynamic values
for Poisons ratio, modules of rigidity. Young's modulus and
volume elasticity. These have been compared with the static
values.
The Rock Mass Intactness (I) has been ascertained using
the Howng (1978) method which makes use of seismic wave
140
velocity through a rock specimen in the laboratory and field
velocity through rockmass. The intactness (I) of meta-
volcanics is calculated to be 0.377 which places them in
category II-| of Hwong.
Another interesting study is that of insitu stress in
meta-volcanics in Rajarwani area using overcoring technique.
Complete stress domain has been obtained. It is found that
the principal stress direction more or less coincides with
orographic trend and also with strike of Panjal Thurst. The
maximum horizontal stresses (7.3 Mpa) are greater than
vertical stresses (4.5 Mpa). However theoretically vertical
stresses should be about 9.5 Mpa. It is likely that the area
has been under the influence of tectonic activity.
Proper characterization of meta-volcanics has helped in
easy applicability of classification of rock masses. The
classifications of Terzaghi (1946) Bieniawski (1973, 1988),
and Barton et al (1974) have been described and applied on
meta-volcanics. It is seen that Terzaghi's method gave
rather high rock load values (upto 47 kg/cm^) specially in
squeezing rock category which is applied in case of weak,
very closely foliated volcanics. It is suggested that this
method ought to be utilized in case of steel arch supported
tunnels only for which it was developed. In the present day
context, its usage has become less favourable. RMR
values for different Geo-Structural units (classified in
cross-cut of Rajarwani drift) have been calculated. It is

141
seen that moderately foliated volcanics generally fall in
fair rock class (RMR 57 to 39) and very closely foliated
volcanics in poor to very poor rock class (RMR 31 to 12). It
is important that geo-structural units are formed prior to
calculation of RMR. The behaviour of moderately foliated and
very closely foliated bands is different in tunnelling.
There is also a great significance of tunnelling
perpendicular or parallel to strike of foliation which is
covered to a large extent in RMR system.
The Q-system is also discussed and Q is worked out for
different geo-structural units. The Q varies from 0.825 to
3.3 in moderate to closely foliated and 0.055 to 0.825 in
very close to closely foliated volcanics. It is observed
that Q-system is very sensitive to the parameters used. The
relationship of RMR and Q (Bieniawski, 1979) is decipted in
plate no. 6.1 & 6.2 which indicates that RMR = In Q+44 is
very satisfactory for Panjal volcanics in this area.
Various methods of support of tunnels have also been
discussed. Selection of supports based on rockmass classifi
cation is suggested. The use of proper tunnelling
methodology which includes excavation by way of blasting and
rock support is discussed. Deployment of well maintained
mobile equipment is necessary. Proper support methods using
fibre-reinforced shotcrete and rock bolts are recommended in
meta-volcanics. The problems of failure in walls while
tunnelling sub-parallel to foliation are highlighted.

142
For planning, design and executing a tunnelling project in
Pangal volcanics following methodology needs to be adopted:
Study of regional geology, geomorphology and structure
with due consideration to tectonic history. Careful
geological mapping following by sub-surface investigations.
To ascertain joint pattern with special consideration to
foliation joints, infillings and their continuity. If
possible the tunnel should be aligned perpendicular to
foliation joints. Measurement of insitu stress is
recommended for large openings. Proper classification of
rockmasses using RMR & Q systems and rock support based on
the above classifications is important. Timely deployment of
machinery is important in many cases. A great deal of
tunnelling remains to be done in the Himalaya and also in
peninsular India. Hydropower schemes, transport sector and
mining industry are the areas of a huge potential of
tunnelling. It is very important that correct methodology is
adopted in each case.

BIBLIOGRAPHY
143
BIBLIOGRAPHY
1. Abad, J.;Celada,B.; Chacon,E.;Gutierrez,V. and Hidalgo,
E. (1983). Application of geomechancal classification
to predict the convergence of coal mine galleries and
to design their supports. Procd. 5 Int. Cong. On Rock
Mechanics, ISRM, Melbourne, Vol. 2, pp E 15-19.
2. Bandyopadhyay, M.R. and Dhawan, G.(1994). Impact of
geological environment on planning and construction of
underground works at Chamera project. Indian J. of
Power and River Valley Development. Chamera HE Project
Number.
3. Barton, N.; Lien ,R. and Lunde, J. (1974). Engineering
classification of rock masses for the design of tunnel
support. Rock Mechanics, Vol. 6, No 4., pp 189-236
4. Bieniawski, Z.T. (1973). Engineering classification of
jointed rock masses. Transactions of the South African
Institutions of Civil Engineers. 15 (12) pp 335-344.
5. Bieniawski, Z.T. (1975). Point load test in
Geotechnical practice. Engineering Geology 9, pp 1-11.
6. Bieniawski, Z.T. (1976). Rock mass classification in
rock engineering. Procd. Symp. Expolaration for Rock
Engineering. 1, pp 97-106 (Ed.Z.T. Bianiawski, A.A.
Balkena, Rotterdam).
7. Bieniawski, Z.T. (1979a). The geomechanics
classification in rock engineering applications. Procd.
4 Int. Cong, of ISRM, Montereux, Balkema, Rotterdam, 2,
pp 41-48.

144
8. Bieniawski, Z.T. (1979b). Tunnel design by rock mass
classification. Tech. Report No. GL-79-19 Prepared for
office of Chief of Engineers, U.S. Army, Washington
D.C., U.S.A.
9. Bieniawski, Z.T.; Franklin, J.A.; Bernede, M.J. and
Doffaut, P.; Runmel, F. ; Horibe, T. ,- Broch, E. ;
Rodrigues, E.; Van Heerden, W.L. and Vogler, U.W.;
Hasagi, I.; Szlavim, J.; Bardy, B.T.; Deere, D.U.;
Hawkes, I.; Milovanovic, D. (1979). Suggested methods
for determining the UCS and deformability of rock
materials. ISRM Commission on Standardisation of
Laboratory and Field tests. Publ. Int. J. of Rock
Mech. and Mining Sc. and Geomech. Abs. Vol. 16 No. 2,pp
135-140.
10. Bieniawski, Z.T. (1988). The rock mass rating (RMR)
system (Geomechanics classification) in engineering
practice. Rock Classification Systems for Engineering
Purposes, ASTM STP 984, Louis Kirkaldie (ed). American
Society for Testing and Materials, Philadelphia, pp 17-
34.
11. Blackwood, R.L. (1977). An instrument to measure the
complete stress field in soft rock and coal in a single
operation. Procd. Int. Symp. On Field Measurements in
Rock Mech. K.Kovari (ed) A.A. Balkema, Rotterdam, Vol.1
pp 137-150

145
12. Broch, E. (1974). The influence of water on some rock
properties. Advances in Rock Mech. Procd. 3 Cong. Int.
Soc.
13. Broch, E. and Franklin, J.A. (1972). The point load
strength test. Int. J. of Rock Mech. Min. Sci. 9, pp
669-697.
14. Cameron-Clark, F.S. and Budavani,S. (1981). Correlation
of rock mass classification parameters obtained from
bore hole and insitu observations. Engineering Geology,
17,pp 19-53.
15. Carlsson, A. and Olsson, T. (1981) . Determination of
compressive strength of rocks using rebound test hammer
and uniaxial compression tests. Bull, of the Geol.
Inst, of the University of Uppsala, Sweden.
16. Chauhan, R.P.S. and Sharda, Y.P. (1990). Rock load
estimationn and support system for a 21.6 Km long head
race tunnel in high ranges through W. Himalayas. Prcd.
of Silver Jubile Seminar On Trends in Geotech. Invst.
In Last 25 years. ISEG Oct. 1990.
17. Coubey, V.D. and Dhawan, G. (1990a) . Engineering geo
logical mapping for tunnels in the Himalayas: A
rockmass classification approach. Procd. 6th Int. Cong.
lAEG. (Ed). D.G. Price, Balkema, Rotterdam, pp 57-64.
18. Choubey, V.D. and Dhawan G. (1990b). Application of
rock mass classification approach to 3-D geological
logging of exploratory drifts. Prod. Silver Jubliee

146
Seminar on Trends on Geotech. Investigations in Last
25 years. ISEG, 20(1-4), Calcutta, pp 205-211.
19. Colback, P.S.B. and Wiid, B.L. (1965) The incluence of
moisture content on comprassive strength of rock. Proc.
3rd Canadian Rock Mech. Symp., Toronto, 1965, pp 65-83
20. Dearman, W.R. and Fooks, P.O. (1974). Engg. Geol.
mapping for civil engg. practice in the U.K. Quart. J.
of Engg. Geol. Vol. 7., pp223-256.
21. Deere, D.U. (1964). Technical description of rock cores
for engg. purpose. Rock Mech. and Engg. Geology Vol.
No. I, pp 17-22
22. Deere, D.U.and Deere, D.W.; (1988) . The rock quality
designation (RQD) index in practice. Rock Clasification
Systems for Engg. Purposes. Louis Kirksldie (Ed), ASTM,
Philadephia, 1988,pp 91-101.
23. Deere, D.U. and Miller, R.P. (1966). Engineering
classification of index properties for intact rock.
Technical report No. AFNL - TR - 65-116, Airforce
Weapons Lab., New Mexico.
24. Dhar, Y.R.(1986). Geotechnical assesment of a power
house cavity at Uri Hydel Project in Kashmir Himalaya,
India. Procd. Int. Symp. On Large Rock Caverns,
Finland,pp929-941.
25. Dhar, Y.R. and Choubey, V.D. (1986) . A critical
geotechnical evaluation of Himalayan rock masses with

147
reference to rock tunnelling projects. Procd. 5th Int.
Cong. lAEG, Balkema, Rotterdam, pp 249-2 88.
26. Dhawan, G. (1992). Correlations of rock support system
and rock quality parameters in Himalayan Tunnels. Ph.D.
Thesis, I.S.M., Dhanbad.
27. Fuchs, G (1975). Contribution to the Geology of N. W.
Himalaya. Abh. Der Geologischam Bundes, Wien, 32, 1-
59.
28. Gansser, A (1964). Geology of the Himalaya. India Sc.
Publ.
29. Ghosh, D.K. (1980). Relationship between petrological
chemical and geomechamical properties of Deccan Basalt
India. Procd, 26th Int Geol. Congress. Bull of lAEG,
No. 22 pp 287-292.
30. Ghose, A.K. and Raju, N.N. (1981) . Charecterization of
rock mass vis-a-vis application of rock bolting in
Indian Coal Measures. Procd.. 22nd U.S. Symp. Rock
Mech. M.TT. Camb, Mass. pp 422-427.
31. Griffits, U.F. and King R.F. (1986). Applied geophysics
for geologists and engineers. Pergaman Press Oxford.
32. Grimstad E. and Barton, N. (1995). Rock mass
classification and use of NMT in India. Procd Conf. On
Design and Const, of U/G Struct., New Delhi. Printed by
System India, New Delhi.
33. Reiner, A,; Martna, J,; Stille, H.;(1993). The Uri
Project and its status 1992. BeFo, Bergmekanikdga 1993,
Foredrag, Stiffelsen Bergfeknisk Forsking.
148
34. Heiner, A.; Martna, J. and Stille, H. (1994) . Geology of
the Uri Project. Procd. of Workshop On Fibre -
Reinforced ShofCrete by ISRMTT, New Delhi.
35. Heuze, F.E. (1971). Sources of errors in Rock Mechanics
field measurement and related solutions. Int. J. of
Rock Mechanics and Mining Sciences, Vol.8 pp 297-310.
36. Hoek, E. and Bray J.W (1981). Rock Slope
Engineering. Inst. of Minina:g & Metallurgy, London.
37. Hoek, E. and Brown, E.T. (1980) Underground Excavation
in Rock. Institute of Mining & Metallurgy, London.
38. Howng, Ting-Chang, (1978) . Classification of the rock
mass structures and determenation of rock mass quality.
Bull of lAEG No. 18, pp 139-142.
39. lAEG (1976). Engineering Geological Maps-. A guid to
their preparation. UNESCO Press, Paris.
40. Indian Standard Code (1976) IS-4453. Explorations by
pits, trenches, drifts, and shafts.
41. Indian Standards Code (1981) IS-10060. Code of
practice for sub-surface invest, of power house sites.
42. Indian Standards Code (1985) IS-6065 part I. Recm. for
the prep, of geol. and geotech. maps for R.V.P. Part I,
Scales.
43. ISRM (1978). Suggested methods for the quantitative
description of discontinuities in rock masses. Int. J.
Rock Mech. Min. Sci. and Geomech. Abstr. 15,319-338.

149
44. ISRM (1985). Suggested method for determining point
load strength. Int. J. of Rock Mech. & Mining Sciences
and Geomechanics Abs., Vol.22, No.2, pp 52-60.
45. ISRMTT NEWS. (1993-94) A Bull, of Ind. So. for Rock
Mech. and Tunnelling Technology, Vol 2, No. 4 & 3 Vol 3
No.l.
46. Jethwa, J.L., Dube, A.K., Singh, B; Singh, Bhawani and
Mithal, R.S. (1982). Evaluation methods for tunnel
support design in squeeing rock conditions. Procd. 4
Cong. ISEG, New Delhi, Vol 5, Oxford & IBH Publ, New
Delhi.
47. Krishan, M.S. (1982) Geology of India and Burma. CBS
Publ. India.
48. Krynine, Dimitri P. and Judd, William R.,(1957)
Principles of Engineering Geology and Geotechnics.
Publ. Mc Graw Hill Book co. N.Y.
49. Legget, R.F. (1962). Geology and Engieering. McGraw
Hill Book Co. N. Y. 884 Pages.
50. Lydekker R. \1876) Geology of Pir Panjal and
Neighbouring Districts. Rec. G.S.I. 9 (4) pp 155-167.
51; Madan, M.M. (1990) Brief History of Tunnel Construction
at Loktak Hydroelectric Project(1990). CHIP Publ. No.
217, New Delhi.
52. Mai Barna, B.D. (1982). Geol. basis for the evaluation
of rock loads on the Chenani HE tunnels, Udhampur
Dist., J&K, India. Procd. 4 Cong. lAEG Vol. 5, pp V 91-
97.

15 J
53. Middlemiss, C.S. (1911). Sections in Pir, Panjal and
Neighbouring districts. Rec. G.S.I. Vol IX, p.155.
54. Muller, L. (1988). The influence of Engineering Geology
and Rock Mechanics in Tunnelling. Bull, of the lAEG,
No.13 8, pp 5-13.
55. Naidu, B.S.K. (1992). Planning and Management of
Hydropower Resources in India. CHIP, Publ. No.226, New
Delhi.
56. Persson, G. and Rytters, K.(1990). Review of Jhelum
River steam flow. Unpubl. memo of SWECO.
57. Rocha, M. and Silverio, A.A (1969) A New method for the
complete determination of the state of stress in rock
masses. Geotechnique, Vol 19, Pages 116-132.
58. Sen, A. (1993). Pers. Comm. (NHPC, DPR, Kishanganga HEP)
59. Sayeed, I. and Bist, S.S. (1995). Environment Friendly
Hydropower Scheme in Pir Panjal Range of Kashmir. Symp.
on Recent Adv. in Geol. Studies of Himalaya & Foredeep.
G.S.I. Lucknow Feb, 1995.
60. Shah, S.K.(1968). A lithostratigraphic classification
of lower Paleozoic Slate group of Pohru valley, N.W.
Kashmir, Univ. Rev. Jammu. 2(3).
61. Shah, S.K.(1972). Stratigraphic studies on Lr.
Paleozoic sequence of Ananthnag District. Himalayan
Geology, 2.
62. Shah, S.K. (1978). Facies pattern of Kashmir within
tectonic framenwork of Himalaya. P.S. Saklani (ed) .
151
Publ. Today & Tommorrow, New Delhi.
63. Shah, S.K. (1979). Stratigrapy and tectonic setting of
Lesser Himalayan belt of Jammu. Proc. of Workshop on
Strat. & Correlations of Lesser Himalayan Formations.
Hindustan Publ. Co.
64. Sharma, V.P. (1976). Stratigraphy & Tectonics of the
SE Jammu Himalaya. G.S.I. Misc Publ. No.34.
65. Sharma, K. S. ; Hegde, U.V. and Sayeed I. (1995).
Tunnelling and adopted support measures in fair to poor
rock conditions of Kashmir Himalaya. Procd. Conf. on
Design and Construction of u/g Structures, New Delhi.
Printed Systems India, New Delhi, pp 495-508.
66. Shome, S.K. (1989). What is engineering geological map
(EGM) and how it should be prepared? J. of Engg.
Geology (India). Volume 18 (3&4), pp 51-55.
67. Shame, S.K. and Kaistha, G.K. (1988). Some questions
and doubts about the rock mass classification system.
Procd. IGC-88, Allahabad. Vol 1, pp 107-109.
68. Shome, S.K.; Kaistha, G.K. and Sharma, K. (1979). A
method of computing RQD in jointed rock not amenable to
good core recovery. Procd. Nat. Symp. of Rock Mech. in
R.V.P. IGS, Roorkee.
69. Srikantia, S.V. (1973). The tectonic and stratigraphic
position of 'Panjal volcanics' in the Kashmir Himalaya-
A Reappraisal. Himalayan Geology 3, pp 59-71.

152
70. Tiku, A.K. and Dhar, Y.R (1982). Geomechanical basis
for the evaluation rock loads on the proposed tunnel
and power house cavity at the Uri Hydel Project,
Kashmir. Procd. IV, Cong. ISEG, New Delhi, Vol V,
Oxford and IBH, Publ., New Delhi, pp V 99-112.
71. Terzaghi K. (1946). Rock defects and loads on tunnel
support in: Rock Tunnelling with Steel Supports.
Editors R.V. Proctor and T. White. Publ. by Commercial
Shearing and Staming Co., Youngston., 1946, pp 15-99.
Also Harvard University, Graduate School of
Engineering, Pulication 418 Soil Mechanics Series 25.
(Cited from Hook & Brown,1980).
72. Tyagi, G.D. and Sharma, K.S.(1982). Adverse geology
necessitated heavy support rectification while
tunnelling at Loktak project. Procd. 4 Cong. ISEG, New
Delhi, Vol 5, Oxford & IBH Publ., pp V 163-182.
73. Virdi, N.S.(1982). Hydel project in the Garhwal
Himalaya and their environmental evaluation. Procd. IV,
Cong. lAEG, No. 1, pp I 237-245.
74. Wadia, D.N. (1928) . Geology of Punch State (Kashmir) amd
Adjacent portions of Punjab. Mem. G.S.I. 511 (2), pp
185-370.
75. Wadia, D.N. (1934). The Cambrian-Triaslas Sequence of
North-Westren Kashmir (Parts of Muzaffarabad and
Baramulla Districts). Rec. G.S.I., 68 (2), pp 121-176.
153
76. Wadia, D.N. (1957). Geology of India. Macmillan & co.
Ltd.
77. Wortnicki, G. and Walton, R.J. (1976) . Triaxial
"Hollow Inclusion" guages for the determination of rock
stress insitu. Proc. ISRM Symp. on Investigation of
Stresses in Rock and Advances in Stress Measurement,
Sydney, 1976, pp 1-8.
78. Zariiba, Q. and Mencl, V. (1976). Engg. Geology.
Elsevier Sc. Publ. Co., Amesterdam, 504 pages.