gender differences in careers - etlagender differences in careers 1 contents abstract 2 1...
TRANSCRIPT
IGender Differences in Careers
Gender Differences in Careers
KeskusteluaiheitaDiscussion Papers
9 Mar. 2011
No 1241
* ETLA – Elinkeinoelämän Tutkimuslaitos, [email protected]** ETLA – Elinkeinoelämän Tutkimuslaitos, [email protected]
Antti Kauhanen* – Sami Napari**

ETLA Keskusteluaiheita – Discussion Papers No 1241II
Acknowledgements: We are grateful for funding from the TT-foundation.
ISSN 0781–6847
1Gender Differences in Careers
Contents
Abstract 2
1 Introduction 3
2 Earlierempiricalliterature 4
3 Theoreticalbackground 6
4 Data 7 4.1 TheEKdata 7 4.2 Thehierarchy 8
5 Thenatureofentry-levelsegregation 12
6 Genderdifferencesinpromotionrates 13
7 Genderdifferencesinstartingwagesandreturnstopromotions 17 7.1 Genderwagegapinstartingwages 17 7.2 Genderdifferencesinthereturnstochangesinhierarchicalposition 18
8 Conclusion 20
References 22
Appendix 25
ETLA Keskusteluaiheita – Discussion Papers No 12412
Tiivistelmä
Tutkimuksessa tarkastellaan sukupuolten välisiä eroja työurissa hyödyntäen laajaa yhdistettyä työnan-taja-työntekijä aineistoa Suomen teollisuuden toimihenkilöistä vuosilta 1981–2006. Analyysi keskittyy työmarkkinatulokkaisiin, joiden urakehitystä seurataan yli ajan. Tutkimuksen keskeisimmät havainnot ovat seuraavat: Miehet aloittavat työuransa vaativammista tehtävistä kuin naiset. Keskeinen tekijä tämän työuran alun segregaation taustalla on sukupuolten erilaiset koulutusvalinnat. Tutkimuksessa havaitaan lisäksi, että miehet myös ylenevät naisia todennäköisemmin. Erityisen suuret sukupuolten väliset erot ylenemistodennäköisyydessä ovat heti työuran ensimmäisinä vuosina voimistaen miesten ja naisten eroja tehtävien vaativuustasoissa työmarkkinauran alussa. Tulokset palkkatarkastelusta puolestaan osoit-tavat, että miehillä on naisia suuremmat aloituspalkat. Sen sijaan tulokset sukupuolten välisistä eroista tehtävien vaihtoihin liittyvissä palkanmuutoksissa eivät ole yksiselitteisiä vaan riippuvat muun muassa tehtävän vaihdon laadusta (esim. ylennys vs. alennus) ja uravaiheesta. Kaiken kaikkiaan tutkimuksen tulokset auttavat ymmärtämään niitä tekijöitä, jotka vaikuttavat sukupuolten välisten palkkaerojen voi-makkaaseen kasvuun työuran alussa.
Asiasanat: Työurat, yritysten sisäiset työmarkkinat, ylennykset, liikkuvuus, palkkakasvu, sukupuolten väliset palkkaerot
Abstract
We examine gender differences in careers using a large linked employer-employee dataset on Finnish white-collar manufacturing workers over the period of 1981–2006. Our focus is on labour market en-trants whom we follow over time. We find that men start their careers from higher ranks of the hierarchy than women do, although gender differences in education explain much of this gap. Men are also more likely to be promoted than women, especially during the first years in the labour market, amplifying the gender differences in hierarchical positions already apparent at labour market entry. Men earn higher starting wages than women, while the results concerning gender differences in the returns to career progression are not clear-cut, but depend on the type of career event and on the career phase. Overall, our results helps to understand the factors behind the large increase in the gender wage gap during the early career observed in the earlier literature.
Key words: Careers, internal labour markets, promotions, mobility, wage growth, gender wage gap
JEL: J16, J24, J31, J62
3Gender Differences in Careers
1 IntroductionWomen’swageslagstubbornlybehindthoseofmen.Recentstudieshaveshownthatgenderwagegapsaremainlydrivenbygenderdifferencesinwagegrowthduringthefirsttenyearsinthelabourmarket(e.g.ManningandSwaffield2008),althoughsomestudieshavealsofoundevidence of significant gender wage differentials already at entry to the labour market.(e.g.Napari2009).Somepartofthegendergapinearly-careerwagegrowthcanbeexplainedbydifferencesinhumancapitalinvestmentandjobmobilitybehaviourbetweenmenandwomen,buttypicallyasubstantialunexplainedgapremains.Onepotentiallyimportantfactorcontrib-utingtotheobservedgrowthofthegenderwagegapearlyinthecareerisgenderdifferencesincareerprogression.Iftherearegenderdifferencesinpromotionprobabilities,propensitytochangeemployers,andreturnstodifferentcareerevents,menandwomenwillindeedexperi-encedifferentearly-careerwagedevelopment.
Therehasbeenincreasinginterestintheseissues,especiallyingenderdifferencesinpromo-tionprobabilityandreturnstopromotion.However,thisliteratureisstillrelativelysmall,andthereisconsiderablevariationinthemainconclusionsbetweenstudies,whichmakesitdiffi-culttoinferhowimportantgenderdifferencesinpromotionprobabilityandassociatedwagereturnsactuallyareincontributingtotheemergenceofthegenderwagegap.Onereasonforthisvariationinfindingsisthatmuchoftheexistingliteratureconsistsofcasestudiesusingdata fromasingle firm.Giventhat therulesandpracticesgoverningpromotionsdifferbe-tweenfirms,itisnotsurprisingtoseestudiesreachsuchdifferentconclusions.Therefore,itwouldbeimportanttogetresultsongenderdifferencesincareersbasedonmoregeneraldata-sets.Thesestudieswouldhelpinconformingwhichoftheresultsofthepreviousstudiesholdacrossvarioussettingsandwhichareidiosyncratictotheparticularfirms.
Byfocusingongenderdifferencesinpromotionprobabilitiesandassociatedwagegains,theliteraturehasalsoneglectedsomeimportantaspectsofcareersthatpotentiallydrivegenderdifferencesinwages.First,theresearchhaspaidlittleattentiontowhethertherearegenderdifferencesinentrypositionsandstartingwages.Itisastylisedfactthatwomenarelesslike-lytoworkinhigh-rankingpositionsthanmen,butitisunclearwhattheroleofgenderdiffer-encesininitialjobassignmentisinthisrespect.Somerecentstudieshavepointedoutthatac-countingforgenderdifferencesininitialjobassignmenthelpstoexplaingenderdifferencesinsubsequentcareers(e.g.PekkarinenandVartiainen2006).Also,littleisknownaboutthefac-torsbehindgendersegregationinpositionsattheentrytolabourmarket.
Second, even studies using large datasets have usually considered only promotions withinfirms and neglected promotions linked to job mobility. This is potentially important sincepreviousresearchhasdocumentedgenderdifferencesinjobmobility(e.g.KeithandMcWil-liams1999).Third,genderdifferencesinpromotionpatternsindifferentcareerphaseshavegonelargelyunstudied.Basedontheobserveddevelopmentofthemale-femalewagediffer-ences,wewouldexpect that thegendergapinpromotionprobability ishigher immediatelyafterlabourmarketentrycomparedtothelatercareer.Fourth,theliteratureisstilldominat-edbystudiesthatfocuseitherongenderdifferencesinpromotionprobabilitiesoronreturnstopromotions. However,withoutconsideringbothoftheseaspectsofcareers,itisdifficulttogetacomprehensivepictureoftheimportanceofgenderdifferencesincareerprocessesasamechanismbehindthegenderwagegap.Furthermore,becausemanyofthetheoreticalmod-elsofpromotionpayattentiontoboththelikelihoodofpromotionandtherewardstoupward
ETLA Keskusteluaiheita – Discussion Papers No 12414
mobility,itisnecessarytoanalysebothofthemtoassessthetheoreticalworkongenderdif-ferencesincareers.
Weusealargelinkedemployee-employerdatasetincludingroughly4000firmsandmorethan640000observationsonwhite-collaremployeesintheFinnishmanufacturingsectorovertheperiod of 1981–2006. We concentrate on employees who enter the labour market in 1981–2006andfollowthemovertime.Keytoouranalysisisthatwehavedetailedinformationonthefeaturesofjobsincludedinthedata,whichallowsustoranktheminasystematicman-nerintohierarchies.Furthermore,becausethejobclassificationsystemissimilarforallfirmsinthedata,theresultinghierarchyisidenticalacrossfirms.Wearethusabletoaddtothelit-eraturebyprovidinginformationonhowwelltheconclusionsofthegenderdifferencesinca-reersmadeinthepreviouscasestudiesfocusingonaparticularfirmorindustrygeneralizetowidereconomy.
Withthisuniquedata,weexaminegenderdifferences in three importantaspectsofcareersthatimproveourcurrentunderstandingofthedriversofthegenderwagedifferentials.First,weinvestigategenderdifferencesincareersrightfromtheverybeginningbyexploringgendersegregationinstartingpositions.Second,westudylatercareerdevelopmentbyinvestigatingpromotionprobabilitiesindifferentcareerphases.Weaimtoanswerthequestionofwhetherwomencatchupwithmenintermsofhigh-rankingpositionslaterintheircareersorwhethertheylagevenfurtherbehind.Entrypositionsandpromotionsare,however,onlyonepartofthecareerprocess–wagesmatteraswell.Therefore,wecompleteouranalysisofgenderdif-ferencesincareersbyinvestigatingstartingwagesandreturnstochangesinhierarchicalpo-sitions.Equippedwithinformationonthehierarchicalstructureoffirmsthatiscomparableacrossemployers,weareabletoexploregenderdifferencesincareerandwagedynamicsbothwithinandbetweenfirms,atopicthathasnotsofarreceivedattentionintheliteratureduetolackofsuitabledata.
Thestructureofthepaperisasfollows.Section2providesashortreviewoftheearlierem-piricalliteratureongenderdifferencesincareerandwagedynamics.Section3discussesthetheoreticalframeworkofthepaper.Dataarepresentedinsection4.Thisisfollowedbyanex-aminationofgenderdifferencesininitialjobassignmentinsection5.Section6investigatespromotionrates,andinsection7,genderdifferencesinstartingwagesandreturnstochang-esinhierarchicalpositionsareanalysed.Thefinalsectionsummarisesthemainconclusions.
2 Earlier empirical literatureTheanalysisofgenderwagegapshasalongtraditionineconomicresearch(seeAltonjiandBlank1999,BlauandKahn2000,Kunze2008forreviews).However,onlyfairlyrecentlyhaveresearchersstartedpayingmoreattentiontohowthegenderwagegapvarieswiththephaseofacareer.Atypicalfindingfromthesestudieshasbeenthatthegenderwagegapisfairlysmallatentrytothelabourmarket,butafterafewyearsaconsiderablegenderwagegapemerges(e.g.Loprest1992,ManningandSwaffield2008,Napari2009).Muchoftheanalysisofthefac-torscontributingtothisgrowthofthegenderwagegaphasfocusedontheroleplayedbygen-derdifferencesinworkexperienceandlabourmarketparticipation.Studieshavefoundthatalthoughwomen’stendencytospendmoretimeoutsidethelabourmarketthanmendamp-erswomen’swagegrowth(e.g.LightandUreta1995,ManningandSwaffield2008)genderdif-
5Gender Differences in Careers
ferencesinearly-careerwagedevelopmentarenotonlyduetodifferencesinworkexperiencebetweenmenandwomen,butthatasubstantialunexplainedgapremainsafteraccountingforlabourmarketexperience(Kunze2003,ManningandSwaffield2008).
Themorerecentlineofresearchhasexploredgenderdifferencesincareerprogressionasoneof thepotentialmechanismbehind thegenderwagegap.Thereare, for instance,agrowingnumberofstudiesongenderdifferencesinpromotionsandthewagereturnstopromotions.However,forseveralreasons,itisdifficulttodrawconclusionsfromthemabouttheimpor-tanceofpromotionsandtheassociatedwagereturnsinexplainingtheemergenceofthegen-derwagegap.First,previousstudiesdiffersignificantlyintheirmainfindings.Intermsofthegenderdifferencesintheprobabilityofpromotion,themostcommonfindingisthatmenaremorelikelytobepromotedthanwomen1.Thereare,however,alsomanystudiesfindingnogenderdifferencesinpromotionprobability2,andstillotherpapersconcludethatthelikeli-hoodofpromotionishigherforwomen3.Inaddition,theconclusionsconcerninggenderdif-ferencesinthereturnstopromotionsvarygreatlybetweenstudies.Forexample,Boothetal.(2003),Fransesconi(2001),andHerschandViscusi(1996)findthatmenbenefitmorefrompromotionsthanwomen.BlauandDevaro(2007),McCue(1996),OlsonandBecker(1983),andPergamitandVeum(1999),ontheotherhand,concludethatthereturnsaresimilarformenandwomen.Finally,Cobb-Clark(2001)findsthatwomenexperiencehigherreturnstopromotionthanmen.Onereasonforthisvariationinfindingsisthatmuchoftheexistinglit-eratureconsistsofcasestudiesusingdatafromasinglefirm.4
Second,mostofthepreviousstudiesongenderdifferencesinpromotionsandtheassociatedwagegainsdonotpayanyattentiontocareerphase.OneexceptiontothisisMcCue(1996)whoprovidesdescriptiveevidenceofhowthefrequencyofdifferentcareermovesandthere-turns to these moves vary with experience separately for men and women. Her results forwhitemenandwomenshowthat,somewhatsurprisingly,men’sadvantageoverwomeninthefrequencyofpromotionissmallestduringthefirsttenyearsinthelabourmarket.Ontheoth-erhand,whenitcomestowagegrowthassociatedwithpromotions,menbenefitmorefrompromotionsduringtheearlycareerthanwomen,butamongthemoreexperiencedworkersitiswomenwhogainmorefromupwardmobility.
Third, the literature is still dominated by studies that focus either on gender differences inpromotionprobabilitiesorinreturnstopromotions.However,becausethetotalcontributionofpromotionstowagegrowthobviouslydependsonbothoftheseaspectsofcareers,itwouldbeimportanttoconsiderbothoftheminordertogetabetterunderstandingoftheroleplayedbypromotionprocessesbehindthegenderwagegap.Afairlycompletelistofstudiesanalys-inggenderdifferencesintheprobabilityofpromotionandtheassociatedwagegainsisBoothetal.(2003),Cobb-Clark(2001),HerschandViscusi(1996),andOlsonandBecker(1983).OfthesestudiesthepapersbyBoothetal.andOlsonandBeckersuggestthatgenderdifferenc-esinpromotionprocessesincreasethewagegapbetweenmenandwomenbecausemenex-periencehigherreturnstopromotionthanwomenandtherearenogenderdifferencesinthe
1 (e.g. Cabral et al. 1981, Olson and Becker 1983, McCue 1996, Winter-Ebmer and Zweimuller 1997, Pergamit and Veum 1999, Cobb-Clark 2001, Ransom and Oaxaca 2005, Pekkarinen and Vartiainen 2006, Blau and Devaro 2007).2 (Jones and Makepeace 1996, Paulin and Mellor 1996, Pudney and Shields 2000, Booth et al. 2003).3 (Hersch and Viscusi 1996, Petersen and Spilerman 1999).4 Exceptions to this are, inter alia, Blau and DeVaro (2007), Booth et al. (2003), Cobb-Clark (2001), McCue (1996), Olson and Becker (1983), Pekkarinen and Vartiainen (2006), and Pergamit and Veum (1999).
ETLA Keskusteluaiheita – Discussion Papers No 12416
probabilityofpromotion,aswasdiscussedabove.Cobb-ClarkandHerschandViscusiontheotherhanddonotprovideclear-cutimplicationsfortheeffectsofpromotiondynamicsonthegenderwagegapastheyfindthatmenhaveanadvantageoverwomeninoneofthecompo-nentsofthepromotionprocesseswhilewomenmakebetterthanmenwithrespecttheothercomponent.
Yetanotheraspectofgenderdifferences incareers fromwhichwehavecurrentlyonly littleknowledgeisinitialjobassignment.However,somerecentstudieshaveshownthatpayingat-tentiontogendersegregationininitialpositionsmightbeimportant.Thisiswellillustratedforinstanceby(e.g.PekkarinenandVartiainen2006),whofindthatgenderdifferencesinthelikelihoodofpromotionare small if initialassignment is ignored.However,whenmenandwomensharing thesame initialpositionare investigated,womenaremuch less likely tobepromotedthanmen.Cabraletal.(1981)andRansomandOaxaca(2005)areotherexamplesofstudiesexamininggenderdifferencesininitialpositions.Theybothfindthatwomenstarttheircareersatlowerlevelsofthehierarchythanmendo.
3 Theoretical backgroundThehumancapitaltheoryisperhapsthetoolmostfrequentlyappliedbyeconomiststoexplainjobchoicesandwhytheymightdifferbygender.Inbrief,accordingtothehumancapitalthe-ory,segregationoccursbecausemenandwomendifferintermsofinvestmenttohumancap-ital.Thereareseveralpotentialreasonsforthis,butthehumancapitaltheoryhighlightstheroleplayedbygenderdifferencesinlabourmarketattachment.Becauseofwomen’straditionalroleasthemainproviderofchildcarewithinthefamily,womentendtoaccumulatelessworkexperienceandhavemoresporadicemploymenthistoriesthanmendo.Therefore,inantici-pationoffuturecareerbreaks,womenmightbelessmotivatedthanmenaretoapplyforjobsrequiringconsiderableinvestmentsinjob-specificskillssimplybecausetheyexpecttospendlesstimeinthelabourmarketenjoyingthereturnsoftheseinvestments.Forthesesamerea-sons,wemightseegenderdifferencesineducationalchoices–menmightinvestmoreorindifferenttypesofschoolingthanwomendo.
Obviously,thereareseveralotherexplanationsforwhymenandwomenoftenendupindif-ferent jobsandpositions.Forexample,genderdifferences incompetitivenessandriskpref-erencesmaycontributetolabourmarketsegregation(seee.g.NiederleandVesterlund2007,CrosonandGneezy2009).Additionally,sexdiscriminationmayleadtosegregation.
Next,wereviewmodelsthatfocusongenderdifferencesinpromotionandtheassociatedwagegains.Thesemodelstypicallybuildongenderdifferencesinfirm-specifichumancapital.Nat-urally,however,theotherfactorsconsideredabove,suchasdiscriminationorgenderdiffer-encesinpsychologicalfactors,mightaffectpromotionprobabilitiesandassociatedwagein-creasesaswell.
Inthemodelsweconsider,genderdifferencesinpromotionratesandwagegainsresultfromdifferencesinoutsideoptions.LazearandRosen(1990)assumethattherearenogenderdif-ferences inproductivity inmarketworkbut thatwomenareonaveragemoreproductive innon-market work. There are two types of jobs in their model. The more demanding job ismoreproductive,anditisefficienttoassignhigh-abilityemployeestothisjob.However,the
7Gender Differences in Careers
moredemandingjobinvolvesaset-upcost:theemployeehastoacquirefirm-specifichumancapital,whichmeanslowinitialproductivityinthenewjob.Thus,thefirmwantstopromotehigh-abilityindividualswhoarelikelytostayinthefirmsothatitcancovertheset-upcost.Animportantfeatureofthemodelisthattheemployeeslearntheirproductivityinnon-mar-ketworkafterthepossiblepromotion.Theassumptionthatwomenareonaveragemorepro-ductiveinnon-marketworkmeansthattheyaremorelikelytoleavethefirmafterpromotion.Thisinturnindicatesthattheyarelesslikelytobepromotedinthefirstplace.Inthismodel,therearenogenderdifferencesinwagereturnstopromotion.Wagesareattachedtojobsandarethusequalformenandwomen.
Booth et al. (2003) present a model that is in many respects similar to Lazear and Rosen’s.However,intheirmodelwagesarenotattachedtojobsbecausethepromotedemployeesmayreceiveheterogeneousoutsideoffersfromcompetingfirmsthatthefirmmaywishtomatch.MaintainingtheassumptionofLazearandRosenthatwomenhavebetteroutsideopportuni-ties,thismodelimpliesthatwomenarelesslikelytobepromotedbutthatthewagegainasso-ciatedwithpromotionislargerforthem.Ontheotherhand,iftheyarepromoted,theirwagesinthenewjobhavetobelargeronaveragetoinducethemtostay.However,Boothetal.(2003)challengetheassumptionthatwomenhavebetteroutsideoptions.Theyarguethatifonecon-siderswomenwithstrongattachmenttothelabourmarket,womenarelikelytohaveworseoutsideoptionsthanmendo.Thismaybeduetowomen’sreceivingfeweroutsideoffersorthefactthattheymaynotbeabletoacceptthemaseasily,forexample,forfamilyreasons.Firmsmayalsoresponddifferentlytooutsideofferstomenandwomen.Ifoneassumesthatwomenhaveworseoutsideoptionsthanmen,thepredictionsarereversed:womenaremorelikelytobepromoted,buttheassociatedwagegainissmaller.
Thus,thetheoreticalworkongenderdifferencesinpromotionsandassociatedwageincreasesdoesnotofferclear-cutpredictions.Theresultsdependcruciallyonassumptionsaboutdiffer-encesinoutsideoptions,andtheseassumptionsarehardtojudge.
4 Data 4.1 The EK dataOurdatacomefromtherecordsoftheConfederationofFinnishIndustries(EK)coveringtheperiodof1981–2006.BothemployeesandemployersinFinlandarehighlyorganised,andEKisthemainorganisationofemployers.EKhasmemberfirmsfromseveraldifferentindustries,butthemost importantsectorrepresentedinthedata ismanufacturing.ThememberfirmsaccountforovertwothirdsofthevalueaddedofFinnishmanufacturing,andaclearmajorityofemployeesinmanufacturingareemployedinEKmemberfirms.OfthetotalemploymentinFinland,thefirmsaffiliatedwithEKaccountforover30percent.ThesectorunderstudyisthusanimportantpartofthewholeFinnisheconomy.
EKgathersthedatabysendingannualsurveystotheemployers.Theresultingdatasetishigh-lyreliableastheinformationcomesdirectlyfromtheadministrativerecordsofthememberfirms.Furthermore,becauseitismandatoryforthefirmsaffiliatedwithEKtoprovidethere-quiredinformation,thenon-responsebiasispracticallynon-existing.Thedataincludealargesetofvariablesthatarelikelytobeimportantdeterminantsofwages,promotions,andtheat-
ETLA Keskusteluaiheita – Discussion Papers No 12418
tachedwagegains.Oftheemployees’characteristics,thedataincludeinformationongender,age,tenure,levelandfieldofeducation,andjobtitle.Wecanalsocontrolforemployerchar-acteristics,suchassizeandindustry.Finally,whatmakestheEKdatasetratheruniqueisthefactthatitallowsustotakealookinsidethefirmsandconstructvariablesmeasuringthechar-acteristicsofco-workers.Wearethusabletocontrolforthegender,tenure,andeducationalbackgroundoftheco-workers.
TheEKdataset is inmanyrespectsverysuitableforthepurposesofthispaper.First, it isapaneldatasetallowingustofollowindividualsrightfromthebeginningoftheircareersoveraconsiderableperiodoftime,upto25years.Second,asdescribedabove,theinformationcon-tentofthedataisexceptionallyrich.Therefore,wecantakeintoaccountmanyissuesthatpre-viousstudieshavenotbeenabletocontrolfor.Finally,thejobsinthedatacanbeallocatedinaconsistentwaytosixdifferenthierarchicallevelsthatarecomparableacrossfirms.Section4.2discussesinmoredetailhowthehierarchyisconstructedandexaminesitsfunctionalitybypresentingdescriptivestatisticsofthetransitionsbetweenpositionsandtheaveragehour-lywagesacrosshierarchicallevels.
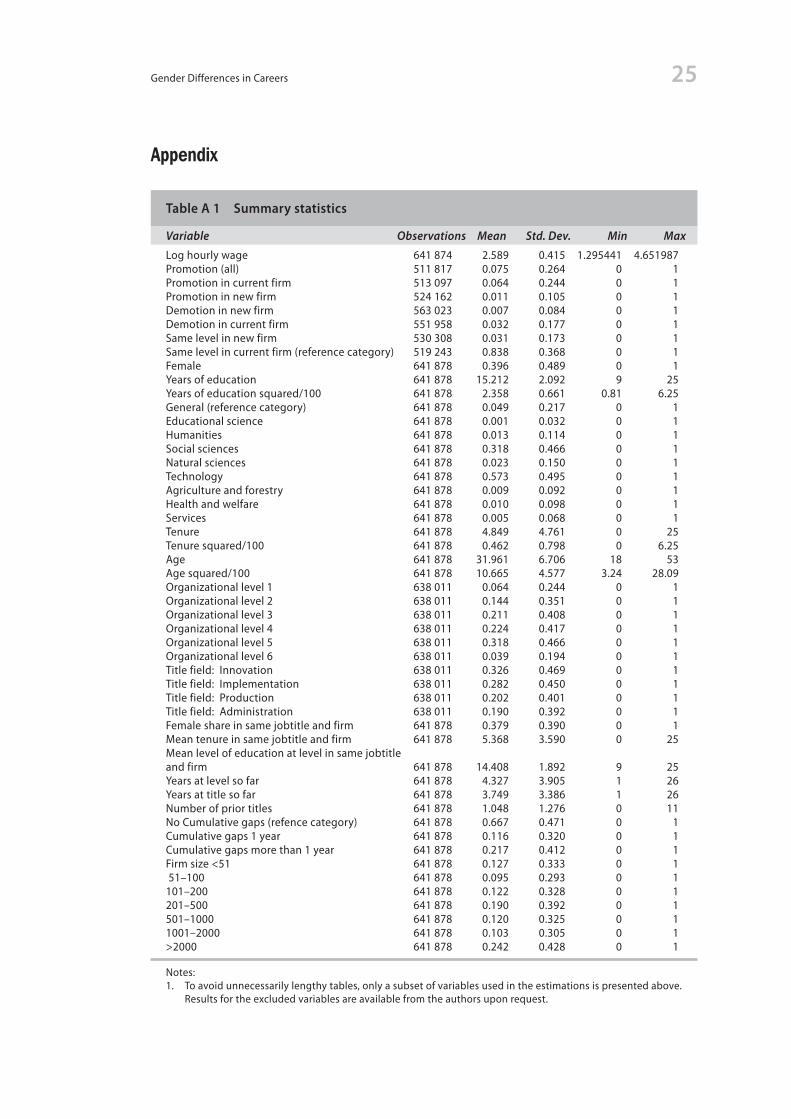
Weconsiderfull-timewhite-collarworkerswhoenteredthelabourmarketforthefirsttimeduringtheobservationperiod.By full-timeworkers,werefer to thosewhoseregularweek-lyworkingtimeisover30hours.Restrictingthesampletofull-timeworkers isof little im-portanceinpracticebecausetheshareofpart-timeworkersisnegligibleamongwhite-collarworkers,roughly2percentin2006.Furthermore,thereareonlysmallgenderdifferencesinthisrespect.EKalsogathersinformationonblue-collarworkers,butweexcludethemfromtheanalysis.Themainreasonforthisisthat,unlikeforthewhite-collarworkers,theoccupa-tionclassificationsystemintheblue-collardataiscomplex,withsubstantialdifferencesbe-tweenindustries.Therefore,itisnotpossibletoallocatethejobsintheblue-collardatasys-tematically todifferenthierarchicalpositions.Tobeclassifiedasa labourmarketentry, thepersonmustbeunder30yearsoldwithlessthan2yearsofpotentialworkexperiencewhenfirstobservedinthedata.Wealsodropped303observationswithsuspiciouslylow/highto-talhourlywages.5Theresultingdatainclude641888observations,ofwhich39.6percentarewomen.Thenumberofindividualsincludedinthedatais81163,withthefemalesharebeing45.9percent.TableA1intheappendixpresentsthesummarystatisticsforthemainvariables.
4.2 The hierarchyTheEKdatacontain75differentjobtitles.Aspartofitsdata-gatheringprocess,EKprovidesadetaileddescriptionofthefeaturesofthesejobs.Forexample,thereisinformationonwheth-erthejobincludesadministrativeormanagerialtasks,whattheeducationalrequirementsare,howmuchworkexperience isneeded,whether the job includes repetitive tasksorwhethertheoperationalenvironmentisdynamicandcomplex,etc.Weapplythisinformationtoallo-catethejobstosixdifferenthierarchicallevels.Thetopofthehierarchyconsistsofmanage-rialjobsassociatedwithfinancialresponsibility.Jobsthatrequireaprofoundexpertiseandinwhichtheoperationalenvironmentiscomplexandvariableareallocatedtothesecondlevel.
5 Total hourly wages are calculated by scaling the total monthly wage (including overtime pay, fringe benefits, bonuses etc.) by the regular weekly working hours. Wages are converted into year 2000 money by using the cost-of-living index of Statistics Finland.
9Gender Differences in Careers
Thethirdlevelconsistsofjobsassociatedwithvaryingoperationalenvironmentsinwhichtherequiredlevelofpriorexperienceandexpertiseislowerthaninjobsatthesecondlevel.Jobsatthefourthlevelrequireareasonablelevelofexpertise(i.e.,throughformaleducation),buttheproblemstobesolvedarelesscomplexthaninjobshigherinthehierarchy.Thesecond-to-lastlevelconsistsofjobsthatrequiresomepreviousworkexperiencebutwherethetasksarerepetitiveinnature.Atthebottomofthehierarchyareroutinejobswithloweducationalrequirementsinvolvingrepetitiveandsimpletasks.
AnovelfeatureoftheEKdataset isthatthesamejobclassificationsystemandjobdescrip-tionsapplytoeverymemberfirm.Thisisusefulforouranalysis.First,equippedwithamea-sureofhierarchicallevelthatiscomparableacrossfirms,wedifferfromthepreviouslitera-turebybeingabletomakebothwithin-firmandbetween-firmscomparisons.Second,byob-servingthehierarchicalstructuresoffirms,wecanmeasurepromotionasatransitionfromalowerhierarchicalleveltoahigherposition.Manyofthepreviousstudieslackinformationonthehierarchy,andthereforetheymusthavebeensettledforotherwaystodefinepromo-tion.6Onetypicalapproachhasbeentobasethepromotionmeasureonaself-reportedevalu-ation(e.g.OlsonandBecker1983,HerschandViscusi1996).Thedrawbackofthisdefinitionisthatitisinevitablysubjective:somepeopleregardacertaincareermovementasapromo-tion,whereasothersdonot.Furthermore,PergamitandVeum(1999)showthatself-reportedpromotionsareoftenassociatedwithnochangeinactualjobtitle.Manystudieshavealsousedchangesinwagecategoriesasapromotionmeasure(e.g.PetersenandSpilerman1999).How-ever,thisdefinitionalsohasitsproblems.Forexample,wagecategorieschangeformanyrea-sons,withpromotionbeingjustoneofthem.Finally,withoutinformationonthehierarchy,itisalsodifficulttocontrolforanindividual’scurrentposition.Thisisunfortunatebecauseboththeprobabilityofandthereturnstopromotionarelikelytodependonanemployee’scurrentstandinginthehierarchy.Forexample,theprobabilityofpromotionislikelytobenegativelycorrelatedwiththeemployee’scurrentpositionsimplybecausethereismoreroomforupwardmobilityatthelowerranks.Ontheotherhand,thetournamenttheoryofcareerssuggeststhatthereturnstopromotioncanbeexpectedtobepositivelyassociatedwiththecurrentstand-inginthehierarchy.
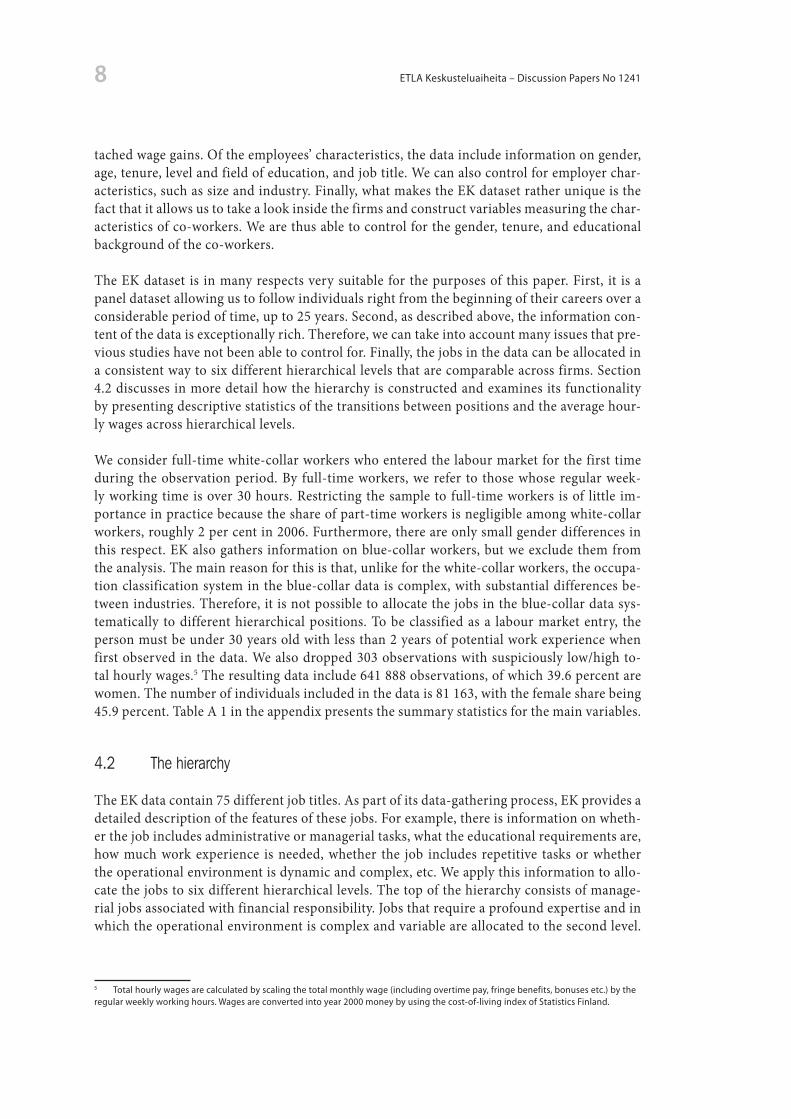
Table 1 presents information on transitions between organisational levels. The first panelshowstheresultsforthepooledsample.Asexpected,aclearmajorityofwhite-collarworkersdonotchangehierarchicallevelbetweenyeartandt+1.Furthermore,promotionsaremoretypicalthandemotions,althoughsomepeopledoseemtomovedownwardinthehierarchy.Thismightbepartlyduetojobrotationwithinfirms.Inthecontextofpromotions,itismosttypicaltomoveuponlyonelevelatatime.
PanelsBandCinTable1indicatethattherearegenderdifferencesinrawtransitionproba-bilities.First,menaremorelikelytobepromotedthanwomen.Second,menaretypicallylesslikely to be demoted than women. Finally, multilevel promotions are more typical for menthanforwomen.
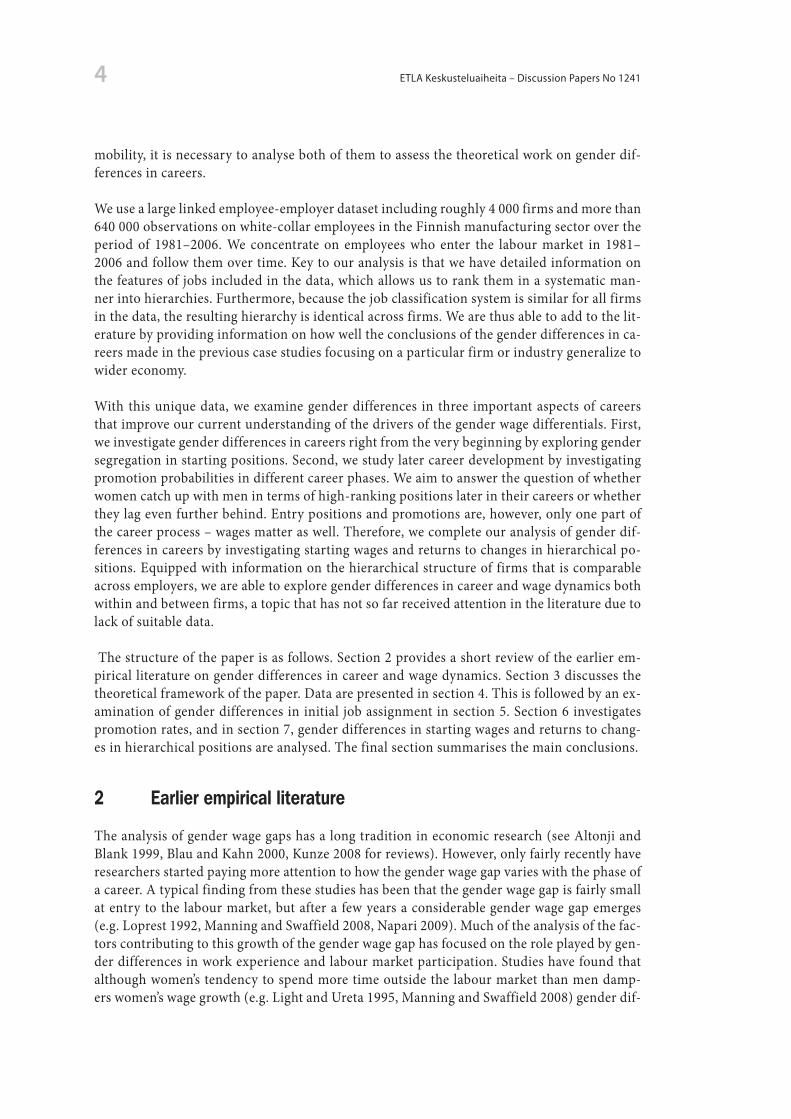
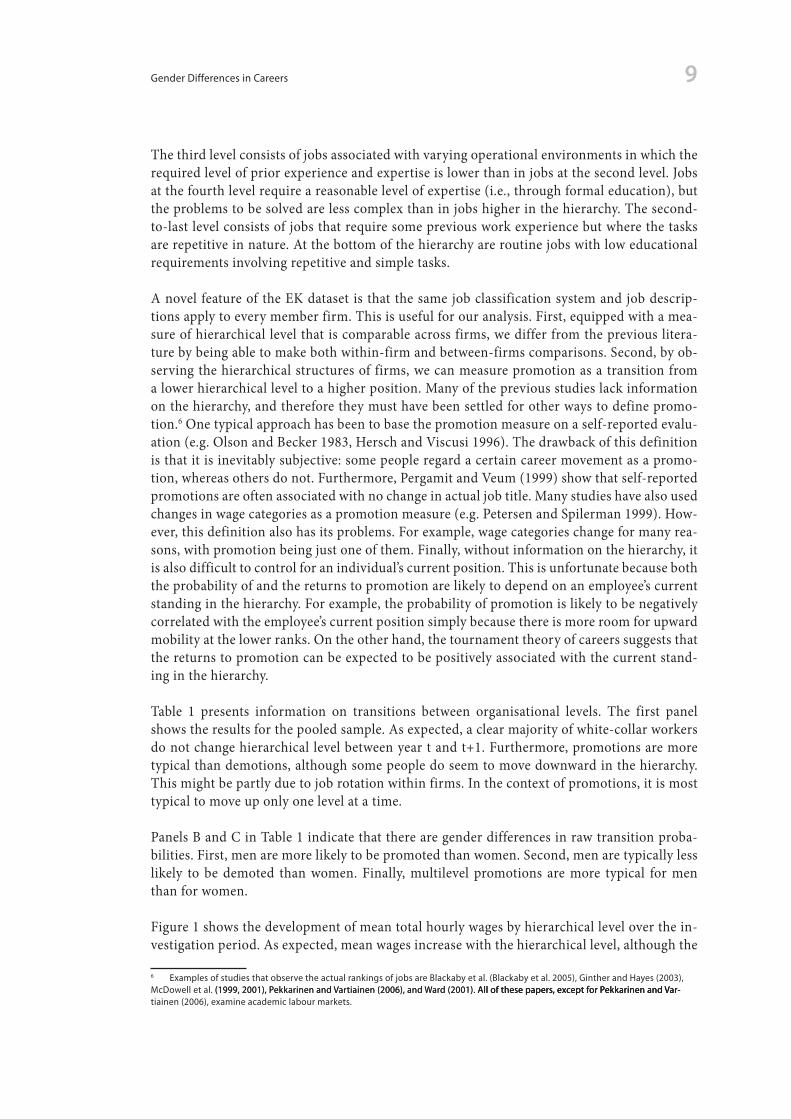
Figure1showsthedevelopmentofmeantotalhourlywagesbyhierarchicalleveloverthein-vestigationperiod.Asexpected,meanwagesincreasewiththehierarchicallevel,althoughthe
6 Examples of studies that observe the actual rankings of jobs are Blackaby et al. (Blackaby et al. 2005), Ginther and Hayes (2003), McDowell et al. (1999, 2001), Pekkarinen and Vartiainen (2006), and Ward (2001). All of these papers, except for Pekkarinen and Var-(1999, 2001), Pekkarinen and Vartiainen (2006), and Ward (2001). All of these papers, except for Pekkarinen and Var- All of these papers, except for Pekkarinen and Var-tiainen (2006), examine academic labour markets.
ETLA Keskusteluaiheita – Discussion Papers No 124110
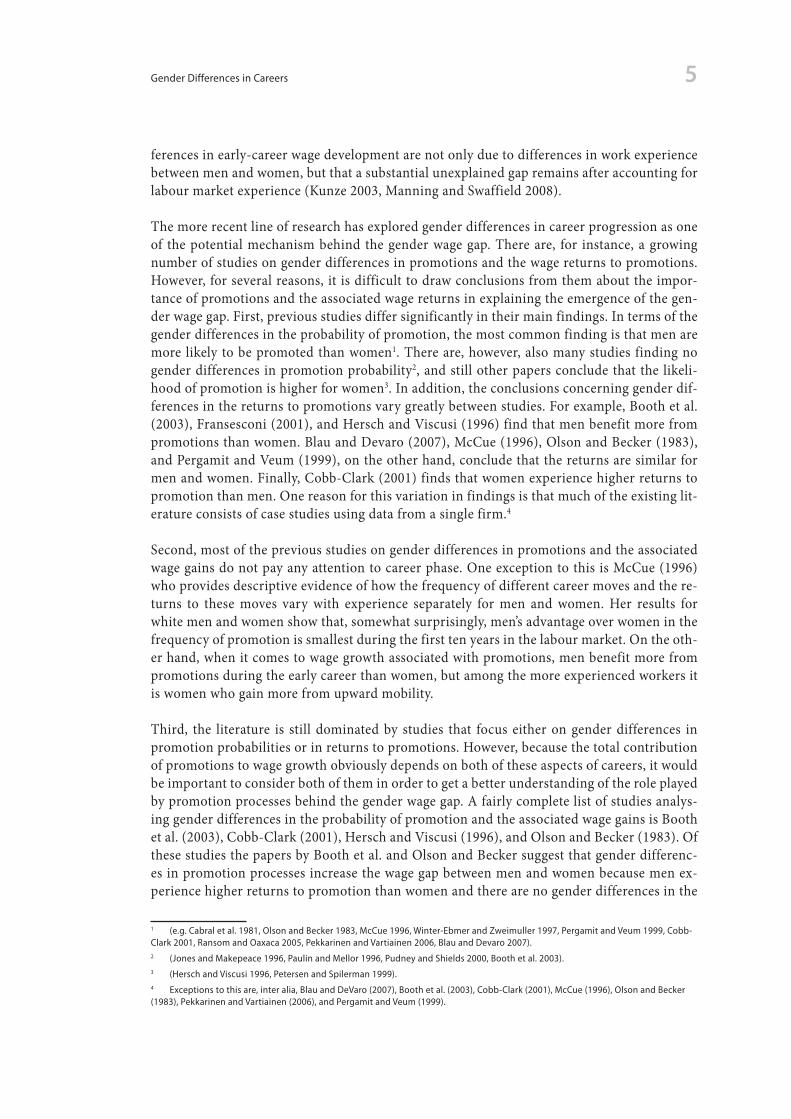
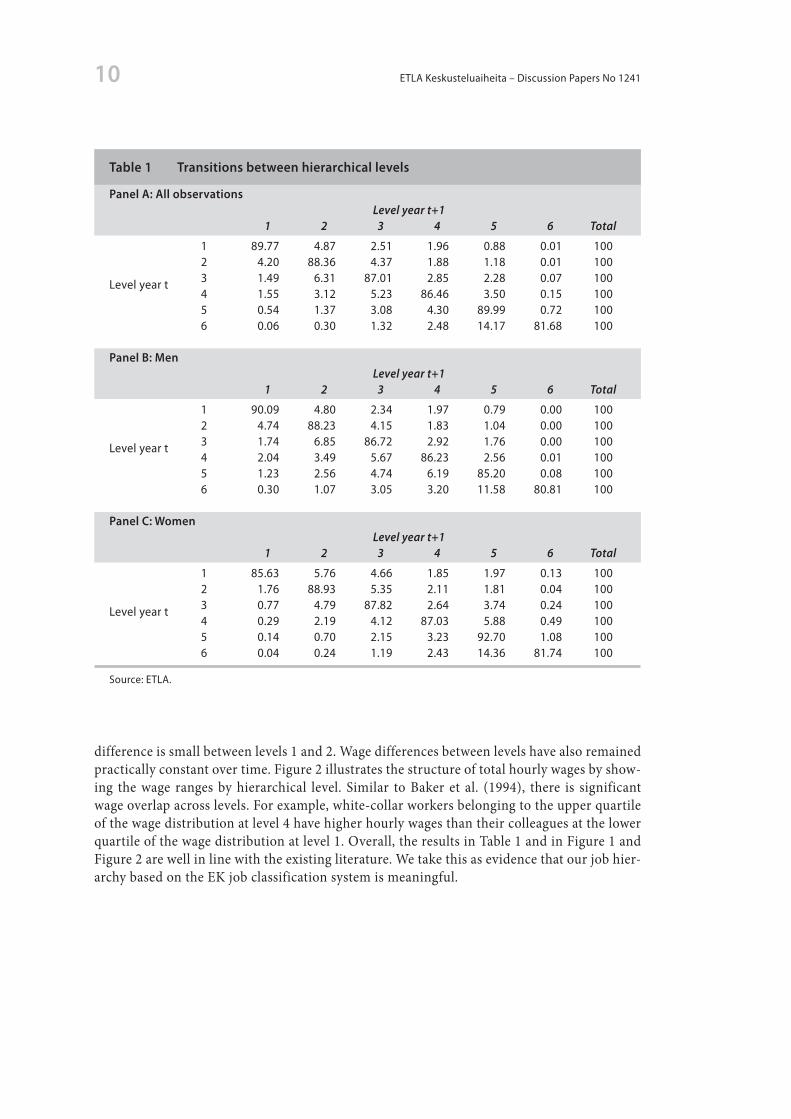
differenceissmallbetweenlevels1and2.Wagedifferencesbetweenlevelshavealsoremainedpracticallyconstantovertime.Figure2illustratesthestructureoftotalhourlywagesbyshow-ing the wage ranges by hierarchical level. Similar to Baker et al. (1994), there is significantwageoverlapacrosslevels.Forexample,white-collarworkersbelongingtotheupperquartileofthewagedistributionatlevel4havehigherhourlywagesthantheircolleaguesatthelowerquartileofthewagedistributionatlevel1.Overall,theresultsinTable1andinFigure1andFigure2arewellinlinewiththeexistingliterature.Wetakethisasevidencethatourjobhier-archybasedontheEKjobclassificationsystemismeaningful.
Table 1 Transitions between hierarchical levels
Panel A: All observations Levelyeart+1 1 2 3 4 5 6 Total
1 89.77 4.87 2.51 1.96 0.88 0.01 100 2 4.20 88.36 4.37 1.88 1.18 0.01 100
Level year t 3 1.49 6.31 87.01 2.85 2.28 0.07 100 4 1.55 3.12 5.23 86.46 3.50 0.15 100 5 0.54 1.37 3.08 4.30 89.99 0.72 100 6 0.06 0.30 1.32 2.48 14.17 81.68 100
Panel B: Men Levelyeart+1 1 2 3 4 5 6 Total
1 90.09 4.80 2.34 1.97 0.79 0.00 100 2 4.74 88.23 4.15 1.83 1.04 0.00 100
Level year t 3 1.74 6.85 86.72 2.92 1.76 0.00 100 4 2.04 3.49 5.67 86.23 2.56 0.01 100 5 1.23 2.56 4.74 6.19 85.20 0.08 100 6 0.30 1.07 3.05 3.20 11.58 80.81 100
Panel C: Women Levelyeart+1 1 2 3 4 5 6 Total
1 85.63 5.76 4.66 1.85 1.97 0.13 100 2 1.76 88.93 5.35 2.11 1.81 0.04 100
Level year t 3 0.77 4.79 87.82 2.64 3.74 0.24 100 4 0.29 2.19 4.12 87.03 5.88 0.49 100 5 0.14 0.70 2.15 3.23 92.70 1.08 100 6 0.04 0.24 1.19 2.43 14.36 81.74 100
Source: ETLA.
11Gender Differences in Careers
Figure 1 Mean hourly wages by hierarchical level, 1981-2006
Figure 2 Hourly wage ranges by hierarchical level

ETLA Keskusteluaiheita – Discussion Papers No 124112
5 The nature of entry-level segregationIthasbeentypicalforthepreviousstudiesongenderdifferencesincareerstofocusonlatercareerevents, likepromotions,and ignoregendersegregation instartingpositions.Howev-er,aswasdiscussedinSection2,payingattentiontoinitialassignmentmightbeimportantinunderstandingdifferencesinsubsequentcareerprogressionbetweenmenandwomen.There-foreinthissection,weinvestigategenderdifferencesinselectionintothedifferenthierarchi-callevelsamongthoseenteringthelabourmarketforthefirsttime.AsmentionedinSection4.1,over81000individualsstartedtheircareersduringtheobservationperiod.Giventheor-dinalnatureofthehierarchy,weanalysegenderdifferencesinentrypositionsbyestimatinganorderedprobitmodel.Threedifferentspecificationsareestimated.Thefirstonecontrolsonlyforgenderandyear.Thisisabenchmarkmodelshowingtherawdifferencesinentrypo-sitionsbetweenmaleandfemalewhite-collarworkers.Thesecondspecificationaddsageandtheyearsandfieldofeducationtothemodel.Thisgivesusinformationontheextenttowhichgenderdifferencesinstartingpositionsreflectgenderdifferencesineducationalchoices.Fi-nally, tocheckwhethergender segregationby industryand firm is important inexplaininggenderdifferencesinentrypositions,thethirdspecificationincludesindustryandfirmsizedummiesinthemodel.
Table2reportstheresultsforthefemaledummy.7Therawdifferencesinthestartingpositionsbetweenmenandwomenarequiteremarkable.Womenare13.1percentmorelikelythanmentostarttheircareerfromthebottomofthehierarchyand23.2percentmorelikelytoenterin-tothesecondloweststepoftheladder.However,onceweaccountforthegenderdifferencesinpre-labourmarkethumancapitalinvestments,gendergapsinentrypositionsfalldramatical-ly,althoughtheyremainstatisticallysignificantatallhierarchicallevels.Addingcontrolsforindustryandfirmsizehasonlynegligibleeffectsontheresultsaftereducationalbackgroundhasbeentakenintoaccount.
7 Results for the other variables used in the estimations are available from the authors upon request.
Notes:1. Table 2 reports marginal effects and t-statistics. 2. Specification I controls for gender and year. Specification II adds age, age^2, years of education, years of ed- ucation^2, and field of education (9 categories) to the model. Specification III also controls for industry (56 categories) and firm size (7 categories). 3. The marginal effects are computed with the Stata meoprobit command.
Table 2 Ordered probit estimation of initial position
Level6 Level5 Level4 Level3 Level2 Level1
Specification I: Female 0.131 0.232 -0.088 -0.163 -0.084 -0.027 [84.87] [102.43] [-70.84] [-98.29] [-70.71] [-38.43]Specification II: Female 0.024 0.123 -0.054 -0.069 -0.020 -0.004 [31.5] [37.01] [-34.42] [-36.56] [-32.82] [-23.16]Specification III: Female 0.024 0.125 -0.055 -0.070 -0.020 -0.003 [31.19] [36.78] [-34.22] [-36.34] [-32.45] [-22.7]
13Gender Differences in Careers
TheresultsinTable2areinlinewiththoseofCabraletal.(1981),PekkarinenandVartiainen(2006),andRansomandOaxaca(2005),whofoundthatwomentendtoenterintolowerhier-archicalranksthanmenatlabourmarketentry.Ourestimatesalsoindicatethatalargepartofthegendersegregationinentrypositionscanbeattributedtogenderdifferencesineducation-alchoices.Inourdata,menareclearlyoverrepresentedintechnologywhereaswomentendtochoosefieldssuchassocialsciencesandhumanitiesmoreoftenthanmen.Basedonthisfind-ing,men’sandwomen’scareersstarttodifferwellbeforelabourmarketentry.
6 Gender differences in promotion ratesIntheprevioussection,wefoundevidencethatmalewhite-collarworkersstarttheircareersfromhigherhierarchicallevelsthantheirfemalecolleagues.Next,weexaminelatercareerde-velopmentbyinvestigatinggenderdifferencesinpromotionrates.Dowomencatchupwithmeninhierarchicalpositionsordotheylagevenfurtherbehind?
We investigategenderdifferences inpromotionsbyestimating the linearprobabilitymodelforpromotion8.Thedependentvariabletakesavalueofoneifanindividualisatahigherhi-erarchicallevelinyeart+1thaninyeartandzerootherwise.Weexplainpromotionsbyus-ingaverylargesetofbackgroundvariables.The human capital-related variablesincludeageanditssquare,yearsofeducationanditssquare,fieldofeducation,andtenureanditssquare.Priorstudiesshowthatsuchhumancapitalvariablesaffecttheprobabilityofpromotion,andthusitisimportanttocontrolforthem(e.g.McCue1996).Wealsoaccountforearlier career developmentbycontrollingforyearsspentsofarinthecurrenthierarchicallevelandjobtitle9,thenumberofcareerbreaks10,andthenumberofprior jobtitles.The impactof thesevari-ablesonpromotionrateshasbeenestablishedby,e.g.,DeVaroandWaldman(2007).Thesetoffirm characteristics consistsofsizeandindustry.Inaddition,ratheruniquely,wealsohaveinformationonthecharacteristics of the co-workers.Thesecharacteristicsincludeyearsofed-ucation,tenure,andgender.Toourknowledge,noexistingstudyongenderdifferencesinca-reershashadaccesstothiskindofinformation.Dataonco-workersmightbeimportantbe-causetheprobabilityofpromotionmaydependonthepoolofcandidates,andinmanycases,co-workersformasubstantialpartofthecandidatepool.Finally,other variables accountedforarecurrenthierarchical levelandfieldof jobtitle,year,andgender,whichisthemainvari-ableofinterest.
Wealsoexaminepromotionprobabilitybyworkexperience.Thisismotivatedbythepreviousfindingsfromthegenderwagegapliterature.Weintendtocheckwhethergenderdifferencesinpromotionpatternsmightprovideyetanotherexplanationfortheearly-careergenderwagegap.Basedontheobserveddevelopmentofthemale-femalewagedifferences,weexpectthatthegendergapinpromotionprobabilityishigherimmediatelyafterlabourmarketentrycom-paredtothelatercareer.
8 We are mainly interested in average marginal effects, and thus, using the linear probability model instead of a non-linear model such as the probit is of little practical importance (see e.g. Angrist and Pischke 2009). 9 Accounting for the time spent at the current level should control for the “fast track effect”, that is the stylized fact made in the internal labour market literature according to which an early promotion increases the probability of future promotions. 10 Because the effects of career breaks on the promotion probability may vary by the length of the career break, we distinguish between career breaks that last less than a year and career breaks that last longer than a year.
ETLA Keskusteluaiheita – Discussion Papers No 124114
Intheliterature,therehasbeenalotofdiscussionabouttheroleoflaboursupplyfactorsasdeterminantsofgenderdifferencesincareerandwagedynamics.Bertrandetal.(2010)forin-stancepresentevidencethatmuchoftheincreaseintheearlycareergenderwagegapamongyoungprofessionalsinthefinancialandcorporatesectorsintheUScanbeexplainedbygen-derdifferencesincareerinterruptionsandinweeklyworkinghoursassociatedwithmother-hood.Unfortunately,ourdatasetdoesnotcontaininformationonchildren,andthusweareunabletoinvestigatetheimportanceofchild-relatedcareerbreaksinaccountingforgenderdifferencesincareersdirectly.However,inordertoprovidesomeinformationonthepotentialrelevanceofcareerdiscontinuityinthiscontext,wealsoexaminegenderdifferencesinpro-motionsbyrestrictingoursampletothosewhohaveonlyonespellinthedatalastingatleast5years.Ifcareerinterruptionsarethemaindrivingforcebehindgenderdifferencesinpromo-tionprobability,thenwewouldexpectsmallergenderdifferencesinthisrespectwhenweusetherestricteddataconsistingofindividualshighlyattachedtolabourmarket.
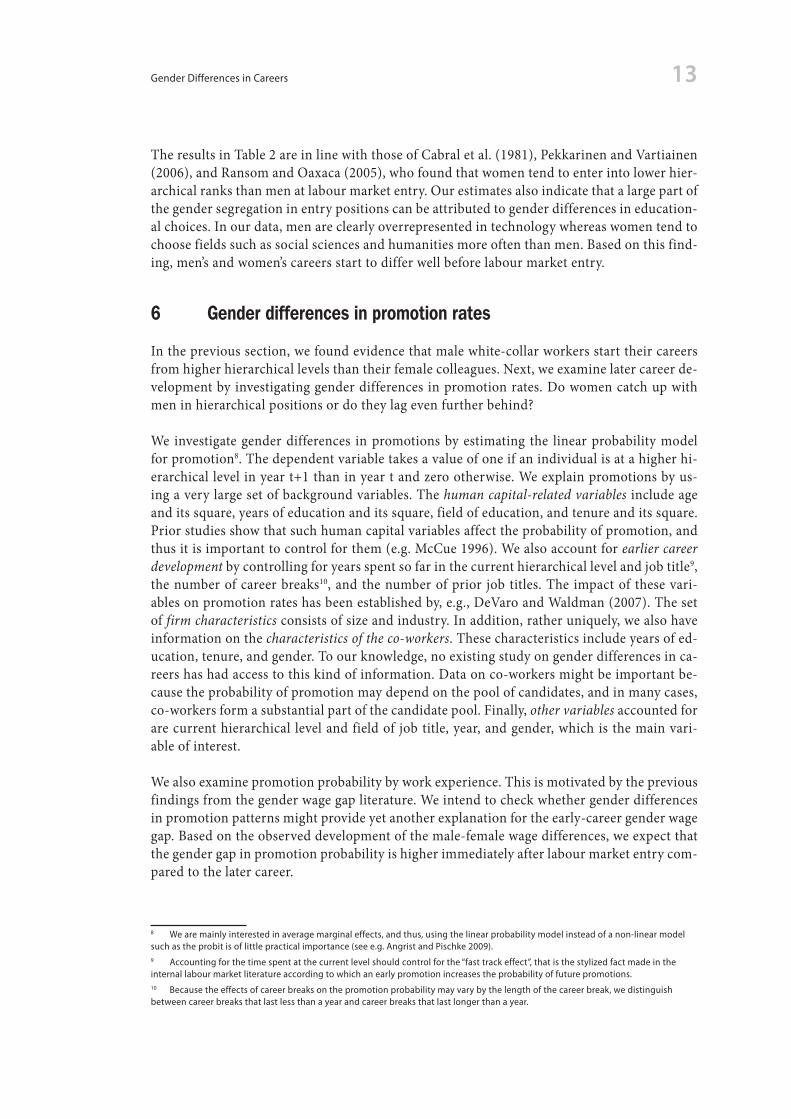
Panel A in Table 3 reports the results for the female-dummy from a promotion regressionwherethedependentvariableisallpromotions,i.e.PanelAdoesnotdistinguishbetweenin-ternalpromotionsandpromotionsassociatedwithemployerchanges.Fromthefirstcolumn,weseethatevenafterahostofdifferentbackgroundcharacteristicshavebeencontrolledfor,womenare2.4percentagepointslesslikelytobepromotedthanmen.However,astheothercolumnsshow,thisoverallgapinpromotionprobabilityhidessignificantvariationwithworkexperience.Thegendergapinpromotionprobabilityishighestduringthefirst5yearsinthelabourmarket,whenthegapisgreaterthan3percentagepoints.Amongthosewith6to10yearsofexperience,thegapdropsto2.1percentagepoints,andforwhite-collarworkerswithmorethan10yearsofexperiencethegapisonly0.8percentagepoints,althoughitremainssta-tisticallysignificant.Also,ifwelookatthepredictedpromotionprobabilities,wenoticethatthegendergapinthelikelihoodofpromotionismostprofoundduringthefirstyearsinthelabourmarket:thepredictedpromotionprobabilityformenisasmuchas63.5percenthigherthanforwomenamongwhite-collarworkerswith2–5yearsofexperience,whereasthecorre-spondingnumberforthosewith10yearsofexperienceormoreis21.1percent.Theobservedpatternofthegendergapinpromotionprobabilityisthusconsistentwiththefindingsoftheearlierliteratureindicatingasubstantialincreaseintheaveragemale-femalewagegapduringtheearly-careerperiod.
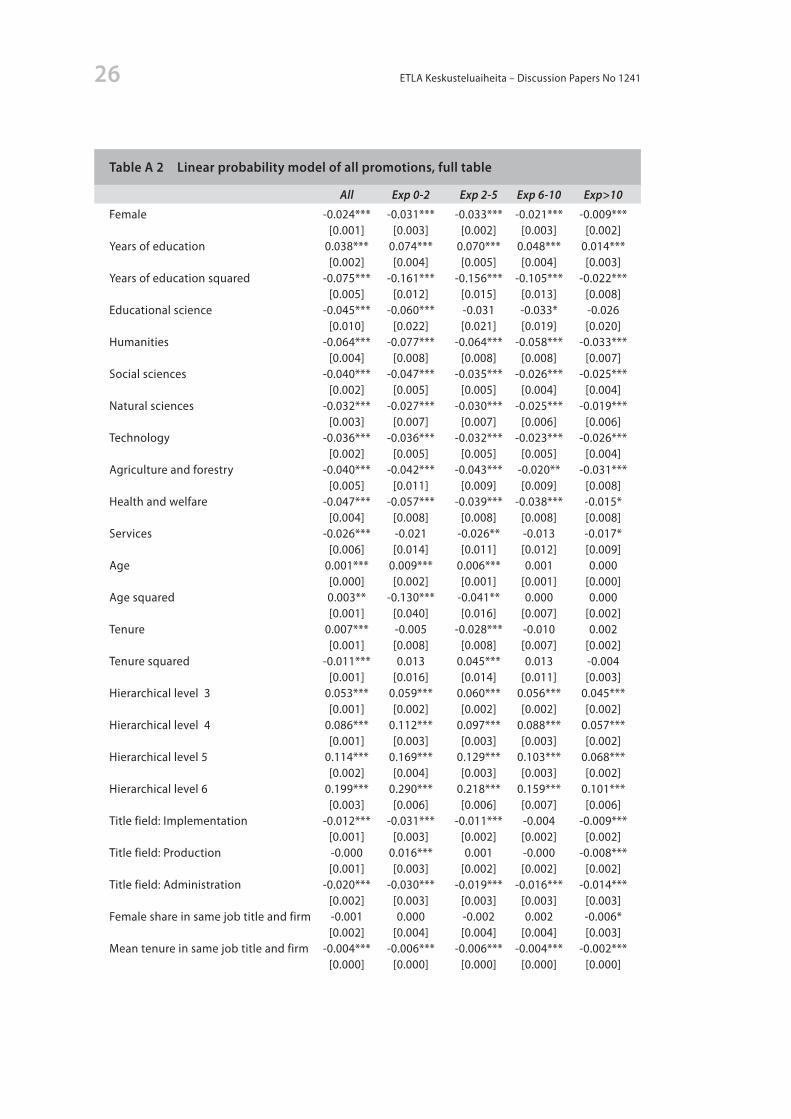
TableA2intheappendixpresentstheresultsfortheothervariablesusedintheestimations.Theyaremostlyinlinewiththetheoryandearlierempiricalfindings.Forexample,anindi-vidualhasbetterchancesforpromotionifheworksinalargefirm,ishighlyeducated,hasnotspenttoolongathiscurrenthierarchicallevel,hasgainedexperiencefromdifferentjobs,andhaslow-educatedco-workerswithlittlejobtenure.Somewhatsurprisingly,thegenderoftheco-workersdoesnotseemtomatterwithrespect toan individual’s likelihoodofbeingpro-moted.
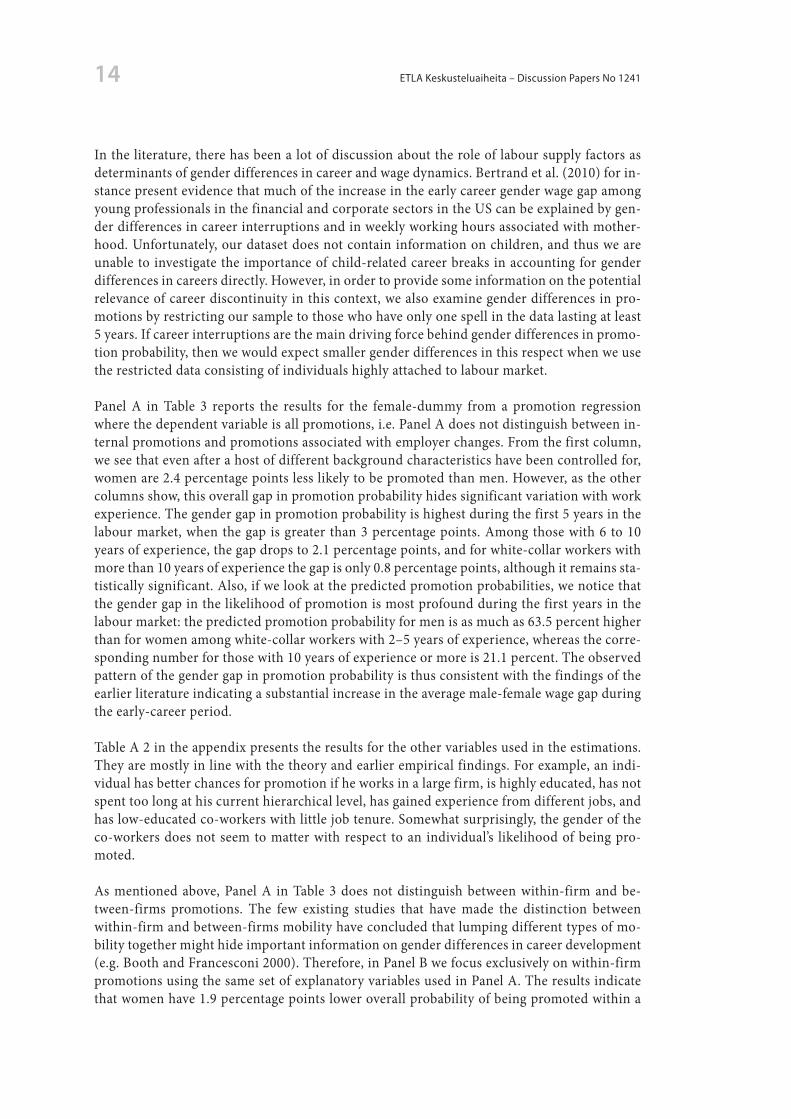
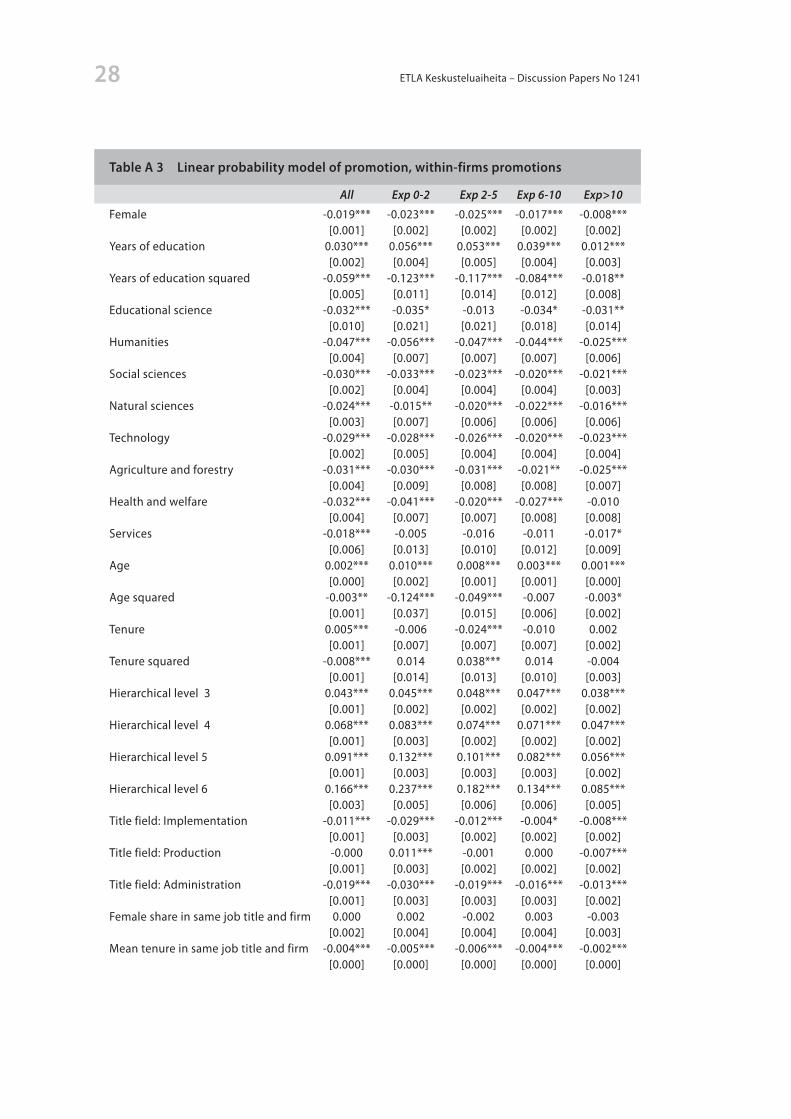
As mentioned above, Panel A in Table 3 does not distinguish between within-firm and be-tween-firms promotions. The few existing studies that have made the distinction betweenwithin-firmandbetween-firmsmobilityhaveconcludedthatlumpingdifferenttypesofmo-bilitytogethermighthideimportantinformationongenderdifferencesincareerdevelopment(e.g.BoothandFrancesconi2000).Therefore,inPanelBwefocusexclusivelyonwithin-firmpromotionsusingthesamesetofexplanatoryvariablesusedinPanelA.Theresultsindicatethatwomenhave1.9percentagepointsloweroverallprobabilityofbeingpromotedwithina
15Gender Differences in Careers
firmthanmendo,whereasthegendergapforallpromotionswassomewhathigher,2.4per-centagepoints(PanelA).However,ifwelookattherelativegenderdifferencesinpromotionprobabilities,wenoticethatthereisnonotablevariationinthegendergapbypromotiontype.Thepredictedprobabilityofwithin-firmpromotionis6percentformenand4.1percentforwomen,suggestingthatmenare46.3percentmorelikelytobepromotedwithinfirmsthanwomenare.Whenallpromotionsareconsidered,menhavea49.0percenthigherprobabili-tyofbeingpromotedthanwomendo,withthepredictedprobabilitiesofpromotionbeing7.3percentformenand4.9percentforwomen.Inaddition,ifwelookattheresultsforthedif-ferentexperiencegroups, therelativegendergaps inpromotionprobabilityareverysimilarbetweenwithin-firmpromotionsandpromotions ingeneral.Furthermore,acomparisonofTablesA2andA3intheappendixshowsthattheeffectsoftheotherbackgroundcharacter-isticsonthepromotionprobabilitydiffersurprisinglylittleaccordingtothetypeofmobility.
Table 3 Linear probability model of promotion
Panel A: All promotions All Exp0-2 Exp2-5 Exp6-10 Exp>10
Female -0.024*** -0.031*** -0.033*** -0.021*** -0.009*** [0.001] [0.003] [0.002] [0.003] [0.002]
R-squared 0.040 0.064 0.041 0.033 0.028Number of observations 482 759 121 931 131 139 107 288 122 401Predicted probability: male 0.0733 0.0946 0.0847 0.0658 0.0463Predicted probability: female 0.0489 0.0635 0.0522 0.0448 0.0371
Notes: 1. Cluster robust t-statistics are given in brackets; * p < 0.05, ** p < 0.01, *** p < 0.001.2. Results for the other variables used in the estimations are presented in Table A 2 and Table A 3 in the ap- pendix.3. Attached workers are employees who have only one spell in the data and the spell lasts at least 5 years.
Panel B: Internal promotions All Exp0-2 Exp2-5 Exp6-10 Exp>10
Female -0.019*** -0.023*** -0.025*** -0.017*** -0.008*** [0.001] [0.002] [0.002] [0.002] [0.002]
R-squared 0.033 0.053 0.035 0.029 0.026Number of observations 482 759 121 931 131 139 107 288 122 401Predicted probability: male 0.0600 0.0740 0.0686 0.0552 0.0407Predicted probability: female 0.0408 0.0508 0.0431 0.0383 0.0324
Panel C: All promotions, attached workers All Exp0-2 Exp2-5 Exp6-10 Exp>10
Female -0.022*** -0.025*** -0.029*** -0.016*** -0.009** [0.002] [0.004] [0.004] [0.004] [0.004]
R-squared 0.040 0.059 0.044 0.034 0.027Number of observations 186 215 42 149 60 837 45 055 38 174Predicted probability: male 0.0710 0.0907 0.0819 0.0619 0.0427Predicted probability: female 0.0492 0.0653 0.0524 0.0455 0.0341
ETLA Keskusteluaiheita – Discussion Papers No 124116
Wethusconcludethatinourdatathemechanismsbehindpromotionsdonotvarydependingonwhetherthepromotiontakesplacewithinafirmorisassociatedwithanemployerchange.
PanelCreportstheresultsforacasewherewehaverestrictedthesampletoindividualshavingonlyonespellinthedata,lastingatleast5years.Asexpected,gendergapinpromotionprob-abilityissmallerforthesampleconsistingofwhite-collarworkershighlyattachedtolabourmarket,althoughthedifferenceintheresultsbetweenthefulldata(panelA)andtherestrict-eddataisquitesmall.Moreover,ourearlierfindingthatthegendergapinpromotionprob-abilityishighestduringthefirstyearsinthelabourmarketholdstruealsofortherestrictedsample.Therefore,inourdatagenderdifferencesinpromotionscannotbeeasilyexplainedbylaboursupplyfactors.
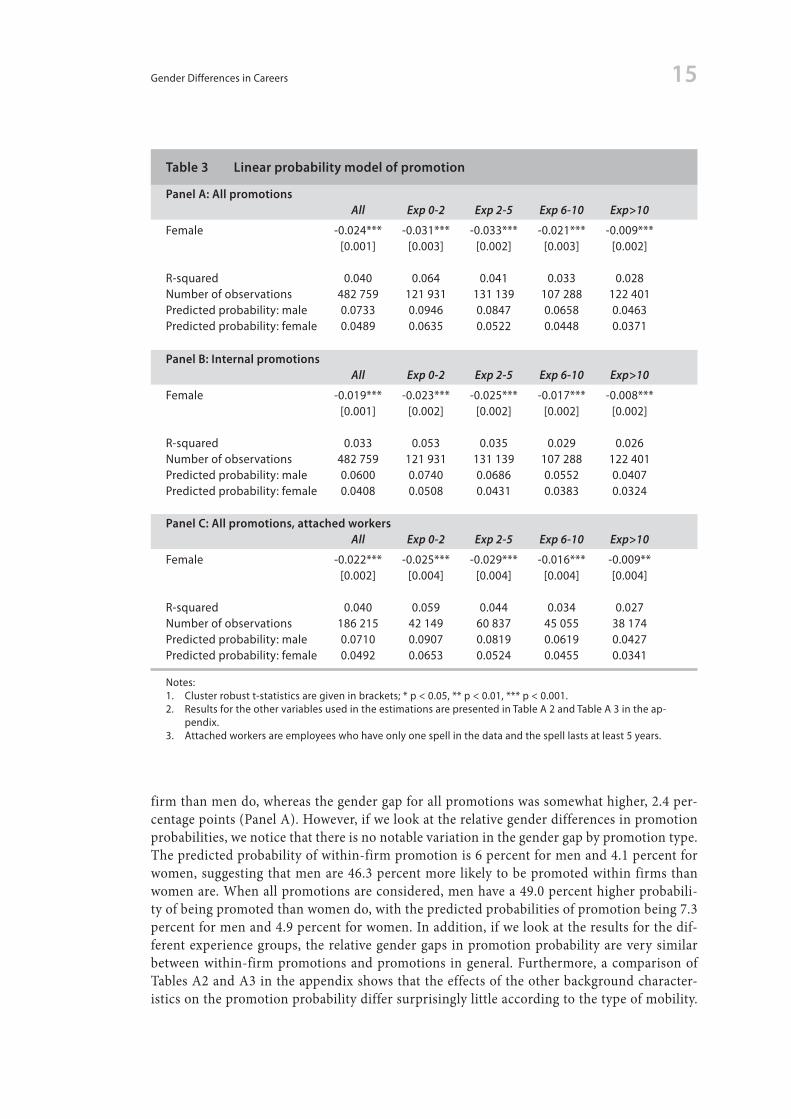
Asafinalexaminationofgenderdifferencesinpromotions,weestimatetheprobabilitymodelbyanindividual’scurrentpositioninthehierarchy.11Thereareatleasttworeasonswhythismightbeofinterest.First,genderdifferencesinpromotionratesarelikelytobesmallerwhenwecomparemenandwomenwiththesameinitialstandings.Thisisbecauseindividualsshar-ingthesameinitialpositionfaceidenticalpotentialfuturecareerpaths.Second,accordingtotheglassceilinghypothesis,women’scareersprogresswellatthelowerranksofthehierarchy,buttheyfacedifficultiesinascendingfurtherwhentryingtoenterthemostdemandingjobs.Ifthisindeedisthecase,thenweshouldexpecttoseethegendergapinpromotionratesin-creaseattheupperendoftheorganisationalladder.
Table4reports theresults for thefemaledummy.Eventhoughwefocusonmenandwom-enworkingatthesameinitialposition,asignificantgendergapinpromotionprobabilityre-mains.Furthermore,thereisconsiderablevariationinthesizeofthegapbetweenpositions.Inaccordancewith theglass ceilinghypothesis, thegendergap in thepredictedpromotionprobabilityincreasesaswemovefromthelowerpositionstothetopofthehierarchy.Forex-ample,atlevel4,menare25.4percentmorelikelytobepromotedthanwomenare,whereasatlevel2men’sadvantageisnearly62percent.However,thegapdoesnotincreasemonotonous-
11 We have also made the same analysis by restricting the previous level to starting level. The reason for this robustness check is that in the cases where previous level is not the starting level there might be some selection issues involved. Furthermore, this selection process might be gender specific. However, replacing the previous level with the starting level has no effects on the conclusions.
Notes: 1. Cluster robust t-statistics are given in brackets; * p < 0.05, ** p < 0.01, *** p < 0.001.2. Results for the other variables used in the estimations are presented in Table A 4 in the appendix.
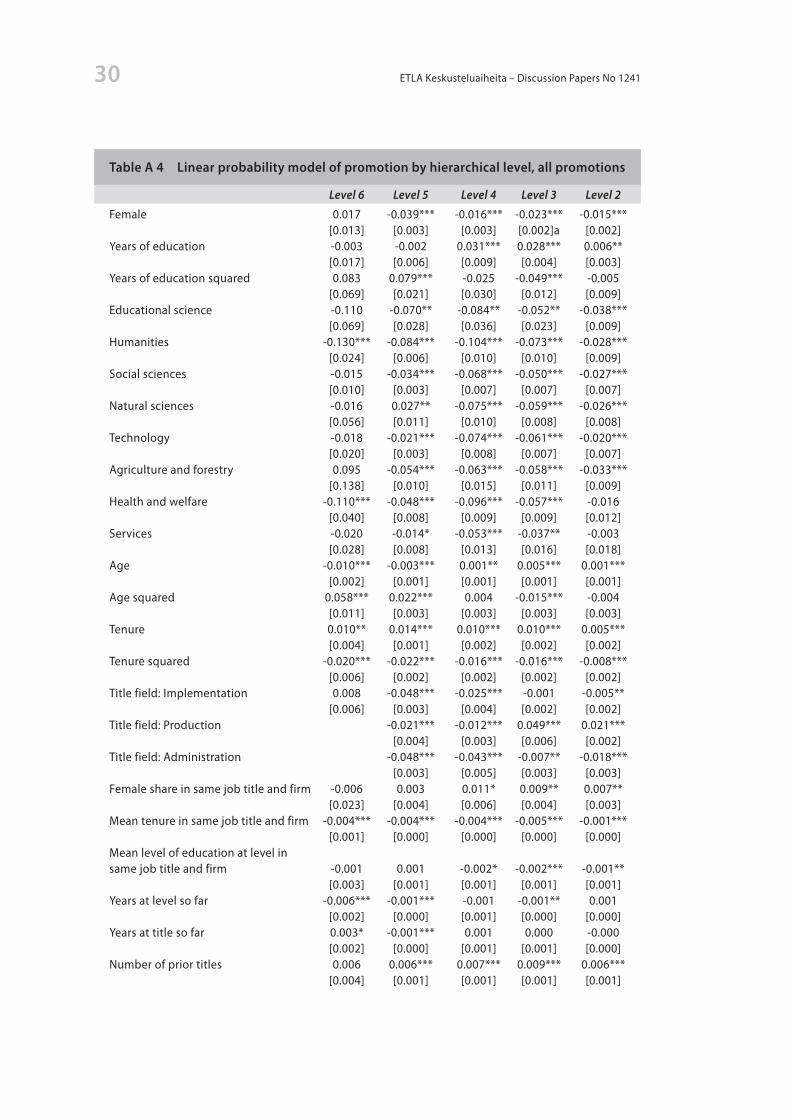
Table 4 Linear probability model of promotion by hierarchical level, all promotions
Level6 Level5 Level4 Level3 Level2
Female 0.017 -0.039*** -0.016*** -0.023*** -0.015*** [0.013] [0.003] [0.003] [0.002] [0.002]
R-squared 0.036 0.058 0.048 0.024 0.031Number of observations 16 929 151 337 110 827 104 345 69 054Predicted probability male 0.114 0.0969 0.0828 0.0693 0.0384Predicted probability female 0.130 0.0582 0.0668 0.0463 0.0234
17Gender Differences in Careers
lythroughoutthehierarchy.Infact,itislargestatlevel5,being65.5percentinmen’sfavour.Therefore,theresultsareatleastassupportiveofthestickyfloormodel,accordingtowhichthegendergapinpromotionprobabilitywidensatthebottomendofthehierarchy,astheyareoftheglassceilinghypothesis.
7 Gender differences in starting wages and returns to promotions
7.1 Gender wage gap in starting wagesSofar,thispaperhasfocusedongenderdifferencesinstartingpositionandpromotionprob-ability.However,one’spositioninthehierarchyandchangesthereofareonlyone,albeitim-portant,partofacareer.Anotherrelatestowagesandreturnstochangesinhierarchicalposi-tion.Understandingtheprocessesbehindthegenderwagedifferentialsrequiresexaminationofbothoftheseaspects.Therefore,therestofthepaperinvestigateswages.Westartbyexam-ining thegenderdifferences instartingwages,afterwhichwe turn togenderdifferences inwagechangesassociatedwithmobilitybetweenhierarchicallevels.
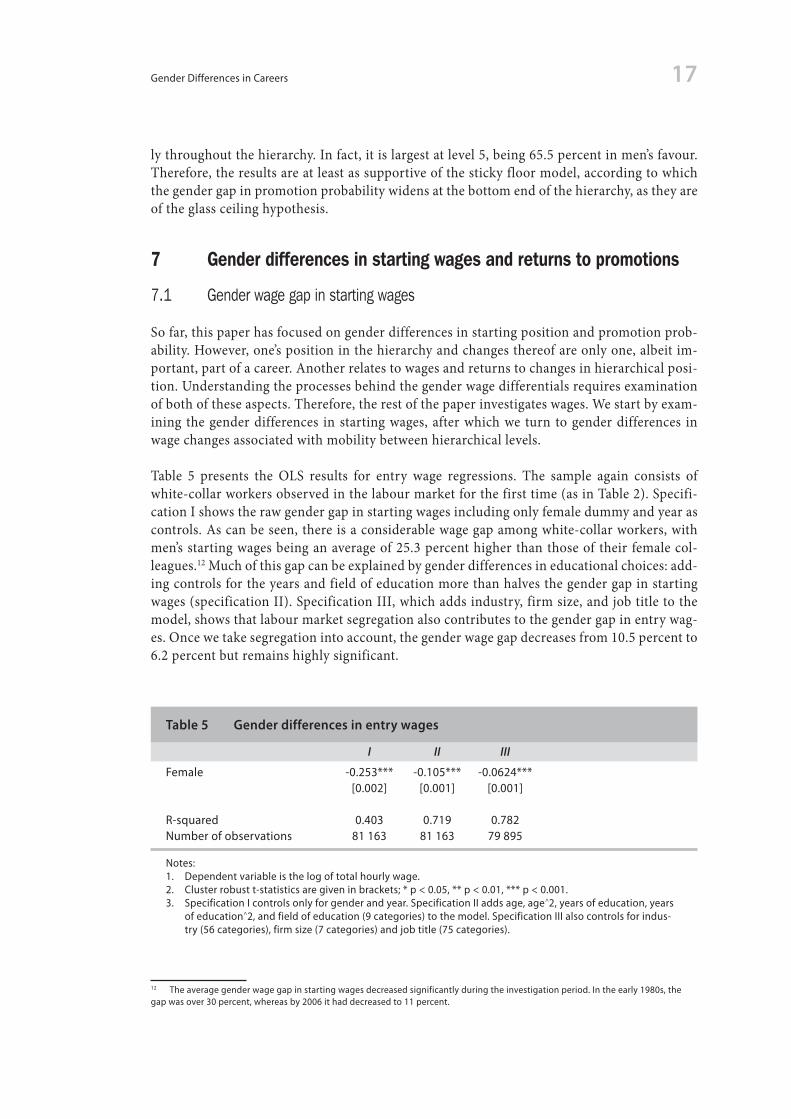
Table 5 presents the OLS results for entry wage regressions. The sample again consists ofwhite-collarworkersobservedinthelabourmarketforthefirsttime(asinTable2).Specifi-cationIshowstherawgendergapinstartingwagesincludingonlyfemaledummyandyearascontrols.Ascanbeseen,thereisaconsiderablewagegapamongwhite-collarworkers,withmen’sstartingwagesbeinganaverageof25.3percenthigherthanthoseoftheirfemalecol-leagues.12Muchofthisgapcanbeexplainedbygenderdifferencesineducationalchoices:add-ingcontrolsfortheyearsandfieldofeducationmorethanhalvesthegendergapinstartingwages(specificationII).SpecificationIII,whichaddsindustry,firmsize,andjobtitletothemodel,showsthatlabourmarketsegregationalsocontributestothegendergapinentrywag-es.Oncewetakesegregationintoaccount,thegenderwagegapdecreasesfrom10.5percentto6.2percentbutremainshighlysignificant.
12 The average gender wage gap in starting wages decreased significantly during the investigation period. In the early 1980s, the gap was over 30 percent, whereas by 2006 it had decreased to 11 percent.
Notes:1. Dependent variable is the log of total hourly wage. 2. Cluster robust t-statistics are given in brackets; * p < 0.05, ** p < 0.01, *** p < 0.001.3. Specification I controls only for gender and year. Specification II adds age, age^2, years of education, years of education^2, and field of education (9 categories) to the model. Specification III also controls for indus- try (56 categories), firm size (7 categories) and job title (75 categories).
Table 5 Gender differences in entry wages
I II III
Female -0.253*** -0.105*** -0.0624*** [0.002] [0.001] [0.001]
R-squared 0.403 0.719 0.782Number of observations 81 163 81 163 79 895
ETLA Keskusteluaiheita – Discussion Papers No 124118
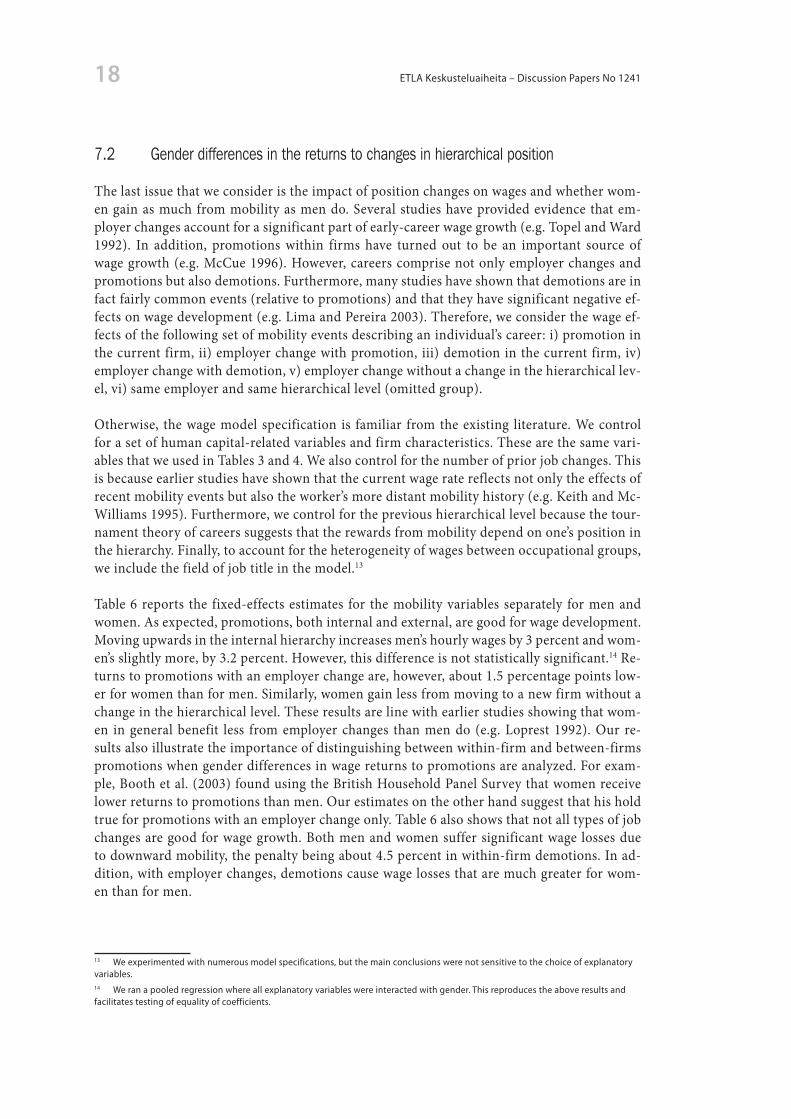
7.2 Gender differences in the returns to changes in hierarchical positionThelastissuethatweconsideristheimpactofpositionchangesonwagesandwhetherwom-engainasmuchfrommobilityasmendo.Severalstudieshaveprovidedevidencethatem-ployerchangesaccountforasignificantpartofearly-careerwagegrowth(e.g.TopelandWard1992). In addition, promotions within firms have turned out to be an important source ofwagegrowth(e.g.McCue1996).However,careerscomprisenotonlyemployerchangesandpromotionsbutalsodemotions.Furthermore,manystudieshaveshownthatdemotionsareinfactfairlycommonevents(relativetopromotions)andthattheyhavesignificantnegativeef-fectsonwagedevelopment(e.g.LimaandPereira2003).Therefore,weconsiderthewageef-fectsofthefollowingsetofmobilityeventsdescribinganindividual’scareer:i)promotioninthecurrentfirm,ii)employerchangewithpromotion,iii)demotioninthecurrentfirm,iv)employerchangewithdemotion,v)employerchangewithoutachangeinthehierarchicallev-el,vi)sameemployerandsamehierarchicallevel(omittedgroup).
Otherwise, thewagemodel specification is familiar fromtheexisting literature.Wecontrolforasetofhumancapital-relatedvariablesandfirmcharacteristics.Thesearethesamevari-ablesthatweusedinTables3and4.Wealsocontrolforthenumberofpriorjobchanges.Thisisbecauseearlierstudieshaveshownthatthecurrentwageratereflectsnotonlytheeffectsofrecentmobilityeventsbutalsotheworker’smoredistantmobilityhistory(e.g.KeithandMc-Williams1995).Furthermore,wecontrolfortheprevioushierarchicallevelbecausethetour-namenttheoryofcareerssuggeststhattherewardsfrommobilitydependonone’spositioninthehierarchy.Finally,toaccountfortheheterogeneityofwagesbetweenoccupationalgroups,weincludethefieldofjobtitleinthemodel.13
Table6 reports the fixed-effectsestimates for themobilityvariables separately formenandwomen.Asexpected,promotions,bothinternalandexternal,aregoodforwagedevelopment.Movingupwardsintheinternalhierarchyincreasesmen’shourlywagesby3percentandwom-en’sslightlymore,by3.2percent.However,thisdifferenceisnotstatisticallysignificant.14Re-turnstopromotionswithanemployerchangeare,however,about1.5percentagepointslow-erforwomenthanformen.Similarly,womengainlessfrommovingtoanewfirmwithoutachangeinthehierarchicallevel.Theseresultsarelinewithearlierstudiesshowingthatwom-en ingeneralbenefit less fromemployer changes thanmendo (e.g.Loprest1992).Our re-sultsalsoillustratetheimportanceofdistinguishingbetweenwithin-firmandbetween-firmspromotionswhengenderdifferencesinwagereturnstopromotionsareanalyzed.Forexam-ple,Boothetal.(2003)foundusingtheBritishHouseholdPanelSurveythatwomenreceivelowerreturnstopromotionsthanmen.Ourestimatesontheotherhandsuggestthathisholdtrueforpromotionswithanemployerchangeonly.Table6alsoshowsthatnotalltypesofjobchangesaregoodforwagegrowth.Bothmenandwomensuffersignificantwage lossesduetodownwardmobility,thepenaltybeingabout4.5percentinwithin-firmdemotions.Inad-dition,withemployerchanges,demotionscausewagelossesthataremuchgreaterforwom-enthanformen.
13 We experimented with numerous model specifications, but the main conclusions were not sensitive to the choice of explanatory variables. 14 We ran a pooled regression where all explanatory variables were interacted with gender. This reproduces the above results and facilitates testing of equality of coefficients.
19Gender Differences in Careers
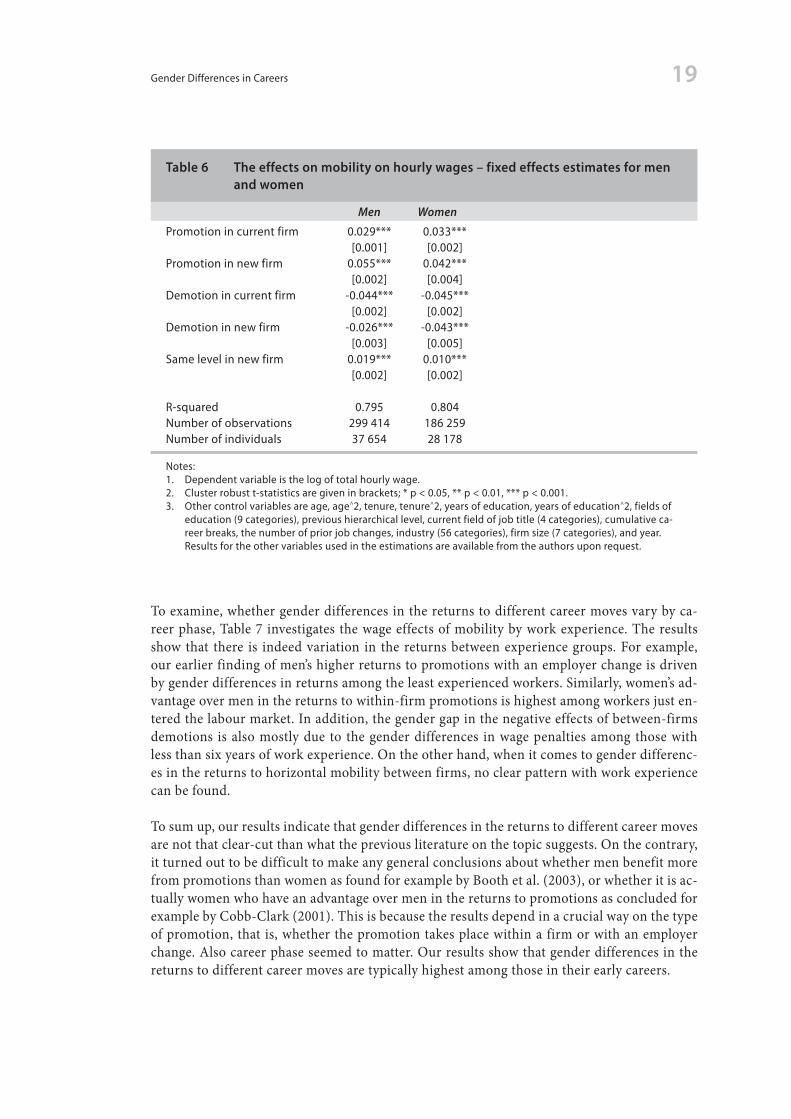
Toexamine,whethergenderdifferencesinthereturnstodifferentcareermovesvarybyca-reerphase,Table7 investigatesthewageeffectsofmobilitybyworkexperience.Theresultsshowthat there is indeedvariation in thereturnsbetweenexperiencegroups.Forexample,ourearlierfindingofmen’shigherreturnstopromotionswithanemployerchangeisdrivenbygenderdifferencesinreturnsamongtheleastexperiencedworkers.Similarly,women’sad-vantageovermeninthereturnstowithin-firmpromotionsishighestamongworkersjusten-teredthelabourmarket.Inaddition,thegendergapinthenegativeeffectsofbetween-firmsdemotions isalsomostlydue to thegenderdifferences inwagepenaltiesamongthosewithlessthansixyearsofworkexperience.Ontheotherhand,whenitcomestogenderdifferenc-esinthereturnstohorizontalmobilitybetweenfirms,noclearpatternwithworkexperiencecanbefound.
Tosumup,ourresultsindicatethatgenderdifferencesinthereturnstodifferentcareermovesarenotthatclear-cutthanwhatthepreviousliteratureonthetopicsuggests.Onthecontrary,itturnedouttobedifficulttomakeanygeneralconclusionsaboutwhethermenbenefitmorefrompromotionsthanwomenasfoundforexamplebyBoothetal.(2003),orwhetheritisac-tuallywomenwhohaveanadvantageovermeninthereturnstopromotionsasconcludedforexamplebyCobb-Clark(2001).Thisisbecausetheresultsdependinacrucialwayonthetypeofpromotion,thatis,whetherthepromotiontakesplacewithinafirmorwithanemployerchange.Alsocareerphaseseemedtomatter.Ourresultsshowthatgenderdifferencesinthereturnstodifferentcareermovesaretypicallyhighestamongthoseintheirearlycareers.
Notes:1. Dependent variable is the log of total hourly wage. 2. Cluster robust t-statistics are given in brackets; * p < 0.05, ** p < 0.01, *** p < 0.001.3. Other control variables are age, age^2, tenure, tenure^2, years of education, years of education^2, fields of education (9 categories), previous hierarchical level, current field of job title (4 categories), cumulative ca- reer breaks, the number of prior job changes, industry (56 categories), firm size (7 categories), and year. Results for the other variables used in the estimations are available from the authors upon request.
Table 6 The effects on mobility on hourly wages – fixed effects estimates for men and women
Men Women
Promotion in current firm 0.029*** 0.033*** [0.001] [0.002]Promotion in new firm 0.055*** 0.042*** [0.002] [0.004]Demotion in current firm -0.044*** -0.045*** [0.002] [0.002]Demotion in new firm -0.026*** -0.043*** [0.003] [0.005]Same level in new firm 0.019*** 0.010*** [0.002] [0.002]
R-squared 0.795 0.804Number of observations 299 414 186 259Number of individuals 37 654 28 178
ETLA Keskusteluaiheita – Discussion Papers No 124120
8 ConclusionInthispaper,weexaminegenderdifferencesincareersamongwhite-collarworkersbyutil-isingalargelinkedemployee-employerdatafromtheFinnishmanufacturingsectorcoveringtheperiodof1981–2006.Themainfindingsofthepaperare,first,thatmenstarttheircareersathigherhierarchicalranksthanwomendo.Althoughalargepartofthegenderdifferenceinentrypositionscanbeexplainedbymen’sandwomen’sdifferenteducationalchoices,someofthegapremainsunexplained.Wealsofind,incontrastforexampletoBoothetal.(2003)whouseddatafromtheBritishHouseholdPanelSurvey,thatevenafteraccountingforalargesetofbackgroundcharacteristics,menaremorelikelytobepromotedthanwomenare.Thegen-dergapinpromotionratesishighestamongthoseintheirearlycareers.Genderdifferencesineducationorcareerbreaksdonotaffectthisresult.
The results for wage analysis show that women have 6.2 percent lower starting wages thanmenaftergenderdifferencesinage,education,industry,firmsize,andjobtitlehavebeencon-trolledfor.Ontheotherhand,genderdifferencesinwagepremiumstochangesinhierarchicalpositionarelessclear-cut.Menexperiencehigherreturnstopromotionwithemployerchang-es,whereasinternalpromotionsleadtosimilarwagegains.Wagereductionsfollowingwith-in-firmdemotionsareroughlyofthesamesizeformenandwomen,butwomensufferlarg-erwagelossesfromdemotionswithanemployerchange.Furthermore,genderdifferencesinthereturnstodifferentcareermoveswerefoundtobehighestduringthefirstyearsinthela-bourmarket.
Notes:1. Dependent variable is the log of hourly wage. 2. Cluster robust t-statistics are given in brackets; * p < 0.05, ** p < 0.01, *** p < 0.001.3. Other control variables are age, age^2, tenure, tenure^2, years of education, years of education^2, fields of education (9 categories), current field of job title (4 categories), cumulative career breaks, the number of prior job changes, industry (56 categories), firm size (7 categories), and year. Results for the other variables used in the estimations are available from the authors upon request.
Table 7 The effects of mobility on hourly wages – fixed effects estimates for men and women by experience
Promotion in current firm 0.012*** 0.022*** 0.017*** 0.019*** 0.014*** 0.015*** 0.017*** 0.020*** [0.004] [0.003] [0.002] [0.002] [0.002] [0.003] [0.002] [0.003]Promotion in new firm 0.041*** 0.026*** 0.040*** 0.038*** 0.030*** 0.027*** 0.018*** 0.010 [0.006] [0.006] [0.003] [0.005] [0.004] [0.007] [0.006] [0.008]Demotion in current firm -0.024*** -0.023*** -0.028*** -0.029*** -0.024*** -0.019*** -0.028*** -0.028*** [0.004] [0.004] [0.002] [0.003] [0.003] [0.003] [0.003] [0.004]Demotion in new firm 0.014* -0.016** -0.005 -0.021*** -0.023*** -0.028*** -0.042*** -0.031*** [0.007] [0.008] [0.004] [0.006] [0.004] [0.010] [0.006] [0.008]Same level in new firm 0.012** 0.016*** 0.016*** 0.005* -0.005** -0.003 0.004 0.000 [0.005] [0.003] [0.002] [0.003] [0.002] [0.004] [0.003] [0.004]
R-squared 0.605 0.591 0.568 0.544 0.497 0.491 0.626 0.693Number of observations 39 459 38 259 92 908 55 621 75 917 42 457 91 130 49 922Number of individuals 23 942 19 612 31 550 20 431 22 611 13 552 16 595 9 558
Exp0-2 Exp2-5 Exp6-10 Exp>10 Male Female Male Female Male Female Male Female

21Gender Differences in Careers
Ourresultsshowthatthegenderwagegapemergesrightinthebeginningofcareeranddiffer-encesincareerprogressionandreturnstocareerprogressionexacerbatethegenderwagegap.Mentendtofarebetterinbothrespects,especiallyintheearlycareer.Inparticular,theresultsshowthatitisimportanttodistinguishbetweenthedifferenttypesofpromotionsanddemo-tionsandtopayattentiontoacareerphase,issuesthataremostlyignoredintheearlierlitera-tureongenderdifferencesincareerandwagedynamics.
ETLA Keskusteluaiheita – Discussion Papers No 124122
References Altonji, J. and Blank, R. (1999), “Race and gender in the labor market”, In Ashenfelter, O. and Card, D. (Ed.), Handbook of labor economics 3c, Elsevier, Amsterdam.
Angrist, J.D. and Pischke, J.-S. (2009), Mostly harmless econometrics: An empiricist’s companion, Princeton University Press,Princeton, NJ.
Baker, G., Gibbs, M. and Holmstrom, B. (1994), “The wage policy of a firm”, Quarterly Journal of Economics 109: 921–955.
Bertrand, M., Goldin, C. and Katz, L.F. (2010), “Dynamics of the gender gap for young professionals in the financial and corporate sectors”, American Economic Journal: Applied Economics 2: 228–255.
Blackaby, D., Booth, A.L. and Frank, J. (2005), “Outside offers and the gender pay gap: Empirical evidence from the uk academic labour market”, Economic Journal 115: F81–F107.
Blau, F.D. and Devaro, J. (2007), “New evidence on gender differences in promotion rates: An empirical analysis of a sample of new hires”, Industrial Relations 46: 511–550.
Blau, F.D. and Kahn, L.M. (2000), “Gender differences in pay”, Journal of Economic Perspectives 14: 75–99.
Booth, A.L. and Francesconi, M. (2000), “Job mobility in 1990s britain: Does gender matter?” In Polachek, S.W. (Ed.), Research in labor economics, vol. 19.: Worker well-being, Elsevier Science, JAI, New York 173–189.
Booth, A.L., Francesconi, M. and Frank, J. (2003), “A sticky floors model of promotion, pay, and gender”, European Economic Review 47: 295–322.
Cabral, R., Ferber, M.A. and Green, C.A. (1981), “Men and women in fiduciary institutions: A study of sex differences in career development”, Review of Economics & Statistics 63: 573.
Cobb-Clark, D.A. (2001), “Getting ahead: The determinants of and payoffs to internal promotion for young u.S. Men and women”, In Polachek, S.W. (Ed.), Research in labor economics: Worker wellbeing in a changing labor market, Elsevier Science, JAI, New York: 339–372.
Croson, R. and Gneezy, U. (2009), “Gender differences in preferences”, Journal of Economic Literature 47: 448-474.
Devaro, J. and Waldman, M. (2007), “The signalling role of promotions: Further theory and empirical evidence”, Available at: http://works.bepress.com/jed_devaro/4.
Francesconi, M. (2001), “Determinants and consequences of promotions in britain”, Oxford Bulletin of Economics and Statistics 63: 279–310.
Ginther, D.K. and Hayes, K.J. (2003), “Gender differences in salary and promotion for faculty in the human-ities 1977-95”, Journal of Human Resources 38: 34–73.
Hersch, J. and Viscusi, W.K. (1996), “Gender differences in promotions and wages”, Industrial Relations 35: 461–472.
Jones, D.R. and Makepeace, G.H. (1996), “Equal worth, equal opportunities: Pay and promotion in an internal labour market”, Economic Journal 106: 401–409.
23Gender Differences in Careers
Keith, K. and McWilliams, A. (1995), “The wage effects of cumulative job mobility”, Industrial & Labor Relations Review 49: 121–137.
Keith, K. and McWilliams, A. (1999), “The returns to mobility and job search by gender”, Industrial and Labor Relations Review 52: 460–477.
Kunze, A. (2003), “Gender differences in entry wages and early career wages”, Annales d’Economie et de Statistique: 245–265.
Kunze, A. (2008), “Gender wage gap studies: Consistency and decomposition”, Empirical Economics 35: 63–76.
Lazear, E.P. and Rosen, S. (1990), “Male-female wage differentials in job ladders”, Journal of Labor Econom-ics 8: 106.
Light, A. and Ureta, M. (1995), “Early-career work experience and gender wage differentials”, Journal of Labor Economics 13: 121.
Lima, F. and Pereira, P.T. (2003), “Careers and wages within large firms: Evidence from a matched employ-er-employee data set”, International Journal of Manpower 24: 812–835.
Loprest, P.J. (1992), “Gender differences in wage growth and job mobility”, American Economic Review 82: 526.
Manning, A. and Swaffield, J. (2008), “The gender gap in early-career wage growth”, Economic Journal 118: 983–1024.
McCue, K. (1996), “Promotions and wage growth”, Journal of Labor Economics 14: 175–209.
McDowell, J.M., Singell Jr, L.D. and Ziliak, J.P. (1999), “Cracks in the glass ceiling: Gender and promotion in the economics profession”, American Economic Review 89: 392–396.
McDowell, J.M., Singell Jr, L.D. and Ziliak, J.P. (2001), “Gender and promotion in the economics profession”, Industrial & Labor Relations Review 54: 224–244.
Napari, S. (2009), “Gender differences in early-career wage growth”, Labour Economics 16: 140–148.
Niederle, M. and Vesterlund, L. (2007), “Do women shy away from competition? Do men compete too much?” Quarterly Journal of Economics 122: 1067–1101.
Olson, C.A. and Becker, B.E. (1983), “Sex discrimination in the promotion process”, Industrial & Labor Relations Review 36: 624–641.
Paulin, E.A. and Mellor, J.M. (1996), “Gender, race, and promotions within a private-sector firm”, Industrial Relations 35: 276.
Pekkarinen, T. and Vartiainen, J. (2006), “Gender differences in promotion on a job ladder: Evidence from finnish metalworkers”, Industrial & Labor Relations Review 59: 285–301.
Pergamit, M.R. and Veum, J.R. (1999), “What is a promotion?” Industrial and Labor Relations Review 52: 581–601.
Petersen, T. and Spilerman, S. (1999), “Organizational structure, determinants of promotion, and gender differences in attainment”, Social Science Research 28: 203–227.
ETLA Keskusteluaiheita – Discussion Papers No 124124
Pudney, S. and Shields, M. (2000), “Gender, race, pay and promotion in the british nursing profession: Estimation of a generalized ordered probit model”, Journal of Applied Econometrics 15: 367–399.
Ransom, M. and Oaxaca, R.L. (2005), “Intrafirm mobility and sex differences in pay”, Industrial and Labor Relations Review 58: 219–237.
Topel, R.H. and Ward, M.P. (1992), “Job mobility and the careers of young men”, Quarterly Journal of Economics 107: 439–479.
Ward, M. (2001), “The gender salary gap in british academia”, Applied Economics 33: 1669–1681.
Winter-Ebmer, R. and Zweimuller, J. (1997), “Unequal assignment and unequal promotion in job ladders”, Journal of Labor Economics 15: 43.
25Gender Differences in Careers
Appendix
Table A 1 Summary statistics
Notes:1. To avoid unnecessarily lengthy tables, only a subset of variables used in the estimations is presented above. Results for the excluded variables are available from the authors upon request.
Variable Observations Mean Std.Dev. Min MaxLog hourly wage 641 874 2.589 0.415 1.295441 4.651987Promotion (all) 511 817 0.075 0.264 0 1Promotion in current firm 513 097 0.064 0.244 0 1Promotion in new firm 524 162 0.011 0.105 0 1Demotion in new firm 563 023 0.007 0.084 0 1Demotion in current firm 551 958 0.032 0.177 0 1Same level in new firm 530 308 0.031 0.173 0 1Same level in current firm (reference category) 519 243 0.838 0.368 0 1Female 641 878 0.396 0.489 0 1Years of education 641 878 15.212 2.092 9 25Years of education squared/100 641 878 2.358 0.661 0.81 6.25General (reference category) 641 878 0.049 0.217 0 1Educational science 641 878 0.001 0.032 0 1Humanities 641 878 0.013 0.114 0 1Social sciences 641 878 0.318 0.466 0 1Natural sciences 641 878 0.023 0.150 0 1Technology 641 878 0.573 0.495 0 1Agriculture and forestry 641 878 0.009 0.092 0 1Health and welfare 641 878 0.010 0.098 0 1Services 641 878 0.005 0.068 0 1Tenure 641 878 4.849 4.761 0 25Tenure squared/100 641 878 0.462 0.798 0 6.25Age 641 878 31.961 6.706 18 53Age squared/100 641 878 10.665 4.577 3.24 28.09Organizational level 1 638 011 0.064 0.244 0 1Organizational level 2 638 011 0.144 0.351 0 1Organizational level 3 638 011 0.211 0.408 0 1Organizational level 4 638 011 0.224 0.417 0 1Organizational level 5 638 011 0.318 0.466 0 1Organizational level 6 638 011 0.039 0.194 0 1Title field: Innovation 638 011 0.326 0.469 0 1Title field: Implementation 638 011 0.282 0.450 0 1Title field: Production 638 011 0.202 0.401 0 1Title field: Administration 638 011 0.190 0.392 0 1Female share in same jobtitle and firm 641 878 0.379 0.390 0 1Mean tenure in same jobtitle and firm 641 878 5.368 3.590 0 25Mean level of education at level in same jobtitle and firm 641 878 14.408 1.892 9 25Years at level so far 641 878 4.327 3.905 1 26Years at title so far 641 878 3.749 3.386 1 26Number of prior titles 641 878 1.048 1.276 0 11No Cumulative gaps (refence category) 641 878 0.667 0.471 0 1Cumulative gaps 1 year 641 878 0.116 0.320 0 1Cumulative gaps more than 1 year 641 878 0.217 0.412 0 1Firm size <51 641 878 0.127 0.333 0 1 51–100 641 878 0.095 0.293 0 1101–200 641 878 0.122 0.328 0 1201–500 641 878 0.190 0.392 0 1501–1000 641 878 0.120 0.325 0 11001–2000 641 878 0.103 0.305 0 1>2000 641 878 0.242 0.428 0 1
ETLA Keskusteluaiheita – Discussion Papers No 124126
Table A 2 Linear probability model of all promotions, full table
All Exp0-2 Exp2-5 Exp6-10 Exp>10
Female -0.024*** -0.031*** -0.033*** -0.021*** -0.009*** [0.001] [0.003] [0.002] [0.003] [0.002]Years of education 0.038*** 0.074*** 0.070*** 0.048*** 0.014*** [0.002] [0.004] [0.005] [0.004] [0.003]Years of education squared -0.075*** -0.161*** -0.156*** -0.105*** -0.022*** [0.005] [0.012] [0.015] [0.013] [0.008]Educational science -0.045*** -0.060*** -0.031 -0.033* -0.026 [0.010] [0.022] [0.021] [0.019] [0.020]Humanities -0.064*** -0.077*** -0.064*** -0.058*** -0.033*** [0.004] [0.008] [0.008] [0.008] [0.007]Social sciences -0.040*** -0.047*** -0.035*** -0.026*** -0.025*** [0.002] [0.005] [0.005] [0.004] [0.004]Natural sciences -0.032*** -0.027*** -0.030*** -0.025*** -0.019*** [0.003] [0.007] [0.007] [0.006] [0.006]Technology -0.036*** -0.036*** -0.032*** -0.023*** -0.026*** [0.002] [0.005] [0.005] [0.005] [0.004]Agriculture and forestry -0.040*** -0.042*** -0.043*** -0.020** -0.031*** [0.005] [0.011] [0.009] [0.009] [0.008]Health and welfare -0.047*** -0.057*** -0.039*** -0.038*** -0.015* [0.004] [0.008] [0.008] [0.008] [0.008]Services -0.026*** -0.021 -0.026** -0.013 -0.017* [0.006] [0.014] [0.011] [0.012] [0.009]Age 0.001*** 0.009*** 0.006*** 0.001 0.000 [0.000] [0.002] [0.001] [0.001] [0.000]Age squared 0.003** -0.130*** -0.041** 0.000 0.000 [0.001] [0.040] [0.016] [0.007] [0.002]Tenure 0.007*** -0.005 -0.028*** -0.010 0.002 [0.001] [0.008] [0.008] [0.007] [0.002]Tenure squared -0.011*** 0.013 0.045*** 0.013 -0.004 [0.001] [0.016] [0.014] [0.011] [0.003]Hierarchical level 3 0.053*** 0.059*** 0.060*** 0.056*** 0.045*** [0.001] [0.002] [0.002] [0.002] [0.002]Hierarchical level 4 0.086*** 0.112*** 0.097*** 0.088*** 0.057*** [0.001] [0.003] [0.003] [0.003] [0.002]Hierarchical level 5 0.114*** 0.169*** 0.129*** 0.103*** 0.068*** [0.002] [0.004] [0.003] [0.003] [0.002]Hierarchical level 6 0.199*** 0.290*** 0.218*** 0.159*** 0.101*** [0.003] [0.006] [0.006] [0.007] [0.006]Title field: Implementation -0.012*** -0.031*** -0.011*** -0.004 -0.009*** [0.001] [0.003] [0.002] [0.002] [0.002]Title field: Production -0.000 0.016*** 0.001 -0.000 -0.008*** [0.001] [0.003] [0.002] [0.002] [0.002]Title field: Administration -0.020*** -0.030*** -0.019*** -0.016*** -0.014*** [0.002] [0.003] [0.003] [0.003] [0.003]Female share in same job title and firm -0.001 0.000 -0.002 0.002 -0.006* [0.002] [0.004] [0.004] [0.004] [0.003]Mean tenure in same job title and firm -0.004*** -0.006*** -0.006*** -0.004*** -0.002*** [0.000] [0.000] [0.000] [0.000] [0.000]
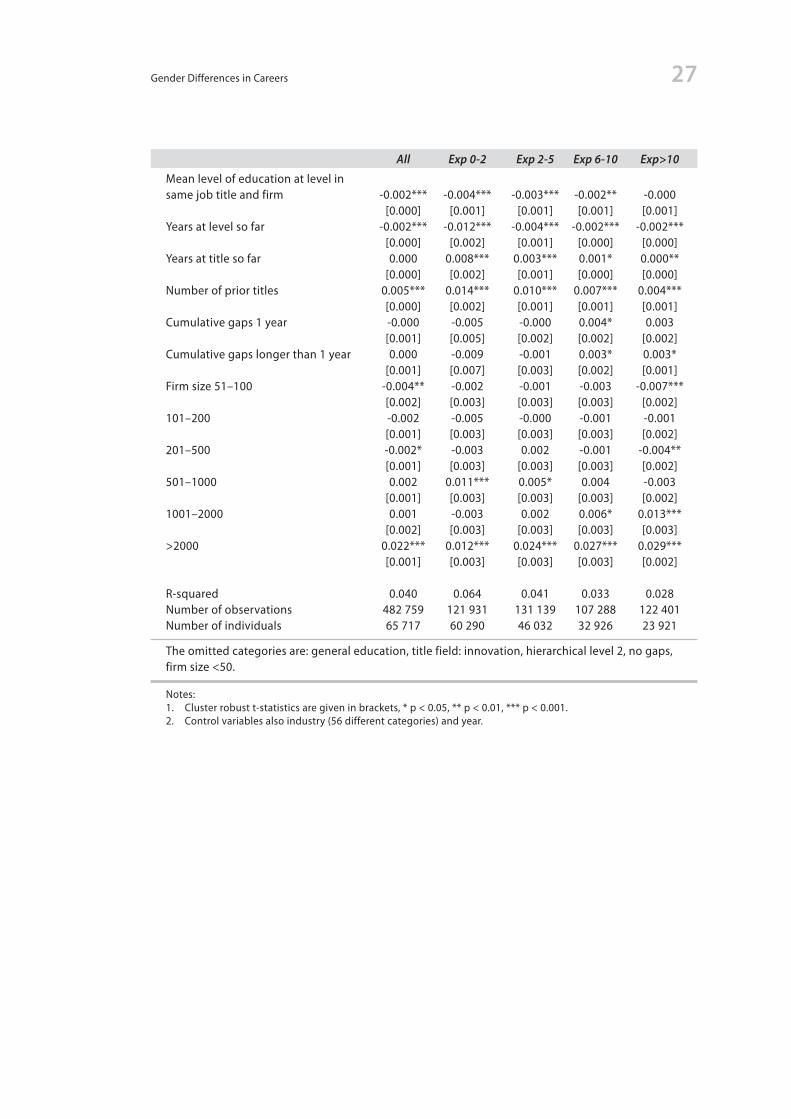
27Gender Differences in Careers
Mean level of education at level in same job title and firm -0.002*** -0.004*** -0.003*** -0.002** -0.000 [0.000] [0.001] [0.001] [0.001] [0.001]Years at level so far -0.002*** -0.012*** -0.004*** -0.002*** -0.002*** [0.000] [0.002] [0.001] [0.000] [0.000]Years at title so far 0.000 0.008*** 0.003*** 0.001* 0.000** [0.000] [0.002] [0.001] [0.000] [0.000]Number of prior titles 0.005*** 0.014*** 0.010*** 0.007*** 0.004*** [0.000] [0.002] [0.001] [0.001] [0.001]Cumulative gaps 1 year -0.000 -0.005 -0.000 0.004* 0.003 [0.001] [0.005] [0.002] [0.002] [0.002]Cumulative gaps longer than 1 year 0.000 -0.009 -0.001 0.003* 0.003* [0.001] [0.007] [0.003] [0.002] [0.001]Firm size 51–100 -0.004** -0.002 -0.001 -0.003 -0.007*** [0.002] [0.003] [0.003] [0.003] [0.002]101–200 -0.002 -0.005 -0.000 -0.001 -0.001 [0.001] [0.003] [0.003] [0.003] [0.002]201–500 -0.002* -0.003 0.002 -0.001 -0.004** [0.001] [0.003] [0.003] [0.003] [0.002]501–1000 0.002 0.011*** 0.005* 0.004 -0.003 [0.001] [0.003] [0.003] [0.003] [0.002]1001–2000 0.001 -0.003 0.002 0.006* 0.013*** [0.002] [0.003] [0.003] [0.003] [0.003]>2000 0.022*** 0.012*** 0.024*** 0.027*** 0.029*** [0.001] [0.003] [0.003] [0.003] [0.002]
R-squared 0.040 0.064 0.041 0.033 0.028Number of observations 482 759 121 931 131 139 107 288 122 401Number of individuals 65 717 60 290 46 032 32 926 23 921
The omitted categories are: general education, title field: innovation, hierarchical level 2, no gaps, firm size <50.
All Exp0-2 Exp2-5 Exp6-10 Exp>10
Notes:1. Cluster robust t-statistics are given in brackets, * p < 0.05, ** p < 0.01, *** p < 0.001.2. Control variables also industry (56 different categories) and year.
ETLA Keskusteluaiheita – Discussion Papers No 124128
Table A 3 Linear probability model of promotion, within-firms promotions
All Exp0-2 Exp2-5 Exp6-10 Exp>10
Female -0.019*** -0.023*** -0.025*** -0.017*** -0.008*** [0.001] [0.002] [0.002] [0.002] [0.002]Years of education 0.030*** 0.056*** 0.053*** 0.039*** 0.012*** [0.002] [0.004] [0.005] [0.004] [0.003]Years of education squared -0.059*** -0.123*** -0.117*** -0.084*** -0.018** [0.005] [0.011] [0.014] [0.012] [0.008]Educational science -0.032*** -0.035* -0.013 -0.034* -0.031** [0.010] [0.021] [0.021] [0.018] [0.014]Humanities -0.047*** -0.056*** -0.047*** -0.044*** -0.025*** [0.004] [0.007] [0.007] [0.007] [0.006]Social sciences -0.030*** -0.033*** -0.023*** -0.020*** -0.021*** [0.002] [0.004] [0.004] [0.004] [0.003]Natural sciences -0.024*** -0.015** -0.020*** -0.022*** -0.016*** [0.003] [0.007] [0.006] [0.006] [0.006]Technology -0.029*** -0.028*** -0.026*** -0.020*** -0.023*** [0.002] [0.005] [0.004] [0.004] [0.004]Agriculture and forestry -0.031*** -0.030*** -0.031*** -0.021** -0.025*** [0.004] [0.009] [0.008] [0.008] [0.007]Health and welfare -0.032*** -0.041*** -0.020*** -0.027*** -0.010 [0.004] [0.007] [0.007] [0.008] [0.008]Services -0.018*** -0.005 -0.016 -0.011 -0.017* [0.006] [0.013] [0.010] [0.012] [0.009]Age 0.002*** 0.010*** 0.008*** 0.003*** 0.001*** [0.000] [0.002] [0.001] [0.001] [0.000]Age squared -0.003** -0.124*** -0.049*** -0.007 -0.003* [0.001] [0.037] [0.015] [0.006] [0.002]Tenure 0.005*** -0.006 -0.024*** -0.010 0.002 [0.001] [0.007] [0.007] [0.007] [0.002]Tenure squared -0.008*** 0.014 0.038*** 0.014 -0.004 [0.001] [0.014] [0.013] [0.010] [0.003]Hierarchical level 3 0.043*** 0.045*** 0.048*** 0.047*** 0.038*** [0.001] [0.002] [0.002] [0.002] [0.002]Hierarchical level 4 0.068*** 0.083*** 0.074*** 0.071*** 0.047*** [0.001] [0.003] [0.002] [0.002] [0.002]Hierarchical level 5 0.091*** 0.132*** 0.101*** 0.082*** 0.056*** [0.001] [0.003] [0.003] [0.003] [0.002]Hierarchical level 6 0.166*** 0.237*** 0.182*** 0.134*** 0.085*** [0.003] [0.005] [0.006] [0.006] [0.005]Title field: Implementation -0.011*** -0.029*** -0.012*** -0.004* -0.008*** [0.001] [0.003] [0.002] [0.002] [0.002]Title field: Production -0.000 0.011*** -0.001 0.000 -0.007*** [0.001] [0.003] [0.002] [0.002] [0.002]Title field: Administration -0.019*** -0.030*** -0.019*** -0.016*** -0.013*** [0.001] [0.003] [0.003] [0.003] [0.002]Female share in same job title and firm 0.000 0.002 -0.002 0.003 -0.003 [0.002] [0.004] [0.004] [0.004] [0.003]Mean tenure in same job title and firm -0.004*** -0.005*** -0.006*** -0.004*** -0.002*** [0.000] [0.000] [0.000] [0.000] [0.000]
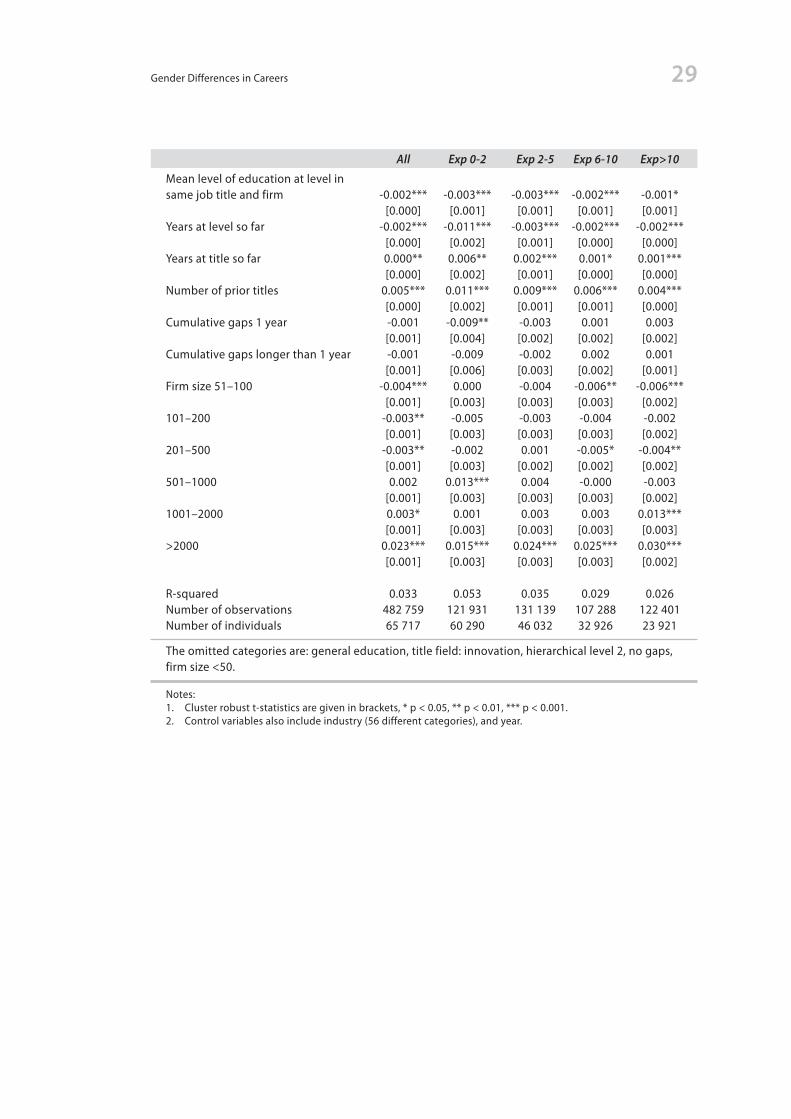
29Gender Differences in Careers
Mean level of education at level in same job title and firm -0.002*** -0.003*** -0.003*** -0.002*** -0.001* [0.000] [0.001] [0.001] [0.001] [0.001]Years at level so far -0.002*** -0.011*** -0.003*** -0.002*** -0.002*** [0.000] [0.002] [0.001] [0.000] [0.000]Years at title so far 0.000** 0.006** 0.002*** 0.001* 0.001*** [0.000] [0.002] [0.001] [0.000] [0.000]Number of prior titles 0.005*** 0.011*** 0.009*** 0.006*** 0.004*** [0.000] [0.002] [0.001] [0.001] [0.000]Cumulative gaps 1 year -0.001 -0.009** -0.003 0.001 0.003 [0.001] [0.004] [0.002] [0.002] [0.002]Cumulative gaps longer than 1 year -0.001 -0.009 -0.002 0.002 0.001 [0.001] [0.006] [0.003] [0.002] [0.001]Firm size 51–100 -0.004*** 0.000 -0.004 -0.006** -0.006*** [0.001] [0.003] [0.003] [0.003] [0.002]101–200 -0.003** -0.005 -0.003 -0.004 -0.002 [0.001] [0.003] [0.003] [0.003] [0.002]201–500 -0.003** -0.002 0.001 -0.005* -0.004** [0.001] [0.003] [0.002] [0.002] [0.002]501–1000 0.002 0.013*** 0.004 -0.000 -0.003 [0.001] [0.003] [0.003] [0.003] [0.002]1001–2000 0.003* 0.001 0.003 0.003 0.013*** [0.001] [0.003] [0.003] [0.003] [0.003]>2000 0.023*** 0.015*** 0.024*** 0.025*** 0.030*** [0.001] [0.003] [0.003] [0.003] [0.002]
R-squared 0.033 0.053 0.035 0.029 0.026Number of observations 482 759 121 931 131 139 107 288 122 401Number of individuals 65 717 60 290 46 032 32 926 23 921
The omitted categories are: general education, title field: innovation, hierarchical level 2, no gaps, firm size <50.
All Exp0-2 Exp2-5 Exp6-10 Exp>10
Notes:1. Cluster robust t-statistics are given in brackets, * p < 0.05, ** p < 0.01, *** p < 0.001.2. Control variables also include industry (56 different categories), and year.
ETLA Keskusteluaiheita – Discussion Papers No 124130
Table A 4 Linear probability model of promotion by hierarchical level, all promotions
Level6 Level5 Level4 Level3 Level2
Female 0.017 -0.039*** -0.016*** -0.023*** -0.015*** [0.013] [0.003] [0.003] [0.002]a [0.002]Years of education -0.003 -0.002 0.031*** 0.028*** 0.006** [0.017] [0.006] [0.009] [0.004] [0.003]Years of education squared 0.083 0.079*** -0.025 -0.049*** -0.005 [0.069] [0.021] [0.030] [0.012] [0.009]Educational science -0.110 -0.070** -0.084** -0.052** -0.038*** [0.069] [0.028] [0.036] [0.023] [0.009]Humanities -0.130*** -0.084*** -0.104*** -0.073*** -0.028*** [0.024] [0.006] [0.010] [0.010] [0.009]Social sciences -0.015 -0.034*** -0.068*** -0.050*** -0.027*** [0.010] [0.003] [0.007] [0.007] [0.007]Natural sciences -0.016 0.027** -0.075*** -0.059*** -0.026*** [0.056] [0.011] [0.010] [0.008] [0.008]Technology -0.018 -0.021*** -0.074*** -0.061*** -0.020*** [0.020] [0.003] [0.008] [0.007] [0.007]Agriculture and forestry 0.095 -0.054*** -0.063*** -0.058*** -0.033*** [0.138] [0.010] [0.015] [0.011] [0.009]Health and welfare -0.110*** -0.048*** -0.096*** -0.057*** -0.016 [0.040] [0.008] [0.009] [0.009] [0.012]Services -0.020 -0.014* -0.053*** -0.037** -0.003 [0.028] [0.008] [0.013] [0.016] [0.018]Age -0.010*** -0.003*** 0.001** 0.005*** 0.001*** [0.002] [0.001] [0.001] [0.001] [0.001]Age squared 0.058*** 0.022*** 0.004 -0.015*** -0.004 [0.011] [0.003] [0.003] [0.003] [0.003]Tenure 0.010** 0.014*** 0.010*** 0.010*** 0.005*** [0.004] [0.001] [0.002] [0.002] [0.002]Tenure squared -0.020*** -0.022*** -0.016*** -0.016*** -0.008*** [0.006] [0.002] [0.002] [0.002] [0.002]Title field: Implementation 0.008 -0.048*** -0.025*** -0.001 -0.005** [0.006] [0.003] [0.004] [0.002] [0.002]Title field: Production -0.021*** -0.012*** 0.049*** 0.021*** [0.004] [0.003] [0.006] [0.002]Title field: Administration -0.048*** -0.043*** -0.007** -0.018*** [0.003] [0.005] [0.003] [0.003]Female share in same job title and firm -0.006 0.003 0.011* 0.009** 0.007** [0.023] [0.004] [0.006] [0.004] [0.003]Mean tenure in same job title and firm -0.004*** -0.004*** -0.004*** -0.005*** -0.001*** [0.001] [0.000] [0.000] [0.000] [0.000]Mean level of education at level in same job title and firm -0.001 0.001 -0.002* -0.002*** -0.001** [0.003] [0.001] [0.001] [0.001] [0.001]Years at level so far -0.006*** -0.001*** -0.001 -0.001** 0.001 [0.002] [0.000] [0.001] [0.000] [0.000]Years at title so far 0.003* -0.001*** 0.001 0.000 -0.000 [0.002] [0.000] [0.001] [0.001] [0.000]Number of prior titles 0.006 0.006*** 0.007*** 0.009*** 0.006*** [0.004] [0.001] [0.001] [0.001] [0.001]
31Gender Differences in Careers
Cumulative gaps 1 year 0.020** -0.001 0.004 0.000 -0.001 [0.009] [0.002] [0.003] [0.003] [0.002]Cumulative gaps longer than 1 year 0.010 0.002 0.002 0.002 0.000 [0.009] [0.002] [0.003] [0.003] [0.002]Firm size 51–100 0.002 -0.008*** 0.003 -0.013*** -0.008** [0.010] [0.003] [0.003] [0.003] [0.004]101–200 0.022** -0.009*** 0.003 -0.003 -0.012*** [0.009] [0.003] [0.003] [0.003] [0.003]201–500 0.004 -0.003 -0.004 -0.004 -0.014*** [0.009] [0.002] [0.003] [0.003] [0.003]501–1000 0.029** -0.002 0.006* 0.003 -0.020*** [0.012] [0.003] [0.003] [0.003] [0.004]1001–2000 0.011 0.003 0.000 0.002 -0.018*** [0.011] [0.003] [0.004] [0.004] [0.004]>2000 0.056*** 0.024*** 0.019*** 0.024*** 0.003 [0.011] [0.003] [0.003] [0.003] [0.003]
R-squared 0.036 0.058 0.048 0.024 0.031Number of observations 16 929 151 337 110 827 104 345 69 054Number of individuals 65 717 60 290 46 032 32 926 23 921
The omitted categories are: general education, title field: innovation, hierarchical level 2, no gaps, firm size <50.
Level6 Level5 Level4 Level3 Level2
Notes:1. Cluster robust t-statistics are given in brackets, * p < 0.05, ** p < 0.01, *** p < 0.001.2. Control variables also include industry (56 different categories), and year.

ETLA Keskusteluaiheita – Discussion Papers No 124132

33Gender Differences in Careers
ETLA Keskusteluaiheita – Discussion Papers No 124134Aikaisemmin ilmestynyt ETLAn Keskusteluaiheita-sarjassa Previously published in the ETLA Discussion Papers Series
No 1226 Heli Koski – Mika Pajarinen, Access to Business Subsidies: What Explains Complementarities and Persistency? 10.11.2010. 16 p.
No 1227 Ville Kaitila, Quality-Adjusted Similarity of EU Countries’ Export Structures. 15.11.2010. 18 p.
No 1228 Eija Niskanen – Yoshio Kakeo – Silvana Petkovic – Karen Severns, Japanese – Baltic Sea Region Film Co-production: Japanese Views. 19.11.2010. 108 p.
No 1229 Markku Kotilainen – Nuutti Nikula, Why do Firms Invest in the Baltic Sea Region? 19.11.2010. 36 p.
No 1230 Rita Asplund – Reija Lilja, Wage Formation and Gender Wage Gaps: The Changing Role of Human Capital in the Finnish Technology Industry. 03.12.2010. 22 p.
No 1231 Tuomo Nikulainen – Hannele Salminen – Pekka Ylä-Anttila, Ammattikorkeakoulujen asema ja uudistuminen – Taustakyselyn tuloksia. 01.12.2010. 28 s.
No 1232 Ilkka Ylhäinen, Persistence of Government Funding in Small Business Finance. 13.12.2010. 33 p.
No 1233 Antti-Jussi Tahvanainen – Tuomo Nikulainen, Tutkimusympäristö muutoksessa – Tutkijoiden näkemykset SHOK:n, korkeakoulukeksintölain ja yliopistolain vaikutuksista. 22.12.2010. 18 s.
No 1234 Antti-Jussi Tahvanainen – Tuomo Nikulainen, Commercialiazation at Finnish Universities – Researchers’ Perspectives on the Motives and Challenges of Turning Science into Business. 10.01.2011. 47 p.
No 1235 Heli Koski – Mika Pajarinen, Do Business Subsidies Facilitate Employment Growth? 04.01.2011. 20 p.
No 1236 Antti-Jussi Tahvanainen – Raine Hermans, Making Sense of the TTO Production Function: University Technology Transfer Offices as Process Catalysts, Knowledge Converters and Impact Amplifiers. 11.01.2011. 40 p.
No 1237 Jukka Lassila – Tarmo Valkonen, Julkisen talouden rahoituksellinen kestävyys Suomessa. 11.01.2011. 28 s.
No 1238 Martin Kenney – Bryan Pon, Structuring the Smartphone Industry: Is the Mobile Internet OS Platform the Key. 10.02.2011. 24 p.
No 1239 Mika Maliranta – Reijo Mankinen – Paavo Suni – Pekka Ylä-Anttila, Suhdanne- ja rakennekriisi yhtä aikaa? Toimiala- ja yritysrakenteen muutokset taantumassa. 17.02.2011. 20 s.
No 1240 Jyrki Ali-Yrkkö – Petri Rouvinen – Timo Seppälä – Pekka Ylä-Anttila, Who Captures Value in Global Supply Chains? Case Nokia N95 Smartphone. 28.02.2011. 22 p.
Elinkeinoelämän Tutkimuslaitoksen julkaisemat ”Keskusteluaiheita” ovat raportteja alustavista tutkimustuloksista ja väliraportteja tekeillä olevista tutkimuksista. Tässä sarjassa julkaistuja monisteita on mahdollista ostaa Talous-tieto Oy:stä kopiointi- ja toimituskuluja vastaavaan hintaan.
Papers in this series are reports on preliminary research results and on studies in progress. They are sold by Taloustieto Oy for a nominal fee covering copying and postage costs.
Julkaisut ovat ladattavissa pdf-muodossa osoitteessa: www.etla.fi/julkaisuhaku.php Publications in pdf can be downloaded at www.etla.fi/eng/julkaisuhaku.php
ETLAElinkeinoelämän TutkimuslaitosThe Research Institute of the Finnish EconomyLönnrotinkatu 4 B00120 Helsinki
ISSN 0781–6847
Puh. 09-609 900Fax 09-601 753