electoral competition and gender differences in political...
TRANSCRIPT

1
Electoral competition and gender differences in political careers
Olle Folke and Johanna Rickne
Abstract
This paper analyzes the role of competition between political parties for the promotion and
turnover of social minorities in party organizations. We collect extensive and reliable panel
data for the career trajectories of all Swedish politicians in 290 municipal councils over 20
years (N=35,000). We argue that political competition pushes local parties to promote the best
individual, which in turn improves gender equality at the top. This finds strong support in the
empirical analysis. Heightened competition is associated with smaller gender gaps in re-
election, retention on the electoral ballot, and promotions to top positions. An extended
analysis shows that variation in the qualifications and family structures of male and female
politicians cannot account for these results. As a more plausible mechanism, the analysis
suggests that parties have nomination processes that are less centralized and more focused on
competence as a selection criteria when competition is fierce.
Keywords: Careers in politics, Vertical inequality, Political competition, Supply of politicians
Due to its sensitive nature, the data used in this study can only be accessed through the secure servers of
Statistics Sweden. Access requires approval from a research ethics board and the payment of an access fee. We
thank Anna Ardin, Pamela Campa, Louise Chappell, Andrew Healy, Lena Hensvik, Jon Fiva, Åsa Ljungvall,
Heléne Lundqvist, Per-Anders Edin, Mattias Lundbäck, Yotam Margalit, Astri Muren, Rainbow Murray, Eva
Ranelid, Erik Snowberg, and seminar participants at the Public Choice Society Annual Meeting 2012; London
School of Economics, VATT, the Annual Conference for Swedish Economists, 2011; RATIO Research Institute,
Research Institute for Industrial Economics, The 13th Annual SNEE European Integration Conference, Mölle,
Sweden; the Workshop on Electoral Gender Quotas, Washington University, Stockholm School of Economics
SITE, Erasmus University, Midwest Political Science Association 2012, Gothenburg University and the
European Association for Labor Economists 2012 for helpful comments and suggestions. We also thank
Christina Lönnblad and Dina Nieman for editorial support. Financial support from the Marianne and Marcus
Wallenberg Foundation, and the Ragnar Söderberg Foundation, is gratefully acknowledged. Columbia University, SIPA & Research Institute for Industrial Economics, [email protected]. Research Institute for Industrial Economics & Uppsala Center for Labor Studies, [email protected].

2
Although the proportion of female legislators worldwide has been steadily rising over the past
decades, women are still largely absent from the apex of political power. In 2014, women
held 22% of the seats in the world's parliaments, but only 18 of the world's 252 executives
were women (UN Women, 2014). As top appointments offer more political power, the small
proportion of women on higher positions means that women's gain in numerical
representation has not been accompanied by an equivalent increase in actual political
influence. Recognizing this fact, a growing body of scholarly work is focusing on the
institutions that shape the proportion of women in countries' ministerial cabinets (Davis,
1997; Reynolds, 1999; Escobar-Lemmon and Taylor-Robinson, 2005; Krook and O’Brien,
2012, O'Brien; forthcoming).
Although the previous literature is highly interesting and informative in understanding
the political environments that allow women to rise to the top, these studies also have
important limitations. First, countries have vastly different political systems and cultures, and
finding data and variable specifications that allow a comparison of all the relevant factors is a
difficult task. Also, and more importantly, a chronic lack of data on the individual
characteristics of politicians in the pool of candidates for top posts makes it hard, or outright
possible, to disentangle supply-side factors from characteristics of the political system. Yet
another level of complexity is added by the unobserved "black box" of complex candidate
selection procedures that vary both across countries and parties (Gallagher and Marsh, 1987).
This paper takes an entirely novel approach to studying women's access to top positions.
Instead of looking at the aggregate share of women in specific political positions we turn to
the microdata level where we can examine the career patterns of individual politicians. Our
longitudinal data contains 20 yearly observations (1991-2010) for the rank in the political
hierarchy and the individual level socioeconomic characteristics of the full universe of
Swedish local politicians, a total of over 35,000 persons.

3
The goal of the paper is to test if one particular contextual factor, political competition,
has a positive impact on women's relative probability of reaching the top. The intuition for
this comes directly from the field of economics, where external competition has been shown
to boost the proportion of female company managers (Black and Strahan, 2001). Put shortly,
an organization that faces more competition has stronger incentives to retain and promote the
most productive individuals, a situation that removes gender as a selection criteria in
promotions. This intuition is well-aligned with previous evidence for the political sector
where competitive elections have been shown to correlate both with a higher share of elected
women (Esteve-Volart and Bagues, 2012) and with improved politician quality (Galasso and
Nannicini, 2011; Besley et al., 2013; De Paola and Scoppa, 2011).
We test our hypothesis on data from Swedish local governments, a dataset with unique
qualities that allows us to pin down the relationship between political competition and gender
parity at the top. First, the degree of political competition varies greatly both across
municipalities and within municipalities over time, while other factors such as the electoral
system, the party system, and key cultural features are automatically held constant when we
use subnational data. The fact that the party system is highly stable across municipalities and
that parties compete in two political blocks allows us to operationalize competition as the vote
difference between these two blocks.
The Swedish case is also suitable to study the outcomes of parties' selection processes
because local parties both rank political candidates on their electoral ballots and appoint
executive positions after the election. By accessing data on all rankings over a 20 year period
we can explore how nomination behaviors are related to the political context. In a country
with more centralized selection procedure, local data on nominations would simply reflect the
priorities of the central party organization, a problem that we circumvent in the Swedish case.
In a country with direct elections for executive posts, such as mayor, it would not be possible
4
to separate party and voter choices. Finally, the fact that our data on party choices covers a 20
year period of nominations for every local party gives us a uniquely large sample size.
For every local party and election we construct two main outcome variables that capture
career advancements and promotions, both of which are measured at the level of the
individual political candidate. The first is a binary indicator of whether a politician remains in
his or her council seat for one more election period (i.e. becomes re-elected). The motivation
for this measure is the simple fact that the process of accumulating seniority is a key
determinant for becoming eligible for top appointments in the political hierarchy, something
that is true both in Sweden and in most political systems around the world.1 Our second
measure is a binary indicator of whether the politician is moved up to, or remains in, the top
position in his or her party, measured by holding the top rank on the party’s ballot. Together,
these two measures capture both the accumulation of the necessary experience for top
appointments and the actual appointments to the top position within each local party and in
each election period.
Our results show that when the difference in vote shares between the left and the right
block is smaller, i.e. when political competition is fiercer, women have a substantially smaller
disadvantage in the probability of re-election and in holding the top appointment. We
ascertain that this result is robust to controlling for characteristics of the municipality and of
the municipal council that reflect contextual differences argued to improve women's political
representation in the cross-country research literature (e.g. Studlar and Welch, 1991, and
Matland, 1993; Paxton, 1997; Matland, 1998; Reynolds, 1999; Norris and Inglehart, 2001;
Tripp and Kang, 2008).
1 Norris (1997) provides an overview of the importance of seniority across political systems and Davis (1997)
highlights this as a key factor behind women’s underrepresentation in the top of political hierarchies.

5
In the second part of the paper we try to further understand the possible mechanisms for
the strong positive role of political competition for vertical gender equality in the local parties.
We first test a supply explanation. Perhaps more skilled, career-minded, or ambitious women
come forth to aspire for political appointments when competition is fierce? Two sets of
empirical analysis reveal that this is unlikely to be the mechanism at work. The first analysis
exploits the unique quality and breadth of our microdata.2 We introduce control variables for
individual qualifications and life situations expected to impact on promotions and political
exits. These include the most common measures of politician qualifications, namely education
level, occupation sector and political experience, as well as controls for having small children
or becoming the parent of a newborn child when occupying a political office. The results
show that these controls do not account for our baseline results. This analysis represents an
important contribution to the research literature, where access to data for the individual
characteristics of male and female politicians has so far been minimal (e.g. Escobar-Lemon
2005; Davis 1997; Reynolds, 1999; Studlar and Moncrief, 1997).
In a second supply side analysis we use survey data that covers 80% of the elected
politicians and measures their self-stated career ambitions. This analysis shows that gender
differences in the level of ambition does not co-vary with competition in a way that would
explain our baseline findings.
In the final section we turn our attention to the characteristics of the nomination process
in the local parties. We explore if competition is linked to the politicians' views of 1) the
selection criteria used in the nomination process, and 2) the importance of different party
actors in that process. Interestingly, the results suggest that a competitive context is correlated
2 This dataset comes from the electoral authority. According to Swedish law, all parties must register their ballots
with this agency and include the unique personal identification number of every individual. We let Statistics
Sweden link every politician on every ballot to yearly panel data on background characteristics. These were
compiled from administrative records collected by various authorities such as the tax authority, the school
authority, and the population register, databases that cover the full population are highly accurate.

6
with a less centralized and a more institutionalized process. Competitive contexts are
associated with more influence by party branches such as the youth league and the women's
branch. Supporting our argument about an increased focus on competence, the results also
show that female politicians (but not male) view competence as a substantially more
important selection criteria under competition.
Our study holds relevance that reaches beyond the borders of Sweden. Our findings
extend the literature that has emphasized the importance of political parties as the key
gatekeepers for women's underrepresentation in politics (e.g. Hellevik and Skard, 1985;
Niven, 1998; 2010; Hakesworth, 2003; Sanbonmatsu, 2006; Casas-Arce and Saiz, 2011). By
showing that party behavior is strongly affected by the external electoral environment, we add
the insight that party bias is not a constant state of affairs. Rather, the external political
environment should be considered an important factor in shaping party behavior. Well-
functioning democratic elections where there is meaningful competition between political
parties aids political minorities in reaching parity not only in numbers, but also in power.
Related Literature and Conceptual Framework
Theoretical and empirical work in economics has shown that competition on the product
market improves the efficiency of a company’s promotion process (Becker, 1957; Black and
Strahan, 2001; Burkart, Panunzi and Schleifer, 2003). While the management of a company
with monopoly power can afford to promote whoever it wants, a firm on a competitive market
is pressured to pick the most productive person for each position. The more competition, the
less likelihood that a discriminating firm can survive when if sacrifices productivity to satisfy
a preference for some un-productive worker characteristic like gender. In this paper we argue
that competition in political elections has a similar impact on the internal labor markets of
political parties that product market competition has on firms' employment practices. We

7
argue that when competition between parties is fiercer, parties cannot forego the skills held by
female political candidates.
Let us explore the comparison between the private firm and the political party in some
more detail. Private firms strive to maximize profits, while political parties maximize their
likelihood of winning elections. Private firms that prioritize non-productive characteristics
over productive characteristics are competed out of the market if either 1) new firms can enter
and capture the surplus of hiring the more productive and discriminated workers, or 2) non-
discriminating existing firms can expand to take advantage of the same underused resource.
Arguably, the probability of a political party to win elections is also increasing in politician
productivity, or valance, as it is usually termed in standard probabilistic voting models. By
increasing its proportion of high valance politicians, parties can win over swing voters and
capture the election. Even without the entry of new parties, environments of high political
competition will raise existing parties' incentives to promote high-valance politicians to
compete for the swing vote.
It is straightforward to assume that a stronger focus on valance in the political
nomination process should raise the proportion of political minorities in office (c.f. Murray
2014; Anzia and Berry 2010). An additional, but perhaps less obvious, claim is that the
promotion of minority candidates will also increase the party's attractiveness to swing voters
by moving its policy platform closer to the swing voters' preference. Starting from the citizen
candidate model it is natural to view the policy platform offered by a party as a product of the
social attributes of the politicians on the list. A recent example of this type of theoretical
modeling is Besley et al.'s (2013) proposed model of a PR election where women and men
have different preferences. In this model, all swing voters prefer candidates of high valence,
and they also prefer representatives of their own gender but at a decreasing marginal rate.
Because the marginal utility of a same-sex candidate is decreasing in the proportion existing

8
same-sex candidates on the list, parties maximize their appeal to the (gender balanced) swing
voters in the election by providing a 50-50 gender balanced list with the highest possible
valence.
A growing empirical literature supports the relationship between competitive elections,
on the one hand, and competence and gender balance on the other hand. In Italy, political
parties have been found to field more competent candidates under more intense electoral
competition (Galasso and Nannicini, 2011; De Paola and Scoppa, 2011). In Spain, there is a
strong party bias against women in uncompetitive districts, while there is no bias in
competitive districts, as illustrated by how parties across these district types either avoid or
comply with a candidate gender quota (Esteve-Volart and Bagues, 2012). Although there is a
lack of empirical research on the impact of competition on the composition of party elites, it
follows from the reasoning above that we can expect more gender balance under competition
(c.f. Chattopadyay and Duflo, 2004).3
A potential caveat with the model of Besley et al. (2013) is that women and men are
assumed to have symmetric preferences for co-gendered representation, an assumption that is
critical for the conclusion that swing voters as a group prefer gender parity. Another
possibility is that men have a more intense preference for co-gendered representation than
women, or that both men and women prefer to be represented by men. Under these
circumstances, competition should still favor gender parity through parties' incentives to
prioritize valance, but this effect would have a counterweight in the voter demand for male
3 There are three previous papers that share the empirical finding that political competition does not correlate
with the proportion of women in ministerial cabinets. The empirical approaches in these papers are however
problematic, especially with regard to the measurement of political competition. Studlar and Moncrief (1997)
use data from Canadian provinces and approximate political competition with legislature size, a factor that
commonly used to measure district magnitude, another variable known to predict female representation.
Escobar-Lemon and Taylor-Robinson (2005) use cross country data and compare cases where the president’s
party has a "near legislative minority" to where it has a "clear minority". This dichotomous measure of
competition could however capture many other factors, such as holding a legislative majority, which the authors
themselves argue could have an independent and opposing effect. Krook and O’Brien (2012) also use cross
country data and measure competition as the difference in seat share between the largest and second largest
parties, a measure is likely to suffer from low comparability across electoral systems.

9
over-representation. If the voter bias against women would be severe enough, it could even
overtake the preference for valance and give a situation where sex-based discrimination
becomes a vote winning strategy. The empirical results on voter behavior is mixed. Most
empirical studies have found that voters have a tendency toward same-sex voting (e.g. Smith
and Fox, 2001, Plutzer and Zipp, 1996, for an opposite result, see Pino 2014), that the average
voter weakly favors moves toward gender parity on PR lists (Casas-Arze and Saiz 2011), and
that - in majoritarian systems - women win equally many votes once they appear as candidates
(e.g. Fox and Oxley, 2003).
Next, we will return briefly to the Becker model to examine the intuition from work on
the political sec to for the key behavior that drives gender differences in recruitment in the
absence of competition, namely taste based discrimination. What could this form of
discrimination look like in the setting of a political party? One important empirical
implication is that social identities of political selectors matter for the selections that are
made. Recent theoretical work has modeled this type of taste-based discrimination in
proportional election systems. Casas-Arze and Saiz (2011) model a party preference
parameter for the local party leadership's preference for having men on the electoral ballot.
Besley et al. (2013) model a male party elite whose own survival probability in the leadership
positions is bolstered by having more males on the list. On the empirical side, In an empirical
study of political recruiters in local U.S. parties, David Niven’s (2010) finds that male
recruiters were considering fewer female candidates for future races, had more than twice as
many male candidates in mind for political advancements, and were about three times more
likely to list a man as their top candidate compared to female recruiters.
On a more general note, research from sociology and management studies is also
relevant for political organization. This body of work has emphasized that social similarity
with an organization's selectors improves a candidate's chances of positive treatment.
10
Similarities in socioeconomic characteristics with the in-group (perceiver) in attitudes, values
and personality lead to an assumption of competence (Lipman-Blumen, 2000; Piliavin, 1987)
and this process is clearly gendered (Klahr, 1969; Holgersson, 2003; Schlozman et al, 1995).
Previous research on selection procedures (nomination procedures) within political
parties has underscored the power of party elites to act on their preferences across candidate
types. Work on parties in the U.S. and Latin America has described the nomination
procedures for top posts as non-transparent “smoke filled rooms” in which network resources
take predominance over competence (see, for example, Kemahlioglu, et. al. 2009 and Hirano
and Snyder, 2014). Precisely this focus on network ties and other connections between
candidates and the party elite is also a common response by female politicians surveys that try
to uncover reasons for women politicians' slower political careers (Maillé and Wängnerud,
1999; Niklasson 2005).
A closely related, and highly relevant, insight from the research on parties' nomination
procedures is that certain characteristics of this procedure favors selection based more
squarely on formal merits. Objective valuations of candidates becomes more common if the
procedure is decentralized, meaning that the party elites' degree of control is reduced. A
second trait that helps objective valuations is the institutionalization of the process, capturing
the role of formal rules rather than informal norms and tacit procedures (Norris, 1997).
Adopting nomination procedures that are more decentralized and/or more institutionalized is
hence expected to reduce the importance of social similarity between recruiters and
candidates in the nomination process. Parties that face competition could be more likely to
adopt procedures of this kind, either if they are pushed to find high-valance candidates under
fiercer competition (as discussed above), but also because more transparent nomination
procedures can attract votes to the party (Carey and Polga-Hecimovich, 2006; Ware, 2002).

11
To summarize our main arguments in this section, we hypothesize that political
competition raises political parties’ incentives to retain and promote the most competent
politicians. This focus on productivity, rather than sex, moves the party toward gender parity.
In addition, gender parity may benefit the party electorally if women and men's policy
preferences differ, and/or as long as voters' are not so biased against female candidates that
their preference for men is greater than their preference for valance.
As a final word of caution, it is relevant to note that competition could be linked to
gender differences in career performances via a supply mechanism. As one strand of
economics literature suggests, a competitive environment should benefit men who - unlike
women - do not shy away from competition with others (e.g. Gupta et al., 2005; Niederle and
Vesterlund, 2007; Croson and Gneezy, 2009). There could also exist other reasons why
different types of men and women seek out political careers when the political context differs.
For example, a competitive context could imply more political uncertainty and less certainty
of political appointments, factors that could appeal or repel particular types of men and
women. If more skilled or ambitious women come forth in competitive contexts, this could
give women an advantage independently of the party's selection process. Disentangling the
supply channel from party behavior is a crucial step of the empirical strategy in this paper.
Swedish Municipalities and Party Nomination Procedures
Sweden has a proportional election system with semi-open lists at all three levels of
government, the national parliament, 20 county assemblies, and 290 municipal assemblies.
The lists have been semi-open since 1998, when each voter was given the opportunity to
circle one politician on the electoral ballot to signal his or her preference for that person.

12
The municipalities' right of local self-government is legally guaranteed by the Swedish
Instrument of Government which stipulates that local authorities themselves determine their
own affairs under the 1991 Local Government Act 2.1. This includes the power to set local
income taxes, which averaged 21.6% in 2010. It also includes the main executive
responsibility for large areas of social spending, in particular education and elderly care
(while health care is managed at the county level), sectors that employ about one fourth of
Sweden’s total labor force. As such, municipalities have political authorities similar to
national parliaments and leading positions in large municipalities are generally considered
more influential than the average seat in the national parliament.
Municipalities differ widely in both land area (from 9 to 19,447 square kilometers) and
population (from 2,558 to 780,817 inhabitants). Elections are held jointly with the parliament
and county levels every fourth year (every third year prior to 1994) and have a participation
rate of above 80%. Seats are allocated across parties in proportion to their vote shares.
The municipal council has at least 31 and at most 101 seats, with an average of 40 seats.
Political power is concentrated to the executive committee, also known as the council board.
Its chairperson is selected by the largest party in the governing coalition, and the remaining
board seats are distributed amongst all parties to reflect the seat allocation of the full
assembly.4 The Swedish party system is highly stable with the seven main political parties
represented in nearly all municipal councils. Small local parties hold about 4-5% of the total
number of council seats.
4 Specific policy areas are dealt with in subcommittees (the average council has seven of them), to which
chairpersons are appointed by the governing majority. The board, assembly, and committee chairpersons are the
most influential politicians, whereof the chairperson of the council board is usually the only person hired full
time. Others receive piece rate compensation for meetings and offices, and less than 10% receive more than 40%
of a standard full time salary. A survey carried out in 1991 showed that the average regular council member
spent 8.3 hours per week on her duties, while chairpersons spent 17.8 hours.

13
Swedish political parties have nomination procedures that are highly decentralized at
the local level. The standard procedure for composing electoral ballots can be summarized as
follows. First, a group of potential candidates is selected either via internal nomination, which
is more common in the left-wing parties (Social Democrats and Left Party), or internal
primaries in the case of right-wing ones (the Conservative Party, Center Party and the
Christian Democrats). Both procedures are organized by a committee of party selectors. This
committee performs several tasks, the first of which is to collect information about aspiring
candidates and to distribute it to the agents that vote in the internal primaries or make
nominations via their clubs in the internal nomination procedure. In both these procedures,
key party branches such as the women's federation and the youth league have substantial
influence. These branches will co-ordinate votes and nominations to place their candidates
high up on the party lists. The selection committee also has a strong implicit power by
organizing and presenting the information about the available candidates. In the case of the
internal primary, the committee often pre-ranks the list of nominees or sends the information
together with party lists from the previous election as “guidance” for the members, practices
that have been argued to introduce an anti-minority bias in the voting pattern (Soininen and
Etzler, 2006).
Having collected information on the support of the difference candidates, the
nomination committee ranks the candidates on a preliminary party list. In this stage the
committee will also take into account the specific party's strategy of gender representation.
All of Sweden's main parties has some strategy of this type, a summary of which are given in
Table A1 of the appendix. Left-wing parties have favored strict quotas with placement
mandates and right-wing parties have relied on non-mandatory recommendations for the share
of women on the electoral ballots (the relevance of these quota policies for our study is further
discussed in the sections on descriptive statistics and results below). After the committee has

14
molded a final suggestion for the party list, that list is put up for a vote a member meeting, but
changes are rarely made at this stage.
Re-election in closed list PR systems occur when a person is placed high enough on the
electoral ballot to gain a seat in the assembly for an additional period. Failing to get re-elected
is either the consequence of a decision not to run – meaning that the politician is not placed on
the ballot at all – or being placed too far down on the ballot to attain a seat. Over time,
politicians gain seniority by being re-elected numerous times, climbing the electoral ballot
toward the most powerful positions at the very top. The further up a politician is placed, the
more powerful is his or her position within the party hierarchy (Folke et al. 2014).
As may be understood from the description of the selection procedure for the ballots,
gaining a slot with a high probability of election is not possible without elite support. The
elites dominate the nomination committees, both directly by being members and indirectly by
exerting influence, and they also co-ordinate the votes of the internal primaries. Rather than
being a “toss-up” in each election, the list nomination procedure is highly stable and
incumbent representatives have large advantages in retaining their positions.5 Perhaps most
importantly, there is a strong convention that the nomination committee approaches
candidates rather than the other way around. In a recent survey among candidates in the 2010
local election, 80% of the respondents said that they appeared on the ballot as a consequence
of "being asked and saying yes", a proportion that was even larger among more politicians
with longer experience (Järnbert 2013).6
5 Incumbent politicians gather experience at the job which should make them more desired for continued careers,
somewhat similar to the incumbency advantage commonly found in majoritarian elections (Schwindt-Bayer,
2004; Palmer and Simon, 2001).
6 The important role of party recruiters also exists in other contexts. For example, Fox and Lawless (2010)
analyze panel data on political ambition and recruitment among US citizens in “pipeline professions” (the most
common professions for political office holders). Following individuals over time, they find that the lower
average level of ambition among women could be fully explained by differences in the recruitment pattern.
Women were less likely to be recruited, recruited intensely, or recruited by multiple agents.

15
A Swedish local politician described the practice of the electoral committee in reaching
out to incumbent politicians for re-election as follows: “You ask and perhaps also try to
convince a specific person to be a candidate, but if there was someone that they did not see as
[desirable]… then you did not ask that person of course. You only reached out to the persons
that you desired” (Soininen and Etzler, 2006, p.128). Because re-election implies that a person
gains seniority and thereby also greater claim for a more influential appointment,
encouragement to run for re-election is closely linked with the perception that the politician is
an appropriate candidate for promotion.
The preference voting system deserves special mention with regard to politician's
election chances and parties' nomination procedures. About one third of the voters cast their
optional preference vote, and those who do largely cast it for one of the top persons on the
list. On average, more than one third of the votes go to the top ranked individual, a fact that
likely reflects the order effect found across contexts with open list systems (for a review of
this literature, see Blom-Hansen et al. 2015). Because of the low "turnout" in preference votes
and the voting for top politicians, it is rare that politicians further down on the electoral ballot
pass the vote threshold for a guaranteed seat which equals 5% of the party's total votes in
preference votes. Nevertheless, research has shown that the distribution of preference votes
among the top persons on the list is used to guide parties' future nominations for top positions
(Folke et. al 2014).7
7 In each election, roughly 20% of the nominated politicians clear this threshold, but 95% of these persons
already qualified for an assembly seat by their list rank. The result is that only 1% of the total elected politicians
received their seat through preference votes rather than list rank.

16
Data and Descriptive Statistics
Our data originate from party ballots kept by the Swedish Election Authority and cover all
political parties competing in six elections (1991 to 2010) and across 290 municipal councils.
In each election, about 55,000 politicians appear on a ballot and roughly 13,000 are elected.
The party ballots include personal identification numbers, which can be linked to a host
of background variables from the administrative registers of Statistics Sweden.8 This gives us
highly reliable information on income, education type and length, age, gender, occupation and
the number of children of all politicians in our dataset. These and other register variables are
available for the full sample period for each politician. This distinguishes our dataset from
other large panels of politicians which usually contain self-reported data from candidates at
the time point when they are running for office or are elected. Because we know what
happens in the individual’s life after he or she leaves elected office, we can account for events
that can drive voluntary drop-outs, such as having children.
Table 1 shows key descriptive statistics for elected municipal politicians, both for the
full sample and by gender. The sample excludes local parties and right-wing nationalist party
(the Swedish Democrats), restrictions that together exclude about 5% of the observations. In
our final sample, the average age is 50 years, one third holds a tertiary degree, and that one
third has at least one child between the age of 0-18. Male politicians are on average about two
years older on average, they have a higher average income, are less likely to have tertiary
education, and less likely to be parents of children aged 0-18.
8 Linking data is subject to an application process for ethics in research as well as judicial clearance.

17
Table 1. Summary statistics for elected politicians by gender, pooled data for 1991-2010.
Age Wage
Higher
education
Parent of child
of age 0-18
All 50 223.8 38 36
Women 48 201.1 42 38
Men 51 239.4 35 35
Figure 1 shows the development over time in the average share of elected women across
all 290 municipal councils. Using information about the list rank of every politician in every
election period we also plot the development in the share of women among the top ranked
individuals on all electoral ballots.
Figure 1. Share of elected women and share of women among top ranked candidates, 2006-2010.
Over our study period, the share of women in the municipal councils increased from 34% to
43%, an increase that was mainly driven by the introduction of a gender quota with a zipper
placement mandate in the largest political party, the Social Democrats, in 1993. Women's
share of the top ranked positions also shows a steady increase over the period, but the share
has consistently been at least ten percentage points below the share of women in the council
as a whole. Although women cleared the threshold of having more than four out of ten council
seats in 1994, the share of first ranked women has still not surpassed one third in 2010.

18
We use two main measures of career advancement, the event of re-election and the
event of being selected to the top position on the ballot. The use of re-election as a measure of
career advancement is motivated by the fact that seniority is the key determinant for reaching
the top appointments within a party group. The importance of re-election is closely linked to
the role of the party organization in distributing seats and positions of influence in the list PR
system. For individual politicians, there is essentially no other route to political influence than
through the party elites since top appointments such as mayor are made by the political parties
after the election. Over several re-elections, politicians climb the ladder that is the party list,
and eventually reach the top positions on the list and the top appointments.
We illustrate this fact in Figure 2. It shows the share of politicians that either i) hold the
top position on a ballot or ii) chair the council board, the municipal council, or a municipal
committee, among politicians with different numbers of total periods in office. For the second
outcome, we restrict the sample to eligible politicians, namely those belonging to a party in
the municipality’s governing coalition.
The figure shows that re-election is crucial for reaching positions of influence. Around
8% of the freshmen hold the top ranked position in their party group, and only 15% hold a
chair position. For each additional election period of experience, the share that holds a top
ranked position increases by on average 5 percentage points, while the share that holds a chair
position increases by 10 percentage points on average. This implies that the average politician
with four periods of seniority is more than three times as likely to hold both the top ranked
position and a chair position within the council as compared to a freshman.

19
Figure 2. Share of politicians who is the top ranked person on their party’s ballot and who holds a chair position
in the municipal council board, municipal council or committee, as a function of the total number of periods in
office.
In the empirical analysis we count being elected to the national parliament as the event
of being re-elected. The average number of elected municipal politicians that gain a seat in the
parliament is 60 persons per election period, which corresponds to 0.4% of those elected. This
addition does not affect our conclusions, but it controls for a gender difference in the rate of
promotions to the national parliament which could hypothetically have affected the analysis.
Our second main measure of career advancement is a binary indicator for holding the
top position on the ballot. This measure is an important complement to our measure of re-
election. While re-election is a factor that enables a politician to reach influential positions,
promotion to the top ranked position captures the event of actually making it to the very top.
We can use data on appointments for the 2006 and 2010 elections to verify this claim. In nine
cases out of ten, the chairperson of the municipal council board is the top-ranked person in the
largest political party of the governing majority. In eight cases out of ten, the vice chairperson
is the top-ranked person from another party, usually the largest opposition party.

20
In addition to our two main measures, we also add two supplementary measures of
career advancement which explicitly take the mechanics of re-election into account. For
clarity, we distinguish between those i) who did not get re-elected because they did not re-
appear on the list and those ii) who did not get re-elected but did re-appear (often with a lower
rank order). It may be tempting to categorize the people who did not re-appear as having
exited politics voluntary. The problem with this interpretation is that moving a person
downward on a ballot is controversial and is usually not done without that person’s
permission and good relations with the party elite ("I drop out but continue to support the
party by letting them use my name on the ballot"). If there is instead a conflict with the elite,
or a person is not encouraged to run again, that politician is likely to leave the list altogether.
With this caveat in mind we will show our analysis for the sub-divided re-election measure.
Table 2 shows descriptive statistics for each of our four outcome variables by gender
and election period. The upper pane contains the statistics for re-election, followed by the two
sub-measures of re-election. The lower pane contains the share of politicians that become top
ranked in the next election.
Table 2. Descriptive statistics for four measures of political career advancement, by gender and election period,
1991-2006.
Full 1991 1994 1998 2002 2006
Re-elected Women 53.3 59.5 50.2 51.0 52.7 56.7
Men 57.0 59.6 55.0 56.1 57.3 54.2
Retained Women 69.8 74.7 65.4 65.6 70.5 73.7
Men 74.1 76.4 71.8 71.8 75.3 75.7
Re-elected Women 76.9 79.6 77.7 77.1 74.9 73.6
if retained Men 76.4 77.9 76.7 78.1 76.1 74.9
Top Ranked Women 9.0 9.6 7.8 9.0 9.0 9.6
Next Election Men 14.4 14.1 14.0 14.6 14.5 14.1
Notes: To be retained is defined as remaining on the electoral ballot. To be elected is to get one of the party's
seats in the municipal council.

21
Men are on average 3.7 percentage points, or 7 percent in relative terms, more likely to
be re-elected than women are. Since this difference applies to each election period, the
average gender difference in total accumulated seniority becomes substantial over time. The
average man has a 14 percent greater probability of remaining an elected politician for two
election periods, and a 40 percent greater probability to remain in office for five periods.9 A
seemingly small average gender difference in re-election rates thus translates into a dramatic
difference in accumulated seniority among men and women in the political body over time.
There is a substantial variation of the gender differences in re-election rates across
election periods. The year that stands out is 1991. Women who were elected in this year had a
higher likelihood of being re-elected in the next election than their male colleagues, a
situation that can be attributed to the fact that both the Social Democrats and the Left Party
introduced centrally mandated gender quotas with placement mandates in the 1994 election.
For our second main outcome, becoming top ranked in the next election, the gender
difference is even larger and quite constant over time. The average man has a 14.4 percent
probability of becoming top ranked in the next election, while the average women only has a
9 percent probability. This implies that the average man is more than 50 percent more likely
to become top ranked compared to the average woman.
To measure political competition we draw on the fact that Swedish politics is centered
around two stable left- and right-wing blocks and has therefore been classified as a bipartisan
political system (Alesina et al., 1997). This makes the absolute difference in vote shares
between the two blocks an appropriate measure for the main dimension of political
competition (for previous use of this measure, see Svaleryd and Vlachos, 2009). We use a
9 For five periods, compare the probability for women (0.533^5 = 0.0043) to the probability for men (0.570^5 =
0.060), which is 6.0/4.3 = 1.40.

22
three-year moving average of the absolute difference in vote shares to capture persistent
political climates rather than occasional competitive elections.
The suitability of our measure can be motivated as follows. First, governing coalitions
across the traditional blocks are uncommon, existing in less than one fifth of the cases when
one block holds a majority of the seats but no single party has more than 50 percent of the
votes. Second, previous research on Swedish municipalities has found a causal effect of
majority positions of political blocks on political outcomes (Pettersson-Lidbom, 2008).
To take into account the fact that, after all, coalition formation along the right-left divide
is not always binding, we also construct an alternative competition measure based on the
margin of electoral victory of the actual governing coalition in each municipality. We
measure the margin of victory, 50 percent minus the total vote share of the coalition parties.
These data are available from the 1994 election onward, so no moving average is used. In
order to interpret higher values of both our two competition measures as more competition, all
vote margins are expressed in negative values.
There is a large amount of variation in both of our competition measures, both across
and within municipalities. The standard deviation of our first competition measure is 12.5
percentage point, and the standard deviation of the second measure is 7.5 percentage points.
After subtracting the average level of competition within each municipality, we are still left
with standard deviations of 7.5 and 5.5 percentage points, respectively. The reason for this is
that the political climate in Sweden has shifted over the sample period to cause substantial
shifts in the political environments within municipalities over time.10
10 Over the past decades the Swedish political climate has shifted away from Social Democratic dominance
toward a more competitive environment. After having Social Democratic governments for most of the post
WWII period, the center-right coalition came to power at the national level in 1991-1994, and again won power
more recently in 2006-2014. A corresponding wave of center-right voting swept across the municipalities,
pushing some Social Democratic strongholds in a more competitive direction and having the opposite effect on

23
Although we cannot directly measure voter demand for gender balance in the
composition of the party leadership we can use the distribution of preference votes to
approximate if the preference voters favor women or men on party ballots. However, this
measure comes with the important caveat that preference votes obtained by a candidate is not
only a function of voter demand but also a function of the party’s support of a candidate. This
support can amount in media appearances, better confidence, a higher list placements, or other
factors that in themselves generate preference votes via name recognition or a ballot order
effect.
With this caveat in mind we compare the average proportion of preference votes for a
local party that was obtained by men and by women in our estimation sample and in the post
1998 period. The average male politician receives 9.5 percent of the preference votes and the
average female politician receives 6.8 percent. When we instead compare only men and
women who hold the same list rank, more than half of this difference disappears. Given these
circumstances, the average man receives 1.2 percentage points more preference votes than the
average women. The exact regression results are showed in the Appendix (Section A1). We
cannot determine if the remaining difference in vote support can be attributed to internal party
factors or to "exogenous" voter support, but we will come back to this the gender difference
when we interpret our main results below.
Empirical Strategy and Main Results
The goal of our empirical analysis is to examine if political competition has a positive impact
on women´s political careers relative to men’s. We start by estimating the regression equation
places with an initially strong center-right base. As an illustration of the substantial shifts in power that took
place over our study period, the number of municipalities with left-wing rule went from 31% in 1991 to 73% in
1999, only to then drop back down to 59% in 2002 and 41 % in 2006.
24
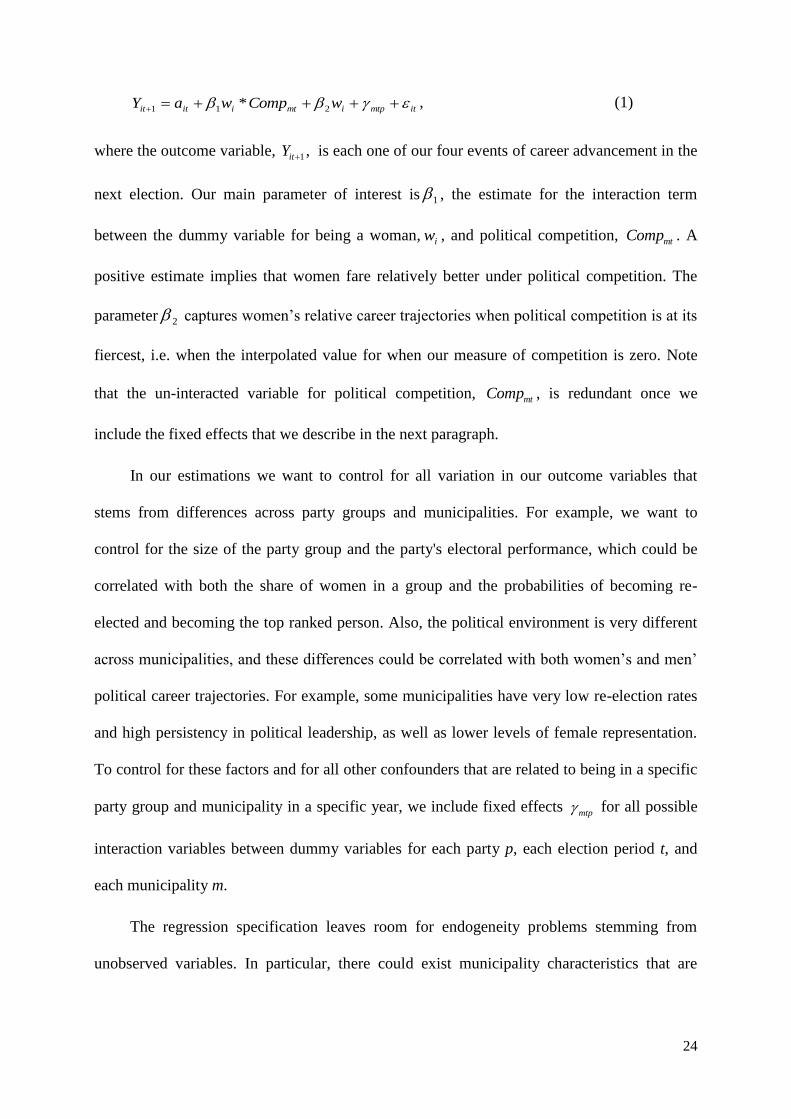
itmtpimtiitit wCompwaY 211 * , (1)
where the outcome variable, 1itY , is each one of our four events of career advancement in the
next election. Our main parameter of interest is 1 , the estimate for the interaction term
between the dummy variable for being a woman, iw , and political competition, mtComp . A
positive estimate implies that women fare relatively better under political competition. The
parameter 2 captures women’s relative career trajectories when political competition is at its
fiercest, i.e. when the interpolated value for when our measure of competition is zero. Note
that the un-interacted variable for political competition, mtComp , is redundant once we
include the fixed effects that we describe in the next paragraph.
In our estimations we want to control for all variation in our outcome variables that
stems from differences across party groups and municipalities. For example, we want to
control for the size of the party group and the party's electoral performance, which could be
correlated with both the share of women in a group and the probabilities of becoming re-
elected and becoming the top ranked person. Also, the political environment is very different
across municipalities, and these differences could be correlated with both women’s and men’
political career trajectories. For example, some municipalities have very low re-election rates
and high persistency in political leadership, as well as lower levels of female representation.
To control for these factors and for all other confounders that are related to being in a specific
party group and municipality in a specific year, we include fixed effects mtp for all possible
interaction variables between dummy variables for each party p, each election period t, and
each municipality m.
The regression specification leaves room for endogeneity problems stemming from
unobserved variables. In particular, there could exist municipality characteristics that are

25
correlated both with the level of competition and with women's relative career prospects, a
concern that is addressed further down in this section.
Our extensive fixed effects structure prohibits the use of a Probit model to estimate the
specification in equation (1). Instead, we use a simple OLS model. If we use a specification
without the fixed effects, the OLS and Probit specifications give essentially the same results11.
In all specifications, we make an important sample restriction by excluding all
observations from a specific party in the election when it introduces a gender quota with a
placement mandate.12 The reason for this is the immediate and “mechanical” advantage that
the quota gives to women in that year. As a second sample restriction we drop party groups
with less than three elected politicians to allow our career advancement variables to reflect at
least a minimal status difference within the party group. Standard errors are clustered at the
municipality level to reflect the unit of observation for our competition variable.
Our main results are presented in Table 3. For each outcome variable, we show the
results for using each of the measures of political competition. In the odd numbered columns,
we use the block difference in votes, and in the even numbered columns, we use the victory
margin for the governing coalition. The upper pane contains the results for the main
outcomes, re-election (columns 1 and 2) and being top-ranked (columns 3 and 4). The lower
pane contains the results for the event of being retained on the ballot (columns 1 and 2) and
the event of being re-elected conditional on retainment (columns 3 and 4).
11 These results can be provided by the authors upon request. 12 The Social Democrats in 1991, the Left Party in 1991 and 1994, and the Green Party in 1994.

26
Table 3. OLS estimates for the relationship between electoral competition and gender differences in career
advancements, 1991-2010.
Competition Measure:
Block Diff.
in Votes (1)
Ruling Block
Win Margin (2)
Block Diff.
in Votes (3)
Ruling Block
Win Margin (4)
Re-Election Top Ranked
Next Election
Woman -2.57 -2.78 -4.37 -3.86
(0.83) (0.77) (0.62) (0.53)
Woman * Competition 10.84 25.69 2.92 9.78
(4.21) (7.08) (2.74) (4.36)
Observations 52,330 38,640 52,330 38,640
Retention Conditional
Re-Election
Woman -3.20 -3.34 -0.01 0.09
(0.78) (0.78) (0.78) (0.74)
Woman * Competition 9.30 19.74 4.86 16.84
(3.75) (7.11) (3.77) (7.25)
Observations 52,330 38,640 37,670 27,680
Election Sample 91-2010 94-2010 91-2010 94-2010
Notes: Parentheses contain robust standard errors clustered at the municipality level. All coefficients are scaled
up by 100 to let the point estimates be interpreted as 1.0 = 1 percentage point. All specifications include fixed
effects for the interaction of year, municipality and party. All observations from a political party are dropped in
the year that it introduced a gender quota, and the sample is restricted to party groups with at least two members.
The main take-away from Table 3 is that there is less gender inequality in career
advancement under more fierce electoral competition. This is shown by the large, positive,
and statistically significant estimates of the interaction term between political competition and
the binary indicator for being a woman, which we find for both of our two main measures of
career advancement. The results are somewhat stronger for re-election than for holding the
top position, but overall they strongly suggest that women’s career trajectories relative to their
male colleagues’ trajectories improve when the two political blocks are more equal in size
(columns 1 and 3), and when the governing majority has a less dominating hold on power
(columns 2 and 4).

27
The size of the point estimates for the main career measures can be interpreted as
follows. First, consider that the average difference in vote shares between the right- and left-
wing block has a standard deviation of 12.5 percentage points. The point estimate for the re-
election outcome, 10.84 in column 1, hence means that increasing competition by one
standard deviation raises the relative re-election probability of women by almost 1.5
percentage points. Thus a one standard deviation increase our first in political competition
would decrease the average difference between men’s and women’s re-election rates with a
third. For the top-ranked position, the same calculation shows that one standard deviation of
increased competition reduces women's disadvantage by 0.5 percentage points, one eigth of
the average gap. For our second measure of competition the point estimates in relationship to
the standard deviation of 7.5 percentage points suggests an even larger role of political
competition in reducing women’s disadvantage.
Given that the average probability of reaching the top position is smaller than that of
being re-elected, the size of the point estimates suggests that the relative impact of
competition is even larger for this outcome.
The results in the lower pane clearly show that the positive relationship between
women’s relative re-election rate and political competition stems both from a smaller gender
difference in leaving the list and a smaller difference in being given a low rank on the list,
conditional on re-election. In particular, the relationship between competition and retention is
significant for both measures of competition. For re-election conditional on retention, the
statistical relationship is only significant for our second competition measure. Together, these
results suggest that the gender difference in exits from the list is smaller under competition,
and that women who remain on the list are less likely to be moved down to lower positions
relative to their male colleagues when competition is fiercer.

28
To address the concern that our results above could be confounded by municipality
characteristics that are correlated both with political competition and with women´s relative
career opportunities, we use two additional specifications. The first relies on control variables
and the second on relies on municipality fixed effects. To save space, these results are shown
for our two main measures of career advancement.
We first add controls for municipal characteristics that may be correlated both with the
level of political competition and with the gender difference in career advancements. Controls
are selected based on previous work on women's numerical representation in elected
assemblies and in the executive branch. Prominent variables in this literature are district
magnitude (e.g. Studlar and Welch, 1991, and Matland, 1993), women's labor force
participation (Matland, 1998), women's socioeconomic status (Reynolds, 1999; Kenworthy
and Malami, 1999), cultural norms regarding gender equality (Inglehart and Norris, 2001;
Tripp and Kang, 2008), and party ideology (Davis, 1997; Thiebault, 1991)
Several variables are chosen to reflect this body of work. Dummy variables for council
sizes are used to control for district magnitude, and another dummy variable captures if the
party is a left wing party. To control for other social factors we build on geographical research
on Sweden which has argued that women’s political representation is highly correlated with
regional cultural differences in women's social and economic emancipation (Forsberg,
1997).13 Based on this we include a set of dummy variables for municipality type according to
the official classification provided by the Swedish Association of Local Authorities and
Regions. The six types are the average (benchmark) type, large city, suburban city, mid-size
city, sparsely populated area, rural area, or industrial or mining town. We also control for the
13 This research has concerned so-called local "gender contracts" with three levels of attitudes toward gender
parity on the labor market and in the family. Places with progressive gender contracts are characterized by
gender parity in education levels, labor market participation and family relations. The theory also expects
women's participation in politics to correlate positively with these factors.
29
average income differential between men and men in the municipality, a variable that captures
both labor force participation and the raw gender wage gap.
When we include our control variables we interact each one with the binary indicator for
female sex. This allows us to effectively control for the relationship between the municipality
characteristics, or party ideology, and women’s relative career opportunities. Reporting the
results, we omit the un-interacted female dummy since this estimate becomes difficult to
interpret after adding the numerous interaction terms. As in the case with the competition
variable, we cannot include the un-interacted variables for our municipality characteristics.
These variables have no variation at the level of our fixed effects, i.e. within the party-
municipality-election period cell.
A second approach to controlling for municipality characteristics relies on municipality
fixed effects. In the baseline specification we already include fixed effects for the interaction
of municipality, party and year. However, this does not capture that fact that there might be an
unobserved municipality characteristic that is correlated with both competition and women´s
career prospects. To account for the unobserved municipality characteristics that are constant
over time but which might give women a differential promotion chance, we interact the
municipality fixed effect with the binary indicator of for being a woman for all politicians in
that municipality. This specification is highly demanding of the data because it relates
differential career advancements between men and women within a municipality to changes
in the level of competition within that same municipality only. Also, recall from the
discussion of our competition measure that the within municipality variation in political
competition is roughly 30 percent smaller than the overall variation in the variable.

30
Table 4. OLS estimates for the relationship between electoral competition and gender differences in career
advancements, 1991-2010, including municipal level control variables.
Competition Measure:
Block Diff.
in Votes (1)
Ruling Block
Win Margin (2)
Block Diff.
in Votes (3)
Ruling Block
Win Margin (4)
Re-Election Top Ranked
Next Election
Woman*Competition 8.90 23.68 3.37 7.14
(4.52) (6.91) (2.76) (4.21)
Woman*Municipal Controls yes yes yes yes
Woman*Party Left Ideology yes yes yes yes
Observations 52,184 38,528 52,184 38,528
Woman * Competition 13.42 22.95 -3.15 4.98
(7.00) (8.98) (5.40) (5.22)
Woman*Municipality FE yes yes yes yes
Observations 52,330 38,640 52,330 38,640
Election Sample 91-2010 94-2010 91-2010 94-2010
Notes: Parentheses contain robust standard errors clustered at the municipality level. See Table 3 for additional
details
The results are reported in Table 4. In the upper pane, the results for the control variable
approach show that our baseline findings are barely affected by including relevant controls for
municipal characteristics. This is true for both of our main outcome variables. Although the
point estimates shrink slightly in size, the estimates that were statistically significant in the
baseline specification remain so in this specification.
The bottom pane shows that the baseline findings for our first outcome also hold up for
the demanding specification in which we include the interaction of the binary indicator for
female gender with municipality fixed effects. Again, the estimates shrink in size, but the
changes are larger than in the previous case. This is likely because we are using only a subset
of the overall variation of competition. Given that this specification captures impacts on
women's relative careers from changes in the political climate within the municipality, it is
perhaps not surprising that we see a larger reduction of the estimate for making it to the top of
the party group than for the estimate of re-election. Arguably, the re-election probability is
31
more sensitive to changes within the municipality compared to the probability of making it to
the top of the party group, an outcome that requires career advancement over several election
periods and make the latter more likely to be observed in a comparison of levels of
competition across municipalities.
In sum, the observation that our baseline results hold up for these two ambitious
approaches to controlling for municipality characteristics make us confident that our results
are not driven by municipality characteristics other than political competition.
Competition and the Supply of Politicians
We continue our analysis by exploring the possible that the relationship between political
competition and women’s relative career advancements is driven by gender differences in the
supply of politicians. If the women who come forth to seek higher political appointments in
competitive contexts are more motivated, more qualified, or have life situations that are less
constraining for their political careers relative to their male colleagues, this could explain the
results in the previous section.
We test this supply mechanism in two ways. The first test draws on our extensive
dataset for the social characteristics of our politicians. We introduce a vector of control
variables for both individual qualifications and life situations that would make politicians
more or less likely to be actively promoted by the party or to opt out of their political careers.
If our main results are driven by different women and men coming forth as candidates under
competition, the baseline results should disappear at the introduction of these controls. Further
down in this section we perform a second test in which we use unique and comprehensive
survey data to examine if there exists a gender difference in the stated career ambitions of
elected men and women that can account for our findings.

32
We divide the individual level controls into two groups: observable qualifications
(quality), and life situations that would lead the politician to leave his or her career for
personal reasons. We provide a brief description of the variables here and refer the reader to
the appendix, Table A2, for a full list.
There is a rapidly evolving empirical literature on the quality of politicians. With our
rich data, we can include controls for the four most commonly used measures of quality in
this literature. The most common measure is a politician's number of years of education,
which is argued to capture enhanced practical skills, signaling ability, or civic engagement
(see, for example, De Paola and Scoppa, 2011; Galasso and Nannicini, 2011; Schwindt-Bayer
2011; Franceschet and Piscopo, 2012). The second measure relies on occupational choices,
departing from the view that individuals with certain occupation-related skills will perform
better or worse as politicians (Messner and Polborn, 2004).14 We measure this with dummy
variables for the employment sector of the politician (at the 2-digit industry level). The third
measure is political experience, a measure mainly used in the U.S. context (for example; Cox
and Katz, 1996; and Hirano and Snyder, 2013). We measure experience with a dummy
variable for incumbency and with fixed effects for the politician’s current list rank. The fourth
measure is the annual income of the politician, following previous studies that have
approximated quality with private wealth and/or wages (e.g. Ferraz and Finan, 2011).
Finally, we use the competence measure developed by Besley et al. (2013), which
exploits data on the local politicians’ earnings on the labor market. It assumes that
competence can be gauged from average income differences (over 20 years) between people
with the same education, occupation, age, and gender. Besley et. al. (2013) show that this
14 Some jobs are viewed as more relevant for the political profession, such as the so-called "pipeline professions"
from which U.S. politicians often come: lawyers, business executives, professors, and secondary school teachers
(Lawless and Fox, 2010). Many studies have tended to add public employment to this list (see, for example, De
Paola and Scoppa, 2011; Schwindt-Bayer, 2011). Others have classified some jobs as “brokerage jobs” or
“politics-facilitating occupations” such as teacher, journalist, government official and political researcher and
argued that people with these occupational backgrounds have a number of subjective personal characteristics
which increase the odds of being selected by the party (Norris and Lovenduski, 1995).

33
measure of competence is strongly associated with individual political success, while Folke et
al. (2014) show that is positively correlated to preference vote support.
Next, we define the control variables for life situations that may trigger a politician to
opt out of politics. To provide guidance on the relevant factors, we rely on a survey from the
early 2000s that targeted all Swedish municipal politicians who left their elected seats before
completing their term in 28 randomly selected municipal assemblies. The three most common
reasons for dropping out were moving away from the municipality (21% of the respondents),
changes in the private labor market situation (16%), and family-related reasons (10%)
(Nielsen, 2001). We control for these factors as well as for the potential heterogeneous impact
of children on women’s career choices (see Appendix Table A2 for further details).
In addition to the above control variables, we control for age, which could be seen both
as a qualification (middle age) and a determinant of the willingness to stay in office (for
senior citizens in particular).15 Finally, we control for immigrant status since immigrants can
face the same type of career obstacles as women. The results for adding the individual level
controls are shown in Table 5, following exactly the same structure as the previous Tables 3
and 4.
15 As emphasized by Davis (1997), family responsibilities may delay women's entry into politics. This makes
them more likely to be older than the "right" age bracket when they reach the necessary level of experience for a
top position.

34
Table 5. OLS estimates for the relationship between electoral competition and gender differences in career
advancements, 1991-2010 and including individual level control variables.
Competition Measure:
Block Diff.
in Votes
(1)
Ruling Block
Win Margin
(2)
Block Diff.
in Votes
(3)
Ruling Block
Win Margin
(4)
Re-Election Top Ranked
Next Election
Woman -1.47 -2.18 -1.20 -1.46
(0.99) (0.95) (0.46) (0.48)
Woman*
Competition 10.78 21.91 4.56 7.50*
(4.16) (7.51) (2.05) (4.16)
Children 2.96 2.85 1.34 1.45
(0.75) (0.84) (0.47) (0.53)
Woman*Children -3.29 -3.24 -1.87 -1.54
(1.09) (1.19) (0.63) (0.72)
Years of Education 0.31 0.37 0.18 0.16
(0.09) (0.11) (0.06) (0.06)
Previously Elected 1.69 1.27 0.29 0.11
(0.61) (0.68) (0.32) (0.35)
Individual Level yes yes yes yes
Observations 46,873 34,568 46,873 34,568
Retention Conditional
Re-Election
Woman -2.12 -2.16 0.57 -0.42
(0.89) (0.94) (0.96) (0.90)
Woman*
Competition 8.24 15.28 6.82 14.47
(3.57) (7.07) (3.92) (7.55)
Children 1.53 1.46 2.03 2.11
(0.68) (0.79) (0.75) (0.88)
Woman*Children -2.66 -3.07 -1.63 -1.33
(0.96) (1.03) (1.11) (1.25)
Years of Education -0.08 0.03 0.52 0.53
(0.08) (0.10) (0.11) (0.13)
Previously Elected -0.87 -0.76 2.84 2.10
(0.49) (0.58) (0.70) (0.79)
Individual Controls yes yes yes yes
Observations 46,873 34,568 33,618 24,650
Election Sample 91-2010 94-2010 91-2010 94-2010
Notes: Parentheses contain robust standard errors clustered at the municipality level. Definitions of the controls
are listed in the Appendix. See Table 3 for additional details
Table 5 shows that our baseline estimates are not explained by differences in individual
level characteristics between men and women. In fact, the results for the interaction term
between women’s career opportunities and political competition are strengthened as we

35
introduce the individual level controls. As we include the estimates are statistically significant
for all four outcomes and both definitions of political completion.
Nevertheless, the fact that the introduction of these control variables only has a marginal
effect on the size of the estimate on the interaction term between female sex and competition
does not mean that they are unimportant for explaining women’s relative career trajectories.
This can be seen by examining the estimates for the independently included dummy variable
for female sex, which is substantially reduced when we include the controls. Due to space
constraints, we only show the estimates for four of the control variables here, namely having
children, the interaction between having children and gender, years of education and being an
incumbent and instead refer the reader to Table A4 in the online Appendix for the full set of
control variables.16
For the role of differential family responsibilities between men and women, we can see
that these play a key role in explaining women’s career disadvantage relative to men. The
point estimates between being a woman and having children for each of the outcomes
suggests that the relative career disadvantage for women is twice as large for those that have
children as for those without children. This can be attributed to a lower relative retention rate
for women with children. The un-interacted point estimates for having children suggest that
men with children do not seem to suffer any disadvantage in their careers.
The estimates for education both have the expected positive signs. The size of these
point estimates helps us put the estimated disadvantage of women into context. The estimate
of women’s average career disadvantage is of about the same as that of having ten years less
education. Finally, the estimate for incumbency status is very small. However, this does not
16 Out of all of our individual controls, it is the control for the differential childrearing responsibilities that by far
matters the most in explaining the overall difference in re-election rates between women and men. This control
variable alone can explain about a third of the overall difference. The key explanatory factors for the difference
in the probability of reaching the top position on the ballot are current list rank and previous political experience.

36
say that incumbents do not hold a large career disadvantage. It is simply due to the fact that
incumbency has already been factored into the current list rank, which we also control for.
Next, we examine survey data for self-reported ambitions among male and female
politicians. The purpose is, once more, to check if a supply of more ambitious female
politicians in high-competition municipalities can explain our results. The survey was sent to
all 13,000 municipal politicians in year 2012 and reached a response rate of almost 80%.
Amongst other things, it explicitly asked the following question: “For how long to you wish
to remain an elected representative?”. The four response categories were: (1) “Shorter than
the current election period”, (2) “Only until the end of the current election period”, (3) “The
current and the next election periods”, and (4) “Many more periods”. In Figure 3, we show the
share of men and women that selected each option.
Figure 3. Ambition to remain in office by gender. The number states the share of respondents the have chosen
each category by gender.
0.01
0.26
0.45
0.27
0.02
0.27
0.45
0.26
0.1
.2.3
.4.5
Men Women
I would like to remain an elected representative for...
... less than the current term ... the current term only
... the current term and the next ... many terms
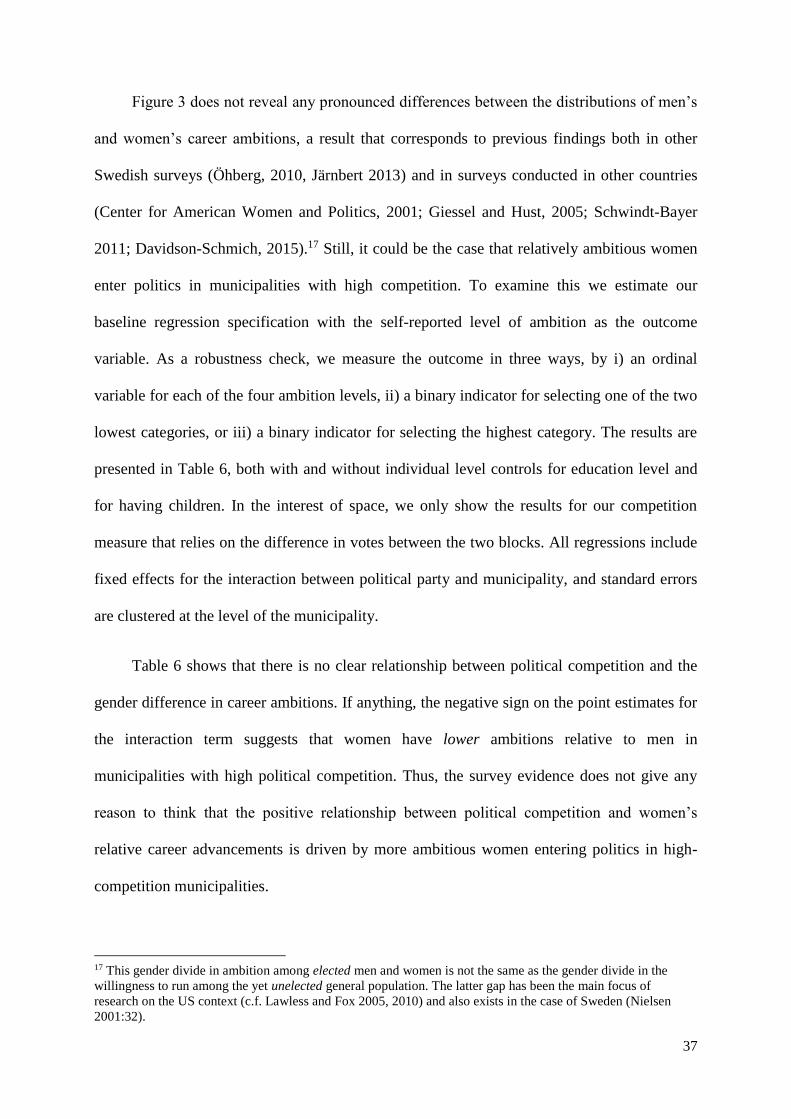
37
Figure 3 does not reveal any pronounced differences between the distributions of men’s
and women’s career ambitions, a result that corresponds to previous findings both in other
Swedish surveys (Öhberg, 2010, Järnbert 2013) and in surveys conducted in other countries
(Center for American Women and Politics, 2001; Giessel and Hust, 2005; Schwindt-Bayer
2011; Davidson-Schmich, 2015).17 Still, it could be the case that relatively ambitious women
enter politics in municipalities with high competition. To examine this we estimate our
baseline regression specification with the self-reported level of ambition as the outcome
variable. As a robustness check, we measure the outcome in three ways, by i) an ordinal
variable for each of the four ambition levels, ii) a binary indicator for selecting one of the two
lowest categories, or iii) a binary indicator for selecting the highest category. The results are
presented in Table 6, both with and without individual level controls for education level and
for having children. In the interest of space, we only show the results for our competition
measure that relies on the difference in votes between the two blocks. All regressions include
fixed effects for the interaction between political party and municipality, and standard errors
are clustered at the level of the municipality.
Table 6 shows that there is no clear relationship between political competition and the
gender difference in career ambitions. If anything, the negative sign on the point estimates for
the interaction term suggests that women have lower ambitions relative to men in
municipalities with high political competition. Thus, the survey evidence does not give any
reason to think that the positive relationship between political competition and women’s
relative career advancements is driven by more ambitious women entering politics in high-
competition municipalities.
17 This gender divide in ambition among elected men and women is not the same as the gender divide in the
willingness to run among the yet unelected general population. The latter gap has been the main focus of
research on the US context (c.f. Lawless and Fox 2005, 2010) and also exists in the case of Sweden (Nielsen
2001:32).

38
Table 6. OLS estimates of the relationship between competition and the gender difference in self-reported career
ambitions.
(1) (2) (3) (4) (5) (6)
Ordinal Low Ambitions High Ambitions
Woman -0.060 -0.058 0.020 0.022 -0.031 -0.026
(0.033) (0.033) (0.018) (0.019) (0.020) (0.020)
Woman * Competition -0.419 -0.332 0.051 0.059 -0.347 -0.244
(0.451) (0.444) (0.264) (0.278) (0.272) (0.265)
Constant 2.985 2.834 0.274 0.287 0.273 0.123
(0.009) (0.040) (0.005) (0.024) (0.005) (0.022)
Individual Level Controls yes
yes
Yes
Observations 9,244 8,244 9,244 8,244 9,244 8,244
Notes: Parentheses contain robust standard errors clustered at the municipality level. All regressions include
fixed effects for municipalities interacted with fixed effects for political parties. The sample is restricted to party
groups with at least three elected politicians, and local parties and the Sweden Democrats are excluded.
Competition and the Candidate Selection Process
Based on our conceptual framework we argue that the positive relationship between political
competition and women’s probability of political career advancement can be attributed to
characteristics of the party's candidate selection process. In this section we provide two tests
to test this mechanism.
We target two specific characteristics of the local parties' nomination procedures and
rely on the same survey data as in the previous section. The first characteristic captures the
importance of two specific selection criteria. On a scale between 1 (very unimportant) to 5
(very important), respondents were asked to rank the importance of "competence" and
"connections" for securing a safe seat on their party's ballot. Table 7 presents the results for
testing if the rankings of these two criteria co-vary with the level of competition (columns 1
and 3) and by gender and competition (columns 2 and 4).
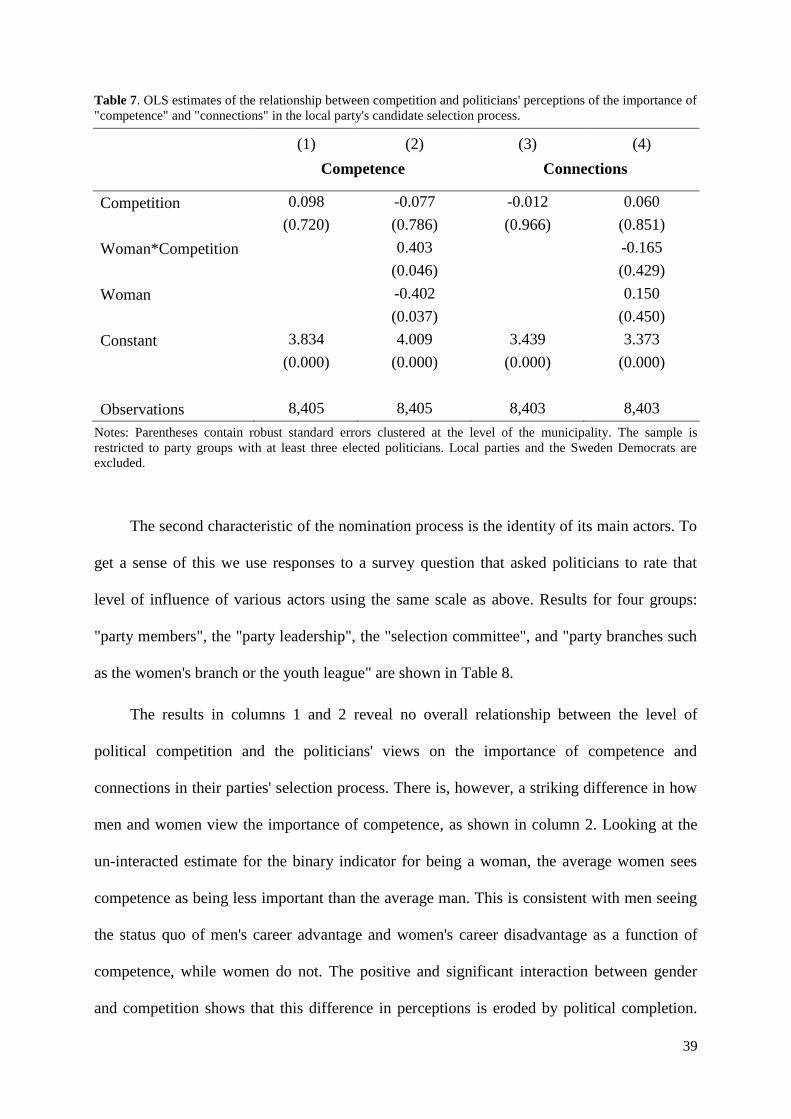
39
Table 7. OLS estimates of the relationship between competition and politicians' perceptions of the importance of
"competence" and "connections" in the local party's candidate selection process.
(1) (2) (3) (4)
Competence Connections
Competition 0.098 -0.077 -0.012 0.060
(0.720) (0.786) (0.966) (0.851)
Woman*Competition 0.403 -0.165
(0.046) (0.429)
Woman -0.402 0.150
(0.037) (0.450)
Constant 3.834 4.009 3.439 3.373
(0.000) (0.000) (0.000) (0.000)
Observations 8,405 8,405 8,403 8,403
Notes: Parentheses contain robust standard errors clustered at the level of the municipality. The sample is
restricted to party groups with at least three elected politicians. Local parties and the Sweden Democrats are
excluded.
The second characteristic of the nomination process is the identity of its main actors. To
get a sense of this we use responses to a survey question that asked politicians to rate that
level of influence of various actors using the same scale as above. Results for four groups:
"party members", the "party leadership", the "selection committee", and "party branches such
as the women's branch or the youth league" are shown in Table 8.
The results in columns 1 and 2 reveal no overall relationship between the level of
political competition and the politicians' views on the importance of competence and
connections in their parties' selection process. There is, however, a striking difference in how
men and women view the importance of competence, as shown in column 2. Looking at the
un-interacted estimate for the binary indicator for being a woman, the average women sees
competence as being less important than the average man. This is consistent with men seeing
the status quo of men's career advantage and women's career disadvantage as a function of
competence, while women do not. The positive and significant interaction between gender
and competition shows that this difference in perceptions is eroded by political completion.

40
Our interpretation of these results is that they support the idea that competition pushes parties
to promote the most competent politicians irrespective of gender.
For the importance of connections (see columns 3 and 4) the point estimates show a
pattern that corresponds to the interpretation above, although the estimates are all far from
statistical significance. Women view connections as being a more important selection
criterion, but this differences is eroded by political competition.
Table 8. OLS estimates of the relationship between competition and politicians' perceptions
of the influence of actors in the local party's candidate selection process.
(1) (2) (3) (4)
Party members Party Leadership
Competition 0.198 0.054 -0.374 -0.381
(0.534) (0.866) (0.443) (0.425)
Woman*Competition 0.329 0.015
(0.182) (0.957)
Woman -0.303 0.000
(0.197) (1.000)
Constant 3.871 4.004 3.353 3.354
(0.000) (0.000) (0.000) (0.000)
Observations 8,402 8,402 8.403 8.403
Selection Committee Party Branches
Competition 0.199 0.189 0.879 0.856
(0.566) (0.616) (0.024) (0.026)
Woman*Competition
0.020 0.050
(0.932) (0.838)
Woman 0.026 -0.018
(0.908) (0.939)
Constant 3.770 3.760 1.786 1.795
(0.000) (0.000) (0.000) (0.000)
Observations 8.403 8.403 8,402 8,402
Notes: Parentheses contain robust standard errors clustered at the level of the municipality.

41
The results from Table 8 are easily summarized when it comes to statistically significant
relationships. The only group that is viewed as having more power in the candidate selection
process under political competition is party branches, where the women’s and youth sections
are explicitly mentioned in the survey question. This is consistent with the idea that the parties
strive to promote most competent candidates irrespective of socioeconomic characteristics. If
parties want to promote the most competent candidates from political minorities it is of course
natural to let the party branch representing those minorities to have a larger say in the
nomination procedure.
8. Conclusions
This paper builds on the insight from previous research that the representation of different
social groups is determined not by the voter casting her or his ballot, but by the political
parties selecting their candidates to stand for election (see e.g. Darcy et al. 1994; Htun 2005;
Soininen and Etzler 2006, Bjarnegaard 2012). We have shown that party behavior in choosing
women for top appointments is strongly affected by the level of political competition. Using
survey data, the improvement in gender equality under competition was linked to two factors
in the nomination process: a stronger focus on competence as a selection criterion and a
stronger role of party fractions such as the women's branch in the selection process. We could
also reject the explanation that more ambitious women, or more high-quality female
politicians, emerge as political candidates in competitive contexts.
Overall, our results support the economic intuition that parties, like private firms, are
pushed to improve the efficiency of their "human resource management" under fiercer
competition. For nominations, this means to retain and promote the most productive
individuals. When competition is low, parties can disregard efficiency and allow a top-down
selection procedure with a weaker competence focus. The consequence of these behaviors is

42
vertical inequality, a situation where the combined power and influence of the elected women
falls short of their numerical presence in the party group.
Can voter demand explain out results? We would argue that this could indeed be the
case, both in a direct and in an indirect sense. Our descriptive statistics showed that Swedish
preference votes are distributed in a way that is slightly biased against female representatives.
This is consistent with a smaller career disadvantage of women under competition than in
places where parties are less constrained by voter preferences. We also argue that voters push
parties to favor women in a more indirect sense by demanding more competent politicians.
Our paper adds to the growing literature that has tied political competition to better
economic outcomes of the political process and higher quality of the elected politicians. We
show that more competition is also related to improved career prospects for political
minorities. This is an important result in itself as equal participation in politics is commonly
viewed as a fundamental human right, an idea formally recognized by the UN resolution
66/130 on “Women and Political Participation”. Our results show that there is no trade-off
between competitive elections and women's access to top positions, something that could
arguably have been expected if women "shy away from competition".
Our results highlight the possibility that the link between competition and minorities'
access to political power could be an explanation for the finding that competition improves
policy outcomes. Previous work has documented that women and men make different policy
priorities (see, for example, Chattopadhyay and Duflo, 2004; Swers 2002; Vega and
Firestone, 1995; Svaleryd, 2009), but also that women leaders spend public resources more
efficiently (Beaman et al. 2010). In addition, the social composition of the political elite that
forms the decision making body could have its own independent effect on policy (Alesina and
Ferrara, 2005). An interesting avenue for future work is to further study the link between
competition, minority representation, and various types of policy outcomes and priorities,

43
responding also to the call for an increased focus on both "critical actors" and "critical acts" in
studies of minorities' impacts on political processes (i.e. Childs and Krook, 2009).
Finally, it is worthwhile to consider the Swedish evidence from an international
comparative perspective. One striking fact is that the proportion of female parliamentarians
reached 32% already in 1985, and both the parliament and the average female representation
in the 290 municipal councils pushed above the 40% mark in 1994. Our study thus concerns a
twenty-year period when women's numerical representation had already reached a level where
gender is largely expected to have lost its importance as a salient divisor of the internal work
environment of the organization (Kanter, 1977). Given this fact, our results show that even in
contexts that should be the most conducive to equality in the political organization, the
nomination behavior of political parties can continue to be an important obstacle to gender
equality at the top.

44
References
Alesina, Alberto, La Ferrara, Eliana. 2005. Ethnic Diversity and Economic Performance.
Journal of Economic Literature, 43 (3): 762-800.
Alesina, Alberto, Nouriel Roubini and Gerald Cohen. 1997. Political Cycles and the
Macroeconomy, Cambridge: MIT Press.
Anzia, Sarah F., and Christopher R. Berry. 2011. "The Jackie (and Jill) Robinson Effect: Why
Do Congresswomen Outperform Congressmen?." American Journal of Political Science
55(3): 478-493.
Beaman, Lori., Esther Duflo, Rohini Pande., & Petia Topalova,. (2010). Political Reservation
and Substantive Representation: Evidence from Indian Village Councils. India Policy
Forum, Brookings and NCAER
Becker, Gary S. 1957. The Economics of Discrimination. Chicago: The University of Chicago
Press.
Besley, Timothy, Olle Folke, Torsten Persson and Johanna Rickne. 2013. Forced to succeed?
Quotas, competition and candidate characteristics. IFN Working paper N 985.
Bjarnegård, Elin. 2009. Men in Politics. PhD Thesis, Uppsala: Uppsala University Press.
Black, Sandra and Philip Strahan. 2001. The division of spoils: Rent sharing and
discrimination in a regulated industry. American Economic Review 91(4): 814-831.
Blom-Hansen, Jens, Jørgen Elklit, Søren Serritzlew, and Louise Riis Villadsen. 2015. "Ballot
Position and Election Results: Evidence from a Natural Experiment." Annual Meeting of
the Danish Political Science Association.
Burkart, Mike, Fausto Panunzi, and Andrei Shleifer. 2003. "Family firms." The Journal of
Finance 58(5): 2167-2202.
Carey, John M., and John Polga-Hecimovich. 2006. “Primary Elections and Candidate
Strength in Latin America.” Journal of Politics 68:530–43.
Casas-Arce, Pablo and Albert Saiz. 2011. Women and Power: Unwilling, Ineffective, or Held
Back? mimeo
Center for American Women in Politics. 2001. Women State Legislators: Past Present and
Future. Highlights and Major Findings. (http://www.capwip.org/readingroom/cawp-
womenstateleg.pdf).
Chattopadhyay, Raghabendra and Esther Duflo. 2004. Women as policy makers: Evidence
from a randomized policy experiment in India. Econometrica 72(5): 1409-1443.
Childs, Sarah and Mona Lena Krook 2009. Analysing women’s substantive representation:
From critical mass to critical actors. Governments and Opposition 44(2): 125-145
Cox, Gary W. and Jonathan N. Katz. 1996. Why did the incumbency advantage in US House
elections grow? American Journal of Political Science. 40: 478-497.
Croson, Rachel and Uri Gneezy. 2009. Gender differences in preferences. Journal of
Economic Literature 47(2): 448-474.
Darcy, Robert, Janet Clark, and Susan Welch. 1994. Women, Elections, and Representation.
Lincoln and London: University of Nebraska Press.
45
Davis, Rebecca Howard. 1997. Women and Power in Parliamentary Democracies: Cabinet
Appointments in Western Europe, 1968-1992. Lincoln: University of Nebraska Press.
Davidson-Schmich, Louise. 2015. A Glass Half Full: Gender Quotas and Political
Recruitment. Book Manuscript.
De Paola, Maria and Vincenzo Scoppa. 2011. Political competition and politician quality:
evidence from Italian municipalities. Public Choice 148 (3-4), 547-559.
Escobar‐Lemmon, Maria and Michelle M. Taylor‐Robinson. 2005. Women ministers in Latin
American government: When, where, and why?. American Journal of Political
Science, 49(4), 829-844.
Esteve-Volart, Berta and Manuel Bagues. 2012. Are women pawns in the political game?
Evidence from elections to the Spanish senate. Journal of Public Economics 96(3-4):
387-399.
Ferraz, Claudio, and Frederico Finan. 2011. Motivating politicians: The impacts of monetary
incentives on quality and performance. Mimeo, Berkeley University
Folke, Olle, Torsten Persson, and Johanna Rickne. 2014. Preferential Voting, Accountability
and Promotions into Political Power: Evidence from Sweden. IFN Working Paper. No.
1002.
Fox, Richard L and Lawless, Jennifer L. 2010. It Still Takes A Candidate: Why Women Don’t
Run for Office. New York: Cambridge University Press.
Fox, Richard L., and Zoe M. Oxley. "Gender stereotyping in state executive elections:
Candidate selection and success." Journal of Politics 65.3 (2003): 833-850.
Forsberg, Gunnel .1997. Rulltrappregioner och social infrastruktur (Escalator regions and
social infrastructure), i Sunding Elisabeth, Om makt och kön (Power and gender), SOU
1997:83, Stockholm: Fritzes.
Franceschet, Susan, and Jennifer M. Piscopo. 2012. Gender and political backgrounds in
Argentina." In Dahlerup, Drude (ed) The Impact of Gender Quotas, 43-56.
Freidenvall, Lenita. 2006. Vägen till Varannan damernas. Kvinnorepresentation,
kandidaturval och kvotering i svensk politik 1970-2002 (The road to”zippered lists”.
Female representation, candidate choice and quotas in Swedish politics 1970-2002).
Stockholms universitet.
Galasso, Vincenzo and Tommaso Nannicini. 2011. Competing on good politicians. American
Political Science Review, 105, 79-99.
Gallagher, Michael, and Michael Marsh. 1987. Candidate Selection in Comparative
Perspective. Sage,
Gupta, Datta, Anders N. Poulsen and Marie, C. Villeval. 2005. Male and Female Competitive
Behavior-Experimental Evidence, IZA Discussion Paper No. 1833
Hakesworth, Mary. 2003. Congressional enactments of race-gender: Toward a theory of race-
gendered institutions. American Political Science Review 97(4): 529-549.
Heath, Michelle, Leslie Schwindt-Bayer and Michelle Taylor-Robinson. 2005. Women on the
Sidelines: Women's Representation on Committees in Latin American Legislatures.
American Journal of Political Science 49(2): 420-436.
Hellevik, Ottar and Torild Skard,. 1985. Norske kommunestyrer – plass för kvinner? (Is there
room for women in Norwegian municipal councils?), Universitetsförlaget, Oslo.

46
Hirano, Shigeo and James M. Snyder. 2014. Primary Elections and the Quality of Elected
Officials. Quarterly Journal of Political Science 9(4): 473-500
Holgersson, Charlotte. 2003. Rekrytering av företagsledare: En studie i homosocialitet.
(Recuriment of business leaders: A study in homosociality) Stockholm: Ekonomiska
forskningsinstitutet vid Handelshögskolan (EFI).
Mala Htun, “Women, Political Parties and Electoral Systems in Latin America,” in Women in
Parliament. Beyond Numbers. A New Edition, eds. Julie Ballington and Azza Karam
(Stockholm: International IDEA, 2005)
Järnbert, Mikaela. 2013. Folkvaldas villkor i kommunfullmäktige (Municipal politician's
work conditions in the municipal councils). Demokratistatistisk rapport 15.
Kanter, Rosabeth Moss. 1977. Men and Women of the Corporation. New York: Basic Books.
Kemahlioglu, Ozge, Rebecca Weitz-Shapiro, and Shigeo Hirano. 2009. Why Primaries in
Latin American Presidential Elections? Journal of Politics 71: 339-352.
Kenworthy, Lane, and Melissa Malami. 1999. Gender inequality in political representation: A
worldwide comparative analysis." Social Forces 78(1): 235-268.
Klahr, David. 1969. Decision making in a complex environment: The use of similarity
Judgements to predct preferences. Management Science 15: 593-618.
Krook, Mona, L. and Diana O’Brien. 2012. All the President’s Men? The Appointment of
Female Cabinet Ministers Worldwide. The Journal of Politics 74(3): 840-855.
Krook, Mona Lena. Quotas for women in politics: Gender and candidate selection reform
worldwide. Oxford University Press, 2009.
Lipman-Blumen, Jean. 2000. Connective leadership. New York: Oxford
Maillé, Chantal, and Lena Wängnerud. 1999 Looking for new opportunities in politics:
women’s organizations and the political parties in Canada and Sweden. in Briskin,
Linda, and Mona Eliasson Women’s Organizing and Public Policy in Canada and
Sweden: 184-209. McGill-Queen's Press-MQUP
Matland, Richard E. 1993. "Institutional Variables Affecting Female Representation in
National Legislatures: The Case of Norway." Journal of Politics, 55(3): 737-755.
Matland, Richard E. "Women's representation in national legislatures: Developed and
developing countries." Legislative Studies Quarterly (1998): 109-125.
Messner, Matthias, and Mattias K. Polborn. 2004. Paying politicians. Journal of Public
Economics 88.12: 2423-2445.
Murray, Rainbow. 2014. "Quotas for Men: Reframing Gender Quotas as a Means of
Improving Representation for All." American Political Science Review 108 (3): 520–32.
Niederle, Muriel and Lise Vesterlund. 2007. Do women shy away from competition? Do men
compete too much? Quarterly Journal of Economics 122(3): 1067–1101.
Nielsen, Peder. 2001. På och av – om uppdragsvillighet, rekrytering och avhopp i den
kommunala demokratin (On and off – motivation for public office, recruitment and
quits in the municipal democracy). in Att vara med på riktigt. Bilagor till betänkande av
Kommundemokratikommittén. Bilaga till SOU 2001:48.

47
Niklasson, Birgitta. 2005. Contact Capital in Political Careers: Gender and Recruiment of
Parliamentarians and Political Appointees. PhD Thesis. Gothenburg: Gothenburg
University Press.
Niven, David. 1998. The Missing Majority: The Recruitment of Women as State Legislative
Candidates. Westport, CT: Praeger.
Niven, David. 2010. Party Elites and Women Candidates: The Shape of Bias, in Women,
gender and politics: A reader. Krook, Mona, L. (Ed), Oxford: Oxford University Press.
Norris, Pippa and Joni Lovenduski. 1995 Political Recruitment: Gender, Race and Class in
the British Parliament. Cambridge University Press: Cambridge
Norris, Pippa, ed. 1997. Passages to power: Legislative recruitment in advanced
democracies. Cambridge University Press.
Norris, Pippa and Ronald Inglehart. 2001. Cultural obstacles to equal representation. Journal
of Democracy 12(3): 126-140.
O’Brien, Diana. forthcoming. “Rising to the Top: Gender, Political Performance, and Party
Leadership in Advanced Industrial Democracies.” American Journal of Political
Science.
Palmer, Barbara, and Dennis Simon. 2001. "The Political Glass Ceiling: Gender, Strategy,
and Incumbency in US House Elections, 1978-1998." Women & Politics 23 (1-2): 59–
78.
Pettersson-Lidbom, Per .2008. Do parties matter for economic outcomes? A regression-
discontinuity approach. Journal of the European Economic Association 6(5), 1037-
1056.
Piliavin, Jane. 1987. Age, Race, and Sex Similarity to Candidate and Voting Preference.
Journal of Applied Social Psychology. 17: 351-368.
Pino, Fransisco. 2014. Is There Gender Bias Among Voters? Evidence from the Chilean
Congressional Elections. ECARES Working Paper 2014-53.
Plutzer, Eric, and John F. Zipp. "Identity politics, partisanship, and voting for women
candidates." Public Opinion Quarterly 60.1 (1996): 30-57.
Reynolds, Andrew. 1999. Women in the Legislatures and Executives of the World: Knocking
at the Highest Glass Ceiling. World Politics 51(4):547-72
Sanbonmatsu, Kira. 2006. Where Women Run: Gender and Party in the American States. Ann
Arbor: University of Michigan.
Schlozman, Kay Lehman, Nancy Burns, Sidney Verba and Jesse Donahue. 1995. Gender and
Citizen Participation: Is There a Different Voice?. American Journal of Political
Science. 39:267-293.
Schwindt-Bayer, Leslie A. 2004. The incumbency disadvantage and women’s election to
legislative office. Electoral Studies 24(2), 227-244.
Schwindt-Bayer, Leslie A. 2011. Women who win: Social backgrounds, paths to power, and
political ambition in Latin American legislatures. Politics & Gender 7(1): 1-33.
Smith, Eric RAN, and Richard L. Fox. "The electoral fortunes of women candidates for Congress."
Political Research Quarterly 54.1 (2001): 205-221.
48
Soininen, Maritta and Nils Etzler. 2006. Partierna nominerar: Exkluderingens mekanismer –
etnicitet och representation (Political parties nominate: Mechanisms of exlution –
ethnicity and representation. SOU 2006:53.
Studlar, Donald .T and Susan Welch. 1991. Does district magnitude matter? Women
candidates in London local elections. Western Political Quarterly 44(2): 457-467.
Studlar, Donley T. and Gary, F Moncrief. 1991. Women Cabinet Ministers in Canadian
Provinces 1976-1994. Canadian Parliamentary Review 19(3): 10-12.
Svaleryd, Helena. 2009. Women’s representation and public spending. European Journal of
Political Economy 25(2):186-198.
Svaleryd, Helena and Jonas Vlachos. 2009. Political rents in a non-corrupt democracy.
Journal of Public Economics 93(3-4): 355-372.
Swers, Michele, L. 2002. The difference women make: the policy impact of women in
congress. University of Chicago Press: Chicago.
Thiebault, Jean-Louis. 1991. The Social Background of Western European Ministers. In Jean
Blondel and Jean-Louis Thiebault eds. The Profession of Government Ministers in
Western Europe. London: Macmillian.
UN Women. 2014. “Progress for Women in Politics, but Glass Ceiling Remains Firm.” Press
Release, 11 March 2014. Available at
http://www.unwomen.org/en/news/stories/2014/3/progress-for-women-in-politics-but-
glass-ceiling-remains-firm#sthash.7FqvEsLe.dpuf. [Accessed 25 May 2014].
Vega, Arturo and Juanita M. Firestone. 1995. The effects of gender on congressional behavior
and the substantive representation of women. Legislative Studies Quarterly 20(2): 213-
222.
Ware, Alan. 2002. The American Direct Primary. Cambridge: Cambridge University Press.
Öhberg, Patrik. 2010. Politiker med karriärambitioner – en omöjlig självklarhet (Politicians
with career ambitions – a contradiction) Ph.D. Thesis, University of Gothenburg,
Department of Political Science.

49
Appendix
Gender Quotas in Swedish Parties
Table A1. Gender quota characteristics and implementation years in Swedish political parties.
Party Year
Mandatory quotas and
placement mandates
(hard quotas)
Targets and
recommendations
(soft quotas)
Left party 1987
Share of women at least
equal to the female share
of the constituency
1993 Minimum 40% of either
sex
1997 Minimum 50% female
Social democrats 1987
Minimum representation of
40% women at all party
levels
1990 Equal representation of the
sexes
1993
50%, plus mandatory
alternation of male and
female names
Green party 1987 40%
1997 50%, plus minus one
person
Liberal party 1974 40%
1984
50%, plus mandatory
alternation of male and
female names
Christian democrats 1987 Minimum 40% of either sex
Center party 1996 Equal representation of the
sexes
Conservative party 1993 Equal representation of the
sexes Source: Authors’ own classification based on Krook et al. (2009) and Freidenvall et al. (2006).
Estimate of voter support
To test if there is a gender difference in preference vote support we estimate the regression
equation
itmtpititiitit QLwaP 1 , (1)

50
where the outcome variable, 1itP , is individual i's share of the total preference votes of the
party in election t. Our main parameter of interest is 1 , the dummy variable for being a
woman. It captures the difference in the proportion of preference votes received by women
and men. itL is vector of dummy variables for each list rank between 1 and 19 and one dummy for
having a list rank of 20 or higher. To account for the fact that the effect of ranking on the proportion of
preference votes could be dependent on the size of the party group, we interact these fixed effects with
four categorical dummy variables for the size of the party group. Next, itQ is the vector of individual
control variables that we include as controls in section 6 (see also the detailed list Table A2 below).18
Finally we include fixed effects for the interaction between election period, party and municipality to
compare the preference vote difference between women and men who are on the same list in the same
election.
We present the results in Table A2. Column 1 shows the results without controlling for list rank
and individual level controls. In column 2 we add the controls for list rank interacted with group size,
and in column 3 we add individual level controls.
Table A2. OLS estimates of the gender difference in the proportion of preference votes, 1998-2006.
(1) (2) (3)
Woman -2.34 -1.22 -1.20
(0.18) (0.13) (0.14)
List rank F.E x x
Individual level controls x
Observations 34,935 34,935 31,098 Notes: Parentheses contain robust standard errors. All coefficients are scaled up by 100 to let
the point estimates be interpreted as 1.0 = 1 percentage point. All specifications include fixed
effects for the interaction of year, municipality and party.
The results show that women receive fewer preference votes than men. Conditional on
only the fixed effects for the interaction of year, municipality and party, women receive 2.3
percentage points fewer preference votes than men. However, about half of this difference can
18 As we are interested in the average difference between all women and men we omit the interaction term
between being a woman and having children.

51
be attributed to men holding a higher list rank than women. The inclusion of the large set of
individual controls cannot explain any of the difference between women and men.
Individual Control Variables
Table A3. Description of Control Variables
Family responsibilities Dummy variable for having at least one child aged between 0 and
18
Dummy variable for getting at least one more child between t and
t+1
Competence Income residual from “mincer style regression” regression that
flexible controls for gender, age, occupation, education and
municipality. Transformed to Z-Score. See Besley et. al. (2013)
for complete description of competence measure.
Labor market changes
Dummy variable for increasing one’s real income by more than
25 percentage points between t and t+1
Dummy variable for changing one’s sector of employment
between t and t+1
Moving Dummy variable for changing residence to another municipality
between t and t+1
Age Categorical dummy variables for the age groups of 18-29, 30-49,
50-60, 61-64, and 65 or above.
Education Years of education
Income
Log of real income
Immigrant Dummy variable for being foreign-born
Occupation Categorical dummy variables for ten employment sectors
Incumbent Dummy variable for being elected in the previous election period
Current position/ranking
within the party group
Fixed effects for each rank order on the ballot. To account for the
fact that the effect of ranking on the probability of re-election
could be dependent on the size of the party group, we interact
these fixed effects with four categorical dummy variables for the
size of the party group.
In Table A3, we provide the estimates from the first alternative hypothesis test together with
the estimates for all individual level controls. Due to space constraint, we do exclude the 10

52
controls for employment sectors and the 50 dummies for list rank fixed effects interacted with
party group size. Moreover, we only show the estimate for when we use the block difference
in votes to measure competition. Below, we will briefly discuss these results for each group of
control variables.
Table A4. OLS estimates of competition and probability of re-election, 1991-2010.
Re-
Election
Top Ranked
Next Election Retention
Conditional
Re-Election
Woman -1.47 -1.20 -2.12 0.57
(0.99) (0.46) (0.89) (0.96)
Woman * Competition 10.78 4.56 8.24 6.82*
(4.16) (2.05) (3.57) (3.92)
Competence 2.89 1.08 1.00 2.94
(0.40) (0.22) (0.32) (0.45)
Women*Children -3.29 -1.87 -2.66 -1.63
(1.09) (0.63) (0.96) (1.11)
More Children -2.08 -0.50 -0.44 -1.50
(1.15) (0.68) (1.04) (1.38)
Children 2.96 1.34 1.53 2.03
(0.75) (0.47) (0.68) (0.75)
Moved -55.00 -10.11 -69.80 -26.30
(0.72) (0.46) (0.68) (4.45)
Occupation Change -0.88 1.68 -2.04 0.99
(0.53) (0.29) (0.47) (0.55)
Wage Change 10.32 4.15 7.52 8.25
(0.87) (0.58) (0.81) (1.14)
Age 18-29 22.42 7.64 9.08 23.16
(1.72) (0.73) (1.67) (1.98)
Age 30-49 24.99 9.07 14.03 21.31
(1.39) (0.58) (1.26) (1.57)
Age 50-64 23.75 6.29 14.85 19.24
(1.21) (0.53) (1.13) (1.44)
Retirement age next period -12.14 -5.71 -6.78 -8.87
(0.93) (0.48) (0.87) (1.00)
Ln (Real income) 2.63 0.83 1.90 2.47
(0.31) (0.14) (0.28) (0.39)
Years of Education 0.31 0.18 -0.08 0.52
(0.09) (0.06) (0.08) (0.11)
Immigrant -0.55 -0.19 -1.23 0.26
(1.05) (0.60) (0.86) (1.27)
Incumbent 1.69 0.29 -0.87 2.84
(0.61) (0.32) (0.49) (0.70)
Observations
46,873 46,873 46,873 33,618 Notes: Parentheses contain robust standard errors. All coefficients are scaled up by 100 to let the point estimates
be interpreted as 1.0 = 1 percentage point. All specifications include fixed effects for the interaction of year,
municipality and party.

53
Starting with the competence measure from Besley et. al. (2013) we can see that is
strongly and positively related to career promotions, corroborating that this actually captures
something that is valued in politics.
For the role of differential family responsibilities between men and women, we can see
that these play a key role in explaining women’s career disadvantage relative to men. The
point estimates between being a woman and having children suggests that the relative career
disadvantage for women with respect to being re-elected is twice as large as for those without
children. This can be attributed to a lower relative retention rate for women with children.
Differential family responsibilities also play a key role in women’s lower probability of
reaching the top ranked position. The un-interacted point estimates for having children
suggest that men with children do not seem to suffer any disadvantage in their careers.
We now turn to the other factors that could lead to politicians opting out of politics.
These are also important explanatory factors, especially for candidates who are retained. That
both occupational change and wage change have a strong association with becoming top
ranked could be explained by the fact that becoming top ranked sometimes implies that the
candidates get a full time appointment as politicians.
What stands out for the age categories is that politicians that are going to retire, or have
retired, are much more likely to take a step back in their political careers. For full time
politicians, this might be obvious, but the relationships are too large to be explained by this
small subset of politicians, which indicates that retirement is a central factor for part-time
politicians taking a step back in their political careers.

54
Wage and education both have the expected signs. Politicians that do well in the private
labor market also do well in politics. Those with higher education also seem to do much
better. The size of these point estimates helps us put the estimated disadvantage of women
into context. The estimate of women’s average career disadvantage is of about the same as
that of having ten years less education, or having half as high a wage. The estimate for being
an immigrant has a weak association with all our measures.
Finally, the estimate for incumbency is very small. However, this does not say that
incumbents do not hold a large career disadvantage. It is simply due to the fact that
incumbency has already been factored into the current list rank. Although we cannot show
these, it is worth noting that those at the top of the list do hold a very large advantage as
compared to those further down the list.