gas transport in porous media under dynamic conditions
TRANSCRIPT

E L S E V I E R Catalysis Today 38 (1997) 31-38
CATALYSIS TODAY
Gas transport in porous media under dynamic conditions
P a v e l t~apek, V l a d i m i r He j tmf inek , O l g a So lcova , K a r e l K l u s a c e k , Pe t r S c h n e i d e r
Institute of Chemical Process Fundamentals, The Czech Academy of Sciences, Rozvojov6 135, 165 02 Praha 6, Suchdol, Czech Republic
Abstract
The dynamic version of the Wicke-Kallenbach diffusion cell with one compartment closed and equipped with a sensitive pressure gauge was used for determination of sets of Mean Transport Pore Model and Dusty Gas Model parameters for an industrial catalyst (ICI 52-1 in reduced form). The dynamic pressure responses due to gas composition step changes of inert gases (H2, He, N2, Ar) were measured and fitted to the system of partial differential equations which describe the transport (mass balances with Maxwell-Stefan constitutive equations). The optimum textural parameters were obtained by simultaneous matching of all experiments. The model parameters are material constants of the porous solid and, thus, do not depend on temperature, pressure and kind of the transported gases. Both diffusion models gave a good agreement between experiments and calculations. The parameter reliability is discussed.
Keywords: Unsteady gas transport; Porous medium; Diffusion; Textural parameters
1. Introduction
The gas transport, in porous media under unsteady conditions is quite common in practice. Start-up and switching off catalytic reactors, adsorption processes on porous adsorbents and random steady process fluctuations can be named as examples. The descrip- tion of the dynamics of complex transport, adsorption and reaction steps as single and/or simultaneous pro- cesses is of basic importance for the process design and choice of optimum reactor and adsorber regimes.
The mass transport can only be isobaric when molar flux densities of mixture components, Ni, satisfy the generalised Graham law
n
ZNi(Mi) 1/2 = O, (1) i=1
*Corresponding author, e-mail: [email protected]
0920-5861/97/$32.00 © 1997 Elsevier Science B.V. All rights reserved. PI I S 0 9 2 0 - 5 8 6 1 ( 9 7 ) 0 0 0 3 6 - 9
where M; are molecular weights of components and n the number of components in the mixture. However, the mass transport inside the porous solids is generally non-isobaric because the ratios of fluxes are controlled by other conditions, e.g., the reaction stoichiometry or adsorption. Furthermore, the Graham law is violated under dynamic conditions even in the absence of reaction or adsorption. The pressure gradient which arises during unsteady transport of inert gases through porous solid can be used to evaluate parameters which describe the transport process. A suitable experimental technique which uses the dynamic version of the Wicke-Kallenbach diffusion cell with one compartment closed, developed by NovLk et al. [1], is shown schematically in Fig. 1. The total pressure change in the bottom compartment of the cell which arises as a consequence of step change of gas composition in the upper cell compartment is followed and the pressure response

32 P Capek et al. / Catalysis Today 38 (1997) 31-38
A Dusty Gas Model for an industrial catalyst IC152-1 in reduced form and to evaluate the confidence of these parameters estimated from a larger set of experiments.
2. Isothermal Maxwell-Stefan constitutive equations
Fig. 1. Scheme of the cell. 1, upper compartment; 2, lower compartment; 3, porous pellets; 4, metallic disc; 5, membrane of pressure transducer; 6, cell outlet; 7, cell inlet; 8, 4-way valve.
1.3
Prep"
1.2
1.1
1.0
' I ' I ' I '
1000 2000 3000 t , s
Fig. 2. Experimental pressure response for the step change N2 --* H2.
(see Fig. 2) is matched to the theoretical descrip- tion.
Multicomponent mass transport in porous solids can be described both by the Mean Transport Pore Model or the Dusty Gas Model. The ability of both models to fit experimental data has been proven in literature. However, a little is known about the number of experiments needed to obtain good estimates of model parameters and about the influence of simulta- neous matching of experiments with different inert gases. Similarly, comparison of both models based on a larger set of experiments has not been done up to now. It is the aim of this study to obtain (transport) parameters of the Mean Transport Pore Model and the
The Dusty Gas Model (DGM) [2] and Mean Trans- port Pore Model (MTPM) [3] are based on the Max- well-Stefan theory. Both models include contributions of bulk diffusion, Knudsen diffusion and permeation flow that accounts for both viscous flow and Knudsen flow. The vector form of the relation between molar flux densities, N = {N1, N2. . . Am} r and gradients of molar concentrations is the same for both models
0e I-I(e). N + = 0, (2)
where c is the vector of molar concentrations, e = {cl, c2 . . . c,} r and It(e) is a square (n × n) con- centration dependent matrix (for matrix elements, h o,
see Appendix A). This matrix does not show [1] the differences between both models. The matrix ele- ments depend on transport properties of pure gases and their binary mixtures, and on the structure of the porous solid. The pore structure is characterised by three parameters which are related (i) to effective porosity of transport pores, ~b; (ii) to the mean trans- port pore radius, (r); (iii) and to the mean of the square of transport pore radii (MTPM) or to the coefficient of the viscous flow (DGM), (r2). These parameters represent porous solid material properties related to mass transport and, thus, do not depend on tempera- ture, pressure and the kind of gases transported. They have to be determined experimentally, preferentially with inert gases.
3. Experimental
Experiments were performed in the diffusion cell, shown in Fig. 1, at laboratory temperature and atmo- spheric pressure. The cell consists of two compart- ments separated by a metallic disc. The cylindrical pellets of an industrial porous catalyst ICI 52-1 (for properties see Table 1) were mounted, in parallel, in cylindrical holes of the metal disc; thus, only the

t3, Capek et al. / Catalysis Today 38 (1997) 31-38 33
Table 1 Diffusion cell and pellet data
Inlet volumetric flow rate, F ° (cm3/s) Upper compartment volume, VL (cm 3) Lower compartment volume, Vo (cm 3) Pellet height (cm) Pellet diameter (cm) Number of pellets Pellet total porosity (e)
1.34 19.1 55.2 0.368 0.540 12 0.623
3.1. Gases
Hydrogen, helium, nitrogen and argon, which do not adsorb on the catalyst ICI 52-1, were used as test gases. The step changes performed using pure gases and gas mixtures are listed in Table 2 which sum- marises also the co-ordinates of the response extremes.
circular pellet faces are open for one-dimensional transport of gases. The inlet to the upper compartment of the diffusion cell is connected to a four-way valve which permits swapping the gas stream entering in the cell by another gas stream. The flow rates are con- trolled by mass flow meter-controllers. The closed lower compartment is equipped with a sensitive pres- sure gauge. The time development of the gauge response after the inlet composition change (t = 0) is logged with frequency 1 Hz in a computer. Before the start of the run, the cell is flushed with gas A (e.g., nitrogen). At the start of the run, gas A was replaced by another gas B (e.g., helium). The compo- sition step change at the inlet of the upper compart- ment is denoted as A---+ B (e.g., N2 ~ He). The system response for the case N2 ~ H2 is shown in Fig. 2.
Table 2 List of experiments. Parentheses mark binary mixtures (1 : 1)
Run Composition at the inlet Maximum/minimum of upper compartment pressure in lower
compartment
(-) t < 0 t > 0 t (s) Prel (-)
1 N2 H2 352 1.310 2 Hz Nz 372 0.660 3 He Nz 430 0.732 4 N2 He 435 1.244 5 Ar He 450 1.295 6 He Ar 479 0.679 7 H2 Ar 422 0.609 8 Ar H2 379 1.360 9 (H2,Ar) He 557 1.123 10 (He,Ar) H2 340 1.222 11 H2 (He,At) 371 0.754 12 (H2,N2) mr 446 0.803 13 Ar (H2,N2) 421 1.183 14 (He,N2) Ar 516 0.822 15 Ar (He,N2) 485 1.163
3.2. Porous pellets
The fresh catalyst was reduced [4] at 200°C by 5% hydrogen in helium and cooled down under helium flow. The reduced catalyst was passivated by slow admission of air. The passivated catalyst pellets were fixed in the cylindrical holes of the metallic disc by silicon-rubber tubing.
4. Mass balance of diffusion cell
Mass balances for n gas mixture component inside the porous pellets supplement the constitutive Eq. (2)
Oc(t, x) ON(t, x) o ~ - Ox ' (3)
where e is the pellet porosity and t the time. Boundary conditions of the system of partial differential Eqs. (2) and (3) follow from the mass balance of both compart- ments assuming no resistance to mass transport between the bulk gas and the pellet.
If ideal mixing is assumed at x = 0 (lower compart- ment), the condition has the form
~,0 0c(t' N(t, 0), (4) 0) Vp
where Vo is the free volume of the compartment, Vp the (geometric) volume of cylindrical pellets in the metal- lic disc and L their length.
At x = L (upper compartment) the boundary con- ditions are
VL 0c(t,0t L) _ FOcO _ FBOL@c(t, L) + ~-~N(t, L),
(5)
where F ° and F are the volumetric flow gas rates at the compartment inlet and outlet, respectively, and VL is the compartment volume. Eq. (5) again assumes ideal

34 P (?apek et aL/Catalysis Today 38 (1997) 31-38
mixing in the compartment. The unknown outlet volumetric flow rate, F, in Eq. (5) is obtained from the overall mass balance
F = F ° + VP~"Ni( t ,L) , (6)
where CT is the total molar gas concentration, a con- stant.
Initial conditions for the system Eqs. (2)-(6) are formulated as
c(0, x) = c*
with the vector of constant component concentrations, c*= {c~,c~...c*n} r, determining the equilibrium state when the cell is completely flushed by a single gas or gas mixture.
The system of Eqs. (2)-(6) was integrated by method of lines [5]. The discretization of the integral form of Eq. (3) was achieved [6] by dividing the pellet into small volume elements (up to 50). The resulting system of ordinary differential equations was solved using backward differentiation formulas [7].
5. O p t i m i s a t i o n
The transport parameters were obtained by mini- misation of an objective function which considered two aspects: (a) both models predict that transport parameters do not depend on the kind of gases used, i.e., the same parameters should result from matching individual runs; (b) because of the possible experi- mental error and parameter correlation all experiments were matched simultaneously. The objective function, X 2, was defined as weighted sum of squares of devia- tions between calculated relative pressures, P(t), cal- culated as (Eq. (4))
n
P(t) = ~ ci(t, O)/CT (7) i=1
and experimentally determined relative pressures, pexp(t), in the lower cell compartment
1 m 1 ~i exp 2 X2(~b, (r), ( r 2 ) ) : - ~ - - ~ i ~ ( e i , j ( t ) - Pij(t))
j = l J i=1
(8)
where sj is the number of pairs t - P(t) in the jth experimental run and m the number of experimental runs. The weighted sum of the squares was chosen because of different lengths of runs. Thus, longer runs with heavier gas pairs are not more heavily weighted than runs with lighter gas pairs.
The objective function (8) was minimised by the simplex algorithm of Nelder and Mead [8]. To save time, the integration was performed with low accuracy in the spatial variable at the start of the optimisation. Near the optimum the accuracy of integration was improved by increasing the number of grid points. In order to avoid local minima the optimisation was restarted with different initial parameter guesses and a different simplex sizes. Constrains based on physical considerations and results of the mercury porosimetry were applied, i.e., ~,, must be within (0, e, (r) > 1 nm and (r 2) > 10 nm 2.
6. Resu l t s and d i scuss ion
The obtained DGM and MTPM transport para- meters are summarised in Table 3. In addition to the simultaneous matching of all (m = 15) experi- mental runs, transport parameters were also deter- mined by matching of pairs of runs and all binary and ternary runs. This should supply information about parameter confidence and the amount of infor- mation held by each experimental run.
6.1. DGM
Transport parameters ~b and (r) estimated from pairs of binary runs do not differ significantly. By simultaneous matching of all binary runs (runs 1-8) similar values of the first two parameters, ~b and (r), are obtained (cf. Table 3). Determination of transport parameters from a single ternary run (run 9) and from pairs of ternary runs (runs 10-15) was difficult. Both transport parameters were loaded with large uncer- tainty. The large deviation of transport parameters obtained from runs 10 and 11 (in which a mixture of Ar with a light gas is replaced by a light gas) is difficult to explain. An interesting behaviour was observed when all ternary runs were included in parameter estimation: transport parameters were close to the final values (the last row in Table 3). The highest
P. Capek et al./Catalysis Today 38 (1997) 31-38
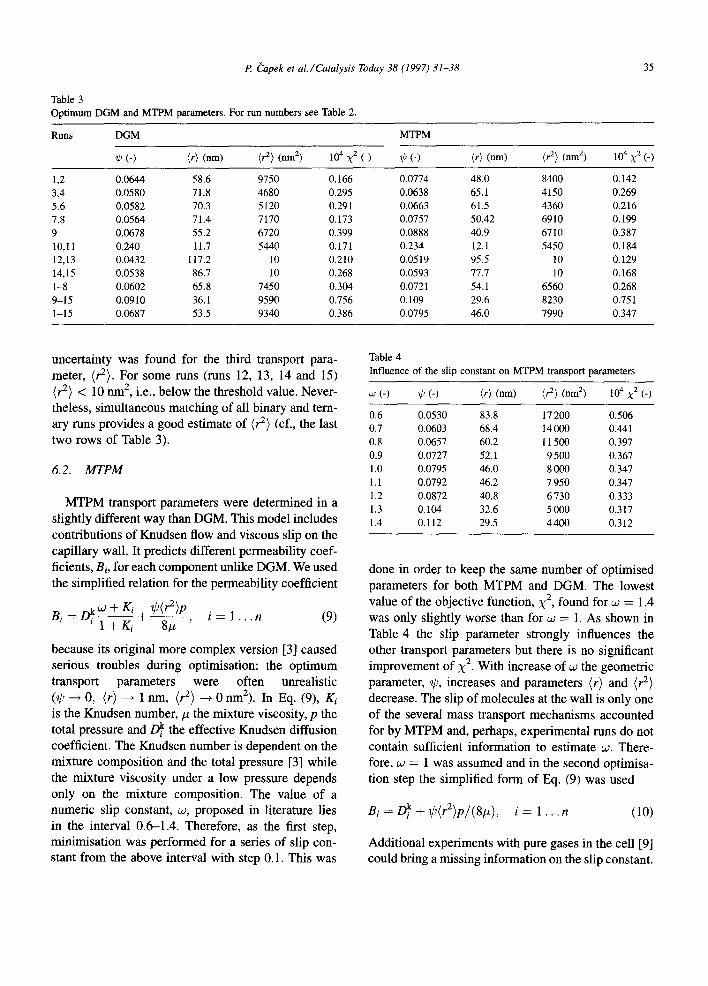
Table 3 Optimum DGM and MTPM parameters. For run numbers see Table 2.
35
Runs DGM MTPM
~b (-) (r) (nm) (rz) (nm 2) 104 )2 (_) //3 (-) (r) (nm) (r 2) (nm 2) 10 4 X 2 (-)
1,2 0.0644 58.6 9750 0.166 0.0774 48.0 8400 0.142 3.4 0.0580 71.8 4680 0.295 0.0638 65.1 4150 0.269 5,6 0.0582 70.3 5120 0.291 0.0663 61.5 4360 0.216 7.8 0.0564 71.4 7170 0.173 0.0757 50.42 6910 0.199 9 0.0678 55.2 6720 0.399 0.0888 40.9 6710 0.387 10,11 0.240 11.7 5440 0.171 0.234 12.1 5450 0.184 12,13 0.0432 117.2 10 0.210 0.0519 95.5 10 0.129 14,15 0.0538 86.7 10 0.268 0.0593 77.7 10 0.168 1-8 0.0602 65.8 7450 0. 304 0.0721 54.1 6560 0.268 9-15 0.0910 36.1 9590 0.756 0.109 29.6 8230 0.751 1-15 0.0687 53.5 9340 0.386 0.0795 46.0 7990 0.347
uncertainty was found for the third transport para- meter, (rE). For some runs (runs 12, 13, 14 and 15) (r 2) < 10 nm 2, i.e., below the threshold value. Never- theless, simultaneous matching of all binary and tern- ary runs provides a good estimate of (r 2) (cf., the last two rows of Table 3).
6.2. MTPM
MTPM transport parameters were determined in a slightly different way than DGM. This model includes contributions of Knudsen flow and viscous slip on the capil lary wall. It predicts different permeabil i ty coef- ficients, Bi, for each component unlike DGM. We used the simplified relation for the permeabil i ty coefficient
ok ~V + Ki ¢(r2)p Bi =- i ~ - ~ 8# ' i = l . . . n (9)
because its original more complex version [3] caused serious troubles during optimisation: the opt imum transport parameters were often unrealistic (~/,, ~ 0, (r) ~ 1 nm, (r 2) --* 0 nrfl2). In Eq. (9), K i is the Knudsen number, # the mixture viscosity, p the total pressure and D~/the effective Knudsen diffusion coefficient. The Knudsen number is dependent on the mixture composit ion and the total pressure [3] while the mixture viscosity under a low pressure depends only on the mixture composition. The value of a numeric slip constant, w, proposed in literature lies in the interval 0.6-1.4. Therefore, as the first step, minimisation was performed for a series of slip con- stant from the above interval with step 0.1. This was
Table 4 Influence of the slip constant on MTPM transport parameters
~: (-) ~ (-) (r) (nm) (r 2) (nm z) 10 4 X 2 (-)
0.6 0.0530 83.8 17 200 0.506 0.7 0.0603 68.4 14 000 0.441 0.8 0.0657 60.2 11500 0.397 0.9 0.0727 52.1 9 500 0.367 1.0 0.0795 46.0 8 000 0.347 1.1 0.0792 46.2 7 950 0.347 1.2 0.0872 40.8 6 730 0.333 1.3 0.104 32.6 5000 0.317 1.4 0.112 29.5 4400 0.312
done in order to keep the same number of optimised
parameters for both MTPM and DGM. The lowest value of the objective function, X 2, found for ~ = 1.4 was only slightly worse than for ~ = 1. As shown in Table 4 the slip parameter strongly influences the other transport parameters but there is no significant improvement of X 2. With increase of ~ the geometric parameter, ~b, increases and parameters (r) and (r 2)
decrease. The slip of molecules at the wall is only one of the several mass transport mechanisms accounted for by MTPM and, perhaps, experimental runs do not contain sufficient information to estimate ~. There- fore, ~ = 1 was assumed and in the second optimisa- tion step the simplified form of Eq. (9) was used
Bi = Dki + ¢(rZ)p/ (8#) , i = 1 . . . n (10)
Additional experiments with pure gases in the cell [9] could bring a missing information on the slip constant.

36 P. Capek et al./ Catalysis Today 38 (1997) 31-38
1.3
Prep -
1.2
1.1
1.0 1.3
Prel, -
1 .2
1.1
1.0 1.3
Prep -
1.2
1.1
1.0 0 1000 2000 3000
t , S
Fig. 3. DGM parameter sensitivity, (a) ~, (b) (r), (c) (r2), for step change N2 ~ H2. Full lines calculated for optimum parameters, dashed lines for 0.9 times optimum parameters and dotted lines for 1.1 times optimum parameters.
6.3. Comparison of MTPM and DGM
There is no major difference between the optimum MTPM and DGM transport parameters and between the corresponding objective functions (Table 3).
The higher uncertainty of the third parameter, (P), can be explained by the small mean transport pore radius, (r). In such narrow pores the viscous flow is of less importance and, consequently, (r 2) can not be estimated too reliably. This is in agreement with the parameter sensitivity determined for the step change N2 ~ H2. Perturbation of the optimum DGM trans- port parameters ~b and (r) influences the time depen- dence of pressure in the lower cell compartment (Fig. 3a,b). The change of (r2), however, does not
1 .3
PreP-
1.2
1.1
1.0
Prel'"
0.9
0.8
0.7 ~...~M,,4.
0 1000 2000 3000 4000
t , s
Fig. 4. Comparison of experimental (OOOID) and calculated ( ) pressure responses for DGM. Step changes: 1, A r ~ H e ; 2, H e ~ A r ; 3, N 2 ~ H e ; 4, He---*N2; 5, Ar ~ (H2,N2); 6, (H2,N2) ~ Ar.
alter the response significantly (Fig. 3c). For MTPM similar behaviour was found.
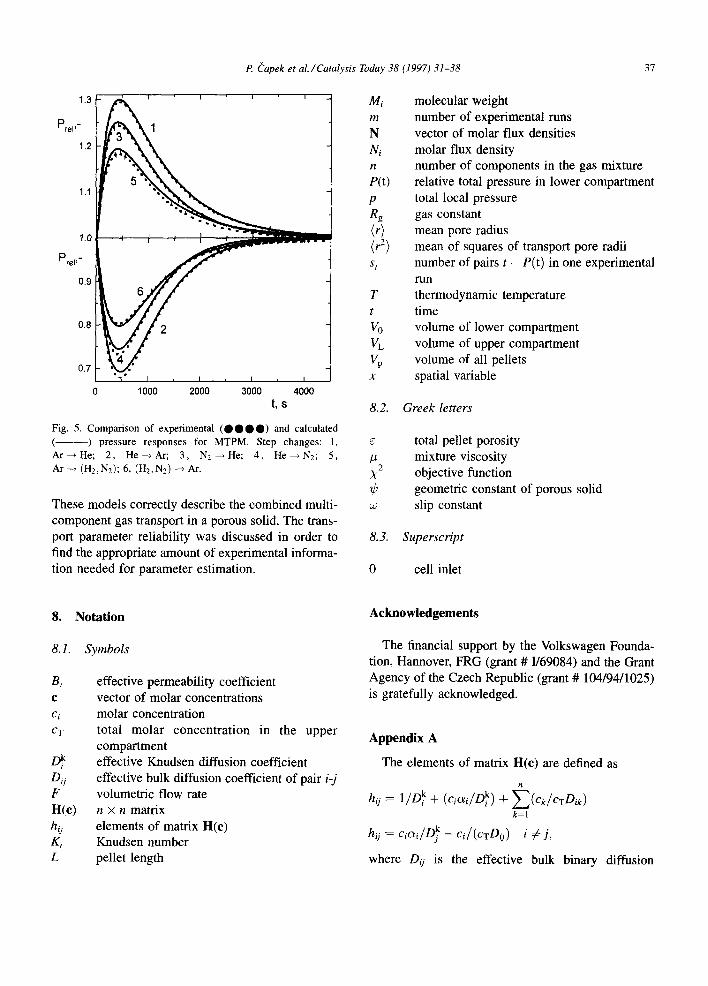
Experimental cell responses are compared with simulations based on optimum MTPM and DGM parameters as shown in Figs. 4 and 5. As can be seen, both models fit the experimental curves well. In agreement with the similarity of X 2 for both models, no model can be classified as superior.
The experiments with binary combinations of four different gases and the simultaneous matching of experimental runs proved to be sufficient for obtaining reliable transport parameters. The experiments with ternary gas mixtures have shown that the underlying theory is capable of correctly predicting the transport of multicomponent gas mixtures.
7. Conclusions
The transport parameters of MTPM and DGM for the reduced catalyst ICI 52-1 were determined by simultaneous matching of experimental responses.
P Capek et al./Catalysis Today 38 (1997) 31-38 37
1.3
e l . e l t -
1.2
1.1
1.0
Prep-
0.9
0.8
0.7
2
0 1000 2000 3000 4000 t,s
Fig. 5. Comparison of experimental ( O Q Q O ) and calculated ( -) pressure responses for MTPM. Step changes: 1, Ar--~He; 2, He--~Ar; 3, N2 ~ H e ; 4, H e i N z ; 5, Ar-~ (Hz,N2); 6, (H2,N2) ~ At.
These models correctly describe the combined multi- component gas transport in a porous solid. The trans- port parameter reliability was discussed in order to find the appropriate amount of experimental informa- tion needed for parameter estimation.
Mi m
N Ni n
P(t)
P Rg
(r) C) sj
T t
Vo vL Vp x
molecular weight number of experimental runs vector of molar flux densities molar flux density number of components in the gas mixture relative total pressure in lower compartment total local pressure gas constant mean pore radius mean of squares of transport pore radii number of pairs t - P(t) in one experimental run thermodynamic temperature time volume of lower compartment volume of upper compartment volume of all pellets spatial variable
8.2. Greek letters
e total pellet porosity # mixture viscosity X 2 objective function ¢ geometric constant of porous solid
slip constant
8.3. Superscript
0 cell inlet
8. Notation
8.1. Symbols
Bi c
Ci CT
D~/ F H(c) ho K, L
effective permeability coefficient vector of molar concentrations molar concentration total molar concentration in the upper compartment effective Knudsen diffusion coefficient effective bulk diffusion coefficient of pair i-j volumetric flow rate n × n matrix elements of matrix H(e) Knudsen number pellet length
Acknowledgements
The financial support by the Volkswagen Founda- tion, Hannover, FRG (grant # 1/69084) and the Grant Agency of the Czech Republic (grant # 104/94/1025) is gratefully acknowledged.
Appendix A
The elements of matrix H(c) are defined as
n
hij = 1/D~i + (ciai/oki) + Z(clc/cwDik) k=l
hij = ciai/D k - ci/(c'rDij) i ¢ j,
where Dii is the effective bulk binary diffusion

38 P. Capek et al./ Catalysis Today 38 (1997) 31-38
coefficient defined as Dij ---- CDij and D~/is the effec- tive Knudsen diffusion coefficient
= ~b2/3( r )18RgT/(TrMi) .
The bulk b inary diffusion coefficients, D O, were taken
from Marrero and Mason [10]. Differences be tween M T P M and D G M appear in the defini t ion of para-
meter ai :
for M T P M
~i = 1 - B i / D k - Z c ~ ( B i - Bk)/CTDik k = l
n
×
k = l
for D G M
oq = --(~/Oki ) ck + Ck O
t
/3 = ~b(rZ)p/(8#).
The mixture viscosity in the latest formula depends on
the mixture composi t ion.
The mixture viscosity, #, used in M T P M (Eqs. (9) and (10)) and D G M was determined by the Reich-
enberg ' s formula [11].
References
[1] M. NovLk, K. Ehrhardt, K. Klus~cek and P. Schneider, Chem. Eng. Sci., 43 (1988) 185.
[2] E.A. Mason and A.E Malinauskas, Gas Transport in Porous Media: The Dusty Gas Model, Elsevier, Amsterdam, 1983.
[3] E Schneider, Chem. Eng. Sci., 33 (1978) 1311. [4] E Capek and K. Klusacek, Chem. Eng. Sci., 49 (1994) 4095. [5] R.F. Sincovec and N.K. Madsen, ACM Trans. Math.
Software, 1 (1975) 261. [6] K. Ehrhardt, K. Klusacek and E Schneider, Comput. Chem.
Eng., 12 (1988) 1151. [7] A.C. Hindmarsh, O j~EPACK, A Systematized Collection of
ODE Solvers, i~Scientific Computing, R.S. Stepleman et al. (Eds.), North-Holland, Amsterdam, 1983, p. 55-64.
[8] D.M. Himmelblau, Nonlinear Programming, McGraw-Hill, New York, NY, 1972, p. 148..
[9] E Fott and G. Petrini, Appl. Catal., 2 (1982) 367. [10] T.R. Marrero and E.A. Mason, J. Phys. Chem. Ref. Data, 1
(1972) 3. [11] R.C. Reid, J.M. Prausnitz and B.E. Poling, The properties of
Gases and Liquids, McGraw-Hill, New York, NY, 1988, p. 404.