funding public education in michigan€¦ · public education funding ... $1.831 billion annual...
TRANSCRIPT
Public Education Funding – Solutions June 17, 2014
Testimony submitted to the State Board of Education by: Christine Stead, Vice President, AAPS Board of Education
Glenn Nelson, Treasurer, AAPS Board of Education Deb Mexicotte, President, AAPS Board of Education
Dr. Jeanice Kerr Swift, Superintendent, AAPS Marios Demetriou, Chief Financial Officer, AAPS
1

An Ann Arbor Family’s Story
Our family moves to Ann Arbor in 2009. They selected Ann Arbor because of its reputation for high quality schools. When looking at homes, they were willing to pay more for a home within the Ann Arbor Public Schools district – an investment they decide is worth making so that their children would have a high quality education.
Ann Arbor
$411,678
Michigan
$118,775
Average Home Price
Source: http://www.realtor.com/local/Ann-Arbor_MI/lifestyle ; accessed June 13, 2014.
United States
$192,490
2
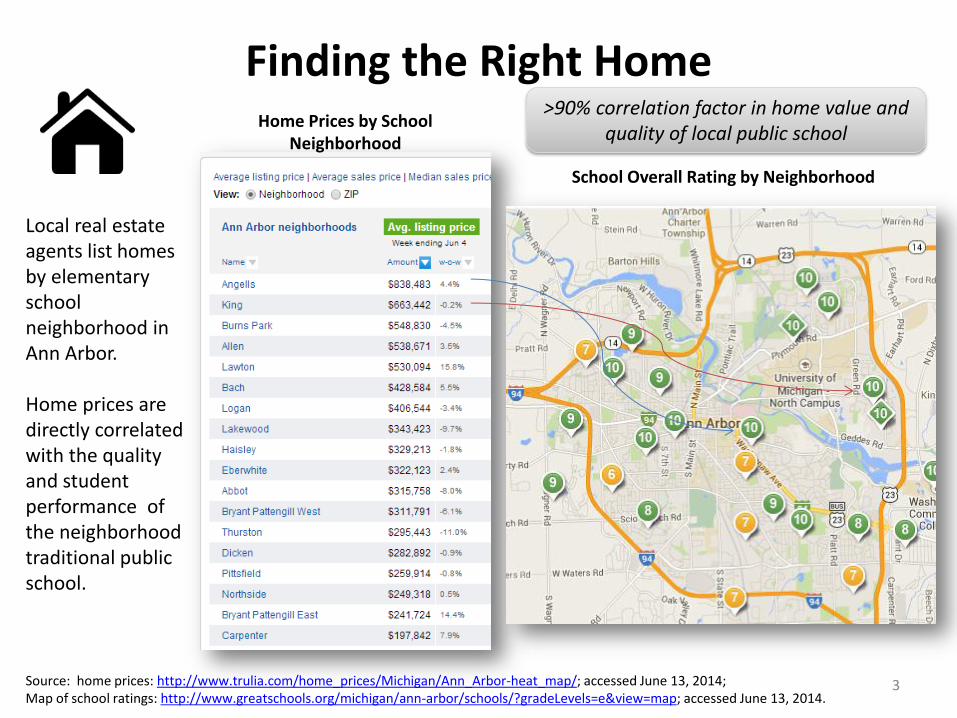
Finding the Right Home
Local real estate agents list homes by elementary school neighborhood in Ann Arbor. Home prices are directly correlated with the quality and student performance of the neighborhood traditional public school.
Source: home prices: http://www.trulia.com/home_prices/Michigan/Ann_Arbor-heat_map/; accessed June 13, 2014; Map of school ratings: http://www.greatschools.org/michigan/ann-arbor/schools/?gradeLevels=e&view=map; accessed June 13, 2014.
3
Home Prices by School Neighborhood
School Overall Rating by Neighborhood
>90% correlation factor in home value and quality of local public school

2009/10 – A Difficult Year
In 2009/10, several things happened that negatively impacted funding for the AAPS: • 20j funding eliminated; • Mid-year significant reduction of funds; • Significant reduction of funds projected for 2010/11; • An enhancement millage effort failed – no relief from a
structural deficit or significant reductions in funds was coming, despite passage in the Ann Arbor district
4
AAPS Impact • Reductions in operations were ~$10,000,000 • Additional reductions in fund equity were used to absorb mid-
year state reductions, rather than disrupt classrooms • FTEs were reduced • Classroom sizes increased (student : teacher ratio) • Administration, class supports and programs were reduced
(transportation, athletics, arts, instructional support, etc.)
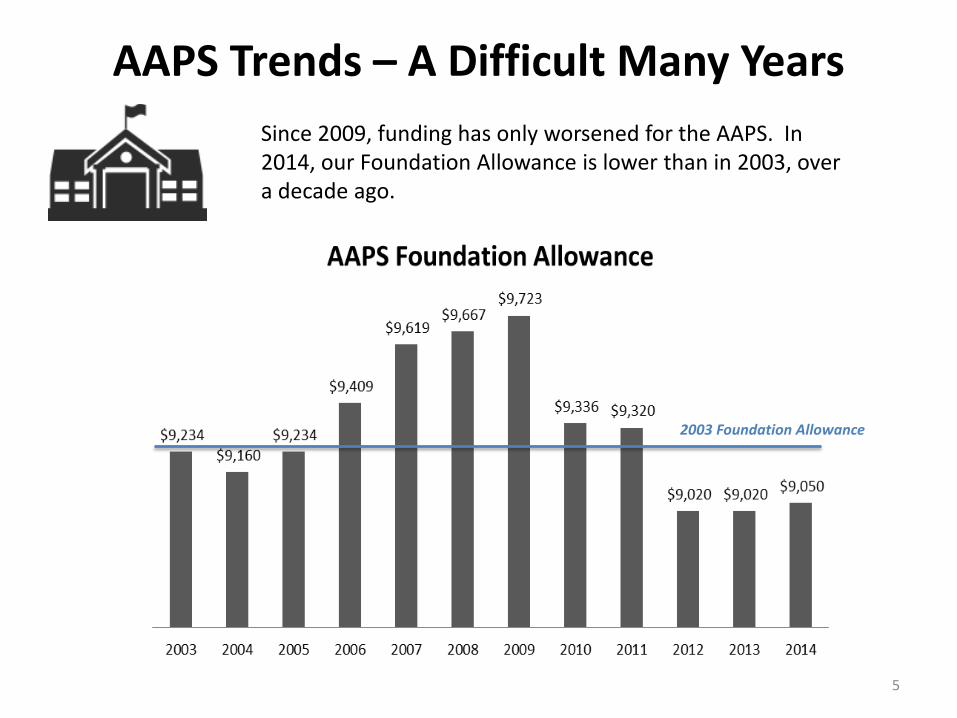
AAPS Trends – A Difficult Many Years
5
2003 Foundation Allowance
Since 2009, funding has only worsened for the AAPS. In 2014, our Foundation Allowance is lower than in 2003, over a decade ago.

Less and Less Revenue Funds the Classroom
6
By not keeping pace with inflation, shouldering increasing MPSERS costs, and other costs, less and less of the foundation allowance is available to fund the classroom.
What’s left for the
classroom: $3,998

Our Family’s Experience In 2013/14, after years of continued cuts, even more were passed on to their family: • Classroom sizes were increased so that high school now
hovers at 40 for some classes; • Pay to play for sports increased to $250 per student; • Total sports participation costs have increased
enormously, while sports programs were reduced; • Funding for music and fine arts was reduced – both
programs and staff support; • Buildings are not as cleanly as they used to be, nor are
grounds – worrying for parents especially with elementary school students;
• Reductions in counselors are impacting access to, and effectiveness of, counselors in helping with college prep and scheduling;
• Course reductions mean less choices – and more costs + logistics help if they want to still take a course, but need to do so outside of AAPS…..
7

Donor District Status Exacerbated by Disconnect between Economic Growth, Proposal A and Budget Policy
8
Average Ann Arbor Home Values will increase 2.7% in Summer 2014
AAPS will have another net reduction in funds next year:
($488,000 - $1,500,000)
Ann Arbor taxpayers will contribute more money to the School Aid Fund, equal to $94 per student toward the general foundation allowance.
$94 Ann Arbor tax
contribution
AAPS FY15 Foundation Allowance
Donor District = $50 AAPS increase; state will take $44 per student

MPSERS Cost Growth Way Outpaces Foundation Allowance
9
MPSERS grew 113% since 1999/00; our Foundation Allowance grew 8.68% over the same period. While we capped healthcare costs, they grew 109% over this period.
Rev
en
ue
: Fo
un
dat
ion
Allo
wan
ce
% E
xpe
nse
Incr
eas
es
Expenses are shown in pink and red; revenue in green. MPSERS is not a locally controlled expense. Healthcare cost has been capped at $12,582 in AAPS. Of these items healthcare cost is the only one AAPS has some control over.
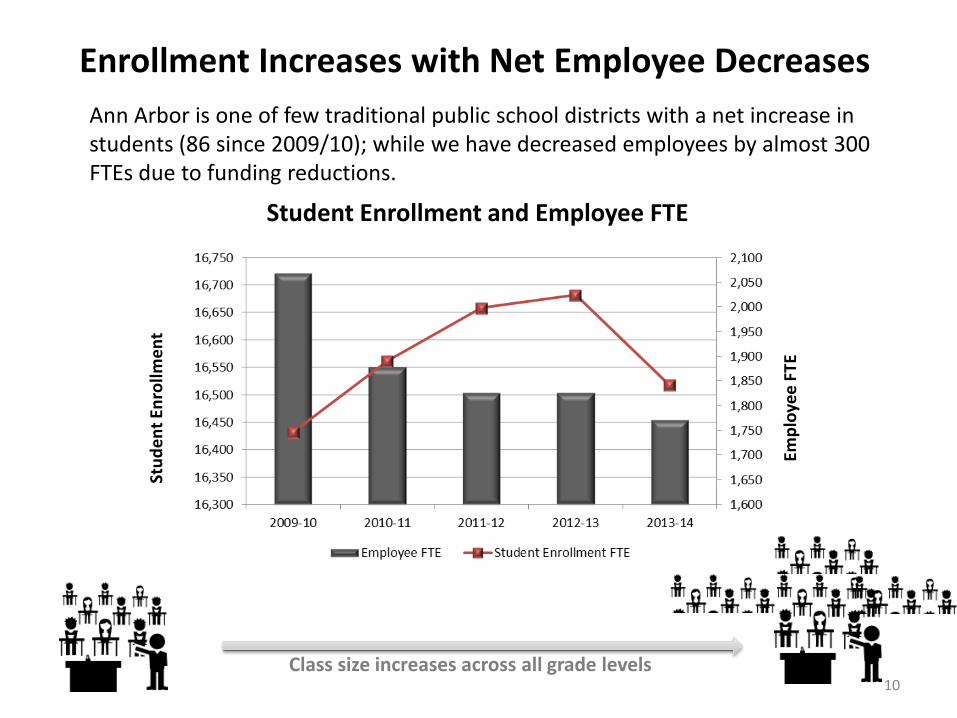
Enrollment Increases with Net Employee Decreases
10
Stu
de
nt
Enro
llme
nt
Emp
loye
e F
TE
Student Enrollment and Employee FTE
Ann Arbor is one of few traditional public school districts with a net increase in students (86 since 2009/10); while we have decreased employees by almost 300 FTEs due to funding reductions.
Class size increases across all grade levels
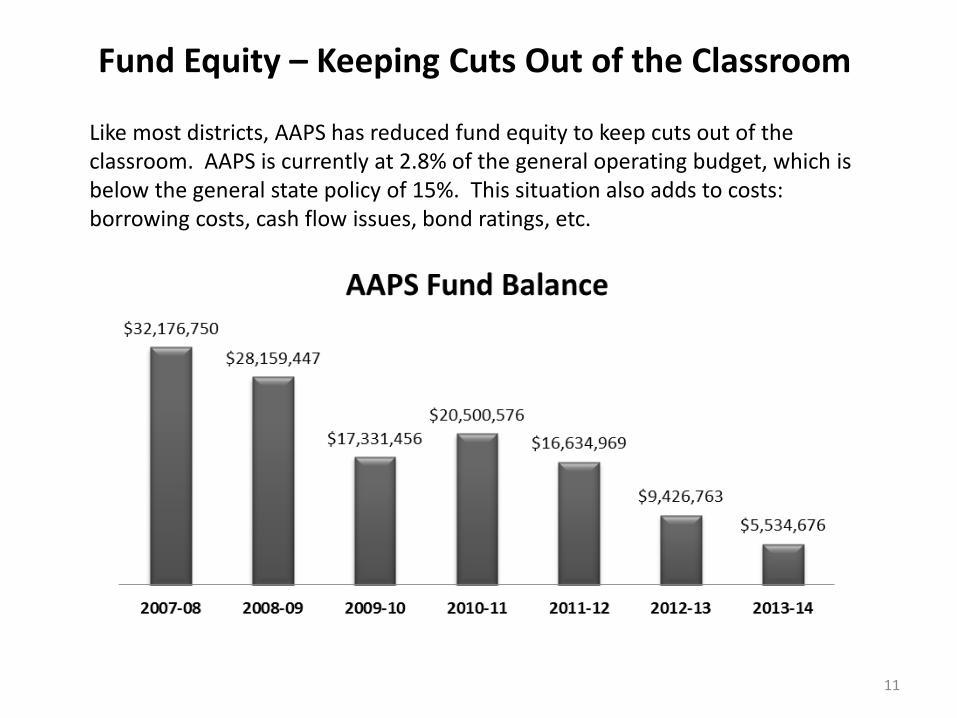
Fund Equity – Keeping Cuts Out of the Classroom
11
Like most districts, AAPS has reduced fund equity to keep cuts out of the classroom. AAPS is currently at 2.8% of the general operating budget, which is below the general state policy of 15%. This situation also adds to costs: borrowing costs, cash flow issues, bond ratings, etc.

State Tax Changes Mean Permanent Reductions in School Funding: $20M Annual Reduction for AAPS
12
• MI Business Tax to 6% Corporate Tax
• $750 Million reduction to School Aid Fund per year
• Reduction of General Fund Support to School Aid Fund = $431 Million per year
• Programs previously paid by General Fund now paid by School Aid Fund = $650 Million Ex. Colleges
$1.831 Billion Annual Disinvestment in K-12
Total Reduction
$1,205 Per Student
Ann Arbor Public Schools:
$19.9 Million
Annual Loss In Revenue
Our Family’s Outlook
13
Our family is increasingly frustrated and upset. They have limited/no means to impact the funding situation, although every opportunity to improve funds, they have supported. They still want a high quality education for their children – but this is increasingly at risk.
• Classroom sizes are larger; • They pay more for many things: extracurricular programs, supports and materials
for classroom or other activities; • Their commute time has increased, as the children now walk up to 1.5 miles to
get onto a bus that used to pick them up in front of their home; • They are frustrated with the outlook of a continued gap in funds, with limited/no
means to raise local revenue for the AAPS • What they are asking at home:
Can we stay in Michigan?

State Places Lower Priority on School Aid Funding
14
Michigan Policymakers give lower priority to K-12 education in recent budgets as compared to the past (19% less in 2014 relative to 2001).
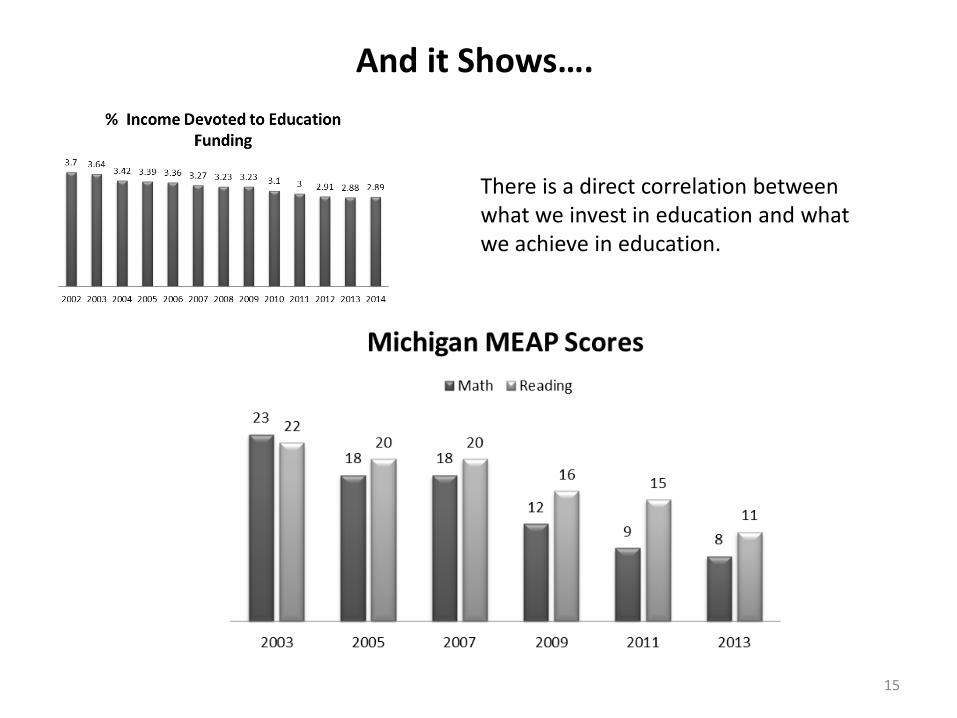
And it Shows….
15
There is a direct correlation between what we invest in education and what we achieve in education.
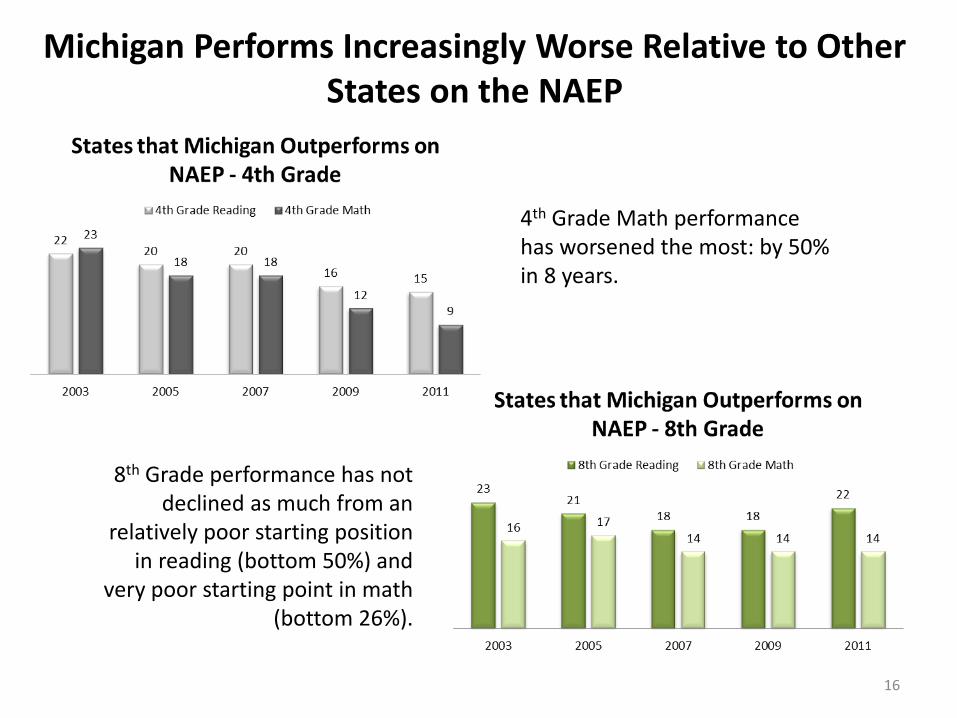
Michigan Performs Increasingly Worse Relative to Other States on the NAEP
16
4th Grade Math performance has worsened the most: by 50% in 8 years.
8th Grade performance has not declined as much from an
relatively poor starting position in reading (bottom 50%) and
very poor starting point in math (bottom 26%).

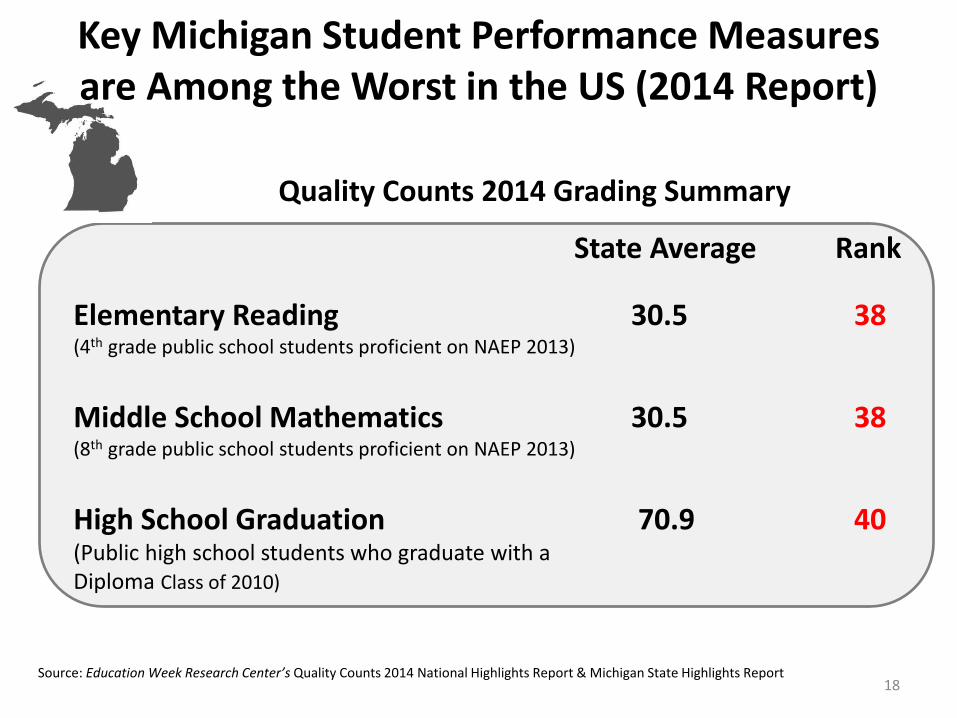
Other Measures Show Similar Poor Ratings for Michigan
17 Source: Education Week Research Center’s Quality Counts 2014 National Highlights Report & Michigan State Highlights Report
Quality Counts 2014 Grading Summary Michigan’s
Grade Rank
Chance for Success (2014) C 33 (Early foundations, School years, & Adult Outcomes)
K-12 Achievement (2014) D 42 (Status, Change, Equity)
School Finance Analysis (2014) C 21 (Equity, Spending)
18
Quality Counts 2014 Grading Summary State Average Rank
Elementary Reading 30.5 38 (4th grade public school students proficient on NAEP 2013)
Middle School Mathematics 30.5 38 (8th grade public school students proficient on NAEP 2013)
High School Graduation 70.9 40 (Public high school students who graduate with a Diploma Class of 2010)
Source: Education Week Research Center’s Quality Counts 2014 National Highlights Report & Michigan State Highlights Report
Key Michigan Student Performance Measures are Among the Worst in the US (2014 Report)

Michigan’s Poor Education Foundation Impacts the Adult Workforce and Economic Viability
19
Quality Counts 2014 Grading Summary State Average Rank National
Average
Adult Educational Attainment 37.5 33 39.5 (Adults with a two- or four-year postsecondary degree 2012)
Annual Income 47.6 30 50.2 (Adults with incomes at or above national median 2012))
Steady Employment 64.5 50 69.8 (Adults in labor force working full time and year round 2012)
Source: Education Week Research Center’s Quality Counts 2014 National Highlights Report & Michigan State Highlights Report

Michigan’s Economic Future
20
80% of Michigan’s growth since 2010 is in the Ann Arbor area.
11,921
9,449
Net:
Ann Arbor plays a significant role in the economic future of Michigan.
Source: US Census Bureau, http://quickfacts.census.gov/qfd/states/26/26161.html, accessed June 15, 2014.

Growing Our Own is Critical
21
% Residents Born in State
Michigan predominantly grows its own human resources. Only Louisiana has a higher % of residents born in state. We are uniquely dependent on growing our own talent. Our economic future is primarily dependent on our investments in our own people.
U.S. Average: 59%
Michigan: 76.6%
Source: 3-year cumulative American Community Survey of he U.S. Bureau of the Census centered on 2012.
1. Louisiana 78.4% 3. Ohio 75.0% 4. Pennsylvania 73.9% 5. Iowa 71.8% 6. Wisconsin 71.8% 7. Mississippi 71.6% 8. West Virginia 70.5%
% Residents Born in State: Top States
% Residents Born in State: Bottom States
51. Florida 35.4% 50. District of Columbia 37.6% 49. Arizona 38.1% 48. Alaska 39.8% 47. Wyoming 40.8% 46. Colorado 42.3%
States successful in attracting outsiders to move in have more options for improving their economy.

Solutions
22
• Achieves an adequate education funding foundation across the state
• Allows communities the opportunity to invest more in education: Communities essential to
the economic future of Michigan may be willing and able to invest in a way that attracts more people and jobs to our communities and state
Education becomes less subject to partisan politics
State saves money & achieves economic growth
#1: Base Foundation + Local Levy Authority
#2: MPSERS is funded by ALL Public Education
Entities
• Removes much of the for profit incentive that currently is built in to the charter and cyber school model
• Expands the cost burden of an under-funded pension to more entities
• Reduces the MPSERS cost escalation that is currently solely borne by traditional public schools
#3: Put a Reasonable Limit on Donor District
% Contribution
• Removes much of the for profit incentive that currently is built in to the charter and cyber school model
• Expands the cost burden of an under-funded pension to more entities
• Reduces the cost escalation that is currently solely borne by traditional public schools

Solutions
23
• Provides increases for every district that meet or exceed a threshold tied to inflation and personal income
• Decreases the erosion of funding inherent in the current model
• Scales to revenue relevant to tax payers
#4: Tie Funding Growth to Inflation & Personal
Income Growth
#5: Allow for Strategic Investments in Funding
• Future jobs require more knowledge-based skills
• Allow for incremental growth if deemed strategic to growing our own workforce
#6: Reward Excellence
• Inspires more districts to pursue excellence and rewards those that make additional investments
• Solves the issue of few rewards, mostly penalties and unfunded mandates
• May attract better talent to teach our students, which leads to further economic growth

Solutions
24
• Cost of living varies across the state; higher cost areas are not adjusted to reflect this
• Lower Socioeconomic students require more supports and are more expensive to educate
• Special needs students are also more expensive to educate
#7: Consider Cost Factors in Funding
#8: Allow for Strategic Investments in Funding
• Future jobs require more knowledge-based skills
• Allow for incremental growth if deemed strategic to growing our own workforce
#9: Engage Education Leaders in Ongoing
Adjustments
• Leverage expertise for innovation, effectiveness, vetting new solutions

A Bright Future is possible, but…
25
Only if we Fix It!