highlights of public school funding
TRANSCRIPT
Highlights
of the
North Carolina
Public School Budget
February
2015
Information Analysis
Division of School Business
North Carolina Department of Public Instruction
1
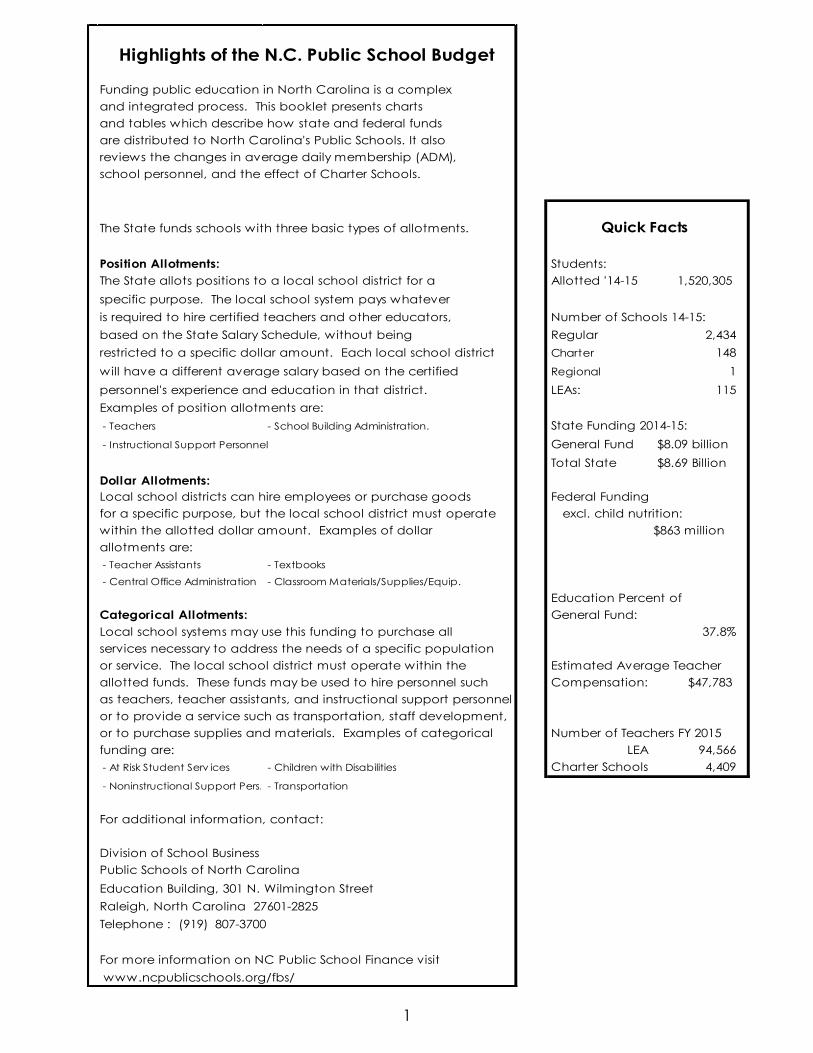
Funding public education in North Carolina is a complex
and integrated process. This booklet presents charts
and tables which describe how state and federal funds
are distributed to North Carolina's Public Schools. It also
reviews the changes in average daily membership (ADM),
school personnel, and the effect of Charter Schools.
The State funds schools with three basic types of allotments.
Position Allotments: Students:
The State allots positions to a local school district for a Allotted '14-15 1,520,305
specific purpose. The local school system pays whatever
is required to hire certified teachers and other educators, Number of Schools 14-15:
based on the State Salary Schedule, without being Regular 2,434
restricted to a specific dollar amount. Each local school district Charter 148
will have a different average salary based on the certified Regional 1
personnel's experience and education in that district. LEAs: 115
Examples of position allotments are:
- Teachers - School Building Administration. State Funding 2014-15:
- Instructional Support Personnel General Fund $8.09 billion
Total State $8.69 Billion
Dollar Allotments:
Local school districts can hire employees or purchase goods Federal Funding
for a specific purpose, but the local school district must operate excl. child nutrition:
within the allotted dollar amount. Examples of dollar $863 million
allotments are:
- Teacher Assistants - Textbooks
- Central Office Administration - Classroom Materials/Supplies/Equip.
Education Percent of
Categorical Allotments: General Fund:
Local school systems may use this funding to purchase all 37.8%
services necessary to address the needs of a specific population
or service. The local school district must operate within the Estimated Average Teacher
allotted funds. These funds may be used to hire personnel such Compensation: $47,783
as teachers, teacher assistants, and instructional support personnel
or to provide a service such as transportation, staff development,
or to purchase supplies and materials. Examples of categorical Number of Teachers FY 2015
funding are: LEA 94,566
- At Risk Student Serv ices - Children with Disabilities Charter Schools 4,409
- Noninstructional Support Pers. - Transportation
For additional information, contact:
Division of School Business
Public Schools of North Carolina
Education Building, 301 N. Wilmington Street
Raleigh, North Carolina 27601-2825
Telephone : (919) 807-3700
For more information on NC Public School Finance visit
www.ncpublicschools.org/fbs/
Highlights of the N.C. Public School Budget
Quick Facts

Percent of the General Fund Public Schools Appropriations
Since 1970, the Public
School’s share of the
General Fund has
decreased by 14.7%. If
our Public Schools were
still funded at the same
percentage as in FY
1969-70, we would have
an additional $3 billion
for our students.
Total State Public School General Fund Appropriations
2000-01 to 2014-15 (in Billions)
Funding increased
from $5.74 billion
in 2000-01 to $8.09
billion in 2014-15.
In 2009-10 state
appropriations
were reduced by
$840 million to
$7.35 billion. Since
this time the
number of
students has
increased by
more than 43,700
yet the funding
level has not
reached the
2008—09 level.
2
30%
35%
40%
45%
50%
55%
2014-152013-142012-132011-122010-112009-102008-092007-081999-001994-951989-901984-851979-801974-751969-70
37.8%37.3%37.3%
37.9%37.4%
39.2%
37.7%
38.9%
40.9%41.3%
45.5%
43.7%
44.7%
46.5%
52.5%
$0
$1
$2
$3
$4
$5
$6
$7
$8
$9
5.745.88 5.92
6.13
6.52
6.86
7.37
7.918.19
7.357.15
7.507.74 7.81
8.09

.
Source of Expenditures
FY 2013-14
Child Nutrition Included
All of the 2013-14 State
expenditures were
attributed to salaries
and benefits except for 6.3%.
How State Funds Were Expended
FY 2013-14
According to the NEA ranking, NC’s
ranking for the percentage of state
funding has declined from 5th in
2007 to 9th in the Nation . The
national average is 46.2%.
Child Nutrition Excluded
State: 66.1% Federal: 8.1% Local: 25.8%
3
Regular Instructional Services
59%
Exceptional Children Services (EC)
11%
Academically and Intellect. Gifted (AIG)
1%
Limited English Proficiency (LEP)
1%
Alternative Programs & Services
3%School-Based Support Services
7%
School Leadership Services6%
System-Wide Support Services
3%
Operational Support & Ancillary Services
9%
Federal, 11.7%
Local, 26.2%
State, 62.1%

Total Expenditures %
Superintendent 13,312,462$ 0.17%
Assoc. & Asst Superintendent 15,347,116 0.20%
Finance Officer 7,355,844 0.10%
Director/Supervisor 45,456,548 0.59%
Principal 149,708,732 1.95%
Assistant Principal 91,847,768 1.20%
Teacher 3,350,869,576 43.60%
Certified Instructional Support 470,642,163 6.12%
Supplement and Differential 23,482,348 0.31%
Teacher Assistant & Aides 337,715,720 4.39%
Non-Instructional Specialist 64,468,822 0.84%
Tutor 17,459,306 0.23%
Clerical 153,799,309 2.00%
Overtime Pay 4,563,469 0.06%
Teacher Substitute Pay 39,872,890 0.52%
Bonus Pay 538,071 0.01%
Mentor Pay 948,796 0.01%
Transportation personnel 216,069,819 2.81%
Other Assignments (Salary) 210,712,323 2.74%
Total Salary 5,214,171,080$ 67.85%
Employer's Social Security Cost 388,318,187$ 5.05%
Retirement Cost 755,966,625 9.84%
Insurance Benefits 705,843,308 9.19%
Longevity 83,747,447 1.09%
Bonus and Annual Leave 46,397,839 0.60%
Disability 5,545,968 0.07%
Total Benefits 1,985,819,374$ 25.84%
Contracted Services 135,366,546$ 1.76%
Workshops 15,713,822 0.20%
Property Services 4,039,260 0.05%
Transportation Services 25,651,497 0.33%
Communications 6,171,444 0.08%
Advertising 24,652 0.00%
Printing & Binding 2,865,963 0.04%
Other Purchased Services 1,211,319 0.02%
Total Purchased Services 191,044,503$ 2.49%
Instructional Supplies 92,485,148$ 1.20%
Computer Software & Supplies 27,944,892 0.36%
Textbooks 10,094,674 0.13%
Library/Audiovisual Services 1,879,168 0.02%
Transportation 100,893,545 1.31%
Non-Capitalized Equipment 49,305,210 0.64%
Total Supplies & Materials 282,602,638$ 3.68%
Equipment 8,759,595 0.11%
Drivers Education Vehicles 1,079,377 0.01%
Total Capital 9,838,972$ 0.13%
Total Other 1,246,977$ 0.02%
Total: 7,684,723,543$ 100%
Capital
Other
Fiscal year 2013-14
For full detail of expenditures by LEA visit http://www.ncpublicschools.org/fbs/resources/data/
Summary of Expenditures - LEAs
Salary
Employee Benefits
Purchased Services
Supplies & Materials
4

Allotted Average Daily Membership
1995-2015
Allotted Average Daily Membership (ADM) is based on the higher of:
(a) Actual ADM from the prior year, or
(b) Projected ADM of the current year.
Average Daily Membership for each school month is based on the sum of the
days in membership for all students in individual LEAs, divided by the number of days
in the school month. To be included in ADM, a student must have a class schedule
that is at least 1/2 of the school’s instructional day.
5
Note: Decrease in 2009-10 Average Daily Membership is due to the change in the Kindergarten age cut off.
Starting in 2009-10, students may not be enrolled in a NC public school unless they are 5 years of age on or
before August 31st, previously October 16th. This represented a decrease in Kindergarten of 13,490.
1,1
45,3
48
1,1
67,0
30
1,2
01
,68
8
1,2
26,0
60
1,2
45
,71
5
1,2
58,6
07
1,2
74,3
26
1,2
83,9
24
1,3
06,1
53
1,3
21,2
03
1,3
45
,46
9
1,3
69,4
93
1,4
05,4
55
1,4
30
,848
1,4
41,8
72
1,4
26
,79
2
1,4
34
,43
6
1,4
36,1
62
1,4
43,9
98
1,4
56,3
30
1,4
56,1
19
4,569
14,230
17,124
19,832
21,603
23,138
27,029
29,170
30,892
34,694
38,122 41,232 44,829
48,795
53,655 64,186
1,000,000
1,050,000
1,100,000
1,150,000
1,200,000
1,250,000
1,300,000
1,350,000
1,400,000
1,450,000
1,500,000
1,550,000
1,600,000
1995 1997 1999 2001 2003 2005 2007 2009 2011 2013 2015
LEA Charter

Allotted Average Daily Membership
FY 2014-15
6
LEA Name ADM LEA Name ADM LEA Name ADM
Alamance-Burlington 22,706 Edgecombe County 6,133 Chapel Hill-Carrboro 12,353
Alexander County 5,310 Forsyth County 53,701 Pamlico County 1,274
Alleghany County 1,456 Franklin County 8,780 Pasquotank County 5,678
Anson County 3,609 Gaston County 31,293 Pender County 9,034
Ashe County 3,187 Gates County 1,659 Perquimans County 1,800
Avery County 2,164 Graham County 1,203 Person County 4,622
Beaufort County 7,038 Granville County 8,174 Pitt County 23,881
Bertie County 2,645 Greene County 3,146 Polk County 2,275
Bladen County 4,743 Guilford County 72,202 Randolph County 18,139
Brunswick County 12,571 Halifax County 3,267 Asheboro City 4,762
Buncombe County 25,640 Roanoke Rapids City 3,035 Richmond County 7,703
Asheville City 4,327 Weldon City 1,050 Robeson County 23,570
Burke County 12,852 Harnett County 20,408 Rockingham County 13,159
Cabarrus County 30,519 Haywood County 7,536 Rowan-Salisbury 19,837
Kannapolis City 5,423 Henderson County 13,650 Rutherford County 8,543
Caldwell County 12,195 Hertford County 3,091 Sampson County 8,613
Camden County 1,923 Hoke County 8,365 Clinton City 3,055
Carteret County 8,471 Hyde County 594 Scotland County 6,069
Caswell County 2,762 Iredell-Statesv ille 20,967 Stanly County 8,666
Catawba County 16,912 Mooresv ille City 6,039 Stokes County 6,558
Hickory City 4,316 Jackson County 3,719 Surry County 8,398
Newton-Conover 3,179 Johnston County 34,096 Elkin City 1,246
Chatham County 8,372 Jones County 1,115 Mount Airy City 1,703
Cherokee County 3,320 Lee County 10,178 Swain County 2,067
Edenton/Chowan 2,235 Lenoir County 9,193 Transylvania County 3,534
Clay County 1,357 Lincoln County 11,589 Tyrrell County 561
Cleveland County 15,103 Macon County 4,354 Union County 42,105
Columbus County 6,132 Madison County 2,512 Vance County 6,588
Whitev ille City 2,259 Martin County 3,407 Wake County 156,207
Craven County 14,526 McDowell County 6,403 Warren County 2,379
Cumberland County 52,002 Mecklenburg County 144,618 Washington County 1,711
Currituck County 3,922 Mitchell County 1,976 Watauga County 4,386
Dare County 5,029 Montgomery County 4,161 Wayne County 19,303
Davidson County 19,965 Moore County 12,986 Wilkes County 9,928
Lexington City 3,089 Nash-Rocky Mount 16,112 Wilson County 12,497
Thomasville City 2,348 New Hanover County 25,852 Yadkin County 5,484
Davie County 6,411 Northampton County 2,040 Yancey County 2,313
Duplin County 9,881 Onslow County 26,010 Charter Schools - Public 64,186
Durham County 33,907 Orange County 7,698 Total 1,520,305

7
Based on the State Public School Fund Certif ied Budget per Long Sheets 9/25/2014 plus transfers Budgeted Budgeted % of Total
Positions Funds
I. State Aid - Local Education Agencies
General Administration
Central Office Administration $94,386,875 1.09%
Instructional Personnel and Related Services
Classroom Teachers 69,156.50 3,017,215,584
Teacher Assistants 376,107,530
Instructional Support 7,010.00 347,645,151
School Building Administration 4,066.58 237,206,208
Classroom Materials/Instructional Supplies/Equipment 43,815,896
Textbooks 24,265,721
Annual Leave 47,211,431
Estimated Matching Benefits (Note 1) 1,250,798,887
Subtotal 5,344,266,408 61.48%
Support
Noninstructional Support Personnel 367,330,979 4.23%
Categorical Programs
Academically & Intellectually Gifted 77,880,694
At Risk Student Services/Alternative Schools 291,183,097
Middle School Safety Officer Grant 7,000,000
Panic Alarms Grant 900,000
Children with Special Needs 784,172,856
Disadvantaged Student Supplemental Funding 85,488,650
Driver Education (DOT) 26,461,843
Limited English Proficiency 77,647,338
Low Wealth Supplemental Funding 215,621,537
School Connectivitiy 19,919,762
School Technology - Fines and Forfeitures ($18m) & Indian Gaming ($6m) 24,000,000
Small County Supplemental Funding 47,543,689
Transportation 455,864,208
Vocational Education 6,904.15 443,277,172
Subtotal 2,556,960,846 29.42%
II. Other Public School Appropriations
ADM Contingency Reserve 2,618,500
Advanced Placement 10,831,184
Children in Private Psychiatric Residential Treatment Facilities 3,200,000
Contracts-Finance Officer Staff Development 64,560
EVAAS 2,795,000
Excellent Schools Act 36,617,010
Excellent Schools Act - Merit Pay (NR) 10,200,000
Cooperative and Innovative HS (Early College - $26.4m, Yadkin - $.3m, Small Speciality - $4m) 30,730,689
141,454,832
School Based Child and Family Support Teams 10,051,540
School Breakfast 2,017,761
School Bus Replacement 43,567,191
Liability Insurance for Public Schools 3,145,000
Testing 15,994,747
Tort Claims (Department of Justice) 5,211,964
UERS 10,258,861
Subtotal 328,758,839 3.78%
Total State Public School Fund Requirements 8,691,703,947 100.00%
Funded by Receipts (Civil Penalties, Lottery Fund, Sales Tax Refund, Highway Fund, Surplus Sales) (603,155,893) 6.94%
Grand Total State Appropriation 8,088,548,054$ 93.06%
DPI Agency Budget with Office of Early Learning
State Appropriation = $49,042,420 DPI Positions = State 413, Federal 232, Receipt 108. Total 753
NCVPS = State 22, Federal 1. Total 23
Residential & Governor Schools = $21,204,139 Residential Schools = State 348. Total 348
NCCAT = $3,219,222 NCCAT = State 46. Total 47
Flow Through Appropriations = $8,668,238
Note 1:
N.C. Elementary and Secondary Education Appropriated Funds FY 2014-15
Personnel Svcs (Longevity $56.2m, ST Disability $7.1m, Workers Comp $48.4m,
Unemployment $27.8m, Svc - $1.9m)
Includes funds for Social Security, Ret irement, and Hospitalizat ion for posit ion/month of employment allotments for Classroom Teachers, Instruct ional Support andSchool Building
Administrat ion. Benef its for other LEA staff are included in the dollar allotments, such as Central Off ice Administrat ion and Vocat ional Educat ion.

Initial Allotment Formulas
FY 2014-15
8
Administration
Category Basis of Allotment (Funding Factors are rounding.)
Central Office Administration Decrease by LEA from FY 13-14 Initial Allotment is -1.36%.
Instructional Personnel and Support Services
Category Basis of Allotment (Funding Factors are rounded.) Allotted Salary
Classroom Teachers
Grades Kindergarten 1 per 18 in ADM.
Grades 1 - 3 1 per 17 in ADM.
Grades 4 - 6 1 per 24 in ADM.
Grades 7 - 8 1 per 23 in ADM.
Grade 9 1 per 26.5 in ADM.
Grades 10 - 12 1 per 29 in ADM. LEA Average
Math/Science/Computer Teachers 1 per county or based on sub agreements.
Teacher Assistants $772.07 per K-3 ADM. N/A
Instructional Support 1 per 218.55 in ADM. LEA Average
School Building Administration Principals 1 per school with at least 100 ADM or at least 7 state paid teachers or LEA Average
Assistant Principals 1 month per 98.53 in ADM. LEA Average
Career Technical Ed. - MOE Base of 50 Months of Employment per LEA with remainder distributed LEA Average
(LIMITED FLEXIBILITY- Salary Increase) based on ADM in grades 8-12.
Classroom Materials/Instructional $ 28.38 per ADM plus $2.69 per ADM in grades 8 and 9 for PSAT Testing
Supplies/Equipment
Textbooks $14.86 per ADM in grades K-12.
Employee Benefits
Category Basis of Allotment
Hospitalization $5,378 per position per year.
Retirement 15.21% of total salaries.
Social Security 7.65% of total salaries.
Statewide Average Salaries for FY 2014-15 (Benefits are not included)
Category Basis of Allotment
Teachers $43,342
Principals (MOE) $5,343
Assistant Principals (MOE) $4,899
Career Technical Ed. (MOE) $4,562
Instructional Support $49,355
Support
Category Basis of Allotment (Funding Factors are rounded.)
Noninstructional Support Personnel $240.19 per ADM.
$6,000 per Textbook Commission member for Clerical Assistants.
instructional support personnel. Schools opening after 7/1/2011 are eligible
based on at least 100 ADM only.
Note: Dollars for 2014-15 position/month allotments are based on LEA's average salary including benefits, rather than the statewide average
salary. They are still position/month allotments and the LEA must stay within the positions/months allotted, not the dollars. This calculation is
necessary to determine the LEA's allotment per ADM for charter schools.
Initial Allotment Formulas
FY 2014-15
9
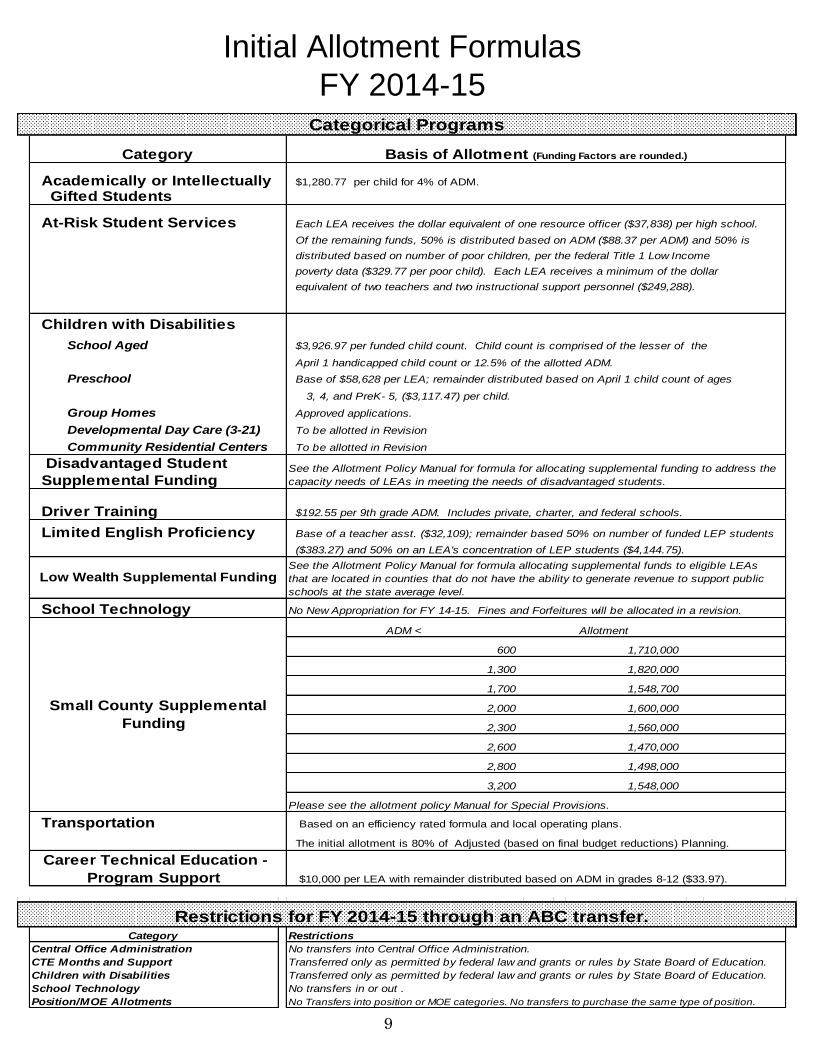
Categorical Programs
Category Basis of Allotment (Funding Factors are rounded.)
Academically or Intellectually $1,280.77 per child for 4% of ADM.
Gifted Students
At-Risk Student Services Each LEA receives the dollar equivalent of one resource officer ($37,838) per high school.
Of the remaining funds, 50% is distributed based on ADM ($88.37 per ADM) and 50% is
distributed based on number of poor children, per the federal Title 1 Low Income
poverty data ($329.77 per poor child). Each LEA receives a minimum of the dollar
equivalent of two teachers and two instructional support personnel ($249,288).
Children with Disabilities
School Aged $3,926.97 per funded child count. Child count is comprised of the lesser of the
April 1 handicapped child count or 12.5% of the allotted ADM.
Preschool Base of $58,628 per LEA; remainder distributed based on April 1 child count of ages
3, 4, and PreK- 5, ($3,117.47) per child.
Group Homes Approved applications.
Developmental Day Care (3-21) To be allotted in Revision
Community Residential Centers To be allotted in Revision
Disadvantaged Student
Supplemental Funding
Driver Training $192.55 per 9th grade ADM. Includes private, charter, and federal schools.
Limited English Proficiency Base of a teacher asst. ($32,109); remainder based 50% on number of funded LEP students
($383.27) and 50% on an LEA's concentration of LEP students ($4,144.75).
School Technology No New Appropriation for FY 14-15. Fines and Forfeitures will be allocated in a revision.
ADM <
600
1,300
1,700
2,000
2,300
2,600
2,800
3,200
Transportation Based on an efficiency rated formula and local operating plans.
The initial allotment is 80% of Adjusted (based on final budget reductions) Planning.
Career Technical Education -
Program Support $10,000 per LEA with remainder distributed based on ADM in grades 8-12 ($33.97).
Category Restrictions
Central Office Administration No transfers into Central Office Administration.
CTE Months and Support Transferred only as permitted by federal law and grants or rules by State Board of Education.
Children with Disabilities Transferred only as permitted by federal law and grants or rules by State Board of Education.
School Technology No transfers in or out .
Position/MOE Allotments No Transfers into position or MOE categories. No transfers to purchase the same type of position.
1,710,000
1,820,000
1,548,700
1,600,000
1,560,000
Restrictions for FY 2014-15 through an ABC transfer.
1,470,000
Low Wealth Supplemental FundingSee the Allotment Policy Manual for formula allocating supplemental funds to eligible LEAs
that are located in counties that do not have the ability to generate revenue to support public
schools at the state average level.
See the Allotment Policy Manual for formula for allocating supplemental funding to address the
capacity needs of LEAs in meeting the needs of disadvantaged students.
1,498,000
1,548,000
Please see the allotment policy Manual for Special Provisions.
Small County Supplemental
Funding
Allotment

What State Money Is Available To Local Education Agencies?
Types of State Funding
FY 2014-15
65.3% of the State funds are allocated as guaranteed certified positions.
Therefore, a LEA receives a position (or month of employment) and the state
pays for the salary and benefits for the position, regardless of where the
individual falls on a salary schedule.
So… a state paid teacher with 5 yrs experience has the same budget impact
to a LEA as a state paid teacher with 25 yrs experience, they both = 1
position.
10
Position, 65.3%
Dollar, 10.4%
Categorical, 24.3%
11
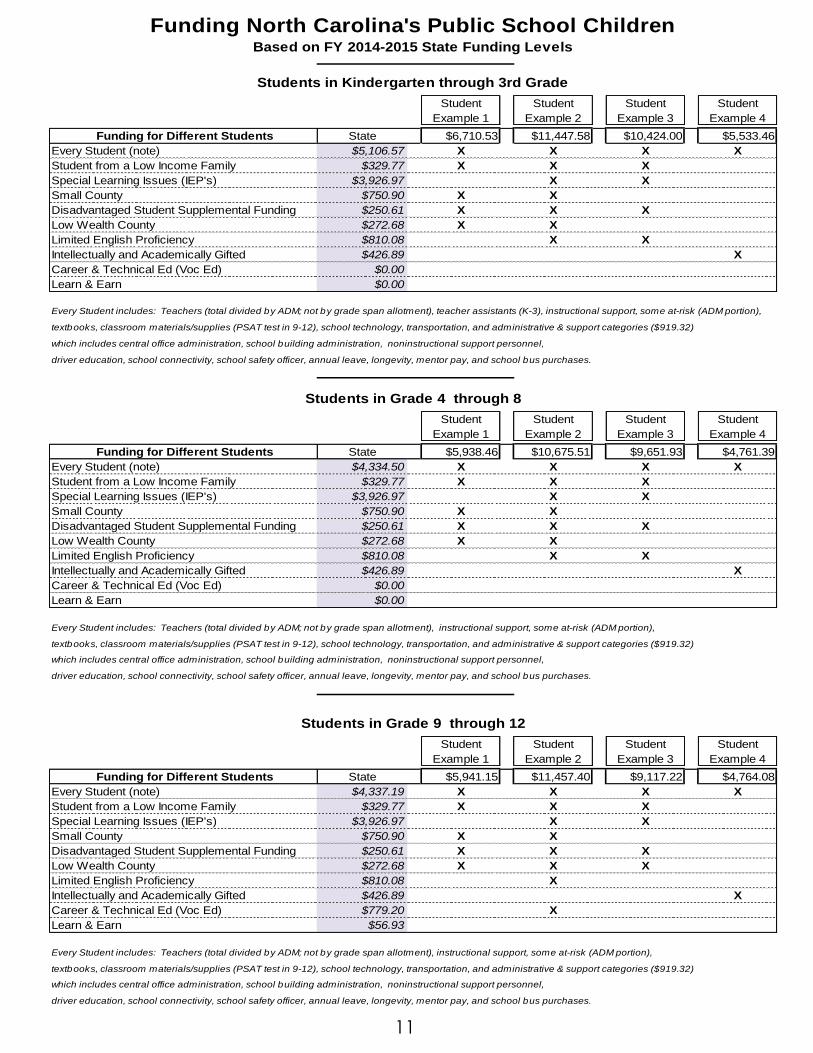
Funding North Carolina's Public School ChildrenBased on FY 2014-2015 State Funding Levels
Students in Kindergarten through 3rd Grade
Student Student Student Student
Example 1 Example 2 Example 3 Example 4
Funding for Different Students State $6,710.53 $11,447.58 $10,424.00 $5,533.46
Every Student (note) $5,106.57 X X X X
Student from a Low Income Family $329.77 X X X
Special Learning Issues (IEP's) $3,926.97 X X
Small County $750.90 X X
Disadvantaged Student Supplemental Funding $250.61 X X X
Low Wealth County $272.68 X X
Limited English Proficiency $810.08 X X
Intellectually and Academically Gifted $426.89 X
Career & Technical Ed (Voc Ed) $0.00
Learn & Earn $0.00
Every Student includes: Teachers (total divided by ADM; not by grade span allotment), teacher assistants (K-3), instructional support, some at-risk (ADM portion),
textbooks, classroom materials/supplies (PSAT test in 9-12), school technology, transportation, and administrative & support categories ($919.32)
which includes central office administration, school building administration, noninstructional support personnel,
driver education, school connectivity, school safety officer, annual leave, longevity, mentor pay, and school bus purchases.
Students in Grade 4 through 8
Student Student Student Student
Example 1 Example 2 Example 3 Example 4
Funding for Different Students State $5,938.46 $10,675.51 $9,651.93 $4,761.39
Every Student (note) $4,334.50 X X X X
Student from a Low Income Family $329.77 X X X
Special Learning Issues (IEP's) $3,926.97 X X
Small County $750.90 X X
Disadvantaged Student Supplemental Funding $250.61 X X X
Low Wealth County $272.68 X X
Limited English Proficiency $810.08 X X
Intellectually and Academically Gifted $426.89 X
Career & Technical Ed (Voc Ed) $0.00
Learn & Earn $0.00
Every Student includes: Teachers (total divided by ADM; not by grade span allotment), instructional support, some at-risk (ADM portion),
textbooks, classroom materials/supplies (PSAT test in 9-12), school technology, transportation, and administrative & support categories ($919.32)
which includes central office administration, school building administration, noninstructional support personnel,
driver education, school connectivity, school safety officer, annual leave, longevity, mentor pay, and school bus purchases.
Students in Grade 9 through 12
Student Student Student Student
Example 1 Example 2 Example 3 Example 4
Funding for Different Students State $5,941.15 $11,457.40 $9,117.22 $4,764.08
Every Student (note) $4,337.19 X X X X
Student from a Low Income Family $329.77 X X X
Special Learning Issues (IEP's) $3,926.97 X X
Small County $750.90 X X
Disadvantaged Student Supplemental Funding $250.61 X X X
Low Wealth County $272.68 X X X
Limited English Proficiency $810.08 X
Intellectually and Academically Gifted $426.89 X
Career & Technical Ed (Voc Ed) $779.20 X
Learn & Earn $56.93
Every Student includes: Teachers (total divided by ADM; not by grade span allotment), instructional support, some at-risk (ADM portion),
textbooks, classroom materials/supplies (PSAT test in 9-12), school technology, transportation, and administrative & support categories ($919.32)
which includes central office administration, school building administration, noninstructional support personnel,
driver education, school connectivity, school safety officer, annual leave, longevity, mentor pay, and school bus purchases.

12
Funding North Carolina's Public School Children
Based on FY 2014-2015 Federal Funding Levels
Students in Kindergarten through 3rd Grade
Student Student Student Student
Example 1 Example 2 Example 3 Example 4
Funding for Different Students Federal $1,672.81 $4,958.36 $4,958.36 $27.18
Every Student $27.18 X X X X
Student from a Low Income Family $1,645.63 X X X
Special Learning Issues (IEP's) $2,206.62 X X
Limited English Proficiency $1,078.93 X X
Career & Technical Ed (Voc Ed) $0.00
Students in Grade 4 through 8
Student Student Student Student
Example 1 Example 2 Example 3 Example 4
Funding for Different Students Federal $1,672.81 $4,269.78 $4,269.78 $27.18
Every Student $27.18 X X X X
Student from a Low Income Family $1,645.63 X X X
Special Learning Issues (IEP's) $1,518.04 X X
Limited English Proficiency $1,078.93 X X
Career & Technical Ed (Voc Ed) $0.00
Students in Grade 9 through 12
Student Student Student Student
Example 1 Example 2 Example 3 Example 4
Funding for Different Students Federal $1,672.81 $4,297.04 $4,269.78 $27.18
Every Student $27.18 X X X X
Student from a Low Income Family $1,645.63 X X X
Special Learning Issues (IEP's) $1,518.04 X X
Limited English Proficiency $1,078.93 X X
Career & Technical Ed (Voc Ed) $27.26 X
Federal Funding Level:
Funding includes federal formula grants only.
Every Student includes Funds from Improving Teacher Quality.
Student from a Low Income Family includes Title I, Title I Reward School Mini-Grant, Title I School Improvement 1003G and Title I School
Improvement. Title I School Improvement 1003G allocation was included in FY2012-2013, no allocation was made in FY2011-2012 and
to date no allocation has been made in FY2013-2014 or FY 2014-15.
Special Learning Issues includes IDEA VI B Preschool Handicapped, and IDEA VI B School Age Handicapped.

Example of Student Funding Grades K-3 (State & Federal)
Difficulties in Comparing
Dollars per ADM
• Huge variance in the size of LEAs. ADM ranges from systems with an ADM of 561 to an ADM of 156,207.
• Certain fixed costs in LEAs such central office operations
• Younger Teachers versus Older Teachers (experience levels)
• Fixed Salary Schedules
Teacher Comparison
• Ex: Teacher in Wake with 5 years experience, versus Hyde with 20 years experience.
– Cost per ADM for Hyde is greater.
– Both schools have a teacher.
13
Student Example1, $5,560.64
Student Example 2 $8,383.34
Student Example 3, $15,382.36
Student Example 4, $16,405.94
Student in grade K-3 with no additional needs.
Academically Gifted Student from Low-Income Family living in a Small, Low-Wealth County. $2,822.70 additional funds
Limited English Proficient Student with Special Learning Issues Disadvantaged Student from Low-Income Family. $9,821.72 additional funds.
Limited English Proficient Student with Special Learning Issues Disadvantaged Student from Low-Income Family living in a Small, Low-Wealth County. $10,845.30 additional funds

Teacher Allotment Ratios and Allotted Positions FY 2014-15
Positions and Salaries FY 2014-15
The average salary
amounts do not include matching
benefits
Social Security – 7.65%,
Retirement – 15.21%
Hospitalization - $5,378
14
2014-15 Grade
Spans
Teacher
Allotment Ratio
Class-Size Average
Ratio for the LEA
Individual Class-
Size Maximum
Positions Allotted
in 2014-15
K 1:18 1:21 1:24 6,496.5
1-3 1:17 1:21 1:24 20,379.0
4-6 1:24 See Note See Note 13,527.5
7-8 1:23 See Note See Note 9,896.5
9 1:26.5 See Note See Note 4,747.0
10-12 1:29 See Note See Note 10,862.0
Total 2014 - 15 65,908.5
Total 2012 - 13 68,793.0
Decrease (2,884.5)
Notwithstanding G.S. 115C-301 or any other law, for the 2013-2015 fiscal biennium, the class size requirements in kindergarten through
third grade shall remain unchanged. (2013 HB112 Section 3.3(d))
Personnel Type Salary Range
Average
Base
Salary
Allotted
Positions
Superintendent (12 months) $57,828 - $139,500 N/A N/A
Assoc/Asst Supt/Dir $40,692 - $104,772 N/A N/A
Supervisors/Coord (12 months)
Principals (12 months) $51,540 - $110,364 $62,902 2,425
Assistant Principals (10 months) $38,280 - $65,170 $48,353 1,471
Teachers (10 months) $33,000 - $68,050 $43,426 65,592
Instructional Support (10 months) $33,000 - $68,050 $49,273 6,672
Vocational Education (10 months) $33,000 - $68,050 $45,428 6,565
Teacher Asistants $1,977.18 - $3,143.20 $21,258 N/A
Clerical $1,916.76 - $4,060.42 $31,791 N/A
Custodian $1,898.40 - $3,633.63 $20,984 N/A
Non Certified Employees - Monthly Salary
Local Education Agencies
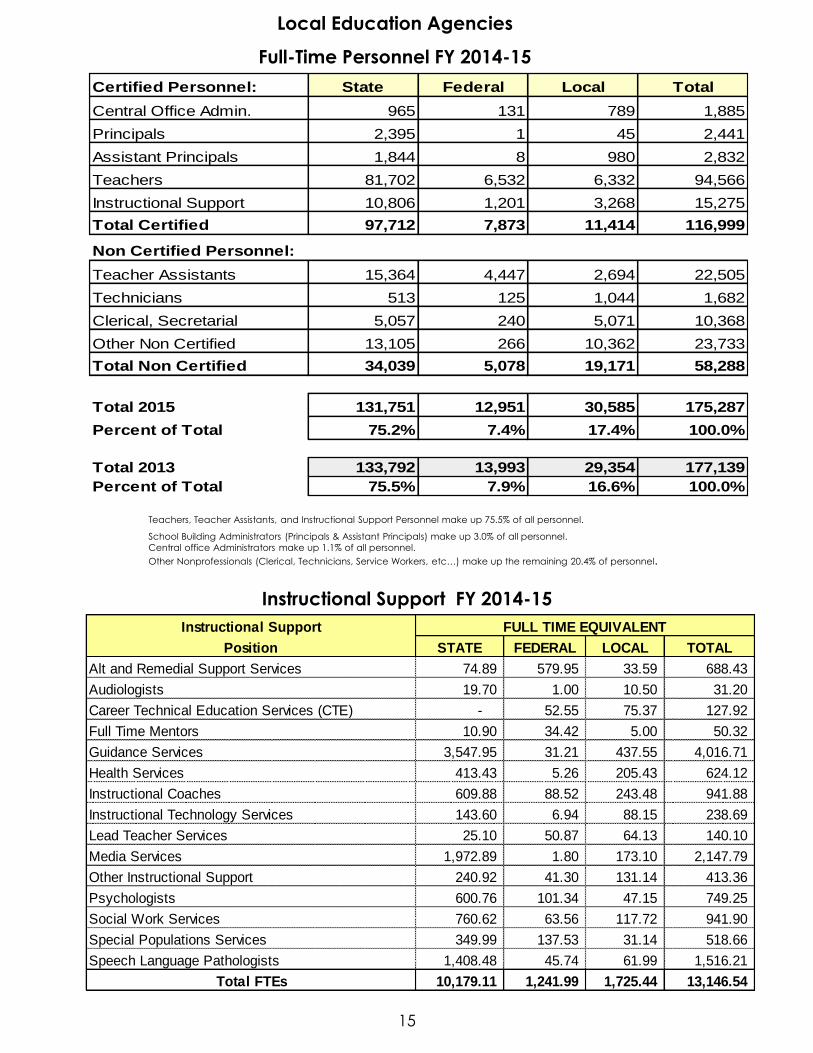
Full-Time Personnel FY 2014-15
Teachers, Teacher Assistants, and Instructional Support Personnel make up 75.5% of all personnel.
School Building Administrators (Principals & Assistant Principals) make up 3.0% of all personnel.
Central office Administrators make up 1.1% of all personnel.
Other Nonprofessionals (Clerical, Technicians, Service Workers, etc…) make up the remaining 20.4% of personnel.
Instructional Support FY 2014-15
15
Certified Personnel: State Federal Local Total
Central Office Admin. 965 131 789 1,885
Principals 2,395 1 45 2,441
Assistant Principals 1,844 8 980 2,832
Teachers 81,702 6,532 6,332 94,566
Instructional Support 10,806 1,201 3,268 15,275
Total Certified 97,712 7,873 11,414 116,999
Non Certified Personnel:
Teacher Assistants 15,364 4,447 2,694 22,505
Technicians 513 125 1,044 1,682
Clerical, Secretarial 5,057 240 5,071 10,368
Other Non Certified 13,105 266 10,362 23,733
Total Non Certified 34,039 5,078 19,171 58,288
Total 2015 131,751 12,951 30,585 175,287
Percent of Total 75.2% 7.4% 17.4% 100.0%
Total 2013 133,792 13,993 29,354 177,139
Percent of Total 75.5% 7.9% 16.6% 100.0%
Instructional Support
Position STATE FEDERAL LOCAL TOTAL
Alt and Remedial Support Services 74.89 579.95 33.59 688.43
Audiologists 19.70 1.00 10.50 31.20
Career Technical Education Services (CTE) - 52.55 75.37 127.92
Full Time Mentors 10.90 34.42 5.00 50.32
Guidance Services 3,547.95 31.21 437.55 4,016.71
Health Services 413.43 5.26 205.43 624.12
Instructional Coaches 609.88 88.52 243.48 941.88
Instructional Technology Services 143.60 6.94 88.15 238.69
Lead Teacher Services 25.10 50.87 64.13 140.10
Media Services 1,972.89 1.80 173.10 2,147.79
Other Instructional Support 240.92 41.30 131.14 413.36
Psychologists 600.76 101.34 47.15 749.25
Social Work Services 760.62 63.56 117.72 941.90
Special Populations Services 349.99 137.53 31.14 518.66
Speech Language Pathologists 1,408.48 45.74 61.99 1,516.21
Total FTEs 10,179.11 1,241.99 1,725.44 13,146.54
FULL TIME EQUIVALENT

16
Since 1994-95 Fiscal Year
State
Employees Teachers
Consumer
Price Index *
The yearly percentage increase 1994-95 4.0% b. 7.0% c. 2.6%
in salary accumulates to: 1995-96 2.0% 2.0% 2.8%
1996-97 4.5% 5.5% 3.0%
- Teachers - 121.8% 1997-98 4.0% 7.5% d. 2.3%
1998-99 3.0% b. 7.5% d. 1.6%
- State Employees - 54.3%(a)
1999-00 3.0% b. 7.5% d. 2.2%
2000-01 4.2% e. 6.5% d. 3.4%
- Consumer Price Index - 64.1% 2001-02 0.0% f. 2.9% 2.8%
2002-03 0.0% g. 1.8% 1.6%
2003-04 0.0% h. 1.8% 2.3%
2004-05 2.5% i. 2.5% 2.7%
2005-06 2.0% k. 4.2% 3.4%
2006-07 5.5% 8.0% 3.2%
2007-08 4.0% 5.0% 2.8%
2008-09 2.8% l. 4.0% d. 3.8%
2009-10 0.0% 0.0% -0.4%
2010-11 0.0% 0.0% 1.6%
2011-12 0.0% 0.0% 3.2%
2012-13 1.2% m. 1.2% 2.1%
2013-14 0.0% m. 0.0% m. 1.5%
2014-15 1.86% n. 7.0% 1.6%Notes:
* The CPI data reflect the updated values from ftp://ftp.bls.gov/pub/special.requests/cpi/cpiai.txt as 01/30/2014.
a. Flat rate amounts are not included in the percentage accumulation total.
b. Plus a one-time bonus of 1% to each permanent employee (0.5% bonus in 1999-2000).
c. Salary increases for teachers ranged from 5% for teachers with 3 years or less experience
or at the 30 year maximum, to 7% for teachers with over 3 years experience. Principals
and Assistant Principals received a 9% increase. School bus drivers received an 8% increase.
d. Teachers received varying increases depending on their years of experience.
e. Plus a one-time bonus of $500 to each permanent employee.
f. An across-the-board flat rate of $52.08 per month was prov ided for all employees.
g. Full-time State Employees received an additional 10 days vacation.
h. Full-time State Employees received an additional 10 days vacation plus a one-time bonus of $550.
i. State Employees received the greater of $1,000 or 2.5%.
k. State Employees received the greater of $850 or 2.0%.
l. State Employees received the greater of $1,100 or 2.75%
m. Full-time State Employees received an additional 5 days vacation.
n. Full-time State agency employees received $1,000. 1.86% is the calculated average increase.
Compensation IncreasesTeachers and State Employees

Average Teacher Compensation
NOTES:
1) Calculated based
on 6th pay period
payroll.
2) Calculated based
on JHA355EG-R01
expenditure data.
3) Information received
from LEAs annually via
survey.
4) 2014-15 longevity
represents payment for
benefit earned in 2013-
14. Longevity benefit
eliminated as of July 1,
2014.
5) Additional pay per
Office of State Budget,
and Management for
state agency teachers
such as those provided
by Office of Juvenile
Justice and DHHS.
North Carolina vs. National Average Comparison of Average Teacher Compensation
National Average from
NEA Annual Rankings
and Estimates.
Estimated Average
Salary for Southeast
Region FY 2014 was
$48,384.
North Carolina ranks
11th in the Southeast
in Average Teacher
Compensation.
States included are
VA, WV, AL, AR, FL,
GA, KY, LA, MS, SC,
TN, NC
17
2014-15 2014-15
Category Estimate $ Chg
Base Salary (1) 43,166$ 40,189$ 2,977$
New Teacher Orientation (2) 17$ 16$ 1$
Extended Contract (2) 1$ 2$ (1)$
Tutorial Pay (2) 78$ 100$ (22)$
Longevity Pay (4) 407$ 757$ (350)$
Supplementary Pay (3) 3,689$ 3,553$ 136$
Bonus (2) 52$ 6$ 46$
Workshop Participant (2) 11$ 10$ 1$
Annual Leave Pay (1) 262$ 262$ -$
Mentor Pay (2) 9$ 12$ (3)$
Other Assignments (2) 21$ 13$ 8$
Total 47,713$ 44,920$ 2,793$
State Agency Teachers (5) 70$ 70 -$
Grand Total 47,783$ 44,990$ 2,793$
Final
2013-14
43,378
44,655
45,688
46,605
47,659
49,026
50,816
52,308
54,319
55,241 55,623 55,418
56,103 56,689
41,496
42,680 42,41143,211 43,343
43,922
46,137
47,633
48,454
46,85046,700
45,933 45,737
44,990
47,783
$30,000
$35,000
$40,000
$45,000
$50,000
$55,000
$60,000
National Average N.C. Average

Note: NBPTS pay
differential originated
on July 1, 1997.
Teachers who receive a
National Boards for
Professional Teaching
Standards certification
may be eligible for a
12% pay differential.
18
Classroom Teacher Education and Years Experience State Funded only, FY 2014-15
2005 7,399 16.60 $480.61 $4,486
2006 8,582 16.77 $493.34 $4,605
2007 9,604 16.91 $527.47 $4,923
2008 10,478 16.95 $545.91 $5,095
2009 11,314 17.04 $552.16 $5,153
2010 12,175 16.85 $543.87 $5,076
2011 13,641 16.46 $531.70 $4,963
2012 13,973 16.67 $525.56 $4,905
2013 13,363 17.13 $528.11 $4,929
2014 12,630 17.65 $524.73 $4,897
2015 12,112 18.00 $535.20 $5,257
National Board (NBPTS) History
Fiscal Year NBPTS Teachers Years ExpMonthly NBPTS
Pay
Avg Certified
Salary
2015
NBPTS NBPTS NBPTS Average
Bachelors Masters Adv./Doc. Bachelors Masters Adv./Doc. Salary
0 2,707.28 374.94 5.72 - - - 3,087.94 $3,341.07
1 2,838.46 765.93 7.00 - - - 3,611.39 $3,371.08
2 2,785.00 867.14 3.00 - - - 3,655.14 $3,378.77
3 2,094.88 854.43 7.82 - 0.50 - 2,957.63 $3,396.83
4 1,850.28 768.71 5.00 20.00 19.00 - 2,662.99 $3,404.46
5 1,680.05 751.72 10.00 27.00 32.50 - 2,501.27 $3,777.18
6 1,899.25 1,004.08 10.79 44.59 52.50 1.00 3,012.21 $3,794.43
7 1,946.79 1,105.61 14.00 66.90 92.45 1.00 3,226.75 $3,809.84
8 1,942.61 1,089.52 14.47 150.95 206.72 1.00 3,405.27 $3,837.53
9 1,871.13 1,158.38 20.23 182.28 268.39 - 3,500.41 $3,858.26
10 1,725.96 1,178.83 16.19 208.23 299.88 2.00 3,431.09 $4,246.65
11 1,703.33 1,072.59 15.97 201.70 320.93 2.00 3,316.52 $4,247.16
12 1,598.58 986.07 17.76 231.81 313.35 6.00 3,153.57 $4,253.05
13 1,542.56 1,003.41 16.90 218.73 321.71 3.00 3,106.31 $4,258.18
14 1,525.27 971.69 9.50 236.62 320.32 5.50 3,068.90 $4,259.33
15 1,432.56 906.39 20.00 249.19 364.82 11.00 2,983.96 $4,650.99
16 1,348.49 901.97 21.66 220.22 317.50 6.00 2,815.84 $4,645.31
17 1,287.48 861.79 18.92 238.36 327.54 8.00 2,742.09 $4,653.76
18 1,277.23 804.11 22.55 206.90 318.10 7.50 2,636.39 $4,647.86
19 1,110.80 694.58 23.50 209.73 314.70 6.00 2,359.31 $4,661.35
20 1,079.62 674.90 19.32 196.50 275.70 4.00 2,250.04 $4,971.34
21 1,039.01 599.91 14.00 172.51 266.47 6.00 2,097.90 $4,966.63
22 856.35 507.51 12.98 152.84 265.25 12.00 1,806.93 $4,990.83
23 807.88 496.90 12.50 127.99 179.90 8.00 1,633.17 $4,958.86
24 766.58 405.75 16.60 149.51 204.39 5.50 1,548.33 $4,972.36
25 720.77 447.51 14.10 80.18 184.82 4.60 1,451.98 $5,338.06
26 692.46 428.84 15.00 104.70 163.51 3.00 1,407.51 $5,334.95
27 633.87 418.43 16.00 99.49 171.19 9.00 1,347.98 $5,355.75
28 516.12 310.63 9.46 83.50 148.37 2.00 1,070.08 $5,353.01
29 475.39 329.77 16.36 60.12 117.06 8.00 1,006.70 $5,354.49
30 393.99 281.40 12.00 48.00 100.66 10.00 846.05 $5,421.96
31 326.63 212.02 8.87 46.52 75.57 3.00 672.61 $5,476.74
32 244.20 167.17 11.97 27.00 70.10 4.00 524.44 $5,581.32
33 183.64 163.08 12.00 20.81 56.52 1.00 437.05 $5,679.19
34 173.90 162.45 6.54 23.92 29.40 1.00 397.21 $5,710.76
35 150.87 136.49 9.39 15.54 33.05 1.00 346.34 $5,839.05
36 137.48 100.06 2.40 14.60 36.00 2.00 292.54 $5,955.93
37+ 326.91 349.8 26.35 23.06 58.12 6.50 790.74 $5,955.37
Subtotal 45,693.66 24,314.51 516.82 4,160.00 6,326.99 150.60
Years of
Experience
Total
Years of
Exp.
Full Time Equivalent
* Teachers without a certified salary information not included in this analysis.
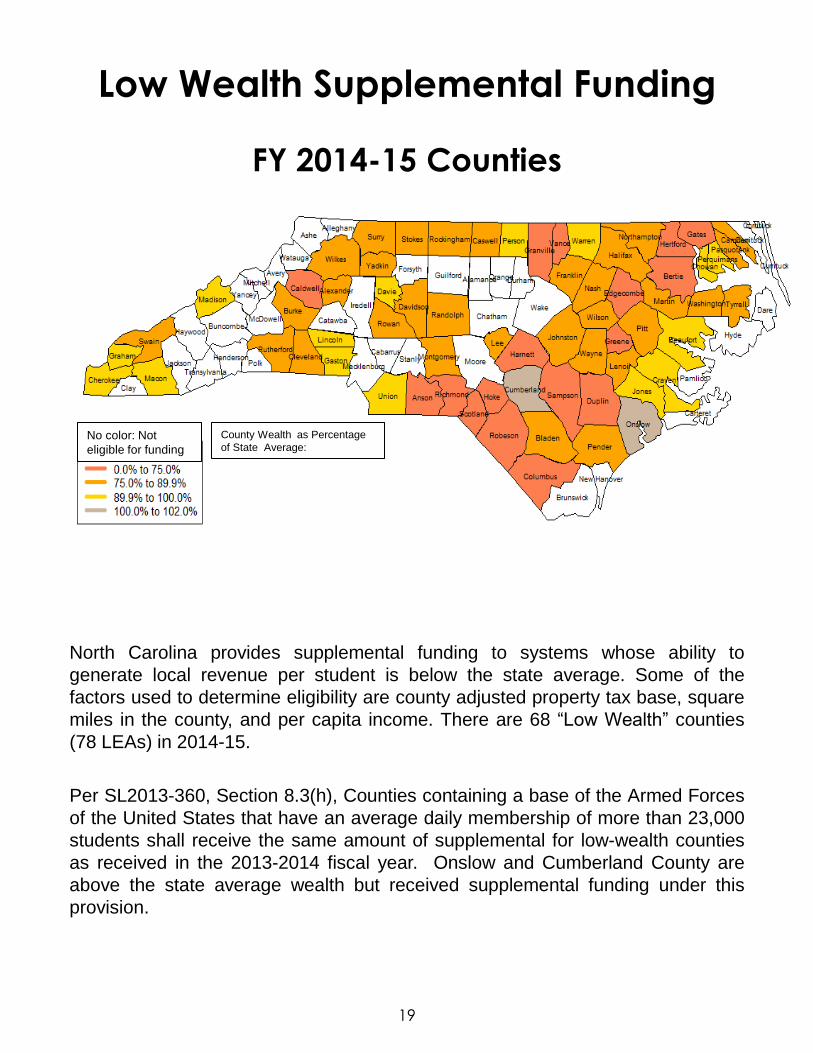
FY 2014-15 Counties
North Carolina provides supplemental funding to systems whose ability to
generate local revenue per student is below the state average. Some of the
factors used to determine eligibility are county adjusted property tax base, square
miles in the county, and per capita income. There are 68 “Low Wealth” counties
(78 LEAs) in 2014-15.
Per SL2013-360, Section 8.3(h), Counties containing a base of the Armed Forces
of the United States that have an average daily membership of more than 23,000
students shall receive the same amount of supplemental for low-wealth counties
as received in the 2013-2014 fiscal year. Onslow and Cumberland County are
above the state average wealth but received supplemental funding under this
provision.
Low Wealth Supplemental Funding
19
No color: Not
eligible for funding
County Wealth as Percentage
of State Average:
Low Wealth Supplemental Funding
Wealth Percentage
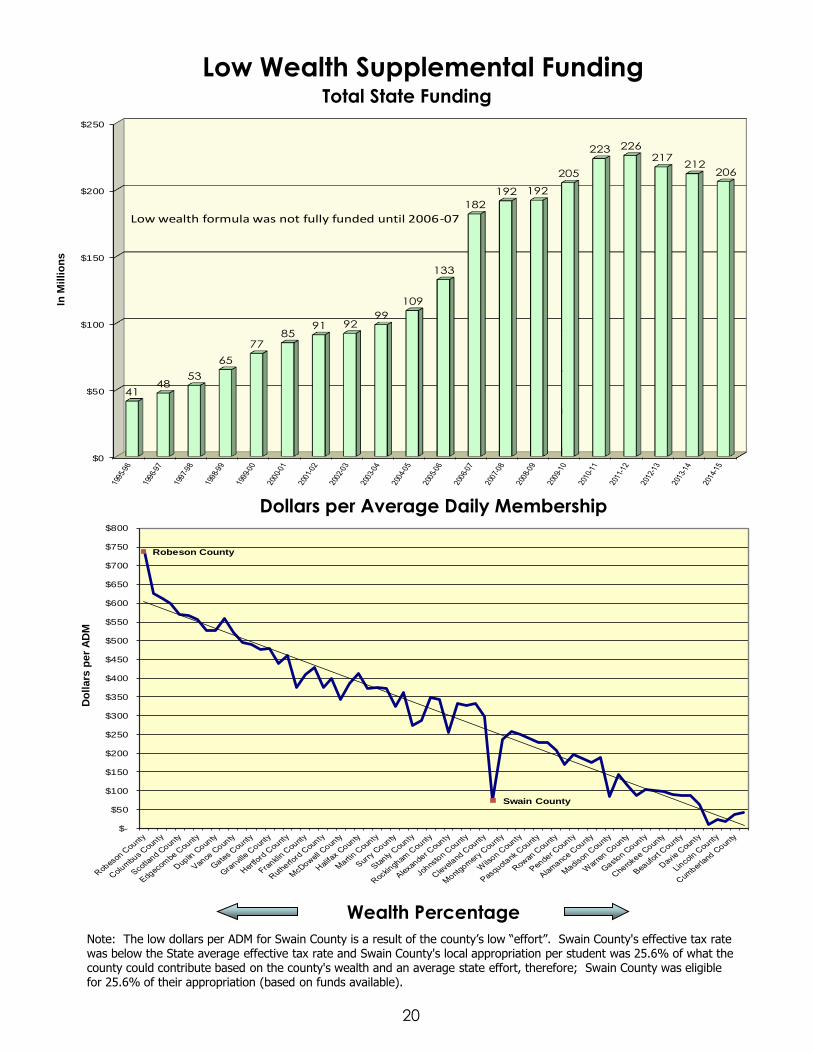
Total State Funding
In M
illi
on
s
Note: The low dollars per ADM for Swain County is a result of the county’s low “effort”. Swain County's effective tax rate was below the State average effective tax rate and Swain County's local appropriation per student was 25.6% of what the county could contribute based on the county's wealth and an average state effort, therefore; Swain County was eligible for 25.6% of their appropriation (based on funds available).
20
Do
llars
pe
r A
DM
Dollars per Average Daily Membership
$0
$50
$100
$150
$200
$250
4148
53
65
7785
91 9299
109
133
182
192 192
205
223 226217
212 206
Low wealth formula was not fully funded until 2006-07
Robeson County
Swain County
$-
$50
$100
$150
$200
$250
$300
$350
$400
$450
$500
$550
$600
$650
$700
$750
$800

Low Wealth Eligible Counties
FY 2014-15
21
Eligible County Wealth %
Dollars per
child Eligible County Wealth %
Dollars per
child
Robeson County 55.99% 734.47$ Alexander County 79.72% 249.09$
Greene County 62.08% 632.83$ Nash County 80.29% 328.93$
Columbus County 63.79% 604.29$ Johnston County 80.30% 328.77$
Anson County 64.90% 585.77$ Stokes County 80.44% 326.43$
Scotland County 66.30% 562.41$ Cleveland County 82.03% 299.89$
Richmond County 66.63% 556.90$ Swain County 82.87% 71.76$
Edgecombe County 68.06% 533.03$ Montgomery County 83.15% 233.96$
Sampson County 68.57% 524.52$ Wilkes County 84.62% 256.67$
Duplin County 68.70% 522.35$ Wilson County 85.20% 246.99$
Bertie County 68.92% 518.68$ Pitt County 85.71% 238.48$
Vance County 69.25% 513.17$ Pasquotank County 85.97% 234.14$
Hoke County 70.16% 497.99$ Lee County 86.52% 224.96$
Gates County 70.67% 489.48$ Rowan County 87.54% 207.94$
Harnett County 71.52% 475.29$ Davidson County 87.91% 166.86$
Granville County 71.66% 472.95$ Pender County 88.21% 192.04$
Caldwell County 73.16% 435.38$ Tyrrell County 88.50% 191.92$
Hertford County 73.34% 444.92$ Alamance County 88.79% 175.29$
Randolph County 75.71% 370.91$ Camden County 88.84% 186.24$
Franklin County 75.82% 403.53$ Madison County 90.94% 84.52$
Washington County 75.92% 401.86$ Person County 91.38% 143.86$
Rutherford County 76.38% 369.35$ Warren County 93.32% 111.48$
Northampton County 76.63% 390.01$ Perquimans County 93.52% 82.29$
McDowell County 76.79% 338.92$ Gaston County 93.81% 103.30$
Lenoir County 77.03% 383.34$ Jones County 93.84% 102.80$
Halifax County 77.29% 379.00$ Cherokee County 93.91% 96.14$
Bladen County 77.86% 369.49$ Union County 94.75% 87.62$
Martin County 77.97% 367.65$ Beaufort County 94.80% 86.78$
Wayne County 78.04% 366.48$ Chowan County 94.83% 86.28$
Surry County 78.34% 319.91$ Davie County 96.20% 63.42$
Yadkin County 78.46% 359.47$ Graham County 98.17% 8.83$
Stanly County 79.14% 275.71$ Lincoln County 98.25% 21.32$
Burke County 79.15% 283.59$ Craven County 98.56% 17.97$
Rockingham County 79.28% 345.79$ Cumberland County 105.26% 34.30$
Caswell County 79.58% 340.78$ Onslow County 106.54% 42.10$

How Low Wealth Funds Were Expended
FY 2013-14
22
Teachers & Instructional Support31.9%
TA and Tutors3.4%
Clerical and Other28.3%
Workshops and Contracted Services
3.5%
Benefits20.2%
Textbooks, Supplies and Materials
7.4%
Cap/Non Cap Outlay5.3%

FY 2014-15 Counties
North Carolina provides supplemental funding to those county school
district with average daily membership (ADM) less than 3,200. City School
Districts are not eligible for this funding. If a school district becomes
ineligible due to an ADM greater than 3,200, the funding will be phased out
over 5 years.
In 2014-15, 25 county school districts were eligible for funding. In addition,
Martin and Anson counties were in the first year of phase out and received
80% of the 2013-14 allotment.
Funded Counties
Counties Not Eligible
Small County Supplemental Funding
23
AlamanceAlexander
Alleghany
Anson
Ashe
Avery
Beaufort
Bertie
Bladen
Brunswick
Buncombe
Burke
Cabarrus
Caldwell
Camden
Carteret
Caswell
Catawba Chatham
Cherokee
Chowan
Clay
Cleveland
Columbus
Craven
Cumberland
Currituck
DareDavidson
Davie
Duplin
Durham
Edgecombe
ForsythFranklin
Gaston
Gates
Graham
Granville
Greene
Guilford
Halifax
Harnett
Haywood
Henderson
Hertford
Hoke
Hyde
Iredell
Jackson
Johnston
Jones
Lee
Lenoir
Lincoln
Macon
MadisonMartin
McDowell
Mecklenburg
Mitchell
Montgomery
Moore
Nash
NewHanover
Northampton
Onslow
Orange
Pamlico
Pasquotank
Pender
Perquimans
Person
Pitt
Polk
Randolph
Richmond
Robeson
Rockingham
Rowan
Rutherford
Sampson
Scotland
Stanly
StokesSurry
Swain
Transylvania
Tyrrell
Union
Vance
Wake
Warren
Washington
Watauga
Wayne
Wilkes
Wilson
Yadkin
Yancey

Small County Supplemental Funding
In FY2014-15,
elig ib le coun t ies
received
b et w een
$1.29and $1.71
m illion in Sm all
Count y
Sup p lem ent al
f und ing.
The p er ADM
d o llar s
w ere b et w een
$367 (Anson) and
$2,948 (Tyr rell).
How Small County Funds Were Expended FY 2013-14
24
$0
$5
$10
$15
$20
$25
$30
$35
$40
$45
15 15
18
2222
28
3031
33
37
39
4141 41
43 43
42 43 43 42
Millions
School Building Administration 4.8%
Teachers & Instructional Support23.1%
TA and Tutors2.0%
Clerical and Other32.6%
Workshops and Contracted Services
10.9%
Benefits22.6%
Textbooks, Supplies and Materials 4.8%
Cap/Non Cap Outlay1.5%

Small County Supplemental Funding
Total and Per ADM Funding FY 2014-15
25
LEA Name Allotment ADM Per ADM
Tyrrell County 1,710,000 561 3,048
Hyde County 1,710,000 594 2,879
Jones County 1,820,000 1,115 1,632
Graham County 1,820,000 1,203 1,513
Pamlico County 1,820,000 1,274 1,429
Clay County 1,548,700 1,357 1,141
Alleghany County 1,548,700 1,456 1,064
Washington County 1,600,000 1,711 935
Gates County 1,548,700 1,659 934
Perquimans County 1,600,000 1,800 889
Camden County 1,600,000 1,923 832
Mitchell County 1,600,000 1,976 810
Swain County 1,560,000 2,067 755
Northampton County 1,560,000 2,040 765
Avery County 1,560,000 2,164 721
Chowan County 1,560,000 2,235 698
Polk County 1,560,000 2,275 686
Yancey County 1,470,000 2,313 636
Warren County 1,470,000 2,379 618
Bertie County 1,498,000 2,645 566
Madison County 1,470,000 2,512 585
Caswell County 1,498,000 2,762 542
Hertford County 1,548,000 3,091 501
Ashe County 1,548,000 3,187 486
Greene County 1,548,000 3,146 492
Martin County 1,327,763 3,407 390
Anson County 1,292,886 3,609 358
Total & Weighted Avg $42,396,749 $750.90
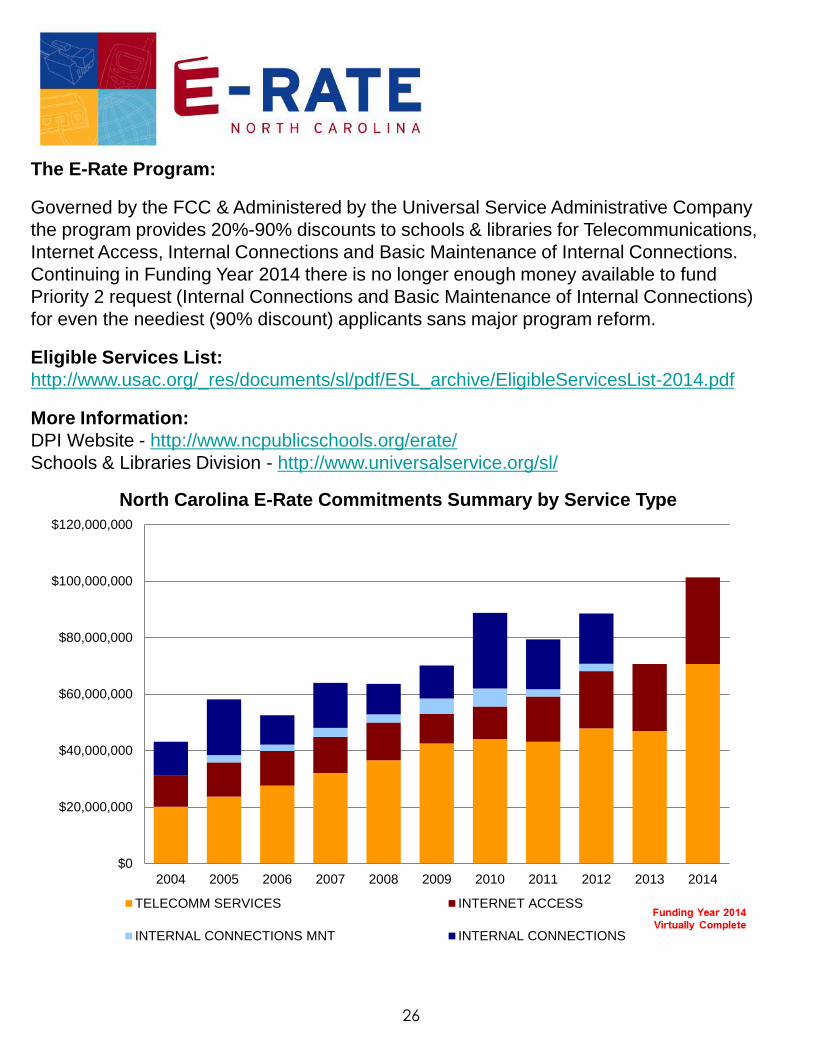
The E-Rate Program:
Governed by the FCC & Administered by the Universal Service Administrative Company
the program provides 20%-90% discounts to schools & libraries for Telecommunications,
Internet Access, Internal Connections and Basic Maintenance of Internal Connections.
Continuing in Funding Year 2014 there is no longer enough money available to fund
Priority 2 request (Internal Connections and Basic Maintenance of Internal Connections)
for even the neediest (90% discount) applicants sans major program reform.
Eligible Services List:
http://www.usac.org/_res/documents/sl/pdf/ESL_archive/EligibleServicesList-2014.pdf
More Information:
DPI Website - http://www.ncpublicschools.org/erate/
Schools & Libraries Division - http://www.universalservice.org/sl/
26
$0
$20,000,000
$40,000,000
$60,000,000
$80,000,000
$100,000,000
$120,000,000
2004 2005 2006 2007 2008 2009 2010 2011 2012 2013 2014
North Carolina E-Rate Commitments Summary by Service Type
TELECOMM SERVICES INTERNET ACCESS
INTERNAL CONNECTIONS MNT INTERNAL CONNECTIONS

Capital Outlay for School Facilities
State Funding Historically, the state of North Carolina has provided funding for salaries and operations to the local school
systems and the local units have been responsible for providing facilities. The state had a School Facilities
Appropriation in 1949 and has passed state school bonds in 1949, 1953, 1963, 1973, and 1996. Currently, North
Carolina provides school construction aid to LEAs through the following programs:
Public School Building Capital Fund: Comprised of two portions, the ADM portion and the
Lottery portion
1. (ADM Fund) 1987-present - Uses part of the corporate income tax revenues to provide counties with an
allotment based on average daily membership. LEAs may let their allotments accrue until they are ready to use
them for a specific project, at which time they must match (1:3) the amount from the state. The fund is currently
about $90 Million per year. The fund was frozen by the Legislature for 2002-03 because of state budget
shortfalls. More than $1 Billion has been allotted since 1987; the current fund balance to be allotted is over $60
million dollars.
27
Fiscal Year State Funds Federal Funds Local Funds Totals
1997-98 240,704,605 215,489 526,754,170 767,674,264
1998-99 554,588,979 1,291,004 561,394,095 1,117,274,078
1999-00 518,506,820 8,272,720 627,673,264 1,154,452,804
2000-01 371,109,242 - 789,866,134 1,160,975,376
2001-02 170,257,261 517,911 842,184,297 1,012,959,469
2002-03 41,949,345 9,697,902 782,630,041 834,277,288
2003-04 46,210,952 9,528,857 752,716,127 808,455,936
2004-05 21,169,420 3,690,000 699,746,058 724,605,478
2005-06 13,842,620 1,790,866 1,003,523,533 1,019,157,019
2006-07 21,216,361 743,931 1,170,080,840 1,192,041,132
2007-08 18,024,915 212,220 939,450,137 957,687,272
2008-09 12,741,320 139,932 1,266,076,911 1,278,958,164
2009-10 13,211,971 2,370,296 415,228,020 430,810,287
2010-11 15,124,664 3,810,633 381,005,150 399,940,447
2011-12 8,709,622 12,880,229 330,098,767 351,688,618
2012-13 23,736,874 7,449,196 313,077,437 344,263,507
2013-14 8,873,255 43,251 273,651,671 282,568,177
Total $2,099,978,226 $62,654,437 $11,675,156,652 $13,837,789,316
$0
$50
$100
$150
$200
$250
$300
1998-99 1999-00 2000-01 2001-02 2002-03 2003-04 2004-05 2005-06 2006-07 2007-08 2008-09 2009-10 2010-11 2011-12 2012-13 2013-14
In m
illi
on
s
Total Revenue Total Allotted

Capital Outlay for School Facilities Cont. 2. The Education Lottery. Lottery sales began in March of 2006. The General Assembly allocated $140 million of anticipated proceeds for school construction for the 2008/2009 fiscal year to be distributed four times per year. Funds are divided among the LEA’s based on (a) ADM as a percentage of state ADM, and (b) property tax rate as a percent of average property tax rate, statewide. Funding for school construction by lottery revenues differs from the PSBCF in two main areas: local matching funds are not required, and lottery funding cannot be used for “technology.”
One-half of lottery sales are returned to the public as prizes; 15% is used for administrative expenses, and 35% is divided among the educational programs. Of the educational programs share, 40% is directed for school construction through the PSBCF.
28
Local Option Sales Tax In addition to direct state aid, the state earmarks sales tax revenues for facilities improvements. State law allows counties to levy two one-half cent additions to the state sales tax (1983, 1986), 30 percent and 60 percent respectively goes to schools (all 100 counties levy the tax). The revenues are distributed to counties on a per capita basis and may be used for public school capital outlay or to retire indebtedness incurred by the county for these purposes. In many cases, this has allowed counties to fund local bond issues without raising property taxes. Recent legislation allows counties to levy either an additional one-quarter cent sales tax, or a Land Transfer Tax. There is no state capital funding for charter school facilities. Federal Funding There is no recurring federal funding for public school facilities. Federal funds have included FEMA emergency relief (hurricane) funds. A federal program that has provided school renovation funds is: Qualified Zone Academy Bonds (QZABs) – a zero-interest bond program (IRS code) that
requires a 10% match from a local business partner. QZABs authority issued to North Carolina 1998 - $ 9,115,000 1999 - $ 8,851,000
2000 - $11,281,000 2001 - $11,961,000 2002 - $10,903,000 2003 - $11,607,000 2004 - $12,750,000 2005 - $13,618,000 2006 - $11,444,000 2007 - $11,444,000 2008 - $12,600,000 2009 - $44,099,000 2010 - $44,454,000 2011 - $13,178,000 2012 - $ 9,678,000
Fiscal
Year Lottery Revenue
Interest Earned on
Lottery Revenues
Interest on
Disbursing Acct.
Balance
Project Allotment
Fiscal Unallotted Balance
2007-08 128,887,893.00 5,045,560.83 967,847.54 92,355,256.80 104,778,271.85
2008-09 123,821,061.00 4,988,190.54 954,669.58 139,871,080.32 94,671,112.65
2009-10 209,575,479.00 2,880,644.51 541,131.05 148,982,629.10 158,685,738.11
2010-11 145,805,007.00 1,705,969.62 361,964.22 157,152,512.01 149,406,166.94
2011-12 89,782,097.00 1,149,637.32 186,289.77 103,638,988.54 136,885,202.49
2012-13 96,854,123.00 571,060.84 122,749.33 126,420,178.56 108,012,957.10
2013-14 100,663,529.00 509,774.17 122,502.50 119,948,391.09 89,360,371.68
Totals 895,389,189.00 895,389,189.00 895,389,189.00 895,389,189.00

Funding from the Lottery
2013 – 14 Lottery Revenue Distributions
29
The total amount of funds received
from the NC Education Lottery in FY
2014 was $489,092,000
Total Operating revenue for the
Education Lottery in FY 2014 was
$1,844,636,000
Lottery
School Funds
310,290,235
8,691,703,947
The Education Lottery contributesan extra 3.8% to the State PublicSchool Fund Requirements
Prize Exp & Prize Tickets, 62%
Net Revenue Transferred to
NCEL Fund, 27%
Commisions, 7%
Administrative Expenses, 4%
Allocation of Expenses FY 2014
Classroom Teachers
49%
Prekindergarten
17%
School Construction
22%College
Scholarships10%
Digital learning2%
Distribution
Charter Schools 1997-2015
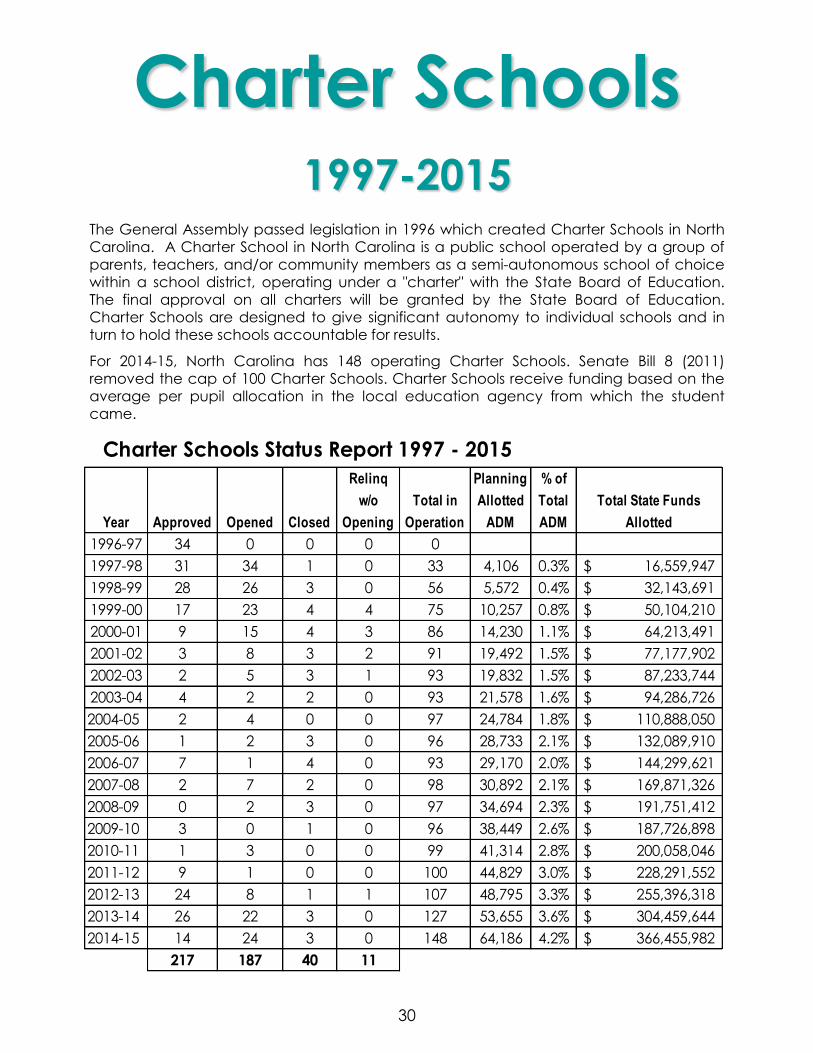
The General Assembly passed legislation in 1996 which created Charter Schools in North Carolina. A Charter School in North Carolina is a public school operated by a group of
parents, teachers, and/or community members as a semi-autonomous school of choice within a school district, operating under a "charter" with the State Board of Education. The final approval on all charters will be granted by the State Board of Education. Charter Schools are designed to give significant autonomy to individual schools and in turn to hold these schools accountable for results.
For 2014-15, North Carolina has 148 operating Charter Schools. Senate Bill 8 (2011) removed the cap of 100 Charter Schools. Charter Schools receive funding based on the average per pupil allocation in the local education agency from which the student came.
30
Year Approved Opened Closed
Relinq
w/o
Opening
Total in
Operation
Planning
Allotted
ADM
% of
Total
ADM
Total State Funds
Allotted
1996-97 34 0 0 0 0
1997-98 31 34 1 0 33 4,106 0.3% 16,559,947$
1998-99 28 26 3 0 56 5,572 0.4% 32,143,691$
1999-00 17 23 4 4 75 10,257 0.8% 50,104,210$
2000-01 9 15 4 3 86 14,230 1.1% 64,213,491$
2001-02 3 8 3 2 91 19,492 1.5% 77,177,902$
2002-03 2 5 3 1 93 19,832 1.5% 87,233,744$
2003-04 4 2 2 0 93 21,578 1.6% 94,286,726$
2004-05 2 4 0 0 97 24,784 1.8% 110,888,050$
2005-06 1 2 3 0 96 28,733 2.1% 132,089,910$
2006-07 7 1 4 0 93 29,170 2.0% 144,299,621$
2007-08 2 7 2 0 98 30,892 2.1% 169,871,326$
2008-09 0 2 3 0 97 34,694 2.3% 191,751,412$
2009-10 3 0 1 0 96 38,449 2.6% 187,726,898$
2010-11 1 3 0 0 99 41,314 2.8% 200,058,046$
2011-12 9 1 0 0 100 44,829 3.0% 228,291,552$
2012-13 24 8 1 1 107 48,795 3.3% 255,396,318$
2013-14 26 22 3 0 127 53,655 3.6% 304,459,644$
2014-15 14 24 3 0 148 64,186 4.2% 366,455,982$
217 187 40 11
Charter Schools Status Report 1997 - 2015

Flexibility of Charter Schools
Financial
• Funds allotted in one dollar allotment.
• Not eligible for the construction funds from the lottery revenue or Local Education Agency.
• Not required to:
pay personnel using the state salary schedules or salary ranges,
participate in the State Employees Retirement System or State Major Medical Plan,
purchase on state contract or participate in e-procurement.
Educational
• Not held to:
Class size maximums in K – 3.
Calendar laws, except the 1,025 instructional hours or 185 days.
Licensing standards of teachers (charter are required to have 50% of the teachers licensed.)
Charter schools are provided both financial and educational flexibility
31
Charter School Full-Time Personnel FY 2014-15
Teachers, Teacher Assistants, and Instructional Support Personnel make up 83.8% of all personnel.
School Building Administrators (Principals & Assistant Principals) make up 4.3% of all personnel.
Central office Administrators make up 2.8% of all personnel.
Other Nonprofessionals (Clerical, Technicians, Service Workers, etc…) make up the remaining 9.2% of
personnel.
Certified Personnel: State Federal Local Total
Central Office Admin 176 5 8 189
Principals 152 0 3 155
Assistant Principals 128 7 2 137
Teachers 4,141 216 52 4,409
Instructional Support 365 31 8 404
Total Certified 4,962 259 73 5,294
Non Certified Personnel:
Teacher Assistants 816 57 25 898
Technicians 48 1 2 51
Clerical, Secretarial 315 1 9 325
Other Non Certified 234 5 11 250
Total Non Certified 1,413 64 47 1,524
Total 2015 6,375 323 120 6,818
Percent of Total 93.5% 4.7% 1.8% 100.0%

Charter School Expenditures
FY 2013-14
State funds are allotted based on the number of students in ADM at the Charter
School. State funds may be used for any purpose other than purchasing a building.
Most federal funds are targeted towards a specific population such as Low Income
Children or Handicapped Children.
Local funds are given to Charter Schools based on the local current expense
appropriation in the county in which the student resides. Local funds may be used
for any purpose.
32
Source of Expenditures
FY 2013-14
How State Funds Were
Expended FY 2013-14
Local, 33.3%
Federal, 3.7%
State, 62.9%
Salaries & Benefits72%
Buildings & Purchased Services
22%
Supplies & Materials5%
Capital Outlay1%

33
CS # CS Name
Funded
ADM
Total State
Funding ($)
Funding Per
ADM ($)
01B River Mill Academy 660 3,287,637 4,981
01C Clover Garden 600 3,087,624 5,146
01D The Hawbridge School 238 1,331,607 5,595
06A Grandfather Academy 23 196,512 8,544
06B Crossnore Academy 95 667,001 7,021
07A Washington Montessori 332 1,783,644 5,372
08A Heritage Collegiate Leadership Academy 191 1,272,915 6,664
09A Paul R. Brown Leadership Academy 102 608,369 5,964
10A Charter Day School 919 4,701,256 5,116
10B South Brunswick Charter School 86 418,509 4,866
11A Evergreen Community Charter 444 2,377,067 5,354
11B ArtSpace Charter 387 2,143,174 5,538
11C Invest Collegiate (Buncombe) 331 1,717,850 5,190
11D The Franklin School of Innovation 280 1,451,616 5,184
11K Francine Delany New School 167 907,420 5,434
12A The New Dimensions School 261 1,417,147 5,430
13A Carolina International School 673 3,341,361 4,965
13B Cabarrus Charter Academy 889 4,349,536 4,893
13C A.C.E. Academy 148 712,135 4,812
16B Tiller School 197 1,059,269 5,377
19A Chatham Charter 497 2,461,217 4,952
19B Woods Charter School 510 2,692,928 5,280
19C Willow Oak Montessori 120 603,367 5,028
20A The Learning Center 168 1,022,670 6,087
23A Pinnacle Classical Academy 370 2,003,731 5,415
24B Flemington Academy 72 470,770 6,538
24C STEM Education for a Global Society Academy (SEGS) 99 647,766 6,543
24N Columbus Charter School 891 5,593,892 6,278
26B Alpha Academy 654 3,189,507 4,877
26C The Capitol Encore Academy 214 1,005,549 4,699
27A Water's Edge Village School 19 105,591 5,557
32A Maureen Joy Charter 553 2,995,577 5,417
32B Healthy Start Academy 378 2,037,496 5,390
32C Carter Community Charter 297 1,653,228 5,566
32D Kestrel Heights School 1,004 5,430,780 5,409
32H Research Triangle Charter 669 3,700,131 5,531
32K Central Park School for Children 366 2,040,518 5,575
32L Voyager Academy 1,346 7,333,714 5,449
32M Global Scholars Academy 158 873,584 5,529
32N Research Triangle High School 347 1,880,413 5,419
32P The Institute for the Development of Young Leaders 131 698,865 5,335
32Q Reaching All Minds Academy 116 578,252 4,985
33A North East Carolina Preparatory School 1,275 7,753,200 6,081
34B Quality Education Academy 479 2,583,661 5,394
34D Carter G. Woodson School 438 2,487,223 5,679
34F Forsyth Academy 722 3,988,653 5,524
34G Arts Based Elementary 511 2,768,753 5,418
34H The North Carolina Leadership Academy 524 2,707,289 5,167
35A Crosscreek Charter School 187 1,115,035 5,963
36B Piedmont Community Charter 1,230 6,177,818 5,023
36C Mountain Island Charter 1,172 5,797,122 4,946
39A Falls Lake Academy 412 2,268,268 5,506
Funded ADM and Total State Funding (1)
FY 2014-15

34
CS # CS Name
Funded
ADM
Total State
Funding
Funding Per
ADM
39B Oxford Preparatory High School 114 650,843 5,709
41B Greensboro Academy 755 3,787,897 5,017
41C Guilford Preparatory Academy 259 1,335,817 5,158
41D Phoenix Academy Inc 891 4,496,412 5,046
41F Triad Math and Science Academy 1,090 5,502,838 5,048
41G Cornerstone Charter Academy 725 3,674,150 5,068
41H College Preparatory & Leadership Academy of High Point 313 1,590,680 5,082
41J Summerfield Charter Academy 639 3,218,116 5,036
42A KIPP Halifax College Preparatory 74 460,908 6,228
43C Anderson Creek Club Charter School 180 934,693 5,193
45A The Mountain Community School 181 956,584 5,285
49B American Renaissance School 535 2,750,769 5,142
49D Success Charter School 95 540,925 5,694
49E Pine Lake Preparatory 1,680 8,538,590 5,082
49F Langtree Charter Academy 903 4,412,324 4,886
50A Summit Charter 196 1,098,476 5,604
51A Neuse Charter School 748 3,902,159 5,217
54A Children's Village Academy 203 1,165,263 5,740
55A Lincoln Charter School 1,786 8,951,004 5,012
58B Bear Grass Charter School 330 2,122,216 6,431
60A Community Charter School 126 625,542 4,965
60B Sugar Creek Charter 1,156 5,721,397 4,949
60C Kennedy Charter 373 1,910,528 5,122
60D Lake Norman Charter 1,593 7,762,644 4,873
60F Metrolina Regional Scholars Academy 366 1,770,662 4,838
60G Queen's Grant Community School 1,208 6,104,382 5,053
60H Crossroads Charter High 169 866,100 5,125
60I Community School of Davidson 1,328 7,020,481 5,287
60J Socrates Academy 655 3,244,222 4,953
60K Charlotte Secondary School 415 2,171,466 5,232
60L KIPP: Charlotte 348 1,895,723 5,447
60M Corvian Community School 520 2,650,572 5,097
60N Aristotle Preparatory Academy 136 673,188 4,950
60P Charlotte Choice Charter 258 1,292,895 5,011
60Q Invest Collegiate 535 2,522,765 4,715
60S Bradford Preparatory School 404 2,096,121 5,188
60U Commonwealth High School 178 876,108 4,922
60V Charlotte Learning Academy 145 780,661 5,384
60W Concrete Roses STEM Academy (2) 109 346,775 3,181
60X Entrepreneur High School(2) 78 390,994 5,013
60Y Pioneer Springs Community School 176 1,029,522 5,850
61J Thunderbird Preparatory School 316 1,545,526 4,891
61K United Community School 133 666,578 5,012
63A The Academy of Moore County 210 1,083,898 5,161
63B Sandhills Theatre Arts Renaissance School 370 1,993,992 5,389
64A Rocky Mount Preparatory 1,262 6,889,607 5,459
65A Cape Fear Center for Inquiry 409 2,177,751 5,325
65B Wilmington Preparatory Academy 128 666,540 5,207
65C Douglass Academy 85 405,938 4,776
65D Island Montessori Charter 168 859,433 5,116
66A Gaston College Preparatory 1,043 7,695,454 7,378
67B Z.E.C.A. School of Arts and Technology 124 652,651 5,263
Funded ADM and Total State Funding (1)
FY 2014-15

35
CS # CS Name
Funded
ADM
Total State
Funding
Funding Per
ADM
68A Orange Charter 236 1,358,618 5,757
68C The Expedition School 226 1,286,416 5,692
68N PACE Academy 75 676,510 9,020
69A Arapahoe Charter School 469 3,570,392 7,613
73A Bethel Hill Charter 399 2,166,168 5,429
73B Roxboro Community School 702 3,663,620 5,219
76N Uwharrie Charter Academy 316 1,639,156 5,187
78A CIS Academy 117 760,865 6,503
78B Southeastern Academy 208 1,211,965 5,827
79A Bethany Community Middle 258 1,486,544 5,762
81A Thomas Jefferson Classical Academy 1,303 7,067,068 5,424
81B Lake Lure Classical Academy 370 2,097,803 5,670
84B Gray Stone Day School 412 2,134,204 5,180
86T Millennium Charter Academy 620 3,705,223 5,976
87A Mountain Discovery Charter School 191 1,289,911 6,753
88A Brevard Academy 241 1,337,080 5,548
90A Union Academy Charter School 1,405 7,241,741 5,154
91A Vance Charter School 540 3,459,484 6,406
91B Henderson Collegiate 496 3,214,106 6,480
92B Exploris Middle School 412 2,058,754 4,997
92D Magellan Charter 406 2,062,200 5,079
92E Sterling Montessori Academy 594 2,981,253 5,019
92F Franklin Academy 1,640 7,945,944 4,845
92G East Wake Academy 1,136 5,844,386 5,145
92K Raleigh Charter High School 559 2,671,972 4,780
92L Torchlight Academy 439 2,356,568 5,368
92M PreEminent Charter School 566 2,951,377 5,214
92N Quest Academy 144 725,256 5,037
92P Southern Wake Academy 304 1,747,578 5,749
92Q Hope Elementary Charter School 122 650,435 5,331
92R Casa Esperanza Montessori 458 2,273,907 4,965
92S Endeavor Charter 508 2,545,672 5,011
92T Triangle Math and Science Academy 434 2,123,050 4,892
92U Longleaf School of the Arts 221 1,073,587 4,858
92V Wake Forest Charter Academy 480 2,409,173 5,019
92W Cardinal Charter 661 3,263,016 4,936
92X Dynamic Community Charter 68 487,936 7,176
92Y Envision Science Academy 252 1,271,337 5,045
93A Haliwa-Saponi Tribal School 192 1,337,432 6,966
95A Two Rivers Community School 185 1,053,937 5,697
96C Dillard Academy 234 1,342,525 5,737
96F Wayne Preparatory 292 1,556,609 5,331
97D Bridges Charter School 162 1,059,386 6,539
98A Sallie B Howard School 803 4,420,470 5,505
98B Wilson Preparatory Academy 358 1,844,938 5,153
Total 69,387 369,404,569
Note:
1. Data is as of Allotment Revision 17.
2. School closed during the year. Amount shown is partial year.
Funded ADM and Total State Funding (1)
FY 2014-15

Funding Our
Public Schools
Federal Funds
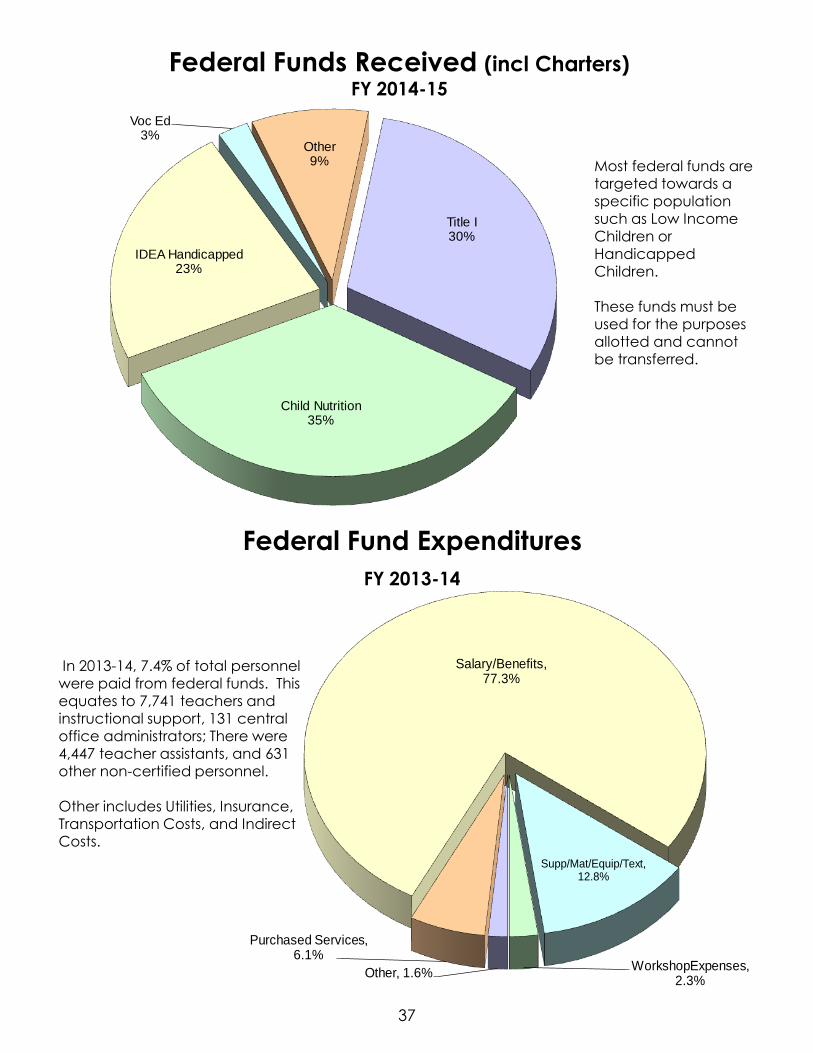
Federal Funds Received (incl Charters) FY 2014-15
Most federal funds are targeted towards a specific population such as Low Income
Children or Handicapped Children. These funds must be used for the purposes allotted and cannot be transferred.
In 2013-14, 7.4% of total personnel
were paid from federal funds. This equates to 7,741 teachers and instructional support, 131 central office administrators; There were 4,447 teacher assistants, and 631 other non-certified personnel. Other includes Utilities, Insurance, Transportation Costs, and Indirect Costs.
Federal Fund Expenditures
FY 2013-14
37
Other, 1.6%
Purchased Services, 6.1%
Salary/Benefits, 77.3%
Supp/Mat/Equip/Text, 12.8%
WorkshopExpenses, 2.3%
Title I30%
Child Nutrition35%
IDEA Handicapped23%
Voc Ed3%
Other9%

Funds for State Aid
Funds for Administration of Grants
38
443 446 438
448
507 502 518
504 494
521 517
222
182
302
327
293 296 304 304
478 484 484
259 274
284 297
278
307 316 315
303
321314
21 21 22 22 22 22 22 20 29 33 33
$0
$100
$200
$300
$400
$500
$600
2004-05 2005-06 2006-07 2007-08 2008-09 2009-10 2010-11 2011-12 2012-13 2013-14 2014-15
Mil
lio
ns
NO CHILD LEFT BEHINDCHILD NUTRITION/MISC.IDEA HANDICAPPEDCARL D. PERKINS VOC ED ACT
Since 2004-05, NCLBfunding for State aid
has increased by $73.4 million.
Since 2004-05, IDEA
funding for State aid has increased by $54.9 million.
$0
$5
$10
$15
$20
$25
$30
$35
$40
2004-05 2005-06 2006-07 2007-08 2008-09 2009-10 2010-11 2011-12 2012-13 2013-14 2014-15
Mil
lio
ns
NO CHILD LEFT BEHINDIDEA HANDICAPPEDCHILD NUTRITION/MISC.CARL D. PERKINS VOC ED ACT
Race to the Top
39
The Race to the Top competitive grants were awarded to encourage and reward states that are
"creating the conditions for education innovation and reform; implementing ambitious plans in four
education reform areas and achieving significant improvement in student outcomes."
States are using the funds to implement comprehensive strategies to address four key areas of reform
that drive school improvement:
– Adopting internationally benchmarked standards and assessments that prepare students for
success in college and the workplace
– Recruiting, developing, retaining and rewarding effective teachers and principals
– Building data systems that measure student success and inform teachers and principals
regarding how they can improve their practices
– Turning around the lowest-performing schools.
North Carolina is one of only 19 recipients of federal Race to the Top (RttT) grants, bringing nearly $400
million to the state's public school system for use over four years. North Carolina’s RttT implementation
is a collaborative effort across the North Carolina Department of Public Instruction, State Board of
Education, and Office of the Governor.
Approximately one-half of the grant is earmarked for distribution to local education agencies for their
own initiatives that support the North Carolina RttT plan. Local RttT funds were distributed in
accordance with federal Title I eligibility to districts and to charter schools upon approval of their
Detailed Scopes of Work by the NC Department of Public Instruction.
RttT funding is enabling North Carolina to remodel our state education system through the READY
initiative. The READY initiative is an ambitious plan to increase student achievement, close achievement
gaps and continue to increase the number of career- and college- ready graduates by making sure every
student has an excellent teacher.
For More information visit www.ncpublicschools.org/rttt/

40
State Aid
No Child Left Behind
Title I College and Career Ready Students 392,995,671$
Title I College and Career Ready Students School Improvement 15,708,642
Migrant 4,623,665
Neglected and Delinquent 739,708
21st Century Community Learning Centers 30,123,833
English Language Acquisition 13,477,455
Rural and Low-Income Schools 5,848,419
Improving Teacher Quality 47,020,513
Mathematics and Science Partnerships 4,572,894
Education for Homeless Children and Youth 1,406,030
516,516,830$
Individuals With Disabilities Education Act
Special Education - Grants to States 303,686,345
Special Education - Preschool Grants 8,980,531
State Program Improvement 1,218,467
313,885,343$
Perkins IV
Career and Technical Education Basic 20,215,990
Transfer to Community Colleges 11,875,090
Transfer to Dept. of Juvenile Justice and Delinquency 50,000
Total Perkins 32,141,080$
Miscellaneous
Abstinence Education 809,762
Child Nutrition 473,429,700 Est.
Child Nutrition Fresh Fruits and Vegetables 2,789,593
Child Nutrition Equipment Grant 1,165,000
Total Miscellaneous 478,194,055$
2014 - 2015 Federal Grants Received

41
Performance Budget Grant Type
Grant Name Period Period Brief Description
21st Century Community Learning Centers 27 months 12 months State
App./Comp
Funds to provide quality, accessible, after-school, weekend, or summer
programs for children, youth, and their families.
Abstinence Education 12 months 12 months State
App/.Comp
Funds are to enable states to provide Abstinence Education, mentoring,
counseling, and adult supervision to promote abstinence from sexual activity,
with a focus on those groups which are most likely to bear children out-of-
wedlock.
Advanced Placement Fee 12 months N/A State
Application
Funds to reimburse part or all of the cost of AP test fees for low income
students.
Career and Technical Education 27 months 12 months State
Plan/Direct
Funds to expand, improve, and develop quality programs to enhance future
workforce skills.
Child Nutrition Prog. Fresh Fruits & Veg. 12 months 12 months State Plan Funding for School Fresh Fruits and Vegetables.
Child Nutrition Programs 12 months 12 months State Plan Funding for School Lunch, Special Milk, and School Breakfast.
Education for Homeless Children & Youth 27 months 12 months State
App./Comp
Funds to ensure that homeless children and youth have greater access to
the appropriate educational services provided under Federal, State, and
local law.
English Language Acquisition 27 months 27 months State
App./Direct
Funds to assist school districts in teaching English to limited English proficient
students and in helping these students meet the same state standards
required of all other students.
Enhanced Assessment for the Consortium
Project
48 months 48 months State
App./Comp
Funds used to (1) improve the quality, validity, and reliability of state
academic assessments; (2) measure student academic achievement using
multiple measures of student academic achievement from multiple sources;
(3) chart student progress over time; and (4) evaluate student academic
achievement through the development of comprehensive academic
assessment instruments, such as performance and technology-based
academic assessments.
Head Start Collaboration 12 months 60 months State
Application
Funds are used to assist North Carolina in meeting the needs of young
children and their families. While North Carolina initiatives such as More At
Four Pre-K Program, Smart Start, Healthy Choice and Five-Star Rated
License System have benefited many children and families, there is still much
to be accomplished.
HIV/STD Prevention and School-Based
Surveillance
12 months 60 months State
Application
Funds used to build the capacity of districts and schools to effectively
contribute the reduction of HIV infection and other STDs among adolescents;
the reduction of disparities in HIV infection and other STDs experienced by
specific adolescent sub-populations; and the conducting of school-based
surveillance through YRBS and profiles implementation. Program activities
are expected to reinforce efforts to reduce teen pregnancy rates; and
intervention activities to address HIV infection, other STDs and teen
pregnancy.
IDEA Deaf/Blind 12 months 60 months State
Application
State Admin. - To coordinate programs for children to age 22 that are both
deaf and blind. Some funds are contracted.
IDEA Special Education - Grants to States 27 months 27 months State
Plan/Direct
Special education programs for handicapped children ages 3 to 21.
FEDERAL GRANTS 2014 - 2015 (Note 1)
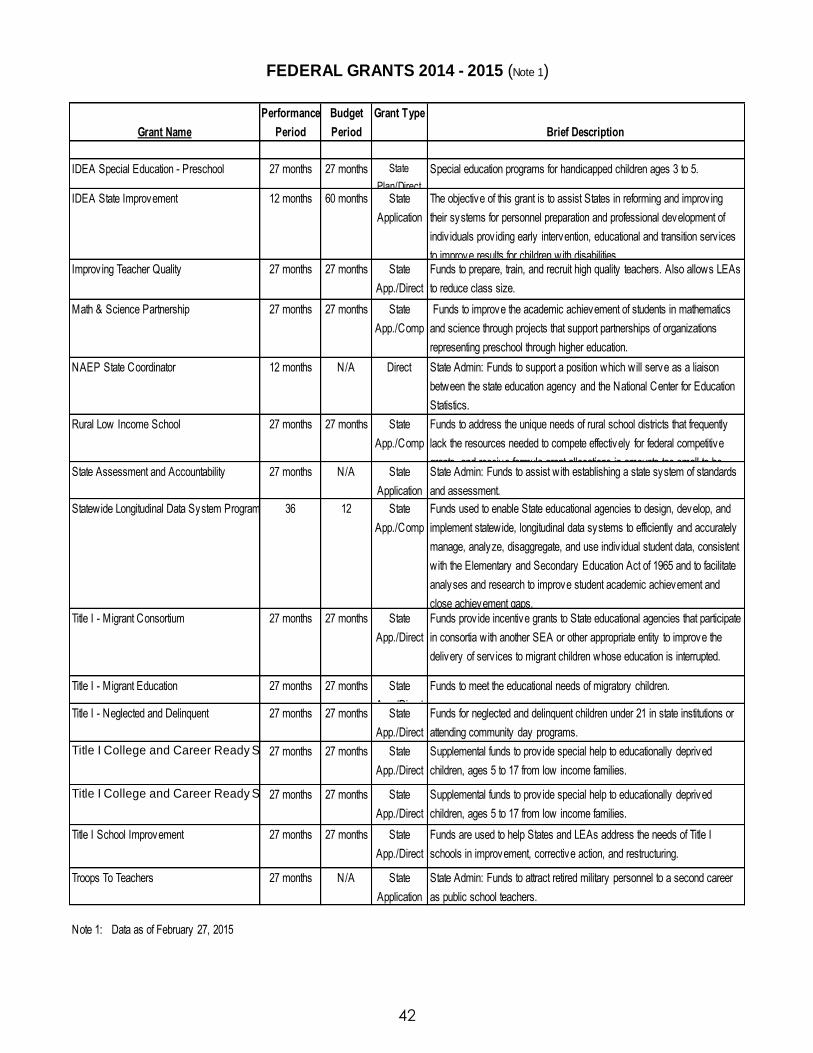
42
Performance Budget Grant Type
Grant Name Period Period Brief Description
IDEA Special Education - Preschool 27 months 27 months State
Plan/Direct
Special education programs for handicapped children ages 3 to 5.
IDEA State Improvement 12 months 60 months State
Application
The objective of this grant is to assist States in reforming and improv ing
their systems for personnel preparation and professional development of
indiv iduals prov iding early intervention, educational and transition serv ices
to improve results for children with disabilities.Improv ing Teacher Quality 27 months 27 months State
App./Direct
Funds to prepare, train, and recruit high quality teachers. Also allows LEAs
to reduce class size.
Math & Science Partnership 27 months 27 months State
App./Comp
Funds to improve the academic achievement of students in mathematics
and science through projects that support partnerships of organizations
representing preschool through higher education.
NAEP State Coordinator 12 months N/A Direct State Admin: Funds to support a position which will serve as a liaison
between the state education agency and the National Center for Education
Statistics.
Rural Low Income School 27 months 27 months State
App./Comp
Funds to address the unique needs of rural school districts that frequently
lack the resources needed to compete effectively for federal competitive
grants, and receive formula grant allocations in amounts too small to be State Assessment and Accountability 27 months N/A State
Application
State Admin: Funds to assist with establishing a state system of standards
and assessment.
Statewide Longitudinal Data System Program 36 12 State
App./Comp
Funds used to enable State educational agencies to design, develop, and
implement statewide, longitudinal data systems to efficiently and accurately
manage, analyze, disaggregate, and use indiv idual student data, consistent
with the Elementary and Secondary Education Act of 1965 and to facilitate
analyses and research to improve student academic achievement and
close achievement gaps.Title I - Migrant Consortium 27 months 27 months State
App./Direct
Funds prov ide incentive grants to State educational agencies that participate
in consortia with another SEA or other appropriate entity to improve the
delivery of serv ices to migrant children whose education is interrupted.
Title I - Migrant Education 27 months 27 months State
App./Direct
Funds to meet the educational needs of migratory children.
Title I - Neglected and Delinquent 27 months 27 months State
App./Direct
Funds for neglected and delinquent children under 21 in state institutions or
attending community day programs.
Title I College and Career Ready Students27 months 27 months State
App./Direct
Supplemental funds to prov ide special help to educationally deprived
children, ages 5 to 17 from low income families.
Title I College and Career Ready Students School Improvement27 months 27 months State
App./Direct
Supplemental funds to prov ide special help to educationally deprived
children, ages 5 to 17 from low income families.
Title I School Improvement 27 months 27 months State
App./Direct
Funds are used to help States and LEAs address the needs of Title I
schools in improvement, corrective action, and restructuring.
Troops To Teachers 27 months N/A State
Application
State Admin: Funds to attract retired military personnel to a second career
as public school teachers.
Note 1: Data as of February 27, 2015
FEDERAL GRANTS 2014 - 2015 (Note 1)