functional role of macrobenthos in estuarine sediment...
TRANSCRIPT

SANDRA CRISTINA DOS REIS BORGES FERNANDES
FUNCTIONAL ROLE OF MACROBENTHOS IN ESTUARINE
SEDIMENT DYNAMICS
Caparica 2009

ii
ISBN @March 2009
Sandra Cristina dos Reis Borges Fernandes
Faculdade de Ciências e Tecnologia da Universidade Nova de Lisboa
Campus da Caparica 2825 Monte da Caparica
Portugal

iii
SANDRA CRISTINA DOS REIS BORGES FERNANDES
FUNCTIONAL ROLE OF MACROBENTHOS IN ESTUARINE
SEDIMENT DYNAMICS
Thesis submitted to the Universidade Nova de Lisboa, Faculdade de Ciências e Tecnologia for the degree of Doctor of Philosophy in Environmental Engineering.
This thesis was financed by Fundação para a Ciência e Tecnologia SFRH/BD/6188/2001.
LISBOA
2009

iv
Author’s declaration
The author states that she afforded a major contribution to the conceptual design and technical execution of the work, interpretation of the results and manuscript preparation of the published articles included in this dissertation, according to the nº2 of art 8º do Decreto-Lei 388-70.
Sandra Cristina dos Reis Borges Fernandes

v
ACKNOWLEGMENTS
I would like to express my sincere gratitude to Professor Paula Sobral. I deeply thank her for the
constant encouragement, valuable guidance and sustained support shown to me since my first
formative years at the FCT, and without whom I possibly would not have followed this path.
Above all, I deeply thank her for her friendship.
I deeply acknowledge Doctor Luca van Duren for have accepted to be my co-supervisor, for her
valuable guidance and assistance, constant support, critical appraisal in this study and for the
facilities allowed at the Netherlands Institute of Ecology (NIOO).
During my staying at the FCT:
I deeply appreciate the constant support of Professor Maria Helena Costa, who has always
provided encouraged and valuable guidance. I also thank the friendship and helpful support of my
colleagues: Ana Dulce Correia, Teresa Neuparth, Filipe Costa, Mário Diniz, Sandra Caeiro e
Gláucia Lima. I am also very grateful to Luis Fernandes for access to velocity data measurements
in the IMAR10-UNL.
I am very thankful to Professor Francisco Carrapiço for the facilities (the epiflourescence
microscope) allowed to at the Centro de Biologia Celular da Faculdade de Ciências, Universidade
de Lisboa.
During my staying at the NIOO:
I am very grateful to Professor Peter Herman for have accepted me in his group and for
constructive criticism and discussions.
I sincerely appreciated to work with Doctor Filip Meysman. I am very grateful for his support and
scientific supervision on the development of mathematical
I am deeply thankful to Doctor Jody de Brouwer, who kindly helped to improve a published
manuscript through his comments, criticism and very interesting and enlightening discussions. I
really appreciated his wisdom, honesty and humbleness and to me he represents the spirit that all
researchers should have.
I am deeply grateful to Jos van Soelen and Bas Koutstaal for support during field collections; Bert
Sinke during the flume experiments as well as Lowie Haazen; Katrijn Baetens for the CFX
simulations, Pieter van Rijswijk for assistance with the use of the Coulter Counter Multisizer II

vi
and Annette Wielemaker-van den Dool for her advice and technical support during Arc View data
treatment.
The two years spent at the NIOO could not be so pleasant without my staying at De Kêete and
without the constant support of Katrijn, Sandra, Sandrine, Marzena, Thomas, Stephane, Karel,
Silvia, the two Francescas, Alexis, and so many others. Thank you so much for your encouraging
support and for the nice parties and travels we have done together.
During my staying at the University of Caen
I acknowledge Doctor Francis Orvain for have accepted to receive me in Caen, for his assistance
with data treatment using MATLAB and for enlightening discussions.
I am sincerely grateful to Professor Michel Mathieu for his constant support and for all the efforts
he took to help me to solve problems related to the incompatibility of the French and the
Portuguese institutions logistics.
I was particularly lucky from participating in the Bioflow, a network gathering researchers from
most of the European flume laboratories. This was an opportunity to meet and discuss with very
interesting researchers: J. Widdows, N. Pope, P. Friend, T. Tolhurts, H-U Riisgård A. and R
Asmos and many others.
I would also like to express my sincere gratitude to Fundação para a Ciência e Tecnologia, who
funded my PhD Fellowship (SFRH/BD/6188/2001) and all the work presented in this thesis.
At REQUIMTE, I am sincerely grateful to: Professor Manuel Nunes da Ponte, Professor Isabel
Moura and to my colleagues Clara Cabrita, Isabel Rodrigues and António Nunes and to all the
community researchers for their constant support and encouragement to finish my PhD thesis.
I deeply appreciate all the support given by my friends Ben, Diogo, João André, Joana, Raquel
and Xico. Thank you so much for your friendship, constant support an eternal understanding.
A very special acknowledgement to my parents (grandmother and the rest of the family), who
have thought me so many precious things, who have always supported me and especially accepted
my absences. I am deeply thankful to them for so many other things for which the pages of this
manuscript would not be enough.

vii
ABSTRACT
Estuaries are areas of high sediment dynamics. Particles in suspension are an important vehicle
of several biochemical substances and contaminants. Therefore, the knowledge on the processes ruling
sediment dynamics is needed to develop tools for estuarine water quality management. Presently, few
numerical models for sediment dynamics incorporate biological interactions with sediment dynamics.
The aim of this study is to gain understanding of the macrobenthic influences on cohesive
sediment dynamics. The research was focused on the effects of two species of macrobenthos; 1) the
cockle Cerastoderma edule (densities of 280 to 1000 ind m-2). Work on this species focused on
sediment transport and deposition, by studying the hydrodynamic effect on the sediment removal
activity (filtration) and its effects on topography and on the current velocities at the boundary layer 2)
The ragworm Nereis diversicolor (densities of 320 to 1200 ind m-2). This work focused on sediment
erodability and consolidation by studying the bioturbation effect on changes in the sediment properties,
and 3) the effect of contamination (3 nmol Cu g-1 dw) on the bioturbation activity of N. diversicolor
and on sediment dynamics.
The results from experiments performed in a racetrack and in an annular flume showed that
increasing density of C. edule is proportional to increasing sediment topography and related to reduced
current velocities near the bed and increased shear velocity (u*), hydrodynamic roughness length and
turbulence kinetic energy (TKE). The higher TKE values were related to the presence of active
filtering C. edule, producing additional turbulence to the TKE produced by topography. The effect of
filtration activity on turbulence is most pronounced at low velocities (u* < 1.5 cm s-1), in agreement
with a unimodal response to increased velocities. Increasing densities of N. diversicolor are related to
increased sediment shear strength (SS), increased biodiffusion coefficients (Db) and increased erosion
rates (ER). This antagonistic effect of increase SS and ER is explained by erosion of bigger aggregates
resulting from biological bound sediments.
This study provides some evidence that copper contaminated sediments are more stable, as a
consequence of decrease in biological response to toxicity, observed in lower values of shear strength
and erosion rates. In addition, new methodologies for the determination of some of the parameters
involved with this research field are suggested.
Key-words : Benthic boundary layer, bioturbation, biodiffusion coefficients, Cerastoderma edule, copper, erosion rates, estuarine cohesive sediments, filtration activity, flumes, Nereis diversicolor, sediment dynamics, topography, turbulence

viii

ix
SUMÁRIO
Os estuários são áreas de grande dinâmica de sedimentos. As partículas em suspensão são um
importante veículo de substâncias bioquímicas e contaminantes. Por essa razão, o conhecimento dos
processos que regem a dinâmica de sedimentos é necessário para desenvolver ferramentas de gestão da
qualidade da água do estuário. Presentemente poucos modelos numéricos incorporam as interacções
biológicas com a dinâmica de sedimentos.
O objectivo deste estudo é o de contribuir para o conhecimento das interacções entre o
macrobentos e a dinâmica de sedimentos coesivos. A investigação focou-se no efeito de duas espécies
funcionais; 1) do berbigão Cerastoderma edule (densidades de 280 a 1000 ind m-2) no transporte de
sedimentos, através do estudo do efeito hidrodinâmico na actividade de remoção de sedimentos
(filtração) e o seu efeito na topografia e nas correntes junto ao fundo, 2) da minhoca-do-mar Nereis
diversicolor (densidades de 320 a 1200 ind m-2) na erodibilidade e coesão do sedimento, através do
estudo do efeito da bioturbação nas alterações das propriedades do sedimento, e 3) o efeito da
contaminação (3 nmol Cu g-1 ps) na bioturbação de N. diversicolor e na dinâmica de sedimentos.
Os resultados experimentais, desenvolvidos em canais oval e anular, mostraram que o aumento
de densidade de C. edule é proporcional ao aumento da topografia e está associado a velocidades
reduzidas e com o aumento da velocidade de corte e energia de turbulência cinética (TKE). Os valores
mais elevados de TKE relacionam-se com a filtração activa de C. edule, que produz uma turbulência
adicional à produzida pela topografia. O efeito da actividade filtradora na turbulência é mais
pronunciado nas velocidades mais baixas (u*<1.5 cm s-1), de acordo com a resposta unimodal da
filtração a velocidades crescentes. Crescentes densidades de N. diversicolor estão relacionadas com o
aumento da força de corte do sedimento (SS), dos coeficientes de biodifusão (Db) e das taxas de
erosão (ER). Este efeito antagónico entre o aumento simultâneo da SS e da ER é explicado pela erosão
de agregados maiores em sedimentos ligados biologicamente.
Este estudo fornece evidências de que os sedimentos contaminados com cobre são mais
estáveis, como resultado de atenuação da actividade biológica em resposta á toxicidade, sendo
observados valores de força de corte do sedimento e taxas de erosão mais baixas. Novas metodologias
para a determinação de alguns parâmetros envolvidos neste campo de investigação são sugeridas.
Palavras-chave: bioturbação, camada limite bentónica, Cerastoderma edule, cobre, coeficientes de biodifusão, dinâmica de sedimentos, filtração, flumes, Nereis diversicolor, sedimentos estuarinos coesivos, velocidade, taxas de erosão, topografia, turbulência

x

xi
ABREVIATIONS A area (m2)
ADV accoustic doppler velocimeter
BBL benthic boundary layer
β local parameter on Eq. [3]
C suspended sediment/particle concentration
C0 initial suspended particle concentration
CD entrainment drag coefficient
CFD computational fluid dynamics
Chl a Chlorophyll a
CR clearance rates (L h-1)
CRind individual clearance rates (L h-1 ind-1)
CR280 clearance rates for a population of 280 ind m-2
Ct suspended particle concentration at time t
cv consolidation coefficient in vertical direction (m2 s-1)
Cu copper
Db biodiffusion coefficients
Df flock maximum dimension
dj exhalant siphon diameter (m2)
Ed eroded depth (m)
Em eroded matter (kg m-2)
EPS extracellular polymeric substances
ETDC erosion, transport, deposition and consolidation cycle of sediment dynamics
ER erosion rates (kg m-2 s-1)
FP7 European Commission 7th Framework Programme (2007-2013)
φs volumetric solid concentration (kg m-3)
φs,0 in-situ volume concentration (-)
g gravitational field strength (acceleration) (m s-2)
γ vertical gradient of the critical bed shear stress on Eq. [3]
h water column height (m)
κ von Karman constant (~ 0.40 or 0.41)
K dispersion coefficient (m2 s-1)
k topographic roughness element height
kcell exponential decrease in algal concentration
xii
M empirical erosion coefficient on Eq. [2]
ME erosion parameter (m/Pa-1s) on Eq. [4, 5]
mv compressibility (m2 N-1)
μ dynamic viscosity (kg m-1 s-1)
n exponent for ER empirical calculations on Eq. [2]
NLI non-locality index
p permeability (m s-1)
ρ density (kg m-3)
ρd sediment particles dry density (kg m-3)
ρs sediment particles density (kg m-3)
ρw water density (kg m-3)
S smooth surface
SS sediment shear strength (Pa)
t time (h)
τb bed shear stress (Pa)
τd critical shear stress for deposition (Pa)
τe critical shear stress for erosion (Pa)
TKE turbulent kinetic energy (m s-2)
TKEU turbulent kinetic energy normalised with free stream velocity
U free stream current velocity (m s-1)
Ucrit critical erosion free-stream velocity (m s-1)
u vertically averaged velocity (m s-1)
u* shear velocity (m s-1)
u*crit critical erosion shear velocity (m s-1)
uj siphon in/exhalant currents/jets (m s-1)
υs settling mud flock velocity (m s-1)
V volume of water (l)
Wd settling velocity (m s-1)
Ye uncorrected weights
Ys standardised and weight specific rates
z depth, distance above the bed (m)
z0 hydrodynamic roughness length (m)
zm jet-in-cross-flow length-scale (m)
10d50 median floc size (m)

xiii
TABLE OF CONTENTS
Acknowledgments …………………………………………………………............…….. v Abstract …………………………………………………………...………………..…...... vii Sumário ………………………………………………………...……………….……....... ix Abbreviations ……………………………………………………...…………….…….…. xi Table of contents ………………………………………………...……………..………… xiii Index of figures ………………………………………………...……………….………... xix Index of tables ………………...……………………………...……………………........... xxvii PART I – GENERAL INTRODUCTION Chapter 1 – Introduction 1.1 Cohesive sediments ……………………………………………………….………….. 2 1.2 Sediment dynamics …………………………………………………………………… 3
1.2.1 Transport ……………………………………………………………………… 5 1.2.2 Erosion …………………………………………….…………………………. 7 1.2.3 Deposition …….…………………………………….………………………... 9 1.2.4 Consolidation ……………………………………….………………………… 10 1.2.5 Sediment stability ……………………………………..………………….…… 11 1.2.6 Contaminated sediments …………………………….………………………... 11
1.3 Biologic interaction with sediment dynamics ………………..……………………….. 12 1.3.1 Stabilisers and destabilisers …………………….….………………………….. 13 1.3.2 Topography ………………….…………………….…………………………… 14 1.3.3 Filtration activity ………………………………………….…………………… 15 1.3.4 Sediment reworking ………………………………….………………………... 16
1.4 Species studied ………………………………………………..……………………..... 18 1.4.1 The cockle Cerastoderma edule …...…………………………….…………..... 18 1.4.2 The ragworm Nereis diversicolor ……………………………….……………. 20
1.5 General objectives and structure of the thesis …………………………..…………….. 22 1.6 References ……………………………………………………………..……………… 25
PART II – INTERACCTION BETWEEN Cerastoderma edule AND SEDIMENT
DYNAMICS
Chapter 2 - Clearance rates of Cerastoderma edule under increasing current velocity, measured in two different flumes and interrelation with hydrodynamics 2.1 Introduction ………………………………………………………..………........….... 39 2.2 Material and Methods …………………………………………………………….….. 41
2.2.1 Organisms collection and experimental set-up and procedures …………..…. 41 2.2.2 Clearance activity estimations ……………………………………….............. 42 2.2.3 Flume calibration ………………………………………………….………..... 44
xiv
2.2.4 Hydrodynamic parameters estimations ………………………………..…….. 45 2.3 Results ……………………………………………………………………..……......... 46
2.3.1 Flume hydrodynamics ………………………………………………............... 46 2.3.2 Effect of cockles on hydrodynamics ……………………………………....…. 47 2.3.3 Visual observations on sediments with cockles ……………………................ 50 2.3.4 The effect of hydrodynamics on clearance activity ………………………….. 50
2.4 Discussion ……………………………………………………………………………. 52 2.4.1 Comparisons between flumes ………………………………………………… 52 2.4.2 Influence of velocity on clearance rates …………………….…………...…… 53 2.4.3 Influence of clearance activity on velocity parameters ………………………. 55
2.5 Conclusions …………………………………………………………………………… 56 2.6 Acknowledgments …………………………………………………………………….. 57 2.7 References ……………………………………………………………………………. 58 Chapter 3 - How cockles change the benthic boundary layer: density effects on topography and turbulence 3.1 Introduction …………………………………………………………………………... 64 3.2 Material and Methods ………………………………………………………………... 66
3.2.1 Experiment 1: Comparison of the effect of live and artificial cockle beds on microtopography and turbulence ……………………………………….………. 66
3.2.1.1 Sediment and organisms collection …………………………............... 66 3.2.1.2 Experimental design and flume runs ………………………................. 66 3.2.1.3 Topography analysis …………………………………………………. 68 3.2.1.4 Hydrodynamic analyses …………………………………………….... 70
3.2.2 Experiment 2: Relationship between filtration activity and turbulence …….... 71 3.3 Results ……………………………………………………………………………….... 72
3.3.1 Experiment 1: Comparison of live and artificial cockle beds on microtopography and turbulence ……………………………………………….…… 72
3.3.1.1 Effects of C. edule on topographical roughness …………………….... 72 3.3.1.2 Effects of C. edule on hydrodynamic roughness ……………………… 75 3.3.1.3 Effects of C. edule on turbulence ……………………………............... 76
3.3.2 Experiment 2: Relationship between filtration activity and turbulence ……..... 79 3.4 Discussion ……………………………………………………………………..……… 82
3.4.1 The effect of C. edule on topographical roughness ………………………….. 82 3.4.2 The effect of C. edule on hydrodynamic roughness …………………. ……… 82 3.4.3 Effects of C. edule on turbulence …………………………………….............. 83
3.5 Conclusions …………………………………………………………………………… 85 3.6 Acknowledgments …………………………………………………………………….. 86 3.7 References ……………………………………………………………………….……. 86

xv
PART III – INTERACCTION BETWEEN Nereis diversicolor AND SEDIMENT
DYNAMICS
Chapter 4 – Nereis diversicolor effect on the stability of cohesive intertidal sediments 4.1 Introduction …………………………………………………………………………… 91 4.2 Material and Methods ………………………………………………………………… 91
4.2.1 Experimental set-up …………………………………………………………... 93 4.2.2 Shear strength measurements ……………………………………………….... 94 4.2.3 Erosion measurements ……………………………………………………….. 94 4.2.4 Bioturbation effect (Be) ……………………………………………………… 95 4.2.5 Statistical analysis …………………………………………………………..... 96
4.3 Results ………………………………………………………………………………… 96 4.3.1 Visual observations …………………………………………………………… 96 4.3.2 Sediment shear strength ………………………………………………………. 97 4.3.3 Sediment erodability ………………………………………………………….. 97
4.3.3.1 Critical current velocity ………………………………………………. 97 4.3.3.2 Eroded material ………………………………………………………. 97
4.3.4 Correlations with sediment shear strength ………………………………… 102 4.4 Discussion ……………………………………………………………………………. 104
4.4.1 N. diversicolor effects below critical erosion velocity ………………………. 104 4.4.2 N. diversicolor effect above critical erosion velocity ………………………… 106 4.4.3 Interaction between sediment stability parameters …………………………… 108
4.5 Concluding Remarks …………………………………………………………………. 110 4.6 Acknowledgments ……………………………………………………………………. 110 4.7 References ……………………………………………………………………………. 111
Chapter 5 – Measuring bioturbation of Nereis diversicolor with luminophores:
experimental and modeling artifacts
5.1 Introduction ………………………………………………………………………….. 117 5.2 Material and Methods ……………………………………………………………….. 120
5.2.1 Organisms and sediment collection ………………………………………….. 120 5.2.2 Mesocosms set-up …………………………………………………………… 120 5.2.3 Luminophores analysis ……………………………………………………….. 122 5.2.4 Db estimations ……………………………………………………………….. 122 5.2.5 Statistical analysis ……………………………………………………………. 124
5.3 Results and Discussion ………………………………………………………………. 124 5.3.1 Control interpretation ………………………………………………………… 124 5.3.2 Luminophores concentrations ……………………………………………….. 127 5.3.3 Db estimations ……………………………………………………………….. 128 5.3.4 NLI Index …………………………………………………………………….. 134
5.4 Conclusions ……………...…………………………………………………………... 135 5.5 References …………………………………………………………………………... 136

xvi
PART IV – INTERACTION BETWEEN CONTAMINATED SEDIMENTS AND
BIOLOGICAL ACTIVITY
Chapter 6 - The effect of Nereis diversicolor on shear strength and erodability of cohesive
sediments: the influence of copper contamination
6.1 Introduction ………………………………………………………………………….. 143 6.2 Material and Methods ………………………………………………………………... 145
6.2.1 Sediment and organisms ………….…………………………………...…........ 145 6.2.2 Experimental set-up ………………….……………………………………...... 145 6.2.3 Sediment properties ………………………………………………………….. 147 6.2.4 Erosion runs …………………….……………………………………………. 147 6.2.5 Critical erosion velocity and eroded matter ………………………………….. 148 6.2.6 Copper analysis ………………………………………………………...……. 149 6.2.7 Statistical analysis …………………………………………………….……… 149
6.3 Results and discussion ……………………………….………………………………. 150 6.3.1 Effects of bioturbation and copper contamination on sediment properties ...... 150
6.3.1.1 Sediment shear strength ………….………………………………………. 150 6.3.1.2 Sediment dry bulk density and organic matter………………………….... 152 6.3.1.3 Chlorophyll a in the sediment ……………….………………..………..... 152
6.3.2 Copper in the sediment and accumulation by N. diversicolor ………………. 153 6.3.3 Effects of bioturbation and copper contamination on erosion ………………. 154
6.3.3.1 Eroded matter and critical shear velocities …….………………………… 154 6.3.3.2 Input of organic matter, chlorophyll a and copper to the water column …. 157
6.3.4 Eroded depth and sediment shear strength …………………………………… 159 6.4 Conclusions …………………………………………………………………………... 161 6.5 Acknowledgments ……………………………………………………………………. 162 6.6 References ……………………………………………………………………………. 162
Chapter 7 – The influence of Cu Contamination on Nereis diversicolor bioturbation
7.1 Introduction ………………………………………………..…………………………. 169 7.2 Material and Methods ……………………………………………………….……….. 171
7.2.1 Mesocosms set-up …………………………………………………………..... 171 7.2.2 Luminophores analysis ………………………………………………………. 173 7.2.3 Db estimations ………………………………………………………............. 173 7.2.4 Additional cumulative effect of bioturbation and copper ……………....…..... 175 7.2.5 Statistical analysis ……………………………………………………………. 175
7.3. Results ……………………………………………………………………………….. 175 7.3.1 Luminophores profiles ………………………………………………….......... 175 7.3.2 Db estimates ………………………………………………………………...... 176 7.3.3 Non-locality index ……………………………………………………………. 177 7.3.4 Comparisons with controls …………………………………………………… 179 7.3.5 Additional cumulative effects …………………………………………….…... 180

xvii
7.4 Discussion …………………………………………………………………………..... 181 7.4.1 Divergent model results ……………………………………………………… 181 7.4.2 Interpretation of Db values and non-local effects …………………………… 181 7.4.3 The effect of Cu on Db values ……………………………………………...... 183 7.4.4 Db estimation on control treatments ………………………………………..... 184
7.5. Conclusions ………………………………………………………………………….. 185 7.6 Acknowledgments …………………………………………………………………..... 185 7.7 References …………………………………………………………………………..... 186
PART V – GENERAL CONCLUSIONS
Chapter 8 – General conclusions
8.1 The effect of Cerastoderma edule on sediment transport ……………...…….............. 193 8.1.1 Topography and hydrodynamic conditions in the BBL ……………………… 193 8.1.2 Filtration activity ……………………………………………………………... 194
8.2 The effect of macrobenthos on sediment stability …………………………….………. 194 8.2.1 Sediment shear strength ………………………………………………….…... 195 8.2.2 Erodability: critical velocity for erosion and erosion rates ………………..….. 195 8.2.3 Interaction between sediment stability parameters …………………............... 195 8.2.4 Sediment reworking ………………………………………………………....... 196
8.3 The effect of Cu contamination in N. diversicolor bioturbation and estuarine sediment stability ………………………………………………………………………… 197 8.4 Measuring Techniques ……………………………………………………….............. 197 8.5 Concluding remarks ………………………………………………………………….. 198
PART VI – REFERENCES
Chapter 9 – References
9.1 References ……………………………………………………………...…….............. 203

xviii

xix
INDEX OF FIGURES Chapter 1 Figure 1.1 - Schematic representation of the role of suspended sediments in estuarine biogeochemical processes. Boxes represent compartments hosting materials and chemical constituents, and arrows denote physical and biogeochemical processes responsible for the transfer of such between compartments (Turner and Millwards, 2002)…...………...………… 4 Figure 1.2 – Schematic drawing of a benthic boundary layer (BBL) in parallel flow at zero incidence ……………………………………………………………………………………..... 6
Figure 1.3 – The cockle Cerastoderma edule ………………..…….…………….………….. 19
Figure 1.4 – The ragworm Nereis diversicolor ……………..………………….…..………... 21
Chapter 2 Figure 2.1 - Comparison between velocities measured (ADV) and predicted (CFX) for the 10 cm width flume, at 5 and 10 cm s-1. Lower graph showing the benthic boundary layer in detail ……………………………………………………………………………….…………….….. 46 Figure 2.2 - Hydrodynamic conditions in the flumes a) measurements in the NIOO flume with ADV; b) CFX simulations for the IMAR flume .....………………………….………….…… 47 Figure 2.3 - Relationship between shear velocity u* estimations (using LW method) and current velocity (U), in the IMAR and NIOO flumes corresponding to the following linear regressions (u*= 0.2462U+0.0141, R2=1.0) and (u*= 0.0267U+0.1008, R2=0.96) ….…….… 48 Figure 2.4 - Velocity profiles at 5 and 40 cm s-1 measured over a smooth surface (S), the control sediments (C) and cockles bed (Ck) in the NIOO flume ………………………..…… 48 Figure 2.5 - Relationship between current velocity (U) and shear velocity (u*) for a smooth surface (S), control sediments (C) and cockles bed (Ck) in the NIOO flume ………..…….... 49 Figure 2.6 - Roughness length (z0) over increasing U in a smooth surface (S), over the control sediments (C) and cockle bed (Ck) in the NIOO flume. z0 axis is in a logarithmic scale for a better visualisation ……………………… …………………………………………..……..... 49 Figure 2.7 – Flume clearance rates (CR) over increasing free-stream current velocities (U) for the control treatments in the NIOO and IMAR flume ……………………….………...….…. 51 Figure 2.8 – Weight specific clearance rates (estimates with CD method) over increasing free-stream current velocities (U) in the IMAR and NIOO flume. (± Standard deviation) ….….... 51 Figure 2.9 - Weight specific clearance rates (estimates with CD method) over increasing shear velocities (u*) in the IMAR and NIOO flume. (± Standard deviation) ….…………….…...… 52

xx
Chapter 3 Figure 3.1 – Side-view of the artificial cockle beds using the two density of shells M (500 ind m-2) and H (1000 ind m-2) and the three roughness levels, T4 being the roughest and T2 the smoothest. The distance between two crosses of the white board is 5 cm …..……...……….. 67 Figure 3.2 - Cerastoderma edule changes in topographical roughness, measured as element height (k, cm), over increasing free-stream velocities (u*, cm s-1) for the natural treatments. Lines refer to linear regressions for each treatment as: black broken line (C), solid grey line (M) and solid black line (H). Legends as in Table 3.2 ..……………………………………... 69
Figure 3.3 – Cerastoderma edule changes in topographical roughness, measured as element height (k, cm), over increasing free-stream velocities (u*, cm s-1) for the natural treatments. Lines refer to linear regressions for each treatment as: black broken line (C, control), solid grey line (M, 500 ind m-2) and solid black line (H, 1000 in m-2)……...………………………..….. 73
Figure 3.4 – Cerastoderma edule effect in the BBL. Average velocity profiles (u, cm s-1, U of ~ 10 cm s-1) and turbulent kinetic energy profiles (TKE, cm2 s-2, at U of ~ 25 cm s-1). Each profile is an average of 8 individual sub-profiles. Legends as in Fig. 3.3.………..………….. 75 Figure 3.5 – Cerastoderma edule effect in the relationships between shear velocity (u*) and free-stream velocity (U) for comparable treatments. Individual points represent averages of 8 sub-profiles. Legends and functions of the relationships can be found in Table 3.2……...….. 76 Figure 3.6 – Cerastoderma edule effect in the relationships between turbulence kinetic energy (TKE, cm2 s-2) and the square of free-stream velocity (U2) for comparable treatments. Individual points represent averages of 8 sub-profiles. Legends and functions of the relationships can be found in Table 3.2. ………………………………………………..……. 78 Figure 3.7 – Cerastoderma edule effect in the relationships between normalised turbulence kinetic energy (TKEU2) and shear velocity (u*) for comparable treatments. Individual points represent averages of 8 sub-profiles. Legends as in Table 3.2…………………………..….... 78 Figure 3.8 – Cerastoderma edule effect in the relationships of normalised TKE (TKEU) as a function of roughness or element height (k). Treatments are gathered in two groups: one with live C. edule (M and H, ♦) and the second with the treatments without live organisms (C and T treatments, )…………………………….……………………………………….………...… 79 Figure 3.9 - Cerastoderma edule effect on turbulence (TKE averaged in the first 6 cm from the bed) as a function of individual clearance rate (CR) of a population of 280 ind m-2, average shell length and weight of 26 mm ± 2 and 0.16g ± 0.01. Linear regression presented in the figure. ………………………………………………………………………………………… 80 Figure 3.10 - Cerastoderma edule jet length scale (zm, cm) and clearance rates (CR, L h-1 ind-
1) as a function of shear velocity (u*) for a population of cockles with 280 ind m-2...…..….... 81

xxi
Figure 3.11- Figure 3.11- Cerastoderma edule effect in the relationships of normalised TKE (TKEU2) as a function shear velocity (u*) for the control treatments of Exp. 1 (C, ○) and of Exp. 2 (Ct, ) and the lowest density of C. edule (280 ind m-2, L, *), medium (500 ind m-2, M, ▲) and the highest density (1000 ind m-2, H, ♦).…………………………………………… 81 Chapter 4 Figure 4.1 - A: Annular flume used to study the effects of bioturbation by Nereis diversicolor on the resuspension of sediment exposed to different current velocities. B: Experimental setup (view across the flume channel). (adapted from Sobral & Widdows, 2000) ……..………….. 95 Figure 4.2 - a) Aspects of the sediment surface at the beginning of the incubation period (day 0). Note, on the upper microcosms, the trace of a N. diversicolor burrowing. b) Sediment surface at day 20, in the control treatment. It is possible to observe the developed biofilm; lighter shaded areas on the surface correspond to sediment from lower layers, transported to the surface by the meiofauna. (photos from experiment MAR) …………………………………. 96 Figure 4.3 - Effect of free stream velocity (cm s-1) on eroded matter (Em) (g m-2)(± SD) (symbols) and on the content of OM on Em (lines) for experiments NOV (A) and MAR (B), for the controls (CNOV and CMAR) and the treatments with N. diversicolor (N350, N530 and N790). Symbols with arrows represent the average Ucrit (cm s-1) of each treatment...…...…. 100 Figure 4.4 - Eroded chl a (g m-2) (symbols) and chl a content of eroded matter (mg chl a g-1 dw) (lines), as a function of the free stream velocity, for experiments NOV (A) and MAR (B). Legends as Fig 6.3 ……………………………………………………….…………..….…. 101 Figure 4.5 - Variation of Ucrit (cm s-1) and sediment shear strength before erosion sb (kPa) for both experiments NOV and MAR. Linear regression is based on all data points (F= 8.16, p<0.01, n=15). Legends as Fig. 6.3 ………………………………………….…..…….…… 103 Figure 4.6 - Variation of Em (g m-2) and sediment shear strength after erosion sa (kPa) for both experiments NOV and MAR. Lines indicate linear regression tendency for each experiment. Legends as Fig. 6.3 ………………………………………………………………..……...… 103 Chapter 5 Figure 5.1 - Comparison between the 570 density of N. diversicolor (570) and respective control (Ct 570) for the luminophores concentration profiles found after 21 incubation days, in terms of a) luminophores concentration, b) the percentage of standard deviation over the respective average, and c) 570 concentrations with respective control subtraction ………... 125 Figure 5.2 – Profiles of luminophores concentration in depth estimated over time after bioturbation of N. diversicolor for densities of 320, 450 and 570 ind m-2 ………………...... 128 Figure 5.3 - Biodiffusion coefficients over the bioturbation period for a population of N. diversicolor of 320, 450 and 570 ind m-2 (± standard deviation) estimated using M1 and M2 methods …………………………………………………………………………………..…. 129

xxii
Figure 5.4 – Biodiffusion coefficients measured on day 20 (Exp. 1) and day 21 (Exp. 2 and Exp. 3) for the different densities of N. diversicolor (320, 450 and 570 ind m-2) (± standard deviation) ………………………………………………………………………..………….. 130 Figure 5.5 - a) Calculations of Db for the 570 Ct treatment using the same concentrations but different sampling time. b) Calculations of Db for 570 treatment using the profile concentrations measured over the sampling period, but assuming these profiles were taken at a fixed time of 3 days ……………………………………………………………….……...…. 131 Figure 5.6 – Comparison between the observed profiles of luminophores (o) and predictions from method M1 (bold line) and M2 (striped line) for each replicate taken on day 21 for 450 and 570 ind m-2 and 570Ct and for day 20 to 320 ind m-2 ……………………..………….... 133 Figure 5.7 - Non-locality index measured after 21 days (20 days for 320 density) in the three densities tested (and control for 570 density) and 450 and 320 density …………..…….….. 135 Chapter 6 Figure 6.1- Map of Tagus estuary (Portugal). A. Sediment collection; B. organisms
collection………………………………………………..………………………………….... 146
Figure 6.2 - Shear strength (KPa) profiles for each sediment before erosion runs: control (B), sediment with N. diversicolor (N), copper spiked control (CB) and copper spiked sediment with N. diversicolor (CN). Mean ± SD. n=3. Significant differences among the four sediments (two-way ANOVA F5.88=19.0410, p<0.001) and sediment layers (two-way ANOVA F3.90=19.9465, p<0.001) …………………………………………………..………………….151 Figure 6.3 - Eroded matter (Em, g m-2) in a log scale as a function of shear velocities (u*, cm s-
1). Lines represent the exponential relationships (expressed on Table 2) in each sediments: control (B ), sediment with N. diversicolor (N ), copper spiked control (CB ) and copper spiked sediment with N. diversicolor (CN ). n=3 ……………..……………...... 155 Figure 6.4 – Input of chlorophyll a (mg m-2) to the water column at selected shear velocities (u* cm s-1) for control sediment (B), sediment with N. diversicolor (N), copper spiked control (CB) and copper spiked sediment with N. diversicolor (CN). Mean ± SD. n=3 ...…….…….157 Figure 6.5 - Input of dissolved and particulate copper (dCu and pCu, µmol m-2) to the water column at selected shear velocities (u*, cm s-1) for copper spiked control sediment (CB) and copper spiked sediment with N. diversicolor (CN). Mean ± SD. n=3...………..…………… 158 Figure 6.6 - Relation between erosion depth (Ed, mm) and sediment shear strength (KPa) measured after erosion. Circle indicates sediments without N. diversicolor. Trend line was built combining data from each sediment (F(1.10)=53.98. p < 0.001), control (B), copper spiked control (CB), sediment with N. diversicolor (N) and copper spiked sediment with N. diversicolor (CN) ……………………………………………………………..…………….. 160

xxiii
Chapter 7 Figure 7.1 – Profiles of luminophores concentration over a period of 21 days for a N. diversicolor density of 570 ind m-2. The “N” treatment represents N. diversicolor in natural sediment, while “CN” refers to N. diversicolor in Cu contaminated sediment. (Bars denote ± standard deviation) ………………………..………………………………………………… 176 Figure 7.2 – Evolution of the biodiffusion coefficient over a period of 21 days. “N” represents N. diversicolor in natural sediment, while “CN” refers to N. diversicolor in Cu contaminated sediment. M1 and M2 refer to the different procedures of Db estimation. (Bars represent ± standard deviation) ……………………………………………….…………………………. 178 Figure 7.3 – Non-locality index estimated over time for a population of N. diversicolor under natural (N) and contaminated sediments (CN). (± Standard deviation) ………..………….. 178 Figure 7.4 – Depth profiles of luminophore concentration after 21 days for a N. diversicolor density of 570 ind m-2. Four treatments: N. diversicolor (N), Cu and N. diversicolor (CN), Cu alone (C), Control (Ct) …………………………………………………...…………………. 179

xxiv
INDEX OF TABLES Chapter 2 Table 2.1 – Characteristics for IMAR and NIOO experiments in terms of a) organisms, b) experimental conditions, c) flume characteristics and d) sampling conditions......................... 43 Chapter 3 Table 3.1 - Flume characteristics ……………………...…………………………….....……. 68 Table 3.2 – Topography characterised by the elements height (k, cm, ± standard deviation, n ~10) and by roughness length (z0, cm) in all treatments (C for control (n=10), treatments with live C. edule (n=10): M for 500 ind m-2 density and H 1000 ind m-2 and for the artificial treatments (n=5), the highest roughness level T4 until the lower roughness level T2 for densities M and H). Relationships between hydrodynamic parameters: shear velocity (u*, cm s-
1), free-stream velocity (U, cm s-1) and turbulence kinetic energy (TKE, cm2 s-2) (n=10 in C, M and H and n=5 in T treatments) and normalised TKE (TKEU) ………….……...……………. 74 Chapter 4 Table 4.1 - Changes in the shear strength s ( ± SD) of the surface sediment after the 20 day incubation period (sb), and after erosion of the sediment surface (sa) for the experiments NOV (CNOV and N350) and MAR (CMAR , N 530 and N 790). Also shown are values of SPM, Em, eroded OM, eroded chl a and erosion rates at the maximum current velocity tested (~50 cm s-1)……………………………………………………………………………...………….. 98 Table 4.2 - Additional cumulative effect of bioturbation (Be, %) on: sediment shear strength (kPa) before (sb) and after (sa) resuspension; critical erosion velocity (Ucrit,); Em; erosion rate; eroded chl a and μg chl a g-1 DW for the highest experimental velocity (~50 cm s-1) for the three N. diversicolor average densities (N350, N530 and N790 ind m-2) ……………..……... 99 Table 4.3 - Exponential regressions of SPM (y) (mg l-1) on current velocity (x) (cm s-1). Also shown are critical current velocities (Ucrit) required to increase the SPM above a threshold of 50 mg l-1 ( ± SD) …………………………………………………………………..…….…… 99 Chapter 5 Table 5.1 – Biodiffusion coefficient values (cm2 y-1) estimated with the two different estimation methods (M1 and M2) and the NLI (non-locality index) for the three densities tested, 320, 450 and 570 ind m-2 ……………………………………………..……………... 128 Table 5.2 – Stabilisation time (days) for Db estimations (with procedure M1 and M2) according to different thresholds …………………………………………..……………….. 132

xxv
Chapter 6 Table 6.1 – Biogeochemical characteristics of the sediment before erosion: Control (B), sediment with N. diversicolor (N), copper spiked control (CB) and copper spiked sediment with N. diversicolor (CN). mean ± SD, (n, number of samples) ..……………………..……. 150 Table 6.2 –Parameters of the fitted equation E=a.eb.u* for eroded matter, Em, (g m-2) and erosion rates, Er, (g m-2 s-1) as a function of shear velocity, u* (cm s-1), and critical shear velocities (u*crit, cm s-1, mean ± SD, n=3), in the control sediment (B), sediment with N. diversicolor (N), copper spiked control (CB) and copper spiked sediment with N. diversicolor (CN). (R2, n=24) .………………………………………………………………….………... 154 Chapter 7 Table 7.1 – Db (cm2 y-1) estimates obtained by M1 and M2 procedures and non-locality index (LNI), over a period of 21 days for different mesocosm set-ups. Treatment codes refer to natural sediment with N. diversicolor (N), contaminated sediment with N. diversicolor (CN), the control without organisms under natural conditions (Ct) and control for contaminated sediment (C). (± Standard deviation) ……………………………………………..………… 177 Table 7.2 - Additional cumulative effect (%) due to bioturbation by N. diversicolor and copper addition. Calculations are based on the Db estimates for day 21 using the M1 and M2 procedures and the non-linearity index (NLI) ………………………………………....…… 180


PART IGENERAL INTRODUCTION
Introduction
Chapter 1

Chapter 1 – Introduction
1
INTRODUCTION
There is a present international concern about ecosystem water quality as well as sea-
level rise and erosion of coastal margins, caused by increase of rainfall and storm episodes
due to global climatic change. Coastal zone management has gained more attention and has
been included in several international commitments (UN Framework Convention on Climate
Change, UN Convention on Biological Diversity, UN Convention on Combating
Desertification, International Strategy for Natural Disaster Reduction), the Kyoto and
Montreal protocols, initiatives such as World Summit on Sustainable Development, Global
Earth Observation System of Systems initiative (GEOSS), Intergovernmental Panel on
Climate Change (IPCC).
One of the main objectives of the FP7- Specific Program for Environment (including
Global Changes)1 is to promote sustainable management of the natural and human
environment and its resources by advancing our knowledge on the interactions between the
biosphere, ecosystems and human activities, and developing new technologies, tools and
services for monitoring, prevention and mitigation of environmental pressures and risks
including on health and for the sustainability of the natural and man-made environment, in
order to address in an integrated way global environmental issues. Douvere and Ehler (2009)
focus on the growing awareness of the need to establish marine spatial planning (as in land
use management) and reviewed the international and legal framework relevant to the
development of an ecosystem-base sea use management.
Estuaries (semi-enclosed coastal bodies of water) are areas of high biological
productivity and have been attractive areas for population establishment for centuries. The
consequent pressure of unsustainable and uncontrolled industrial and anthropogenic
development creates conflicts with natural processes that sustain the health and productivity
of coastal areas and results in situations of contamination and eutrophication and situations of
loss or accretion of margins due to erosion and sedimentation.
Estuaries are often characterized by high sediment dynamics. Estuarine sediments are
composed of mud and sand and when they have a relevant percent of mud, they exhibit
cohesive properties. Sedimentation establishes mudflats. Estuary boundaries are often
delineated by mudflats and can be separated in three distinct zones: the lower, the middle and
1 European Commission C(2008)4598 of 28 August 2008

PART I – GENERAL INTRODUCTION
2
the upper flats according to water inundation during the tidal cycle. The typology of intertidal
mudflats can be characterised in terms of tidal range, wave energy, sediment supply,
steepness, bed forms, organic content and biology (Dyer, 1998).
Intertidal mudflats are areas of high production of flora and fauna. They support large
populations of birds and form nurseries and feeding areas for coastal fisheries. They are also
known as places of high organic matter mineralization (Middelburg et al., 1996; Guarini et
al., 2000; Heip et al., 2001), and they constitute an important component in global
biogeochemical cycles. Additionally, these zones of high sedimentation are a potential trap
for solid phase contaminants. The sedimentation of contaminated sediments, chemical
reactions and dissolution under anaerobic conditions (observed in few mm depths in some
cases) and resuspension events (leading to recontamination events) are processes that need to
be clarified.
The increasing anthropogenic pressures on the environmental systems and the need
for sustainable management tools, led to an extensive research focusing on contaminated
sediments. Toxicity towards the benthos is another important issue considering their
importance at the lower levels of the trophic chain, and considering the contamination
amplification to higher levels of the food web and ultimately to human consumption.
1.1 Cohesive sediments
Estuarine sediments are composed of sand (non-cohesive sediments) and mud
(cohesive sediments). The non-cohesive sediments can be characterised by being inert
material whose transport/erosion/deposition behaviour is mainly determined by physical
properties such as gain size distribution (Berlamont et al., 1993). In this case, particle
adhesion is due to water-film surface tension. The cohesive sediment particles are
characterised for being chemically very reactive. Due to its wide variability of origins and
composition the prediction of behaviour, transport and fate of cohesive sediments is much
more complex than the non-cohesive.
Cohesive sediments, as encountered in the environment, is a mixture of clay, silt, fine
sand, organic material, water and sometimes gas (Winterwerp and van Kestereren, 2004).
The mineral composition of cohesive sediments comprises silicates (quartz, feldspar and clay
minerals) and non-silicate minerals that are precipitations of salts, carbonates, sulfates,
sulfides, phosphates, oxides and hydroxides, depending on chemical conditions (Winterwerp
and van Kestereren, 2004).

Chapter 1 – Introduction
3
The granular size and composition are of prime importance for the mechanical
behaviour of sediments (in transport, flocculation, erosion, deposition and consolidation).
The textural classification of gravel-free muddy sediments was revised by Flemming (2000),
who proposed the most recent and more precise diagram using the sand/silt/clay ratio.
The chemical properties of organic matter (organic polymers, colloids or dissolved
organic carbon) in the liquid phase are also very important for the cohesive behaviour of
sediments by influencing the formation of aggregates and flocs. In general, the amount of
organic matter is well correlated and proportional to the clay content (Winterwerp and van
Kestereren, 2004). According to these authors, there is a group of organic substances that can
be regarded as flocculants (polysaccharides, proteins composed of peptides and amino acids)
a second group that is neutral (lipids, hydrocarbons like cellulose, lignin composed of
aliphatic and aromatic hydrocarbons), and a third group that are dispergents or deflocculants
(humic acids). These polymers occur as charged, or as neutral particles and can adsorb to
clay particles through van der Waals forces, bipolar forces or hydrogen bonding (Winterwerp
and van Kestereren, 2004).
1.2 Sediment dynamics
The cycle of sediment dynamics, also known by the ETDC cycle (erosion, transport,
deposition and consolidation) is a present concern considering that the pollutant dynamics of
an estuary is closely linked to the distribution of particulate mater. Therefore, the knowledge
of the processes governing sediment dynamics is essential to a better prediction and
management.
The sediment particles along with seston are transported in the flowing water. The
trajectory of each particle follows laminar flows and turbulent eddies. In their trajectories
particles collide with other particles and form aggregates with subsequent adherence among
particles of cohesive sediment. These aggregates, or flocs, can collide with each other
causing floc break-up.
The sediments are transported in suspension in the water column as long as current
velocities exceed critical values for deposition. The critical velocity for deposition is
dependent on the shape and the height of the floc, i.e. the flocs in suspension do not deposit
at the same time or with the same settling velocity.
Particles with a larger deposition velocity can overtake those with a smaller
deposition velocity and collision between those particles may result in further aggregation

PART I – GENERAL INTRODUCTION
4
and floc break-up. The lower the current velocities, the higher deposition rates are observed.
Once the particles or flocs are deposited on the seabed, they can either be buried by
subsequent deposited sediments or they can be resuspended if current velocity increases.
Underneath the deposited sediments there is an increasing pressure that pushes the sediment
down and promotes the expulsion of interstitial water as the consolidation process take place.
When the current velocities increase and exceed the critical erosion velocity, the consolidated
sediments are eroded and brought back in to the water column where they become exposed to
turbulent eddies, floc break-up and further aggregation.
Because of their reactivity, mobility and nutritional value, suspended particles have
an important role in biogeochemical cycles in estuaries as transfer vehicles of chemical
constituents between water column, bed sediment and food chain (Fig. 1.1).
Figure 1.1 - Schematic representation of the role of suspended sediments in estuarine biogeochemical processes. Boxes represent compartments hosting materials and chemical constituents, and arrows denote physical and biogeochemical processes responsible for the transfer of such between compartments (Turner and Millwards, 2002).
Great effort has been taken to develop a more integrated description of the processes
in sediment dynamics. While physical (Teisson et al., 1993; Uncles, 2002; Cappucci, et al.
2004) and biogeochemical processes (Correl et al., 1992; Chen et al., 2000; Azevedo et al.,
2008) are relatively well understood, the modelling approaches incorporating the biological
effects are scarce (Borsje et al., 2008). The models integrating the effect of suspension

Chapter 1 – Introduction
5
feeders on sediment and nutrient dynamics have but a description of suspension-feeding
activity and other ecophysiological variables (Sohma et al., 2001, 2008; Turner and
Millwards, 2002). Due to the multidisciplinary range of processes and their interactions, the
clear relevance of each process (within the scale of observation) on sediment dynamics is still
not clear.
1.2.1 Transport
The physical processes that dominate sediment transport in aquatic ecosystems are
relatively well defined (e.g. Mehta et al., 1989; Houwing, 1999; Gleizon et al., 2003; Dyer et
al., 2004). Sediment transport is governed by an advection-dispersion equation for the mass
conservation of suspended sediments:
)()( CKCUt
C∇∇=∇+
∂
∂ [1]
where C is the suspended sediment concentration (kg m-3) and t is time (s). t
C
∂
∂ expresses the
accumulation rate in time and space. U is the free stream current velocity (m s-1) and K is the
dispersion coefficient (m2 s-1).
The description of transport is only completed after considering bottom exchanges by
erosion and deposition rates. Erosion and deposition are sources and sinks that started to be
taken in to account recently (Brenon and Le Hir, 1999; Cancino and Neves, 1999; Cugier and
Le Hir, 2000). These two processes will be discussed in detail later.
The structure of the flow is characterised by shear flow near the bed (Fig. 1.2). At the
bottom, there is a benthic boundary layer (BBL) characterise by a velocity gradient
developed between U in the water column and the boundary, where no slip- condition applies
(i.e. at z=0, U=0). Within the part of the turbulent boundary layer, the velocity profile is
logarithmic and may be described by the Prandtl von Karman equation or “law of the wall”:
=
0z
zuzU ln)( *
κ [2]
where U(z) is the velocity at height z above the bed, κ is the von Karman’s constant (~ 0.40),
z0 is roughness length and u* is the shear velocity. u* is generally determined from the slope
advection diffusion

PART I – GENERAL INTRODUCTION
6
of the logarithmic velocity profile (u (z) versus ln (z)) and z0 is estimated from the intercept
between the relation (u(z) versus ln (z)) and the Y-axis.
Figure 1.2 – Schematic drawing of a benthic boundary layer (BBL) in parallel flow at zero incidence.
Shearing stresses within the benthic boundary layer of a flow (∂u/∂z) are a
manifestation of the drag force at the bed and the flux of momentum per unit area per unit
time is known as the bed shear stress (τ, Pa). The modelling approaches used to estimate
erosion and deposition rates are dependent on τ and its critical values at which erosion or
deposition start (Houwing, 1999). Therefore, τ is one of the most important parameters used
in the modelling of sediment transport in the benthic boundary layer and in evaluation of the
benthic flux of material.
Most numerical models using hydrodynamic parameters are based on empirical
formulas assuming τ as a quadratic function of shear velocity (u*, m s-1) τ ∝ 2*u (Winterwerp
et al., 2006), or using the Manning roughness coefficient (Dias and Lopes, 2006) or the
Nikuradse roughness coefficient to express topographical roughness (Houwing and Van Rijn,
1998; Lumborg, 2005, Zimmermen et al., 2008).
The estimation of τ is normally performed using indirect approaches and the
properties of the sea bed are frequently disregarded, which reduces the accuracy of its
velocity (U)
height
(z)
BBL
0
velocity (U)
height
(z)
BBL
0

Chapter 1 – Introduction
7
determination and the accuracy of hydrodynamic models. Therefore the knowledge on the
parameters of the BBL over natural structures needs to be developed.
Some efforts have been taken by El Ganaoui et al. (2004) to discriminate the erosion
and deposition behaviour of the top “fluff layer” and of the deeper sediment. They have
showed that multi-class models, using two critical shear stresses for erosion and deposition
dependent on sediment characteristics, have a better fit to observed data.
1.2.2 Erosion
Sediment erosion is an important component of sediment dynamics. It produces a
source of sediment to the water column, but also nutrients, organic matter and contaminants.
From the theoretical point of view, the mechanical processes of sediment erosion are well
described. A review of the calculation methods to estimate erosion rates was performed by
Mehta et al. (1982). The formulations for erosion rates (ER, kg m-2 s-1) are based on the
concept of critical bed shear stress. Erosion happens when τb > τe , which means that erosion
occurs as long as the applied bed shear stress (τb, Pa) is larger than the critical bed shear
stress for erosion (τe, Pa). ER is then described as:
n
eb zzMER ))()(( ττ −= [3]
where M(z) is an empirical erosion coefficient with its dimension depending on an exponent
n, τe(z) is the critical bed shear stress for erosion that may vary with z.
Sanford and Maa (2001) revised the mathematical formulation for erosion and
proposed a suitable assumption that neglected M and τe while setting n = 1, and derived the
previous formulation [2] to:
)()()( 0
0
tt
ebd ezER−−−= γβττβρ [4]
where ρd(z) is dry bulk density at sediment depth z, β is a local parameter, τe0 is critical bed
shear stress when τb is first applied at t = t0, t is time (h), and dzd e /τγ = is the vertical
gradient of the critical bed shear stress.
ER has been generally based on critical shear stress (Sanford and Maa, 2001; Wang,
2003; Lumborg, 2005). However, the determination of ER from in situ measurements is not
straightforward because both parameters M and τe and a variety of physical, chemical and

PART I – GENERAL INTRODUCTION
8
biological factors influencing them, are an unknown function of sediment depth (Aberle et
al., 2004).
There are known linear relationships between ER and sediment characteristics such as
dry bulk density, water content, mud/sand content, organic content, colloidal carbohydrate
(Houwing, 1999, 2000; Friend et al., 2003; Aberle et al., 2004). Friend et al. (2003) verified
that the use of Chlorophyll a sediment content as a proxy for τe is related to seasonal
variability for intertidal silty sand sediments of the Ria Formosa. This relationship would
only be suitably used for late summer/early autumn.
In 2004 Winterwerp and Van Kesteren proposed a formulation for ER that would
incorporate some mechanical sediment characteristics:
debEMER ρττ )( −= [5]
and
SSd
cM
sv
E
50
0
10
,φ= [6]
ME (m/Pa-1s) is an erosion parameter, cv (m2 s-1) is the consolidation coefficient in vertical
direction, φs,0 (-) is sediment concentration by volume at onset of swell (i.e. the in-situ volume
concentration), 10d50 (µm) median floc size, SS (Pa) undrained shear strength. cv (m2 s-1) is a
function of permeability and compressibility of the skeleton:
gm
pc
wv
vρ
1= [7]
where p is permeability (m s-1), mv (m2 N-1) is the compressibility, ρw (kg m-3) the water
density and g gravitational acceleration (m s-2).
Although some efforts have been taken to include properties of the sediment on the
description of erosion mechanisms, the relationships that are likely to influence the quantity
of eroded matter, are still poorly described. The proper formulation of ER would imply the
numerical descriptions of known physical (shear and critical velocities), chemical and
biological functions, involved in sediment biogeochemical properties.
Quite recently Tolhurst et al. (2009) provided an overview of the studies on cohesive
sediment erosion describing the response of settled mud beds to fluid stress which can be
tracked back to the mid-1950s. They have highlighted the works of three professors who have
dominated the stage: R. Krone, A. Mehta, and E. Partheniades. They also provide an overview

Chapter 1 – Introduction
9
of the knowledge gained from these and other works, approaching both advances and
shortcomings related to mud sampling and the use of benthic erosion devices.
1.2.3 Deposition
The deposition component of sediment dynamics has received attention from many
science fields: in geology, because of the depositional record; in geochemistry areas focusing
chemically less permanent deposits and interactions with previously deposited constituents
and in biology areas focusing settlement of larvae and food particles to benthic fauna.
Deposition is the gross flux of cohesive sediment flocs on the seabed and
sedimentation is the net increase in bed level (Winterwerp and van Kestereren, 2004). Thus,
the sedimentation rate is the deposition rate minus the erosion rate.
By definition, sediment is formed of granular material that can settle in water by
gravity. Settling velocity of an individual particle (Wd, m s-1) in still water corresponds to the
constant velocity at which particles settle through a static fluid when the resistance of the
fluid exactly equals the downward force of gravity acting on the particle. It is dependent on
particle density, shape, size, and surface texture, and on the density and viscosity of the fluid.
According to the Stokes Law, Wd can be estimated as
µ
ρρ
18
10 250dg
W ws
d
)( −= [8]
where ρs is the density of sediment particles (kg m-3), ρw is the density of water (kg m-3), g is
the gravitational field strength (m s-2), 10d50 is the floc size (m) and µ is the dynamic
molecular viscosity of water (kg m-1 s-1). Observations from previous studies show
relationships between Wd and salinity (van Leussen, 1999). A comparison between Wd
observed on natural sediments and a model prediction using Stokes law show that natural
sediments have Wd two orders of magnitude larger (McCool and Parsons, 2004). Techniques
to measure settling velocities of cohesive sediment aggregates were recently reviewed by
Mantovanelli and Ridd (2006). They briefly describe a wide variety of devices emphasizing
logistical and scientific implications of its use and measuring purposes.
The first particles to deposit are the largest (e.g. aggregates), most dense or closest to
the bottom. During deposition, flocs will have high probability of aggregation and collision
with other flocs with different Wd. The processes of flocculation (Winterwerp, 2002;
Winterwerp et al., 2006), aggregation (McAnally & Mehta, 2002), floc strength and breakage

PART I – GENERAL INTRODUCTION
10
(Jarvis et al., 2005) are a function of shear stress at steady state. Flocculation plays an
important role on the vertical transport of sediments towards the bed (Lick et al., 1992) and is
important to understand the partitioning between contaminants and the sediment, organic and
water phase (Ongley et al., 1992).
Recent approaches using numerical analysis have indicate correlations between the
median floc size and sediment concentration (Xu et al., 2008) and provided a new heuristic
formula for turbulence induced flocculation of cohesive sediments (Winterwerp at al., 2006).
The present descriptions of deposition in estuaries are mostly based on the
characteristics of the hydrodynamics and suspended matter. Realistic numerical simulations
of these phenomena’s are complex due to the variety of particle characteristics in time in the
water column and the definition of critical shears for deposition of different sediment classes.
In addition, there are biologic activities that may influence sediment deposition. For
example, the suspended sediment that is removed from the water column by the benthic
organisms is transformed and deposited as faeces, i.e. larger aggregates of suspended
material (Turner and Millward, 2002).
1.2.4 Consolidation
As mud flocs accumulate on the bed, the flocs that arrived first are squeezed by the
ones on the top and suffer a vertical pressure gradient. Pore water is driven out of the flocs
and out of the space between the flocs. This process is known as self-weighting consolidation
(Winterwerp and van Kestereren, 2004). In the consolidation phase, flocs are mainly
supported by particle interactions and are described by the Gibson equation, which is a
simple wave equation in vertical direction z, over time t:
( ) 0=∂
∂+
∂
∂ss
s
ztφν
φ [9]
where sφ is the volumetric solids concentration (kg m-3) and
sν is the settling velocity of the
mud flocs (m s-1) relative to a fixed reference plane. The consolidation of cohesive sediments
can be expressed as cv, the consolidation coefficient (see section 1.2.2, Equation [7]),
dependent on sediment permeability and compressibility.
In general, consolidation is approached as a mechanical sediment property based on
sediment composition and texture, sediment bulk density, porosity, water content
(Winterwerp and van Kestereren, 2004; Bartetzko and Kopf, 2007; Jacobs et al, 2007),

Chapter 1 – Introduction
11
usually assessed through measurement of the critical erosion threshold (Teisson et al, 1993;
Houwing, 1999) and shear strength (Watts et al., 2003). The relationships between some of
these parameters are not clear. The expected trend of increasing shear strength and decreasing
porosity with depth was only observed in 31% of drill sites from the entire suite of
expeditions from the OceanDrilling Program (Bartetzko and Kopf, 2007).
Although the activity of burrowed organisms is not usually taken into account in the
processes of consolidation, there are evidences of the effects of the crab Mictyris longicarpus
(Webb and Eyre, 2004) and the bivalve Yoldia limatula (Ingalls et al., 2000) on sediment
porosity and irrigation.
1.2.5 Sediment stability
Sediment stability is not by itself a component of what is understood to be the
dynamic cycle of estuarine sediments. The concept of sediment stability refers roughly to the
resistance of cohesive sediments to erosion. It should be understood as a general term, which
can be characterised in terms of the properties of the sediment: sediment shear strength,
critical erosion shear stress, porosity, grain size, and in terms of the response to shear
velocities: erosion rates, critical shear stress.
The effect of biological processes on sediment stability is important in the transport of
microbenthos, nutrients, organic matter and contaminants to the water column (Rasmussen et
al., 1998; Mazik and Elliot, 2000). In addition, benthic organisms are known to affect
sediment stability and other properties such as their effect on sediment strength and
erodability (Baillie and Welsh, 1980; Kornman and de Deckere, 1998; Widdows et al., 2000;
Blanchard et al., 2001).
The description of sediment stability and the interactions among the sediment
physical, geochemical and biological properties demands a multidisciplinary approach able
to recognize multi-side effects and couple interactions taking place at different scales. The
efforts taken to develop this subject are illustrated by the increasing precision of
measurement equipments and the use of flume devices (Jonsson et al., 2006), which allowed
small-scale observations of estuarine sediment dynamics processes. Because the description
of sediment stability gives more emphasis to sediment properties, which are much more
variable and complex to describe than the hydrodynamic conditions, it is not very popular
among the more theoretical scientists.

PART I – GENERAL INTRODUCTION
12
1.2.6 Contaminated sediments
Heavy metals bind to clay mineral particles follow the same transport and deposition
pattern than other particles, having a negligible transport towards the open sea (Sondi et al.,
2008). A recent study focusing on the distribution of contaminants in three shelf areas from
the Portuguese coast was published by Mil Homens et al. (2006). They observed that the
character of the contaminated sediments transported to these shelf areas is further influenced
by grain-size sorting as well as by dilution with other marine sediments.
The effect of floods is an important issue because it is a source of material derived
from the runoff of the basin soils, increasing suspended sediments, nutrients and pollutants.
Zonta et al. (2005) highlighted the effect of floods on the transport of suspended sediments
and contaminants in the estuary of the Dese River (Venice Lagoon). They concluded that the
transport of most of the analysed heavy metals was driven by the suspended particulate matter
concentration.
There are some studies focusing the effect that macrofauna have on contaminant
distribution in the sediments and their input to the water column (Rasmussen et al., 1998;
Ciarelli et al., 2000; Delmotte et al., 2007; French and Turner, 2008), but the effect of
contaminated sediments on the bioturbation activity of macrofauna was never investigated.
In terms of sediment dynamics, contaminated sediments are normally approached as
an object (to be transported, deposited or resuspended), and not as an influencing factor on
sediments dynamics. In order to predict the response of mudflats to environmental and
anthropogenic pressures, a greater understanding on the multidisciplinary processes that
affects sediment dynamics with associated contaminants is needed. So far, the effect of
contaminate sediments on sediment stability has not been investigate.
1.3 Biologic interactions with sediment dynamics
A wide diversity of organisms, from bacteria to benthic invertebrates and marsh
plants that inhabit the sediment bottom performs a variety of activities that influence
sediment physical structure, biogeochemical properties, and species distribution (Hewitt et
al., 2006; Rabaut et al., 2007).
Considering the effect that some species have on their habitat, a new concept of
ecosystem engineering emerged in 1994 (Jones et al, 1994): ecosystem engineers, directly or
indirectly modulate the availability of resources (other than themselves) to other species, by
causing physical state changes in biotic and abiotic materials. In so doing they modify,

Chapter 1 – Introduction
13
maintain and/or create habitats. The distinction between “ecosystem engineers” and “key-
stone species”, one whose effect is large and disproportionately large relative to its biomass
and abundance (Power et al., 1996) has been widely discussed (Jones et al., 1997; Crain and
Bertness, 2006; Wright & Jones 2006 and references within).
The concept of estuarine ecosystem engineers is more applied to plants due to their
importance on the processes of fine particles retention and in the promotion of refuge for
other macrofauna species influencing the habitat and the distribution of the surrounding
community (Brusati and Grosholz, 2006; Hewitt et al., 2006; Neira et al., 2007; Rabaut et al.,
2007).
The benthic communities influence sediment dynamics by affecting some
components of the ETDC cycle and sediment stability. They are characterized according to
size; micro (< 32 µm), meso (>32 µm and < 1 mm) and macrobenthos (> 1 mm) and
according to location; hyperbenthos (organisms living above the sediments), epibenthos
(living on top of the sediment) and endobenthos (living inside the sediment). They change
sediment characteristics and stability, influencing biogeochemistry, bottom topography and
velocities near the bed, sediment deposition and in the case of suspension feeders, constitute
an additional removal of suspended particles. Although this is a known fact, the
quantification of these influences is not properly addressed.
1.3.1 Sediment stabilisers and destabilisers
At the sediment surface, the microphytobenthos produce and live in a biofilm that is
known to increase sediment stability. The microphytobenthic community dominated by
diatoms (Underwood and Smith, 1998, de Brouwer et al., 2002), have a stabilising effect that
derives from the production of extracellular polymeric substances, EPS (Paterson, 1989;
Yallop et al., 1994; Miller et al., 1996; de Brouwer et al. 2003), resulting in increased
sediment adhesion, higher resistance to resuspension by tidal action (de Jonge and Van den
Bergs, 1987; Johnson and Azetsu-Scott, 1995; Blanchard et al., 1997; Austen et al., 1999;
Shimeta et al., 2002) and raised erosion thresholds (Self et al., 1989; Tolhurst et al., 1999;
Watts et al., 2003). Using a cross-shore morphodynamic model of an intertidal mudflat in
which the equilibrium profile of the intertidal flat under tide and wave forcing is simulated,
Le Hir et al. (2007) suggested that local stabilisation by the microphytobenthos does not have
a significant long-term effect. These conclusions are dependent, of course, on the forcing

PART I – GENERAL INTRODUCTION
14
functions description and the question of whether the simplification of the description of
certain parameters influenced the results remains.
The biofilm is confined to the sediment surface layer, and once it is eroded, the
sediment resistance is governed by processes occurring below the surface such as the
characteristics of deeper sediment layers and the activity of the macrofauna.
Different species of the macrofauna affect sediment stability differently (see Graf and
Rosenberg, 1997). Some burrowing species such as crabs, gastropods, polychaetes and
amphipods are known to change the properties of the sediment an their stability (Jones and
Jago, 1993; Botto and Iribarne, 2000; Volkenborn et al, 2007), affecting sediment shear
strength (Meadows and Tait, 1989; Meadows and Hariri, 1991; Widdows et al., 1998) whilst
others affect sediment erosion (Davies, 1993; Davey and Partridge, 1998; Rowden et al.,
1998; Widdows et al., 1998, 2000; Andersen et al., 2005; Orvain et al., 2006). Le Hir et al.
(2007) provide a literature review of bioturbation by deposit feeders in stabilizing and
destabilising cases. A recent study at the North Sea (Borsje et al., 2008) suggests the
stabilizing organisms are mainly responsible for the seasonal variation in suspended sediment
concentrations, while the destabilizing organisms are mainly responsible for the spatial
variation in fine sediment on the bed.
There are few studies concerning the interaction of contaminants and the effects of
macrofauna on sediment dynamics (Mazik and Elliot, 2000), but in the cases where toxicity
is known to reduce performance, bioturbation activity is certainly affected.
1.3.2 Topography
Bottom topography has an important effect on near bed velocities and on the structure
of the BBL. The shear stresses at the bottom (see section 1.2.1) are a manifestation of the
drag form. Therefore, it is important to define the drag force felt by the mean flow where the
bed forms acts as a roughness element. It is also of interest for predictions of sediment
transport to determine what is the portion of the total drag that is form drag and what portion
is viscous drag, because only the viscous drag gives origin to movement. Large-scale sea bed
topography is well known, but a more detailed description of microtopography for small-
scale approaches is presently needed.
The effect of bed forms can only be parameterized in numerical models via the drag
coefficient (directly related to τ), which most of the cases is calculate through empirical
methods. Some studies quantified the effect of topographic roughness on hydrodynamic

Chapter 1 – Introduction
15
parameters, concerning different shapes and densities of roughness elements (Wooding et al.,
1973) or beds with different median grain sizes and patches (Lawless and Robert, 2001;
Thompson et al., 2004) and hydrodynamic parameters (Camenen et al., 2009). There is a
recent review by Camenen et al. (2009) reviewing and comparing the different existing
predictive formulas to estimate bed roughness where a new relationship based in the common
knowledge is proposed. In this study, the commonly used relationship involving the grain
size and Shields parameter appeared to be insufficient to characterize roughness height.
Although there is an attempt to include natural phenomena in hydrodynamic models, such as
movable bed roughness (Zhang et al., 2004), present hydrodynamic models are inaccurate in
simulating flow over biogenic structures.
Measurements over natural beds are still few, and most of the present hydrodynamic
models are not sufficiently calibrated for certain local parameters such as multi-scale
physical roughness, interaction with animal generated flow or with flexile structures. All of
these will have an impact on boundary layer properties, such as shear velocity, and ultimately
on particle dynamics in the near-bed layer.
In many boundary layers over biogenic structures the relationship between
topographical roughness (roughness height) and hydrodynamic roughness (the one estimated
from velocity profiles characteristics) is still ill defined (see Chapter 3).
Some studies focused on the effect of epibenthic bivalves on the BBL, either by
changes in topography or by increasing turbulence through their continuous filter pumping
activity. The patches of organisms protruding from the sediment surface, thus changing
surface roughness, produce regions of lower mean longitudinal velocities and more
turbulence, as it was observed for the mussels Atrina zelandica (Miller et al., 2002; Nikora et
al., 2002) and Mytilus edulis (Butman et al., 1994, van Duren et al., 2006). Beyond a certain
critical density, the shells within these patches produce a skimming flow with a
corresponding decrease in the drag coefficient and an uplift of the boundary layer surface
(Green et al., 1998). The effect of epibentic organisms in microtopography has never been
approached.
1.3.3 Filtration activity
The filtration activity of bivalves, measured as clearance rates (Coughlan, 1969) has a
known impact on phytoplankton (Kamermans, 1993). Filter-feeders can promote a direct
transport of suspended particles from the water column to the sediment, which is also an

PART I – GENERAL INTRODUCTION
16
important process in sediment dynamics. Suspended particles are removed from the water
column, by filtration activity, at velocities much higher than the velocities to allow
mechanical deposition. The effect of bivalves’ filtration activity on sediment removal is not
dissociated from the production of faeces, which are generally thrown back to the
environment in a different form and composition than the earlier loose suspended form.
Many authors have observed that the feeding physiology of bivalves such as the
cockle Cerastoderma edule is affected by the quantity and quality of suspended matter
(Navarro and Widdows, 1997, Iglesias et al., 1996; Hawkins et al., 1998; Ibarrola et al.,
2000; Velasco and Navarro, 2005). Other works focused on the effect of increasing currents
on clearance rates of bivalves (Wildish and Miyares, 1990; Ackerman, 1999; Sobral and
Widdows, 2000; Newell et al. 2001; Widdows et al., 2002), showing that clearance rates
have an unimodal response to current velocity.
While current velocity influences clearance rates of bivalves, the inverse is also true:
the presence of bivalves influences local hydrodynamics. This has been shown in particular
for epibenthic species like the blue mussel Mytilus edulis (Butman et al., 1994; van Duren et
al., 2006) and the horse mussels Atrina zelandica (Green et al., 1998; Nikora et al., 2002).
The presence of bivalves generally causes flow reduction and increased turbulence. The
increase in turbulence is often related to increased bed roughness, produced by the shells
protruding in the BBL, and a consequence of the interaction of the exhalent jets with the
overlying flow (Monismith et al., 1990; O’Riordan et al., 1995). The effect of endobenthic
bivalves (with a relatively low impact on the surface roughness) on the BBL has recently
been studied by Ciutat et al. (2007) but the effect of clearance activity on near bed current
velocities has never been approached.
1.3.4 Sediment reworking
Biological activities, such as food foraging and gallery/burrow building, increase the
transport of solutes and influence the biogeochemical processes in cohesive sediments
(François et al., 1997; Hansen and Kristensen, 1998), a process known by bio-irrigation
(Aller, 2001) and strongly enhance the transport of particles, a process known as bioturbation
in the sediment in depth. These activities can also change geotechnical properties, such as
grain size distribution (Giangrande et al., 2002) and influence microbial activity (Aller and
Aller, 1998; Goñi-Urriza et al., 1999; Mulsow et al., 2002; Ferro et al., 2003), creating a
patchy mosaic of anoxic microhabitats (Fenchel, 1996; Kristensen, 2000), and hence, will

Chapter 1 – Introduction
17
alter the diagenetic conditions within the sediment (Aller and Aller, 1998; Forster et al.,
1999; Mortimer et al., 1999; Nielsen et al., 2004). Overall, macrofauna bioturbation and bio-
irrigation have the potential to strongly influence the production, mobilisation and
accumulation of certain contaminants (Rasmussen et al., 1998; Hammerschmidt and
Fitzgerald, 2004).
In 1997, François and colleagues proposed a new approach for modelling sediment
reworking with four functional groups:
1) Biodiffusers, organisms whose activities result in a constant diffusive transport of
sediments in the bioturbated zone, from the interface to the maximum depth of
reworking, e.g.: the clam Ruditapes decussatus, C. edule, amphipods;
2) Upward conveyors, head-down vertically oriented species which ingest material
in depth and expel it at the sediment water interface, promoting an “active”
transport of the sediment through the gut, ex: Arenicola marina;
3) Downward conveyors, head-up vertically orientated species causing an active
transport of sediment through their gut from the sediment water interface to their
egestion depth, ex: sipunculids and annelis;
4) Regenerator, digging organisms which transfer sediment from depth to the surface
where it is washed away and replaced by other sediment. This behaviour has two
effects. One effect is the biodiffusional mixing with a high output of sediment to
the water column during digging, and the other effect is a net movement of the
surficial sediment to the bottom of the burrow after it has been deserted, ex:
fiddler crabs.
Bioturbation activity is characterised by both an intensity coefficient (Db, the
biodiffusion coefficient) and a depth over which it occurs (mixing depth). It is commonly
described using the classical one-dimensional biodiffusion model (Boudreau, 1986),
which is governed by:
02
2
=−∂
∂C
z
CDb λ [10]
where C is the concentration of tracers and λ is a rate (decay) constant (time-1).
In the past, experimental bioturbation studies have focused on community
bioturbation in relation to differences in feeding types (Gerino et al., 1995, 1999; Flach et al.,
1998; Turnewitsch et al., 2000; Green et al., 2002), scaling of bioturbation to the size of the
organisms (Swift et al., 1996) and the presence of burrows (Dellapenna et al., 1998). Other

PART I – GENERAL INTRODUCTION
18
studies have followed a more theoretical approach, relating Db to biological parameters in
simplified models of biological activity (Wheatcroft et al., 1990; François et al., 2002;
Meysman et al., 2003; Mugnai et al., 2003; Solan et al., 2004).
Yet, with regard to the interaction between bioturbation and contaminants, our
knowledge remains sparse. Some studies have measured the effect of particular organisms
(Gilbert et al., 1996, 2003; Kure et al., 1997; Petersen et al., 1998; Rasmussen et al., 1998) or
natural communities (Swift et al., 1996) on the distribution of contaminants in the sediment
in depth or concerning their transport to the water column, but only few take into account the
effect of contaminants on the mixing activity of the biota (Mulsow et al., 2002).
1.4 Species studied
1.4.1 The cockle Cerastoderma edule
The cockle Cerastoderma edule (Fig. 1.3) is an endofaunal bivalve, widely
distributed on European coasts, showing high tolerance to substrate type, salinity,
temperature and current velocities (Boyden and Russel, 1972; Ysebaert et al. 2002). It occurs
in densities up to 1750 ind m-2 (Ysebaert and Herman, 2002).
According to Ysebaert et al. (2002), C. edule occurs in environments with flow
velocities of up to 80 cm s-1, having a maximum probability of 0.35 to occur at flow
velocities around 35 cm s-1. Kamermans (1993) and Lenihan et al. (1996) found that cockles
show increased growth with increasing flow velocities (0 – 7 cm s-1) under laboratory and
more clearly under field situations.
C. edule is a suspension feeder that feeds on phytoplankton and resuspended
microphytobenthos (Sauriau and Kang, 2000; Rossi et al., 2004), and in the process changes
the gradient and composition of suspended matter passing over the cockle beds (Smaal and
Haas, 1997). The ecophysiology of C. edule is relatively well understood regarding the
clearance rates, food absorption efficiency and faeces production, according to the quantity
aaan quality of suspended matter (Iglesias et al., 1996; Navarro and Widdows, 1997; Ibarrola
et al., 2000; Rueda et al., 2005; Widdows and Navarro, 2007).
The effect of C.edule on sediment dynamics has been studied recently. The effect of
C. edule on biodeposit production is an important issue in what concerns sediment
deposition. The cockle actively transports and transforms particles present in the water
column, producing faeces that are deposited at the surface.

Chapter 1 – Introduction
19
Figure 1.3 – The cockle Cerastoderma edule
Widdows and Navarro (2007) focused on the erosion threshold of pseudofaeces and
faecal pellets. Loose mucus bound pseudofaeces have a lower erosion threshold of 15 cm s−1
compared to 25 cm s−1 for faecal pellets. Recent studies showed that the presence of C. edule
is related to lower near bed currents and that the increasing density of C. edule (up to 312 ind
m-2) is related to increased erosion rates of sediments from the Tamar estuary Ciutat et al.
(2007). The reduction effect of cockles in the BBL is certainly related to inhalant current
produced during feeding. Troost et al. (2009), using particle image velocimetry and model
calculations, estimated that the average jet speed of C. edule was 20.8 cm s-1.
Cockles on their own are not a roughness element, as they are buried in the sediment
with the siphons opening levelled with the sediment surface. The roughness they produce is a
result of their adjustment to the sediment surface and increasing near bed current velocities.
Burrowing behaviour is commonly affected by parasitism and bacterial load (Blanchet et al.,
2003). The entrainment drag coefficient (CD) of cockles varied from 0.43 to 0.56 (estimated
using particle image velocimetry) and the fall velocity and settling drag coefficient were
constant and estimated to be of 0.36 m s-1 and 1.08, respectively (Peña et al., 2008). The
description of the effect of C. edule on the sediment topography was never performed and the
explanation of how C. edule affects the near-bed currents is still not clear (see Chapter 2).

PART I – GENERAL INTRODUCTION
20
1.4.2 The ragworm Nereis diversicolor
The ragworm Nereis diversicolor (Fig. 1.4), an endobenthic species, is widespread in
brackish water environments throughout north and south-western Europe, showing a high
tolerance to temperature, salinity and occurring in sand or mud habitats. Typical densities are
in the range of 1000-2000 ind m-2 for adult populations, but can reach up to 16000 ind m-2 for
juvenile populations in spring (Davey, 1994; Fidalgo e Costa et al., 1998). In Portugal
densities range from 430 to 16000 ind m-2 (Fidalgo e Costa et al., 1998; Abrantes et al.,
1999).
N. diversicolor builds and lives in mucus-lined galleries with considerable structural
complexity (Meadows and Meadows, 1991), which provides refuge from predators. The
gallery walls are covered by mucus secreted from epidermis glands covering the entire
surface of the body. These secretions are rubbed and pushed against the walls of the burrow
to consolidate the walls (Meadows and Tait, 1989; Meadows et al., 1990). Complex gallery
networks can extend down to 30 cm depth, and are related to body length, although
organisms > 10 cm long can be found in the upper 2 to 3 cm of the sediment (Anderson and
Meadows, 1978; Esselink and Zwarts, 1989).
Davey and Partridge (1998) observed that only 20% of the population was found
below 8 cm depth. Galleries are known to increase sediment permeability, de-watering, and
provide conduits for overburden-driven drainage, thereby stepping up sediment consolidation
(Meadows and Tait, 1989; Murray et al., 2002). All these activities result in increased
sediment shear strength (Meadows and Tait, 1989; Meadows and Hariri, 1991).
N. diversicolor is an opportunistic species that uses different feeding modes such as
filter and deposit feeding, scavenging and predation on other macrofauna (Esselink and
Zwarts, 1989 and references within; Vedel et al., 1994). It is known to be resistant to high
levels of pollution and is a suitable bioindicator for toxicity (Bryan and Hummerstone, 1971;
Ozoh, 1994; Bernds et al., 1998).

Chapter 1 – Introduction
21
Figure 1.4 – The ragworm Nereis diversicolor
Some pioneer studies on this species have concentrated upon the bioturbation effect
of burrowing activity (Trevor, 1977; Davey, 1994) and on sediment reworking (Gerino,
1991; François et al., 2002). François et al., (2002) classified N. diversicolor as being a
“gallery-diffusor” in terms of sediment mixing, distinct from “biodiffusors” and “downward
conveyers”. Gallery diffusors display a combination of bio-advective (fast unidirectional
downward transport) and bio-diffusive mechanisms (bi-directional mixing) (François et al.,
2002). The bioturbation activity of N. diversicolor is greatly enhanced by food supply
(Nogaro et al., 2008).
There is some controversy about the stabilising effect that N. diversicolor has on
sediments. Some early works considered this species as a stabiliser, judging from its
influence on the shear strength properties of the sediment (Meadows and Tait, 1989;
Meadows et al., 1990). On the other hand, this species has a destabilising effect due to its
negative influence on the colonisation of the sediments by benthic diatoms (Underwood and
Paterson, 1993; Engelsen and Pihl, 2008). Although some literature (Eckman et al., 1981;
Davey, 1994) refers to the direct effect of macrofauna density on bioturbation, the
quantification of this activity is required, and the relative importance of this species on
sediment stability needs to be assessed.

PART I – GENERAL INTRODUCTION
22
1. 5 General objectives and structure of the thesis
The main objective of this work is to contribute to the knowledge of the biological
benthic interactions with estuarine sediment dynamics, using a small-scale study approach.
The work presented in this thesis focuses on the behaviour and interactions of two estuarine
species, from different functional groups, with sediment dynamics. The effect of the cockle C.
edule on transport and removal of suspended matter from the water column and the effect of
the ragworm N. diversicolor on sediment erodability, consolidation and remixing, is
investigated taking into account density dependent effects. Each species affects sediment
dynamics distinctively by acting on different components of the ETDC cycle. This thesis
furthermore assesses the interactive effect of copper (Cu) contaminated sediments on the
behaviour of N. diversicolor and the combined effect of bioturbation and copper on sediment
stability.
This thesis is divided in 6 sections that include chapters corresponding to articles
published, in publication or submitted.
PART I – General introduction
A general introduction on sediment dynamics, hydrodynamic processes and biological
activity and their interactions is given.
PART II – Interaction between Cerastoderma edule and sediment dynamics:
hydrodynamics in the benthic boundary layer
Chapter 2 – Fernandes, S., Sobral, P., van Duren L.A. 2007. Clearance rates of
Cerastoderma edule under increasing current velocity, measured in two different flumes:
estimation methods and interrelation with hydrodynamics. Continental Shelf Research 27,
1104-1115
Chapter 3 - Fernandes, S., van Duren, L.A., van der Wal, D., Orvain, F., Herman, P.M.J. How
cockles change the benthic boundary layer: density effects on topography and turbulence. In
preparation.

Chapter 1 – Introduction
23
Chapter 2 deals with methodological issues (flume design) related to bio-fluid
dynamic research and aims to address the environmental interaction between local
hydrodynamic regime and cockle feeding behaviour. The effects cockles have on fluid
dynamics may be the result of topographical differences and of interaction of the feeding
currents with the flow. A subsequent study attempted to separate these two processes. These
results are included in Chapter 3. The objective of this study is to assess the effects of
filtration activity of C. edule on the microtopography and on the BBL by comparing the
effects of artificial (with no filtration activity) and natural (with organisms actively filtering)
beds while accessing the influence of density. This study was performed using two densities
of organisms and the effect due to the organisms was assessed by quantification of the
additional effect of animal pumping activity on the bottom turbulence, by comparing
treatments with and without animals, where microtopography is identical.
PART III – Interaction between Nereis diversicolor and sediment dynamics: sediment
biogeochemical properties and erodability
Chapter 4 – Fernandes, S., Sobral, P., Costa, M.H. 2006. Nereis diversicolor effect on the
stability of cohesive intertidal sediments. Aquatic Ecology 40: 567 – 579
Chapter 5 – Measuring bioturbation of Nereis diversicolor with luminophores: experimental
and modeling artifacts.
The ragworm N. diversicolor inhabits a network of galleries and feeds at the sediment
surface. With the aim to characterise the effect of bioturbation by N. diversicolor on sediment
dynamics, erodability (erosion rates, critical velocity) and sediment shear strength were
measured. The effect of organism density on sediment dynamics was also analysed. This
study is described in Chapter 4.
Other objective of this work is to characterise and quantify the bioturbation activity of
N. diversicolor in terms of biodiffusion coefficients (Db), while focusing on the
methodological procedures and evaluating the effect of sampling time with two different
methods detailed in Chapter 5. Two different biodiffusion modelling procedures were used,

PART I – GENERAL INTRODUCTION
24
in order to examine if and how artifacts are created by applying an exclusive bio-diffusive
model to bioturbation, which is characterized by a mixture of diffusive and advective aspects.
PART IV – Interaction between contaminated sediments and biological activity: Nereis
diversicolor case study
Chapter 6 - Fernandes, S., Alcântara, F., Sobral, P. 2009. The effect of Nereis diversicolor
on shear strength and erodability of cohesive sediments: the influence of copper
contamination. Estuarine Costal and Shelf Research (in press).
Chapter 7 – Fernandes, S., Meysman, F.J.R., Sobral, P. 2006. The influence of Cu
Contamination on Nereis diversicolor bioturbation. Marine Chemistry 102, 148-158
The transport and deposition of contaminated sediments is an emergent issue with
impacts on ecosystem quality. One objective of this work is to quantify the effect of copper
(Cu) contaminated sediments on the activity of N. diversicolor. This was analysed in terms of
sediment stability, by determination of erosion rates and sediment shear strength. These
results are in detailed in Chapter 6. The effect of Cu on the bioturbation activity of N.
diversicolor was also assessed in terms of Db (Chapter 7). In this study, the effect of Cu
contamination on the sediment mixing activity of N. diversicolor was evaluated using two
different biodiffusion modelling procedures.
PART V – General conclusions
In this section, the major conclusions of each section are summarised and discussed in a more
general context of faunal effects on sediment dynamics. Some considerations are drawn
regarding the present status of estuarine sediment dynamics research and practical
applications.
PART VI – References
This section compiles the references from all chapters.

Chapter 1 – Introduction
25
1.6 References
Aberle, J., Nikora, V., Walters, R., 2004. Effects of bed material properties on cohesive
sediment erosion. Marine Geology. 207, 83-93 Abrantes, A., Pinto, F., Moreira, M.H., 1999. Ecology of the polychaete Nereis diversicolor in
the Canal de Mira (Ria de Aveiro, Portugal): Population dynamics, production and oogenic cycle. Acta Oecologica. 20 (4): 267-283
Ackerman, J.D., 1999. Effect of velocity on the filter feeding of dreissenid mussels (Dreissena polymorpha and Dreissena bugensis): implications for trophic dynamics. Canadian Journal of Fisheries and Aquatic. Science 56, 1551-1561
Aller, R.C., 2001. Transport and reactions in the bioirrigated zone, in The Benthic Boundary
Layer, edited by BP Boudreau and BB Jorgensen, pp. 269-301, Oxford University Press, Oxford.
Aller, R.C., Aller, J.Y., 1998. The effect of biogenic irrigation intensity and solute exchange on diagenic reaction rates in marine sediments. Journal of Marine Research. 56, 905-936
Anderson, J.G., Meadows, P.S., 1978. Microenvironments in marine sediments. Proceedings of the Royal Society of Edinburgh 76B, 1-16
Andersen, T.J., Lund-Hansen, L.C., Pejrup, M., Jensen, K.T., Mouritsen, K.N., 2005. Biologically induced differences in erodibility and aggregation of subtidal and intertidal sediments: a possible cause for seasonal changes in sediment deposition. Journal of Marine Systems 55, 123-138
Austen, I., Andersen, T.J., Edelvang. K., 1999. The influence of benthic diatoms and invertebrates on the erodability of an intertidal mudflat, the Danish Wadden sea. Estuarine, Coastal and Shelf Science 49, 99-111
Azevedo, I.C., Duarte, P.M., Bordalo, A.A., 2008. Understanding spatial and temporal dynamics of key environmental characteristics in a mesotidal Atlantic estuary (Douro, NW Portugal). Estuarine, Coastal and Shelf Science 76, 620-633
Baillie, P.W., Welsh, B., 1980. The effect of tidal resuspension on the distribution of intertidal epipelic algae in an estuary. Estuarine, Coastal and Shelf Science 10, 165-180
Bartetzko, A., Kopf, A.J., 2007. The relationship of undrained shear strength and porosity with depth in shallow (<50 m) marine sediments. Sedimentary Geology 196, 235-249
Berlamont, J., Ockende, M., Toorman, E., Winterwerp, J., 1993. The characterisation of cohesive sediment properties. Costal Engineering 21, 105-128
Bernds, D., Wübben, D., Zauke, G.P., 1998. Bioaccumulation of trace metals in polychaetes from German Wadden Sea: evaluation and verification of toxicokinetic models. Chemosphere 37 (13), 2573-2587
Blanchard, G.F., Guarini, J.M., Orvain, F., and Sauriau, P.-G., 2001. Dynamic behaviour of benthic microalgal biomass in intertidal mudflats. Journal of Experimental Marine Biology and Ecology 264, 85-100
Blanchard, G.F., Sauriau, P.-G., Cariou-Le Gall, V., Gouleau, D., Garet, M.-J., Olivier, F., 1997. Kinetics of tidal resuspension of microbiota: Testing the effects of sediment cohesiveness and bioturbation using flume experiments. Marine Ecology Progress Series 151, 17-25
Blanchet, H., Raymond, N., de Montaudouin, X., Capdepuy, M., Bachelet, G., 2003. Effects of digenean trematodes and heterotrophic bacteria on mortality and burying capability of the common cockle Cerastoderma edule (L.). Journal of Experimental Marine Biology and Ecology 293, 89-105

PART I – GENERAL INTRODUCTION
26
Borsje, B.W., de Vries, M.B., Hulscher, S.J.M.H., de Bóer G.J., 2008. Modeling large-scale cohesive sediment transport affected by small-scale biological activity. Estuarine, Coastal and Shelf Science 78, 468-480
Botto, F., Iribarne, O., 2000. Contrasting effects of two burrowing crabs (Chasmagnathus
granulata and Uca uruguayensis) on sediment composition and transport in estuarine environments. Estuarine, Coastal and Shelf Science 51, 141-151
Boudreau, B.P., 1986. Mathematics of tracer mixing in sediments. II: Non-local mixing and biological conveyor belt phenomena. Am. J. Sci. 286, 199-238
Boyden, C.R., Russel, P.J.C., 1972. The distribution and habitat range of the brackish water cockle (Cardium (Cerastoderma) glaucum) in the British Isles. The Journal of Animal Ecology 41, 719-734
Brenon, I., Le Hir, P., 1999. Modelling the turbidity maximum in the Seine estuary (France): identification of formation processes. Estuarine, Coastal and Shelf Science 49, 525-544
Brusati, E.D., Grosholz, E.D., 2006. Native and introduced ecosystem engineers produce contrasting effects on estuarine infaunal communities. Biological Invasions 8, 683-695
Bryan, G.W., Hummerstone, L.G., 1971. Adaptation of the polychaete Nereis diversicolor to estuarine sediments containing high concentrations of heavy metals.1- general observations and adaptation to copper. Journal of the Marine Association of the UK 51, 845-863
Butman, C.A., Fréchette, M., Geyer, W.R., Starczak, V.R., 1994. Flume experiments on food supply to the blue mussel Mytilus edulis L. as a function of boundary-layer flow. Limnology and Oceanography. 39, 1755-1768
Camenen, B., Larson, M., Bayram, A., 2009. Equivalent roughness height for plane bed under oscillatory flow. Estuarine, Coastal and Shelf Science 81, 409-422
Cancino, L., Neves, R., 1999. Hydrodynamic and sediment suspension modelling in estuarine systems. Part I: descriptions of the numerical models. Journal of Marine Systems 22, 105-116
Cappucci, S., Amos, CL., Hosoe, T., Umgiesser, G.. 2004. SLIM: a numerical model to evaluate the factors controlling the evolution of intertidal mudflats in Venice Lagoon, Italy. Journal of Marine Systems. 51 (1-4), 257-280
Chen, C.-C., Petersen, J.E., Kemp, W.M., 2000. Nutrient-uptake in experimental estuarine ecosystems: scaling and partitioning rates. Marine Ecology Progress Series. 200, 103-116
Ciarelli, S., Kater, B.J., van Straalen, N.M., 2000. Influence of bioturbation by the amphipod Corophium volutator on fluoranthene uptake in the marine polychaete Nereis virens. Environmental Toxicology and Chemistry 19, 1575-1581
Ciutat, A., Widdows, J., Pope, N.D., 2007. Effect of Cerastoderma edule density on near-bed hydrodynamics and stability of cohesive muddy sediments. Journal of Experimental Marine Biology and Ecology 346, 114-126
Correl, D.L., Jordan, T.E., Weller, D.E., 1992. Nutrient flux in a landscape: effects of coastal land use and terrestrial community mosaic on nutrient transport to coastal waters. Estuaries. 15, 431-442
Coughlan, J., 1969. The estimation of filtering rate from the clearance of suspensions. Marine Biology. 2, 356-358
Crain, C.M., Bertness, M.D., 2006. Ecosystem engineering across environmental gradients: implications for conservation and management. Bioscience 56 (3), 211-218
Cugier, P., Le Hir, P., 2000. Three dimensional modelling of suspended matters in the eastern "baie de Seine" (English Channel, France). Comptes Rendus de L’Academie des Sciencesde Paris, Sciences De La Terre et des Planetes 331 (4), 287-294

Chapter 1 – Introduction
27
Davey, J.T., Partridge, V.A., 1998. The macrofaunal communities of the Skeffling muds (Humber estuary), with special reference to bioturbation. In: Black KS, DM Paterson, A Cramp (Eds.) Sedimentary processes in the intertidal zone. Special publications, Vol.139, pp. 115-124 Geological Society, London
Davey, J.T., 1994. The architecture of the burrow of Nereis diversicolor and its quantification in relation to sediment-water exchange. Journal of Experimental Marine Biology and Ecology. 179, 115-129
Davies, W.R., 1993. The role of bioturbation in sediment resuspension and its interaction with physical shearing. Journal of Experimental Marine Biology and Ecology 171, 187-2000
de Brouwer, J.F.C., de Deckere, E.M.G.T., Stal, L.J., 2003. Distribution of extracellular carbohydrates in three intertidal mudflats in western Europe. Estuarine, Coastal and Shelf Science 56, 313-324
de Brouwer, J.F.C., Ruddy, G.K., Jones, T.E.R., Stal, L.J., 2002. Sorption of EPS to sediment particles and the effect on the rheology of sediments slurries. Biogeochemistry 61, 57-71
de Jonge, V.N., van der Bergs, J., 1987. Experiments on the resuspension of estuarine sediments containing benthic diatoms. Estuarine, Coastal and Shelf Science 24, 725-740
Dellapenna, T.M., Kuehl, S.A., Schaffner, L.C., 1998. Sea-bed mixing and particle residence times in biologically and physically dominated estuarine systems: a comparison of lower Chesapeake bay and the York River subestuary. Estuarine, Coastal and Shelf Science 46, 777-795
Delmotte, S., Meysman, F.J.R., Ciutat, A., Boudou, A., Sauvage, S., Gerino, M., 2007. Cadmium transport in sediments by tubificid bioturbation: An assessment of model complexity. Geochimica et Cosmochimica 71, 844-862
Dias, J.M., Lopes, J.F., 2006. Implementation and assessment of hydrodynamic, salt and heat transport models: The case of Ria de Aveiro Lagoon (Portugal). Environmental Modelling & Softaware 21, 1-15
Douvere, F., Ehler, C.N., 2009. New perspectives on sea use management: Initial findings from European experience with marine spatial planning. Journal of Environmental Management 90, 77–88
Dyer, K.R., Christie, M.C., Manning, A.J., 2004. The effects of suspended sediment on turbulence within an estuarine turbidity maximum. Estuarine, Coastal and Shelf Science 59, 237-248
Dyer, K.R., Christie, M.C., Wright, E.W., 2000. The classification of intertidal mudflats. Continental Shelf Research 20, 1039-1060
Dyer, K.R., 1998. The topology of intertidal mudflats. In Black, K. S., Paterson, D. M. and Cramp, A. (eds) Sedimentary processes in the intertidal zone. Geological Society, London, Special Publications 139, 11-24
Eckman, J.E., Nowell, A.R.M. and Jumars, P.A., 1981. Sediment destabilisation by animal tubes. Journal of Marine Research39, 361-374
El Ganaoui, O., Schaaff, E., Boyer, P., Amielh, M., Anselmet, F., Grenz, C., 2004. The deposition and erosion of cohesive sediments determined by a multi-class model. Estuarine, Coastal and Shelf Science 60, 457–475
Engelsen, A., Pihl, L., 2008. Grazing effects by Nereis diversicolor on development and growth of green algal mats. Journal of Sea Research. 59, 228-236
Esselink, P., Zwarts, L., 1989. Seasonal trend in burrow depth and tidal variation in feeding activity of Nereis diversicolor. Marine Ecology Progress Series. 56, 243-254
Fenchel, T., 1996. Worm burrows and oxic microniches in marine sediments.1.Spacial and temporal scales. Marine Biology. 127, 289-295
PART I – GENERAL INTRODUCTION
28
Ferro, I., van Nugteren, P., Middelburg, J.J., Herman, P.M.J., Heip, C.H.R., 2003. Effect of macrofauna, oxygen exchange and particle reworking on iron and manganese sediment biogeochemistry: a laboratory experiment. Vie Millieu. 53 (4), 211-220
Fidalgo e Costa, P., Sarda, R., Cancela da Fonseca, L., 1998. Life cycle, growth and production of the polychaete Nereis diversicolor O.F. Müller in three lagoonal estuarine systems of the southerwestern portuguese coast (Odeceixe, Aljezur and Carrapateira). Écologie 29 (4), 523-533
Flach, E., Lavaleye, M., de Stigter, H., Thomsen, L., 1998. Feeding types of the benthos community and particle transport across the slope of the N.W. European continental margin (Goban Spur). Progress in Oceanography. 42, 209-231
Flemming, B.W., 2000. A revised textural classification of gravel-free muddy sediments on the basis of ternary diagrams. Continental Shelf Research. 20, 1125-1137
Forster, S., Glud, R.N., Gundersen, J.K., Huettel, M., 1999. In situ study of bromide tracer and oxygen flux in coastal sediments. Estuarine, Coastal and Shelf Science. 49, 813-827
François, F., Gerino, M., Stora, G., Durbec, J.P., Poggiale, J.C., 2002. Functional approach to sediment reworking by gallery-forming macrobenthic organisms: modeling and application with the polychaete Nereis diversicolor. Marine Ecology Progress Series. 229, 127-136
François, F., Poggiale, J.-C., Durbec, J.-P., Stora, G., 1997. A new approach for the modeling of sediment reworking induced by a macrobenthic comunity. Acta Biotheorethica. 45, 295-319
French, B., Turner, A., 2008. Mobilization, adsorption, and bioavailability of Pt and Pd in coastal sediments: The role of the polychaete, Arenicola marina. Environmental Science & Technology. 42, 3543-3549
Friend, P.L., Ciavola, P., Cappucci, S., Santos, R., 2003. Bio-dependent bed parameters as a proxy tool for sediment stability in mixed habitat intertidal areas. Continental Shelf Research. 23 (17-19), 1899-1917
Gerino, M., Stora, G., Weber, O., 1999. Evidence of bioturbation in the Cap-Ferret Canyon in the deepo northeastern Atlantic. Deep-Sea Research II 46: 2289-2307
Gerino M Stora G, Poydenot F, Bourcier M. 1995. Benthic fauna and bioturbation on the Mediterranean continental slope: Toulon Canyon. Continental Shelf Research. 15 (11/12), 1483-1496
Gerino, M., 1991. Quantification of burrow geometry and sediment reworking by the polychaete Nereis diversicolor. Symposium of the Zoological Society of London. 63, 305-307
Giangrande, A., Montresor, M., Cavallo, A., Licciano, M., 2002. Influence of Naineris
laevigata (Polychaeta: Orbiniidae) on vertical grain size distribution, and dinoflagellate resting stages in the sediment. Journal of Sea Research. 47, 97-108
Gilbert, F., Hulth, S., Stromberg, N., Ringdahl, K., Poggiale, J.-C., 2003. 2-D optical quantification of particle reworking activities in marine surface sediments. J Journal of Experimental Marine Biology and Ecology. 285-286, 251-263
Gilbert, F., Stora, G., Bertrand, J.-C., 1996. In situ bioturbation and hydrocarbon fate in an experimental contaminated Mediterranean coastal ecosystem. Chemosphere. 33 (8), 1449-1458
Gleizon, P., Punt, A.G., Lyons, M.G., 2003. Modelling hydrodynamics and sediment flux within a macrotidal estuary: problems and solutions. The Science of the Total Environment. 314-316, 589-597
Goñi-Urriza, M., de Montaudouin, X., Guyoneaud, R., Bachelet, G., de Wit, R., 1999. Effect of macrofaunal bioturbation on bacterial distribution in marine sandy sediments, with special reference to sulphur-oxidising bacteria. Journal of Sea Research. 41, 269-279

Chapter 1 – Introduction
29
Graf, G., Rosenberg, R., 1997. Bioresuspension and biodeposition: a review. Journal of Marine Systems. 11, 269-278
Green, M.A., Aller, R.C., Cochran, J.K., Lee, C., Aller, J.Y., 2002. Boiturbation on the shelf/slope sediments off Cape Hatteras, North Carolina: the use of 234Th, Chl-a, and Br- to evaluate rates of particle and solute transport. Deep-Sea Research. II 49, 4627-4644
Green, M.O., Hewitt, J.E., Thrust, S.F., 1998. Seabed drag coefficient over natural beds of horse mussels (Atrina zelandica). Journal of Marine Research. 56, 613-637
Guarini, J.-M., Blanchard, G.F., Gros, P.H., Gouleau, D., Bacher, C., 2000. Dynamic model of the short-term variability of microphytobenthic biomass on temperate intertidal mudflats. Marine Ecology Progress Series. 195, 291-303
Hammerschmidt, C.R., Fitzgerald, W.F., 2004. Geochemical controls on the production and distribution of methylmercury in near-shore marine sediments. Environmental Science and Technology. 38, 1487-1495
Hansen, K., Kristensen, E., 1998. The impact of the polychaete Nereis diversicolor and enrichment with macroalgal (Chaetomorpha linum) detritus on benthic metabolism and nutrient dynamics in organic-poor and organic-rich sediment. Journal of Experimental Marine Biology and Ecology. 231, 201-223.
Hawkins, A.J.S., Bayne, B.L., Bougrier, S., Héral, M., Iglesias, J.I.P., Navarro, E., Smith, R.F.M., Urrutia, M.B., 1998. Some general relationships in comparing the feeding physiology of suspension- feeding bivalve molluscs. Journal of Experimental Marine Biology and Ecology. 219, 87-103
Heip, C.H.R., Duineveld, G., Flach, E., Graf, G., Helder, W., Herman, P.M.J., Lavaleye, M., Middelburg, J.J., Pfannkuche, O., Soetaert, K., Soltwedel, T., de Stigter, H., Thomsen, L., Vanaverbeke, J., de Wilde, P., 2001. The role of the benthic biota in sedimentary metabolism and sediment-water exchange processes in the Goban Spur area (NE Atlantic). Deep-Sea Research. 48, 3223-3243
Hewitt, J., Thrush, S., Gibbs, M., Lohrer, D., Norkko, A., 2006. Indirect effects of Atrina
zelandica on water column nitrogen and oxygen fluxes: The role of benthic macrofauna and microphytes. Journal of Experimental Marine Biology and Ecology. 330, 261-273
Houwing, E.-J., 2000. Morphodynamic development of intertidal mudflats: consequences for the extension of the pioneer zone. Continental Shelf Research. 20, 1735-1748
Houwing, E.-J., 1999 Determination of the critical erosion threshold of cohesive sediments on intertidal mudflats along the Duch Wadden Sea coast. Estuarine, Coastal and Shelf Science. 49, 545-555
Houwing, E.-J., van Rijn, L.C., 1998. In Situ Erosion Flume (ISEF): determination of bed shear stress and erosion of a kaolinite bed. Journal of Sea Research. 39, 243-253
Ibarrola, I., Etxeberria, M., Iglesias, J.I.P., Urrutia, M.B., Ângulo, E., 2000. Acute and acclimated digestive responses of the cockle Cerastoderma edule (L.) to changes in the food quality and quantity II. Enzymatic, cellular and tissular responses of the digestive gland. Journal of Experimental Marine Biology and Ecology. 252, 199-219
Iglesias, J.I.P., Urrutia, M.B., Navarro, E., Alvarez-Jorna, P., Larretxea, X., Bougrier, S., Heral, M., 1996. Variability of feeding processes in the cockle Cerastoderma edule (L.) in response to changes in seston concentration and composition. Journal of Experimental Marine Biology and Ecology. 197, 121-143
Ingalls, A.E., Aller, R.C., Lee, C., Sun, M.-Y., 2002. The influence of deposit-feeding on chlorophyll-a degradation in coastal marine sediments. Journal of Marine Research. 58, 631–651

PART I – GENERAL INTRODUCTION
30
Jacobs, W., van Kesteren, W.G.M., Winterwerp, J.C., 2007. Permeability and consolidation of sediment mixtures as function of sand content and clay mineralogy. International Journal of Sediment Research. 22, 180-187
Jacobs, W., Van Kesteren, W.G.M., Winterwerp, J.C., 2007. Permeability and consolidation of sediment mixtures as function of sand content and clay mineralogy. International Journal of Sediment Research. 22, 180-187
Jarvis, P., Jefferson, B., Gregory, J., Parsons, S.A., A review of floc strength and breakage. Water Research. 39, 3121-3137
Jones, C.G., Lawton, J.H., Shachak, M., 1997. Positive and negative effects of organisms as physical ecosystem engeneers. Ecology. 78 (7), 1946-1957
Jones, C.G., Lawton, J.H., Shachak, M., 1994. Organisms as ecosystem engeneers. Oikos. 373-386
Jones, S.E., Jago, C.F., 1993. In situ assessment of modification of sediment properties by burrowing invertebrates. Marine Biology. 115, 133--142
Jonsson, P.R., van Duren, L.A., Amielh, M., Asmus, R., Aspden, R.J., Daunys, D., Friedrichs, M., Friend, P.L., Olivier, F., Pope, N., Precht, E., Sauriau, P.-G., Schaaff, E., 2006. Making water flow: a comparison of the hydrodynamic characteristics of 12 different benthic biological flumes. Aquatic Ecology. 40, 409–438
Kamermans, P., 1993. Food limitation in cockles (Cerastoderma edule (L.)): influences of location on tidal flat and of nearby presence of mussel beds. Netherlands Journal of Sea Research. 31, 71-81
Kornman, B.A., de Deckere, E.M., 1998. Temporal variation in sediment erodability and suspended sediment dynamics in the Dollard estuary. In: Black KS, Paterson DM and Cramp A (eds) Sedimentary processes in the intertidal zone. Special publications. Vol.139, pp. 231-241 Geological Society, London
Kristensen, E., 2000. Organic matter diagenesis at the oxic/anoxic interface in coastal marine sediments, witrh emphasis on the role of burrowing animals. Hydrobiologia. 426, 1-24
Kure, L.K., Forbes, T.L., 1997. Impact of bioturbation by Arenicola marina on the fate of particle-bound fluoranthene. Marine Ecology Progress Series. 156, 157-166.
Lawless, M., Robert, A., 2001. Scales of boundary resistance in coarse-grained channels: turbulent velocity profiles and implication. Geomorphology. 39, 221-238
Le Hir, P., Monbet, Y., Orvain, F., 2007. Sediment erodability in sediment transport modelling: Can we account for biota effects? Continental Shelf Research. 27, 1116-1142
Lenihan, H.S., Peterson, C.H., Allen, J.M., 1996. Does flow speed also have a direct effect on growth of active suspension-feeders: An experimental test on oysters. Limnology and Oceanography. 41, 1359-1366
Lick, W., Lick, J., Kirk Ziegler, C., 1992. Flocculation and its effect on the vertical transport of fine-grained sediments. Hydrobiologia. 235/236, 1-16
Lumborg, U. 2005. Modelling the deposition, erosion and flux of cohesive sediments through Øresund. Journal of Marine Systems. 56, 179-193
Mantovanelli, A., Ridd, P.V., 2006. Devices to measure settling velocities of cohesive sediment aggregates : A reviwe of the in situ technology. Journal of Sea Research. 56, 199-226
Mazik, K., Elliot, M., 2000. The effect of chemical pollution on the bioturbation potential of estuarine intertidal mudflats. Helgollan Marine Research. 54, 99-109
McAnally, W.H., Metha, A.J., 2002. Significance of aggregation of fine sediment particles in their deposition. Estuarine, Coastal and Shelf Science. 54, 643-653
McCool, W.W., Parsons, J.D., 2004. Sedimentation from buoyant fine-grained suspensions. Continental Shelf Research. 24, 1129-1142

Chapter 1 – Introduction
31
Meadows, P.S., Murray, J.N.H., Meadows, A., Wood, D.M., West, F.J.C., 1998. Microscale biogeotechnical differences in intertidal sedimentary ecosystems. In Black, K. S., Paterson, D. M. and Cramp, A. (eds) Sedimentary processes in the intertidal zone. Geological Society, London, Special Publications. 139, 349-366
Meadows, P.S., Hariri, M.S.B., 1991. Effects of two infaunal polychaetes on sediment shear strength and permeability: na experimental approach. Symposium of the Zoological Society of London. 63, 319-321
Meadows, P.S., Meadows, A., 1991. The geotecnical and geochemical implications of bioturbation in marine sedimentary ecosystems. Symposium of the Zoological Society of London. 63, 157-181.
Meadows, P.S., Tait, J., 1989. Modification of sediment permeability and shear strength by two burrowing invertebrates. Marine Biology. 101, 75-82.
Meadows, P.S., Tate, J., Hussain, A., 1990. Effects of estuarine infaunal on sediment stability and particle sedimentation. Hydrobiologia. 190, 263-266
Mehta, A.J., Hayter, E.J., Parker, W.R., Krone, R.B., Teeter, A.M., 1989. Cohesive sediment transport. I: Process description. Journal of Hydraulic Engineering. 115 (8), 1076-1093
Mehta AJ, Parchure TM, Dixit JG, Arithurai R. 1982. Resuspention potencial of deposited cohesive sediment beds. Estuarine Comparisons, V.S. Keneddy, ed., Academic Press, New York, 591-609
Meysman, F.J.R., Boudreau, B.P., Middelburg, J.J., 2003. Relations between local, non-local, discrete and continuous models of bioturbation. Journal of Marine Research. 61, 391-410
Middelburg, J.J., Klaver, G., Nieuwenhuize, J., Wielemaker, A., de Haas, W., van der Nat, J.F.W.A., 1996. Organic matter mineralization in intertidal sediments along an estuarine gradient. Marine Ecology Progress Series. 132, 157-168
Mil-Homens, M., Stevens, R.L., Abrantes, F., Cato, I., 2006. Heavy metal assesment for surface sediments from three áreas of the Portuguese Continental Shelf. Continental Shelf Research. 26, 1184-1205
Miller, D.C., Norkko, A., Pilditch, C.A., 2002. Influence of diet on dispersal of horse mussel Atrina zelandica biodeposits. Marine Ecology Progress Series. 242, 153–167
Miller, D.C., Geider, R.J., MacIntyre, H.L., 1996. Microphytobenthos: the ecological role of the "secret garden" of unvegetated, shallow-water marine habitats. II. Role in sediment stability and shallow water food webs. Estuaries. 19, 202-212.
Monismith, S.G., Koseff, J.R., Thompson, J.K., O’Riordan, C.A., Nepf, H.M., 1990. A study model bivalve siphonal currents. Limnology Oceanography. 35, 680-696
Mortimer, R.J.G., Davey, J.T., Krom, M.D., Watson, P.G., Frickers, P.E., Clifton, R.J., 1999. The effect of macrofauna on porewater profiles and nutrient fluxes in the intertidal zone of the Humber estuary. Estuarine, Coastal and Shelf Science. 48, 683-699.
Mugnai, C., Gerino, M., Frignani, M., Sauvage, S., Bellucci, L.G., 2003. Bioturbation experiments in the Venice Lagoon. Hydrobiologia. 494, 245-250
Mulsow, S., Landrum, P.F., Robbins, J.A., 2002. Biological mixing responses to subleathal concentrations of DDT in sediments by Heteromastus filiformis using 137Cs layer technique. Marine Ecology Progress Series. 29, 181-191
Murray, J.M.H., Meadows, A., Meadows, PS., 2002. Biogeomorphological implications of microscale interactions between sediment geothecnics and marine benthos: a review. Geomorphology. 47, 15-30
Navarro, J.M., Widdows, J., 1997. Feeding physiology of Cerastoderma edule in response to a wide range of seston concentrations. Marine Ecology Progress Series. 152, 175-186
Neira, C., Levin, L.A., Grosholz, E.D., Mendoza, G., 2007. Influence of invasive Spartina growth stages on associated macrofaunal communities. Biological Invasions. 9, 975-993

PART I – GENERAL INTRODUCTION
32
Newell, C.R., Wildish, D.J., MacDonald, B.A., 2001. The effect of velocity and seston concentration on the exhalant siphon area, valve gape and filtration rate of the mussel Mytilus edulis. Journal of Experimental Marine Biology and Ecology. 262, 91-111
Nielsen, O.I., Gribsholt, B., Kristensen, E., Revsbech, N.P., 2004. Microscale distribution of oxygen and nitrate in sediments inhabited by Nereis diversicolor: spatial patterns and estimated reaction rates. Aquatic Microbiology Ecology. 34, 23-32
Nikora, V., Green, M.O., Thrust, S.F., Hume, T.M., Goring, D., 2002. Structure of the internal boundary layer over a patch of pinnid bivalves (Atrina zelandica) in an estuary. Journal of Marine Research. 60, 121-150
Nogaro, G., Charles, F., de Mendonça Jr, J.B., Mermillod-Blondin, F., Stora, G., François-Carcaillet, F., 2008. Food supply impacts sediment reworking by Nereis diversicolor. Hydrobiologia. 598, 403-408
O’Riordan, C.A., Monismith, S.G., Koseff, J.R., 1995. The effect of bivalve excurrent jet dynamics on mass transfer in a benthic boundary layer. Limnology and Oceanography. 40, 330-344
Ongley, E.D., Krishnappan, B.G., Droppo, I.G., Rao, S.S., Maguire, R.J., 1992. Cohesive sediment transport - emerging issues for toxic-chemical management. Hydrobiologia. 235, 177-187
Orvain, F., Sauriau, P.G., Bacher, C., Prineau, M., 2006. The influence of sediment cohesiveness on bioturbation effects due to Hydrobia ulvae on the initial erosion of intertidal sediments: A study combining flume and model approaches. Journal of Sea Research. 55, 54-73
Ozoh, P.T.E., 1994. The effects of salinity, temperature and time on the accumulation and depuration of copper in ragworm Hedistes (Nereis) diversicolor (O.F. Müller). Environmental Monitoring and Assessment. 29, 155-166
Paterson, D.M., 1989. Short-term changes in the erodability of intertidal cohesive sediments related to migratory behaviour of epipelic diatoms. Limnology and Oceanography. 34, 223-234
Peña, E., Anta, J., Puertas, J., Teijeiro, T., 2008. Estimation of Drag Coefficient and Settling Velocity of the Cockle Cerastoderma edule Using Particle Image Velocimetry (PIV). Journal of Coastal Research. 24(4C), 150-158
Petersen, K., Kristensen, E., Bjerregaard, P., 1998. Influence of bioturbating animals on flux of cadmium into estuarine sediment. Marine Environmental Research. 45, 403-415
Power, M.E., Tilman, D., Estes, J.A., Menge, B.A., Bond, W.J., Mills, L.S., Daily, G., Castilla, J.C., Lubchenco, J., Paine, R.T., 1996. Challenges in the Quest for Keystones: Identifying keystone species is difficult—but essential to understanding how loss of species will affect ecosystems. BioScience. 46 (8), 609-620
Rabaut, M., Guilini, K., van Hoey, G., Vincx, M., Degraer, S., 2007. A bio-engineered soft-bottom environment: the impact of Lanice conchilega on the benthic species-specific densities and community structure. Estuarine, Coastal and Shelf Science. 75, 525-536
Rasmussen, A.D., Banta, G.T., Andersen, O., 1998. Effects of bioturbation by the lugworm Arenicola marina on cadmium uptake and distribution in sandy sediments. Marine Ecology Progress Series. 164, 179-188
Rowden, A.A., Jones, M.B., Morris, A.W., 1998. The role of Callianassa subterranean (Montagu) (Thalassinidea) in sediment resuspension in the North Sea. Continental Shelf Research. 18, 1365-1380
Rossi, F., Herman, P.M.L., Middleburg, J.J., 2004. Interspecific and intraspecific variation of δ13C and δ15N in deposit - and suspension- feeding bivalves (Macoma balthica and Cerastoderma edule): Evidence of ontogenic changes in feeding mode of Macoma
balthica. Limnology and Oceanography. 49, 408-414

Chapter 1 – Introduction
33
Rueda, J.L., Smaal, A.C., Scholten, H., 2005. A growth model of the cockle (Cerastoderma
edule L.) tested in the Oosterschelde estuary (The Netherlands). Journal of Sea Research. 54, 276-298
Sanford, L.P., Maa, J.P-.Y., 2001. A unified erosion formulation for fine sediments. Marine Geology. 179, 9-23
Sauriau, P.-G., Kang, C.-K., 2000. Stable isotope evidence of benthic macroalgae-based growth and secondary production in the suspension feeder Cerastoderma edule (Mollusca, Bivalvia) in the Marennes-Oleron Bay. Hydrobiologia. 440, 317-329
Shimeta, J., Amos, C.L., Beaulieu, S.E., Ashiru, O.M., 2002. Sequencial resuspension of protists by accelarating tidal flow: Implications for community structure in the benthic boundary layer. Limnology and Oceanography. 47 (4), 1152-1164
Self, R.F.L., Nowell, A.R.M., Jumars, P.A., 1989. Factors controlling critical shears for deposition and erosion of individual grains. Marine Geology 86, 181-199
Smaal AC, Haas HA. 1997. Seston dynamics and food availability on mussel and cockle beds. Estuarine Coastal Shelf Science. 45: 247-259
Sobral, P., Widdows, J., 2000. Effects of increasing current velocity, turbidity and particle size selection on the feeding activity and scope for growth of Ruditapes decussatus from Ria Formosa, southern Portugal. Journal of Experimental Marine Biology and Ecology. 245, 111-125
Sohma, A., Sekiguchi, Y., Kuwae, T., Nakamura, Y., 2008. A benthic–pelagic coupled ecosystem model to estimate the hypoxic estuary including tidal flat - Model description and validation of seasonal/daily dynamics. Ecological Modelling. 215, 10-39
Sohma, A., Sekiguchi, Y., Yamata, H., Sato, T., Nakata, K., 2001. A new coastal marine ecosystem model study coupled with hydrodynamics and tidal flat ecosystem effect. Marine Pollution Bulletim. 43 (7-12), 187-208
Solan, M., Wigham, B.D., Hudson, I.R., Kennedy, R., Coulon, C.H., Norling, K., Nilsson, H.C., Rosenberg, R., 2004. In situ quantification of bioturbation using time-lapse fluorescent sediment profile imaging (f-SPI), luminophore tracers and model simulation. Marine Ecology Progress Series. 271, 1-12
Sondi, I., Lojen, S., Juracic, M., Prohic, E., 2008. Mechanisms of land–sea interactions – the distribution of metals and sedimentary organic matter in sediments of a river-dominated Mediterranean karstic estuary. Estuarine Coastal and Shelf Science. 80, 11-20
Swift, D.J.P., Stull, J.K., Niedoroda, A.W., Reed, C.W., Wong GT. 1996. Contaminant dispersal on the Palos Verdes continental margin. II. Estimates of the biodiffusion coefficient, Db, from composition of the benthic infaunal community. The Science of the Total Envirinment. 179, 91-107
Teisson, C., Ockendeden, M., Le Hir, P., Kraneburg, C., Hamm, L., 1993. Cohesive sediment transport processes. Costal Engineering. 21, 129-162
Thompson, C.E.L., Amos, C.L., Lecouturier, M., Jones, T.E.R., 2004. Flow decelaration as a method of determining drag coefficient over roughened flat beds. Journal of Geophysical Research. 109, 1-12
Tolhurst, T.J., Black, K.S., Paterson, D.M., 2009. Muddy Sediment Erosion: Insights from Field Studies. Journal of Hydraulic Engineering. 135, 73-87
Tolhurst, T.J., Black, K.S,, Shayler, A.S., Mather, S., Black, I., Baker, K., Paterson D.M., 1999. Measuring the in situ erosion shear stress of intertidal sediments with the Cohesive Strength Meter (CSM). Estuarine, Coastal and Shelf Science. 49, 281-294
Trevor, J.H., 1977. The burrowing of Nereis diversicolor O.F. Müller, together with some observations on Arenicola marina (L.) (Annelida: Polychaeta). Journal of Experimental Marine Biology and Ecology. 30, 129-145
PART I – GENERAL INTRODUCTION
34
Troost, K., Stamhuis, E.J., van Duren, L.A., Wolff, W.J., 2009. Feeding current characteristics of three morphologically different bivalve suspension feeders, Crassostrea gigas, Mytilus edulis and Cerastoderma edule, in relation to food competition. Marine Biology. 156, 355-372
Turner, A., Millward, G.E., Suspended particles: their role in estuarine biogeochemical cycles. Estuarine, Coastal and Shelf Science 55: 857-883
Turnewitsch, R., Witte, U., Graf, G., 2000. Bioturbation in the abyssal Arabian Sea: influence of fauna and food supply. Deep-Sea Research. II 47, 2877-2911
Uncles, R.J., 2002. Estuarine physical processes research: some recent studies and progress. Estuarine, Coastal and Shelf Science, 829-856
Underwood, G.J.C., Paterson, D.M., 1993. Seasonal changes in diatoms biomass, sediment stability and biogenic stabilisation in the Severn Estuary. Journal of the Marine Association of the UK. 73, 871-887
Underwood, G.J.C., Smith, D.J., 1998. Predicting epipelic diatom exopolymer concentrations in intertidal sediments from sediment chlorophyll a. Microbial Ecology. 35, 116-125.
Van Duren, L.A., Herman, P.M.J., Sandee, A.J.J., Heip, C.H.R., 2006. Effects of mussel filtering activity on boundary layer structure. Journal of Sea Research. 55, 3-14
van Leussen, W., 1999. The variability of settling velocities of suspended fine-grained sediment in the Ems estuary. Journal of Sea Research. 41, 109-118
Vedel, A., Andersen, B.B., Riisgård, H.U., 1994. Field investigations of pumping activity of facultative filter-feeder polychaete Nereis diversicolor using an improved infrared phototransducer system. Marine Ecology Progress Series. 103, 91-101
Velasco, L.A., Navarro, J.M., 2005. Feeding physiology of two bivalves under laboratory and field conditions in response to variable food concentrations. Marine Ecology Progress Series. 291, 115-124
Volkenborn, N., Hedtkamp, S.I.C., van Beusekom JEE, Reise R. 2007. Effects of bioturbation and bioirrigation by lugworms (Arenicola marina) on physical and chemical sediment properties and implications for intertidal habitat succession. Estuarine, Coastal and Shelf Science. 74, 331-343
Wang, Y.H., 2003. The intertidal erosion rate of cohesive sediment: a case study from Long Island Sound. Estuarine, Coastal and Shelf Science. 56, 891-896
Watts, C.W., Tolhust, T.J., Black, K.S., Whitmore, A.P., 2003. In situ measurements of erosion shear stress and geotechnical shear strength of the intertidal sediments of the experimental managed realignment scheme at Tollesbury, Essex, UK. Estuarine, Coastal and Shelf Science. 58, 611-620
Webb, A.P., Eyre, B.D., 2004. The effect of natural populations of the burrowing and grazing soldier crab (Mictyris longicarpus) on sediment irrigation, benthic metabolism and nitrogen fluxes. Journal of Experimental Marine Biology and Ecology. 309, 1-19
Wheatcroft, R.A., Jumars, P.A., Smith, C.R., Nowell, A.R.M., 1990. A mechanistic view of the particulate biodiffusion coefficients: step lengths, rest periods and transport directions. Journal of Marine Research. 48, 177-207
Widdows, J., Navarro, J.M., 2007. Influence of current speed on clearance rate, algal cell depletion in the water column and resuspension of biodeposits of cockles (Cerastoderma edule). Journal of Experimental Marine Biology and Ecology. 343, 44–51
Widdows, J., Lucas, J.S., Brinsley, M.D., Salkeld, P., Staff, F.J., 2002. Investigation of the effects of current velocity on mussel feeding and mussel bed stability using an annular flume. Helgoland Marine Research. 56, 3-12
Chapter 1 – Introduction
35
Widdows, J., Brinsley, M.D., Salkeld, P.N., Lucas, C.H., 2000. Influence of biota on spatial and temporal variation in sediment erodability and material flux on a tidal flat (Westerschelde, The Netherlands). Marine Ecology Progress Series. 194, 23-37
Widdows, J., Brinsley, M.D., Bowley, N., Barret, C., 1998. A benthic annular flume for in
situ measurement of suspension feeding/biodeposition rates and erosion potential of intertidal cohesive sediments. Estuarine, Coastal and Shelf Science. 46, 27-38
Wildish, D.J., Miyares, M.P., 1990. Filtration rate of blue mussels as a function of flow velocity: preliminary experiments. Journal of Experimental Marine Biology and Ecology. 142, 213-219
Winterwerp, J.C., Manning, A.J., Martens, C., de Mulder, T., Vanlede, J., 2006. A heusticic formula for turbulence-induced flocculation of cohesive sediment. Estuarine, Coastal and Shelf Science. 68,195-207
Winterwerp, J.C., van Kesteren, W.G.M., 2004. Introduction to the physical of cohesive sediments in marine environment. Elsevier. Developments in sedimentology. 56. ISBN 0-4444-51553-4, ISSN 0070-4571
Winterwerp, J.C., 2002. On the flocculation and settling velocity of estuarine mud. Continental Shelf Research. 22, 1339-1360
Wooding, R.A., Bradley, E.F., Marshall, J.K., 1973. Drag due to regular array of roughness elements of roughness elements of varying geometry. Boundary-Layer Metereology. 5, 285-308
Wright, J.P., Jones, C.G., 2006. The concept of organism as Ecossystem Engineers Ten Years on: Progress, Limitations, and Chalenges. BioScience. 56, 203-209
Yallop, M.L., de Winder, B., Paterson, D.M., Stal, L.J., 1994. Comparative structure, primary production and biogenic stabilisation of cohesive and non-cohesive marine sediments inhabited by microphytobenthos. Estuarine, Coastal and Shelf Science. 39, 565-582.
Ysebaert, T., Herman, P.M.J., 2002. Spatial and temporal variation in benthic macrofauna and relationships with environmental variables in an estuarine, intertidal soft-sediment environment. Marine Ecology Progress Series. 244, 105-124
Ysebaert, T., Meire, P., Herman, P.M., Verbeek, H., 2002. Macrobenthic species response surfaces along estuarine gradients: prediction by logistic regression. Marine Ecology Progress Series. 225, 79-95
Xu, F., Wang, D.-P., Riemer, N., 2008. Modeling flocculation processes of fine-grained particles using a size-resolved method: Comparison with published laboratory experiments. Continental Shelf Research. 28, 2668–2677
Zhang, H., Madsen, O.S., Sannasiraj, S.A., Chan, ES., 2004. Hydrodynamic model wave-current interaction in coastal regions. Estuarine Coastal and Shelf Science. 61, 317-324
Zimmerman, J.R., Bricker, J.D., Jones, C., Dacunto, P.J., Street, R.L., Luthy, R.G. 2008. The stability of marine sediments at a tidal basin in San Francisco Bay amended with activated carbon for sequestration of organic contaminants. Water Research. 42, 4133-4145
Zonta, R., Collavini, F., Zaggia, L., Zuliani, A., 2005. The effect of floods on the transport of suspended sediments and contaminants: A case study from the estuary of the Dese River (Venice Lagoon, Italy). Environment International. 31 (7), 948-958

PART I – GENERAL INTRODUCTION
36
PART IIINTERACCTIONS BETWEEN
AND SEDIMENT DYNAMICS
Clearance rates of
under increasing current velocity, measured
in two different flumes and interrelation
with hydrodynamics
Cerastoderma edule
Cerastoderma edule
Chapter 2


Chapter 2 - Clearance rates of Cerastoderma edule under increasing current velocity
39
CLEARANCE RATES OF CERASTODERMA EDULE UNDER INCREASING
CURRENT VELOCITY, MEASURED IN TWO DIFFERENT FLUMES AND
INTERRELATION WITH HYDRODYNAMICS
S. Fernandes, P. Sobral, L. van Duren
Continental Shelf Research, 27, 1104-1115
Abstract
Estimations of clearance rates (CR) of Cerastoderma edule (300 ind m-2) as a function of free-stream
current velocity (U) (from 5 to 40 cm s-1) are compared between a small annular (60 l) and a large
racetrack (8850 l) flume with different hydrodynamic conditions. Results showed that the flumes
differ considerably in their hydrodynamic characteristics. The relationship between clearance rate and
U is different in the two flume tanks, however, there appears to be a straightforward unimodal trend
between CR and shear velocity (u*). The cockles themselves were found to influence boundary layer
(BBL) characteristics, with steeper velocity gradients and increased mixing over the cockle bed
compared to bare sediment. This brings new evidence on how endobenthic organisms can affect the
BBL. However, the influence of CR on u* could not be quantified because these parameters have
interactive effects that cannot be dissociated.
Key-words: Benthic boundary layer, Cerastoderma edule, Clearance rates, Flumes, Velocity
2.1 Introduction
The clearance rate of bivalves has a known impact on the phytoplankton
concentrations in aquatic ecosystems (Kamermans, 1993). It is also an important process on
sediment dynamics. Filter-feeders can promote a direct transport of suspended particles from
the water column to the sediment surface. Accurate establishment of clearance rates of
bivalves has been and is the subject of extensive research and discussion (Riisgård, 2001).
Many authors have observed that clearance rates increase with quantity and quality of
suspended matter up to a threshold, after which clearance and absorption efficiency is

PART II – INTERACCTION BETWEEN Cerastoderma edule AND SEDIMENT DYNAMICS
40
negatively influenced by increasing quantity (Navarro and Widdows, 1997) and quality
(Iglesias et al., 1996; Hawkins et al., 1998; Ibarrola et al., 2000).
Later works focus on the effect of increasing currents on clearance rates of bivalves
(Wildish and Miyares, 1990; Ackerman, 1999; Sobral and Widdows, 2000; Newell et al.
2001; Widdows et al., 2002), showing that low current velocities have a positive effect on
clearance rates, but as velocity increases, clearance rates are reduced having an unimodal
response to current velocity.
While current velocity influences clearance rates of bivalves, the inverse is also true:
the presence of bivalves influences local hydrodynamics. This has been shown particularly for
epibenthic species (Butman et al., 1994; Green et al., 1998; Nikora et al., 2002). Their
presence is related with regions of increased drag coefficients, more energetic turbulence, and
consequently reduced flow speed. The increase in turbulence is often related to the effect of
increased roughness, produced by the shells protruding in the BBL, and a consequence of the
interaction of the exhalent jets with the overlying flow (Monismith et al., 1990; O’Riordan et
al., 1995). The effect of endobenthic bivalves, with a relatively low impact on the surface
roughness, on the benthic boundary layer and the effect of clearance activity on current
velocities has never been studied.
The cockle Cerastoderma edule is a widely distributed bivalve from European coasts
that occurs in densities up to 1750 ind m-2 in the Scheldt estuary (Ysebaert and Herman,
2002). It is an endobenthic suspension feeder that feeds on phytoplankton and resuspended
microphytobenthos (Sauriau and Kang, 2000; Rossi et al., 2004), and in the process changes
the gradient and composition of suspended matter passing over the cockle beds (Smaal and
Haas, 1997). According to Ysebaert et al. (2002) C. edule occurs in environments with flow
velocities of up to 80 cm s-1, having a maximum probability of 0.35 to occur at flow velocities
around 35 cm s-1. Kamermans (1993) and Lenihan et al. (1996) found that cockles show
increased growth with increasing flow velocities (0 – 7 cm s-1) under laboratory and more
clearly under field situations.
The reason why clearance activity of bivalves is influenced by water flow is twofold:
firstly, the flow determines the rate at which food particles are transported towards the
animals, and secondly, because the water exerts a force on the bed and hence on the feeding
apparatus of the animals. It is therefore not only the flow velocity that is important, but also
the structure of the boundary layer and the shear forces caused by the velocity gradient.
Experimental research on the effect of flow effects on bivalves feeding is normally carried out

Chapter 2 - Clearance rates of Cerastoderma edule under increasing current velocity
41
in a flume tank. The boundary layer structure is related to flume design (straight, racetrack,
annular and with several dimensions). This can lead to difficulties for comparisons or
misinterpretation of results obtained in different laboratory devices. This was recently
observed by Amos et al (2004) in a comparative study on sediment stability measurements in
different flumes.
Some larger flumes, with a straight working section provide hydrodynamic conditions
that closely resemble the boundary layer in the field. However, the large volume of water,
relative to a small area of cockle bed can introduce large measurement errors on the
estimations of clearance rates. Small annular flumes have the advantage of being easier to
operate. There are no entrance and exit conditions to take into account and the relatively small
test section surface-to-volume ratio makes it easy to detect reductions in algal concentrations.
However, the curvature of the flume walls produces a centrifugal force that generates
secondary flows and radial variability in bed stress (Amos et al., 1992; Yang et al., 2000),
producing a boundary layer structure very different from the field. Cross-channel variation in
bed stress variability is also reported for long straight flumes, but it is considered to be less
than stress gradients encountered in annular flume designs (Black and Cramp, 1995).
In this work, we compare the effect of current velocity on clearance rates of C. edule
in two different flumes: a small annular flume (60 l) and a big racetrack flume (8850 l). We
also analyse the effect of C. edule on the boundary layer characteristics, by comparing it with
the hydrodynamic characteristics over a bare sediment and over a smooth surface.
2.2 Material and methods
2.2.1 Organisms collection and experimental set-up and procedures
The experiments took place in November-December 2002 at the Instituto do Mar-
Universidade Nova de Lisboa (IMAR-FCTUNL) and at the Netherlands Institute of Ecology
(NIOO) in June-July 2003.
Organisms were collected (see details in Table 2.1a), brought to the laboratory and
allowed to acclimatise, for a minimum of 5 days, in seawater aquaria under continuous
aeration, temperature and salinity similar to the experimental conditions (see Table 2.1b),
prior to introduction into the flume for experimental measurements (see details of flumes
below).
PART II – INTERACCTION BETWEEN Cerastoderma edule AND SEDIMENT DYNAMICS
42
In the IMAR flume, fine sand (< 500 µm) was used as an experimental substrate.
Observations at that time revealed that the resuspension of very fine grains would interfere
with cell counts and produced error in the estimation of clearance rates. For this reason, in the
NIOO flume, coarser sand (average grain diameter 750 µm) was used.
On both flumes, each group of organisms (see Table 2.1a) was introduced into the
flume and left overnight under a free-stream current velocity of about 2 cm s-1. The next day,
the organisms were exposed to increasing free-stream current velocities (from 5 to 40 cm s-1).
Before each velocity run, care was taken to substitute dead or inactive organisms. The
treatments with C. edule will be designated as Ck and the control treatments as C. Later we
will refer treatment S, concerning the velocity measurements over a smooth surface, the
channel PVC surface of the NIOO flume.
In the beginning of each current velocity run, microalgae (see Table 2.1b) were added
to the water in order to obtain a concentration of 16000 cells ml-1. Algal cells were allowed to
distribute homogeneously in the water column. Subsequently, water samples were taken at
five heights (2, 7, 12, 17 and 22 cm above the bed) at fixed time intervals (see Table 1d) for
the determination of suspended cell depletion over time. Cell counts were performed in
Coulter Counter® Mod II and Multisizer II. Water samples were also taken in the beginning
and at the end of each velocity run and filtered onto Whatman GF/C filters for determination
of total particulate suspended matter.
2.2.2 Clearance activity estimations
Clearance rates (CR) were estimated on C and Ck treatments in the two flumes, by the
cell depletion method (Coughlan, 1969). It measures the volume of water cleared of
suspended particles per unit of time. It has proved to be a reliable method in many clearance
studies on bivalves, although it has the disadvantage that cell concentrations decline during
the experiments (Riisgård, 2001). This artefact was minimised in this experiment by assuring
a minimum concentration of cells in the flume. In the end of all velocity runs in both
experiments, cell concentrations were above 5000 cells ml-1. Therefore reduced clearance
activity due to low food concentration presumably did not occur.
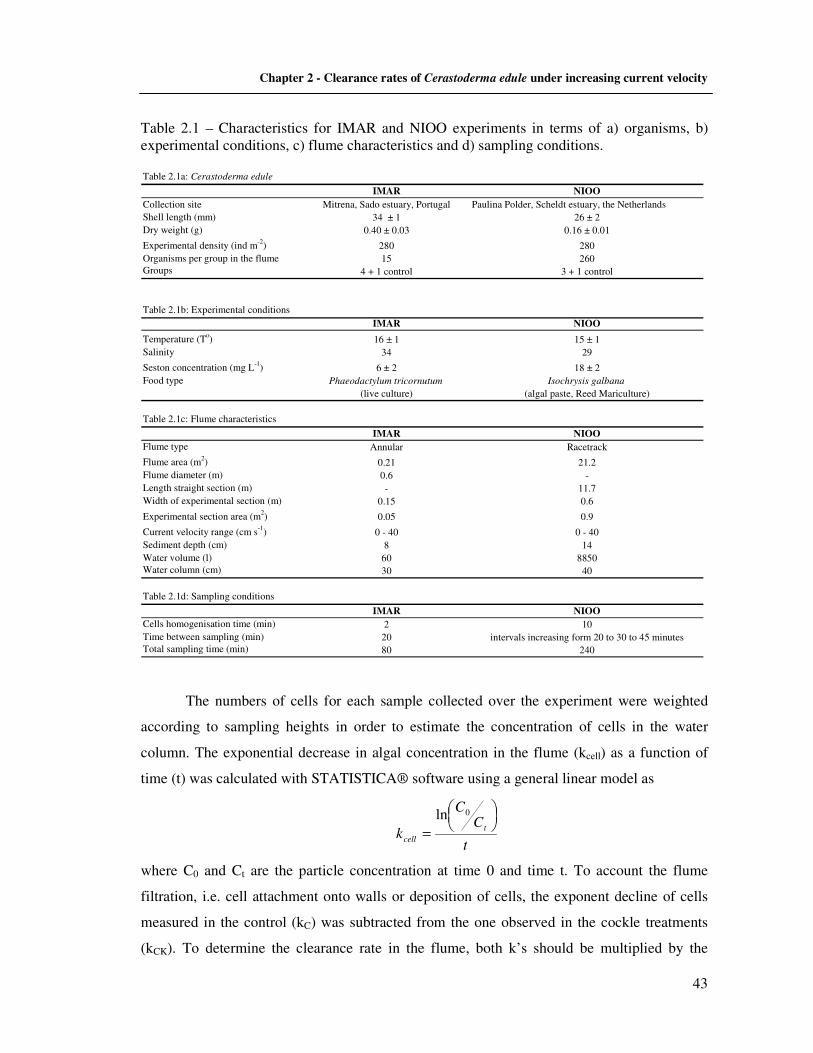
Chapter 2 - Clearance rates of Cerastoderma edule under increasing current velocity
43
Table 2.1 – Characteristics for IMAR and NIOO experiments in terms of a) organisms, b) experimental conditions, c) flume characteristics and d) sampling conditions. Table 2.1a: Cerastoderma edule
IMAR NIOO
Collection site Mitrena, Sado estuary, Portugal Paulina Polder, Scheldt estuary, the Netherlands
Shell length (mm) 34 ± 1 26 ± 2
Dry weight (g) 0.40 ± 0.03 0.16 ± 0.01
Experimental density (ind m-2) 280 280
Organisms per group in the flume 15 260Groups 4 + 1 control 3 + 1 control
Table 2.1b: Experimental conditions
IMAR NIOO
Temperature (To) 16 ± 1 15 ± 1
Salinity 34 29
Seston concentration (mg L-1) 6 ± 2 18 ± 2
Food type Phaeodactylum tricornutum Isochrysis galbana
(live culture) (algal paste, Reed Mariculture)
Table 2.1c: Flume characteristics
IMAR NIOO
Flume type Annular Racetrack
Flume area (m2) 0.21 21.2Flume diameter (m) 0.6 -Length straight section (m) - 11.7Width of experimental section (m) 0.15 0.6
Experimental section area (m2) 0.05 0.9
Current velocity range (cm s-1) 0 - 40 0 - 40
Sediment depth (cm) 8 14
Water volume (l) 60 8850Water column (cm) 30 40
Table 2.1d: Sampling conditions
IMAR NIOO
Cells homogenisation time (min) 2 10Time between sampling (min) 20 intervals increasing form 20 to 30 to 45 minutesTotal sampling time (min) 80 240
The numbers of cells for each sample collected over the experiment were weighted
according to sampling heights in order to estimate the concentration of cells in the water
column. The exponential decrease in algal concentration in the flume (kcell) as a function of
time (t) was calculated with STATISTICA® software using a general linear model as
t
CC
kt
cell
=
0ln
where C0 and Ct are the particle concentration at time 0 and time t. To account the flume
filtration, i.e. cell attachment onto walls or deposition of cells, the exponent decline of cells
measured in the control (kC) was subtracted from the one observed in the cockle treatments
(kCK). To determine the clearance rate in the flume, both k’s should be multiplied by the

PART II – INTERACCTION BETWEEN Cerastoderma edule AND SEDIMENT DYNAMICS
44
volume of water in the flume (V). Individual clearance rates are obtained by dividing it by the
number of organism in the flume (n) as:
( )CCK kkn
VCR −=
The cockles used in the NIOO experiment were considerably smaller than those in the
IMAR experiment (Table 1a). Clearance rates do not scale linearly with body weight, but
according to a power law. To remove the effect of body weight, the data were standardised
and weight specific rates (Ys) were calculated using the formula:
b
e
d
esW
WYY
=
where , Ye is the uncorrected rate, Wd is the weight to be corrected for (1g) , We is the average
dry weight of the respective cockles group and b is the weight power (0.70, Møhlenberg and
Riisgård, 1978).
2.2.3 Flume calibration
The IMAR flume (see Table 2.1c) is an annular flume with 15 cm channel width, built
after Widdows et al. (1998), where current velocities are driven by a rotating drive plate of
adjustable height. In the IMAR flume, it was only possible to measure free-stream velocities
but no method for accurate velocity measurements in the boundary layer was available. For
this reason, a model (F15) was developed using a computational fluid dynamics (CFD)
commercial software, CFX 5.7, to simulate hydrodynamic conditions in the IMAR flume,
given the geometry of the flume and different driving forces on the rotating plate to produce
the different free-stream velocities that were actually measured. Good boundary layer
measurements were available from a similar flume, with the same external dimensions, but
with a narrower channel width of 10 cm. This flume (IMAR10) is fitted with a Sontek micro-
ADV Lab and velocity profiles were available for the free-stream current velocities of 5, 10,
20 and 40 cm s-1. To calibrate the F15 model, we first developed a CFD model for the
IMAR10 flume (F10). When this model proved capable of accurately reproducing velocity
profiles in the narrower flume, this was used as a basis for the F15 model, only changing the
channel width. F15 and F10 were based on the corresponding geometry and were meshed
using tetrahedral elements. The walls and the bottom of the flume were modelled as smooth
walls with no-slip conditions. Water flow in the model was driven from the top of the flume.
A previously determined relationship was used, between the drive plate and the free-stream

Chapter 2 - Clearance rates of Cerastoderma edule under increasing current velocity
45
velocity in the IMAR flume (Fernandes, 2001), based on time measurements of complete
rotations of neutrally buoyant particles in the flume and of the driving plate.
In the NIOO-CEME flume the water is circulated around the flume via a motor-driven
conveyor belt with vertical paddles. Turning vanes are positioned in each of the two bends of
the racetrack flume to reduce secondary circulation and stacks of pvc pipes act as collimators.
In the NIOO flume, profiles with a vertical resolution of 8 mm were measured with a Nortek
ADV mounted on an automated 3D positioning system, over a smooth surface. To cope with
horizontal variability, due to e.g. effect of exhalent jets near the bed, at each height 8 points at
different horizontal locations within a surface area of 3 cm2 were measured. Each individual
measurement lasted 5 seconds. The temporal and spatial averages at each height provided the
measurements for each profile. The same velocity measurements were repeated during the
clearance activity experiments, in the front (5 cm from the leading edge of the cockle bed) and
in the back part (60 cm further) of the cockle bed. Subsequent analysis showed significant
changes of the boundary layer structure between the front and the back of the cockle bed. This
is presumably due to the effect of the cockles on the near-bed flow. For this reason,
hydrodynamic comparison between treatments was based on the measurements performed in
the back part of the cockle beds.
2.2.4 Hydrodynamic parameters estimations
Shear velocity (u*) and roughness length (z0) were determined from the logarithmic
velocity profile using Karman-Prandtl Law of the Wall equation:
=
0
* lnz
zUU
κ
where U is the free-stream velocity, z is the height above the bed and κ is the Von Karman
constant (0.40). Comparisons of fluid dynamics between flumes are based on CFX
simulations and measurements (NIOO) over a plastic smooth surface (S). Comparisons of
fluids dynamics between treatments (in the NIOO experiments) were based on measurements
for the respective treatment.
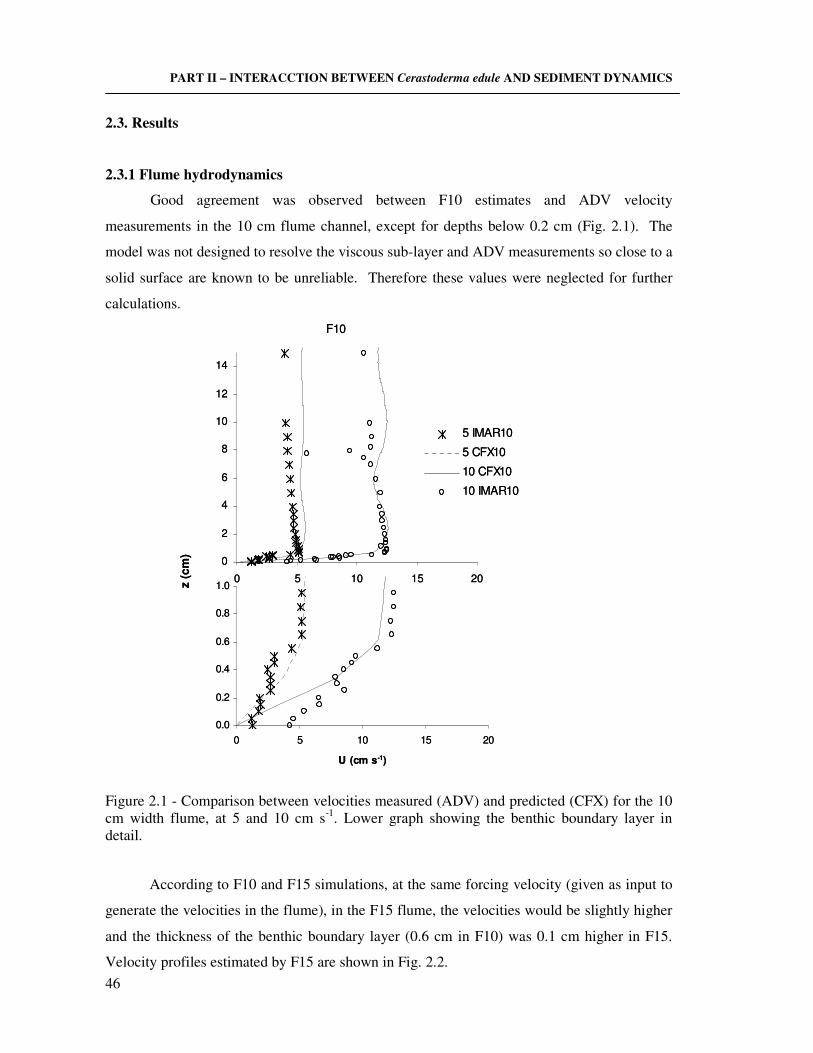
PART II – INTERACCTION BETWEEN Cerastoderma edule AND SEDIMENT DYNAMICS
46
2.3. Results
2.3.1 Flume hydrodynamics
Good agreement was observed between F10 estimates and ADV velocity
measurements in the 10 cm flume channel, except for depths below 0.2 cm (Fig. 2.1). The
model was not designed to resolve the viscous sub-layer and ADV measurements so close to a
solid surface are known to be unreliable. Therefore these values were neglected for further
calculations.
Figure 2.1 - Comparison between velocities measured (ADV) and predicted (CFX) for the 10 cm width flume, at 5 and 10 cm s-1. Lower graph showing the benthic boundary layer in detail.
According to F10 and F15 simulations, at the same forcing velocity (given as input to
generate the velocities in the flume), in the F15 flume, the velocities would be slightly higher
and the thickness of the benthic boundary layer (0.6 cm in F10) was 0.1 cm higher in F15.
Velocity profiles estimated by F15 are shown in Fig. 2.2.
0.0
0.2
0.4
0.6
0.8
1.0
0 5 10 15 20
U (cm s-1)
F10
0
2
4
6
8
10
12
14
0 5 10 15 20
5 IMAR10
5 CFX10
10 CFX10
10 IMAR10
z (
cm
)
0.0
0.2
0.4
0.6
0.8
1.0
0 5 10 15 20
U (cm s-1)
F10
0
2
4
6
8
10
12
14
0 5 10 15 20
5 IMAR10
5 CFX10
10 CFX10
10 IMAR10
z (
cm
)
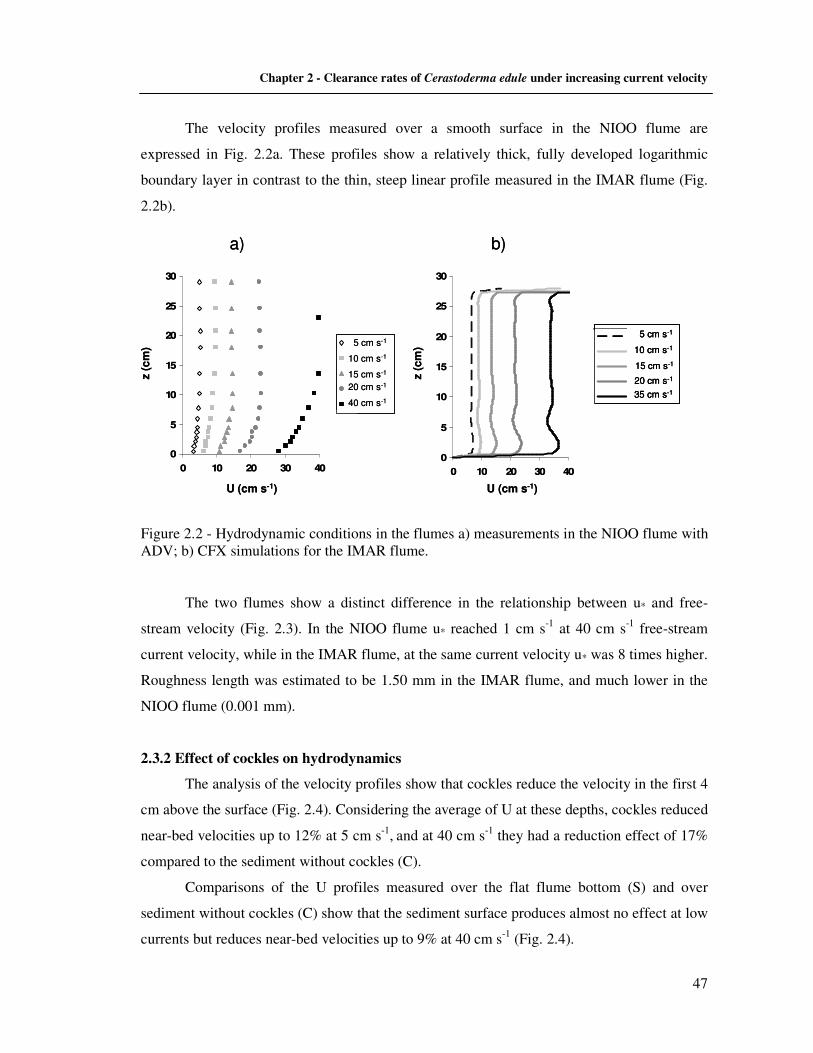
Chapter 2 - Clearance rates of Cerastoderma edule under increasing current velocity
47
The velocity profiles measured over a smooth surface in the NIOO flume are
expressed in Fig. 2.2a. These profiles show a relatively thick, fully developed logarithmic
boundary layer in contrast to the thin, steep linear profile measured in the IMAR flume (Fig.
2.2b).
Figure 2.2 - Hydrodynamic conditions in the flumes a) measurements in the NIOO flume with ADV; b) CFX simulations for the IMAR flume.
The two flumes show a distinct difference in the relationship between u* and free-
stream velocity (Fig. 2.3). In the NIOO flume u* reached 1 cm s-1 at 40 cm s-1 free-stream
current velocity, while in the IMAR flume, at the same current velocity u* was 8 times higher.
Roughness length was estimated to be 1.50 mm in the IMAR flume, and much lower in the
NIOO flume (0.001 mm).
2.3.2 Effect of cockles on hydrodynamics
The analysis of the velocity profiles show that cockles reduce the velocity in the first 4
cm above the surface (Fig. 2.4). Considering the average of U at these depths, cockles reduced
near-bed velocities up to 12% at 5 cm s-1, and at 40 cm s-1 they had a reduction effect of 17%
compared to the sediment without cockles (C).
Comparisons of the U profiles measured over the flat flume bottom (S) and over
sediment without cockles (C) show that the sediment surface produces almost no effect at low
currents but reduces near-bed velocities up to 9% at 40 cm s-1 (Fig. 2.4).
0
5
10
15
20
25
30
0 10 20 30 40
z (
cm
)
U (cm s-1)
0
5
10
15
20
25
30
0 10 20 30 40
z (
cm
)
U (cm s-1)
a) b)
5 cm s-1
10 cm s-1
15 cm s-1
20 cm s-1
40 cm s-1
5 cm s-1
10 cm s-1
35 cm s-1
15 cm s-1
20 cm s-1
0
5
10
15
20
25
30
0 10 20 30 40
z (
cm
)
U (cm s-1)
0
5
10
15
20
25
30
0 10 20 30 40
z (
cm
)
U (cm s-1)
a) b)
5 cm s-1
10 cm s-1
15 cm s-1
20 cm s-1
40 cm s-1
5 cm s-1
10 cm s-1
35 cm s-1
15 cm s-1
20 cm s-1
5 cm s-1
10 cm s-1
35 cm s-1
15 cm s-1
20 cm s-1

PART II – INTERACCTION BETWEEN Cerastoderma edule AND SEDIMENT DYNAMICS
48
0
2
4
6
8
10
0 20 40 60
U (cm s-1)
u* (c
m s-1
)
IMAR
NIOO
Figure 2.3 - Relationship between shear velocity u* estimations (using LW method) and current velocity (U), in the IMAR and NIOO flumes corresponding to the following linear regressions (u*= 0.2462U+0.0141, R2=1.0) and (u*= 0.0267U+0.1008, R2=0.96).
0
3
6
9
12
15
18
1 10 100
U (cm s-1
)
z (
cm
)
S
C
Ck
Figure 2.4 - Velocity profiles at 5 and 40 cm s-1 measured over a smooth surface (S), the control sediments (C) and cockles bed (Ck) in the NIOO flume.
The flow reduction in the near-bed layers results in a steeper velocity gradient.
Consequently we found that u* estimations where higher in the presence of cockles (Fig. 2.5).
On the cockle treatment u* values were 16% higher at 5 cm s-1 and 74% higher at 40 cm s-1 (in
comparison with bare sediment, C), while u* on sediment, at 40 cm s-1, was 65% higher than
over a smooth surface. As a consequence, the relationships found between u* and U depend on

Chapter 2 - Clearance rates of Cerastoderma edule under increasing current velocity
49
the presence of sediment and cockles and differ from measurements over a smooth surface
(Fig. 2.5).
0
0,5
1
1,5
2
2,5
3
3,5
0 10 20 30 40 50
U (cm s-1
)
U* (
cm
s-1
)
S
C
Ck
Figure 2.5 - Relationship between current velocity (U) and shear velocity (u*) for a smooth surface (S), control sediments (C) and cockles bed (Ck) in the NIOO flume.
In comparisons with a smooth surface, C. edule and the sediment had a clear effect on
z0 (Fig. 2.6). C. edule had an increasing effect over z0 of 286% at 5 cm s-1 and 4681% at 40 cm
s-1 when compared to C. This large increase in roughness length did not coincide with a
conspicuous visual increase of physical bed roughness, although this was not quantified.
Figure 2.6 - Roughness length (z0) over increasing U in a smooth surface (S), over the control sediments (C) and cockle bed (Ck) in the NIOO flume. z0 axis is in a logarithmic scale for a better visualisation.
0.0001
0.001
0.01
0.1
1
10
5 10 20 30 40
U (cm s-1)
S
C
Ckzo
(mm
)
0.0001
0.001
0.01
0.1
1
10
5 10 20 30 40
U (cm s-1)
S
C
Ckzo
(mm
)

PART II – INTERACCTION BETWEEN Cerastoderma edule AND SEDIMENT DYNAMICS
50
2.3.3 Visual observations on sediments with cockles
In the IMAR experiments, at U of 15 cm s-1, bed load transport was observed and the
flat surface topography started to become rippled. Sand erosion started at 30 cm s-1. At this
current velocity it was possible to observe the organisms using their feet to actively burrow in
the sand, while aggregating in groups of 3-4 individuals. In an annular flume, it was possible
to observe the erosion and the corresponding deposition in further points of the channel. The
cockles appeared to be able to cope with considerable sediment deposition. Although covered
by sand, the cockles actively crawl up to the surface, and kept feeding. At 40 cm s-1, some
organisms were carried away with the current but with their feet, they were able to settle on
further ahead ripples. In the NIOO experiments, bed load transport started at U of 20 cm s-1
but still at 40 cm s-1 there was almost no resuspension. The organisms appear to cope with this
bed load transport, which seemed not to interfere with their clearance activity.
2.3.4 The effect of hydrodynamics on clearance activity
The analysis of microalgal profiles showed that the concentration of cell in the water
column had a faster reduction over time in the IMAR flume in comparison with the NIOO
flume (presumably due to the smaller ratio of volume of water by number of animals in the
flume), but no obvious depletion layer was observed. Cell reduction in the control treatments
was negligible in the IMAR flume (Fig. 2.7).
In the NIOO flume the control experiments showed a significant cell reduction that
was inversely related to flow velocity (Fig. 2.7). At the lowest velocity cell reduction in the
control was of the same order of magnitude as in the cockle treatment. At the highest velocity
there was hardly any loss at all in control treatments.
The effect of free-stream current velocity on clearance rates is different in both flumes.
Statistical analysis (two-way ANOVA) showed that clearance rates were significantly
different in the two flumes (p< 0.001) and over increasing free-stream current velocity (p<
0.01) (Fig. 2.8). The cockles in the NIOO flume increased their clearance rates with velocity.
The maximum clearance rates in the NIOO flume were found at 30 and 40 cm s-1. These
range between 2.3 and 3.6 l h-1 ind-1, corresponding to a weight specific rate of 6.3 – 11.2 l h-1
g-1. In the IMAR flume, the highest clearance rates were found at about 15 cm s-1 (3.7 l h-1
ind-1 ± 0.7, corresponding to a weight specific rate of 7.0 l h-1 g-1 ± 1.3), after which they
declined, stopping at 40 cm s-1.

Chapter 2 - Clearance rates of Cerastoderma edule under increasing current velocity
51
Whereas the relationship between CR and U observed in the two different flumes is
different, the one between CR and u* (based in the relationships shown in Fig. 2.3) appears to
show a maximum (Fig. 2.9). The analysis of CR based on u* (Fig. 2.9) show that low
velocities increase clearance rates up to a point (approximately 3.8 cm s-1), after which they
start to decline.
Figure 2.7 – Flume clearance rates (CR) over increasing free-stream current velocities (U) for the control treatments in the NIOO and IMAR flume.
-4
-2
0
2
4
6
8
10
12
14
0 10 20 30 40 50
U (cm s-1)
CR
(l h -
1 g -1 )
NIOO
IMAR
Figure 2.8 – Weight specific clearance rates (estimates with CD method) over increasing free-stream current velocities (U) in the IMAR and NIOO flume. (± Standard deviation)
0
100
200
300
400
500
600
700
800
0 5 10 15 20 25 30 35 40 45
NIOO
IMAR
Flu
me
CR
(l
h-1
)
U (cm s-1)
0
100
200
300
400
500
600
700
800
0 5 10 15 20 25 30 35 40 45
NIOO
IMAR
Flu
me
CR
(l
h-1
)
U (cm s-1)

PART II – INTERACCTION BETWEEN Cerastoderma edule AND SEDIMENT DYNAMICS
52
Figure 2.9 - Weight specific clearance rates (estimates with CD method) over increasing shear velocities (u*) in the IMAR and NIOO flume. (± Standard deviation).
2.4 Discussion
2.4.1 Comparisons between flumes
The hydrodynamic conditions in the two flumes presented different characteristics. In
the NIOO racetrack flume the hydrodynamic conditions are closer to the observed in natural
conditions (Finelli et al., 1999). However, the clearance observed in the NIOO control (Fig.
2.7) indicates that there are some losses of material under low current velocities which
compromises optimal laboratory conditions. Due to the very large volume of the flume,
relative to the number of filtering cockles, the error of measurement in the NIOO flume is
relatively large. Another source of error in this set-up is the relatively large “consumption
rate” of the flume itself at low velocities. At the lowest velocity the “flume consumption”
even out-competes the consumption by the cockles. This is probably primarily due to
turbulence reducing structures, such as collimators, where algae can get trapped. These
structures will also promote the break down of any possible vertical gradient. Such structures
are absent in the IMAR flume. The higher velocity gradients in the IMAR flume will also
prevent sedimentation of the algae.
The hydrodynamic conditions in the IMAR annular flume are characterised by a
compressed log layer, as observed in other flumes (Fukuda and Lick, 1980; Thompson et al.
2004), which might only represent few natural situations (e.g. meandering shallow streams).
In the IMAR flume, it is likely that once erosion started uncovering the organisms and ripples
-4
-2
0
2
4
6
8
10
12
14
0 2 4 6 8 10 12
NIOO
IMAR
CR
(l h
-1g
-1)
U*(cm s-1)
-4
-2
0
2
4
6
8
10
12
14
0 2 4 6 8 10 12
NIOO
IMAR
CR
(l h
-1g
-1)
U*(cm s-1)

Chapter 2 - Clearance rates of Cerastoderma edule under increasing current velocity
53
formed, the shells protruded from the thin boundary layer (considered to be 0.7 cm high),
increasing turbulence.
In comparison to the NIOO flume, the IMAR flume presented advantages in terms of
the quantity of material needed to perform the experiments (organisms, sediment and algae
culture) and the time needed for measurable cell depletion. Although no physical obstacles
were presented in the water column, the high shear velocities and turbulent mixing observed
in this flume, especially at the higher velocities, prevented depletion of the near-bed layers by
the clearance activity of C. edule.
Although both flumes presented some limitations regarding natural conditions
reproducibility, the trend in the data in both flumes is consistent enough to have confidence in
the response of cockles to changes in hydrodynamics.
2.4.2 Influence of velocity on clearance rates
Weight-specific CR in the NIOO experiments, varying from 6 to 11 l-1 h-1 g-1, were
higher than the ones found in the IMAR experiments that varied from 0 to 7 l-1 h-1 g-1). This is
probably due to an overestimation caused by the standardisation to weight-specific rates of the
organisms used in the NIOO experiment, with half the weight of the organisms used in
IMAR, as the rates for individual organisms were under the same magnitude, varying from
0.5 to 3.0 l-1 h-1 ind-1 in the NIOO and from 0 to 3.7 l-1 h-1 ind-1 in the IMAR experiment.
Nevertheless, standardisation has to be performed to allow comparisons between the two
different populations. The different rates can also be related with differences in the origin and
collection time of the organisms and by differences in the seston concentration and the food
type used in the two experiments.
In general, the clearance rates found in this work are in agreement with the rates found
by Riisgård et al. (2003) (average clearance rates 4.8 to 6.6 l h-1 g-1) at a range of temperature
from 5 to 10 ºC. The rates were slightly higher than the ones found by Karlsson et al. (2003)
(about 3 l h-1g-1) under a current velocity range from 4 to 6 cm s-1, but they specifically
investigated particle sizes of 60 µm and larger. Navarro and Widdows (1997) reported that
clearance rates decrease with increasing seston concentration. They report maximum
clearance rates of 7.1 l h-1 g-1 for very low seston concentrations, and of 3.7 l h-1 g-1 for seston
concentrations ranging from 10 to 20 mg l-1, which is the range of the concentrations used in
the present work. All of the rates from the literature mentioned above were measured on
individual animals. The rates determined in the present flume experiments are bed averages.

PART II – INTERACCTION BETWEEN Cerastoderma edule AND SEDIMENT DYNAMICS
54
Normally one would expect these to be somewhat lower than maximum individual rates.
However, all the animals in our experiments were hand-selected, healthy and active, which
will have increased the average clearance rates, in comparison to natural beds. The clearance
rates in the two flumes appeared to give a different relationship with free-stream velocity. In
the NIOO flume clearance increased with velocity, in the IMAR flume clearance rates started
to decrease at velocities of 20 cm s-1. This was almost certainly due to the fact that the two
flumes have very different boundary layers, with a different velocity gradient. Although the
experimental free-stream velocities in the flumes overlapped, there was little overlap in the
ranges of u*. If we consider the trend in the responses from both flumes, it appears that
clearance rates are primarily influenced by shear velocity, rather than velocity per se.
The relationship between clearance rates and increasing velocities (Fig. 9) is
unimodal, as observed for other bivalve species (Lenihan et al., 1996; Ackerman, 1999;
Sobral and Widdows, 2000). Under low velocities CR seems to be enhanced. Previous
measurements of CR from C. edule in the IMAR flume (Fernandes and Sobral, 2001), under
shear velocities from 0 to 4.4 cm s-1 (according to the conversion between U and u* used in
the present work), showed an increment of CR (from 2.1 to 2.8 l h-1 ind-1 corresponding to 5.5
and 7.2 l h-1 g-1). However, C. edule clearance activity is reduced at high shear velocities.
According to our results, the critical u* value from where CR reduction lies between 3.5 and
5.3 cm s-1.
At low velocities, some bivalves seem to increase their clearance rates, by orientating
themselves into the flow, thus reducing pumping cost (Englund and Heino, 1996). Others
report that they orient both their siphons perpendicularly to the principal component of current
direction, hence, reducing interactions between siphon flows and minimizing the risk of
refiltration of seawater (Vincent et al., 1988). Low velocities are also known to increase the
encounter efficiency with frontal cilia, promoting particle retention (Ward et al., 1998).
Other observations under current velocities between 10 and 30 cm s-1 showed that
water velocity has a significant negative linear effect on mussel exhalant siphon area,
although no significant effect on valve gape was found (Newell et al., 2001).
As velocity increases, there is a critical point at which the organisms have to deal with
abrasion due to saltating particles and increased ballistic momentum flux (Amos et al., 2000)
at the siphons level. This may be an additional factor in the difference of the clearance rates
between the two flumes.
Chapter 2 - Clearance rates of Cerastoderma edule under increasing current velocity
55
In the annular flume finer sediment was used that had a lower erosion threshold than
that in the racetrack flume experiment. The resuspension observed at the higher velocities in
the IMAR flume might be related with the decrease on clearance rates. The decline in
clearance activity as a consequence of resuspension and therefore, increase in suspended
matter was already mentioned by Sobral and Widdows (2000). In addition, under higher
current velocities it is possible that bivalves reduce their ability to orientate their body or
siphons in relation to the current or might even loose the ability of the ciliary pump to
function effectively in removing food particles (Wildish and Miyares, 1990).
Reduced algal concentrations near the bottom over dense cockle beds have been
reported from the field (Smaal and Haas, 1997). Near-bed depletion layers have also been
observed in a preliminary experiment in the annular flume with similar densities (Fernandes
and Sobral, 2001), where reduced concentrations were observed at about 12 cm from the bed
and at velocities of about 11 cm s-1 (u*~2.8 cm s-1). In a similar annular flume, Sobral and
Widdows (2000) observed a depleted layer at about 10 cm height in an experiment with
similar densities of the clam Ruditapes decussatus, an endobenthic bivalve with long
separated siphons. This effect was marked at low current velocities (3 cm s-1) and still
detectable at 17 cm s-1. In the present study we did not find any reduction in algal
concentration in the near-bed layers. For depletion to occur, clearance rates per unit area must
out-compete vertical mixing rates.
In the IMAR flume the high shear velocities and turbulent mixing are likely to reduce
depletion in the water column. The lower shear velocities and mixing rates in the racetrack
flume would make the occurrence of depletion layers more likely. However, after leaving the
test section with the cockles the water in this flume is completely mixed again at the drive
belt. Flume structures, such as the paddles and collimators will promote the break down of
any possible vertical gradient. In the racetrack flume the water samples were taken about 60
cm from the leading edge. Even at a low velocity of e.g. 10 cm s-1, the cockles would have
only 6 seconds to significantly reduce the concentration in the lower water layers.
2.4.3 Influence of clearance activity on velocity parameters
The shear velocity values could only be estimated for boundary layers over a smooth
surface, due to the fact that for calibration of the IMAR flume only measurements over the
flat bottom were available. The results for the NIOO-flume show that the actual values of u*
over the cockles were 70% to 190% higher than over a smooth surface (Fig. 2.5). The fact

PART II – INTERACCTION BETWEEN Cerastoderma edule AND SEDIMENT DYNAMICS
56
that u* over bare sediment was increased in comparison to the flat flume bottom is certainly
due to increased bottom roughness (Fig. 2.6). The cockles may have increased the physical
roughness slightly, but visual inspection of the sediment did not reveal very clear differences
with the bare sediment. The increased shear velocity and the highly increased estimates for z0,
are almost certainly due to the effect of the clearance activity of the cockles. André et al.
(1993) have shown that a free-stream velocity of 15 cms-1 caused a deflection of C. edule
excurrent that reached a height of less than 1cm above the sediment, 10 cm downstream of the
siphons. The in/exhalent jets interacting with the flow, create additional roughness elements
and turbulence (Ertman and Jumars, 1988). Van Duren et al. (2005) found similar effects in
mussels, with relatively larger effects at higher flow velocities.
The positive relationship between CR and u* (F1,9=7.4780; p<0.02), can not be
understood as the effect of CR on u*, as it reflects both the effect of CR on u* and the effect of
velocity on CR. Therefore, the effect of each parameter on the other is interrelated and can not
be dissociated in these experiments. Maybe, the use of inactive cockle-beds (containing shells
without organisms, in order to prevent clearance) could be a way to access the additional
effect of clearance activity.
2.5 Conclusions
Comparisons of results obtained in different flumes should not be based on current
velocity estimations because the structure of the BBL may vary considerably, as observed in
the two flumes used in this work. For this purpose it is better to base comparisons on shear
velocity, which is a better indicator of the BBL structure.
Both flumes showed limitations at different levels. We recommend for future studies
that the choice of the flume type should be based on the objectives of the intended
observations. The hydrodynamic conditions in the annular flumes are rather different from the
field situation, but these flumes are logistically much easier to work with. Provided that the
hydrodynamic conditions are well characterised, the conclusions regarding effects from
different hydrodynamic treatments should still be valid. However, for an assessment of the
effects that cockles have on boundary layer hydrodynamics, it is desirable to use a flume with
boundary layer conditions that resemble the field more closely. For such research a relatively
large flume with a straight working section is preferable.
As observed for other bivalves, the clearance activity of C. edule showed a unimodal
response to increased shear velocities, with a turning point between 3.5 and 5.3 cm s-1.

Chapter 2 - Clearance rates of Cerastoderma edule under increasing current velocity
57
The reduction of flow speed in the benthic boundary layer was already reported for
mussels (Butman et al., 1994; Green et al., 1998; Nikora et al., 2002). It is important to stress
that the effect of epibenthic organisms in the boundary layer is dominated by roughness
produced by the protuberance of their shells, and it is different from the effect of endobenthic
organisms. Although endobenthic organisms do not produce considerable physical roughness,
it was shown in this work that they are able to influence the velocities near the bed. This
effect of C. edule should be clarified in order to understand the direct effect of clearance on
turbulence and its indirect effect on roughness.
This work suggests that C. edule has two types of interactions with sediments
dynamics. Firstly, cockles reduce the velocities near the bed, with possible consequences in
the particle erosion/deposition pattern. The cockle density used in this work is low in relation
to densities found in the Wadden Sea and in the Westerschelde estuary (Kamermans, 1993;
Ysebaert and Herman, 2002). Presumably, in higher densities the reduction effect would be
even more significant. Secondly, cockles transform loose suspended particles into particles
packed as faeces or aggregated as pseudofaeces. Faecal material from molluscs tends to have
very different erosion thresholds from sediment particles (Orvain et al., 2003). In addition, C.
edule is also able to remove from the water column and ingest particles up to 500 µm size
(Karlsson et al., 2003), thereby influencing the near-bed composition of suspended material.
The interrelation between bivalves and hydrodynamics needs further developments in
order to understand water transport processes. CR are not only influenced by hydrodynamics
but also by other parameters such as the quality and quantity of suspended matter and it is
important to integrate these effects in order to comprehend the effect of cockle beds in
sediment dynamics.
2.6 Acknowledgments
The authors thank Katrijn Baetens for the CFX simulations and Luis Fernandes for
access to velocity data measurements in the IMAR10-UNL flume. Also to Pieter van Rijswijk
for assistance with the use of the Coulter Counter Multisizer II. We are grateful to Peter
Herman for constructive criticism and discussions as well as to Judi Hewitt and the anonymous
reviewer. S. Fernandes was funded by Foundation for Science and Technology (Portugal)
fellowship SFRH/BD/6188/2001. This is publication 3635, NIOO-KNAW Netherlands
Institute of Ecology.

PART II – INTERACCTION BETWEEN Cerastoderma edule AND SEDIMENT DYNAMICS
58
2.7 References
Ackerman, J.D., 1999. Effect of velocity on the filter feeding of dreissenid mussels (Dreissena polymorpha and Dreissena bugensis): implications for trophic dynamics. Canadian Journal of Fisheries and Aquatic. Science. 56, 1551-1561
Amos, C.L., Bergamasco, A., Umgiesser, G., Cappucci, S., Cloutier, D., DeNat, L., Flindt, M., Bonardi, M., Cristante, S., 2004. The stability of tidal flats in Venice Lagoon-the results of in-situ measurements using two benthic, annular flumes. Journal of Marine Systems 51, 211-241
Amos, C.L., Sutherland, T.F., Cloutier, D., Patterson, S., 2000. Corrasion of a remolded cohesive bed by saltating littorinid shells. Continental Shelf Research 20, 1291-1315
Amos, C.L.,Grant, J., Daburn, G.R., Black, K., 1992. Sea Carrousel- a benthic, annular flume. Estuarine Coastal and Shelf Science 34, 557-577
André, C., Jonsson, P.R., Lindegarth, M., 1993. Predation on settling bivalve larvae by benthic suspension feeders: the role of hydrodynamics and larval behaviour. Marine Ecology Progress Series 97, 183-192
Black, K., Cramp, A., 1995. A device to examine the in situ response of intertidal cohesive sediment deposits to fluid shear. Continental Shelf Research 15, 1945-1954
Butman, C.A., Fréchette, M., Geyer, W.R., Starczak, V.R., 1994. Flume experiments on food supply to the blue mussel Mytilus edulis L. as a function of boundary-layer flow. Limnology and Oceanography 39, 1755-1768
Coughlan, J., 1969. The estimation of filtering rate from the clearance of suspensions. Marine Biology 2, 356- 358
Englund, V.P.M., Heino, M.P., 1996. Valve movement of the freshwater mussel Anodonta
anatina: a reciprocal transplant experiment between lake and river. Hydrobiologia 328, 49-56
Ertman, S.C., Jumars, P.A., 1988. Effects of bivalve siphonal currents on the settlement of inert particles and larvae. Journal of Marine Reseach 46 (4), 797-813
Fernandes, S., 2001. Efeitos da bioturbação na ressuspensão de sedimentos estuarinos – ensaios num canal circular. M.Sc. Thesis. Instituto Superior Técnico/ Universidade Técnica de Lisboa, unpublished.
Fernandes, S., Sobral, P., 2001. Efeito do aumento da velocidade da corrente na taxa de filtração e eficiência de absorção de alimento em Cerastoderma edule. Resultados preliminares. Revista de Biologia (Lisboa) 19, 63-70
Finelli, C.M., Hart, D.D., Fonseca, D.M., 1999. Evaluating the spatial resolution of an acoustic Doppler velocimeter and the consequences for measuring near-bed flows. Limnology and Oceanography 44, 1793-1801
Fukuda, M.S., Lick, W., 1980. The entrainment of cohesive sediments in freshwater. Journal of Geophysical Research, 85, 2813-2824
Green, M.O., Hewitt, J.E., Thrust, S.F., 1998. Seabed drag coefficient over natural beds of horse mussels (Atrina zelandica). Journal of Marine Research. 56: 613-637
Hawkins, A.J.S., Bayne, B.L., Bougrier, S., Héral, M., Iglesias, J.I.P., Navarro, E., Smith, R.F.M., Urrutia, M.B., 1998. Some general relationships in comparing the feeding physiology of suspension- feeding bivalve molluscs. Journal of Experimental Marine Biology and Ecology. 219, 87-103
Ibarrola, I., Etxeberria, M., Iglesias, J.I.P., Urrutia, M.B., Angulo, E., 2000. Acute and acclimated digestive responses of the cockle Cerastoderma edule (L.) to changes in the food quality and quantity II. Enzymatic, cellular and tissular responses of the digestive gland. Journal of Experimental Marine Biology and Ecology. 252, 199-219

Chapter 2 - Clearance rates of Cerastoderma edule under increasing current velocity
59
Iglesias, J.I.P., Urrutia, M.B., Navarro, E., Alvarez-Jorna, P., Larretxea, X., Bougrier, S., Heral M., 1996. Variability of feeding processes in the cockle Cerastoderma edule (L.) in response to changes in seston concentration and composition. Journal of Experimental Marine Biology and Ecology. 197, 121-143
Kamermans, P., 1993. Food limitation in cockles (Cerastoderma edule (L.)): influences of location on tidal flat and of nearby presence of mussel beds. Netherlands Journal of Sea Research. 31, 71-81
Karlsson, Ő., Jonsson, P.R., Larsson, A.I., 2003. Do large seston particles contribute to the diet of the bivalve Cerastoderma edule? Marine Ecology Progress Series. 261, 161-173
Lenihan, H.S., Peterson, C.H., Allen, J.M., 1996. Does flow speed also have a direct effect on growth of active suspension-feeders: An experimental test on oysters. Limnology and Oceanography. 41, 1359-1366
Møhlenberg, F., Riisgård, H.U., 1978. Efficiency of particle retention in 13 species of suspension feeding bivalves. Ophelia. 17, 239-246
Monismith, S.G., Koseff, J.R., Thompson, J.K., O’Riordan, C.A., Nepf, H.M., 1990. A study of model bivalve siphonal currents. Limnology and Oceanography. 35, 680-696
Navarro, J.M., Widdows, J., 1997. Feeding physiology of Cerastoderma edule in response to a wide range of seston concentrations. Marine Ecology Progress Series. 152, 175-186
Newell, C.R., Wildish, D.J., MacDonald, B.A., 2001. The effect of velocity and seston concentration on the exhalant siphon area, valve gape and filtration rate of the mussel Mytilus edulis. Journal of Experimental Marine Biology and Ecology. 262, 91-111
Nikora, V., Green, M.O., Thrust, S.F., Hume, T.M., Goring, D., 2002. Structure of the internal boundary layer over a patch of pinnid bivalves (Atrina zelandica) in an estuary. Journal of Marine Research 60, 121-150
O’Riordan, C.A., Monismith, S.G., Koseff, J.R., 1995. The effect of bivalve excurrent jet dynamics on mass transfer in a benthic boundary layer. Limnology and Oceanography 40, 330-344.
Orvain, O., Le Hir, P., Sauriau, P.-G., 2003. A model of fluff layer erosion and subsequente bed erosion in the presence of the bioturbator, Hydrobia ulvae. Journal of Marine Research. 61, 823-851
Riisgård, H.U., Kittner, C., Seerup, D.F., 2003. Regulation of opening state and filtration rate in filter-feeding bivalves (Cardium edule, Mytilus edulys, Mya arenaria) in response to low algal concentration. Journal of Experimental Marine Biology and Ecology. 284, 105-127
Riisgård, H.U., 2001. On measurements of filtration rates in bivalves - the stony road to reliable data: review and interpretation. Marine Ecology Progress Series. 211, 275-291
Rossi, F., Herman, P.M.L., Middleburg, J.J., 2004. Interspecific and intraspecific variation of δ13C and δ15N in deposit - and suspension- feeding bivalves (Macoma balthica and Cerastoderma edule): Evidence of ontogenic changes in feeding mode of Macoma
balthica. Limnology and Oceanography. 49, 408-414 Sauriau P-G, Kang C-K. 2000. Stable isotope evidence of benthic macroalgae-based growth
and secondary production in the suspension feeder Cerastoderma edule (Mollusca, Bivalvia) in the Marennes-Oleron Bay. Hydrobiologia. 440, 317-329
Smaal, A.C., Haas, H.A., 1997. Seston dynamics and food availability on mussel and cockle beds. Estuarine Coastal Shelf Science. 45, 247-259
Sobral, P., Widdows, J., 2000. Effects of increasing current velocity, turbidity and particle-size selection on the feeding activity and scope for growth of Ruditapes decussates from Ria Formosa, southern Portugal. Journal of Experimental Marine Biology and Ecology. 245, 111-125

PART II – INTERACCTION BETWEEN Cerastoderma edule AND SEDIMENT DYNAMICS
60
Thompson, C.E.L., Amos, C.L., Lecouturier, M., Jones, T.E.R., 2004. Flow decelaration as a method of determining drag coefficient over roughened flat beds. Journal of Geophysical Research. 109, C03001
Van Duren, L. A., Herman, P. M. J., Sandee, A. J. J., and Heip, C. H. R., 2006. Effects of
mussel filtering activity on boundary layer structure. Journal of Sea Research. 55, 3-14
Vincent, B., Desrosiers, G., Gratton, Y., 1988. Orientation of the infaunal bivalve Mya
arenaria L. in relation to local current direction on a tidal flat. Journal of Experimental Marine Biology and Ecology. 124, 205-214
Ward, J.E., Sanford, L.P., Newell, R.I.E., MacDonald, B.A., 1998. A new explanation of particle capture in suspension-feeding bivalve molluscs. Limnology and Oceanography. 43, 741-752
Widows, J., Lucas, J.S., Brinsley, M.D., Salkeld, P., Staff, F.J., 2002. Investigation of the effects of current velocity on mussel feeding and mussel bed stability using an annular flume. Helgoland Marine Research. 56, 3-12
Widdows, J., Brinsley, M.D., Bowley, N., Barret, C., 1998. A benthic annular flume for in situ measurement of suspension feeding/biodeposition rates and erosion potential of intertidal cohesive sediments. Estuarine Coastal Shelf Science. 46, 27-38.
Wildish, D.J., Miyares, M.P., 1990. Filtration rate of blue mussels as a function of flow velocity: preliminary experiments. Journal of Experimental Marine Biology and Ecology. 142, 213-219
Yang, Z., Baptista, A., Darland, J., 2000. Numerical modeling of flow characteristics in a rotating annular flume. Dynamics of Atmospheres and Oceans. 31, 271-294
Ysebaert, T., Herman, P.M.J., 2002. Spatial and temporal variation in benthic macrofauna and relationships with environmental variables in an estuarine, intertidal soft-sediment environment. Marine Ecology Progress Series. 244, 105-124
Ysebaert, T., Meire, P., Herman, P.M.J., Verbeek, H., 2002. Macrobenthic species response surfaces along estuarine gradients: prediction by logistic regression. Marine Ecology Progress Series. 225, 79–95

PART IIINTERACCTIONS BETWEEN
AND SEDIMENT DYNAMICS
How cockles change the benthic boundary
layer: density effects on topography and
turbulence
Cerastoderma edule
Chapter 3


Chapter 3 – How Cerastoderma edule change the benthic boundary layer
63
HOW COCKLES CHANGE THE BENTHIC BOUNDARY LAYER:
DENSITY EFFECTS ON TOPOGRAPHY AND TURBULENCE
S. Fernandes, L. A. van Duren, D. van der Wal, F. Orvain, P. M. J. Herman
To be submited to Marine Ecology Progress Series
Abstract
Cockle beds reduce current velocities in the benthic boundary layer (BBL). This may result from their
influence on microtopography or from siphonal feeding currents. To discriminate between and to
quantify these two effects, two experiments were performed in a racetrack flume under free-stream
current velocities (U) from 5 to 40 cm s-1. The first focused on the effect of Cerastoderma edule on
the BBL, using two densities (500 and 1000 ind m-2) of live and artificial cockle beds with similar
topographic roughness. The second focused the effect of feeding activity of live cockle beds (280 ind
m-2) in the BBL parameters. Microtopography, estimate as roughness height (k), was quantified using
laser beam projections on the sediment surface and subsequent image analysis. BBL parameters such
as U, shear velocity (u*), hydrodynamic roughness length (z0) and turbulent kinetic energy (TKE)
were calculated from ADV measurements of velocity profiles. Feeding activity was quantified as
clearance rates (CR). Increasing density of cockles had an increasing effect on topographic element
height (k). Hydraulic roughness was predominantly influenced by k. TKE, in contrast, was not related
to topographic or hydrodynamic roughness but was higher in treatments with live cockles. The effect
of live cockles on TKE was positively related to CR. Exhalent jets had more pronounced effects at
low velocities (u* < 1 cm s-1), as observed in the first experiment. In conclusion, cockle beds reduce
velocities in the BBL by increasing topographic roughness and in addition, by increasing turbulence
through production of siphonal currents.
Key-words: bedforms, Cerastoderma edule, filtration activity, flumes, hydrodynamics, roughness, shear
velocity, turbulence kinetic energy.

PART II – INTERACCTION BETWEEN Cerastoderma edule AND SEDIMENT DYNAMICS
64
3.1 Introduction
The hydrodynamic processes in the benthic boundary layer (BBL) for static non-
living systems are relatively well known. The passage of flow over the bed surface produces
a velocity gradient reflecting the loss of momentum from the flow to the bed. The seabed
incurs two types of drag on the flow: friction drag, resulting from the fact that viscosity cause
water to resist deformation, and form drag. The latter only occurs over bed structures which
are sufficiently large to cause wake formation behind the structures.
According to Prandtl von Karman equation or “law of the wall” the BBL is
characterized by a vertical gradient of velocity (u) dependent on shear velocity (u*) as
following:
z
u
z
u 1*
κ=
∂
∂ [1]
where u is the current velocity, κ is the von Karman’s constant (≈0.4) and z is the distance
above the bed. The description of u* for a well developed boundary layer only formed by
friction drag is obtained after integration of Eq. [1] as:
*
0
lnκ
=z
u zu
z [2]
where uz is the velocity at height z, and z0 the hydrodynamic roughness length. In theory, the
square of the shear velocity (u*)2 is directly proportional to momentum transfer in the
boundary layer and to turbulence production (Kim et al 2000).
Although there is an attempt to include natural phenomena such as topographic
variability in hydrodynamic models, present hydrodynamic models are inaccurate in
simulating flow over biogenic structures (Zhang et al. 2004, Pilditch & Miller 2007). Some
studies quantified the effect of topographic roughness on hydrodynamic parameters,
concerning different shapes and densities of roughness elements (Wooding et al. 1973) or
beds with different median grain sizes and patches (Lawless & Robert 2001; Thompson et al.
2004).
Measurements over natural beds are still few, and most of the present hydrodynamic
models are not sufficiently calibrated for certain local parameters such as multi-scale
physical roughness, interaction with animal generated flow or flexible structures. All of these
will have an impact on boundary layer properties, such as shear velocity, and ultimately on
particle dynamics in the near-bed layer. In many boundary layers over biogenic structures the

Chapter 3 – How Cerastoderma edule change the benthic boundary layer
65
relationship between topographical roughness and hydrodynamic roughness is still ill
defined.
Some studies focused on the effect of epibenthic bivalves, protruding from the
sediment surface, thus changing surface roughness and the structure of the BBL (Butman et
al. 1994, Nikora et al. 2002). Their effect is characterised by decreasing the drag coefficient
and uplifting the BBL (Green et al. 1998). Monismith et al. (1990) and O’Riordan et al.
(1993) studied the effect of siphonal incurrent-excurrent flow fields on the properties of a
turbulent boundary layer in relation to the depletion of phytoplankton. However, these
studies were performed with artificial siphons, or based on numerical simulations and did not
include live organisms, nor the effect of current velocity on the filtration activity and the
consequent production of siphonal currents. The study by Van Duren (2006) measured flow
profiles over a flat bed, inactive mussels and actively filtering mussels. This study indicated
that the siphonal currents, combined with the very rough structure of the bed appeared to
cause a decoupling between the theoretical fixed relationship between u*, TKE and Reynolds
stress ( ' 'u w ).
Little is known about the effect of endobenthic bivalves in the BBL. Although the
cockle Cerastoderma edule live inside the sediment, and therefore has limited effect on
topographical roughness, it is known to reduce current velocities near the bed (Ciutat et al.
2007, Fernandes et al. 2007). C. edule exists in average densities of up to 1000 ind m-2 and at
maximum ebb current velocity of up to 60 cm s-1 in the Schelde Estuary (Ysebaert and
Herman, 2002). Has the highest probability of occurrence at ambient flow velocities of about
30 to 40 cm s-1 (Ysebaert et al. 2002), which corresponds to u* of 2 to 3 cm s-1 in the NIOO
flume, where the present experiments were performed. Increasing density of C. edule (up to
312 ind m-2) is related to increased erosion rates of muddy sediments from the Tamar estuary
(Ciutat et al. 2007). In Ciutat et al. (2007) and in a previous study on the effect of current
velocity on the filtration activity (using clearance rates as proxy) of C. edule (Fernandes et al.
2007), we observed in the presence of cockles, reduced current velocities near the bed that
were related to higher values of roughness length, shear velocity and turbulence.
It was not clear from the these experiments whether the observed reductions in
current velocity near the bed and higher turbulence profiles were due to C. edule effects on
topography, due to their filtration activity, or both. In order to differentiate between these two
effects, a first experiment was performed to compare the hydrodynamic conditions between
natural cockle beds and artificial beds. More precisely, turbulence profiles were compared

PART II – INTERACCTION BETWEEN Cerastoderma edule AND SEDIMENT DYNAMICS
66
between natural beds with live cockles and artificial cockle beds, with different topographic
roughness levels. Considering that there is no effect of filtration in the latter case, effects on
artificial beds can only be due to increasing topographical roughness in the BBL. A second
experiment exploring the relationship between pumping activity (using clearance rates as a
proxy) and additional turbulence was performed.
3.2 Materials and methods
3.2.1 Experiment 1: Comparison of the effect of live and artificial cockle beds on
microtopography and turbulence
3.2.1.1 Sediment and organisms collection
The cockle C. edule and intertidal estuarine cohesive sediments (top first 2 cm) were
collected in Paulinapolder (Westerschelde estuary, Netherlands) during low tide in April
2004. The organisms (average size and weight: 2.9 cm ± 0.2 (± standard deviation) and 0.18
g ± 0.04, n = 30) were brought to the laboratory and allowed to acclimate for about 2 weeks
in an outdoor tank (area of about 8 m2) with daily renewed seawater from the Oosterschelde
(filtrated on a 0.5 mm mesh) before being introduced in the experimental sediment.
Sediment was defaunated by manually removing bivalves, polychaetes and larger
shell fragments. The grain size was measured with a laser particle sizer (Malvern 6000 Hydro
200G Mastersize I). The < 63 µm fraction accounted for 38 % of total particles and median
grain size was 143 ± 4 µm. Sediment was characterised as 1.3 % organic matter ± 0.2; 28.4
% water ± 5.6 and sediment dry bulk density of 2.0 g cm-3 ± 0.3. These values were obtained
on sediment samples dried at 60 °C for 96 h and later incinerated at 450 °C for 5h.
3.2.1.2 Experimental design and flume runs
Flume boxes (1 m length x 0.23 m weight x 0.14 m height) were filled with sediment.
3 treatments (in duplicate) were prepared with a medium density of C. edule (M, 500 ind m-
2), another with a high density (H, 1000 ind m-2) and a control with sediment and without
organisms (C). All sediment boxes were left to stabilise for a period of 10 days in the outdoor
tank.
Artificial cockle beds were prepared using empty cockle shells that were randomly
glued on PVC boards (same surface area as the flume boxes) using 500 ind m-2 and 1000 ind

Chapter 3 – How Cerastoderma edule change the benthic boundary layer
67
m-2 densities. As the emergence of live cockles in natural treatments was not controlled, the
artificial treatments were prepared in order to obtain a wide range of roughness that would
include the one in the live treatments (M and H). These boards were introduced in the flume
boxes and successively covered with sediment in order to obtain 3 different roughness levels
(T2, T3, T4), each accounting as a new treatment (Figure 3.1).
Each flume box was introduced individually in the NIOO racetrack flume test section
that is placed in the last 2 m of one of the straight sections (Table 3.1). To avoid edge effects
on bed roughness, especially where the sediment adjoined the upstream and downstream
sides of the flume test section, care was taken to ensure that the sediment surface was exactly
flush with the surrounding surface. The flume was filled with filtered water from the
Oosterschelde estuary with a salinity of 29. Each treatment was then exposed to stepwise
increasing current velocities (from 5 to 40 cm s-1).
Figure 3.1 – Side-view of the artificial cockle beds using the two density of shells M (500 ind m-2) and H (1000 ind m-2) and the three roughness levels, T4 being the roughest and T2 the smoothest. The distance between two crosses of the white board is 5 cm.
M
(500 ind m-2)
H
(1000 ind m-2)
T2
T3
T4
M
(500 ind m-2)
H
(1000 ind m-2)
T2
T3
T4

PART II – INTERACCTION BETWEEN Cerastoderma edule AND SEDIMENT DYNAMICS
68
Table 3.1 - Flume characteristics
Flume type Racetrack
Flume area (m2) 21.2
Length straight section (m) 11.7Width of experimental section (m) 0.6
Experimental section area (m2) 0.9
Current velocity range (cm s-1
) 0 - 40Sediment depth (cm) 14Water volume (l) 8850Water column (cm) 40
3.2.1.3 Topography analysis
The measurements of topographical roughness were based on image analysis of
pictures from laser beam projections in the sediment. At the end of each velocity step, the
carriage where the ADV was mounted was driven out of the test section and the flow was
stopped to allow still water conditions and to avoid water movement interferences in the
picture capture of the bottom. Laser beams were then projected onto the sediment surface in
the test section using a construction laser level, placed parallel to the flume length and
reaching the full length of the test section. A thin scaled board (5 cm mesh) was previously
placed around the test section for subsequent georeferencing of the pictures. The inclination
angle was adjusted in order to obtain different projection lines separated by a distance of
about 5 cm. Several pictures were then taken from a fixed camera mounted on an upper
platform, set perpendicularly to the laser projections.
The images from the laser lines were analysed with image enhancement techniques to
reinforce the red colour of the laser profiles and exclude other colours in the images. Using
the scaled board placed in the bottom of the test section, the images were georeferenced
using Arc View software. Topographic profiles, with a value of height every 0.5 mm along
the transect were then extracted. Each profile was detrended by subtracting a best fit second
order polynomial, followed by a conversion to actual height, based on a calibration using
objects with a known (measured) height. The data were smoothed using a five points moving
median filter. The resulting topographic profiles are expressed in Fig. 3.2.

Chapter 3 – How Cerastoderma edule change the benthic boundary layer
69
C
M
H
T2H
T3H
T4H
T2M
T3M
T4M
live
arti
ficia
l
60 cm
C
M
H
T2H
T3H
T4H
T2M
T3M
T4M
live
arti
ficia
l
60 cm
Figure 3.2 - Topographic profiles obtained in the natural an artificial treatments for the two density of C. edule: M (500 ind m-2) and H (1000 ind m-2) and the three roughness levels, T4 being the roughest and T2 the smoothest.
A topographical line can be considered as a succession of elements, resulting from
unevenness of the sediment and from the effect of (buried) cockles. A Fast Fourier
Transform (FFT) allows decomposing a waveform into sinusoids of different frequencies
(Legendre & Legendre, 1998). The technique was applied to cut the topographic line into
short segments, with one segment separating two elements:
∑=
−−
−
=N
n
nfN
j
enxfX1
)1)(1(.2.
).()(
π
, 1≤ f≤ N [3]
The variable x(n) is the topographic height at a distance and the transformed Fourier of this
series will be denoted X(f) with N samples. In order to recover all Fourier components of a
periodic waveform, it is necessary to use a sampling rate at least twice the highest waveform
frequency. The Nyquist frequency, is the highest frequency that can be coded at a given

PART II – INTERACCTION BETWEEN Cerastoderma edule AND SEDIMENT DYNAMICS
70
sampling rate in order to be able to fully reconstruct the signal. The period (1/fniquist) gives a
good estimate of the distance d between each element. The amplitude of the topography
within each segment of distance d was calculated and the averaged amplitude of all peaks
within a topographical line was estimated. The element height (k) of each line was estimated
as half of the average amplitude. The average k of each treatment and under different current
velocities (only for C, M and H) was estimated from about 10 topographical profiles.
When considering the topographical profiles measured in all treatments, the standard
deviation of all values of height of each topographical profile (root-mean-square height,
RMS) was positively correlated to k (Pearson product moment correlation (PPMC), n = 192,
r = 0.843, p < 0.001). Because the characterisation of surface roughness is more meaningful
as a measure of element height, rather than the RMS, topographical roughness is therefore
based on the element height (k).
3.2.1.4 Hydrodynamic analyses
Hydrodynamic measurements were performed with a Nortek ADV (Acoustic Doppler
velocimeter, measuring at 25 Hz, sample volume at 5 cm below the transmit beam), mounted
on an automated 3D positioning system, on a carriage, which can be positioned anywhere
along the working section of the flume. After flow stabilisation at each velocity step (20
min), 8 velocity profiles (within a surface area of 8 cm2) were measured 60 cm downward the
test section, For each velocity profile, 12 velocity measurements were taken from 0.5 cm
above the surface, through 24 cm of water height, with a vertical resolution of 0.8 cm. Each
measurement lasted 5 seconds. Measurements done at 5 mm height were eliminated because
they clearly deviated from the linear (ln transformed) relationship between flow velocity and
distance from the bottom and some of these measurements suggested interference due to the
proximity to the bed.
u* was determined according to Eq. [2], from the slope of the logarithmic velocity
profile (u (z) versus ln (z)). Average values of u* were calculated from 8 sub-profiles. z0 can
be estimated from the intercept between the relation (u(z) versus ln (z)) and the Y-axis (Eq.
[2]). However, considerable errors arise with the application of this procedure because the
value of the intercept is extremely sensitive to the velocity gradient (Thompson et al. 2003;
Pope et al. 2006).

Chapter 3 – How Cerastoderma edule change the benthic boundary layer
71
When integrated over the entire water depth, Eq. [1] can be integrated as following:
=
0
*
.ln
ze
huu
κ [4]
where u is the vertically averaged velocity, h is the water column height and ∫=h
z
uh
u
0
1.
After transformation, this can be written as:
1.
0
.* ee
hz
u
u
=
κ
[5]
The ratio *uu is equal to a, the slope of the function *.uau = +b, considering that the
constant b = 0. Because it is based on the calculation of a slope instead of an intercept with
Y-axis, this method yields a more robust estimation of roughness length. For each bed
roughness and for each velocity step, z0 was determined with the average values (from 8 sub-
profiles) of u and u*.
Turbulent kinetic energy (TKE) or the intensity of velocity fluctuations was
calculated from the average standard deviation (‘) of the three components of velocity (u, v,
and w) as: ( )222 '''2
1wvuTKE ++= [6]
In order to compare the values of TKE obtained over the column height, to other
parameters, TKE was averaged from the first 6 cm above the bed (measurements at 6
heights) for each sub-profile. The TKE of each treatment was based on averages from 8 sub-
profiles. In order to remove the effect of current velocity on TKE, TKE was normalised as
TKEU2 = TKE / U2, being U the free-stream current velocity at 18 cm above the bed. TKEU2
is undimensional.
3.2.2 Experiment 2: Relationship between filtration activity and turbulence
The measurements of filtration activity were not possible during experiment 1,
because resuspended muddy sediments and particles within would bias the cell counting for
further calculation of clearance rates. Exp. 2 is a re-analysis of data published in Fernandes et
al. 2007, where experimental details are given. Clearance rates (CR) were measured in the
same flume during another experimental series using sandy sediments (grain diameter = 750
µm). Full details of the experiment are given by Fernandes et al. (2007) where CR were
compared as a function of current velocity in two different flumes. Three flume runs were

PART II – INTERACCTION BETWEEN Cerastoderma edule AND SEDIMENT DYNAMICS
72
performed using 3 groups of organisms (n = 260 on each group) from a population of cockles
(280 ind m-2, average shell length and weight of 26 cm ± 2 and 0.16 g ± 0.01) from the same
collection area.
Each flume run was done under 5 steps of increasing velocity from 5 to 40 cm s-1.
Velocity measurements were taken following the same methodology as described before, but
velocity steps were increased every 4 hours (to allow filtration activity measurements)
instead of 1 hour for experiment 1. Velocity parameter calculations followed the
methodology described in experiment 1. The seawater temperature varied between 15 and 16
°C and salinity was of 29. A culture of Isocrysis galbana was added, (about 16000 cell ml-1)
corresponding to initial concentrations of 0.831 ± 0.319 mg Chlorophyll a m-3. The filtration
activity of the bed was measured as the clearance rates of a population of 280 ind m-2
(CR280). It was estimated using the cell depletion method (Coughlan 1969) based on the
measurement of the volume of water cleared of suspended microalgae per unit of time (see
details in Fernandes et al. 2007) and subtraction of the CR observed in a control treatment
without organisms. Individual clearance rates (CRind) were then estimated by dividing the CR
for the population by the 260 individuals.
The current speed of in/exhalant currents/jets (uj, cm s-1) was estimated as uj = CRind /
A, considering Cind (ml s-1 = cm3 s-1) and A the area of the siphons (cm2). According to the
relationship between the diameter of the siphon of C. edule and the organism shell width
(Riisgård et al. 2003) the diameter of the siphons of the organism used in that experiments
averaged 0.338 cm (for the exhalant) and 0.416 cm (for the inhalant) which correspond to a
siphon area of 0.090 cm2 and 0.136 cm2 respectively. Jet-in-cross-flow length scale (zm) was
defined by List (1982) as the relative influence of the exhalant jets on the crossflow.
According to List (1982): zm = uj dj / U, where dj is the exhalant siphon diameter. This
provides an estimation of the ratio between the exhalent jet and the longitudinal flow.
3.3. Results
3.3.1. Experiment 1: Comparison of live and artificial cockle beds on microtopography
and turbulence
3.3.1.1. Effects of C. edule on topographical roughness
In comparison to control treatments (C), the density of live cockle beds (M and H)
produced significant changes on the microtopography (Analysis of Covariance (ANCOVA),

Chapter 3 – How Cerastoderma edule change the benthic boundary layer
73
F2.134 = 29.4; p < 0.001, all statistical analysis was performed using STATISTICA 6.1
software (α = 0.05)). Topographic roughness (k) was significantly higher in the treatments
with the highest density of live C. edule (H) compared to the medium density (M, p < 0.001)
but there was no difference between M and the control C (Table 3.2). The increase in current
velocity had no significant effect on k, which remained almost constant over the increasing
velocities (Fig. 3.3). The overall averages of k in each treatment were 0.21 cm in C, 0.25 cm
in M and 0.34 cm in H (Table 3.2).
0
0.1
0.2
0.3
0.4
0.5
0.6
0 10 20 30 40
U (cm s-1)
k
(cm)
C
M
H
Figure 3.3 – Cerastoderma edule changes in topographical roughness, measured as element height (k, cm), over increasing free-stream velocities (u*, cm s-1) for the natural treatments. Lines refer to linear regressions for each treatment as: black broken line (C, control), solid grey line (M, 500 ind m-2) and solid black line (H, 1000 in m-2).
Topographic roughness in live treatments (M and H) was similar to some of the
artificial treatments (T treatments, Table 3.2). ANCOVA analysis of k in all treatments
showed that according to homogeneous grouping (Tukey test), M is statistically comparable
to T2M and T2H and H to T2M and T3H. Since the objective of this study was to access the
additional effects of filtration activity on turbulence, the comparison between live and
artificial (with no filtration activity) treatments only considered sediments with comparable
topographical roughness (M, H, C, T2M, T2H, T3H).

PART II – INTERACCTION BETWEEN Cerastoderma edule AND SEDIMENT DYNAMICS
74
Table 3.2 – Topography characterised by the elements height (k, cm, ± standard deviation, n ~10) and by roughness length (z0, cm) in all treatments (C for control (n=10), treatments with live C. edule (n=10): M for 500 ind m-2 density and H 1000 ind m-2 and for the artificial treatments (n=5), the highest roughness level T4 until the lower roughness level T2 for densities M and H). Relationships between hydrodynamic parameters: shear velocity (u*, cm s-1), free-stream velocity (U, cm s-1) and turbulence kinetic energy (TKE, cm2 s-2) (n=10 in C, M and H and n=5 in T treatments) and normalised TKE (TKEU).
Exp. 1 a b R2
a b R2
C 0.21 ± 0.06 0.02 ± 0.01 0.0513 1.0065 0.99 0.0109 1.7310 0.99 0.005 ± 0.002
T2 H 0.21 ± 0.06 0.15 ± 0.09 0.1201 0.8478 0.97 0.0136 1.7041 0.99 0.006 ± 0.002
M 0.25 ± 0.09 0.06 ± 0.03 0.0814 0.9070 1.00 0.0206 1.7022 0.97 0.009 ± 0.003
T2 M 0.31 ± 0.06 0.10 ± 0.03 0.0932 0.8894 1.00 0.0173 1.6695 0.99 0.007 ± 0.002
H 0.34 ± 0.10 0.10 ± 0.11 0.0687 0.9910 0.92 0.0280 1.5918 0.97 0.010 ± 0.004
T3 H 0.41 ± 0.05 0.27 ± 0.08 0.0913 0.9987 0.99 0.0056 2.0454 1.00 0.006 ± 0.000
T3 M 0.47 ± 0.15 0.31 ± 0.09 0.1066 0.9469 0.99 0.0130 1.8432 1.00 0.009 ± 0.001
T4 H 0.55 ± 0.17 0.20 ± 0.10 0.0814 0.9070 1.00 0.0316 1.6010 0.99 0.011 ± 0.005
T4 M 0.57 ± 0.13 0.40 ± 0.15 0.1250 0.9250 0.99 0.0075 2.1005 0.99 0.010 ± 0.001
Exp. 2
Ct 0.03 ± 0.01 0.0591 0.9976 1.00 0.0131 1.6952 1.00 0.006 ± 0.001
L 0.12 ± 0.12 0.0752 0.9567 0.87 0.0284 1.6372 0.94 0.011 ± 0.006
TKEU2k z0
u*=aUb
TKE=aUb
Legends: Experiment 1: C for control (n = 10), treatments with live C. edule (n = 10), M for 500 ind m-2 density and H 1000 ind m-2 and for the artificial treatments (n = 5). The lowest roughness level T2 until the highest roughness level T4 for densities M and H. Experiment 2: Ct for control (n = 5) and L for 280 ind m-2 density (n = 10).

Chapter 3 – How Cerastoderma edule change in the benthic boundary layer
75
3.3.1.2 Effects of C. edule on hydrodynamic roughness
The hydrodynamic profiles measured in the treatments with live C. edule (M and H),
systematically showed lower current velocities near the bed in comparison to the controls. As
an example a comparison of profiles for the natural treatments at free-stream current velocity
of ~10 cm s-1 is provided (Fig. 3.4). Similarly, in the artificial treatments reduced velocities
near the bottom were related to increasing roughness. The reduction of velocity in the lower
layers for treatments with increasing roughness resulted in higher shear velocities at the
bottom.
Figure 3.4 – Cerastoderma edule effect in the BBL. Average velocity profiles (u, cm s-1, U of ~ 10 cm s-1) and turbulent kinetic energy profiles (TKE, cm2 s-2, at U of ~ 25 cm s-1). Each profile is an average of 8 individual sub-profiles. Legends as in Fig. 3.3.
The relationship between u* and U (Fig. 3.5) was significantly affected by live C.
edule density in comparison to C (ANCOVA, F2.27 = 5.338, p < 0.05). Analysis among
comparable treatments (C, M, H, T2H, T2M and T3H, see Table 2) showed a positive
relationship between the slope of the linear relationship u*/U and k (Regression, F(1,7) =
11.114, R2 = 0.61, p < 0.01).
0
5
10
15
20
25
30
0 5 10 15
u (cm s-1)
z
(cm)
C
M
H
0
5
10
15
20
25
30
0 1 2 3 4 5 6
TKE (cm2 s
-2)
C
M
H
T2M
T2H
T3H
0
5
10
15
20
25
30
0 5 10 15
u (cm s-1)
z
(cm)
C
M
H
0
5
10
15
20
25
30
0 1 2 3 4 5 6
TKE (cm2 s
-2)
C
M
H
T2M
T2H
T3H
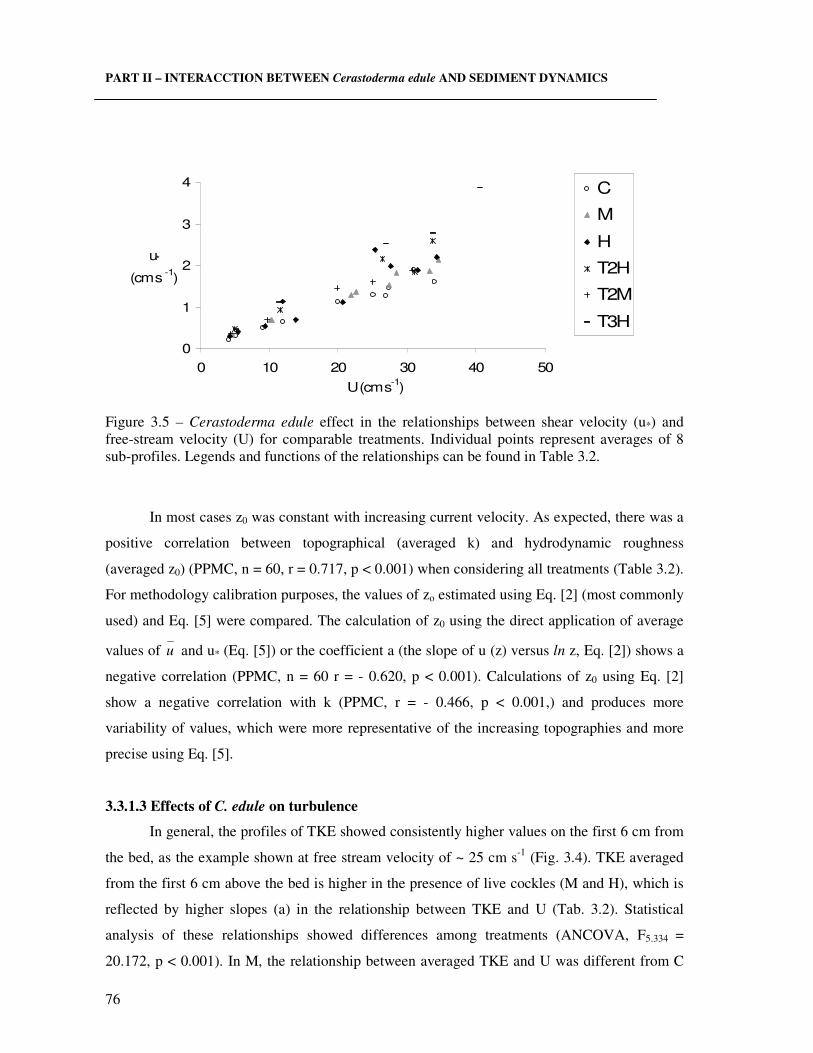
PART II – INTERACCTION BETWEEN Cerastoderma edule AND SEDIMENT DYNAMICS
76
0
1
2
3
4
0 10 20 30 40 50
U (cm s-1)
u*
(cm s -1)
C
M
H
T2H
T2M
T3H
Figure 3.5 – Cerastoderma edule effect in the relationships between shear velocity (u*) and free-stream velocity (U) for comparable treatments. Individual points represent averages of 8 sub-profiles. Legends and functions of the relationships can be found in Table 3.2.
In most cases z0 was constant with increasing current velocity. As expected, there was a
positive correlation between topographical (averaged k) and hydrodynamic roughness
(averaged z0) (PPMC, n = 60, r = 0.717, p < 0.001) when considering all treatments (Table 3.2).
For methodology calibration purposes, the values of zo estimated using Eq. [2] (most commonly
used) and Eq. [5] were compared. The calculation of z0 using the direct application of average
values of u and u* (Eq. [5]) or the coefficient a (the slope of u (z) versus ln z, Eq. [2]) shows a
negative correlation (PPMC, n = 60 r = - 0.620, p < 0.001). Calculations of z0 using Eq. [2]
show a negative correlation with k (PPMC, r = - 0.466, p < 0.001,) and produces more
variability of values, which were more representative of the increasing topographies and more
precise using Eq. [5].
3.3.1.3 Effects of C. edule on turbulence
In general, the profiles of TKE showed consistently higher values on the first 6 cm from
the bed, as the example shown at free stream velocity of ~ 25 cm s-1 (Fig. 3.4). TKE averaged
from the first 6 cm above the bed is higher in the presence of live cockles (M and H), which is
reflected by higher slopes (a) in the relationship between TKE and U (Tab. 3.2). Statistical
analysis of these relationships showed differences among treatments (ANCOVA, F5.334 =
20.172, p < 0.001). In M, the relationship between averaged TKE and U was different from C
Chapter 3 – How Cerastoderma edule change in the benthic boundary layer
77
and T2H (p < 0.001) and T2M (p < 0.01) but comparable to H and T3H (p > 0.05), even if k
was significantly lower on M than H or T3H (Tab. 2). H was different from C, T2M and T3H (p
< 0.001).
As expected, there is a strong correlation between TKE (averaged from the first 6 cm
above the bed) and current velocities: U (PPMC, n = 45, r = 0.909, p < 0.001) and u* (r = 0.882,
p < 0.001), reflecting the dependence of the latter two. There were very weak correlations
between TKE and the roughness parameters k (PPMC, n = 45, r = 0.1689, p > 0.05) and z0 (r = -
0.0018, p > 0.05). This shows that TKE is related to current velocity but does not have a clear
relationship with roughness parameters.
The results of the comparisons between two groups: live (M and H) and others (C, T2H,
T2M, and T3H) showed that the average TKE values were higher in the live treatments
(ANCOVA, F1.43 = 10.731, p < 0.01), while considering the effect of U. These results show that
turbulence is better explained by the presence of cockles than on a topographic basis alone.
The relationship between TKE and U2 (Fig. 3.6) showed good linear fit (Linear
regression, R2 = 0.88 for M, R2 = 0.96 for H and R2 > 0.98 for the other treatments without live
cockles). To remove the effect of current velocity TKE was normalised by U2. The relationship
between TKEU2 and u* (Fig. 3.7) within the treatments was almost constant over increasing
currents, although values were slightly higher under low velocities (u* < 1 cm s-1) for the
treatments with C. edule (M and H). Average values of TKEU2 varied from 0.005 to 0.007 for
the C and T treatments and were higher in the presence of C. edule varying from 0.009 to 0.010
for M and H.
Treatments were organised in two groups: live (M and H) and artificial (C and T
treatments) to evaluate the effect of live cockles, who have a significant increasing effect on
additional turbulence (One-way ANOVA, F1.159=6.408, p < 0.01). TKEU2 was also compared
to k using the live/artificial groups (Fig. 3.8).
The higher values of TKEU2 are better related to the live treatments (ANCOVA, F1.43 =
16.384, p < 0.001) than to k (ANCOVA, F1.43 = 0.892, p > 0.05). These observations strongly
suggests that there is an additional source of turbulence, which is not related to increasing
velocity or to topographical roughness but more with an effect produced by live cockles.

PART II – INTERACCTION BETWEEN Cerastoderma edule AND SEDIMENT DYNAMICS
78
0
2
4
6
8
10
12
0 500 1000 1500 2000
U 2 (cm
2 s
-2)
TKE
(cm 2 s
-2)
C
M
H
T2H
T2M
T3H
Figure 3.6 – Cerastoderma edule effect in the relationships between turbulence kinetic energy (TKE, cm2 s-2) and the square of free-stream velocity (U2) for comparable treatments. Individual points represent averages of 8 sub-profiles. Legends and functions of the relationships can be found in Table 3.2.
0
0.01
0.02
0.03
0 1 2 3 4 5
u* (cm s-1)
TKEU2
C
M
H
T2H
T2M
T3H
Figure 3.7 – Cerastoderma edule effect in the relationships between normalised turbulence kinetic energy (TKEU2) and shear velocity (u*) for comparable treatments. Individual points represent averages of 8 sub-profiles. Legends as in Table 3.2.

Chapter 3 – How Cerastoderma edule change in the benthic boundary layer
79
0.000
0.005
0.010
0.015
0 0.1 0.2 0.3 0.4 0.5
k (cm)
TKEU2
live
art M H
C T2HT2M
T3H
Figure 3.8 - Cerastoderma edule effect in the relationships of normalised TKE (TKEU2) as a function of roughness or element height (k). Treatments are gathered in two groups: one with live C. edule (M and H, ♦) and the second with the treatments without live organisms (C and T treatments, ).
3.3.2. Experiment 2: Relationship between filtration activity and turbulence
The second experiment performed in the same flume and with organisms from the same
site produced similar and comparable results from Exp.1 (Table 3.2). The averaged TKEU2 was
higher in the presence of cockles (One-way ANOVA, F1.135 = 34.836, p < 0.001) in comparison
to control treatments. The relationship between TKE and CRind (Fig. 3.9) measured in the flume
for a density of 280 ind m-2 (a population of 260 organisms), showed that clearance rates has a
significant effect on turbulence (Regression analysis, R2 = 0.53, F1.8 = 8.83, p < 0.05, n = 10).
The analysis of individual siphonal ex/inhalant currents produced in the filtration
activity experiment can provide further insight in the effect of clearance rates in turbulence.
Clearance rates increased with shear velocity up to 1.3 cm s-1, after which they stabilised (Fig.
3.10). Individual clearance rates vary from 0.99 to 3.66 L h-1 ind-1 and exhalant currents varies
from 3.06 to 11.31 cm s-1. The difference between the exhalant and inhalant current resulted in
an upward velocity that is 34% of the exhalant currents. The jet-in-cross-flow length scale (zm)
estimated using the values of exhalent currents varies from 0.23 to 0.07 cm under shear
velocities up to 1.3 cm s-1, after which it stabilises (Fig. 3.10). When zm drops below 0.1 cm, the

PART II – INTERACCTION BETWEEN Cerastoderma edule AND SEDIMENT DYNAMICS
80
effect of siphonal currents can no longer compete with hydrodynamic currents and the
additional effect of cockles becomes less relevant.
R2 = 0.53
0
4
8
12
16
0 1 2 3 4
CR (L h-1ind
-1)
TKE
(cm2 s
-2)
Figure 3.9 - Cerastoderma edule effect on turbulence (TKE averaged in the first 6 cm from the bed) as a function of individual clearance rate (CR) of a population of 280 ind m-2, average shell length and weight of 26 mm ± 2 and 0.16g ± 0.01. Linear regression presented in the figure.
On both experiments the averaged TKEU2 measured over increasing velocities in the
control treatments (C for Exp.1 and Ct for Exp.2) were the lowest and statistically comparable
(0.005 ± 0.002 for C and 0.006 ± 0.001 for Ct, p>0.05, Tukey post-hoc test) (Fig. 3.11). The
averaged TKEU2 was higher in the treatments with 280 ind m-2 (0.011 ± 0.006) in comparison to
treatments with 500 ind m-2 (0.009 ± 0.003) and 1000 ind m-2 (0.010 ± 0.004).

Chapter 3 – How Cerastoderma edule change in the benthic boundary layer
81
0
0.1
0.2
0.3
0.4
0 1 2 3 4
u* (cm s-2)
Zm
(cm)
0
1
2
3
4
CRind
(L h-1 ind
-1)
Zm
CR
Figure 3.10 - Cerastoderma edule jet length scale (zm, cm) and clearance rates (CR, L h-1 ind-1) as a function of shear velocity (u*) for a population of cockles with 280 ind m-2.
0.00
0.01
0.02
0.03
0 1 2 3 4 5
u* (cm s-1)
TKEU2
Ct
280
C
500
1000
Figure 3.11- Cerastoderma edule effect in the relationships of normalised TKE (TKEU2) as a function shear velocity (u*) for the control treatments of Exp. 1 (C, ○) and of Exp. 2 (Ct, ) and the lowest density of C. edule (280 ind m-2, L, *), medium (500 ind m-2, M, ▲) and the highest density (1000 ind m-2, H, ♦).

PART II – INTERACCTION BETWEEN Cerastoderma edule AND SEDIMENT DYNAMICS
82
3.4 Discussion
3.4.1 The effect of C. edule on topographical roughness
C. edule is known to prefer ambient flow velocities of about 25 – 30 cm s-1 (Ysebaert et
al. 2002), which corresponds to u* of 1.8 to 2.2 cm s-1 in the NIOO flume. Previous studies
found changes in behaviour of cockles above a certain threshold shear velocity (Fernandes et
al. 2007). This behaviour has a direct effect on topography (promoting deposition,
resuspension and erosion). The behaviour also appears to be linked to the onset of bed erosion.
Previous observations at higher shear velocities up to u* 8 cm s-1 (Fernandes et al. 2007)
showed an effect of current velocities on topography, both as a consequence of erosion, and as
a consequence of C. edule burrowing behaviour (using its foot) possibly in an effort to remain
buried during erosion. In these experiments C. edule significantly changed bottom topography
and increased roughness which is related to increasing density of live cockles. Increasing shear
velocities (up to 4 cm s-1) did not affect the topographical roughness nor did it change the
behaviour of cockles. In the present study the velocity threshold for the onset of burrowing
behaviour was apparently not exceeded.
The positive relation between topographical roughness and the density of organisms is
certainly due to increasing surface interaction with sediment topography and increasing
probability for organisms to knock against each other. Under low current velocities, at low
densities cockles produce little variation in bed height, living buried in the sediment and
placing the top of the siphons flush with the sediment surface. Under low current velocities the
cockles themselves are not a roughness element, but they change surface roughness as a result
of their adaptation to the sediment surface, density, feeding activity and ultimately to current
velocity.
3.4.2 The effect of C. edule on hydrodynamic roughness
The reduction of velocity near the bottom is directly related to increasing roughness.
The presence of cockles increased roughness 0.2 times for 500 ind m-2 and 0.6 times for 1000
ind m-2, in comparison to the control treatment. Although these increases in bed roughness are
small in comparison to epibenthic fauna, it is sufficient to affect hydrodynamic parameters
such as u* and z0. This is in agreement with previous observations (Ciutat et al. 2007,
Fernandes et al. 2007). This relationship is well-known for epibenthic organisms like mussels.
These increase the drag of the bed on the water column (Green et al. 1998, Nikora et al. 2002,

Chapter 3 – How Cerastoderma edule change in the benthic boundary layer
83
van Duren et al. 2006) each organism being a roughness element large enough to incur form
drag. C. edule, an endobenthic species, is also able to affect the BBL. Its effect in the BBL is
characterised by increasing microtopography resulting in lower velocities near the bed and
increased velocity gradients in the BBL. These changes in roughness are not large enough to
cause form drag and the influence on boundary layer shear must be the result of friction drag
alone.
The presence of C. edule reduced current velocities in the first 6 cm from the bed (Fig.
3.4). These observations differ from Ciutat’s et al. (2007), who refer to an effect in the first 2
cm from the bed. These observations are probably related to the conditions of the annular
flume used by Ciutat et al., where the curvature of the flume walls produces a centrifugal force
that generates secondary flows and a compressed logarithmic layer.
The values of z0 produced using Eq. [5], are better correlated to topographical
roughness, are least biased and with a smaller variation than the values obtain by direct
application of the Law of the Wall method (Eq. [2]). Calculations with Eq. [2] are very
sensitive to the exact height of the ADV above the bed (Pope et al. 2006) and in the present
study did not reflect increasing topographies.
.
3.4.3 Effects of C. edule on turbulence
TKE is only directly related to topography when live cockles are not present. In the
presence of active C. edule the values of TKE are much higher.
The relationship between turbulence and topographic roughness for the artificial
treatments is shown in Fig. 3.8. The same relationship obtained in the presence of live
organisms, actively filtering the water column showed higher values. Live cockle beds with a
fairly low topographic roughness produced turbulence levels in the boundary layer similar to
artificial beds with much higher topographic roughness (see Tab. 3.2).
The positive relationship between filtration activity and TKE observed in Exp. 2 (Fig.
3.9) supports the idea that filtration activity and the production of siphonal currents are
responsible for higher levels of turbulence near the bed.
The effect of filtration activity on turbulence is most pronounced at low velocities (u* <
1 cm s-1, Fig. 9). The effect of exhalant currents, measured here as zm decreases with
increasing velocity (Fig. 3.10). This decrease is mainly generated by the bending effect of the
trajectory of vertical currents produced by increased overlying cross-flow (Monismith et al.

PART II – INTERACCTION BETWEEN Cerastoderma edule AND SEDIMENT DYNAMICS
84
1990). This is probably why above a certain velocity the exhalant currents can no longer
protrude higher in the water column.
In the present work shear velocities showed a positive relationship with filtration
activity. However, at u* > 4 cm s-1 the effect of siphonal current not only decreases due to
decreasing of the ratio siphonal currents/ cross flow velocity, but also due to the reduction
effect of higher shear velocities on filtration activity as observed in previous experiments
(Fernandes et al. 2007). Therefore, the effect of filtration activity on turbulence will only be
significant under relatively low shear velocities (up to 4 cm s-1).
The averaged values of TKEU2 were slightly higher in Exp. 2 in comparison to Exp. 1
(Tab. 2 and Fig. 3.11). This is possibly due to the fact that on Exp. 2 courser sand was used
and additional food was supplied to the cockles. The courser sand is an additional source of
friction drag. The higher values of TKEU2 in the live cockle treatment of Exp. 2 might be
related to feeding stimulation by addition of Isocrysis galbana.
The two densities used in the first experiment produced very similar additional
turbulence (Fig. 3.6). This is surprising since the highest density has twice the number of
organisms of the medium density and therefore higher filtration activity and higher levels of
turbulence were expected on H. The higher values of TKEU2 observed at low velocities (Fig.
3.7) are probably related to the values of siphonal currents jet-length scale that are higher
under lower velocities). Under increasing shear velocity the jets can no longer compete with
the cross-flow, even if additional turbulence is being produced.
This study may have some consequences for the classical description of mixing
coefficients based on topography calculations. The effect of live C. edule was not detected in
the analysis of topographical roughness, shear velocity or roughness length, but only in
turbulence. This means that in hydrodynamic models, turbulence and vertical mixing above
filter-feeders beds should be discriminated and should be not be considered purely as a
function of topographic roughness.
Generally, turbulence is calculated after the drag coefficient (CD) that expresses the
drag the bed imposes on the fluid. CD is calculated according to the quadratic stress law as
2uCD ρτ= while
2
*uρτ = . But, it could also be calculated using the TKE method as
TKEC1=τ (Soulsby & Dyer 1981; Kim et al. 2000) being C1 a constant that expresses the
ratio of TKE to u*. Pope at al. (2006) found a good agreement between τ calculations based on
log-profile and TKE and Ciutat et al. (2007) used the TKE method to describe bed roughness

Chapter 3 – How Cerastoderma edule change in the benthic boundary layer
85
in terms of shear stress. Calculation of τ using Ciutat’s model resulted in values about ten
times higher than the τ calculated with the measured TKE averaged and C1=0.19.
The adoption of the TKE approach to estimate τ reduces the problems associated with
precision on measurements elevation from the bottom and does not suffer the problems
associated with roughness length estimation using the log-profile method (Pope et al. 2006).
However, there is some ongoing discussion about the value of C1. Some authors consider it to
be of 0.19 (Pope et al., 2006, Thompson et al. 2003, 2004) while other consider it as 0.21 (Kim
et al. 2000). In the present work the ratio of TKE to u* increased with increasing U and it is not
possible to follow the assumption of a fixed relationship between TKE and u*, necessary to the
use of the TKE method. This study and a few others (Van Duren et al. 2006) suggest that over
beds of filter feeders these relationships may differ considerably. The precise dependence of
turbulence and drag on bed roughness in the presence of filter feeders needs to be assessed
further.
3.5 Conclusions
This study shows that living organisms modify fluids dynamics in a different way that
is generally address by engineering. Density of C. edule affects boundary layer parameters
such as hydrodynamic roughness length, resulting in reduced current velocities near the
sediment surface, as a consequence of changes in topographic roughness. In addition to the
effect of C. edule on the topographical roughness, the filtration activity produces additional
turbulence. The effect of filtration activity is only important under shear velocities lower than
~1.5 cm s-1. At high shear velocities, siphonal currents can no longer compete with the
longitudinal currents and lose relevance. For the velocities at which filtration activity is
relevant, the cockles produce an additional turbulence in the BBL, comparable to the effect
produced by the highest topographic roughness tested in this work.
The effect of filtration activity on the BBL should be combined with the effect of current
velocity on filtration activity, as well as the effect of quantity and quality of suspended matter
on clearance rates. The effect of cockle beds in sediment dynamics is not only restricted to
changes in the BBL, but they also play an important role in sediment stability, suspended
matter depletion in the water column and further production of biodeposits, with different
transport/resuspension/deposition characteristics than the earlier suspended matter. This study
aims to be a contribution for more realistic numerical modelling simulations, a valuable tool
for ecosystem management.

PART II – INTERACCTION BETWEEN Cerastoderma edule AND SEDIMENT DYNAMICS
86
3.6 Acknowledgments
We are very grateful to J. van Soelen and B. Koutstaal for support during field
collections. We thank the invaluable support of B. Sinke during the flume experiments as
well as L. Haazen. Also to A. Wielemaker-van den Dool for her advice and technical
support during Arc View data treatment. Discussions and suggestions by J. Widdows, N.
Pope, H-U Riisgård and S. Lefebrve greatly benefited this study. S. F. were funded by
Foundation for Science and Technology (Portugal) fellowship SFRH/BD/6188/2001. This is
publication 3748 of the Netherlands Institute of Ecology (NIOO-KNAW).
3.7 References
Andersen, T.J., Lund-Hansen, L.C., Pejrup, M., Jensen, K.T., Mouritsen, K.N., 2005. Biologically induced differences in erodability and aggregation of subtidal and intertidal sediments : a possible cause for seasonal changes in sediment deposition. Journal of Marine Systems. 55, 123-138
Blanchet, H., Raymond, N., de Mantaudouin, X., Capdepuy, M., Bachelet, G., 2003. Effects of diagenean trematodes and heterotrophic bacteria on mortality and burying capacity of the common cockle Cerastoderma edule (L.). Journal of Experimental Biology and Ecology. 293, 89-105
Boyden, C.R., Russel, P.J.C., 1972. The distribution and habitat range of the brackish water cockle (Cardium (Cerastoderma) glaucum) in the British Isles. The Journal of Animal Ecology. 41, 719-734
Butman, C.A., Fréchette, M., Rockwell Geyer, W., Starczak, V.R., 1994. Flume experiments on food supply to the blue mussel Mytilus edulis L. as a function of boundary-layer flow. Limnology Oceanography. 39, 1755-1768
Coughlan, J., 1969. The estimation of filtering rate from the clearance of suspensions. Marine Biology. 2, 356-358
de Brouwer, J.F.C., Ruddy, G.K., Jones, T.E.R., Stal, L.J., 2002. Sorption of EPS to sediment particles and the effect on the rheology of sediment slurries. Biogeochemistry. 61, 57-71
Fernandes, S., Sobral, P., Van Duren, L.A., 2007. Clearance rates of Cerastoderma edule under increasing current velocity, measured in two different flumes and interrelation with hydrodynamics. In press Continental Shelf Science
Fernandes, S., Sobral, P., Costa, M.H., 2006. Nereis diversicolor effect on the stability of cohesive intertidal sediments. Aquatic Ecology. 40, 567-579
Friedrichs, M., Graf, G., Springer, B., 2000. Skimming flow induced over a simulated polychaete tube lawn at low population densities. Marine Ecology Progess Series. 192, 19-228
Green, O.M., Hewitt, J.E., Thrush, S.F., 1998. Seabed drag coefficient over natural beds of horse mussels (Atrina zelandica). Journal of Marine Research. 56, 613-637
Jensen, K.T., Castro, N.F., Bachelet, G., 1999. Interactions between Himasthla spp. (Trematoda) and their second intermediate host: Cerastoderma edule; experimental infections of cockle spat. Journal of the Marine Biological Association of the UK. 79: 265-271

Chapter 3 – How Cerastoderma edule change in the benthic boundary layer
87
Kim, S.-C., Friedrichs, C.T., Maa, J. P.-Y., Wright, L.D., 2000. Estimating bottom stress in tidal boundary layer from acoustic Doppler velocimeter data. Journal of hydraulic Engineering. 126, 399-406
Lawless, M., Robert, Andre., 2001 Scales of boundary resistance in coarse-grained channels: turbulent velocity profiles and implication. Geomorphology. 39, 221-238
List, E. J., 1982. Turbulent jets and plumes. Annual Review of Fluid Mechanics 14, 189-212 Monismith, S.G., Koseff, J.R., Thompson, J.K., O’Riordan, C.A., Nepf, H.M., 1990. A study
model bivalve siphonal currents. Limnology Oceanography 35, 680-696 Navarro, J.M., Widdows, J., 1997. Feeding physiology of Cerastoderma edule in response to a
wide range of seston concentrations. Marine Ecology Progress Series. 152, 175-186 Nikora, V., Green M.O. Thrust, S.F., Hume, T.M., Goring, D. 2002. Structure of the internal
boundary layer over a patch of pinnid bivalves (Atrina zelandica) in an estuary. Journal of Marine Research. 60, 121-150
O’Riordan, C.A., Monismith, S.G., Koseff, J.R., 1993. A study of concentration boundary-layer formation over a bed of model bivalves. Limnology Oceanography. 38, 1712-1729
Orvain, F., Le Hir, P., Sauriau, P.-G., 2003. A model of fluff erosion and subsequent bed erosion in the presence of the bioturbator, Hydrobia ulvae. Journal of Marine Research. 61, 823-851
Paterson, D.M., 1989. Short-term changes in the erodability of intertidal cohesive sediments related to migratory behaviour of epipelic diatoms. Limnology and Oceanography. 34, 223-234
Pope, N.D., Widdows, J., Brinsley, M.D., 2006. Estimation of bed shear stress using the turbulent kinetic energy approach – A comparison of annular flume and field data. Continental Shelf Research. 26, 959-970
Riisgård, H.,U., Kittner, C., Seerup, D.,F., 2003. Regulation of opening state and clearance rate in felter-feeder bivalves (Cardium edule, Mytilus edulis, Mya arenaria) in response to low algal concentration. Journal of Experimental Marine Biology and Ecology. 284, 105-127
Soulsby, R.L. Dyer, K.R., 1981. The form of the near-bed velocity profile in a tidally accelerating flow. Journal of Geophysical Research. 86, 8067-8074
Thompson C.E.L., Amos, C.L., Lecouturier, M., Jones, T.E.R. 2004. Flow decelaration as a method of determining drag coefficient over roughened flat beds. Journal of Geophysical research. 109, 1-12
Thompson, C.E.L., Amos, C. L., Jones, T.E.R., Chaplin, J., 2003. The manifestation of fluid-transmitted bed shear stress in a smooth annular flume – a comparison of methods. Journal of Coastal Research. 19, 1094-1103
Urrutia, M., B., Iglesias, J.I.P., Navarro, E., Prou, J., 1996. Feeding and absorption in Cerastoderma edule under environmental conditions in the bay of Marennes-Oleron (Western France). Journal of the Marine Biological Association of the United Kingdom. 76, 431-450
Van Duren, L.A., Herman, P.M.J., Sandee, A.J.J., Heip, C.H.R., 2006. Effects of mussel filtering activity on boundary layer structure. Jornal of Sea Research. 55, 3-14
Vogel S. 1994. Life in moving fluids. Princeton, New Jersey: Princeton University Press Widdows, J., Brinsley, M.D., Salked, P.N., Elliott, M., 1998. Use of annular flumes to
determine the influence of current velocity and bivalves on material flux at the sediment-water interface. Estuaries. 21, 552-59
Wooding, R.A., Bradley, E.F. & Marshall, J.K., 1973. Drag due to regular array of roughness elements of roughness elements of varying geometry. Boundary-Layer Metereology. 5, 285-308

PART II – INTERACCTION BETWEEN Cerastoderma edule AND SEDIMENT DYNAMICS
88
Ysebaert, T., Meire, P., Herman, P.M., Verbeek, H., 2002. Macrobenthic species response surfaces along estuarine gradients: prediction by logistic regression. Marine Ecology Progress Series. 225, 79-95
Zhang, H., Madsen, O.S., Sannasiraj S.A., Chan E.S., 2004. Hydrodynamic model wave-current interaction in coastal regions. Estuarine Coastal and Shelf Science. 61, 317-324

PART IIIINTERACCTIONS BETWEEN
AND
SEDIMENT DYNAMICS
effect on the stability
of cohesive intertidal sediments
Nereis diversicolor
Nereis diversicolor
Chapter 4


Chapter 4 - Nereis diversicolor effect on the stability of cohesive intertidal sediments
91
NEREIS DIVERSICOLOR EFFECT ON THE STABILITY OF COHESIVE
INTERTIDAL SEDIMENTS
S. Fernandes, P. Sobral and M. H. Costa
Aquatic Ecology 40, 567 – 579, 2006
Abstract
The effect of the polychaete Nereis diversicolor on the stability of natural cohesive sediments was
investigated in the laboratory. Three densities (450, 600 and 1200 individuals m-2) of N. diversicolor
were used. Sediment shear strength was measured using a cone penetrometer. Sediment erodability
was assessed using an annular flume (current velocities from 5 to 55 cm s-1) in which flow velocity
was increased incrementally, and water sampled to quantify suspended material in order to derive
critical erosion velocity and erosion rates. At low current velocities (< 25 cm s-1), we found N.
diversicolor to have a stabilising effect, reflected by an increase of up to 20% in the critical erosion
velocity. This is related to an enhancement of ~ 50% in shear strength, due probably to gallery
building activities, responsible for the promotion of lateral compaction, an increase in the area of the
sediment-water interface, and enhanced microphytobenthos production. Once the sediment began to
erode, the stabilising effect of N. diversicolor reversed, leading to an increase of up to 40% in eroded
matter due to compaction, which resulted in the erosion of larger aggregates. The balance between the
effect of N. diversicolor on herbivory and microphytobenthos production due to the presence of
galleries is discussed. Our results indicate that neither chlorophyll a, nor shear strength nor critical
erosion velocity are good indicators of erodability. This underlines the need to include biogeochemical
processes in any realistic sediment transport model.
Key-words: bioturbation, critical erosion velocity, erosion rates, resuspension, shear strength
4.1 Introduction
The physical processes that dominate sediment transport in aquatic ecosystems have
been relatively well studied (e.g. Mehta et al., 1988; Houwing, 1999; Dyer et al., 2004).
However, in most numerical models, the benthic variables are given only as boundary
conditions. Some studies focus upon the biochemical exchanges at the sediment water

PART III – INTERACCTION BETWEEN Nereis diversicolor AND SEDIMENT DYNAMICS
92
interface (e.g. Rutgers van der Loeff and Boudreau, 1997; Sohma et al., 2001), but less
importance is given to the biological processes that interact in this exchange. The erosive
behaviour of intertidal deposits which act as sources and sinks for sediments in suspension,
are critical to understand the ETDC (erosion, transport, deposition and consolidation) cycle.
Furthermore, no models exist which predict adequately the erosion, transport and deposition
of sediment in estuaries. Recently, it has been emphasised that the study of biological
processes affecting sediment stability, as well as the contribution of microphytobenthic
biomass, nutrients, organic matter and contaminants to the water column (Rasmussen et al.,
1998; Mazik and Elliot, 2000), are important in the understanding of sediment strength and
erodability (Kornman and de Deckere, 1998; Widdows et al., 2000; Blanchard et al., 2001).
Much recent work has focussed upon sediment stabilisation by the microphytobenthos,
and their effect on sediment adhesion and resuspension by tidal action (de Jonge and Van den
Bergs, 1987; Blanchard et al., 1997; Austen et al., 1999; Shimeta et al., 2002). However, less
attention has been given to macroinvertebrates and their interaction with the hydrodynamic
and physical properties of the sediment (Davies, 1993; Davey and Partridge, 1998; Widdows
et al., 2000). Different species of the macrofauna affect sediment stability differently (see
Graf and Rosenberg, 1997). Some burrowing species are known to change sediment stability
by changing the properties of the sediment (Jones and Jago, 1993; Botto and Iribarne, 2000)
or affecting sediment shear strength (Meadows and Hariri, 1991; Widdows et al., 1998a),
whilst others have direct or indirect effects upon sediment resuspension (Davies, 1993;
Rowden et al., 1998a; Widdows et al., 1998a).
The ragworm Nereis diversicolor is a widely distributed polychaete, occurring in sand
or mud habitats in Portugal with densities ranging from 430 to 16000 ind m-2 (Fidalgo e Costa
et al., 1998; Abrantes et al., 1999). N. diversicolor live in semi-permanent burrows which
provide refuge from predators, and they have a wide array of different feeding techniques
such as filter and deposit feeding, scavenging and predation on other macrofauna (Esselink
and Zwarts, 1989 and references within; Vedel et al., 1994). They build complex gallery
networks that can extend down to 30 cm depth, and which are related to body length, although
organisms > 10 cm long can be found in the upper 2 to 3 cm (Anderson and Meadows, 1978;
Esselink and Zwarts, 1989; Davey and Partridge, 1998). Some studies have concentrated upon
the bioturbation effect of this species on burrowing activity (Trevor, 1977; Davey, 1994) and
on sediment reworking (Gerino, 1991; François et al., 2002). There is some controversy about
the stabilising effect of N. diversicolor. Some authors considered this species as a stabiliser,
judging from its influence on the shear strength properties of the sediment (Meadows and

Chapter 4 - Nereis diversicolor effect on the stability of cohesive intertidal sediments
93
Tait, 1989; Meadows et al., 1990). On the other hand, Underwood and Paterson (1993)
referred to the destabilising effect of N. diversicolor due to its negative influence on the
colonisation of benthic diatoms. Although some literature (Eckman et al., 1981; Davey, 1994)
refers to the proportional effect of macrofauna density on bioturbation, the quantification of
this activity is required, and the relative importance of the effect of this species on sediment
stability needs to be assessed.
The objective of our study is to understand the effect of (1) N. diversicolor on
sediment stability; and (2) density (ind m-2) on bioturbation activity. To achieve this, we
quantified the species influence on sediment stability parameters, e.g. shear strength, critical
erosion velocity, as well as erosion rates and resuspension of particulate organic matter and
chl a.
4.2 Material and methods
4.2.1 Experimental set-up
Intertidal estuarine sediments from Ponta da Erva, Tejo estuary, Portugal (29SN NC
030 984) were collected in November 2000 and March 2001, corresponding to the first
(NOV) and second experiments (MAR). The sediments were collected from the top-most 2
cm and maintained at 4ºC to minimise biological activity, until the experiments commenced
(7days). Subsequently, the macrofauna present (occasional small shells, small crabs, N.
diversicolor) was defaunated manually to minimise sediment disturbance, and the sediment
was thoroughly homogenised to reduce variability between treatments. Sediment cores were
taken to determine sediment dry bulk density (ds) and organic content by drying at 90ºC (48h)
and incinerating at 450ºC (4h). The sediment comprised ~ 95% silt (Lima, 2002), with an
average ds of 0.75 g dry weight (DW) cm-3 (SD = ± 0.15, n=12) and organic-matter content of
7.7 % (± 1.6; n =12). Experiment microcosms were prepared using 8-cm high flume boxes
(area, 0.053 m2) representing a quarter of the total flume channel area (see below). For both
experiments, microcosms were replicated 3X for each density treatment, as well as a control
treatment on each experiment (C NOV and C MAR). In total, three treatments were carried
out for NOV and MAR experiments with different densities of N. diversicolor. Organisms
were collected from the upper 10 cm of sediment from Barreiro (Tejo estuary) on both
occasions. After acclimatisation to laboratory (~ 4 days), the organisms were introduced to the
flume box microcosms. For the first experiment (NOV), a density of 450 ind m-2 was used,
corresponding to 23 ind microcosm-1 (average length (AL) of 77 mm ± 11, and 0.11 g DW ±

PART III – INTERACCTION BETWEEN Nereis diversicolor AND SEDIMENT DYNAMICS
94
0.03, n=20 for all treatments). In the second experiment (MAR), two densities treatments with
600 ind m-2 (32 ind microcosm-1 with 102 mm AL ± 32 and 0.09 g DW ± 0.02) and 1200 ind
m-2 (64 ind microcosm-1 with 78 mm AL ± 18 and 0.05 g DW ± 0.01) were used. After
introduction of the organisms, microcosms incubated under a water column of ~ 2 cm, under
continuous flow-through (3 l h-1) and controlled temperature (15ºC ± 1), salinity (36 ppt) and
light (57 µmol m-2 s-1 ± 11), and with a 12h photo-period for 20 days.
4.2.2 Shear strength measurements
After the 20 days of incubation, sediment geotechnical shear strength (SS) was
measured before (sb) and after (sa) erosion runs, with a Geonor falling-cone penetrometer
(described in Watts et al., 2003). This device consisted of a 10g inverted cone dropped on the
sediment surface. Cone penetration depth was converted into undrained shear strength using
Hansbo (1957) conversion tables. Measurements were triplicated, for each experimental
microcosm, both before and after resuspension runs.
4.2.3 Erosion measurements
For the sediment erosion tests, an annular flume similar to that described in Widdows et
al., 1998a was used (Fig. 4.1). The annular flume is 60 cm in diameter, and has a channel
width of 15 cm, area of 0.21 m2 and a capacity of 60 l with a water column height of 30 cm. It
has seven sampling ports at 5-cm intervals from the base. Current velocities are generated by
a rotating drive plate of adjustable height. The drive plate rotation was calibrated previously
(Fernandes, 2001) and could generate free stream current velocities of up to 55 cm s-1. After
the incubation period, each microcosm was introduced carefully into the flume. Since the
experimental microcosms were tested individually, three empty inverted flume boxes were
introduced to the flume to complete and level the sediment surface. For each erosion run in
the flume, current velocity was increased at 15-min increments from 5 to 10, 15, 20, 25, 40
and to 50 cm s-1. Water samples were collected at 2, 12 and 22 cm above the sediment bed, to
obtain an homogeneous quantification of the eroded matter at the end of each velocity step,
and to determine suspended particulate mater (SPM), particulate organic matter (POM) and
chl a. At the end of the erosion runs, the microcosms were defaunated by hand. The
organisms were stored in 70% alcohol for size, weight and final density determinations. As
the initial density would not have represented the density over the incubation period and the
final density would have underestimated the total numbers of organisms in the experiment,
experimental density was determined as the average of the initial and the final density.

Chapter 4 - Nereis diversicolor effect on the stability of cohesive intertidal sediments
95
Figure 4.1 - A: Annular flume used to study the effects of bioturbation by Nereis diversicolor on the resuspension of sediment exposed to different current velocities. B: Experimental setup (view across the flume channel). (adapted from Sobral & Widdows, 2000).
Water samples were filtered onto washed and pre-weighed glass fibre Whatman GF/C
filters (c. 1.2 µm mesh size). SPM and POM were determined gravimetrically after oven
drying at 90 ºC (48h), and after combustion at 450 ºC (1 h) respectively. For chl a
determination, filters were frozen immediately until spectrophotometric analysis. Total chl a
and phaeopigments were calculated according to the equation of Lorenzen (1967). The chl a
content of the eroded matter was estimated using SPM standardisation and the quality of
eroded chl a was determined using an index % chl a (chl a/ phaeopigments * 100) (Lucas et
al., 2000).
Critical current velocities (Ucrit) were derived according to Widdows et al. (1998a,b),
based on a regression of log SPM against current velocity. Ucrit was defined as the free stream
current velocity inducing an increase in SPM concentration above the threshold value of 50
mg l-1. Eroded matter, Em (g m-2) was determined using Em = (SPM * V)/ A, where V is the
volume of water in the flume and A the area of the test section. Erosion rates (g m-2 s-1) were
quantified as [Em (t+1) - Em (t)]/ t, where t is the time interval (s) between samplings.
4.2.4 Bioturbation effect (Be)
Bioturbation was described using an index of additional cumulative effect (Blanchard et
al., 1997) (Be, %), where Be= [(X with N. diversicolor - X with zero N. diversicolor) / X with
zero N. diversicolor ]* 100, and where X is the value of each parameter.
rotating drive plate(motor driven)
sediment
water
N. diversicolor
direction of
water flow
A B
Sampling
ports
10 cm
8 cm
35 cm
40 cm

PART III – INTERACCTION BETWEEN Nereis diversicolor AND SEDIMENT DYNAMICS
96
4.2.5 Statistical analysis
The data were analysed statistically with a multivariate bifactorial ANOVA for α = 0.5, and
with a Tukey post-hoc HSD (Honest Significant Difference) probability test using
STATISTICA (version 6.0) software. Sample independence was assured through
experimental design, and homogeneity of variance was verified using Levene's test.
4.3 Results
4.3.1 Visual observations
After the 20-days incubation period, a surface biofilm had developed in the microcosms
(Fig. 4.2 a and b). During the incubation period, the presence of natural meiofauna was
observed in all treatments. Although a detailed taxonomic analysis was not done, nematodes,
harpacticoid copepods and ciliate protozoa were identified. The meiofauna was comparable in
all treatments, and hence changes in sediment properties were attributed specifically to N.
diversicolor.
Figure 4.2 - a) Aspects of the sediment surface at the beginning of the incubation period (day 0). Note, on the upper microcosms, the trace of a N. diversicolor burrowing. b) Sediment surface at day 20, in the control treatment. It is possible to observe the developed biofilm; lighter shaded areas on the surface correspond to sediment from lower layers, transported to the surface by the meiofauna. (photos from experiment MAR).
a
b
a
b

Chapter 4 - Nereis diversicolor effect on the stability of cohesive intertidal sediments
97
After the erodability runs and N. diversicolor defaunation, a mortality rate of 43 % (± 2)
in NOV for 450 ind m-2 was estimated, and 25 % (± 6) and 69 % (± 9) in MAR with densities
of 600 and 1200 ind m-2, respectively. Average densities during the runs were: N350 for 450
ind m-2, N530 for 600 ind m-2 and N790 for 1200 ind m-2.
4.3.2 Sediment shear strength
Controls (C) and N. diversicolor treatments in both experiments did not differ
significantly in SS, before erosion runs (sb) (Table 4.1). However, in NOV, after resuspension
runs (sa) SS increased significantly (F=18.00, p<0.05) by about 63% (see Table 4.2) in the
N350 treatment, although Em was similar to the control (1271 g m-2 ± 247 and 1139 g m-2 ±
299, respectively). In the second experiment (MAR), prior to the erosion runs, surface
sediment SS was about 38% higher in the presence of N. diversicolor (Table 4.2). After
erosion runs, SS differed significantly between N790 and CMAR, and N790 and N530
(p<0.01 and p<0.05 respectively), depending on the erosion depth at which SS was measured.
Nevertheless, SS was always higher in N. diversicolor treatments.
4.3.3 Sediment erodability
4.3.3.1 Critical current velocity
The Ucrit ranged between 27 cm s-1 and 35 cm s-1 (Table 4.3). Significant differences
were observed only in NOV, between CNOV and N350 (p<0.05). For both experiments, the
presence of N. diversicolor had an increasing effect on Ucrit of up to 22% compared with
controls (Table 4.2). Ucrit was positively correlated with % eroded OM measured before
erosion (R2= 0.46, F= 10.04, p< 0.01).
4.3.3.2 Eroded material
In NOV, no significant differences were apparent in Em (g m-2) (Fig. 4.3A) and even at
the highest velocity (~ 50 cm s-1), Em values were similar (see Table 4.1). However, for the
range of velocities below Ucrit, Em values were significantly higher in CNOV (F=11.95,
p<0.01). At current velocities <25 cm s-1, Em was lower in N350 (9 to 14 g m-2) compared
with CNOV (15 to 41 g m-2).

PART III – INTERACCTION BETWEEN Nereis diversicolor AND SEDIMENT DYNAMICS
98
Table 4.1 - Changes in the shear strength s ( ± SD) of the surface sediment after the 20-day incubation period (sb), and after erosion of the sediment surface (sa) for the experiments NOV (CNOV and N350) and MAR (CMAR , N 530 and N 790). Also shown are values of SPM, Em, eroded OM, eroded chl a and erosion rates at the maximum current velocity tested (~50 cm s-1).
Sediment shear strength
(kPa)
NOV Sb Sa
SPM
(g l-1)
at ~50 cm s-1
Em
(g m-2)
at ~50 cm s-1
Eroded OM
(g m-2)
at ~50 cm s-1
Eroded chl a
(mg m-2)
at ~50 cm s-1
Erosion rates
(g m-2 s-1)
at ~50 cm s-1
CNOV 0.10 ± 0.00 0.21 ± 0.05 1.01 ± 0.26 1139 ± 299 101 ± 28 54 ± 12 0.516 ± 0.141
N350 0.10 ± 0.00 0.34 ± 0.02 1.12 ± 0.22 1271 ± 247 87 ± 4 22 ± 6 0.668 ± 0.499
MAR
CMAR 0.13 ± 0.06 0.23 ± 0.08 0.48 ± 0.12 544 ± 130 55 ± 12 35 ± 13 0.272 ± 0.052
N530 0.18 ± 0.03 0.53 ± 0.15 0.60 ± 0.06 681 ± 64 60 ± 5 22 ± 7 0.407 ± 0.011
N790 0.18 ± 0.03 1.02 ± 0.28 0.67 ± 0.11 759 ± 127 75 ± 11 43 ± 5 0.453 ± 0.201

Chapter 4 - Nereis diversicolor effect on the stability of cohesive intertidal sediments
99
Table 4.2 - Additional cumulative effect of bioturbation (Be, %) on: sediment shear strength (kPa) before (sb) and after (sa) resuspension; critical erosion velocity (Ucrit,); Em; erosion rate; eroded chl a and µg chl a g-1 DW for the highest experimental velocity (~50 cm s-1) for the three N. diversicolor average densities (N350, N530 and N790 ind m-2).
Be (%)
ind m-2
N350 N530 N790
Shear strength
Sb 0 38 38
Sa 63 128 335
Erodability
Ucrit 22 3 8
Em 12 25 39
Erosion rate 30 50 67
chl a
Eroded chl a -60 -37 22
µg chl a g-1 DW - 65 - 48 - 9
Table 4.3 - Exponential regressions of SPM (y) (mg l-1) on current velocity (x) (cm s-1). Also shown are critical current velocities (Ucrit) required to increase the SPM above a threshold of 50 mg l-1 ( ± SD).
NOV Equation R2 U crit (cm s-1)
CNOV y = 2.896e0.102x 0.85 27.1 ± 1.6
N350 y = 0.530e0.136x 0.78 33.1 ± 0.8
MAR
CMAR y = 1.333e0.109x 0.73 32.7 ± 1.8
N530 y = 0.337e0.154x 0.95 33.8 ± 3.1
N790 y = 0.588e0.124x 0.76 35.4 ± 1.3

PART III – INTERACCTION BETWEEN Nereis diversicolor AND SEDIMENT DYNAMICS
100
Figure 4.3 - Effect of free stream velocity (cm s-1) on eroded matter (Em) (g m-2)(± SD) (symbols) and on the content of OM on Em (lines) for experiments NOV (A) and MAR (B), for the controls (CNOV and CMAR) and the treatments with N. diversicolor (N350, N530 and N790). Symbols with arrows represent the average Ucrit (cm s-1) of each treatment.
These results agree with the differences found in % eroded OM, where an earlier
decline in CNOV related with the dilution effect of bulk erosion was observed (Fig. 4.3A).
Additionally, Ucrit was lower in CNOV (see Table 4.3). Hence, these results indicate
stabilisation or alteration due to the presence of N. diversicolor. After resuspension, erosion
rates were always higher in N350 (0.54 g m-2 s-1 ± 0.15 at 40 cm s-1 and 0.66 g m-2 s-1 ± 0.49
at 52 cm s-1), compared to CNOV (0.39 g m-2 s-1 ± 0.12 at 40 cm s-1 and 0.51 g m-2 s-1 ± 0.14
at 52 cm s-1).
In MAR experiment, Em and erosion rates were always higher in N. diversicolor
treatments (Table 4.1). However, no significant differences were observed after Ucrit was
0
400
800
1200
1600
0 20 40 60
free stream velocity (cm s-1
)
Em
(g
m-2
)
0
20
40
60
80
% O
M o
n E
m
C MAR
N 530
N 790
C MAR
N 530
N 790
0
400
800
1200
1600
0 20 40 60
Em
(g
m-2)
0
20
40
60
80
% O
M o
n E
m
C NOV
N 350
C NOV
N 350
B
A
0
400
800
1200
1600
0 20 40 60
free stream velocity (cm s-1
)
Em
(g
m-2
)
0
20
40
60
80
% O
M o
n E
m
C MAR
N 530
N 790
C MAR
N 530
N 790
0
400
800
1200
1600
0 20 40 60
Em
(g
m-2)
0
20
40
60
80
% O
M o
n E
m
C NOV
N 350
C NOV
N 350
B
A

Chapter 4 - Nereis diversicolor effect on the stability of cohesive intertidal sediments
101
reached (Fig. 4.3B). Before Ucrit was reached (velocities up to 25 cm s-1) in CMAR, Em was
higher and differed significantly from N790 (p<0.01) with highest OM contents of eroded
matter (varying from 5 to 12 g m-2 and 42 to 57 % OM; and 2 to10 g m-2 and 29 to 45 % OM,
respectively) (Fig. 4.3B). The additional cumulative effect of bioturbation (Be) (Table 4.2)
showed a concomitant increase with Em and N. diversicolor density, and Em and eroded OM
were highly correlated (R2 = 0.98) in both experiments (Table 4.1).
The effect of N. diversicolor on the input of chl a to the water column (Fig. 4.4) was not
significantly different between controls and N treatments before erosion. In NOV, however, it
differed significantly after erosion (F=16.88, p<0.01).
Figure 4.4 - Eroded chl a (g m-2) (symbols) and chl a content of eroded matter (mg chl a g-1 dw) (lines), as a function of the free stream velocity, for experiments NOV (A) and MAR (B). Legends as Fig 4.3.
0
20
40
60
80
0 20 40 60
free stream velocity (cm s-1
)
ch
l a
(g
m-2
)
0
0.5
1
1.5
2
2.5
mg
ch
l a
g-1 D
W
C MAR
N 530
N 790
C MAR
N 530
N 790
0
20
40
60
80
0 20 40 60
ch
l a
(g
m-2
)
0
0.04
0.08
0.12
0.16
mg
ch
l a
g-1 D
W
C NOV
N350
C NOV
N350
B
A
0
20
40
60
80
0 20 40 60
free stream velocity (cm s-1
)
ch
l a
(g
m-2
)
0
0.5
1
1.5
2
2.5
mg
ch
l a
g-1 D
W
C MAR
N 530
N 790
C MAR
N 530
N 790
0
20
40
60
80
0 20 40 60
ch
l a
(g
m-2
)
0
0.04
0.08
0.12
0.16
mg
ch
l a
g-1 D
W
C NOV
N350
C NOV
N350
B
A

PART III – INTERACCTION BETWEEN Nereis diversicolor AND SEDIMENT DYNAMICS
102
As seen from Em, chl a resuspension occurred earlier in CNOV before Ucrit was established,
whilst at the highest velocity, eroded chl a decreased by 60% in N350 (Table 4.2). In MAR,
eroded chl a differed significantly between N530 and N790, before (F=4.70, p<0.05) and after
erosion (F=8.81, p<0.01), and between CMAR and N530 after erosion (F = 6.88, p<0.05)
(Fig. 4B). Higher chl a resuspension occurred in N790 at 50 cm s-1 (43 mg chl a m-2 ± 5)
whilst values for N530 were lower (22 mg chl a m-2 ± 7) at 53 cm s-1 than CMAR (35 mg chl
a m-2 ± 13) at 50 cm s-1. The Be index for chl a contents (see Table 4.2) shows the negative
effect of bioturbation on eroded chl a.
To eliminate the effect of bulk Em on chl a resuspension, the data were standardised to
Em (i.e. mg chl a g-1 DW) and the Be index was even higher (-65%). For NOV, at velocities
of 50 cm s-1, the chl a content of eroded matter was higher in CNOV (0.05 mg chl a g-1 DW ±
0.01) than in N350 (0.02 mg chl a g-1 DW ± 0.00). In contrast, for the velocities below Ucrit,
chl a content was higher in N350 (Fig. 4.4A). In MAR, for velocities below Ucrit, N530 and
N790 treatments had higher chl a contents than the control (Fig. 4.4B). The quality of chl a
was higher in the control treatments in NOV (ranging from 8 to 14 % chl a in CNOV and
from 3 to 11 % chl a in N350) and MAR (ranging from 8 to 18 % chl a in CMAR, 7 to 11 %
chl a in N530 and 6 to 16 % chl a in N790), implying that N. diversicolor had decreased the
quality of eroded chl a. For the highest velocity tested, CMAR and N790 showed the same
weight-specific chl a concentration (0.06 mg chl a g-1 DW ± 0.01), but these values were 48
% lower for N530 (0.03 mg chl a g-1 DW ± 0.01).
4.3.4 Correlations with sediment shear strength
A positive relation was found between surface SS before erosion and Ucrit (Fig. 4.5).
The significance of the correlation is lowered by the NOV treatments that showed similar
values of SS corresponding to different Ucrit. In MAR, the positive relationship between these
two parameters is clearer, suggesting that N. diversicolor affect sediment SS.
The interpretation of the relationship between Em at the highest velocity tested and
surface SS after erosion (Fig. 4.6) should take into account that the sa was measured at
different depths, according to the different Em found. The correlation between Em and sa was
positive for MAR, but absent for NOV. The average sa of the control treatments (CNOV and

Chapter 4 - Nereis diversicolor effect on the stability of cohesive intertidal sediments
103
CMAR) was always lower (0.2 kPa) than for N. diversicolor treated samples (0.3 to 1.0 kPa)
(Fig. 4.6).
R2 = 0.41
25
30
35
40
0 0.05 0.1 0.15 0.2 0.25
Sb (kPa)
Uc
rit
(cm
s-1
)
C NOV
N350
C MAR
N530
N790
Figure 4.5 - Variation of Ucrit (cm s-1) and sediment shear strength before erosion sb (kPa) for both experiments NOV and MAR. Linear regression is based on all data points (F= 8.16, p<0.01, n=15). Legends as Fig. 6.3.
R2 = 0.01
R2 = 0.24
0
400
800
1200
1600
2000
0 0.5 1 1.5
Sa (kPa)
Em
(g
m-2
)
C NOV
N350
C MAR
N530
N790
Figure 4.6 - Variation of Em (g m-2) and sediment shear strength after erosion sa (kPa) for both experiments NOV and MAR. Lines indicate linear regression tendency for each experiment. Legends as Fig. 6.3.

PART III – INTERACCTION BETWEEN Nereis diversicolor AND SEDIMENT DYNAMICS
104
However, these differences in sa did not affect Em to a large extent. Although similar Em
concentrations were found in NOV, the treatments with N. diversicolor (N350) exhibited SS
values 1.6 times higher than for the control (CNOV). In MAR, higher sediment SS measured
after erosion is related to the higher N. diversicolor densities, with increases of 2.3 and 4.4
times the SS values for the control for N530 and N790, respectively. This increment in SS
may be related to the higher chl a content of eroded matter observed in N. diversicolor
treatments in MAR (see Fig.3). Chl a content of eroded matter was positively correlated with
both sb and sa (R2=0.35, F=5.44, p<0.05 and R2=0.72, F=27.57, p<0.001, respectively). The
SS (sb and sa) values found for the N. diversicolor treatments showed a concomitant increase
with average chl a content of eroded matter (see Table 4.1 and Fig. 4.4). The overall effect of
N. diversicolor on sediment SS was larger than its effect on sediment erodability.
4.4 Discussion
4.4.1 N. diversicolor effects below critical erosion velocity
The mortality rates reported by us are related not only to real mortality, but also to the
methodology used, i.e. we may have missed the organisms during sediment defaunation, or
they escaped from the microcosms during the incubation period. Thus, mortality rates are over
estimated. The high mortality in MAR (1200 ind m-2) is due probably to stress under high
population density or the poor condition of the organisms following the unusually rainy
winter of 2001. Nevertheless, for the same experiment and 600 ind m-2, a much lower
mortality was observed.
The presence of N. diversicolor enhanced the SS of the surface sediments by up to
38% (Tables 4.1 and 4.2), which has also been reported by Meadows and Tait (1989) and
Meadows et al. (1990), who found increased sediment SS, which ranged from 37% to 67% for
densities from 1000 to 3000 ind m-2. The values obtained by these authors in the laboratory
are not inconsistent with the surface SS values found at mid tide level for the inner Clyde
estuary (UK), where N. diversicolor were abundant (Meadows and Tufail, 1986). The
increase in SS is probably related to lateral compaction caused by gallery building activity.
The gallery walls of N. diversicolor are covered by mucus secreted from glands covering the
entire surface of the epidermis. These secretions are pushed against the walls of the burrow,

Chapter 4 - Nereis diversicolor effect on the stability of cohesive intertidal sediments
105
and consolidate the walls (Meadows and Tait, 1989). Galleries are known to increase: (1)
sediment permeability; (2) de-watering; and (3) provide conduits for overburden-driven
drainage, thereby stepping up sediment consolidation (Meadows and Tait, 1989; Murray et
al., 2002).
N. diversicolor increasingly affected not only sediment SS, but also Ucrit, which was
always higher in the presence of N. diversicolor (see Table 4.3). This agrees with significantly
lower suspended matter concentrations found in the presence of N. diversicolor under low
velocities (< 25 cm s-1). The lower organic matter contribution of the controls at about 25 cm
s-1 (Fig. 4.3) is related also to a dilution effect of eroded matter that is particularly clear for the
controls of NOV (C Nov, Fig. 4.3A). This effect was observed also for chl a content at 25 cm
s-1 (Fig. 4.4). The lower critical erosion velocities for the controls may be related to earlier
resuspension (Type I erosion, Amos et al., 1997) of diatoms and protists, known to have
lower critical erosion velocities (Blanchard et al., 1997; Lucas et al., 2000; Shimeta et al.,
2002).
Increase in critical erosion velocities in the presence of N. diversicolor may be also
caused by creation of skimming flow by protruding galleries with associated reduction of
shear velocities (Eckman and Nowell, 1984; Friedrichs et al., 2000). However, before erosion
occurred, the surface of the treatments with N. diversicolor was similar visually to the biofilm
surface of the controls, and galleries protruded only after erosion started to occur. These
observations suggest that the increasing effect of N. diversicolor on Ucrit is not related to
skimming flow.
The increasing effect of N. diversicolor on Ucrit is probably related more to their effect
on sediment properties, i.e. compaction, increasing sediment SS, rather than their physical
effect on the shear stress velocities, as reported for other burrowing invertebrates (Jones and
Jago,1993). The relationship between initial sediment SS and critical erosion velocities
observed by us supports this explanation (Fig. 4.5) as well as agrees with Blanchard et al.
(1997), who observed that the more cohesive the sediment, the greater is the tidal current
velocity required to resuspend an equal quantity of matter. Also, this agrees with the
proportionality relationship between critical shear stress measured with a CSM and SS
measured with a fall-cone (Watts et al., 2003).
The relationship observed by us between Ucrit and N. diversicolor density (Table 4.2)
is related strongly to the fact that sediments and organisms were collected on different

PART III – INTERACCTION BETWEEN Nereis diversicolor AND SEDIMENT DYNAMICS
106
occasions, which may have influenced sediment properties and microphytobenthos
composition. Nevertheless, critical velocities were always higher in the presence of N.
diversicolor. Hence, for velocities up to Ucrit, the presence of N. diversicolor causes additional
biostabilisation of the surface sediments.
4.4.2 N. diversicolor effect above critical erosion velocity
In this study, a positive relationship between sediment Em (as well as erosion rates)
and organism density was observed (Table 4.1 and Figure 4.3). Destabilisation of the
sediment bed did not clear differ in the low density treatments (same erodability as the
control) (see Table 4.1 and Fig. 4.3). Hence, a N. diversicolor density of 350 ind m-2 is
considered to be too low to produce measurable sediment erodability effects. In fact, this
density is low compared with the natural mean densities found by Fidalgo e Costa et al.
(1998) on the south-west coast of Portugal (430 to 16 000 ind m-2). For higher N. diversicolor
densities we observed a proportional increase in sediment erodability.
Increased erosion rates have been reported for other macrofauna species, e.g. the
polychaetes Diopatra cuprea (Luckenbach, 1986) and Owenia fusiformis (Eckman et al.,
1981); the bivalves Cerastoderma edule and Macoma balthica (Widdows et al., 1998a; 2000);
the amphipod Corophium volutator (Grant and Daborn, 1994) and the gastropod Hydrobia
ulvae (Andersen et al., 2002). Davies (1993) studied the effect of several deposit feeder
species on direct bioresuspension (Graf and Rosenberg, 1997). These works show that deposit
feeders increase resuspension rates due to a tendency to physically eject sediment into the
overlying water, thereby disrupting the cohesive structure of the sediment and increasing its
water content.
We also observed contradictory effect between an increase in the Ucrit (reflecting
higher sediment stability) coincidental with increased Em. According to Luckenbach (1986),
once the surface sediment is disrupted, erosion proceeds quicker for dislodged aggregates in
mucus-stabilised sediments than for erosion in unbound sediments. Although critical
velocities may be higher in the presence of N. diversicolor, erosion rates may actually be
higher immediately after the onset of erosion.
Pelletisation is known to decrease erosion thresholds and increase suspended sediment
concentration (Maa et al., 1998; Andersen, 2001). Although we did not measure pelletisation,
N. diversicolor feeds on the sediment surface but faeces are deposited in the lower layer of the

Chapter 4 - Nereis diversicolor effect on the stability of cohesive intertidal sediments
107
burrows, which will decrease the effect of faecal pellets production at the sediment surface.
However, since Ucrit was higher in the presence of N. diversicolor, it indicated the lack of
pelletisation effect.
The effect of N. diversicolor on erosion rates can also be related to its deposit feeding
activity, which results in sediment reworking at the surface and a reduction of the biofilm. In
search for food, the polychaetes will disrupt the biofilm, not only due to predation, but also
due to body movements over the sediment surface. Sediment chl a was not analysed.
However, estimations of total eroded chl a suggest that N. diversicolor had a decreasing effect
on algal biomass. The values measured for the two highest densities tested at the highest
velocities are over estimated since (in agreement with the data on Em observed in this work)
they correspond to deeper sediment layers. The lower quality of chl a (% chl a) in the
treatments with N. diversicolor can also indicate herbivory of Nereis. Considering that the Em
is representative of the eroded layer characteristics, it can be assumed that the algal mat
decreased due to removal by N. diversicolor.
Assuming that chl a is correlated with EPS (colloidal carbohydrate) fractions in the
sediment (Underwood and Paterson, 1993; Blanchard et al., 2001; Friend et al., 2003), and
that chl a is a good indicator of sediment stability (Underwood and Smith, 1998), grazing by
N. diversicolor on the biofilm can be an important factor in decreasing in sediment stability.
This agrees with laboratory and field experiments (Peletier, 1996; Smith et al., 1996), which
suggest that N. diversicolor has a markedly reducing effect on the abundance of benthic
diatoms mainly due to deposit-feeding. In addition, they may alter the specific composition of
benthic diatom assemblages. Other studies on the microphytobenthos community have
reported the effect of macrofauna grazing on the reduction of surface biofilm and on sediment
stability (Miller et al., 1996; Austen et al., 1999).
We observed a concomitant increase of N. diversicolor density with chl a content in
eroded matter, e.g. for N790, and biofilm development. High mortality observed in this
treatment may have lead to a reduction in grazing activity. Furthermore, N790 was associated
with the highest organic matter content (Fig.4.3). This was probably related to a higher
decomposition and mineralisation, which may have increased microalgal production. Both
Mouritsen et al. (1998) and de Deckere et al. (2001), found that sediment stability and
microphytobenthic production increased after mass mortality of the macrofauna. Furthermore,
simultaneous increase of N. diversicolor density and chl a content can also be due to the

PART III – INTERACCTION BETWEEN Nereis diversicolor AND SEDIMENT DYNAMICS
108
higher density of burrows. During defaunation of the microcosms, we found gallery walls to
appear lighter in colour, with the same visual appearance as the well-oxygenated sediment
surface. The burrow walls of N. diversicolor are known to provide an additional
sediment/water interface, increasing oxygenation, chemical exchanges and chl a content in the
sediment (Anderson and Meadows, 1978; Gerino, 1991; Davey, 1994; Davey and Partridge,
1998). These facts suggest that high burrow densities may attenuate or contradict the grazing
effect.
Our data reveals that for low N. diversicolor densities, although chl a content was
reduced by ~60% in the eroded sediment, there was no corresponding effect on sediment
stability (Table 2). Conversely, for the highest N. diversicolor densities (where increased chl a
was recorded) a greater effect on sediment erodability was found. Thus, N. diversicolor
grazing impact might have no consequences at the sediment stability level. On the other hand,
an inverse relationship between chl a and Ucrit, erosion rates as well as sediment SS was
found. Although, we did not quantify the sediment chl a that limits our conclusions to some
extent, our results suggest that chl a is probably not a good indicator of stability in the
presence of macrofauna. Although this parameter reflects characteristics of the biofilm, it
does not reflect the erosion behaviour or erosion rates of further sediment layers. Riethmüller
et al. (2000) suggests caution in using chl a as an index of stability citing the fact that chl a
concentrations in the sediments of the tidal flats of the German and Danish Wadden Sea were
not always related to critical erosion shear stresses, and that this relationship was found to be
highly site-specific.
4.4.3 Interaction between sediment stability parameters
Sediment SS values measured by us after erosion are directly proportional to
polychaete density (see also Meadows and Hariri, 1991). These surface measurements are
influenced by the eroded depth at which they were measured and it is known that SS generally
increases with depth (Amos et al., 1988; Underwood and Paterson, 1993). Although we
measured at different depths, the N. diversicolor effect on Em is much lower compared with
their effect on sediment SS (Fig. 4.6). The higher SS values found at the highest density
treatments are also related to the high mortality, and consequently effect the microbial
production as discussed previously. The relationship between Em and sediment SS after
erosion, is not very clear in the NOV experiment, particularly due to similar values of Em on

Chapter 4 - Nereis diversicolor effect on the stability of cohesive intertidal sediments
109
both treatments. In MAR, sediments with higher SS were related to higher Em and erosion
rates. In addition, erodability of sediments with similar SS is variable.
Our findings are in contradiction with the classical assumption that sediments with
high SS exhibit lower erosion rates. This assumption was recently verified by Watts et al.
(2003) on intertidal sediments at Tollesbury (Essex, UK); they used both Fall-Cone and CSM
devices, and erosion rate calculations from the si index. For our study we can take into
account that biologically-mediated sediments have a higher strengths, and that higher SS is
related to a higher compaction (Underwood and Paterson, 1993). In addition, such sediments
may have a higher probability of erosion as aggregates, rather than as loose material
(Luckenbach, 1986).
Although we found a relationship between SS and Ucrit , these parameters were not
related to erosion rates. These parameters are, therefore, not good indicators of erodability.
The lack of relationship between erosion rates and erosion thresholds has been mentioned by
several workers (Grant and Daburn, 1994; Blanchard et al., 1997; Sutherland et al., 1998),
suggesting that erosion rates are a better indicator of sediment stability than erosion threshold.
Houwing (1999) considered critical erosion threshold to be inadequate for characterising
erodability, since it is restricted to the upper layers of the bed only. Although critical erosion
threshold is related to the surface resistance against erosion, erosion rates are related more to
the resistance of the subsurface layers. In addition, Andersen (2001) found a large variation in
erosion rates for samples with similar erosion thresholds. There is still a strong tendency to
relate erosion rates with velocity parameters such as shear stress (Houwing, 1999; Wang,
2003). These relationships completely neglect the influence of the sediment properties that are
more likely to influence the quantity of eroded matter.
Although some studies use benthic fluff layers to predict erosion (Wang, 2003) and
positive relationships have been found between faecal pellets and erosion rates (Andersen,
2001), this seems to be a weak indicator for erodability, since there is almost no benthic fluff
after consecutive resuspension events (Jago et al., 2002). For gastropod Hydrobia ulvae,
Andersen et al. (2002) observed that low erosion thresholds were related to high faecal pellet
contents whereas both high and low thresholds were found at sites with low faecal pellet
contents. On the other hand, the relationship between erosion rates and faecal pellets can be
related to the presence of destabilising macrofauna rather than the presence of faecal pellets
itself.

PART III – INTERACCTION BETWEEN Nereis diversicolor AND SEDIMENT DYNAMICS
110
The correlation between erosion rates or erosion thresholds is also difficult to obtain
from sediment features such as water content, grain size or sediment fractions, as well as
biochemical measurements such as moisture and organic content, chl a and colloidal
carbohydrate concentrations (Underwood and Paterson, 1993; Houwing, 1999; Paterson et al.,
2000; Andersen, 2001).
The precision of sediment stability proxies, is related not only to the biofilm variability
factors such as emersion, seasonality, light intensity or day-night variations (Paterson et al.,
2000; de Brouwer and Stal, 2001; Friend et al., 2003), but also to macrofauna activity that can
be increased in the summer months (e.g. Rowden et al., 1998b).
4.5 Concluding remarks
This work contributes to clarifying the role of N. diversicolor on sediment
stabilisation, through the modification of sediment properties and an increase of Ucrit. The
stabilising effect of N. diversicolor reverses once Ucrit is established. N. diversicolor
enhancement of SS is likely to enhance aggregate erosion rates. Our results contribute
towards an understanding of the effect bioturbating macrofauna may have on the long-term
sediment dynamics of intertidal cohesive sediments. They confirm the importance of
biological processes on sediment transport and stress the need for further study in order to
understand their relative importance and interactions. Bioturbation processes can cause large
changes in property of sediment stability, and should be integrated in any management or
conservation models. We also demonstrate the need: (1) to clarify and obtain a better
understanding of factors that regulate sediment SS with depth in bioturbated sediments; (2) to
comprehend the effect of bioturbation activities on bed topography and on the velocities near
the surface; (3) to understand the influence of the biofilm on bioturbated sediment stability;
and (4) to examine further the relationships between SS and erodability in bioturbated
cohesive sediments. In particular, the relative importance of direct and indirect bioturbation
effects on sediment stability should be assessed.
4.6 Acknowledgements
Funding for this work was provided by the Portuguese Foundation for Science and
Technology contract PRAXIS/2/2.1/MAR/1733/95 and grant BTI/17285/98. We are very
grateful to Patrick Friend for his careful revision and constructive comments from which this

Chapter 4 - Nereis diversicolor effect on the stability of cohesive intertidal sediments
111
manuscript greatly benefited. We also like to thank Jody de Brouwer, who kindly helped to
improve the manuscript through his comments, criticism and discussion.
4.7 References
Abrantes, A., Pinto, F., Moreira, M.H., 1999 Ecology of the polychaete Nereis diversicolor in the Canal de Mira (Ria de Aveiro, Portugal): Population dynamics, production and oogenic cycle. Acta Oecol. 20 (4), 267-283
Amos, C.L., van Wagoner, N.A. Daborn, G.R., 1988 The influence of subaerial exposure on the bulk properties of fine-grained intertidal sediment from Minas basin, Bay of Fundy. Est Coast Shelf Sci. 27, 1-13
Amos, C.L., Feeney, T., Sutherland, T.F., Luternauer. 1997 The stability of fine-grained sediments from the Fraser river delta. Est Coast Shelf Sci. 45, 507-524
Anderson, J.G. Meadows, P.S., 1978. Microenvironments in marine sediments. Proceedings of the Royal Society of Edinburgh. 76B, 1-16
Andersen, T.J., .2001. Seasonal variation in erodability of two temperate microtidal mudflats. Est Coast Shelf Sci. 53, 1-2
Andersen, T.J., Jensen, K.T., Lund-Hansen, L., Mouritsen, K.N., Pejrup, M., 2002. Enhanced erodability of fine-grained marine sediments by Hydrobia ulvae. J Sea Res. 48, 51-58
Austen, I., Andersen, T.J., Edelvang, K., 1999. The influence of benthic diatoms and invertebrates on the erodability of an intertidal mudflat, the Danish Wadden Sea. Est Coast Mar Sci. 49. 99-111
Blanchard, G.F., Sauriau, P.-G., Cariou-Le Gall, V., Gouleau, D., Garet, M.-J., Olivier, F. 1997. Kinetics of tidal resuspension of microbiota: Testing the effects of sediment cohesiveness and bioturbation using flume experiments. Mar Ecol Pro Ser. 151, 17-25
Blanchard, G.F., Guarini, J.M., Orvain, F., Sauriau, P.-G. 2001. Dynamic behaviour of benthic microalgal biomass in intertidal mudflats. J Exp Mar Biol Ecol. 264, 85-100
Botto, F., Iribarne, O., 2000. Contrasting effects of two burrowing crabs (Chasmagnathus
granulata and Uca uruguayensis) on sediment composition and transport in estuarine environments. Est Coast Shelf Sci. 51, 141-151
Davey, J.T., 1994. The architecture of the burrow of Nereis diversicolor and its quantification in relation to sediment-water exchange. J Exp Mar Biol Ecol. 179, 115-129
Davey, J.T., Partridge, V.A., 1998.The macrofaunal communities of the Skeffling muds (Humber estuary), with a special reference to bioturbation. In: Black KS, Paterson DM and Cramp A (eds) Sedimentary processes in the intertidal zone. Special publications. Vol.139, pp. 155-124 Geological Society, London
Davies, W.R., 1993. The role of bioturbation in sediment resuspension and its interaction with physical shearing. J Exp Mar Biol Ecol. 171, 187-2000
de Brouwer, J.F.C., Stal, L.J. 2001. Short-terms dynamics in microphytobenthos distribution and associated extracellular carbohydrates in surface sediments of intertidal mudflat. Mar Ecol Prog Ser. 218, 33-44
de Deckere, E.M.G.T., Tolhurst, T.J., de Brouwer, J.F.C, 2001. Destabilisation of cohesive intertidal sediments by infauna. Est Coast Shelf Sci. 53, 665-669
de Jonge, V.N., van der Bergs, J., 1987. Experiments on the resuspension of estuarine sediments containing benthic diatoms. Est Coast Shelf Sci. 24, 725-740
Dyer, K.R., Christie, M.C., Manning, A.J., 2004. The effects of suspended sediment on turbulence within an estuarine turbidity maximum. Est Coast Shelf Sci. 59, 237-248

PART III – INTERACCTION BETWEEN Nereis diversicolor AND SEDIMENT DYNAMICS
112
Eckman, J.E., Nowell, A.R.M., Jumars, P.A., 1981. Sediment destabilisation by animal tubes. J Mar Res. 39: 361-374
Eckman, J.E., Nowell, A.R.M., 1984. Boundary skin friction and sediment transport about an animal-tube mimic. Sedimentology. 31, 851-862
Esselink, P. Zwarts, L., 1989. Seasonal trend in burrow depth and tidal variation in feeding activity of Nereis diversicolor. Mar Ecol Prog Ser. 56, 243-254
Fernandes S (2001) Bioturbation effects on the resuspension of estuarine sediments - tested in an annular flume. M.Sc. Thesis. IST/UTL, Lisbon. 96 pages
Fidalgo e Costa, P., Sarda, R., Cancela da Fonseca, L., 1998. Life cycle, growth and production of the polychaete Nereis diversicolor O.F. Müller in three lagoonal estuarine systems of the southerwestern portuguese coast (Odeceixe, Aljezur and Carrapateira). Écologie. 29 (4), 523-533
François, F., Gerino, M., Stora, G., Durbec, J.-P., Poggiale, J.-C., 2002. Functional approach to sediment reworking by gallery-forming macrobenthic organisms: modelling and application with the polychaete Nereis diversicolor. Mar Ecol Prog Ser. 229, 127-136
Friedrichs, M., Graf, G., Springer, B., 2000. Skimming flow induced over a simulated polychaete tube lawn at low population densities. Mar Ecol Prog Ser. 192, 219-228
Friend, P.L., Ciavola, P., Cappucci, S., Santos, R., 2003. Bio-dependant bed parameters as a proxy tool for sediment stability in mixed habitat intertidal areas. Cont Shel Res. 23, 1899-1917
Gerino, M., 1991 Quantification of burrow geometry and sediment reworking by the polychaete Nereis diversicolor. Symp Zool Soc Lond. 63, 305-307
Graf, G., Rosenberg, R., 1997, Bioresuspension and biodeposition: a review. J Mar Sys. 11, 269-278
Grant, J., Daburn, G., 1994. The effects of bioturbation on sediment transport on an intertidal mudflat. Neth J Sea Res. 32 (1), 63-72
Hansbo, S., 1957. A new approach to the determination of the shear strength of clay by the fall-cone test. Sw. Geot. Inst. Publ. No.14, Stockholm.
Houwing, E.-J., 1999. Determination of the critical erosion threshold of cohesive sediments on intertidal mudflats along the Duch Wadden Sea coast. Est Coast Shelf Sci. 49, 545-555
Jago, C.F., Jones, S.E., Latter, R.J., McCandliss, R.R., Hearn, M.R. Howarth, M.J., 2002. Resuspension of benthic fluff by tidal currents in deep stratified waters, northern North Sea. J Sea res. 48, 259-269
Jones, S.E., Jago, C.F., 1993. In situ assessment of modification of sediment properties by burrowing invertebrates. Mar Biol. 115, 133-142
Kornman, B.A., de Deckere, E.M., 1998. Temporal variation in sediment erodability and suspended sediment dynamics in the Dollard estuary. In: Black KS, Paterson DM and Cramp A (eds) Sedimentary processes in the intertidal zone. Special publications. Vol.139 (pp. 231-241) Geological Society, London
Lima, G., 2002. Respostas bioquímicas e fisiológicas do bivalve Scrobicularia plana (da Costa) em exposição a sedimentos naturais contaminados. Mc S. Thesis. FCT-UNL, Caparica. 77 pages
Lorenzen, C.J., 1967. Determination of chlorophyll and pheo-pigments: spectrophotometric equation. Limnol Oceanogr. 12 (2), 343-346
Lucas, C.H., Widdows, J., Brinsley, M.D., Salkeld, P.N., Herman, P.M.J., 2000. Benthic-pelagic exchange of microalgae at a tidal flat. 1. Pigment analysis. Mar Ecol Prog Ser. 196, 59-73

Chapter 4 - Nereis diversicolor effect on the stability of cohesive intertidal sediments
113
Luckenbach, M.W., 1986. Sediment stability around animal tubes: the roles of hydrodynamic process and biotic activity. Limnol Oceanogr. 31 (4), 779-787
Maa J P-Y, Sanford L and Halka JP (1998) Sediment resuspension characteristics in Baltimore Harbour, Maryland. Mar Geol 146: 137--145
Mazik K and Elliot M (2000) The effect of chemical pollution on the bioturbation potential of estuarine intertidal mudflats. Helgol Mar Res 54: 99--109
Meadows PS and Tufail A (1986) Bioturbation, microbial activity and sediment properties in an estuarine ecosystem. Proceedings of the Royal Society of Edinburg 90B, 129--142
Meadows, P.S., Tait, J., 1989. Modification of sediment permeability and shear strength by two burrowing invertebrates. Mar Biol. 101, 75-82
Meadows, P.S., Tate, J., Hussain, A., 1990. Effects of estuarine infaunal on sediment stability and particle sedimentation. Hydrobiologia. 190, 263-266
Meadows, P.S., Hariri, M.S., 1991. Effects of two infaunal polychaetes on sediment shear strength and permeability: an experimental approach. Symp Zool Soc Lond. 63, 319-321
Mehta, A.J., Hayter, E.J., Parker, W.R., Krone, R.B., Teeter, A.M., 1988. Cohesive sediment transport. I: Process description. J Hydraulic Engineering. 115 (8), 1076-1093
Miller, D.C., Geider, R.J. MacIntyre, H.L. 1996. Microphytobenthos: The ecological role of the "Secret Garden" of unvegatated, shallow-Water marine habitats. II. Role in sediment stability and shallow- water food webs. Estuaries, 19 (2A), 202-212
Mouritsen, K.N., Mouritsen L.T., Thomas Jensen, K.T. 1998. Change of topography and sediment characteristics on an intertidal mud-flat following mass-mortality of the amphipod Corophium volutator. J Mar Biol Ass U.K 78: 1167-1180
Murray, J.M.H., Meadows, A., Meadows, P.S., 2002. Biogeomorphological implications of microscale interactions between sediment geothecnics and marine benthos: a review. Geomorphology. 47, 15-30
Paterson, D.M., Tolhurst T.J., Kelly, J.A., Honeywill, C., de Deckere, E.M.G.T., Huet, V., Shayler, S.A., Black, K.S., de Brower, J. Davidson, I. 2000. Variations in sediment properties, Skeffling mudfalt, Humber Estuary, UK. Cont Shelf Res. 20, 1373-1396
Peletier, H., 1996. Long-term changes in intertidal estuarine diatom assemblages related to reduce input of organic waste. Mar Ecol Prog Ser. 137, 265-271
Rasmussen, A.D., Banta, G.T. Andersen, O., 1998. Effects of bioturbation by the lugworm Arenicola marina on cadmium uptake and distribution in sandy sediments. Mar Ecol Prog Ser. 164, 179-188
Riethmüller, R., Heineke, M., Kühl, H., Keuker-Rüdiger 2000. Chlorophyll a concentration as an index of sediment surface stabilisation by microphytobenthos? Cont Shelf Res. 20, 1351-1372
Rowden A.A., Jones, M.B., Morris, A.W., 1998a. The role of Callianassa subterranean (Montagu) (Thalassinidea) in sediment resuspension in the North Sea. Cont Shelf Res. 18, 1365-1380
Rowden, A.A., Jago, C.F. Jones, S.E. 1998b. Influence of benthic macrofauna on the geothecnical and geophysical properties of surficial sediment, North Sea. Cont Shelf Res. 18, 1347-1363
Rutgers van der Loeff. M,M,. Boudreau, B.P., 1997. The effect of resuspension on chemical exchanges at the sediment water interface in the deep sea - A modelling and natural radiotracer approach. J Mar Sys. 11, 305-342
Shimeta, J., Amos, C.L., Beaulieu, S.E., Ashiru., O.M., 2002. Sequencial resuspension of protists by accelarating tidal flow: Implications for community structure in the benthic boundary layer. Limnol Oceanogr. 47 (4) 1152-1164

PART III – INTERACCTION BETWEEN Nereis diversicolor AND SEDIMENT DYNAMICS
114
Smith, D., Hughes, R.G., Cox, E.J. 1996. Predation of epipelic diatoms by the amphipod Corophium volutator and the polychaete Nereis diversicolor. Mar Ecol Prog Ser. 145 , 53-61
Sobral, P., Widdows, J., 2000. Effects of increasing current velocity, turbidity and particle size selection on the feeding activity and scope for growth of Ruditapes decussatus from Ria Formosa, southern Portugal. J Exp Mar Biol Ecol. 245,111-125.
Sohma, A., Sekiguchi, Y., Yamata, H., Sato, T., Nakata, K., 2001. A new coastal marine ecosystem model study coupled with hydrodynamics and tidal flat ecosystem effect. Mar Poll Bull. 43 (7-12), 187-208
Sutherland, T.F., Amos, C.L., Grant. J., 1998. The effect of buoyant films on the erodability of sublittoral sediments of a temperate microtidal estuary. Limnol Oceanogr. 43, 225-235
Trevor, J.H., 1977. The burrowing of Nereis diversicolor O.F. Müller, together with some observations on Arenicola marina (L.) (Annelida: Polychaeta). J Exp Mar Biol Ecol. 30, 129-145
Underwood, G.J.C., Paterson, D.M., 1993. Recovery of intertidal benthic diatoms after biocide treatment and associated sediment dynamics. J Mar Biol Ass UK. 73, 25--45
Underwood, G.J.C., Smith, D.J., 1998. Predicting epipelic diatom exopolymer concentrations in intertidal sediments from Sediment Chlorophyll a. Microb Ecol. 35, 116-125
Vedel, A., Andersen, B.B. Riisgård, H.U., 1994 Field investigations of pumping activity of the facultative filter-feeding polychaete Nereis diversicolor using an improved infrared phototransducer system. Mar Ecol Prog Ser. 103, 91-101
Wang, Y.H., 2003. The intertidal erosion rate of cohesive sediment: a case study from Long Island Sound. Est Coast Shelf Sci. 56, 891-896
Watts, C.W., Tolhust, T.J., Black, K.S., Whitmore, A.P., 2003. In situ measurements of erosion shear stress and geotechnical shear strength of the intertidal sediments of the experimental managed realignment scheme at Tollesbury, Essex, UK. Est Coast Shelf Sci. 58, 611-620
Widdows, J., Brinsley, M.D., Bowley, N., Barret C 1998a. A benthic annular flume for in situ measurement of suspension feeding/biodeposition rates and erosion potential of intertidal cohesive sediments. Est Coast Shelf Sci 46: 27-38
Widdows, J., Brinsley, M.D., Elliot, M., 1998b. Use of in situ flume to quantify particle flux (biodeposition rates and sediment erosion) for an intertidal mudflat in relation to changes in current velocity and benthic macrofauna. In: Black, K.S.; D.M. Paterson & A. Cramp (Eds.) Sedimentary processes in the intertidal zone. Special publications, Vol.139, pp. 85-97. Geological Society, London
Widdows J, Brinsley MD, Salkeld PN and Lucas CH (2000) Influence of biota on spatial and temporal variation in sediment erodability and material flux on a tidal flat (Westerschelde, The Netherlands). Mar Ecol Prog Ser 194: 23-37
PART IIIINTERACCTIONS BETWEEN
AND
SEDIMENT DYNAMICS
Measuring bioturbation of
with luminophores: experimental and
modeling artifacts
Nereis diversicolor
Nereis diversicolor
Chapter 5


Chapter 5 – Bioturbation of N. diversicolor using luminophores
117
MEASURING BIOTURBATION OF NEREIS DIVERSICOLOR WITH
LUMINOPHORES: EXPERIMENTAL AND MODELING ARTIFACTS
Abstract
Bioturbation activities are very important for mineralization at the sediment water-interface
and also for changes in the sediment properties. The aim of this work is to quantify the bioturbation of
three densities of N. diversicolor (320, 450 and 570 ind m-2). Three experiments were conducted on
cohesive sediments over 21 days. Bioturbation was measured as biodiffusion coefficients (Db), using
luminophores as tracers. Db were estimated using two different calculation methods: M1, the most
common biodiffusion model; M2, a model giving more emphasis to the concentrations in the lower
layers. The Db´s observed in this work were not proportional to density, which is probably related to
the different experimental mesocosms used in the different experiments. Db estimations using M1 and
M2 varied over time. The M2 procedure showed to have better fit to the tracer concentration in the
deeper layers. These findings brought up some questions regarding the experimental procedure.
Herein, the source of misinterpretations observed in this work is discussed and some recommendations
are provided.
Key-words: cohesive sediments, bioturbation, Nereis diversicolor, luminophores, biodiffusion model.
5.1 Introduction
Biological activities influence the biogeochemical fluxes of solutes and reaction rates
over the sediment-water interface, stimulating aerobic decomposition in the sediment creating
a mosaic of microenvironments (Aller and Aller, 1992; Fenchel, 1996; Kristensen, 2000).
This regeneration enhancement is particularly important in the upper centimetres of oceanic
sediments, where molecular diffusion in the upper layers is the dominant mode of transport to
the water column (Middelburg et al., 1997; Berg et al., 2001)
These activities, such as food search and gallery/burrow building, result in
redistribution of particles, enhancement of pore water transport and improve irrigation
conditions and oxygen concentrations within the sediments (Aller, 1983; Aller and Aller,
1998; Forster et al., 1999; Mortimer et al., 1999; Kristensen, 2000: Nielsen et al., 2004). The
effect of biological activity increases microbial degradation of matter along the oxic walls of

PART III – INTERACCTION BETWEEN N. diversicolor AND SEDIMENT DYNAMICS
118
infaunal burrows, enhancing the decomposition of organic and inorganic matter, nutrients and
pollutants (Aller, 1983; Andersen and Kristensen, 1992; Davey and Watson, 1995; Aller and
Aller, 1998; Gerino et al., 1999; Hansen et al., 1999; Kristensen, 2000; Hammerschmidt and
Fitzgerald, 2004).
The majority of these works focused in the effect of bioturbation on solutes, but few
focus on particles distribution. Although bioturbation have a significantly smaller effect on
solids than on solutes (15 to 20 times smaller) (Berg et al., 2001), the particle mixing activity
is also important for its influences on the recruitment of planktonic populations by generating
the burial and the return of buried diapause eggs and cysts to the sediment surface. Particle
redistribution increases the opportunities for these eggs to hatch as they repeatedly cycle past
the water-sediment interface (Marcus and Schmitd-Gengenbach, 1986), but can also play a
negative role on the viability of cysts that have passed through polychaetes’ gut (Giangrande
et al., 2002).
To quantify these bioturbation activities several tracers are used to access sediment
mixing, such as particle-reactive radionuclides (Sandnes et al.,2000a,b; Berg et al., 2001;
Shull and Mayer, 2002; Dellapenna et al., 2003), chlorophyll a (Boon and Duineveld, 1998;
Green et al., 2002), glass beads (Marcus and Schmitd-Gengenbach, 1986; Berg et al., 2001)
and luminophores (Caredec et al., 2004; Ouellette etal., 2004; Solan et al., 2004). Some of
them being more accurate than others (Middelburg et al., 1997; Gerino et al., 1998; Berg et
al., 2001). The luminophores method showed good agreement between field and laboratory
estimations and predict similar orders of magnitude of biodiffusive mixing estimated using
234Thorium and Chl a (Gerino et al., 1998).
Several in situ studies focus on the effect of the community bioturbation in relation to
the present feeding types (Gerino et al., 1995, 1999; Flach et al., 1998; Turnewitsch et al.,
2000; Green et al., 2002), scales of bioturbation according to the relation height-width of the
present organisms (Swift et al., 1996), or the presence of burrows (Dellapenna et al., 1998).
Although the bioturbation found in these works is related with the present communities, they
include a high heterogeneity of species composition and not only is difficult to compare them,
as it is not possible to evaluate the effect of individual species that are known to have different
sediment mixing modes and turnover rates, feeding strategies and mobility (François et al.,
1997 (and references within), 2002; Kristensen, 2000; Sandness et al., 2000a).
The estimation of the mixing bioturbation activity in the sediment is normally
expressed as biodiffusion coefficients, Db. This incorporates all animal activities affecting the
sediment, such as local passive transport (mechanical sediment mixing) and non-local active

Chapter 5 – Bioturbation of N. diversicolor using luminophores
119
transport (through the digestive/gut way), into a single coefficient. This parameter can be
estimated individually for solids and solutes (Sandness et al., 2000b: Berg et al., 2001) and it
is known to be influenced by total community biomass (Sandnes et al., 2000a), the density of
organisms (Retraubun et al., 1996), temperature (Aller and Aller, 1992; Gerino et al., 1998;
Ouellette et al., 2004), body weight (Giangrande et al., 2001), sediment porosity (Aller and
Aller, 1992; Mulsow et al., 1998) and availability of organic matter (Gerino et al., 1998).
Due to the variety of models to estimate Db and the specification of model estimation
for each tracer, the comparisons among results becomes complex (Swift et al., 1996;
Dellapenna et al., 1998; Gerino et al., 1998; Turnewitsch et al., 2000; Green et al., 2002). In
addition, only few works compare tracers distribution obtained in the presence of macrofauna
with controls with the absence of macrofauna (Sandnes et al., 2000a; Ulsow et al., 2002;
Ouellette et al., 2004). Most of the studies which employ Db estimations based on tracer
distribution do not refer the values for control situations (Gerino et al., 1998; Hansen et al.,
1999; Caradec et al., 2004). The lack of control measurements is sometimes linked to the fact
that defaunating methods would alter the sediment structure (Berg et al., 2001), although was
reported that defaunation using microwaves do not affect sediment porosity (Aller and Aller,
1992).
Some authors use experimental mesocosms with small areas (30 to 100 cm2) and
considerable depths (up to 30 cm) (Marcus and Schmitd-Gengenbach, 1986; Gerino et al.,
1994; Berg et al., 2001; François et al., 2002; Ouiellette et al., 2004) to assess the effect of
macrofauna in the distribution of tracers. In these works, although the number of organisms
used per mesocosms is proportional to the tested densities, the small horizontal area at which
the organisms are exposed forces them to move in a limited space, increasing reworking
activity into a certain extent. To avoid this artefact, the present study was performed in a
larger area, employing core sampling to access tracers distribution in depth (Sandnes et al.,
2000a).
The present work, examines the effect of the ragworm Nereis diversicolor on sediment
reworking. This species is a well studied gallery-diffusor (François et al., 2002), being one of
the most abundant infaunal benthic organisms in Europe, who lives in complex gallery
networks that can extend down to 30 cm depth (according to body length), in burrows
diameters from 0.5 to 4 mm (Andersen and Kristensen, 1992; Webster, 1992; Kristensen,
2000) and mean burrow surface ares of 1, 10 and 25 cm2 for small, medium and large worms
(Davey, 1994). Its burrow lines increase the surface area from 0 to 420% in densities <100 to

PART III – INTERACCTION BETWEEN N. diversicolor AND SEDIMENT DYNAMICS
120
13100 ind m-2 (Mortimer et al., 1999). François et al. (2002) measured Db of 3.18 cm2 y-1 in
the presence of a population of 800 N. diversicolor m-2, based on Gerino’s experiments
(Gerino and Stora, 1991; Gerino, 1992, in François et al., 2002).
The aim of this work is to understand how estimations of Db are affected by: 1) the
density of organisms, 2) sampling incubation time for measurements, 3) the calculation
procedures.
5.2 Materials and methods
5.2.1 Organisms, sediment and water collection
Three experiments were performed in November 2000, March 2001 and January 2002
using three densities of N. diversicolor. In all occasions, organisms (10 to 15 cm length) were
collected in Rosarinho (Tagus estuary, Portugal), brought to the laboratory and allowed to
stabilize under the experimental conditions for a period of about 5 days before introduction in
the experimental mesocosms. Typical densities are in the range of 1000-2000 ind m-2 for adult
populations, but can reach up to 16000 ind m-2 for juvenile populations in spring (Davey,
1994; Fidalgo e Costa et al., 1998).
Intertidal estuarine sediments from Ponta da Erva (Tejo estuary) were scooped from
the top 1 cm during low tide, brought to the laboratory where they were kept at 40C (to reduce
biological activity) until mesocosms set-up. Recent grain size analysis at Ponta da Erva (using
a Malvern®Mastersizer 2000, n=3) showed that sediment is mostly composed by silts and
clays (75.4 ± 5.4 % and 22.9 ± 6.2 respectively) and median grain size (10d50) is 9.8 ± 2.0
µm. Besides the fine fraction only a small percentage of very fine sand was present, 1.7 ± 0.9
% (Soares & Sobral, unpublished data).
Seawater used at IMAR-FCTUNL facilities is collected on the coast, 30 Km west of
Lisbon, and supplied periodically to our major tank by the navy. The seawater is kept in the
laboratory in a continuous recirculation aerated system and under temperature controlled
conditions.
5.2.2 Mesocosm set-up
Sediments were hand defaunated for macrofauna, after which they were homogenised
and introduced in the mesocosms. The number of mesocosms was prepared according to the
number of sampling days (one per sampling day). On the following day, N. diversicolor were
introduced in the mesocosms and allow to burry in the sediment. All the experimental

Chapter 5 – Bioturbation of N. diversicolor using luminophores
121
mesocosms were 8 cm depth, which is the depth at which most of N. diversicolor are found,
given the fact that they burrow deeper in sand than in mud (Anderson and Meadows, 1978;
Esselink and Zwarts, 1989; Davey, 1994).
The activity of N. diversicolor was accessed using fluorescent particles (luminophores,
80 – 180 µm) (Mahaut and Graf, 1987; Gerino et al., 1998) that were added in a fine layer
into the sediment surface, enough to assure that vertical transport rate would not be influenced
by the lack of tracers in the top of the sediment (Gerino et al., 1994). The mesocosms were
placed in tanks that were carefully filled with sea water, in order to avoid resuspension of the
luminophores. The mesocosms were then allowed to stabilise under experimental conditions
with a water column of 2 cm, under a continuous flow-through system (~ 3 L h-1) with
constant aeration. At each sampling day 3 cores (area of 3.5 cm2) were taken from each
mesocosms and immediately frozen until analysis. Mesocosms were defaunated in order to
estimate the final density. As the final density was related with mortality, organisms escaping
during incubation or killed during core sampling, an average density was estimated from the
initial and the final density.
Experiment 1 In November 2000, 40 organisms (0.11 g dry weight (DW) ind-1, n=20)
were introduced in mesocosms with an area of 0.0875 m2 and 8 cm height (a density of 450
ind m-2). Sampling was performed after 20 days of stabilisation under experimental
conditions (temperature 150C ± 1; salinity 36 and light 57µmol m-2 s-1 ± 11 with a 12 hour
photoperiod). After the experiment average density was estimated to be 320 ind m-2.
Experiment 2 In March 2001, 17 organisms (0.09 g DW ind-1, n=20) were introduced
in each mesocosms with an area of 0.0270 m2 and 8 cm height (a density of 600 ind m-2).
Sampling was done at days 3, 7, 14, 21 and 28. Experimental conditions were the same as
Exp.1. After the experiment average density was estimated to be 450 ind m-2.
Experiment 3 In January 2002, 24 organisms (0.08 g dry weight (DW) ind-1, n=22)
were introduced in each mesocosms with an area of 0.0270 m2 and 8 cm height (a density of
900 ind m-2). Sampling was done at days 2,7,15 and 21 days of stabilisation under
experimental conditions (temperature 170C ± 1; salinity 36 and light 54 µmol m-2 s-1 ± 23 with
a 12 hour photoperiod). After the experiments average density was estimated to be 570 ind m-
2. The results of this experiment were already mentioned in a work about the bioturbation
effect of N. diversicolor under the effect of copper spiked sediments (Fernandes et al., 2006).

PART III – INTERACCTION BETWEEN N. diversicolor AND SEDIMENT DYNAMICS
122
5.2.3 Luminophores analysis
Frozen cores were sliced in 0.5 cm layers for the top first cm and in 1 cm layers for the
layers bellow. Each sample was dried (90ºC, 48h) and homogenised (Mahaut and Graf, 1987).
Within each layer, sub samples of 0.25g were taken for counting luminophores in an
epifluorescence microscope (Olympus BX60). From this, the number of luminophores per
layer (n) and the total number in the profile (N we obtained, the fraction (n/N) of
luminophores per layer could be determined. The concentration of luminophores was
estimated as ( )C n z * A * N= , where z (cm) is the thickness of sampling layer and A the
core area.
5.2.4 Db estimations
Bioturbation was estimated in terms of biodiffusion coefficients (Db) that were
estimated using the classical one-dimensional biodiffusion model (Boudreau, 1986;
Wheatcroft et al., 1990; Meysman et al., 2003), which is governed by
( ) ( )2
2
, ,= .b
C x t C x tD
t x
∂ ∂
∂ ∂ [1]
Initially, it is assumed that the luminophores are located in a very narrow layer at the water-
sediment interface, as idealized by following initial conditions
( ),0 = (x).C x δ [2]
where (x)δ represents the Dirac delta function. Over the infinite interval, the initial-value
problem [1]-[2] has the solution (Crank, 1975)
( )2
, exp4
= −
bb
N xC x t
D tA D tπ [3]
where N is the number of luminophores originally spread at the sediment surface , and A
represents the surface area. Because concentrations are expressed relative to the total number
of luminophores found in the profile, a value of 1=N should be substituted.
Values for Db were obtained by matching expression [3] to the observed data profiles.
For this purpose, two separate procedures were employed. In a first approach (M1), the

Chapter 5 – Bioturbation of N. diversicolor using luminophores
123
untransformed data was used. Accordingly, the biodiffusion coefficient bD was estimated
using the least-squares method, i.e. by minimizing the cost function
model data 2
11
( )=
= −∑N
i i
i
R C C [4]
In a second procedure (M2), the data were log-transformed, and the alternative cost function
was minimized
model data 2
21
(ln ln )=
= −∑N
i i
i
R C C [5]
to estimate a second value for the biodiffusion coefficient bD .
Effectively, both procedures use a different weighting of the data when calculating
their “optimal” Db values. The M1 procedure emphasizes the large luminophores
concentrations near to the surface, and thus fits the concentration data in the top layers best. In
contrast, the M2 procedure emphasizes the difference between model and data at low
concentrations values, and thus will provide a better fit to the concentration data in the deeper
layers.
Theory predicts that if the actual bioturbation mechanism is truly diffusive, i.e. if
biological activity generates effectively isotropic, small-scale particle displacements
(Meysman et al., 2003), then both procedures should generate the Db same value. However, if
the underlying macrofauna activity is not generating diffusive particle displacements, then Db
values generated by the M1 and M2 procedures can show large deviations (see below). In
particular, when non-local transport mixes particles faster down than expected, one can expect
large discrepancies between the Db estimates. Accordingly, we propose the following non-
locality index (NLI) based on the Db values obtained using M1 and M2 procedures:
[ ] [ ][ ]
b 2 b 1
b 1
D M D MNLI
D M
−= [8]
As required, this non-locality index NLI takes the zero value when Db estimates from M1 and
M2 have the same value.
The temporal scales of measurements varies from hours (Sandnes et al., 2000a; Berg
et al., 2001; Solan et al., 2004) to months (Marcus and Schmitd-Gengenbach, 1986; Gerino et
al., 1994; Gilbert et al., 2003) and this lack of consistency might produce decrease in

PART III – INTERACCTION BETWEEN N. diversicolor AND SEDIMENT DYNAMICS
124
estimation accuracy. To evaluate the effect of sampling time on the estimation of Db, the
distribution of luminophores was monitored over a period of up to 28 days.
5.2.5 Statistical analysis
Data was analyzed through one -way and 2-way ANOVA, and Tukey HSD post-hoc
comparisons test using the STATISTICA® 6.1 software. Some of the data profiles could not
be transformed to match the homogeneity assumption (Levene's test). According to
Underwood (1997) the validity and power of the ANOVA test and the probabilities associated
with the F-ratio distribution are not much affected by the violations of this assumption and
therefore we decided to proceed with ANOVA for all the data, though extreme care was taken
on the interpretation of low levels of significance.
5.3 Results and discussion
5.3.1 Control interpretation
The comparison of the luminophores concentration, on Exp. 3, between 570 and the
respective control (Fig. 5.1a), after 21 days of incubation, shows similar values, with no
statistical significance, although the control treatment shows lower values bellow 3 cm depth.
The percentage of standard deviations over the respective average (Fig. 5.1b) indicates that
the variability of results is higher in the controls. This counteracts the hypothesis that higher
standard deviations are to be expected when non-local transport due to animal activity can
take place.
The results found in the controls greatly compromise the interpretation of data, since
the transport of particles to lower layers attributed to N. diversicolor happens in the controls
where these organisms are not present.
Considering the effect of coring artefacts and subtracting the control values,
concentrations of luminophores in lower layers due to the activity of N. diversicolor become
negative in the upper 2cm (Fig. 5.1c). Bellow 2 cm, values become in average 36% lower
than the values without control subtraction.

Chapter 5 – Bioturbation of N. diversicolor using luminophores
125
0
1
2
3
4
5
6
0 100 200
% sd on Av
de
pth
(cm
)
Ct 570
570
0
1
2
3
4
5
6
0.0001 0.01 1
concentration
depth
(cm
)
Ct 570
570
a b c
0
1
2
3
4
5
6
-0.1 -0.05 0 0.05 0.1
concentration
dep
th (
cm
)
570 - Ct
0
1
2
3
4
5
6
0 100 200
% sd on Av
de
pth
(cm
)
Ct 570
570
0
1
2
3
4
5
6
0.0001 0.01 1
concentration
depth
(cm
)
Ct 570
570
a b
0
1
2
3
4
5
6
0 100 200
% sd on Av
de
pth
(cm
)
Ct 570
570
0
1
2
3
4
5
6
0.0001 0.01 1
concentration
depth
(cm
)
Ct 570
570
a b c
0
1
2
3
4
5
6
-0.1 -0.05 0 0.05 0.1
concentration
dep
th (
cm
)
570 - Ct
Figure 5.1 - Comparison between the 570 density of N. diversicolor (570) and respective control (Ct 570) for the luminophores concentration profiles found after 21 incubation days, in terms of a) luminophores concentration, b) the percentage of standard deviation over the respective average, and c) 570 concentrations with respective control subtraction.
It is possible that the transport observed in the controls is a result of core artefact
during core sampling rather the activity of N. diversicolor. During penetration, the core
produces a compression of the sediment at the top most portions and sediment is pushed aside
rather than entering the tube and in addition there is also the effect of internal friction in the
areas near the walls (Crusius and Anderson, 1991; Wright, Jr., 1993). This can result into a
shorter core with low water content (Blonqvist, 1991). Core shortening is the difference
between the depth of sediment recovered and the depth of core penetration and core
compression is just a mechanism that could account for core shortening (Cumming et al.,
1993).
It is known that diffusion of particles in control sediments is observed until 1.25 cm
depth (Sandnes et al., 2000) (defaunated with a solution of 30% NaCl) and until 3 - 4 cm
(Marcus and Schmitd-Gengenbach, 1986; Webb and Montagna, 1993) in defaunated
sediments. Rusch and Huettel (2000) found a penetration of microbeads (1 – 30 µm) up to 5
cm depth in fine sand sediments containing no macrofauna. It is not clear if the tracers
distribution in the depth is due to hydrodynamic disturbance at the surface, due to mechanical
diffusion or due to micro and meiobenthos activity. Defaunation was avoided by Berg et al.
(2001) who considered that defaunation methods would alter the sediment structure.

PART III – INTERACCTION BETWEEN N. diversicolor AND SEDIMENT DYNAMICS
126
The same similarity between Db in controls and treatments was found by Mulsow et
al. (2002) in an experiment with Heteromastus filiformis. In both cases (Berg et al., 2001;
Mulsow et al., 2002), there was no coring artefact, since the tracers were added to the cores
after coring collection, and the fauna present in the sediments was mostly meiofauna
comprising foraminifers (63%), nematodes (27%), copepods (5%) and annelids (5%). Also
Ouelette et al. (2004) report penetration of luminophores down to 2 cm on control sediments
sieved from macrofauna (1mm mesh) that were not subjected to coring. They explain these
results by the density differences between luminophores and sediments, inducing a little
particle displacement towards deeper sediments, while reducing the importance of meiofauna
in this deep tracers burial by concluding that the penetration of tracers caused by meiofauna
would increased in time, which was not the case for the controls between day 5 and 30.
Furthermore, the core sampling in the present work was performed in zones with high
concentration of luminophores in order to assure that vertical transport rate would not be
influenced by the lack of tracers in the top of the sediment (Gerino et al., 1994). This might
have introduced another sampling artefact in the Db estimations, since zones of lower
luminophores concentration at the surface, might result in higher luminophores burrowing.
The sampling method used in the present work, might have forced the collection of cores in
zones with low tracer transport. In addition, sampling on areas with high concentrations of
luminophores increases the probability for luminophores smearing during coring.
Another artefact can be generated during core slicing, where possible leakage between
the pistons and the tube or accidental mixing caused by a small stones or shells can allow the
pore water to drain down through the sediment making the tracers appear to extend deeper
into the sediment than their true position and producing an overestimation of Db (Berg et al.,
2001). The possibility of core slicing artefacts was reduced in the present work since sediment
was frozen and muddy sediments have a reduced drainage (Berg et al., 2001).
The penetration of particles up to 4 cm depth gives a strong indication of a sampling
artefact, however, some considerations bring some doubts of whether the controls are really
true controls, and if, by taking them into account we are just introducing an interpretation
artefact. In the present work, the sediment in the controls was not defaunated for micro or
meiofauna (just for macrofauna) and the transport observed in the controls, can be also a
result of meiofauna bioturbation. Meiofauna are known to increase solute transport
coefficients in surface sediments by ~ 1.3 – 2 times molecular diffusion (at the same
porosity), but tends to be less than macrofauna who typically produce elevations of 2-10 times
in molecular diffusion (Aller and Aller, 1992). It is also possible that the meiofauna

Chapter 5 – Bioturbation of N. diversicolor using luminophores
127
population in the controls is enhanced, as a consequence of predation by N. diversicolor.
Considering this assumption, the results indicate that N. diversicolor has a larger influence in
the sediment bellow 2 cm depth.
On a parallel experiment, about the effect of N. diversicolor on sediment erodability
(Fernandes et al, 2009), it was observed that this species alters the characteristics of the
sediment by increasing sediment shear strength and thus, changing the conditions for
advection diffusion. Similar observations by Meadows and Tait (1989) indicate that N.
diversicolor increases sediment permeability and shear strength. In a work using Br- and Cl–
tracers to measure solute transport, Aller and Aller (1992) found lower diffusion coefficients
in defaunated controls than on treatments containing meiofauna (nematodes, ostracodes,
copepods, foraminiferans) and they concluded that 20 – 40 % of the increased transport was
due to increased porosity. Likewise, the sediments are not in the same conditions and
comparisons with controls might lead into an interpretation artefact.
Another problem present in this work was the fact that the luminophores counting was
done manually. Meaning that due to the lack of a large number of particles in the controls, the
smaller particles would have the same weight as big particles observed in the 570 treatment,
where smaller particles like luminophores “dust” would be neglected. In this way, the
numbers of particles counted in the controls are overestimated.
Considering that controls without macrofauna do not reflect the same physical
properties of the sediment (Aller and Aller, 1992; Berg et al., 2001) we shall neglect them in
our interpretations, even though they give an indication of possible sampling artefact, that
limits our conclusions into a certain extent.
5.3.2 Luminophore concentrations
The comparisons of the luminophore profiles measured on different densities and on different
sampling days, showed similar results (Fig. 5.2). There was no statistical significance among
densities, except for day 20/21, bellow 1 cm layer, between 450 and 320 (p< 0.01) according
to Levene’s post-hoc test.
The concentration of luminophores showed no variation over time, in opposition to the
observation of Francois et al. (2002), who found deeper concentrations of luminophores after
30 days (20 cm deep) than after 15 days (15 cm deep) in sediments bioturbated by N.
diversicolor. Similar results were observed by Ouellette et al. (2004) for Neanthes virens.

PART III – INTERACCTION BETWEEN N. diversicolor AND SEDIMENT DYNAMICS
128
Figure 5.2 – Profiles of luminophores concentration in depth estimated over time after bioturbation of N. diversicolor for densities of 320, 450 and 570 ind m-2.
5.3.3 Db estimations
Db estimation using two different procedures for all the densities and over the
sampling times are expressed on Table 5.1 and on Figure 5.3.
Table 5.1 – Biodiffusion coefficient values (cm2 y-1) estimated with the two different estimation methods (M1 and M2) and the NLI (non-locality index) for the three densities tested, 320, 450 and 570 ind m-2.
Density Sampling days M1 M2 NLI
320 20 1.93 ± 0.74 73 ± 28 48 ± 40
450 3 3.90 ± 0.08 94 ± 63 23 + 16
7 3.81 ± 3.51 101 ± 63 31 ± 8
14 0.98 ± 0.21 33 ± 9 33 ± 7
21 0.60 ± 0.03 21 ± 4 34 ± 6
28 0.44 ± 0.02 19 ± 2 43 ± 2
570 2 4.52 ± 2.30 493 ± 141 160 ± 152
7 1.79 ± 0.05 142 ± 52 79 ± 30
15 0.84 ± 0.08 48 ± 19 57 ± 27
21 0.59 ± 0.02 56 ± 18 94 ± 28
570 Ct 21 0.64 ± 0.10 21 ± 10 32 ± 10
day 7
0
1
2
3
4
5
6
7
0.0001 0.01 1
concentration
dep
th (
cm
)
day 15
0
1
2
3
4
5
6
7
0.0001 0.01 1
concentration
dep
th (
cm
)
day 20/21
0
1
2
3
4
5
6
7
0.0001 0.01 1
concentration
de
pth
(cm
)
450
570
320
day 2/3
0
1
2
3
4
5
6
7
0.0001 0.01 1
concentration
depth
(cm
)
day 7
0
1
2
3
4
5
6
7
0.0001 0.01 1
concentration
dep
th (
cm
)
day 15
0
1
2
3
4
5
6
7
0.0001 0.01 1
concentration
dep
th (
cm
)
day 20/21
0
1
2
3
4
5
6
7
0.0001 0.01 1
concentration
de
pth
(cm
)
450
570
320
day 2/3
0
1
2
3
4
5
6
7
0.0001 0.01 1
concentration
depth
(cm
)

Chapter 5 – Bioturbation of N. diversicolor using luminophores
129
0
1
10
100
1000
0 5 10 15 20 25 30
time (days)
Db (
cm
2 y
-1) 450 M1
450 M2
570 M1
570 M2
320 M1
320 M2
Figure 5.3 - Biodiffusion coefficients over the bioturbation period for a population of N.
diversicolor of 320, 450 and 570 ind m-2 (± standard deviation) estimated using M1 and M2 methods.
Db estimations based on the two procedures showed quite different scales. Db ranged
from 0.4 to 7.9 using M1 procedure and from 16.1 to 504.0 using M2 procedure. Db values
over time, were slightly higher in 570 density, than on 450, but there was no statistical
significance between the two treatments.
A comparison of Db estimates after 20 days (for 320 treatment) and 21 days (for 450
and 570) revealed no relationship between Db and density (Fig. 5.4). The treatments with
comparable areas (270 cm2, 450 and 570) showed higher Db for 570, using M2 procedure, but
similar values were observed using M1 procedure (Fig. 5.4). A small area limits the activity
of the organisms and increases the probability of one individual to pass over the same spot,
and consequently promotes the interpretation of higher reworking activity and higher Db. On
most of the works with a smaller surface area the vertical area is also deep, and it is also
possible that penetration depths are enhanced by an artefact caused by horizontal space
limitation. On the other hand, the possibility of encountering organisms or obstacles, that is
higher in smaller cores, might reduce the organisms activity, as observed by Hansen et al.
(1999) on a study with Capitella sp. I, using 51Cr as tracer, where they suggest that worm
density may act as a feed-back mechanisms on particle mixing process and that feeding rate
might be inversely related with density.
The Db values estimated in the present work using procedure M1 were within the
range of values estimated for macrofauna bioturbation. Francois et al. (2002) measured

PART III – INTERACCTION BETWEEN N. diversicolor AND SEDIMENT DYNAMICS
130
slightly higher Db that ranged from 2.37 to 4 cm2 y-1. However, these experiments were
performed in mesocosms (8 cm diameter and 30 cm depth) that might have increased
organism activity in depth due to its special limitation. In addition, the higher luminophores
concentration in deeper sediment might have had an increasing effect on Db.
0.10
1.00
10.00
100.00
1000.00
M1 M2
procedure
Db
(c
m2 y
-1)
320
450
570
Figure 5.4 – Biodiffusion coefficients measured on day 20 (Exp. 1) and day 21 (Exp. 2 and Exp. 3) for the different densities of N. diversicolor (320, 450 and 570 ind m-2) (± standard deviation).
Other models give Db estimations under the range of the values estimated in the
present work, using M1. Caradec et al. (2004) found Db ranging from 0.53 to 2.99 cm2 y-1 in
four macrofauna species. These values are within the range of values found by Gerino et al.
(1994) in sediments from the Rhone river, on in situ sediment containing natural
communities, where Db was 4.3 ± 2.8 cm2 y-1. Slightly higher Db were estimated by Solan et
al., (2004) using luminophores and profile-imaging system (f-SPI) to determine the
bioturbation activity of the brachyuran crab Hyas araneus (126 cm2 y-1, after ) and by
Ouellette et al., (2004) on a study about sediment reworking by Neanthes virnes (13.2 cm2 y-1,
measured after 30 days under temperatures ranging from 16 to 180C).
On both M1 and M2 procedures Db decreases with increasing sampling time. The
values found after 14 days were statistically different (p<0.01) from the ones found on the
first 7 days.
The decrease of Db with time, can be related to 1) intense activity and colonisation
behaviour during the first days, when organisms are introduced in inhabited sediments, and

Chapter 5 – Bioturbation of N. diversicolor using luminophores
131
once the gallery network is established their building activities decrease, or 2) a model
artefact due to defectiveness of the biodiffusion model.
Although it is not possible to test the colonisation behaviour of the organisms, it is
possible to test the defectiveness of the models used. Considering that the same
concentrations of luminophores found in the 570 Ct (after 21 days of incubation) were
obtained on different sampling days, one would expect that Db estimation would be the same
if there would be no artefact from the models. On the other hand, if we assume that the
concentration profiles obtained for 570 treatment over the 21 sampling days (for 2, 7, 15 and
21 days) were taken at the same day (3 or 21), we would expect the same decreasing of Db in
time (as in figure 5.3) if there would be a higher bioturbation intensity on the first days, or
constant values over time, if we are in the presence of a model artefact.
Results form these exercises are expressed on Fig. 5.5, and show that the estimations
of Db from the models are affected by the sampling time (Fig. 5.5a) and that the higher values
of Db on the first sampling days (Fig. 5.3) are not a result of higher activity during
colonisation, but a consequence of a model defectiveness, produced by time and present on
both M1 and M2 estimations. It also shows that estimations for a smaller time interval (3
days) produce higher Db values than estimation for a longer period (21 days), using both M1
and M2 procedures.
Figure 5.5 - a) Calculations of Db for the 570 Ct treatment using the same concentrations but different sampling time. b) Calculations of Db for 570 treatment using the profile concentrations measured over the sampling period, but assuming these profiles were taken at a fixed time of 3 days (3d) and 21 days (21d). Estimation of Db by M1 and M2 procedure.
Although colonisation behaviour is expected on inhabited sediments, the findings on
Fig. 5.5, indicate that if an intense activity exists, then it is not measurable, or it takes place on
the first hours and reaches an equilibrium before 3 days of incubation. In order to establish the
0.1
1
10
100
1000
0 10 20 30
time (days)
Db
(cm
2 y
-1)
Ct 570 M1
Ct 570 M2
0.1
1
10
100
1000
0 5 10 15 20 25
time (days)
Db
(c
m2 y
-1)
570 M1 d3
570 M2 d3
570 M1 d21
570 M2 d21
0.1
1
10
100
1000
0 10 20 30
time (days)
Db
(cm
2 y
-1)
Ct 570 M1
Ct 570 M2
0.1
1
10
100
1000
0 5 10 15 20 25
time (days)
Db
(c
m2 y
-1)
570 M1 d3
570 M2 d3
570 M1 d21
570 M2 d21
b a

PART III – INTERACCTION BETWEEN N. diversicolor AND SEDIMENT DYNAMICS
132
time at which Db would stabilise and time would have a minimum effect as an artefact, some
calculations of the reduction of Db estimations as a result of the model defectiveness were
performed using M1 and M2 procedures. Based on data from 450 and 570 treatments, an
exponential function describing the daily reduction of Db in time was used to estimate the
time at which Db would stabilise according to different reduction thresholds (Table 5.2).
From these calculations, a time step of 64 days (using M1 procedure) and 114 days (using M2
procedure) would be needed in order to obtain satisfactory estimates that would not be
influenced by the defectiveness of the model.
Table 5.2 – Stabilisation time (days) for Db estimations (with procedure M1 and M2) according to different thresholds.
time (days) Reduction
threshold M1 M2
5 12
1 32
0.5 40
0.1 14 59
0.05 22 68
0.01 39 87
0.001 64 114
Estimations of Db using M1 or M2 procedures produced results on different range
scales. The comparison of the predicted values using the two distinct procedures and the
observed data for all luminophore profiles (for each replicate) at day 21 (day 20 for 320
treatment) are expressed on Figure 5.6.
For all profiles, the predictions by M2 procedure are closer to the observed
concentrations of luminophores than the predictions by M1 procedure. This should be
expected, as M1 procedure generates a diffusive particle displacement, neglecting biological
diffusion or non-local transport and emphasizing the high concentrations near the surface,
producing an exponential distribution that become zero for infinite depth. In opposition to an
exponential diffusion, the observed data is better explained by M2 procedure which provides
a better fit to the concentration data in the deeper layers.

Chapter 5 – Bioturbation of N. diversicolor using luminophores
133
Figure 5.6 – Comparison between the observed profiles of luminophores (o) and predictions from method M1 (bold line) and M2 (dashed line) for each replicate taken on day 21 for 450 and 570 ind m-2 and 570Ct and for day 20 to 320 ind m-2.
0
1
2
3
4
5
6
7
0.001 0.1 10
lum fraction cm 3
dep
th (
cm
)
320 d20 1
0
1
2
3
4
5
6
7
0.001 0.1 10
lum fraction cm 3
dep
th (
cm
)
320 d20 2
0
1
2
3
4
5
6
7
0.001 0.1 10
lum fraction cm 3
dep
th (
cm
)
320 d20 3
0
1
2
3
4
5
6
7
0.001 0.1 10
lum fraction cm3
dep
th (
cm
)
320 d20 4
0
1
2
3
4
5
6
0.001 0.1 10
lum fraction cm 3
dep
th (
cm
)
570 d21 1
0
1
2
3
4
5
6
0.001 0.1 10
lum fraction cm3
dep
th (
cm
)
570 d21 2
0
1
2
3
4
5
6
0.001 0.1 10
lum fraction cm 3
dep
th (
cm
)
570 d21 3
0
1
2
3
4
5
6
0.0001 0.01 1
lum fraction cm3
dep
th (
cm
)
450 d21 1
0
1
2
3
4
5
6
0.0001 1
lum fraction cm3
dep
th (
cm
)
450 d21 2
0
1
2
3
4
5
6
0.0001 0.01 1
lum fraction cm 3
dep
th (
cm
)
450 d21 3
0
1
2
3
4
5
6
0.0001 0.01 1
lum fraction cm 3
dep
th (
cm
)
570Ct d21 1
0
1
2
3
4
5
6
0.0001 0.01 1
lum fraction cm 3
dep
th
(cm
)
570Ct d21 2
0
1
2
3
4
5
6
0.0001 0.01 1
lum fraction cm 3
dep
th (
cm
)
570Ct d21 3
0
1
2
3
4
5
6
7
0.001 0.1 10
lum fraction cm 3
dep
th (
cm
)
320 d20 1
0
1
2
3
4
5
6
7
0.001 0.1 10
lum fraction cm 3
dep
th (
cm
)
320 d20 2
0
1
2
3
4
5
6
7
0.001 0.1 10
lum fraction cm 3
dep
th (
cm
)
320 d20 3
0
1
2
3
4
5
6
7
0.001 0.1 10
lum fraction cm3
dep
th (
cm
)
320 d20 4
0
1
2
3
4
5
6
7
0.001 0.1 10
lum fraction cm 3
dep
th (
cm
)
320 d20 1
0
1
2
3
4
5
6
7
0.001 0.1 10
lum fraction cm 3
dep
th (
cm
)
320 d20 2
0
1
2
3
4
5
6
7
0.001 0.1 10
lum fraction cm 3
dep
th (
cm
)
320 d20 3
0
1
2
3
4
5
6
7
0.001 0.1 10
lum fraction cm3
dep
th (
cm
)
320 d20 4
0
1
2
3
4
5
6
0.001 0.1 10
lum fraction cm 3
dep
th (
cm
)
570 d21 1
0
1
2
3
4
5
6
0.001 0.1 10
lum fraction cm3
dep
th (
cm
)
570 d21 2
0
1
2
3
4
5
6
0.001 0.1 10
lum fraction cm 3
dep
th (
cm
)
570 d21 3
0
1
2
3
4
5
6
0.001 0.1 10
lum fraction cm 3
dep
th (
cm
)
570 d21 1
0
1
2
3
4
5
6
0.001 0.1 10
lum fraction cm3
dep
th (
cm
)
570 d21 2
0
1
2
3
4
5
6
0.001 0.1 10
lum fraction cm 3
dep
th (
cm
)
570 d21 3
0
1
2
3
4
5
6
0.0001 0.01 1
lum fraction cm3
dep
th (
cm
)
450 d21 1
0
1
2
3
4
5
6
0.0001 1
lum fraction cm3
dep
th (
cm
)
450 d21 2
0
1
2
3
4
5
6
0.0001 0.01 1
lum fraction cm 3
dep
th (
cm
)
450 d21 3
0
1
2
3
4
5
6
0.0001 0.01 1
lum fraction cm3
dep
th (
cm
)
450 d21 1
0
1
2
3
4
5
6
0.0001 1
lum fraction cm3
dep
th (
cm
)
450 d21 2
0
1
2
3
4
5
6
0.0001 0.01 1
lum fraction cm 3
dep
th (
cm
)
450 d21 3
0
1
2
3
4
5
6
0.0001 0.01 1
lum fraction cm 3
dep
th (
cm
)
570Ct d21 1
0
1
2
3
4
5
6
0.0001 0.01 1
lum fraction cm 3
dep
th
(cm
)
570Ct d21 2
0
1
2
3
4
5
6
0.0001 0.01 1
lum fraction cm 3
dep
th (
cm
)
570Ct d21 3
0
1
2
3
4
5
6
0.0001 0.01 1
lum fraction cm 3
dep
th (
cm
)
570Ct d21 1
0
1
2
3
4
5
6
0.0001 0.01 1
lum fraction cm 3
dep
th
(cm
)
570Ct d21 2
0
1
2
3
4
5
6
0.0001 0.01 1
lum fraction cm 3
dep
th (
cm
)
570Ct d21 3
PART III – INTERACCTION BETWEEN N. diversicolor AND SEDIMENT DYNAMICS
134
Some authors report good fits between observed and predicted data (Sandnes et al.,
2000), while others report bad fits. The 51Cr distribution on sediments bioturbated by
Capitella sp. I, (Hansen et al., 1999) showed poor fits to the simple biodiffusion model
proposed by Crank (1975) and they pointed out that the assumption of homogeneous mixing
becomes particularly critical when working with deposit-feeders who may ingest and defecate
sediment non-randomly with depth.
On a work focusing seabed mixing, Dellapenna et al. (2003) classified the profiles
obtained using 137Cs tracers, in 3 types: 1) uniform, 2) stepped-stirs profiles; that result
primarily from physical and sediment mixing (Dellapenna et al., 1998) and 3)consistent slope
profiles; that reflect either sediment accretion or bioturbation (Dellapenna et al., 2003). In the
present work, the profiles found in 570Ct is better described by type 1, while 570 is clearly a
consistent slope profile.
5.3.4 The NLI index
The NLI index is an indication of the deviation from the observed data and the
theoretical diffusive transport and is expressed on Figure 5.7 for all treatments after 21 or 20
days. The analysis of NLI showed that values are much bigger in the 570 than in the
respective control, meaning that the profiles measured in the control have a distribution closer
to the theoretical diffusivity, and the profiles measured on 570 have the influence of a non-
local transport. The comparison between LNI of 570Ct and treatments 320 and 450 has little
sense, since the physical, chemical and biological properties of the sediment are probably not
the same.
NLI index also showed to have no relation to density or time. Although there was no
correlation between NLI and Db estimated from M1 procedure, a positive significant
correlation was found between NLI and Db estimations using M2 procedure (F1.31=5.21,
p<0.05, R2=0.14, n=33).
The higher values of NLI found on 320 and 570 (Fig. 5.7) are probably related with
the concentration peaks found at 2 – 4 cm layers for 320 treatment (replicates 2 and 4 , Fig. 5)
and 3 – 5 cm layers for 570 treatments (all replicates, Fig. 5), where deviations from the
theoretical diffusion is more evident.

Chapter 5 – Bioturbation of N. diversicolor using luminophores
135
0.00
20.00
40.00
60.00
80.00
100.00
120.00
140.00
21
time (day)
NL
I
320
470
570
Ct 570
Figure 5.7 - Non-locality index measured after 21 days (20 days for 320 density) in the three densities tested (and control for 570 density) and 450 and 320 density.
5.4 Conclusions
This study highlights some concerns related to the estimation of Db using
luminophores. It is concluded from this study that the estimation of Db using M2 provides a
better approximation to the bioturbation occurring in the surface sediment layers. The Db
estimations are dependent on the sampling time. According to the analysis performed in this
study Db values would only reach a constant value after 64 and 114 days of incubation using
M1 an M2 estimation models, respectively. The area of the mesocosm where incubations are
conducted is also another issue that may influence the estimations of Db. Due to problems
associated to core sampling, such as core shortening, compression and internal friction we
recommend the use of sharpened cores edges, the use of core with larger diameters. Core
freezing before sampling and the discard of the sediment in contact with the core is
recommended to avoid the luminophores transport due to coring. The question of whether
controls can be true controls, regarding the predation effect of macrofauna on meiofauna is
raised.

PART III – INTERACCTION BETWEEN N. diversicolor AND SEDIMENT DYNAMICS
136
5.5 References
Aldridge, J.N., Kershaw, P., Brown, J., McCubbin, D., Leonard, K.S., Young, E.F., 2003. Transport of plutonium (239/240 Pu) and cesium (137Cs) in the Irish Sea: comparison between observations and results from sediment and contaminant transport modeling. Cont. Shelf Res. 23, 869-899
Aller, R. C., 2001. Transport and reactions in the bioirrigated zone, in The Benthic Boundary
Layer, edited by B. P. Boudreau and B. B. Jorgensen, pp. 269-301, Oxford University Press, Oxford.
Aller, R.C., Aller J.Y., 1998. The effect of biogenic irrigation intensity and solute exchange on diagenic reaction rates in marine sediments. J. Mar. Res. 56, 905-936
Aller, R. C. 1983. The importance of diffusive permeability of animal burrow linings in determining marine sediment chemistry. J. Mar. Res. 41: 299-322
Aller R. C., Aller, J.Y. 1992. Meiofauna and solute transport in marine muds. Limnol. Oceanogr. 37 : 1018-1033
Amiard, J.C., Amiard-Triquet, C., Berthet, B., Metayer, C., 1987. Comparative study of the patterns of bioaccumulation of essential (Cu, Zn) and non-essential (Cd, Pb) trace metals in various estuarine and coastal organisms. J. Exp. Mar. Ecol. 106, 73-89
Andersen, F. O., Kristensen, E. 1992. The importance of benthic macrofauna in decomposition of microalgae in a coastal marine sediment. Limnol. Oceanogr. 37: 1392-1403
Anderson, J.G., Meadows, P.S., 1978. Microenvironments in marine sediments. Proceedings of the Royal Society of Edinburgh 76B, 1-16
Berg, P., Rysgaard, S., Funch, P. Sejr, M.K. 2001. effects of bioturbation on solutes and solids in marine sediments. Aquat. Microb. Ecol. 26: 81-94
Bernds, D., Wübben, D., Zauke, G.P., 1998. Bioaccumulation of trace metals in polychaetes from German Wadden Sea: evaluation and verification of toxicokinetic models. Chemosphere, 37 (13), 2573-2587
Blanchard, G.F., Sauriau, P.-G., Cariou- Le Gall. V., Gouleau, D., Garet, M.-J., Olivier, F. (1997). Kinetics of tidal resuspension of microbiota: Testing the effects of sediment cohesiveness and bioturbation using flume experiments. Mar. Ecol. Pro. Ser. 151, 17-25
Boon, A.R., Duineveld, G.C.A. 1998. Chlorophyll a as a marker for bioturbation and carbon flux in southern and central North Sea sediments. Mar. Ecol. Prog. Ser. 162: 33-43
Boudreau, B. P., 1997. Diagenetic Models and Their Implementation. pp. 414, Springer, Berlin.
Boudreau, B. P. 1986. Mathematics of tracer mixing in sediments. II: Non-local mixing and biological conveyor belt phenomena. Am. J. Sci. 286: 199-238
Bryan, G.W., Hummerstone, L.G., 1971. Adaptation of the polychaete Nereis diversicolor to estuarine sediments containing high concentrations of heavy metals.1- general observations and adaptation to copper. J. Mar. Ass. UK 51, 845-863
Caradec, S., V. Grossi, S., Hulth, G., Stora, F., Gilbert. 2004. Macrofaunal nreworking actyivities and hydrocarbon redistribution in an experimental sediment system. J. Sea Res. 52, 199-210
Christensen, M., Andersen, O., Banta, G.T., 2002. Metabolisms of pyrene by the polychaetes Nereis diversicolor and Arenicola marina. Aquat. Tox. 58, 15-25
Crank, J. 1975. The mathematics of diffusion. Oxford University Press, Oxford Crusius, J., Anderson, R.F. 1991. Core compression and surficial sediment loss of lake
sediments of high porosity caused by gravity coring. Limnol. Oceanogr. 36,1021-1031 Crusius, J., Anderson, R.F., Cornett, R.J., Chant, L. 1993. Reply to the comments of
Cumming et al. and Wright. Limnol. Oceanogr. 36,1021-1031

Chapter 5 – Bioturbation of N. diversicolor using luminophores
137
Cumming, B. F., Glew, J.R., Smol, J.P., Davis, R.B., 1993. Comment on “Core compression and surficial sediment loss of lake sediments of high porosity caused by gravity coring” (Crusius and Anderson). Limnol. Oceanogr. 38, 695-699
Davey, J.T., 1994. The architecture of the burrow of Nereis diversicolor and its quantification in relation to sediment-water exchange. J. Exp. Mar. Biol. Ecol. 179, 115-129
Davey, J.T., Partridge, V.A., 1998. The macrofaunal communities of the Skeffling muds (Humber estuary), with a special reference to bioturbation. In: Black KS, Paterson DM and Cramp A (eds) Sedimentary processes in the intertidal zone. Special publications. Vol.139 (pp. 155-124) Geological Society, London
Davey, J.T., Watson, P.G., 1995. The activity of Nereis diversicolor (polychaeta) and its impact on nutrient fluxes in estuarine waters. Ophelia. 41, 57-70
Dellapenna, T.M., Kuehl, S.A., Schaffner, L.C. 1998. Sea-bed mixing and particle residence times in biologically and physically dominated estuarine systems: a comparison of lower Chesapeake bay and the York River subestuary. Est. Coast. Shelf. Res. 46, 777-795
Dellapenna, T.M., Kuehl, S.A., Schaffner, L.C. 2003. Ephemeral deposition, seabed mixing and fine-scale strata formation in the York River estuary, Chesapeake Bay. Est. Coast. Shelf. Res. 58, 621-643
Droppo, I.G., Lau, Y.L., Mitchell, C., 2001. The effect of depositional history on contaminated bed sediment stability. Sci. Tot. Env. 266, 7-13
Esselink, P., Zwarts, L., 1989. Seasonal trend in burrow depth and tidal variation in feeding activity of Nereis diversicolor. Mar. Ecol. Prog. Ser. 56, 243-254
Fenchel, T., 1996. Worm burrows and oxic microniches in marine sediments.1.Spacial and temporal scales. Mar. Biol. 127, 289-295
Fernandes, S., Sobral, P., Alcântara, F. 2009. Nereis diversicolor and copper contamination effect on the erosion of cohesive sediments: A flume experiment. Estuarine Coastal and Shelf Science (in press)
Fernandes, S., Meysman, F.J.R., Sobral, P. 2006. The influence of Cu Contamination on Nereis diversicolor bioturbation. Marine Chemistry. 102, 148-158
Ferro, I., van Nugteren, P., Middelburg, J.J., Herman, P.M.J., Heip, C.H.R., 2003. Effect of macrofauna, oxygen exchange and particle reworking on iron and manganese sediment biogeochemistry: a laboratory experiment. Vie Millieu 53, 211-220
Fidalgo e Costa, P., Sardá, R., Cancela da Fonseca, L., 1998. Life cycle, growth and production of the polychaete Nereis diversicolor O.F. Müller in three lagoonal estuarine systems of the southerwestern portuguese coast (Odeceixe, Aljezur and Carrapateira). Écologie 29 (4), 523--533
Flach, E., Lavaleye, M., de Stigter, H., Thomsen, L., 1998. Feeding types of the benthos community and particle transport across the slope of the N.W. European continental margin (Goban Spur). Prog. Ocean. 42, 209-231
Forster, S. Glud, R.N., Gundersen, J.K., Huettel, M., 1999. In situ study of bromide tracer and oxygen flux in coastal sediments. Est. Coast. Shel. Sci. 49, 813-827
François, F., Gerino, M., Stora, G., Durbec, J.P., Poggiale, J.C., 2002. Functional approach to sediment reworking by gallery-forming macrobenthic organisms: modeling and application with the polychaete Nereis diversicolor. Mar. Ecol. Prog. Ser. 229, 127-136
François, F., Dalègre, K., Gilbert, F., Stora, G., 1999. Variabilité spécifique à l'interieur des groupes fonctionnels. Étude du remaniement sédimentaire de deux bivalves Veneridae, Ruditapes decussatus et Venerupis aurea. Écologie 322, 339-345
François, F., Poggiale, J.C., Durbec, J.P., Stora, G., 1997. A new approach for the modeling of sediment reworking induced by macrobenthic community. Acta Biotheor. 45, 295-319

PART III – INTERACCTION BETWEEN N. diversicolor AND SEDIMENT DYNAMICS
138
Gerino, M., Stora, G., Weber O., 1999. Evidence of bioturbation in the Cap- Ferret Canyon in the deep northern Atlantic. Deep-Sea Research II 46, 2289-2307
Gerino, M., Aller, R.C., Lee, C., Cochran, J.K., Aller, J.Y., Green, M.A., Hirschberg, D. 1998. Comparison of different tracers and methods used to quantify buiturbation during a spring bloom: 234-Thorium, luminophores and Chlorophyll a. Est. Coast. Shel. Sci. 46: 531-547
Gerino, M, Stora, G., Poydenot, F., Bourcier, M., 1995. Benthic fauna and bioturbation on the Mediterranean continental slope: Toulon Canyon. Cont. Shelf Res. 15 (11/12), 1483-1496
Gerino, M., Stora, G., Durbec, J-P. 1994. Quantitative estimation of biodiffusive and bioadvective sediment mixing: in situ experimental approach. Ocean. Acta 17: 547-554
Giangrande, A., Lucciano, M., Fanelli, G., 2001. Bioturbation behavior in two Mediterranean polychaetes. J. Mar. Biol. Ass. U.K., 81, 341-342
Giangrande, A., Montresor, M., Cavallo, A., Licciano, M., 2002. Influence of Naineris
laevigata (Polychaeta: Orbiniidae) on vertical grain size distribution, and dinoflagellate resting stages in the sediment. J. Sea Res. 47, 97-108
Gilbert, F, Stora, G., Bertrand, J.-C., 1996. In situ bioturbation and hydrocarbon fate in an experimental contaminated Mediterranean coastal ecosystem. Chemosphere 33 (8), 1449-1458
Gilbert, F. Hulth, St., Stromberg, N., Ringdahl, K., Poggiale, J.-C., 2003. 2-D optical quantification of particle reworking activities in marine surface sediments. J. Exp. Mar., Biol. Ecol. 285-286, 251-263
Gleizon, P., Punt, A.G., Lyons, M.G., 2003. Modelling hydrodynamics and sediment flux within a macrotidal estuary: problems and solutions. Sci. Tot. Env. 314-316, 589-597
Grant, A., Hateley, J.G., Jones, N.V., 1989. Mapping the ecological impact of heavy metals on the estuarine polychaete Nereis diversicolor using inherited metal tolerance. Mar. Pull. Bull, 20 (5), 235-238
Green, M.A., Aller, R.C., Cochran, J.K., Lee, C, Aller, J.Y., 2002. Boiturbation on the shelf/slope sediments off Cape Hatteras, North Carolina: the use of 234Th, Chl-a, and Br- to evaluate rates of particle and solute transport. Deep-Sea Res. II 49, 4627-4644
Green, M.O., Hewitt, J.E., Thrush, S.F., Seabed drag coefficient over natural beds of horse mussels (Atrina zelandica). J. Mar. Res. 56, 613-637
Guñi-Urriza, M., de Montaudouin, X., Guyoneaud, R., Bachelet, G., de Wit, R., 1999. Effect of macrofaunal bioturbation on bacterial distribution in marine sandy sediments, with special reference to sulphur-oxidising bacteria. J. Sea REs. 41, 269-279
Hammerschmidt, C.R., Fitzgerald, W.F., 2004. Geochemical controls on the production and distribution of methylmercury in near-shore marine sediments. Environ. Sci. Technol., 38, 1487-1495
Hansen, R, Forbes, T.L., Westermann, P. 1999. Importance of bioturbation and feeding by the polychaete Capitella sp. I in the degradation of di(2-ethylhexyl)phthalate (DEHP). Mar. Ecol. Prog. Ser. 182: 187-199
Heip, C.H.R., Duineveld, G., Flach, E., Graf, G., Helder, W., Herman, P.M.J., Lavaleye, M, Middelburg, J.J., Pfannkuche, O., Soetaert, K., Soltwedel, T., de Stigter, H., Thomsen, L., Vanaverbeke, J., de Wilde, P., 2001. The role of the benthic biota in sedimentary metabolism and sediment-water exchange processes in the Goban Spur area (NE Atlantic). Deep-Sea Res. 48, 3223-3243
James, I.D., 2002. Modelling pollution dispersion, the ecosystem and water quality in coastal waters: a review. Env. Mod. Softw. 17, 363-385
Kristensen, E., 2000. Organic matter diagenesis at the oxic/anoxic interface in coastal marine sediments, witrh emphasis on the role of burrowing animals. Hydrobiologia 426, 1-24

Chapter 5 – Bioturbation of N. diversicolor using luminophores
139
Mahaut, M.-L., Graf, G. 1987. A luminophore tracer technique for bioturbation studies. Oceanol. Acta 10, 323-328
Marcus, N. H., Schmidt-Gengenbach, J. 1986. Recrutment of individuals into the plankton: the importance of bioturbation. Limnol. Oceanogr. 31, 206-210
Meadows, P. S. and J. Tait. 1989. Modification of sediment permeability and shear strength by two burrowing invertebrates. Mar. Biol. 101: 75-82
Meysman, F.J.R., Boudreau. B.P., Middelburg, J.J. 2003. Relations between local, non-local, discrete and continuous models of bioturbation. J. Mar. Res. 61, 391-410
Middelburg, J. J., Soetaert, K., Herman, P. 1997. Empirical relashionships for use in global diagenic models. Deep-Sea Res. I 44,327-344
Middelburg, J.J., Klaver, G., Nieuwenhuize, J., Wielemaker, A., de Haas, W., van der Nat, J.F.W.A., 1996. Organic matter mineralization in intertidal sediments along an estuarine gradient. Mar. Ecol. Prog. Ser. 132, 157-168
Mortimer, R.J.G., Davey, J.T., Krom, M.D., Watson, P.G., Frickers, P.E., Clifton, R.J., 1999. The effect of macrofauna on porewater profiles and nutrient fluxes in the intertidal zone of the Humber estuary. ESt. Coast. Shelf Res. 48, 683-699
Mulsow, S., Landrum, P.F., Robbins, J.A., 2002. Biological mixing responses to subleathal concentrations of DDT in sediments by Heteromastus filiformis using 137Cs layer technique. Mar. Ecol. Prog. Ser. 29, 181-191
Mulsow, S., B. P. Boudreau and J. N. Smith. 1998. Bioturbation and porosity gradients. Limnol. Oceanogr. 43, 1-9
Niedoroda, A.W. Swift, D.J.P., Reed , C.W., Stull, J.K., 1996. Contaminant dispersal on the Palos Verded Continental margin: III. Processs controlling transport, accumulation and re-emergence of DDT-contaminated sediment particles. Sci. Tot. Env. 179, 109-133
Nielsen, O.I, Gribsholt, B., Kristensen, E. Revsbech, N.P., 2004. Microscale distribution of oxygen and nitrate in sediments inhabited by Nereis diversicolor: spatial patterns and estimated reaction rates. Aquat. Microb. Ecol. 34, 23-32
Nikora, V., Green, M.O., Thrush, S.F., Hume, T.M., Goring, D., 2002. Structure of internal boundary layer over a patch of pinnid bivalves (Atrina zelandica) in an estuary. J. Mar. Res. 60, 121-150
Ouellette, D., Desrosiers, G. Gagne, J.-P., Gilbert, F., Poggiale, J.-C., Blier, P.U. Stora, G., 2004. Effects of temperature on in vitro sediment reworking processes by a gallery biodiffusor, the polychaete Neanthes virens. Mar. Ecol. Prog. Ser. 266, 185-193
Ozoh, P.T.E., 1992. The effects of salinity, temperature and sediment on the toxicity of copper to juvenile Hedistes (Nereis) diversicolor (O.F. Müller ). Env. Monit. Assess. 21, 1-10
Ozoh, P.T.E., Jones, N.V., 1988. The effects of copper ions on embryogenesis in the polychaete, Hedistes (nereis) diversicolor. Mar. Env. Res. 24, 255-256
Rasmussen, A.D., Banta, G.T., Andersen, O., 1998. Effects of bioturbation by the lugworm Arenicola marina on cadmium uptake and distribution in sandy sediments. Mar. Ecol. Prog. Ser. 164, 179-188
Retraubun, A.S.W., Dawson, M., Evans, S.M., 1996. Spatial and temporal factors affecting sediment turnover by the lugworm Arenicola marina (L.). J. Exp. Mar. Biol. Ecol. 201, 23-35
Rusch, A., Huettel, M. 2000. Advective particle transport into permeable sediments – evidence from experiments in an intertidal sandflat. Limnol. Oceanogr. 45, 525-533
Saiz-Salinas, J.I., Francés-Zubillaga, G., 1997. Nereis diversicolor: an unreliable biomonitor of metal contamination in the Ria de Bilbao (Spain). Mar. Ecol. 18, 113-125
PART III – INTERACCTION BETWEEN N. diversicolor AND SEDIMENT DYNAMICS
140
Sandnes, J., Forbes, T., Hansen, R., Sandnes, B. 2000a. Influence of particle type and faunal activity on mixing of di(2-ethylhexyl)phthalate (DEHP) in natural sediments. Mar. Ecol. Prog. Ser. 197, 151-167
Sandnes, J., Forbes, T., Hansen, R., Sandnes, B. 2000b. Bioturbation and irrigation in natural sediments, described by animal-community parameters. Mar. Ecol. Prog. Ser. 197, 169-179
Shull, D.H., MAYER, L.M. 2002. Dissolution of particle-reactive radionuclides in deposit-feeder digestive fluids. Limnol. Oceanogr. 47, 1530-1536
Solan, M, Wigham, B.D., Hudson, I.R., Kennedy, R., Coulon, C.H., Norling, K., Nilsson, H.C., Rosenberg, R., 2004. In situ quantification of bioturbation using time-lapse fluorescent sediment profile imaging (f-SPI), luminophore tracers and model simulation. Mar. Ecol. Prog. Ser. 271, 1-12
Sturley, D.R.M., Bowen, A.J., 1996. A model for contaminant transport in Lunenburg Bay, Nova Scotia. Sci. Tot. Env. 176, 161-172
Swift, D.J.P., Stull, J.K., Niedoroda, A.W., Reed, C.W., Wong, G.T., 1996. Contaminant dispersal on the Palos Verdes continental margin. II. Estimates of the biodiffusion coefficient, Db, from composition of the benthic infaunal community. Sci. Tot. Env. 179, 91-107
Sze, P.W.C., Lee, S.Y., 1995. The potential role of mucus in the depuration of copper from the mussel Perna viridis (L.) and Septifer virgatus (Wiegmann). Mar. Poll. Bull. 31, 390-393
Turnewitsch, R., Witte, U., Graf, G., 2000. Bioturbation in the abyssal Arabian Sea: influence of fauna and food supply. Deep-Sea Res. II 47, 2877-2911
Underwood, A.J. 1997. Experiments in Ecology. Cambridge University Press. Cambridge. 504 p.
Webb, D. G., and P. A. Montagna. 1993. Initial burial and subsequent degradation of sedimented phytoplankton: relative impact of macro and meiobenthos. J. Exp. Mar. Biol. And Ecol. 166, 151-163
Webster, I. T. 1992. Wave enhancement of solute exchange within empty burrows. Limnol. Oceanogr. 37, 630-643
Wheatcroft, R.A., Jumars, P.A., Smith, C.R., Nowell, A.R.M. 1990. A mechanistic view of the particulate biodiffusion coefficients: step lengths, rest periods and transport directions. J. Mar. Res. 48, 177-207
Widdows, J., Brinsley, M.D., Bowley, N., Barret, C., 1998. A benthic annular flume for in
situ measurement of suspension feeding/biodeposition rates and erosion potential of intertidal cohesive sediments. Est. Coast. Shelf Sci. 46, 27-38
Widdows, J., Brown, S., Brinsley, M.D., Salkeld, P.N., Elliott, M., 2000. Temporal changes in intertidal sediment erodability: influence of biological and climatic factors. Cont. Shelf Res. 20, 1275-1289

PART IVINTERACTIONS BETWEEN
CONTAMINATED SEDIMENTS
AND BIOLOGICAL ACTIVITY
The effect of on shear
strength and erodability of cohesive sediments:
the influence of copper contamination
Chapter 6Nereis diversicolor


Chapter 6 – Effect of N. diversicolor on shear strength and erodability
143
NEREIS DIVERSICOLOR AND COPPER CONTAMINATION EFFECT ON THE
EROSION OF COHESIVE SEDIMENTS: A FLUME EXPERIMENT
S. Fernandes, P. Sobral and F. Alcântara
Estuarine, Coastal and Shelf Science, in press
Abstract
The effect of bioturbation on the erodability of natural and manipulated copper spiked sediments (3
µmol Cu g-1 dw) was investigated using sediments collected in the Tagus estuary and Nereis
diversicolor (900 ind m-2). The input of particulate matter and Cu into the water column as a result of
erosion was quantified in an annular flume at 7 shear velocities (1 to 13 cm s-1). The biogeochemical
characteristics of the sediment were analysed in depth down to 8 cm. Cu contamination elicited lower
levels of eroded matter and lower shear strength profiles. Eroded matter and sediment shear strength
values were higher (up to 1.7 Kg m-2) in the presence of N. diversicolor, whose effect was less
pronounced under contamination. Sediment erodability was not only related to hydrodynamics but was
highly affected by the biogeochemical characteristics and contamination of the sediments.
Key-words: bioturbation, shear strength, erosion, copper, flumes, Nereis diversicolor.
6.1 Introduction
Sediment stability, i.e., resistance against erosion, is an important component of
sediment dynamics, not only in terms of the erosion and accretion of margins, but also
because resuspended matter is an important source of food and also, in the case of sediment
contamination, of particulate contaminants to the system. At the sediment surface, the
microphytobenthos community dominated by diatoms (Underwood and Smith, 1998, de
Brouwer et al., 2002), has a stabilising effect that derives from the production of extracellular
polymeric substances, EPS (Paterson, 1989; Miller et al., 1996; Sutherland et al., 1998; de
Brouwer et al. 2003, 2005), resulting in increased grain to grain adhesion (Johnson and
Azetsu-Scott, 1995) and raised erosion thresholds (Tolhurst et al., 1999; Watts et al., 2003).
However, this biofilm is confined to a surface layer of a few millimeters, below which the

PART IV – CONTAMINATED SEDIMENTS AND BIOLOGICAL ACTIVITY
144
biogeochemical properties of the sediment result in part from the activities of other functional
groups, such as the macrofauna. Different macrofauna species are known to have either
stabilising or destabilising effects on sediments with different effects on erosion thresholds
(Widdows et al., 1998a; Austen et al., 1999). Sediment mixing and irrigation by macrofauna
are known to influence the biogeochemical processes in the sediment (François et al., 1997;
Hansen and Kristensen, 1998). Some studies have been focused on the bioturbation effects of
macrofauna on the distribution of contaminants in the sediments, concerning both their
transport in depth and to the water column (Petersen et al., 1998; Rasmussen et al., 1998).
Mazik and Elliot (2000) showed that pollution reduced the potential for sediment transport as
a result of the toxic effect on the bioturbation activity and of the reduced grazing pressure.
It is then essential to understand the effect of pollution on the biological activities of
specific functional groups that change the sediment-water interface properties. This
knowledge leads to a better description of phenomena of estuarine sediment erosion and
transport. In this context, the polychaete N. diversicolor (O.F. Müller, 1776), is known to be a
suitable bioindicator (Bryan and Hummerstone, 1971; Ozoh, 1994). It is an opportunistic
species, very abundant in estuarine and coastal systems, that uses different feeding modes
such as suspension and deposit feeding, predation and scavenging. It builds and lives in
mucus-lined galleries with a considerable structural complexity (Meadows and Meadows,
1991). During burrowing, mucus secretions are released from glands covering the entire
surface of the epidermis. These secretions are pushed against the walls of the burrow,
consolidating it in this way (Meadows and Tait, 1989).
In a previous study with natural sediments (Fernandes et al., 2006a), N. diversicolor
contributed to sediment stability, increasing sediment shear strength and critical erosion
velocity. However, when exposed to high shear velocities (up to 13 cm s-1), strong erosion
was observed and these effects increased with higher densities of these organisms. The
present study is focused on the effect of N. diversicolor on contaminated and non-
contaminated sediment stability.
The main objectives are directed to the quantification of the effects of: 1) N.
diversicolor bioturbation activity on the properties of natural and copper spiked sediments
(biogeochemical and shear strength) and the resulting input of materials (SPM, Chl a and Cu)
into the water column, 2) the effect of Cu on the bioturbation activity of N. diversicolor and
3) the overall effect of Cu and N. diversicolor on sediment stability.

Chapter 6 – Effect of N. diversicolor on shear strength and erodability
145
6.2 Materials and methods
6.2.1. Sediment and organisms
Cohesive sediments were collected in Ponta da Erva (Tagus estuary, 38º50’N, 8º58’W,
water salinity of about 22, Fig. 6.1) during low tide. Mud from mid-tidal level was scooped
from the top first 2 cm into buckets, brought to the laboratory and kept at 4 ºC to reduce
biological activity and then acclimated for 1 week maximum. Recent grain size analysis at
Ponta da Erva (using a Malvern®Mastersizer 2000, n=3) showed that sediment is mostly
composed by silts and clays (75.4 ± 5.4 % and 22.9 ± 6.2 respectively) and median grain size
(10d50) is 9.8 ± 2.0 µm.
Besides the fine fraction only a small percentage of very fine sand was present, 1.7 ±
0.9 % (Soares & Sobral, unpublished data). Sediment was characterised as 9 ± 1 % of organic
matter, 68 ± 1 % water content and Cu content of 0.49 ± 0.05 µmol Cu g-1 dry weight (mean ±
standard deviation, n=12).
N. diversicolor were collected in Barreiro (Tagus estuary, 38º39’N, 9º05’W, water
salinity of about 33, Fig. 6.1), immediately brought to the laboratory and allowed to acclimate
to the experimental conditions for 5 days before being added to the sediment. Body size
ranged from 10 to 15 cm (first setiger L3=2.24 ± 0.36 µm, n=22) and biomass was 0.075 ±
0.003 g dw ind-1 (n=25).
Seawater used at IMAR-FCTUNL facilities is collected on the coast, 30 Km west of
Lisbon, and supplied periodically to our major tank by the navy. The seawater is kept in the
laboratory in a continuous recirculation aerated system and under temperature controlled
conditions.
6.2.2 Experimental set-up
All macrofauna (N. diversicolor, other smaller polychaetes and small crabs) and larger
shell fragments that could be visually detected upon close inspection were manually removed
from the sediment. This defaunation technique was preferred over wet sieving to avoid
dilution of the sediment. Meiofauna (nematodes, harpacticoid copepods and ciliates) was
therefore not excluded. In order to decompose the effect of bioturbation and copper a 2-block
experiment was designed, using a control for the presence of N. diversicolor and another for
copper contamination. Two batches of homogenised sediment were prepared. One was spiked
with a solution of copper chloride (CuCl2) in order to obtain a final concentration of 3 µmol

PART IV – CONTAMINATED SEDIMENTS AND BIOLOGICAL ACTIVITY
146
Cu g-1 dw, the other was used as control. From each batch, two groups of sediments were
prepared in triplicate in flume boxes that are an exact quarter section of the flume channel (8
cm height and base of 0.053 m2), to be later inserted in the flume. One group contained added
N. diversicolor (~ 900 ind m-2, 48 ind per flume box) and the other, not added, was used as the
control. The four sediments obtained were designated as B and CB (blank sediment control
and copper spiked sediment control, respectively), and N and CN (non-contaminated sediment
and copper spiked sediment, respectively, both with added N. diversicolor). An extra box of
each of the four types of sediments was prepared in the same conditions and used for
sediment properties characterisation before the erosion runs. All the prepared sediments were
stabilised in a flow-through system (3 L h-1), under controlled temperature (17 ± 1 ºC),
salinity (36) and light (54 ± 23 µ E m-2 s-1 with a 12 h photoperiod) for 21 days.
Figure 6.1- Map of Tagus estuary (Portugal). A. Sediment collection; B. organisms
collection.
Chapter 6 – Effect of N. diversicolor on shear strength and erodability
147
6.2.3. Sediment properties
Cores were taken for the characterisation of the sediment before the erosion runs using
a special corer made of 8 one-centimetre rings, allowing the sediment to be sliced into 1 cm
layers. Analysis of sediment properties was performed in 1 cm layers from the surface down
to 5 cm with the exception of chlorophyll a (Chl a) which was sampled on 2 layers (0-1 and
1-3 cm). Dry sediment bulk density (ds) and organic matter content (OM) were determined in
oven-dried (90 ºC for 48 h) and incinerated (450 ºC for 4 h) sediment.
Geotechnical shear strength (SS, KPa) was measured with a penetrometer, Geonor® - Fall-
cone Apparatus (Hansbo, 1957, described in Watts et al., 2003 and also used by Meadows and
Hariri, 1991 and Widdows et al., 1998a) with a 10g inverted cone.
Chl a was quantified fluorimetrically (Yentsch and Menzel, 1963) in a Jasco FP-777
spectrofluorimeter. Samples were extracted in 10 ml of 90 % acetone in the dark and in the
cold (4 ºC). The extracts were centrifuged at 5000 rpm and the fluorescence read at 440nm
excitation and 660nm emission. A pre-determined calibration factor was used to convert the
readings in Chl a concentrations that were then converted in concentration per gram of dry
weight sediment. Copper in the sediment was determined following the methods described in
section 6.2.6.
6.2.4. Erosion runs
Sediment erodability was determined using an annular flume similar to the one
described in Widdows et al. (1998b, 2007). The flume has an outer diameter of 60 cm, a
channel of 40 cm high and 15 cm wide, generating a bottom area of 0.21 m2 and a capacity of
~60 L (water column of 30 cm). It has seven sampling ports distributed every 5 cm in height.
The flume has a motor-driven top rotating plate that can generate free-stream velocities (U)
up to 53 cm s-1, corresponding to shear velocities (u*) up to 13 cm s-1. The flume has been
previously calibrated using computational fluid dynamics (CFD) modelling and velocity
profile measurements over smooth sediment surface (Fernandes et al., 2007). Shear velocities
were determined from the logarithmic velocity profile, using the Karman–Prandtl Law of the
Wall equation. The relationship between U and u* in this flume is described by u* = 0.2462 U
+ 0.0141 (R2=1). This type of bench annular flumes is characterised by a compressed
boundary layer profile with shear velocities higher than the ones found in the field for the

PART IV – CONTAMINATED SEDIMENTS AND BIOLOGICAL ACTIVITY
148
same current velocities. Because this study approaches the sediment bottom conditions,
hydrodynamic conditions are characterised by u*.
For each sediment type (B, CB, N, and CN) a flume box with the manipulated
sediment (in triplicate) was introduced into the flume upstream of the sampling ports. The
flume bed was then completed with three other flume section boxes in an inverted position,
levelled to the sediment surface and tape sealed to avoid inter-scouring between boxes and
edge effects.
Shear velocities were increased every 15 min to 1, 3, 4, 5, 6, 10 and 13 cm s-1.
Triplicated water samples (100 ml, collected at 2, 2 and 22 cm for from the bed) for
determination of suspended particulate mater (SPM), particulate organic matter (POM), were
taken for each velocity. Samples for Chl a, particulate and dissolved copper concentrations
(pCu and dCu) were taken twice before erosion (at u* 1 and 3 cm s-1) and twice after erosion
at (at u* 10 and 13 cm s-1). Water samples were immediately filtered through washed, ashed
and pre-weighed Whatman GF/C filters. The filters were oven-dried at 90 ºC (48h) for
calculation of SPM and then incinerated (450 ºC, 1 h) for the calculation of POM. Chl a on
filters was extracted as described above. Copper concentrations were determined according to
the methods described in section 2.6. After each run, the water was carefully drained,
sediment was defaunated and N. diversicolor density was determined.
6.2.5. Critical erosion velocity and eroded matter
Critical shear velocity (u*crit) was determined after Widdows et al. (1998b) and defined
as the shear velocity required to increase SPM concentration above a threshold of 100 mg L-1.
It was estimated from the regression of log SPM against shear velocity.
Eroded matter (g m-2) was determined from SPM concentrations and the sediment bed
(0.053 m2). Erosion rates (g m-2 s-1) were determined using the difference in eroded matter
between two velocity steps.
As suspended sediments result from erosion of a known area, erosion depth ( dE , cm)
was estimated from bulk density using the expression: Ad
VdE
s
w
d*
*= , where dw is the
concentration of sediment in the water column at a given current velocity (SPM, g L-1), V is
the volume of water in the flume (L); ds is the sediment dry bulk density (g dw cm-3) and A
the area of the bed (cm-2).

Chapter 6 – Effect of N. diversicolor on shear strength and erodability
149
6.2.6. Copper analysis
All the materials used in the processing of samples for copper analysis were
previously decontaminated overnight in HNO3 (1:10). The water samples were immediately
filtered onto decontaminated Nuclepore polycarbonate filters (0.4 µm pore size) for pCu
and dried at 60 °C in plastic Petri dishes. Samples were processed as in Grasshof et al. (1999).
Samples of filtered water in HDPE bottles were acidified with HNO3 and kept cool until dCu
analysis. Extraction was performed with purified 1,1,2-trichloro-1,2,2-trifluoroethane (freon),
an extracting mixture of ammonium pyrrolidine dithiocarbamate (APDC), diethylammonium-
N,N-diethyldithiocarbaminat (DDDC) and 2M acetate buffer (acetic acid and ammonia).
The sediment, the organisms and the pCu filters were dried at 60ºC for 48h, after
which the sediment and organisms were ground into fine powder in a planetary agate ball mill
(Retsch® S100). All the samples were individually kept in plastic Petri dishes, in a dry place,
until analysis. Samples of the sediment and pCu filters were processed as in Rantala and
Loring (1975) and the organisms as in Sobral and Widdows (1997). Wet digestions were
performed in tightly closed Teflon (PTFE) containers in a covered water-bath at 100°C.
Sediment and pCu samples were digested in aquæ regia and fluorhydric acid (HF) for 90 min
and 60 min respectively. The organisms were digested in HNO3 for 4 h, plus 1 h after the
addition of hydrogen peroxide (H2O2). Copper contents were analysed by FAAS with a
Perkin-Elmer A Analyst spectrophotometer.
Certified reference materials (estuarine water BCR CRM 505, mussel tissue BCR
CRM 278R and marine sediment NRC MESS-3) were used in this analysis. Values for copper
in the reference water and mussel tissue were 13.5 and 20.6 % lower than the certified values,
and so the input of copper from the sediment to the water and accumulation by N. diversicolor
may have been underestimated. Values for the sediment were within 0.5 % of the certified
values.
6.2.7. Statistical analysis
The effects of N. diversicolor and copper on the sediment properties (dry bulk density,
organic content, Chl a and SS) were analysed with a multivariate bifactorial ANOVA; eroded
matter and input of copper to the water column under increasing shear velocities were
analysed with ANCOVA, for α=0.5 in both cases, using STATISTICA (version 6.0) software.
Comparisons of different treatments were evaluated using Tukey HSD post-hoc probability

PART IV – CONTAMINATED SEDIMENTS AND BIOLOGICAL ACTIVITY
150
test. Independence between samples was assured through the experimental design and
homogeneity of variances was verified through Levene's test.
6.3. Results and Discussion
6.3.1. Effects of bioturbation and copper contamination on sediment properties
6.3.1.1. Sediment shear strength
Fall-cone measurements of SS at the sediment surface, before erosion runs (after 21
incubation days), did not reveal eventual effects due to bioturbation or contamination (Table
6.1).
Table 6.1 - Biogeochemical characteristics of the sediment before erosion: Control (B), sediment with N. diversicolor (N), copper spiked control (CB) and copper spiked sediment with N. diversicolor (CN). mean ± SD, (n, number of samples).
B N CB CN
Shear strength (KPa)
0-1cm (3 ) 0.22 ± 0.04 0.45 ± 0.14 0.22 ± 0.06 0.38 ± 0.05
1-5cm (12 ) 0.67 ± 0.18 1.19 ± 0.30 0.33 ± 0.05 0.69 ± 0.30
Bulk density (Kgm-3
)
0-1 cm (3 ) 204 ± 48 224 ± 64 175 ± 72 178 ± 75
1-5 cm (12 ) 420 ± 124 436 ± 106 364 ± 175 337 ± 111
Organic matter content (%)
0-1 cm (3 ) 9.0 ± 0.6 8.3 ± 0.5 9.5 ± 0.7 9.6 ± 0.6
1-5 cm (12 ) 8.8 ± 0.6 8.6 ± 0.6 8.6 ± 1.0 8.7 ± 1.3
Chl a (ugg-1
)
0-1 cm (3 ) 9.9 ± 1.3 8.0 ± 0.4 14.1 ± 1.4 8.4 ± 0.5
1-3 cm (6 ) 12.0 ± 0.6 5.6 ± 5.5 8.8 ± 1.3 5.8 ± 0.6
Cu (µmol g-1
)
0-1 cm (3 ) 0.49 ± 0.05* 0.49 ± 0.05* 2.95 ± 0.11 2.91 ± 0.13
1-5 cm (12 ) - - 3.02 ± 0.08 2.92 ± 0.09
Sediment types
*Cu in the sediment from Ponta da Erva, previous studies

Chapter 6 – Effect of N. diversicolor on shear strength and erodability
151
However, the comparison of SS measured in depth (Fig. 6.2) showed that bioturbation
produced significantly higher SS in the deeper sediment layers (one-way ANOVA
F1.10=42.5936, p<0.001) resulting in a 76 % increase in the non contaminated sediments (B
and N, Tukey, p<0.001) and 125 % under copper-spiked sediments (CB and CN, Tukey,
p<0.001). Similar observations were done by Meadows and Tait (1989) and Meadows et al.
(1990), who found an increase in shear strength of about 40 % under non-contaminated
conditions. Higher SS in depth may be the result of improved adhesion of particles through
mucus production, as well as of compaction of the sediment associated to gallery building and
sediment remixing activities (Meadows et al., 1990; Fernandes et al., 2006a).
0
1
2
3
4
5
6
7
0.0 0.5 1.0 1.5 2.0 2.5
KPa
depth
(cm)
B
N
CB
CN
Figure 6.2. - Shear strength (KPa) profiles for each sediment before erosion runs: control (B), sediment with N. diversicolor (N), copper spiked control (CB) and copper spiked sediment with N. diversicolor (CN). Mean ± SD. n=3. Significant differences among the four sediments (two-way ANOVA F5.88=19.0410, p<0.001) and sediment layers (two-way ANOVA F3.90=19.9465, p<0.001).
Copper spiked sediments had significant lower SS values, than the non-contaminated
sediments (Fig. 6.2), 45 % lower in control sediments (B and CB, Tukey, p<0.01) and 40 % in
the sediments with N. diversicolor (N and CN, Tukey, p<0.001).
PART IV – CONTAMINATED SEDIMENTS AND BIOLOGICAL ACTIVITY
152
In related experiments, Fernandes et al. (2006b) reported that the mixing activity of N.
diversicolor, quantified as biodiffusion coefficients (Db) in experiments with luminophores,
was lower when under Cu contamination on the first days of incubation. Yet, after 14 days of
incubation the Db observed in N and CN experiments were similar and this suggests that
sediment shear strength profiles observed in Fig. 6.2 are the result of bioturbation activity in
the first days when the organisms start to colonize the sediment.
The analysis of bacterial activity in the same batch of sediments used in the present
study revealed decreased levels of bacterial abundance and significant low levels of biomass
production in comparison to non-contaminated sediments (Almeida et al., 2007). This led to
lower bacterial mucus production and to decreased sediment adhesion. The toxic effect of
copper on the biota decreases their activity, resulting in lower sediment SS.
6.3.1.2. Sediment dry bulk density and organic matter
Surface values of dry bulk densities were ~50 % lower than the depth values in all the
sediments (Table 6.1). N. diversicolor bioturbation had little effect on ds but Cu spiked
sediments showed significantly lower depth averaged ds (one-way ANOVA, F1.196=17.241,
p<0.001). These values of ds are lower than the one found for the Tollesbury estuary (500 –
700 Kg m-3, Watts et al., 2003), the Dutch Wadden Sea (Houwing, 1999) and the Northern
Wadden Sea (Austen et al., 1999). The percentage of organic matter ranged from 8 to 10%
(average values of 8.8 ± 0.9%, n=84) and was similar in all the sediments (Table 6.1).
As density measurements of cohesive mud are closely related to water content, the
lower sediment bulk density in this experiment seems to be a consequence of the continuous
immersion of the sediment and also of the contamination procedure. Therefore the
comparison between these sediments and the ones described for other field studies in estuaries
should be done with caution.
6.3.1.3. Chlorophyll a in the sediment
The presence of N. diversicolor resulted in lower Chl a sediment content (Table 6.1)
regardless of copper contamination (two-way ANOVA, F1.22=19.5396, p<0.001). This
reduction was of 20 % in the control and 40 % in the copper contaminated sediments. This
effect on Chl a has been previously observed (Smith et al., 1996; Fernandes et al., 2006a) and
is related to grazing by N. diversicolor on the biofilm, since non-selective sediment ingestion
is the predominant feeding mode of N. diversicolor. A recent work from Engelsen and Pihl

Chapter 6 – Effect of N. diversicolor on shear strength and erodability
153
(2008) showed that N. diversicolor was able to prevent initial algal growth, affect growth
capacity and also partly reduce full-grown algal mats.
Many studies refer the toxic effect of copper on the biota (Morelli and Scarano, 2004,
Gillis et al., 2006) but surprisingly the Chl a content in the contaminated sediment without N.
diversicolor was 42 % higher than in the control. To a certain extent high copper
concentrations may not be inhibitory to the biofilm community development as tolerant
species may replace sensitive ones. Copper concentrations that affect the growth of
microalgae are in fact largely variable and depend on the cellular defences of the species
assayed and on environmental conditions, especially when sediments sequester toxic metals
and reduce their bioavailability. Real et al. (2003) found significantly increased Chl a contents
in periphyton under copper exposure to 44 µg L-1 regardless of the presence of grazers. Cid et
al. (1995) have reported that growth of microalgae can be more affected by copper than
photosynthesis suggesting that the two processes may be uncoupled. Toxicity of copper
towards the meiofauna has also been reported by Hagopian-Schlek, et al. (2001) who found
LC50 96-h of 4.4 µmol Cu g-1 for harpacticoid copepods and by Fleeger et al (2006) who
found that nematode abundance decreased by 50% when under copper concentrations of 2.4
to 6 nmol Cu g-1).
6.3.2. Copper in the sediment and accumulation by N. diversicolor
Bioturbation by N. diversicolor had no significant effects on the vertical distribution of
copper in the sediment (Table 6.1). This was not surprising since copper was added directly
and homogeneously to the bulk sediment. Copper values at the surface layer were lower than
in the deeper layers. Profiles obtained from sediments with N. diversicolor were less variable
and showed lower copper contents than the controls. The adsorption of copper to the mucus
secreted by N. diversicolor to cement the gallery walls reduced its bioavailability, while
irrigation through galleries increased the oxygenation of sediments (Ferro et al., 2003), and
facilitated copper transport to the water column. In addition, bioturbation by N. diversicolor
might have promoted resuspension of particles before the onset of erosion. Lower Cu might
be a result of sediment ingestion and accumulation of copper in the animal tissues.
N. diversicolor had an initial (day 0 of the experiment) copper content of 0.28 ± 0.08
µmol g-1 dw. After 21 days under laboratory condition, in the non-contaminated sediments,
there was evidence of depuration and a decrease of 23 % (copper content of 0.22 ± 0.03 µmol
g-1). Mortality rates were 13 ± 6 % and related to death during core sampling. In the copper

PART IV – CONTAMINATED SEDIMENTS AND BIOLOGICAL ACTIVITY
154
contaminated sediments, mortality rates were higher, 23 ± 7 %. Accumulation took place at a
rate of 0.01 µmol Cu g-1 d-1 leading to a significant increase of 78 % in tissue copper content
(0.50 ± 0.08 µmol g-1) (one-way ANOVA, F1.12=5.718004, p<0.05). Therefore, before erosion
runs the differences in copper content between animals in the contaminated and in the non-
contaminated sediments were highly significant (one-way ANOVA, F1.16=90.5960, p<0.001).
When exposed to contaminated sediments N. diversicolor accumulated copper in the
tissues up to 0.63 µmol g-1 dw, in the range of the contents found for this species in several
polluted estuaries (Bryan and Hummerstone, 1971; Rainbow et al., 2004; Saiz-Salinas and
Francés-Zubillaga, 1997). The known ability of N. diversicolor to cope, to a certain extent,
with copper contamination arises from the production of detoxified metal- rich-granules in
both the tegument and intestine walls (Rainbow et al., 2004), from the existence of regulatory
systems for copper excretion (Bryan and Hummerstone, 1971), and also from active
protection provided by their mucus-lined galleries against contaminated particles in the
sediment (Saiz-Salinas and Francés-Zubillaga, 1997). Sediment reworking by N. diversicolor
(François et al., 1997; Fernandes et al. 2006b) promotes further complexation of copper.
6.3.3. Effects of bioturbation and copper contamination on erosion
6.3.3.1. Eroded matter and critical shear velocities
Eroded matter and erosion rates were higher in the sediments with N. diversicolor and
lower in contaminated sediments (Table 6. 2).
Table 6.2 - Parameters of the fitted equation E=a.eb.u* for eroded matter, Em, (g m-2) and erosion rates, Er, (g m-2 s-1) as a function of shear velocity, u* (cm s-1), and critical shear velocities (u*crit, cm s-1, mean ± SD, n=3), in the control sediment (B), sediment with N.
diversicolor (N), copper spiked control (CB) and copper spiked sediment with N. diversicolor (CN). (R2, n=24).
Em Er u*crit
a b R2
a b R2
B 3.3866 0.3785 0.71 0.001 0.5005 0.73 7.7 ± 0.3
N 3.6661 0.4689 0.81 0.0008 0.5714 0.82 7.5 ± 0.1
CB 1.7598 0.4393 0.84 0.0012 0.4607 0.87 6.7 ± 0.3
CN 1.7639 0.4825 0.85 0.0009 0.5072 0.82 7.1 ± 0.5
Sediment types

Chapter 6 – Effect of N. diversicolor on shear strength and erodability
155
The relationship between Em and shear velocity (Fig. 6.3) was different among
sediments (ANCOVA, F3.92=3.2, p<0.05) and among velocities (ANCOVA, F1.92=154.6,
p<0.001). Below 6 cm s-1 Em varied from 4 to 23 g m-2, and was higher in the presence of N.
diversicolor whose activities clearly displaced particles into the near-bottom water (Fig. 6.3).
At the maximum velocity tested, bioturbated sediments eroded 1716 ± 54 g m-2 in the control
(N) and only 1036 ± 137g m-2 in the copper-spiked sediments (CN). In the sediments without
bioturbation by N. diversicolor (B and CB) the presence of copper reduced eroded matter by
~12% (765 ± 183 g m-2 in B and 676 ± 30 g m-2 in CB).
1
100
10000
0 5 10 15u* (cm s-1)
Em
(g m-2)
B
N
CB
CN
Figure 6.3 - Eroded matter (Em, g m-2) in a log scale as a function of shear velocities (u*, cm s-
1). Lines represent the exponential relationships (expressed on Table 2) in each sediments: control (B ), sediment with N. diversicolor (N ), copper spiked control (CB ) and copper spiked sediment with N. diversicolor (CN ). n=3.
Bioturbation by N. diversicolor increased eroded matter both in the non-contaminated
sediments (124 %) and under copper exposure (53 %). This increasing effect has been
previously reported (Fernandes et al., 2006a). N. diversicolor disturbs the surface sediment
and reduces the biofilm and this results in lower Chl a concentrations (Table 6.1). Grazing
PART IV – CONTAMINATED SEDIMENTS AND BIOLOGICAL ACTIVITY
156
reduces sediment stability and facilitates erosion, as has been shown by Underwood and
Smith (1998) and de Brouwer et al. (2003). A similar effect was observed by Austen et al.
(1999), who found that Hydrobia ulvae could regulate the biostabilisation process through
reduction of the biomass of microalgae on the surface sediment.
Digging burrows and building galleries modify the geotechnical properties of the
sediment (Meadows and Meadows, 1991). Once erosion starts, and with increasing shear
velocity, the areas around the openings and above the near surface tubes erode more rapidly,
as observed in earlier studies (Luckenbach, 1986; Grant and Daborn, 1994). Once the burrows
start to become prominent, the generation of eddies within these structures results in a higher
transfer of turbulent kinetic energy to the bed, thus, leading to increased shear velocities
(Eckman et al., 1981 and Eckman, 1983) and further erosion.
Lower Em was found for contaminated sediments (Fig. 6.3), especially in the presence
of N. diversicolor (reduction of 36 %), suggesting that copper in the sediment attenuated the
activity of the biota present.
Though we lack direct measurements of activity, copper toxicity towards the biota has
been addressed quite extensively (Gillis et al., 2006; Real et al., 2003; Sobral and Widdows,
1997). In a study of the effect of chemical pollution on the bioturbation potential of estuarine
intertidal mudflats, Mazik and Elliot (2000) found that increased levels of pollution reduced
bioturbation, average burrow depth and volume, as a result of decreasing species diversity and
community biomass, as well as diversity of feeding and bioturbation groups. Biosynthesis of
EPS is a known mechanism of metal sequestration, used by several bacteria and
microphytobenthos, which offer a protective barrier to cells against environmental stress.
Some Cu-resistant bacteria are known to be growth stimulated by Cu contamination (on a
growth medium of up to 1000 mg Cu2+l-1) and to increase EPS production according to the
need of metal cation binding onto the EPS (Kazy et al. 2002). However, this is not supported
by the lower bacterial activity observed in the contaminated sediments without N. diversicolor
(Almeida et al., 2007).
Critical shear velocities were similar in all treatments, but slightly lower in the
contaminated sediments (Table 6.2). The similarity among treatments can be understood
considering the observations of Bale et al. (2006) who found significant correlations between
critical erosion threshold and silt content, bulk density and water content in sediments from
the Tamar Estuary.

Chapter 6 – Effect of N. diversicolor on shear strength and erodability
157
6.3.3.2. Input of organic matter, chlorophyll a and copper to the water column
Bioturbation by N. diversicolor was responsible for higher values of eroded mass, and
thus increased the transport of materials from the sediment surface to the water column, and
the effect was more pronounced in the non contaminated sediments.
As expected, the organic content of eroded matter (EPOM) was highly correlated to total
eroded matter (Em) in all sediments (EPOM=0.1040.Em+2.3926, R2=0.98, n=96, regression
analysis, F1.94=3832.2, p<0.001) and was similar among sediments. At velocities below u*crit
(u* < 6 cm s-1) organic matter content varied between 25 % and 45 % and decreased to 7 % to
20 % when bulk erosion started.
As N. diversicolor decreased the chlorophyll content at the sediment surface (Table
6.1) the input of chlorophyll into the water column was ~24 % lower in its presence (Fig. 6.4).
At velocities above u*crit, the input of Chl a to the water column showed a 10-fold increase.
When compared to the controls (B and CB) sediments without N. diversicolor contributed
with less 20 to 30% Chl a.
Figure 6.4. Input of chlorophyll a (mg m-2) to the water column at selected shear velocities (u* cm s-1) for control sediment (B), sediment with N. diversicolor (N), copper spiked control (CB) and copper spiked sediment with N. diversicolor (CN). Mean ± SD. n=3.
0
5
10
15
20
25
30
35
1 5 10 13
u* (cm s-1)
Chl a
(mg m-2)
B
N
CB
CN
e
r
o
s
i
o
n

PART IV – CONTAMINATED SEDIMENTS AND BIOLOGICAL ACTIVITY
158
Sediment bioturbation by N. diversicolor had no effect on the concentrations of
dissolved copper in the water column (Fig. 6.5), which was.directly related to increasing shear
velocities (ANCOVA, F3.61=9.8524, p<0.0001), first as a consequence of (shear stress)
pumping of interstitial water out of the sediment, and later due to erosion.
Figure 6.5 - Input of dissolved and particulate copper (dCu and pCu, µmol m-2) to the water column at selected shear velocities (u* cm s-1) for copper spiked control sediment (CB) and copper spiked sediment with N. diversicolor (CN). Mean ± SD. n=3.
0
10
20
30
40
50
60
70
80
1 5 10 13u* (cm s-1)
dissolved Cu
(µmol Cu m-2)
CB
CN
0
400
800
1200
1600
2000
2400
2800
3200
1 5 10 13
u* (cm s-1)
particulate Cu
(µmol Cu m-2)
CB
CN
e
r
o
s
i
o
n
e
r
o
s
i
o
n

Chapter 6 – Effect of N. diversicolor on shear strength and erodability
159
Significantly different dissolved copper concentrations (Tukey, p<0.01) were found
before (15.9 to 24.7 µmol Cu m-2) and after erosion (34.6 to 53.5 µmol Cu m-2).
Concentrations of particulate copper in the water before the onset of erosion were only
slightly higher when in the presence of N. diversicolor and increased sharply with shear
velocity (Fig. 6.5) resulting in a ~200 times increase at the highest velocity tested. Particulate
Cu content in the water column increased with Em as expected and was therefore significantly
different below and beyond u*crit (ANCOVA, F3,31=47.28, p<0.0001). As bioturbation
promoted increased values of eroded mass, particulate copper input to the water column was
significantly higher in the presence of N. diversicolor (ANCOVA, F1,31=5.27, p<0.05). Strong
interaction between shear velocities and the presence of N. diversicolor was also found
(ANCOVA, F1,31=9.26, p<0.01). Mixing and reworking of the surface sediment promoted
suspension of particles and facilitated the input of organic materials and particulate copper to
the water column.
6.3.4 Eroded depth and sediment shear strength
Depth of erosion was calculated from the amount of eroded matter. Erosion depths
(Fig. 6.6) were significantly different among sediments (one-way ANOVA, F1.4=33.47,
p<0.001) and the sediments without N. diversicolor were clearly lower than in bioturbated
sediments. Bioturbation by N. diversicolor had a significant impact on this variable increasing
it by 2.2 times in the sediments without contamination (1.7 ± 0.4 mm in B and 3.8 ± 0.1 mm
in N) and 1.6 times in the copper spiked sediments (1.8 ± 0.01 mm in CB and 2.9 ± 0.4 mm in
CN) (Tukey, p < 0.001 and p < 0.01, respectively). Copper contamination had no effect on
erosion depth of the control sediments (B and CB), but bioturbation in the copper spiked
sediments significantly increased erosion depth by 22 % (for N and CN, Tukey, p < 0.01). As
expected, a significant positive correlation (R2=0.84, F1,10=54.0, p<0.001, n=12) was found
between erosion depth and SS measured after erosion (Fig. 6.6) as the more compact
subsurface layers became exposed.
Sediments with higher SS are expected to be more resistant to erosion, as was recently
verified by Watts et al. (2003) on intertidal sediments of Tollesbury (Essex) using both Fall-
Cone and CSM devices and erosion rates calculations from the si index. In the present study
we found a different relationship between SS after erosion and Ed (Fig. 6.6).
SS of 0.2 KPa was enough to prevent further erosion on the sediments without N.
diversicolor, whereas in the sediments bioturbated by N. diversicolor higher values of SS

PART IV – CONTAMINATED SEDIMENTS AND BIOLOGICAL ACTIVITY
160
were needed (0.3-0.7 KPa). This relation is supported by observations by Grant and Daborn,
(1994) who also found positive relationships between SS and Em, which is in this work
directly related to Ed. The effect of bioturbation by N. diversicolor upon Em could be
explained by increasing particle adhesion and aggregation by mucus production, especially in
response to copper toxicity, and by increasing sediment compaction due to sediment
reworking and gallery building. Biologically bound sediments, on one hand, lead to higher SS,
but above u*crit promote erosion of sediment aggregates (Luckenbach, 1986), instead of the
gradual erosion observed in sediments with lower shear strength and lower biological activity
(as in the absence of N. diversicolor).
y = 5.576x + 0.845
R2 = 0.84
1
2
3
4
5
0 0.2 0.4 0.6 0.8
KPa
Ed
(mm)
B
N
CB
CN
Figure 6.6 - Relation between erosion depth (Ed, mm) and sediment shear strength (KPa) measured after erosion. Circle indicates sediments without N. diversicolor. Trend line was built combining data from each sediment (F(1.10)=53.98. p < 0.001), control (B), copper spiked control (CB), sediment with N. diversicolor (N) and copper spiked sediment with N.
diversicolor (CN).
The results found in this laboratory study are not consistent with field observations
that showed a direct relationship between SS and Chl a (Underwoood and Paterson, 1993;
Mazik and Elliot, 2000) using a CSM® and a Geonor® H-10 field inspection vane. Although
we could find in this experimental study an inverse relationship between Chl a concentration
in the sediment and Em, we also observed that different values of Chl a corresponded to the

Chapter 6 – Effect of N. diversicolor on shear strength and erodability
161
same initial values of SS at the surface, as measured with the fall-cone device. This is not
surprising since fall-cone measurements do not reflect the changes in the characteristics or
abundance of the biofilm, but measure instead the geotechnical strength related to other
properties of the sediment, such as physical resistance. Also, sediments in this study were
kept immersed and therefore will respond differently from the tidal sediments measured by
the different authors. In addition, patchiness and the complex interaction among
biogeochemical properties of the sediment, such as grain size, water content, sediment bulk
density, organic matter and the biota, contribute to varied responses that are not always clear
(Houwing, 1999; Widdows et al., 2000 a,b).
Eroded matter (Em) and erosion rates (Er) of cohesive sediments are commonly related
to shear stress (Sanford and Maa, 2001; Wang, 2003) but a high variability is generally
recognized. In the present study, different Em and Er were observed for similar shear
velocities, confirming that these parameters do not depend solely on hydrodynamic conditions
and are related to sediment characteristics (as shear strength), which in turn are influenced by
the biota.
6.4 Conclusions
This study provides evidence that N. diversicolor not only disrupts the stability of
surface sediment, making it more prone to erosion, but it also modifies sediment shear
strength profiles, increasing the resistance to erosion of subsurficial layers.
Copper contamination partially counteracted the effects of bioturbation. Contaminated
sediments are more stable as a consequence of biological responses to toxicity such as lower
bioturbating activity and the production of mucus that binds sediment particles. Contaminated
sediments will have therefore longer residence times and may act as contamination sources
during storm events. This issue should be addressed carefully as natural contaminated
sediments are complex mixtures of various interacting pollutants, eliciting different defensive
responses that may lead ultimately to the death of the biota. In this event, the biological
responses that promote stability would no longer be acting. Biological activity of N.
diversicolor and biogeochemical processes at the sediment water interface modify sediment
properties and thus influence the transport of materials to the water column, increasing food
availability but also releasing contaminants. This coupling of the benthic and pelagic
processes must be taken into account to develop realistic approaches of sediment transport
models for the better management of effluent disposal of coastal and estuarine systems.

PART IV – CONTAMINATED SEDIMENTS AND BIOLOGICAL ACTIVITY
162
6.5 Acknowledgements
This work was funded by Fundação para a Ciência e Tecnologia (Portugal), project
POCTI/33735/BSE/1999 and fellowship (SFRH/BD/6188/2001). We would like to thank the
anonymous reviewers whose comments greatly enhance the manuscript.
6.6 References
Almeida, A., Cunha, A., Fernandes, S., Sobral, P., Alcântara, F., 2007. Copper effects on bacterial activity of estuarine silty sediments. Estuarine Coastal and Shelf Science 73, 743-752.
Austen, I., Andersen, T.J., Edelvang, K., 1999. The influence of benthic diatoms and invertebrates on the erodability of an intertidal mudflat, the Danish Wadden sea. Estuarine Coastal and Shelf Science. 49, 99 -111
Bale A.J., Widdows, J., Harris, C.B., Stephens, J.A., 2006. Measurements of the critical erosion threshold of surface sediments along the Tamar Estuary using a mini-annular flume. Continental Shelf Research 26, 1206–1216
Bryan, G.W., Hummerstone, L.G., 1971. Adaptation of the polychaete Nereis diversicolor to estuarine sediments containing high concentrations of heavy metals.1- general observations and adaptation to copper. Journal of the Marine Biological Association of theUnited Kingdom 51, 845-863
Cid A., Herrero C., Torres, E., Abalde, J., 1995. Copper toxicity on the marine microalga Phaeodactylum tricornutum: effects on photosynthesis and related parameters. Aquatic Toxicology 31, 165-174
de Brouwer, J.F.C., Wolfstein, K., Ruddy, G.K., Jones, T.E.R., Stal, L.J.. 2005. Biogenic Stabilization of Intertidal Sediments: The Importance of Extracellular Polymeric Substances Produced by Benthic Diatoms. Microbial Ecology. 49, 501–512
de Brouwer, J.F.C., de Deckere, E.M.G.T., Stal, L.J., 2003. Distribution of extracellular carbohydrates in three intertidal mudflats in western Europe. Estuarine Coastal and Shelf Science 56, 313-324.
de Brouwer, J.F.C., Ruddy, G.K., Jones, T.E.R., Stal, L.J., 2002. Sorption of EPS to sediment particles and the effect on the rheology of sediments slurries. Biogeochemistry. 61, 57-71.
Eckman, J.E., 1983. Hydrodynamic processes affecting benthic recruitment. Limnology and Oceanography. 28, 241-257.
Eckman, J.E., Noowell, A.R.M., Jumars, P.A., 1981. Sediment destabilisation by animal tubes. Journal of Marine Research 39, 361-374.
Engelsen, A., Pihl, L., 2008. Grazing effects by Nereis diversicolor on development and growth of green algal mats. Journal of Sea Research 59, 228–236
Fernandes, S., Sobral, P., van Duren, L., 2007. Clearance rates of Cerastoderma edule Ander increasing current velocity. Continental Shelf Research 27, 1104 - 1115
Fernandes, S., Sobral, P. Costa, M.H., 2006a. Nereis diversicolor effect on the stability of cohesive intertidal sediments. Aquatic Ecology 40, 567-579.
Fernandes, S., Meysman, F., Sobral, P., 2006b. The influence on Cu contamination on Nereis
diversicolor bioturbation. Marine Chemistry 102, 148-158.

Chapter 6 – Effect of N. diversicolor on shear strength and erodability
163
Ferro, I., van Nugteren, P., Middelburg, J.J., Herman, P.M.J., Heip, C.H.R., 2003. Effect of macrofauna, oxygen exchange and particle reworking on iron and manganese sediment biogeochemistry: a laboratory experiment. Vie Millieu 53 (4), 211-220.
Fleeger, J.W., Tita, G., Carman, K.R., Millward R.N., Moser, E.B., Portier R.J., Gambrell R.P., 2006. Does bioturbation by a benthic fish modify the effects of sediment contamination on saltmarsh benthic microalgae and meiofauna? Journal of Experimental Marine Biology and Ecology 330 (1), 180-194.
François, F., Poggiale, J.C., Durbec, J.P., Stora., G., 1997. A new approach for the modelling of sediment reworking induced by a macrobenthic community. Acta Biotheoretica 45, 295-319.
Gillis, P.L., Wood, C.M., Ranville, J.F., Chow-Fraser, P., 2006. Bioavailability of sediment-associated Cu and Daphnia magna. Aquatic Toxicology 77, 402-411
Grant, J., Daborn, G., 1994. The effect of bioturbation on sediment transport on an intertidal mudflat. Netherlands Journal of Sea Research 32, 63-72.
Grasshof, K., Kremling, K., Ehrhardt, M., 1999. Methods for Seawater Analysis. 3rd Ed. Wiley-VCH. Weinheim. p.408.
Hagopian-Schlekat, T., Chandler, G.T., Shaw T.J., 2001. Acute toxicity of five sediment-associated metals, individually and in a mixture, to the estuarine meiobenthic harpacticoid copepod Amphiascus tenuiremis. Marine Environmental Research, 51 (3), 247-264.
Hansbo, S., 1957. A new approach to the determination of the shear strength of clay by the fall-cone test. Sw. Geot. Inst. Publ. No.14, Stockholm.
Hansen, K., Kristensen, E., 1998. The impact of the polychaete Nereis diversicolor and enrichment with macroalgal (Chaetomorpha linum) detritus on benthic metabolism and nutrient dynamics in organic-poor and organic-rich sediment. Journal of Experimental Marine Biology and Ecology 231, 201-223.
Houwing, E.-J., 1999. Determination of the critical erosion threshold of cohesive sediments on intertidal mudflats along the Dutch Wadden Sea coast. Estuarine Coastal and Shelf Science 49, 545-555.
Johnson, B.D., Azetsu-Scott, K., 1995. Adhesion force and the character of surfaces immersed in seawater. Limnology and Oceanography 40, 802-808.
Kazy, S.K., Sar, P., Singh, S.P., Sen, A.K., D’Souza, S.F. 2002. Extracellular polysaccharides of a copper-sensitive and a copper-resistant Pseudomonas aeruginosa strain: synthesis, chemical nature and copper binding. World Journal of Microbiology & Biotechnology 18, 583–588 Luckenbach, M.W., 1986. Sediment stability around animal tubes: the roles of hydrodynamic
processes and biotic activity. Limnology and Oceanography 31, 779-787. Mazik, K., Elliot, M., 2000. The efects of chemical pollution on the bioturbation potential of
estuarine intertidal mudflats. Helgoland Marine Research 54, 99-109. Meadows, P.S., Hariri, M.S.B., 1991. Effects of two infaunal polychaetes on sediment shear
strength and permeability: an experimental approach. Symposium of the Zoological Society of London 63, 319-321.
Meadows, P.S., Meadows, A., 1991. The geotecnical and geochemical implications of bioturbation in marine sedimentary ecosystems. Symposium of the Zoological Society of London 63, 157-181.
Meadows, P.S., Tait, J., Hussain, A., 1990. Effects of estuarine infauna on sediment stability and particle sedimentation. Hydrobiologia 190, 263-266.
Meadows, P.S., Tait, J., 1989. Modification of sediment permeability and shear strength by two burrowing invertebrates. Marine Biology 101, 75-82.

PART IV – CONTAMINATED SEDIMENTS AND BIOLOGICAL ACTIVITY
164
Miller, D.C., Geider, R.J., MacIntyre, H.L., 1996. Microphytobenthos: the ecological role of the "secret garden" of unvegetated, shallow-water marine habitats. II. Role in sediment stability and shallow water food webs. Estuaries 19, 202-212.
Morelli, E. Scarano G., 2004. Coppper-induced changes of non.protein thiols and antioxidant enzymes in the marine microalga Phaeodactylum tricornuntum. Plant Science 167, 289-296.
Ozoh, P.T.E., 1994. The effects of salinity, temperature and time on the accumulation and depuration of copper in ragworm Hedistes (Nereis) diversicolor (O.F. Müller). Environmental Monitoring and Assessment 29, 155-166.
Paterson, D.M., 1989. Short-term changes in the erodability of intertidal cohesive sediments related to migratory behaviour of epipelic diatoms. Limnology and Oceanography 34, 223-234.
Petersen, K., Kristensen, E., Bjerregaard, P., 1998. Influence of bioturbating animals on flux of cadmium into estuarine sediment. Marine Environmental Research 45, 403-415.
Rantala, R., Loring, D., 1975. Multi-element analysis of silicate rocks and marine sediments by atomic absorption spectrophotometry. Atomic Absorption Newsletter 14, 117-120.
Rainbow, P.S., Gefferd, A., Jeantet, A.Y., Smith, B.D., Amiard, J.C., Amiard-Triquet, C., 2004. Enhanced food-chain transfer of coper from diet of copper-tolerant estuarine worms. Marine Ecology Progress Series 271, 183-191.
Rasmussen, A.D., Banta, G.T., Andersen, O., 1998. Effects of bioturbation by the lugworm Arenicola marina on cadmium uptake and distribution in sandy sediments. Marine Ecology Progress Series 179, 179-188.
Real, M., Munõz, I., Guasch, H., Navarro, E., Sabater, S., 2003. The effect of copper exposure on a simple aquatic food chain. Aquatic Toxicology 63, 283-/291.
Saiz-Salinas, J.I., Francés-Zubillaga, G., 1997. Nereis diversicolor: an unreliable biomonitor of metal contamination in the Ria de Bilbao (Spain). Marine Ecology 18, 113-125.
Sanford, L.P., Maa, J. P.-Y., 2001. A unified erosion formulation for fine sediments. Marine Geology 179, 9-23.
Smith, D., Hughes, R.G., Cox, E.J., 1996. Predation of epipelic diatoms by the amphipod Corophium volutator and the polychaete Nereis diversicolor. Marine Ecology Progress Series 145, 53-61.
Sobral, P., Widdows, J. 1997. Effects of copper exposure on the scope for growth of the clam Ruditapes decussatus, from southern Portugal. Marine Pollution Bulletim 34, 992-1000.
Sutherland, T.F., Grant, J., Amos, C.L. 1998. The effect of carbohydrate production by the diatom Nitzschia curvilineata on the erodability of sediment. Limnology and Oceanography 43, 65-72.
Tolhurst, T.J., Black, K.S., Shayler, A.S., Mather, S., Black, I., Baker, K., Paterson, D.M., 1999. Measuring the in situ erosion shear stress of intertidal sediments with the Cohesive Strength Meter (CSM). Estuarine Coastal and Shelf Science 49, 281-294.
Underwood, G.J.C., Smith, D.J., 1998. Predicting epipelic diatom exopolymer concentrations in intertidal sediments from sediment chlorophyll a. Microbial Ecology 35, 116-125.
Underwood, G.J.C., Paterson, D.M., 1993. Seasonal changes in diatoms biomass, sediment stability and biogenic stabilisation in the Severn Estuary. Journal of the Marine Biology Assossiation of the UK 73, 871-887
Wang, Y.H., 2003. The intertidal erosion rate of cohesive sediment: a case study from Long Island Sound. Estuarine Coastal and Shelf Science 56, 891-896.
Watts, C.W., Tolhust, T.J., Black, K.S., Whitmore, A.P., 2003. In situ measurements of erosion shear stress and geotechnical shear strength of the intertidal sediments of the

Chapter 6 – Effect of N. diversicolor on shear strength and erodability
165
experimental managed realignment scheme at Tollesbury, Essex, UK. Estuarine Coastal and Shelf Science 58, 611-620.
Widdows, J., Friend, P.L., Bale, A.J., Brinsley, M.D., Pope, N.D., Thompson, C.E.L. 2007. Inter-comparison between five devices for determining erodability of intertidal sediments. Continental Shelf Research 27, 1174–1189.
Widdows, J., Brown, S., Brinsley, M.D., Salkeld, P.N., Elliot, M., 2000a. Temporal changes in intertidal sediment erodability: influence of biological and climatic factors. Continental Shelf Research 20, 1275-1289.
Widdows, J., Brinsley, M.D., Salkeld, P.N., Lucas, C.H., 2000b. Influence of biota on spatial and temporal variation in sediment erodability and material flux on a tidal flat (Westerschelde, The Netherlands). Marine Ecology Progress Series 194, 23-37.
Widdows, J., Brinsley, M.D., Salkeld, P.N., 1998a. Use of annular flumes to determine the influence of current velocity and bivalves on material flux at the sediment-water interface. Estuaries 21, 552-559.
Widdows, J., Brinsley, M.D., Bowley, N., Barret, C., 1998b. A benthic annular flume for in situ measurement of suspension feeding/biodeposition rates and erosion potential of intertidal cohesive sediments. Estuarine Coastal and Shelf Science 46, 27-38.
Yentsch, C.S., Menzel, D.W., 1963. A method for the determination of phytoplankton chlorophyll and phaeophytin by fluorescence. Deep-Sea Research 10, 221-231


PART IVINTERACTIONS BETWEEN
CONTAMINATED SEDIMENTS
AND BIOLOGICAL ACTIVITY
The influence of Cu Contamination on
bioturbation
Chapter 7
Nereis diversicolor


Chapter 7 – The influence of Cu on N. diversicolor bioturbation
169
THE INFLUENCE OF CU CONTAMINATION ON NEREIS DIVERSICOLOR
BIOTURBATION
S. Fernandes, F. J. R. Meysman, P. Sobral
Marine Chemistry 102, 148-158
Abstract
Aquatic sediments feature a two-way interaction between contaminants and benthic
macrofauna. The effect of the macrofauna community on the transport of contaminants in sediment
has received considerable attention. Yet, few studies have investigated the reverse effect, i.e. the
influence of contaminants on bioturbation activity. To this end, we performed laboratory experiments
to investigate the effect of copper contamination on sediment reworking activity of the ragworm
Nereis diversicolor. A density of 570 ind m2 was introduced in mesocosms containing natural and
copper spiked (2.99 nmol Cu g-1) cohesive intertidal sediments from Ponta da Erva (Tejo estuary,
Portugal). Luminophore tracers were used to quantify sediment reworking activity over time (2, 7, 14
and 21 days). Bioturbation was quantified via biodiffusion coefficients (Db) using two different
parameter estimation routines. In the first days, luminophore concentrations at depth were significantly
lower under Cu contamination. Yet, after 14 days, profiles showed no longer differences, indicating
that N. diversicolor is able to maintain a normal activity under the applied Cu contamination.
Bioturbation activity of N. diversicolor shows a clear non-local signature, generating a faster
penetration of tracer particles at depth than expected by a diffusive mechanism. We show that for this
mode of bioturbation, Db values become highly dependent on the actual optimisation algorithm used
in the parameter estimation procedure. This puts into question the appropriateness of the biodiffusion
model for N. diversicolor bioturbation and may have important repercussions for the comparison of
Db values between studies.
Key-words: cohesive sediments, bioturbation, Nereis diversicolor, copper, luminophores, biodiffusion
model.
7.1 Introduction
Intertidal sediments are known to be places of high organic matter mineralization, and
hence, constitute an important component in global biogeochemical cycles (Middelburg et al.,
PART IV – CONTAMINATED SEDIMENTS AND BIOLOGICAL ACTIVITY
170
1996; Heip et al., 2001). At the same time, these environments are also zones of high
sedimentation, and thus, they can act as a potential trap for solid phase contaminants (James,
2002; Aldridge et al., 2003). In order to assess the fate and dynamics of such contaminants in
the environment, one needs a proper understanding of the reactive transport of these
contaminants (Boudreau, 1997). One crucial aspect in this regard is the two-way interaction
between contaminants and the macrofauna community of intertidal environments.
Benthic macrofauna exert a strong influence upon the chemical constituents within the
sediment in several ways (Gerino et al., 1995; Gilbert et al., 1996; Flach et al., 1998).
Biological activities, such as food foraging and gallery/burrow building, strongly enhance the
transport of solutes, a process known as bio-irrigation (Aller, 2001), and induce considerable
mixing of solids, a process commonly referred to as bioturbation (Meysman et al., 2003).
These activities can also change geotechnical properties, such as grain size distribution
(Giangrande et al., 2002), sediment cohesion, and erodability (Widdows et al., 1998, 2000;
Fernandes et al., submitted). These factors combined strongly influence microbial activity
(Aller and Aller, 1998; Goñi-Urriza et al., 1999; Mulsow et al., 2002; Ferro et al., 2003),
creating a patchy mosaic of oxic and anoxic microhabitats (Fenchel, 1996; Kristensen, 2000),
and hence, will alter the diagenetic conditions within the sediment (Aller and Aller, 1998;
Forster et al., 1999; Mortimer et al., 1999; Nielsen et al., 2004). Overall, macrofauna
bioturbation and bio-irrigation have the potential to strongly influence the production,
mobilisation and accumulation of certain contaminants (Rasmussen et al., 1998;
Hammerschmidt and Fitzgerald, 2004).
Biological mixing is the dominant transport process for solid contaminants in aquatic
sediments (Olsen et al., 1982; Weatcroft et al., 1990), thus it is worthwhile to study the effects
of contamination on bioturbation rates. In the past, experimental bioturbation studies have
focused on community bioturbation in relation to differences in feeding types (Gerino et al.,
1995, 1999; Flach et al., 1998; Turnewitsch et al., 2000; Green et al., 2002), scaling of
bioturbation to the size of the organisms (Swift et al., 1996) and the presence of burrows
(Dellapenna et al., 1998). Other studies have followed a more theoretical approach, relating
biodiffusion coefficients (Db) to biological parameters in simplified models of biological
activity (Wheatcroft et al., 1990; François et al., 2002; Meysman et al., 2003; Mugnai et al.,
2003; Solan et al., 2004). Yet, with regard to the interaction between bioturbation and
contaminants, our knowledge remains sparse. Some studies have measured the effect of
particular organisms (Gilbert et al., 1996, 2003; Rasmussen et al., 1998) or natural
communities (Swift et al., 1996) on the distribution of contaminants, but only few take into
account the effect of contaminants on the mixing activity of the biota (Mulsow et al., 2002).

Chapter 7 – The influence of Cu on N. diversicolor bioturbation
171
Here, our aim is to evaluate the effect of contaminated sediments on the bioturbation
activity of estuarine benthos. We selected the ragworm, Nereis diversicolor, as the subject of
our study.
This endobenthic species is widespread in brackish water environments throughout
north-western Europe, shows a high tolerance to temperature, salinity and lives in muddy to
sandy habitats on the southern-western coast of Portugal (Fidalgo e Costa et al., 1998).
Typical densities are in the range of 1000-2000 ind m-2 for adult populations, but can reach up
to 16000 ind m-2 for juvenile populations in spring (Davey, 1994; Fidalgo e Costa et al.,
1998). It also appears very tolerant to contaminants (Bryan and Hummerstone, 1971; Bernds
et al., 1998) and is an important prey for birds and fishes, representing a link for the transfer
of contaminants in the food chain.
N. diversicolor inhabits a more-or-less permanent and complex gallery network that
can extend down to 30 cm depth, (Anderson and Meadows, 1978; Esselink and Zwarts, 1989;
Davey, 1994). However, in a study on the Humber estuary, Davey and Partridge (1998)
observed that only 20% of the population was found below 8 cm depth. François et al., (2002)
classified it as having a “gallery-diffusor” sediment mixing mode, distinct from “biodiffusors”
and “downward conveyers”. Gallery diffusors display a combination of bio-advective (fast
unidirectional downward transport) and bio-diffusive mechanisms (bi-directional mixing)
(François et al., 2002).
In this study, we evaluate the effect of Cu contamination on the sediment mixing
activity of N. diversicolor using two different biodiffussive modelling procedures. Besides the
contaminant aspect, our aim is also to examine if and how artifacts are created by applying an
exclusive bio-diffusive model to a bioturbation mode, which is characterized by a mixture of
diffusive and advective aspects.
7.2. Materials and methods
7.2.1 Mesocosms set-up
In January 2002, N. diversicolor specimen (10 to 15 cm length) were collected in
Rosarinho (Tejo estuary, Portugal), brought to the laboratory and allowed to acclimatize to
experimental conditions (temperature 17 ± 1 0C (± standard deviation); salinity 36 and light
54 ± 23 µmol m-2 s-1 with a 12 hour photoperiod) for a period of 5 days before being added to
the mesocosms.

PART IV – CONTAMINATED SEDIMENTS AND BIOLOGICAL ACTIVITY
172
Fine muddy sediments from Ponta da Erva (Tejo estuary) (~ 8% organic matter and ~
95% silt) were scooped from the top 2 cm during low tide, and brought to the laboratory,
where they were kept at 4 0C to reduce biological activity until mesocosms were set-up.
Macrofauna (N. diversicolor, small crabs) and larger shell fragments that could be visually
detected upon close inspection were manually removed from the sediment. This defaunation
technique was preferred over sieving to avoid disturbance of the sediment structure texture by
water dilution. Subsequently, the sediment was thoroughly mixed to ensure homogenisation.
Note that this defaunation method does not exclude meiofauna and although a taxonomic
analysis was not performed, nematodes, harpacticoid copepods and ciliates amongst others
were identified.
Two batches of sediments were prepared, one batch referred to as “natural sediment”
to which no contaminant is added, and another one that was spiked with a solution of copper
chloride up to a final concentration of 3.15 nmol Cu g-1 dw (dry weight) (details in Fernandes
et al., submitted). From each sediment batch, five separate mesocosms with an area of 270
cm2 and a sediment height of 8 cm were prepared. From these, four were allocated for
inoculation with organisms, to be sampled on days 2, 7, 14 and 21. The remaining mesocosm
was a control (i.e. without organisms) only to be sampled on day 21. The day after mesocosm
set-up, 24 organisms (0.08 g DW ind-1, n=22) were introduced resulting in an initial density of
900 ind m-2, which is a typical density for an adult N. diversicolor population under natural
conditions (Davey, 1994).
The activity of N. diversicolor was assessed using luminophores (80 – 180 µm), i.e.
inert fluorescent particles (Mahaut and Graf, 1987; Gerino et al., 1998). The luminophores
method generally produces good agreement between field and laboratory studies, and predicts
similar biodiffussive mixing coefficient as when using 234Thorium and Chl a (Gerino et al.,
1998). Luminophores were added in a fine layer (~ 1 mm) onto the sediment surface, enough
to assure that the vertical transport rate would not be influenced by the lack of particles tracers
in the top layer of the sediment (Gerino et al., 1994). The mesocosms were carefully filled
with sea water in order to avoid resuspension of the luminophores. The sediment in the
mesocosms was covered by a water column of ~ 2 cm, in a flow-through system (~ 3 L h-1)
with constant aeration.
Destructive sampling took place after days 2, 7, 15 and 21 days under experimental
conditions. At each sampling time, 3 sediment cores (area 3.5 cm2) were taken from each
mesocosm and immediately frozen until analysis. The remaining sediment in the mesocosms
was hand defaunated in order to estimate the N. diversicolor density at the end of the
experiment. Mortality rates were of 13 ± 6 % in N (N. diversicolor alone treatment) and 27 ±

Chapter 7 – The influence of Cu on N. diversicolor bioturbation
173
7 % in CN (Cu + N. diversicolor treatment) after 21 days. The difference between initial (900
ind m-2) and final densities are attributed to natural mortality, organisms escaping during
incubation, losses in post-experiment defaunation, or elimination during core sampling. The
average density during the 21-day experiment was estimated to be 570 ind m-2.
7.2.2 Luminophores analysis
Frozen cores were sliced in 0.5 cm layers for the top first cm and in 1 cm intervals for
the layers below. Each sample was dried (90ºC, 48h) and homogenized (as described in
Mahaut and Graf, 1987). Within each layer, subsamples of 0.25 g were taken for counting
luminophores under an epifluorescence microscope (Olympus BX60). From this, the number
of luminophores per layer (n) and the total number in the profile (N) were obtained, and
hence, the fraction (n/N) of luminophores per layer could be determined. The concentration of
luminophores was estimated as ( )C n z * A * N= , where z (cm) is the thickness of the
sampling layer and A the core area.
7.2.3 Db estimations
The biodiffusion coefficient Db was estimated using the classical one-dimensional
biodiffusion model (Boudreau, 1986; Wheatcroft et al., 1990; Meysman et al., 2003), which is
governed by
2
2 ),(),(
x
txCDtxC b
∂
∂=∂ [ ]1
Initially, it is assumed that the luminophores are located in a very narrow layer at the water-
sediment interface, as idealized by the initial condition
)()0,( xxC ∂= [ ]2
where (x)δ represents the Dirac delta function. Over the infinite interval, the initial-value
problem [1]-[2] has the solution (Crank, 1975)
−=
tD
x
tDA
NtxC
bb4
exp),(2
π [ ]3

PART IV – CONTAMINATED SEDIMENTS AND BIOLOGICAL ACTIVITY
174
where N is the number of luminophores originally spread at the sediment surface, and A
represents the surface area. Because concentrations are expressed relative to the total number
of luminophores found in the profile, a value of 1=N should be substituted.
Values for Db were obtained by matching expression [3] to the observed data profiles.
For this purpose, two separate procedures were employed. In a first approach (M1), the
untransformed data was used. Accordingly, the biodiffusion coefficient bD was estimated by
minimizing the cost function
2
1
mod
1 )(data
i
N
i
el
i CCR −= ∑=
[ ]4
In a second procedure (M2), the data were first log-transformed, and subsequently, a second
value for the biodiffusion coefficient bD was estimated by minimizing the alternative cost
function
2
1
mod
1 )ln(lndata
i
N
i
el
i CCR −=∑=
[ ]5
Effectively, both procedures use a different weighting of the data when calculating
their “optimal” Db values. The M1 procedure emphasizes the large luminophore
concentrations near to the surface, and thus fits the concentration data in the top layers best. In
contrast, the M2 procedure emphasizes the difference between model and data at low
concentration values, and thus will provide a better fit to the concentration data in the deeper
layers.
Theory predicts that if the actual bioturbation mechanism is truly diffusive, i.e. if
biological activity generates effectively isotropic, small-scale particle displacements
(Meysman et al., 2003), then both procedures should generate the Db same value. However, if
the underlying macrofauna activity is not generating diffusive particle displacements, then the
Db values generated by the M1 and M2 procedures can show large deviations (see below). In
particular, when non-local transport mixes particles faster down as expected, one can expect
large discrepancies between the Db estimates. To quantify any such deviations, we propose
the following non-locality index (NLI) based on the Db values obtained using the M1 and M2
procedures:
[ ] [ ][ ] [ ]21
12
* MDMD
MDMDNLI
bb
bb −= [ ]6

Chapter 7 – The influence of Cu on N. diversicolor bioturbation
175
As required, this non-locality index NLI takes a zero value when Db estimates from
M1 and M2 have the same value, i.e. when biological transport is truly diffusive. Conversely,
for strong non-local transport, the obtained Db values will differ significantly, i.e. Db[M2]
will be large while Db[M1] will be small. Under these conditions, the NLI index [6] tends to
infinity, indicative of a large “non-local” character of the biological transport considered.
7.2.4 Additional cumulative effect of bioturbation and copper
The effects of bioturbation and copper were quantified after Blanchard et al. (1997),
using an index of the additional cumulative effect (ACE, %) of a tested parameter (X), where
ACE = [(Xtreat - Xno treat)/ Xno treat ]* 100. The treatments in our case are the presence of N.
diversicolor and Cu respectively, while the three tested parameters are the biodiffusion
coefficients Db derived from M1 and M2, and the NLI.
7.2.5 Statistical analysis
Statistical analysis was performed using two-way ANOVA (α=0.05) and Bonferroni’s
post-hoc comparison test (STATISTICA® 6.1 software) after data was log-transformed to
assure the homogeneity assumption (verified with Levene's test), in order to test . We tested
for the significance of the effects of treatment (N x NC, Ct x N, Ct x C and C x CN) and time
(2, 7 15 and 21 days) on the Db estimates. With regard to the luminophore profiles in the
sediment, because depth intervals within cores are not independent, the primary assumption of
ANOVA would be violated. To enable ANOVA analysis, core identity was introduced as a
new parameter that was treated as a random factor, nested within the treatment*time
interaction. Significance of the treatment, time, treatment*time interaction was tested over the
mean square between cores within treatment*time. Significance of depth, and all interaction
terms involving depth, was tested over the error mean square.
7.3. Results
7.3.1 Luminophores profiles
Statistical analysis of the profiles of luminophores concentration showed significant
differences between treatments (p=0.0014), which are predominantly caused by differences in
the profiles after the first two days (Fig. 7.1).

PART IV – CONTAMINATED SEDIMENTS AND BIOLOGICAL ACTIVITY
176
Figure 7.1 – Profiles of luminophores concentration over a period of 21 days for a N.
diversicolor density of 570 ind m-2. The “N” treatment represents N. diversicolor in natural sediment, while “CN” refers to N. diversicolor in Cu contaminated sediment. (Bars denote ± standard deviation).
7.3.2 Db estimates
Estimates of Db were highly dependent on the optimisation procedure that was used.
Db values ranged from 0.6 to 5.9 cm2 y-1 using the M1 procedure and from 13 to 493 cm2 y-1
using the M2 procedure (Table 7.1; Fig. 7.2,).
Using the M1 procedure, there was no significant effect of Cu addition on Db values,
which were similar in the N. diversicolor alone (N) and the Cu + N. diversicolor treatment
(CN). In contrast, using the M2 procedure, Db values were significantly higher (p=0.0081) in
the N. diversicolor alone (N) as compared to the Cu + N. diversicolor treatment (CN).
Time showed to have a highly significant effect on the Db values estimated by both
procedures (p<0.0001 for both M1 and M2). This is particularly due to day 2 where Db values
were significantly higher than the ones observed in the following days (p<0.001). The decline
in the Db value with time is very similar in both procedures (M1 and M2), and amounts to a
reduction of 89% between day 2 and day 21.
0
1
2
3
4
5
6
0.0001 0.01 1
lum cm -3
dep
th (
cm
)
N
CN
0
1
2
3
4
5
6
0.0001 0.01 1
lum cm -3
dep
th (
cm
)N
CN
0
1
2
3
4
5
6
0.0001 0.01 1
lum cm -3
dep
th (
cm
)
N
CN
Days 2 7 15 21
0
1
2
3
4
5
6
0.001 0.01 0.1 1
lum cm -3
dep
th
(cm
) N
CN
0
1
2
3
4
5
6
0.0001 0.01 1
lum cm -3
dep
th (
cm
)
N
CN
0
1
2
3
4
5
6
0.0001 0.01 1
lum cm -3
dep
th (
cm
)N
CN
0
1
2
3
4
5
6
0.0001 0.01 1
lum cm -3
dep
th (
cm
)
N
CN
Days 2 7 15 21
0
1
2
3
4
5
6
0.001 0.01 0.1 1
lum cm -3
dep
th
(cm
) N
CN

Chapter 7 – The influence of Cu on N. diversicolor bioturbation
177
Table 7.1 – Db (cm2 y-1) estimates obtained by M1 and M2 procedures and non-locality index (LNI), over a period of 21 days for different mesocosm set-ups. Treatment codes refer to natural sediment with N. diversicolor (N), contaminated sediment with N. diversicolor (CN), the control without organisms under natural conditions (Ct) and control for contaminated sediment (C). (± Standard deviation).
Db (cm 2 y
-1)
Treatments
Days method Ct C N CN
2 M1 4.52 ± 2.30 5.87 ± 0.06
M2 493.39 ± 141.36 305.71 ± 55.18
NLI 11.68 ± 5.78 7.05 ± 0.66
7 M1 1.79 ± 0.05 1.72 ± 0.06
M2 142.13 ± 52.02 65.93 ± 1.01
NLI 8.69 ± 1.76 6.02 ± 0.13
15 M1 0.84 ± 0.08 0.87 ± 0.05
M2 47.67 ± 19.41 48.09 ± 9.85
NLI 7.35 ± 1.75 7.26 ± 0.37
21 M1 0.64 ± 0.10 0.55 ± 0.00 0.59 ± 0.02 0.62 ± 0.06
M2 21.42 ± 9.85 12.77 ± 4.34 56.34 ± 17.53 34.81 ± 15.62
NLI 5.51 ± 0.91 4.57 ± 0.84 9.60 ± 1.44 7.27 ± 2.18
7.3.3 Non-locality index
The non-locality index (NLI) varied in general from 4 to 18 indicating strong non-
local effects (Fig 7.3). Time had no statistical effect on the NLI, but treatment produced
significant differences. Higher NLI values were obtained in the N treatment as compared to
the CN treatment at all sample intervals (p=0.0263).
Comparison at day 21 of the sediments with organisms with the corresponding
controls shows that addition of organisms has a significant effect on NLI (p=0.0124). In both
the natural and contaminated sediment, the addition of N. diversicolor results in a higher NLI.

PART IV – CONTAMINATED SEDIMENTS AND BIOLOGICAL ACTIVITY
178
0.1
1.0
10.0
100.0
1000.0
0 5 10 15 20 25
time (days)
Db (
cm
2 y
-1)
M1 N
M1 CN
M2 N
M2 CN
Figure 7.2 – Evolution of the biodiffusion coefficient over a period of 21 days. “N” represents N. diversicolor in natural sediment, while “CN” refers to N. diversicolor in Cu contaminated sediment. M1 and M2 refer to the different procedures of Db estimation. (Bars represent ± standard deviation).
0
5
10
15
20
2 7 15 21
time (days)
NL
I
N
CN
Ct
C
Figure 7.3 – Non-locality index estimated over time for a population of N. diversicolor under natural (N) and contaminated sediments (CN). (± Standard deviation).

Chapter 7 – The influence of Cu on N. diversicolor bioturbation
179
7.3.4 Comparisons with controls
The Ct control mesocosm (i.e. natural sediment without N. diversicolor) showed a Db
of 0.64 ± 0.10 cm2 y-1 (M1) and 21.42 ± 9.85 cm2 y-1 (M2), while the copper alone treatment
(C) resulted in Db values of 0.55 ± 0.01 cm2 y-1 (M1) and 12.77 ± 4.34 cm2 y-1 (M2) (Table
7.1). The addition of organisms had no significant effect on the M1 estimates, but a
significant effect on the M2 estimates (p=0.0156) that are especially due to differences
between both controls (C and Ct) and N. The concentration profiles at day 21 (Fig. 7.4)
showed no statistically significant differences among treatments. Nevertheless post-hoc
analysis indicates significant differences between N and Ct (p=0.0240) and N and C
(p=0.0128).
0
1
2
3
4
5
6
0.001 0.01 0.1 1
lum cm-3
de
pth
(c
m)
N
CN
Ct
C
Figure 7.4 – Depth profiles of luminophore concentration after 21 days for a N. diversicolor
density of 570 ind m-2. Four treatments: N. diversicolor (N), Cu and N. diversicolor (CN), Cu alone (C), Control (Ct).

PART IV – CONTAMINATED SEDIMENTS AND BIOLOGICAL ACTIVITY
180
7.3.5 Additional cumulative effects
Values for the additional cumulative effect (ACE) due to N. diversicolor and Cu
treatments are presented in Table 7.2. As shown, these values are highly dependent on the
procedure that is used to estimate the Db. The ACE indexes based on the M1 procedure are
contradictory with those produced by the M2 procedure. According to the M1 values, N.
diversicolor produced almost no effect on Db, slightly decreasing Db under natural conditions
(-7%), while slightly increasing Db (+13%) in contaminated sediments. In contrast, M2
values showed that N. diversicolor is responsible for an increase of Db in both natural and
contaminated sediments (163% and 172% respectively).
The same ACE analysis for the NLI index results in no effect (+1%) under natural
conditions, i.e. uncontaminated sediments display the same degree of non-locality with and
without N. diversicolor. However, under contaminated conditions, the NLI index increased
about 60% as a result of the presence of N. diversicolor.
The effect of Cu on bioturbation activity was also highly dependent on the estimation
procedure used to determine Db values. According to M1, the effect of Cu was negligible
(ACE's from 0 to +5%), while based on M2, Cu reduced mixing by about 40%. The NLI
index was lower in the presence of Cu with or without N. diversicolor (ACE's about -20%),
suggesting that Cu reduces the non-local character of the particle mixing.
Table 7.2 - Additional cumulative effect (%) due to bioturbation by N. diversicolor and copper addition. Calculations are based on the Db estimates for day 21 using the M1 and M2 procedures and the non-linearity index (NLI).
Effect Treatment M1 M2 NLI
bioturbation natural -7 163 1
contaminated 13 172 59
Cu N. diversicolor 5 -38 -24
Control 0 -40 -17

Chapter 7 – The influence of Cu on N. diversicolor bioturbation
181
7.4 Discussion
7.4.1 Divergent model results
Strongly differing values for the biodiffusion coefficient are obtained when applying
either M1 or M2 procedures. These divergent Db’s then lead to divergent NLI and ACE
values. The nature and quality of the resulting Db/NLI/ACE values can be assessed by
inspection of the luminophore profiles (Fig. 7.4). These profiles show hardly any distinction
in the top centimetres, while they diverge at depth. The first 0.5 cm virtually contains only
particles that have not been displaced, and accordingly, this top layer does not effectively
embed information on the mechanism of bioturbation. In contrast, differences in bioturbation
activity are only revealed by the data points in the deeper layer (i.e. those particles that have
been actually displaced). As a consequence, the Db/NLI/ACE values derived from M2-Db’s
(based on concentration data in the deeper layers) will be more informative than the ACE
values based on M1-Db’s (predominantly based on information in the top layer). Therefore, it
is not surprising that the ACE values based on M2 engender a more consistent and logical
interpretation: the presence of N. diversicolor increases the Db, the presence of Cu decreases
the Db. In contrast, the ACE values based on M1 suggest that after 21 days the intensity of
reworking is about the same in N. diversicolor inhabited sediments as in the controls without
N. diversicolor (Table 7.1). This awkward conclusion is however refuted by inspection of the
luminophores profiles (Fig.7.4): these profiles show a clear signal (i.e. elevated luminophore
concentrations) at depth due to the presence of N. diversicolor. Due to the distinct data-
weighting of the two DB-estimation procedures, this signal is not picked by M1, but is clearly
exposed by M2.
7.4.2 Interpretation of Db values and non-local effects
The high non-locality index (Fig 7.3) shows that the type of particle transport induced
by N. diversicolor is not well explained by a simple diffusion description. The high
discrepancy between the M1 and M2 estimates for the Db of the same data profile is mainly
caused by a small number of particles, which are transported much faster than would be
expected by the biodiffusion model. The basic assumption of the diffusion model is that
particle displacements are small-scale, and so it requires a considerable number of
bioturbation events (and hence considerable time) for a particle to penetrate to deeper layers.
Therefore, the finding of luminophores particles at depth after short periods of time indicates
that the bioturbation mechanism of N. diversicolor is typified by a true non-local mechanism

PART IV – CONTAMINATED SEDIMENTS AND BIOLOGICAL ACTIVITY
182
of particle displacement. The M2 is heavily biased to this small number of fast-travelling
particles, thus generating high Db values. Conversely, the M1 procedure neglects this
“minority” of fast-travelling particles altogether and instead, focuses on the bulk of the
luminophores, i.e. those near the surface that move slower, and thus generate far smaller Db
values. There are other indications of non-local bioturbation. Figs. 7.1 and 7.4 show a peak in
the luminophore concentration at 3-4 cm depth, both at 2 days and 21 days. Such
concentration peaks are a clear sign of non-local “injection” of tracer at that depth. In contrast,
the biodiffusion model always generates monotonically decreasing concentration profiles,
prohibiting the occurrence of local maxima in the concentration profile. Concentration
maxima at depth might result from the gallery building, deposit feeding and passive sloping of
luminophore particle through the burrows of N. diversicolor.
Fig. 7.2 also shows drastic decreases of the biodiffusion coefficient with time (the
same trend is obtained using the M1 and M2 procedure). A pertinent question then is whether
this decrease is (1) a true feature of the bioturbation mechanism (bioturbation activity
effectively decreases with time), (2) a model artifact (due to the defectiveness of the
biodiffusion model), or (3) a sampling artifact. Effectively, these high initial Db’s originate
because, even for these short bioturbation periods, luminophore particles are found in deeper
layers. This fast occurrence of particles at deeper layers can be caused by (1) increased non-
local transport related to colonisation behaviour of the organisms (i.e. higher gallery building
activities immediately after introduction in an uninhabited environment), or (2) by smearing
of luminophores during core retrieval. The latter situation can be corrected for by subtracting
the profile found in an appropriate control set-up.
In our case, this situation could not be checked because no control sample was taken
after 2 days. However, subtracting the control profile at 21 days (and assuming this is only
generated by core retrieval), we find that some luminophores still reach depths of 2-5 cm
within 2 days. This indicates that non-local transport by N. diversicolor has effectively moved
particles to these depths. Accordingly, applying a conventional biodiffusion model, these deep
penetrating particles will lead to high Db values, when this penetration occurs over short time-
scale. Effectively, the shorter the time-scale, the higher the estimated Db-value will be. This is
because the time period t in model equation [3] will critically influence the magnitude of the
estimated Db value. One can check this model artifact by applying the M2 procedure to same
data profile (e.g. the N profile on day 2 in Fig 7.1) for increasing values of t. The resulting Db
values will show the same strong decrease with time as observed in Fig. 7.2 (results not
shown). Based on this, we conclude that the observed decrease of the Db in Fig. 7.2 is mostly
due to a model artifact, i.e. the biodiffusion model [3] does not appropriately represent the

Chapter 7 – The influence of Cu on N. diversicolor bioturbation
183
factual particle movement of N. diversicolor. Although there might well be an increased
biological particle transport due to gallery building activities immediately after introduction,
in the case of N. diversicolor this increased activity can not be explicited by the diffusion
model [3]. More in general, when bioturbation is dominated by non-local transport
mechanisms, Db values estimated on the first experimental days seem unrealistic to
characterize the activity of organisms.
7.4.3 The effect of Cu on Db values
Concentration profiles of luminophores measured after 7 days did show a significant
effect of Cu on bioturbation (Figs. 7.1-7.2). This depressed bioturbation activity over the first
days of the experiment may result from shock acclimation to copper. Nevertheless, our
observations show that after 14 days, the profiles of luminophores become similar, probably
as a result of N. diversicolor adaptation to contamination. These observations agree with data
obtained on Cu bio-accumulation from a parallel experiment (Fernandes et al., submitted). At
the start of the experiment, the same batch of organisms had initial Cu tissue contents of 0.283
± 0.094 nmol Cu g-1 dw before being introduced in the contaminated sediments. After 2 days,
a bioaccumulation of 0.965 ± 0.076 nmol Cu g-1 dw was observed, after which Cu content
was gradually reduced to 0.653 ± 0.019 nmol Cu g-1 dw after 7 days and 0.472 ± 0.005 nmol
Cu g-1 dw at day 21. The reduction of the Cu content in the tissues of N. diversicolor with
time agrees with observations under pyrene contamination. In pyrene contaminated sediments
(0.4 ppm), the concentration of water-soluble and insoluble pyrene metabolites increases in
the tissues of N. diversicolor during the first four days, after which they reach a steady-state
level (Christensen et al., 2002). Probably, the negligible effect on Db from Cu contamination
is related with the low Cu bioaccumulation. In a study about the ecological impact of Cu
bioaccumulation on N. diversicolor Grant et al. (1989) concluded that effects only become
significant at copper levels above 0.009 nmol Cu g-1 dw, which is one order of magnitude
smaller than the accumulation values observed in our experiments.
On the one hand, copper is known to promote the loss of muscle co-ordination and
balance in juveniles of N. diversicolor when exposed to 7.9 to 9.4 nmol Cu L-1 (Ozoh, 1992),
as well as inducing changes in embryogenesis such as non-motility and reduced ciliary
beatings of larvae (Ozoh and Jones, 1988). On the other hand, N. diversicolor is able to
regulate heavy metal bioaccumulation by excretion and sequestration in secreted mucus
(Bryan and Hummerstone, 1971; Sze and Lee, 1995; Saiz-Salinas and Francés-Zubillaga,
1997). The lower NLI index in the presence of Cu (Fig. 4) suggests a change in type of

PART IV – CONTAMINATED SEDIMENTS AND BIOLOGICAL ACTIVITY
184
bioturbation activity. One explanation for this might be that Cu reduces the feeding activity of
N. diversicolor A reduction in feeding activity was also observed by Christensen et al. (2002)
and Mulsow et al. (2002). The latter authors observed that after the exposure to DDT
contaminated sediments, the polychaete Heteromastus filiformis reduced its feeding rate, and
only mixed the sediment diffusively, conveying only limited amounts of ingested sediment to
the surface. These observations support the idea that through various adaptations, N.
diversicolor has a high tolerance to Cu contamination and is able to maintain a living in Cu
contaminated sediments.
7.4.4 Db estimation on control treatments
The values of Db measured in the control mesocosms were surprisingly high (10-20
cm2 yr-1, Table 7.1) when compared to the Db values estimated in the presence of N.
diversicolor (30-60 cm2 yr-1, Table 7.1). Equally, the controls show a deep penetration of
particles up to 4-5 cm deep after 21 days. The observed transport of particles can be due to (1)
a coring artifact caused by friction near the core liner walls (Crusius and Anderson, 1991) or
(2) due to bioturbation of meiobenthos that were present in the sediments. Meiofauna
abundance can extend up to 10 cm in the sediment (Meira et al., 2001). Similar relatively deep
penetration of luminophores has been observed in the controls from other studies (> 2 cm;
Mugnai et al., 2003; Ouellette et al., 2004). In the latter case, there was no meiofauna
defaunation and no coring artifact, since the tracers were added directly in the cores (Ouelette
et al., 2004). Considering that meiobenthos were not defaunated from the sediment, the lower
Db and NLI values found under Cu contamination might be interpreted as a negative effect of
Cu on the activity of the meiofauna.
This also brings up the question whether our controls are true controls. Although the
sediments were the same, it is highly probable that N. diversicolor has a negative impact on
the meiobenthic fauna through predation. If this would be the case, the reproducibility of
experimental conditions would be affected. Further studies on macrofauna bioturbation could
benefit from a characterisation of the sediment meiofauna (e.g. species composition, biomass,
density with depth). This might help to clarify the effect and interactions between meiofauna
and macrofauna. In a similar fashion one could ask to what extent the abiotic properties of the
sediment are influenced by the presence of N. diversicolor and Cu. A parallel study
(Fernandes et al., in press) showed that N. diversicolor significantly increases sediment shear
strength by 70% under natural conditions and by 90% under Cu contaminated conditions. In
other words, N. diversicolor greatly affects the compaction or cohesion of the sediment,
influencing the overall transport properties of constituents within the sediment. The same

Chapter 7 – The influence of Cu on N. diversicolor bioturbation
185
study revealed that Cu has a significant reduction effect on sediment bulk density (g sediment
cm3).
7.5 Conclusions
The results of this work show that N. diversicolor is largely resistant to contamination
of 3.15 nmol Cu g-1 dw sediment. Bioturbation activity, estimated via biodiffusion
coefficients, did not appreciably differ between uncontaminated and contaminated mesocosm
set-ups when observed over a sufficiently long period of 3 weeks. However, a small
distinction is noticeably when observed over a shorter time-scale. Bioturbation activity of N.
diversicolor was lower in the days immediately following Cu contamination as compared to
the uncontaminated mesocosm. After a sufficient acclimation period (in the order of less than
two weeks), the polychaete was apparently able to adapt to the contaminated sediments
(presumably by regulating its internal levels of contamination), and reached an activity level
that was comparable to that under non-contaminated conditions.
Our work also reveals some intricate problems connected to the model interpretation
of luminophores tracer profiles. Here we show that when macrofauna activity has a clear non-
local signature, the biodiffusion model becomes inadequate, as estimated values of the
biodiffusion coefficient become greatly dependent on the actual optimisation algorithm used
in the parameter estimation procedure. In addition, non-local transport induces an apparent
decrease of the estimated biodiffusion coefficient for longer incubation periods. We believe
this has important repercussions for the comparison of Db values between studies.
7.6 Acknowledgments
We would like to thank Prof. F. Carrapiço (Faculty of Sciences of the University of
Lisbon) for facilitating the use of the epifluorescence microscope. We greatly appreciate the
support of Volodymyr Malyuga and Peter Herman (Netherlands Institute of Ecology) on the
model simulations and statistical analysis. We are very grateful to the anonymous reviewers for
their careful revision and constructive comments from which this manuscript greatly benefited.
This work was funded by Foundation for Science and Technology (Portugal) in the scope of
the project POCTI/33735/BSE/1999 and S. Fernandes' fellowship SFRH/BD/6188/2001. This
is publication 3508 of the NIOO-KNAW (Netherlands Institute of Ecology).

PART IV – CONTAMINATED SEDIMENTS AND BIOLOGICAL ACTIVITY
186
7.8 References
Aldridge, J.N., Kershaw, P., Brown, J., McCubbin, D., Leonard, K.S., Young, E.F., 2003. Transport of plutonium (239/240 Pu) and cesium (137Cs) in the Irish Sea: comparison between observations and results from sediment and contaminant transport modeling. Cont. Shelf Res. 23, 869-899
Aller, R. C., 2001. Transport and reactions in the bioirrigated zone, in The Benthic Boundary
Layer, edited by B. P. Boudreau and B. B. Jorgensen, pp. 269-301, Oxford University Press, Oxford.
Aller, R.C., Aller J.Y., 1998. The effect of biogenic irrigation intensity and solute exchange on diagenic reaction rates in marine sediments. J. Mar. Res. 56, 905-936
Anderson, J.G., Meadows, P.S., 1978. Microenvironments in marine sediments. Proceedings of the Royal Society of Edinburgh 76B, 1-16
Bernds, D., Wübben, D., Zauke, G.P., 1998. Bioaccumulation of trace metals in polychaetes from German Wadden Sea: evaluation and verification of toxicokinetic models. Chemosphere, 37 (13), 2573-2587
Blanchard, G.F., Sauriau, P.-G., Cariou- Le Gall. V., Gouleau, D., Garet, M.-J., Olivier, F., 1997. Kinetics of tidal resuspension of microbiota: Testing the effects of sediment cohesiveness and bioturbation using flume experiments. Mar. Ecol. Pro. Ser. 151, 17-25
Boudreau, B.P., 1986. Mathematics of tracer mixing in sediments. II: Non-local mixing and biological conveyor belt phenomena. Am. J. Sci. 286, 199-238
Boudreau, B. P., 1997. Diagenetic Models and Their Implementation. pp. 414, Springer, Berlin.
Bryan, G.W., Hummerstone, L.G., 1971. Adaptation of the polychaete Nereis diversicolor to estuarine sediments containing high concentrations of heavy metals.1- general observations and adaptation to copper. J. Mar. Ass. UK 51, 845-863
Christensen, M., Andersen, O., Banta, G.T., 2002. Metabolisms of pyrene by the polychaetes Nereis diversicolor and Arenicola marina. Aquat. Tox. 58, 15-25
Crank, J., 1975. The mathematics of diffusion. Oxford University Press, Oxford Crusius, J., Anderson, R.F., 1991. Core compression and surficial sediment loss of lake
sediments of high porosity caused by gravity coring. Limnol. Oceanogr. 36, 1021-1031 Davey, J.T., 1994. The architecture of the burrow of Nereis diversicolor and its quantification
in relation to sediment-water exchange. J. Exp. Mar. Biol. Ecol. 179, 115-129 Davey, JT; Partridge VA. 1998. The macrofaunal communities of the Skeffling muds
(Humber estuary), with special reference to bioturbation. In: Black, K.S.; D.M. Paterson & A. Cramp (Eds.) Sedimentary processes in the intertidal zone. Special publications, Vol.139 (pp. 115-124) Geological Society, London
Dellapenna, T.M., Kuehl, S.A., Schaffner, L.C., 1998. Sea-bed mixing and particle residence times in biologically and physically dominated estuarine systems: a comparison of lower Chesapeake bay and the York River subestuary. Est. Coast. Shelf Res. 46, 777-795
Esselink, P., Zwarts, L., 1989. Seasonal trend in burrow depth and tidal variation in feeding activity of Nereis diversicolor. Mar. Ecol. Prog. Ser. 56, 243-254
Fenchel, T., 1996. Worm burrows and oxic microniches in marine sediments.1.Spacial and temporal scales. Mar. Biol. 127, 289-295
Fernandes, S., Sobral, P., Alcântara, F. The effect of Nereis diversicolor on shear strength and on the erodability of cohesive sediments under the effect of copper contamination. Journal of Sea Research. Submitted
Ferro, I., van Nugteren, P., Middelburg, J.J., Herman, P.M.J., Heip, C.H.R., 2003. Effect of macrofauna, oxygen exchange and particle reworking on iron and manganese sediment biogeochemistry: a laboratory experiment. Vie Millieu 53, 211-220

Chapter 7 – The influence of Cu on N. diversicolor bioturbation
187
Fidalgo e Costa, P., Sardá, R., Cancela da Fonseca, L., 1998. Life cycle, growth and production of the polychaete Nereis diversicolor O.F. Müller in three lagoonal estuarine systems of the southerwestern portuguese coast (Odeceixe, Aljezur and Carrapateira). Écologie 29 (4), 523--533
Flach, E., Lavaleye, M., de Stigter, H., Thomsen, L., 1998. Feeding types of the benthos community and particle transport across the slope of the N.W. European continental margin (Goban Spur). Prog. Ocean. 42, 209-231
Forster, S. Glud, R.N., Gundersen, J.K., Huettel, M., 1999. In situ study of bromide tracer and oxygen flux in coastal sediments. Est. Coast. Shel. Sci. 49, 813-827
François, F., Gerino, M., Stora, G., Durbec, J.P., Poggiale, J.C., 2002. Functional approach to sediment reworking by gallery-forming macrobenthic organisms: modeling and application with the polychaete Nereis diversicolor. Mar. Ecol. Prog. Ser. 229, 127-136
Gerino, M, Stora, G. Durbec, J.-P., 1994. Quantitative estimation of biodiffusive and bioadvective sediment mixing: in situ experimental approach. Ocean. Acta 17 (5), 547-554
Gerino, M, Stora, G., Poydenot, F., Bourcier, M., 1995. Benthic fauna and bioturbation on the Mediterranean continental slope: Toulon Canyon. Cont. Shelf Res. 15 (11/12), 1483-1496
Gerino, M., Aller, R.C., Lee, C., Cochran, J.K., Aller, J.Y., Green M.A., Hirschberg, D., 1998. Comparison of different tracers and methods used to quantify bioturbation during a spring bloom: 234-Thorium, luminophores and Chlorophyll a. Est. Coast. Shel. Sci. 46, 531-547
Gerino, M., Stora, G., Weber, O., 1999. Evidence of bioturbation in the Cap-Ferret Canyon in the deepo northeastern Atlantic. Deep-Sea Res.II 46, 2289-2307
Giangrande, A., Montresor, M., Cavallo, A., Licciano, M., 2002. Influence of Naineris
laevigata (Polychaeta: Orbiniidae) on vertical grain size distribution, and dinoflagellate resting stages in the sediment. J. Sea Res. 47, 97-108
Gilbert, F, Stora, G., Bertrand, J.-C., 1996. In situ bioturbation and hydrocarbon fate in an experimental contaminated Mediterranean coastal ecosystem. Chemosphere 33 (8), 1449-1458
Gilbert, F. Hulth, St., Stromberg, N., Ringdahl, K., Poggiale, J.-C., 2003. 2-D optical quantification of particle reworking activities in marine surface sediments. J. Exp. Mar., Biol. Ecol. 285-286, 251-263
Grant, A., Hateley, J.G., Jones, N.V., 1989. Mapping the ecological impact of heavy metals on the estuarine polychaete Nereis diversicolor using inherited metal tolerance. Mar. Pull. Bull, 20 (5), 235-238
Green, M.A., Aller, R.C., Cochran, J.K., Lee, C, Aller, J.Y., 2002. Boiturbation on the shelf/slope sediments off Cape Hatteras, North Carolina: the use of 234Th, Chl-a, and Br- to evaluate rates of particle and solute transport. Deep-Sea Res. II 49, 4627-4644
Guñi-Urriza, M., de Montaudouin, X., Guyoneaud, R., Bachelet, G., de Wit, R., 1999. Effect of macrofaunal bioturbation on bacterial distribution in marine sandy sediments, with special reference to sulphur-oxidising bacteria. J. Sea REs. 41, 269-279
Hammerschmidt, C.R., Fitzgerald, W.F., 2004. Geochemical controls on the production and distribution of methylmercury in near-shore marine sediments. Environ. Sci. Technol., 38, 1487-1495
Heip, C.H.R., Duineveld, G., Flach, E., Graf, G., Helder, W., Herman, P.M.J., Lavaleye, M, Middelburg, J.J., Pfannkuche, O., Soetaert, K., Soltwedel, T., de Stigter, H., Thomsen, L., Vanaverbeke, J., de Wilde, P., 2001. The role of the benthic biota in sedimentary metabolism and sediment-water exchange processes in the Goban Spur area (NE Atlantic). Deep-Sea Res. 48, 3223-3243

PART IV – CONTAMINATED SEDIMENTS AND BIOLOGICAL ACTIVITY
188
James, I.D., 2002. Modelling pollution dispersion, the ecosystem and water quality in coastal waters: a review. Env. Mod. Softw. 17, 363-385
Kristensen, E., 2000. Organic matter diagenesis at the oxic/anoxic interface in coastal marine sediments, witrh emphasis on the role of burrowing animals. Hydrobiologia 426, 1-24
Mahaut, M.-L., Graf, G., 1987. A luminophore tracer technique for bioturbation studies. Oceanol. Acta 10 (3), 323-328
Meira, C.,Sellanes, J., Levin, L.A., Arntz, W.E., 2001. Meiofaunal distribution on the Peru margin: relashionship to oxygen and organic matter availability. Deep-Sea Res. I 48, 2453-2472
Meysman, F.J.R., Boudreau, B.P., Middelburg, J.J., 2003. Relations between local, non-local, discrete and continuous models of bioturbation. J. Mar. Res. 61, 391-410
Middelburg, J.J., Klaver, G., Nieuwenhuize, J., Wielemaker, A., de Haas, W., van der Nat, J.F.W.A., 1996. Organic matter mineralization in intertidal sediments along an estuarine gradient. Mar. Ecol. Prog. Ser. 132, 157-168
Mortimer, R.J.G., Davey, J.T., Krom, M.D., Watson, P.G., Frickers, P.E., Clifton, R.J., 1999. The effect of macrofauna on porewater profiles and nutrient fluxes in the intertidal zone of the Humber estuary. ESt. Coast. Shelf Res. 48, 683-699
Mugnai, C., Gerino, M., Frignani, M., Sauvage, S., Bellucci, L.G., 2003. Bioturbation experiments in the Venice Lagoon. Hydrobiologia 494, 245-250
Mulsow, S., Landrum, P.F., Robbins, J.A., 2002. Biological mixing responses to subleathal concentrations of DDT in sediments by Heteromastus filiformis using 137Cs layer technique. Mar. Ecol. Prog. Ser. 29, 181-191
Nielsen, O.I, Gribsholt, B., Kristensen, E. Revsbech, N.P., 2004. Microscale distribution of oxygen and nitrate in sediments inhabited by Nereis diversicolor: spatial patterns and estimated reaction rates. Aquat. Microb. Ecol. 34, 23-32
Ouellette, D., Desrosiers, G. Gagne, J.-P., Gilbert, F., Poggiale, J.-C., Blier, P.U. Stora, G., 2004. Effects of temperature on in vitro sediment reworking processes by a gallery biodiffusor, the polychaete Neanthes virens. Mar. Ecol. Prog. Ser. 266, 185-193
Olsen, C.R., Cutshall, N.H., Larsen, I.L., 1982. Pollutant particulate associations and dynamics in coastal marine environments: a review. Mar. Chem. 11, 501-533
Ozoh, P.T.E., 1992. The effects of salinity, temperature and sediment on the toxicity of copper to juvenile Hedistes (Nereis) diversicolor (O.F. Müller ). Env. Monit. Assess. 21, 1-10
Ozoh, P.T.E., Jones, N.V., 1988. The effects of copper ions on embryogenesis in the polychaete, Hedistes (nereis) diversicolor. Mar. Env. Res. 24, 255-256
Rasmussen, A.D., Banta, G.T., Andersen, O., 1998. Effects of bioturbation by the lugworm Arenicola marina on cadmium uptake and distribution in sandy sediments. Mar. Ecol. Prog. Ser. 164, 179-188
Saiz-Salinas, J.I., Francés-Zubillaga, G., 1997. Nereis diversicolor: an unreliable biomonitor of metal contamination in the Ria de Bilbao (Spain). Mar. Ecol. 18, 113-125
Solan, M, Wigham, B.D., Hudson, I.R., Kennedy, R., Coulon, C.H., Norling, K., Nilsson, H.C., Rosenberg, R., 2004. In situ quantification of bioturbation using time-lapse fluorescent sediment profile imaging (f-SPI), luminophore tracers and model simulation. Mar. Ecol. Prog. Ser. 271, 1-12
Swift, D.J.P., Stull, J.K., Niedoroda, A.W., Reed, C.W., Wong, G.T., 1996. Contaminant dispersal on the Palos Verdes continental margin. II. Estimates of the biodiffusion coefficient, Db, from composition of the benthic infaunal community. Sci. Tot. Env. 179, 91-107
Sze, P.W.C., Lee, S.Y., 1995. The potential role of mucus in the depuration of copper from the mussel Perna viridis (L.) and Septifer virgatus (Wiegmann). Mar. Poll. Bull. 31, 390-393

Chapter 7 – The influence of Cu on N. diversicolor bioturbation
189
Turnewitsch, R., Witte, U., Graf, G., 2000. Bioturbation in the abyssal Arabian Sea: influence of fauna and food supply. Deep-Sea Res. II 47, 2877-2911
Widdows, J., Brinsley, M.D., Bowley, N., Barret, C., 1998. A benthic annular flume for in
situ measurement of suspension feeding/biodeposition rates and erosion potential of intertidal cohesive sediments. Est. Coast. Shelf Sci. 46, 27-38
Widdows, J., Brown, S., Brinsley, M.D., Salkeld, P.N., Elliott, M., 2000. Temporal changes in intertidal sediment erodability: influence of biological and climatic factors. Cont. Shelf Res. 20, 1275-1289
Wheatcroft, R.A., Jumars, P.A., Smith, C.R., Nowell, A.R.M., 1990. A mechanistic view of the particulate biodiffusion coefficients: step lengths, rest periods and transport directions. J. Mar. Res. 48, 177-207


PART VGENERAL CONCLUSIONS
General conclusions
Chapter 8


Chapter 8 – General Conclusions
193
GENERAL CONCLUSIONS
8.1 The effect of Cerastoderma edule on sediment transport
The results presented in this work have demonstrated that the presence and the density
of C. edule affects boundary layer parameters. The presence of cockles causes higher surface
topography (roughness), higher turbulence conditions at the bottom (u*, z0 and TKE) and
thus, lower current velocity (Chapter 2 and 3). Apart from the effect that C. edule has on
increasing surface roughness, the filtration activity is in itself, an additional source of
turbulence (Chapter 3).
The effect of C. edule on sediment transport cannot be dissociated from the effect of
suspended sediment removal by filtration column at velocities far higher than the critical
velocities for deposition. However, the sediment removal effect of C.edule on sediment
dynamics sediment was not studied
8.1.1 Topography and hydrodynamic conditions in the BBL
C. edule significantly increased bottom topography and hydrodynamic roughness
(Chapter 3). This effect is associated with increasing density of live cockles, which reduced
current velocities in the first 6 cm near the bed. The reduction of velocity near the bottom is
directly related to the presence of the cockles which increased roughness by 0.3 times for 500
ind m-2 and 0.6 times for 1000 ind m-2, when compared to the control treatment, and
consequently increased other hydrodynamic parameters directly related to topography, such
as shear velocity and hydrodynamic roughness.
Live cockle beds with a fairly low topographic roughness produced turbulence levels
in the boundary layer similar to artificial beds with much higher topographic roughness. The
higher turbulence values were observed when C. edule was actively filtering.
The analysis of u* and z0 over a flat surface and increasing roughness bed presented in
this work clearly show that topographic roughness and its relationship with hydrodynamic
parameters found in natural beds are different from (theoretical) relationships over smooth
surfaces. Moreover, the increasing effect of C. edule on the turbulence near the sediment
surface can be important for the settlement and redistribution of larvae, which are known to

PART V – GENERAL CONCLUSIONS
194
be driven by chemical cues but their probabilities of hitting the bed and remaining on the bed
are also driven by local turbulence.
8.1.2 Filtration activity
In addition to the effect that the presence of C. edule has on topography and
consequently on u* and z0, the filtration activity was well correlated with higher levels of
turbulence. The positive relationship between CR and TKE (Fig. 3.9) supports the idea that
filtration activity and the production of siphonal currents are responsible for higher levels of
turbulence near the bed (Fig. 3.7 and 3.10), specially at low velocities (u* < 4 cm -2) and
maximum at u* < 1 cm -2.
There is a dynamic interaction between filtration by C. edule and hydrodynamics. The
filtration activity of C. edule showed a unimodal response to increased shear velocities with a
critical u* value (between 3.5 and 5.3 cm s-1) after which filtration rate starts to decline (Fig.
2.9).
The observed effect of filtration activity on turbulence is more pronounced under low
shear velocities (u* < 1.5 cm s-1). The effect of exhalant currents, measured here as zm
decreases at u* higher than the critical value, because the exhalant currents can no longer
compete with cross-flow and no longer protrude higher in the water column (Figs. 3.7 and
3.10).
8.2 The effect of N. diversicolor on sediment stability and biodiffusion
N. diversicolor has a dualistic effect on sediment stability. On one hand it acts as a
biostabilizer, increasing sediment shear strength and critical velocity for erosion. On the other
hand over a tidal cycle, once the critical erosion velocity is established, eroded mass was
higher in the presence of N. diversicolor, classifying it as a biodestabilizer.
In addition to the increasing effect of N. diversicolor on erosion, bioturbation increases
sediment remixing in depth promoting biodiffusion. This second aspect suggests that this
polychaete affects sediment transport by increasing suspended matter but also the transport of
particles from the surface to deeper sediment layers.
The effect of N. diversicolor on the topography and hydrodynamic conditions in the
BBL was not measured because the ragworm does not cause measurable changes on the
sediment surface.

Chapter 8 – General Conclusions
195
8.2.1 Sediment shear strength
The presence of N. diversicolor enhanced the SS of the surface sediments by up to
38% (Tables 4.1 and 4.2), and the SS of sub-surface layers up to 70% (Fig. 6.2). The
enhancement of SS can be explained by increasing particle adhesion and aggregation by
mucus production, as well as gallery building and sediment remixing activities that result in
lateral compaction of the surrounding sediment, especially in a confined flume channel.
Considering results from the same main experiment (Chapter 6 and 7), the average of SS in
depth (Fig. 6.2) was correlated (Pearson Product Moment Correlation Distribution, R2=0.92,
p<0.05, n=4) with Db, the index to estimate bioturbation activity (estimated using M2, Table
7.1), the more appropriate to express bioturbation below 1 cm depth (Fig. 5.6). This is a good
indication that the higher SS are related to higher bioturbation activity.
This study shows that low values of SS (of 0.2 KPa) are related to lower erosion
(eroded depth of 2 mm), whereas sediments with higher SS (of 0.4 KPa) are related with
higher erosion (eroded depth of 4 mm, Fig. 6.6). This might be an indication that macrofauna
cohesiveness mediation can produce different effects than the physical gravitational
consolidation.
8.2.2 Erodability: critical velocity for erosion and erosion rates
Critical erosion velocities were higher in the sediments bioturbated by N. diversicolor
(up to 22%, Tables 4.2, 4.3 and 6.2), meaning that the sediments would erode at higher
velocities. The higher Ucrit observed in the presence of N. diversicolor are in agreement with
the higher values of sediment shear strength measured after erosion (Table 4.1, 4.3, 6.1 and
Fig. 6.6). A regression analysis performed using average values of Ucrit and SS measured after
erosion in the experiments of Chapter 4 and 6 shows a positive relationship (Pearson Product
Moment Correlation Distribution, R2=0.44, p=0.0533, n=9).
There was a positive relationship between sediment erosion rates and N. diversicolor
density. The effect of bioturbation on erosion rates varied from 30% to 67% in densities
ranging from 350 to 790 ind m-2 (Table 4.2). The effect of N. diversicolor on erosion rates is
related to bioturbation activities and the disruption of the biofilm due to grazing (deposit
feeding) resulting in a decrease of surface sediment stability.
8.2.3 Interaction between sediment stability parameters
Sediments with higher shear strength are expected to be more resistant to erosion. However,
once the sediment starts to erode, erosion rates were higher in the sediments with higher SS in

PART V – GENERAL CONCLUSIONS
196
depth and Ucrit. There was also a positive correlation between SS measured at the surface after
erosion and erosion depth (Fig. 6.6) showing that in the sediments without N. diversicolor,
shear strength of 0.2 KPa was enough to prevent erosion, while in the sediments with N.
diversicolor a shear strength of 0.4 KPa was not enough to do so. This relationship can be
understood considering that once the surface sediment is disrupted, erosion proceeds quicker
for aggregates in mucus-stabilised sediments than for erosion in unbound sediments.
8.2.4 Sediment mixing
The bioturbation of N. diversicolor in the top 6 cm, measured in terms of biodiffusion
coefficients (Db) using luminophores after 21 days of activity, ranged from 1.9 to 0.6 cm y-1
for organisms densities from 320 to 570 ind m-2 (Chapter 5). This figure was determined
using the most common procedure (M1) and gives more weight to the large concentration of
luminophores remaining at the sediment surface (the particles that were not mixed), and thus,
fits the concentration data on the top layers best. To deal with this bias, a complementary
procedure for Db estimation (M2) is suggested based on log transformed data (luminophores
concentration in depth), which provides a better fit to the distribution of the transported
particle tracers in the lower sediment layers, the focus of our observations. The use of M1 and
M2 procedures resulted in very different Db estimations, but Db obtained with procedure M2
is considered to be a better indication of bioturbation because differences in bioturbation of N.
diversicolor are only revealed with the data points at deeper layers. Thus, Db obtained with
M2 procedure is more informative than with M1 (the most commonly used).
The non-locality index (NLI index), which expresses the deviations between M1 and
M2, indicates that in comparison to the control without large bioturbators, relocation of
sediment particles by N. diversicolor is not a diffusive process (Chapter 5 and 7). This active
transport of tracers may result from gallery building, deposit feeding and passive fall of tracer
particles through the burrows.
The estimations of Db were different over time, Db measured after 2 days were higher
than the Db measured after 21 days. This can be either an artefact of the model used or an
indication that there is an increased biological activity and particle transport due to gallery
building activities immediately after addition of N. diversicolor to the sediments, i.e. in the
first days of colonisation.
Average Db (after 21 days, using procedure M2) was 73 cm y-1 for 320 ind m-2,
21 cm y-1 for 450 ind m-2 and 56 cm y-1 for 570 ind m-2 (Table 5.1). No proportionality

Chapter 8 – General Conclusions
197
between organism density and Db was found, probably due to the use of different area
mesocosms in the different experiments.
8.3 The effect of Cu contamination in N. diversicolor bioturbation and estuarine
sediment stability
This work provides evidence that the bioturbation of N. diversicolor and sediment
stability parameters are affected by copper contamination. In copper contaminated sediments
bioturbation activity and erodability was lowered as observed for the lower Db (Table 7.1),
lower SS (up to 40%, Fig. 6.2) and lower Em (Fig. 6.3). Critical velocities for erosion were
slightly lower for the contaminated sediments, in agreement with lower values of SS (Fig.
6.6). The lower erosion rates found for contaminated sediments, with or without N.
diversicolor (Chapter 6) suggest that copper toxic effect attenuates the activity of the biota
present in the sediment. The control treatments used in this experiment incorporated meso and
microbiological activity and therefore the direct effect of Cu on sediment binding was not
assessed.
Under Cu contamination the values of Db (using M2) were slightly lower in the first
days in comparison to the uncontaminated situation (Fig. 7.2). However, after 14 days Db
values became similar on both situations, probably due to N. diversicolor recovery/adaptation
to contamination.
8.4 Measuring techniques and estimation methodologies: some considerations
A common problem to empirical and experimental studies, with repercussions for
numerical simulation predictions, is the lack of calibration among measuring techniques,
which limits the interpretation and consolidation of results. This was a constant concern over
the course of the studies presented in this thesis. This work contributes to the intercalibration
of the methodologies used on quantification procedures, namely:
1) in the inter comparison of hydrodynamic characteristics of different flumes and
interpretation of clearance rates measured under each situation (Chapter 2);
2) in the comparison of surface roughness parameters such as hydrodynamic
roughness and topographical roughness using different estimations methods (Chapter 3).
3) in the comparison of different parameters to estimate sediment stability (Chapter 4
and 6) such as quantification of erosion rates, critical erosion velocity, sediment shear
strength, and other biogeochemical sediment properties (bulk density, organic content, Chl a,
copper);
PART V – GENERAL CONCLUSIONS
198
4) in the comparison of two different parameter estimation routines used to quantify
the biodiffusion coefficients (Db) and consideration about their meaning and sampling time
dependence concerning species behaviour (Chapter 5 and 7).
8.5 Concluding remarks
This thesis is a contribution to the understanding on the effect of macrofauna on
sediment dynamics, showing clear evidence on how the presence of C. edule affect turbulence,
topography and other hydrodynamic parameters in the BBL and how the presence of N.
diversicolor affects physical and biogeochemical properties of the sediments and their
erodability. This study provides evidence that copper contaminated sediments are more stable,
as a consequence of decrease in biological response to toxicity, observed in lower values of
shear strength and erosion rates.
Laboratory studies like these, performed under controlled conditions, are
required to understand small-scale processes and analyse basic principles of sediment
dynamics. The parameterisation of numerical environmental models demands the use of
empirical relationships to describe hydrodynamic parameters, erosion coefficients, sediment
characteristics and biodiffusivity coefficients. The relationships described in this study provide
indications on how to include biological interactions in environmental models.
The relationships between sediment properties and erodability parameters found in this
work, reinforces the need to understand erosion phenomena’s as a function of sediment
properties (physical, chemical and biological) and not only a function of physical forcing
(shear strength or velocity). The observations and parameters relationships provided in this
study do not completely reproduce field conditions, because they were performed under
laboratory conditions. Only larger scale field measurement studies would clarify the relevance
of the biological processes described in this work.
If the effect of macrobenthos observed in this work has an effect in a larger scale, then
this knowledge should be used with an engineering perspective, by means of using the
organisms functionality in ecosystem management. This concept is not innovative, but it is
still a biological technology that is not taken very seriously.
For example, the role of filter feeders on sediment dynamics should be further
investigated for application in places with excess suspended material. In addition to the effect
they have on the characteristics of the BBL studied in this work, they have an important effect
on suspended sediment removal (by filtration) at velocities far higher than the critical
velocities for deposition. They also have an important role on matter transformation

Chapter 8 – General Conclusions
199
considering that the suspended removed particles are transformed in faeces, with different
transport/resuspension/deposition characteristics, with a higher probability for deposition.
Also, the knowledge about bioturbation activity of sediment reworking could be use as a
recycling solution for high organic sediments.


PART VIREFERENCES
References
Chapter 9


Chapter 9 – References
203
REFERENCES Andersen, T.J., Lund-Hansen, L.C., Pejrup, M., Jensen, K.T., Mouritsen, K.N., 2005.
Biologically induced differences in erodability and aggregation of subtidal and intertidal sediments : a possible cause for seasonal changes in sediment deposition. Journal of Marine Systems. 55, 123-138
Aberle, J., Nikora, V., Walters, R., 2004. Effects of bed material properties on cohesive sediment erosion. Marine Geology. 207, 83-93
Abrantes, A., Pinto, F., Moreira, M.H., 1999. Ecology of the polychaete Nereis diversicolor in the Canal de Mira (Ria de Aveiro, Portugal): Population dynamics, production and oogenic cycle. Acta Oecologica. 20 (4): 267-283
Ackerman, J.D., 1999. Effect of velocity on the filter feeding of dreissenid mussels (Dreissena polymorpha and Dreissena bugensis): implications for trophic dynamics. Canadian Journal of Fisheries and Aquatic. Science 56, 1551-1561
Aldridge, J.N., Kershaw, P., Brown, J., McCubbin, D., Leonard, K.S., Young, E.F., 2003. Transport of plutonium (239/240 Pu) and cesium (137Cs) in the Irish Sea: comparison between observations and results from sediment and contaminant transport modeling. Cont. Shelf Res. 23, 869-899
Aller R. C., Aller, J.Y. 1992. Meiofauna and solute transport in marine muds. Limnol. Oceanogr. 37 : 1018-1033
Aller, R. C., 2001. Transport and reactions in the bioirrigated zone, in The Benthic Boundary
Layer, edited by B. P. Boudreau and B. B. Jorgensen, pp. 269-301, Oxford University Press, Oxford.
Aller, R.C., Aller, J.Y., 1998. The effect of biogenic irrigation intensity and solute exchange on diagenic reaction rates in marine sediments. Journal of Marine Research. 56, 905-936
Aller, R. C. 1983. The importance of diffusive permeability of animal burrow linings in determining marine sediment chemistry. J. Mar. Res. 41: 299-322
Almeida, A., Cunha, A., Fernandes, S., Sobral, P., Alcântara, F., 2007. Copper effects on bacterial activity of estuarine silty sediments. Estuarine Coastal and Shelf Science 73, 743-752.
Amiard, J.C., Amiard-Triquet, C., Berthet, B., Metayer, C., 1987. Comparative study of the patterns of bioaccumulation of essential (Cu, Zn) and non-essential (Cd, Pb) trace metals in various estuarine and coastal organisms. J. Exp. Mar. Ecol. 106, 73-89
Amos, C.L., Bergamasco, A., Umgiesser, G., Cappucci, S., Cloutier, D., DeNat, L., Flindt, M., Bonardi, M., Cristante, S., 2004. The stability of tidal flats in Venice Lagoon-the results of in-situ measurements using two benthic, annular flumes. Journal of Marine Systems 51, 211-241
Amos, C.L., Sutherland, T.F., Cloutier, D., Patterson, S., 2000. Corrasion of a remolded cohesive bed by saltating littorinid shells. Continental Shelf Research 20, 1291-1315
Amos, C.L., Feeney, T., Sutherland, T.F., Luternauer. 1997 The stability of fine-grained sediments from the Fraser river delta. Est Coast Shelf Sci. 45, 507-524
Amos, C.L.,Grant, J., Daburn, G.R., Black, K., 1992. Sea Carrousel- a benthic, annular flume. Estuarine Coastal and Shelf Science 34, 557-577
Amos, C.L., van Wagoner, N.A. Daborn, G.R., 1988 The influence of subaerial exposure on the bulk properties of fine-grained intertidal sediment from Minas basin, Bay of Fundy. Est Coast Shelf Sci. 27, 1-13
Andersen, T.J., Lund-Hansen, L.C., Pejrup, M., Jensen, K.T., Mouritsen, K.N., 2005. Biologically induced differences in erodability and aggregation of subtidal and

PART VI – REFERENCES
204
intertidal sediments: a possible cause for seasonal changes in sediment deposition. Journal of Marine Systems. 55, 123-138
Andersen, T.J., .2001. Seasonal variation in erodability of two temperate microtidal mudflats. Est Coast Shelf Sci. 53, 1-2
Andersen, T.J., Jensen, K.T., Lund-Hansen, L., Mouritsen, K.N., Pejrup, M., 2002. Enhanced erodability of fine-grained marine sediments by Hydrobia ulvae. J Sea Res. 48, 51-58
Andersen, F. O., Kristensen, E. 1992. The importance of benthic macrofauna in decomposition of microalgae in a coastal marine sediment. Limnol. Oceanogr. 37: 1392-1403
Anderson, J.G. Meadows, P.S., 1978. Microenvironments in marine sediments. Proceedings of the Royal Society of Edinburgh. 76B, 1-16
André, C., Jonsson, P.R., Lindegarth, M., 1993. Predation on settling bivalve larvae by benthic suspension feeders: the role of hydrodynamics and larval behaviour. Marine Ecology Progress Series 97, 183-192
Austen, I., Andersen, T.J., Edelvang, K., 1999. The influence of benthic diatoms and invertebrates on the erodability of an intertidal mudflat, the Danish Wadden Sea. Est Coast Mar Sci. 49. 99-111
Azevedo, I.C., Duarte, P.M., Bordalo, A.A., 2008. Understanding spatial and temporal dynamics of key environmental characteristics in a mesotidal Atlantic estuary (Douro, NW Portugal). Estuarine, Coastal and Shelf Science 76, 620-633
Baillie, P.W., Welsh, B., 1980. The effect of tidal resuspension on the distribution of intertidal epipelic algae in an estuary. Estuarine, Coastal and Shelf Science 10, 165-180
Bartetzko, A., Kopf, A.J., 2007. The relationship of undrained shear strength and porosity with depth in shallow (<50 m) marine sediments. Sedimentary Geology 196, 235-249
Berg, P., Rysgaard, S., Funch, P. Sejr, M.K. 2001. effects of bioturbation on solutes and solids in marine sediments. Aquat. Microb. Ecol. 26: 81-94
Berlamont, J., Ockende, M., Toorman, E., Winterwerp, J., 1993. The characterisation of cohesive sediment properties. Costal Engineering 21, 105-128
Bernds, D., Wübben, D., Zauke, G.P., 1998. Bioaccumulation of trace metals in polychaetes from German Wadden Sea: evaluation and verification of toxicokinetic models. Chemosphere 37 (13), 2573-2587
Black, K., Cramp, A., 1995. A device to examine the in situ response of intertidal cohesive sediment deposits to fluid shear. Continental Shelf Research 15, 1945-1954
Blanchard, G.F., Guarini, J.M., Orvain, F., and Sauriau, P.-G., 2001. Dynamic behaviour of benthic microalgal biomass in intertidal mudflats. Journal of Experimental Marine Biology and Ecology 264, 85-100
Blanchard, G.F., Sauriau, P.-G., Cariou-Le Gall, V., Gouleau, D., Garet, M.-J., Olivier, F., 1997. Kinetics of tidal resuspension of microbiota: Testing the effects of sediment cohesiveness and bioturbation using flume experiments. Marine Ecology Progress Series 151, 17-25
Blanchet, H., Raymond, N., de Montaudouin, X., Capdepuy, M., Bachelet, G., 2003. Effects of digenean trematodes and heterotrophic bacteria on mortality and burying capability of the common cockle Cerastoderma edule (L.). Journal of Experimental Marine Biology and Ecology 293, 89-105
Boon, A.R., Duineveld, G.C.A. 1998. Chlorophyll a as a marker for bioturbation and carbon flux in southern and central North Sea sediments. Mar. Ecol. Prog. Ser. 162: 33-43
Borsje, B.W., de Vries, M.B., Hulscher, S.J.M.H., de Bóer G.J., 2008. Modeling large-scale cohesive sediment transport affected by small-scale biological activity. Estuarine, Coastal and Shelf Science 78, 468-480

Chapter 9 – References
205
Botto, F., Iribarne, O., 2000. Contrasting effects of two burrowing crabs (Chasmagnathus
granulata and Uca uruguayensis) on sediment composition and transport in estuarine environments. Est Coast Shelf Sci. 51, 141-151
Boudreau, B. P., 1997. Diagenetic Models and Their Implementation. pp. 414, Springer, Berlin.
Boudreau, B.P., 1986. Mathematics of tracer mixing in sediments. II: Non-local mixing and biological conveyor belt phenomena. Am. J. Sci. 286, 199-238
Boyden, C.R., Russel, P.J.C., 1972. The distribution and habitat range of the brackish water cockle (Cardium (Cerastoderma) glaucum) in the British Isles. The Journal of Animal Ecology. 41, 719-734
Brenon, I., Le Hir, P., 1999. Modelling the turbidity maximum in the Seine estuary (France): identification of formation processes. Estuarine, Coastal and Shelf Science 49, 525-544
Brusati, E.D., Grosholz, E.D., 2006. Native and introduced ecosystem engineers produce contrasting effects on estuarine infaunal communities. Biological Invasions 8, 683-695
Bryan, G.W., Hummerstone, L.G., 1971. Adaptation of the polychaete Nereis diversicolor to estuarine sediments containing high concentrations of heavy metals.1- general observations and adaptation to copper. Journal of the Marine Biological Association of theUnited Kingdom 51, 845-863
Butman, C.A., Fréchette, M., Rockwell Geyer, W., Starczak, V.R., 1994. Flume experiments on food supply to the blue mussel Mytilus edulis L. as a function of boundary-layer flow. Limnology Oceanography 39, 1755-1768
Camenen, B., Larson, M., Bayram, A., 2009. Equivalent roughness height for plane bed under oscillatory flow. Estuarine, Coastal and Shelf Science 81, 409-422
Cancino, L., Neves, R., 1999. Hydrodynamic and sediment suspension modelling in estuarine systems. Part I: descriptions of the numerical models. Journal of Marine Systems 22, 105-116
Cappucci, S., Amos, CL., Hosoe, T., Umgiesser, G.. 2004. SLIM: a numerical model to evaluate the factors controlling the evolution of intertidal mudflats in Venice Lagoon, Italy. Journal of Marine Systems. 51 (1-4), 257-280
Caradec, S., V. Grossi, S., Hulth, G., Stora, F., Gilbert. 2004. Macrofaunal nreworking actyivities and hydrocarbon redistribution in an experimental sediment system. J. Sea Res. 52, 199-210
Chen, C.-C., Petersen, J.E., Kemp, W.M., 2000. Nutrient-uptake in experimental estuarine ecosystems: scaling and partitioning rates. Marine Ecology Progress Series. 200, 103-116
Christensen, M., Andersen, O., Banta, G.T., 2002. Metabolisms of pyrene by the polychaetes Nereis diversicolor and Arenicola marina. Aquat. Tox. 58, 15-25
Ciarelli, S., Kater, B.J., van Straalen, N.M., 2000. Influence of bioturbation by the amphipod Corophium volutator on fluoranthene uptake in the marine polychaete Nereis virens. Environmental Toxicology and Chemistry 19, 1575-1581
Cid A., Herrero C., Torres, E., Abalde, J., 1995. Copper toxicity on the marine microalga Phaeodactylum tricornutum: effects on photosynthesis and related parameters. Aquatic Toxicology 31, 165-174
Ciutat, A., Widdows, J., Pope, N.D., 2007. Effect of Cerastoderma edule density on near-bed hydrodynamics and stability of cohesive muddy sediments. Journal of Experimental Marine Biology and Ecology 346, 114-126
Correl, D.L., Jordan, T.E., Weller, D.E., 1992. Nutrient flux in a landscape: effects of coastal land use and terrestrial community mosaic on nutrient transport to coastal waters. Estuaries. 15, 431-442
Coughlan, J., 1969. The estimation of filtering rate from the clearance of suspensions. Marine Biology. 2, 356-358

PART VI – REFERENCES
206
Crain, C.M., Bertness, M.D., 2006. Ecosystem engineering across environmental gradients: implications for conservation and management. Bioscience 56 (3), 211-218
Crank, J. 1975. The mathematics of diffusion. Oxford University Press, Oxford Crusius, J., Anderson, R.F., Cornett, R.J., Chant, L. 1993. Reply to the comments of
Cumming et al. and Wright. Limnol. Oceanogr. 36,1021-1031 Crusius, J., Anderson, R.F. 1991. Core compression and surficial sediment loss of lake
sediments of high porosity caused by gravity coring. Limnol. Oceanogr. 36,1021-1031 Cugier, P., Le Hir, P., 2000. Three dimensional modelling of suspended matters in the eastern
"baie de Seine" (English Channel, France). Comptes Rendus de L’Academie des Sciencesde Paris, Sciences De La Terre et des Planetes 331 (4), 287-294
Cumming, B. F., Glew, J.R., Smol, J.P., Davis, R.B., 1993. Comment on “Core compression and surficial sediment loss of lake sediments of high porosity caused by gravity coring” (Crusius and Anderson). Limnol. Oceanogr. 38, 695-699
Davey, J.T., Partridge, V.A., 1998. The macrofaunal communities of the Skeffling muds (Humber estuary), with special reference to bioturbation. In: Black KS, DM Paterson, A Cramp (Eds.) Sedimentary processes in the intertidal zone. Special publications, Vol.139, pp. 115-124 Geological Society, London
Davey, J.T., Watson, P.G., 1995. The activity of Nereis diversicolor (polychaeta) and its impact on nutrient fluxes in estuarine waters. Ophelia. 41, 57-70
Davey, J.T., 1994. The architecture of the burrow of Nereis diversicolor and its quantification in relation to sediment-water exchange. Journal of Experimental Marine Biology and Ecology 179, 115-129
Davies, W.R., 1993. The role of bioturbation in sediment resuspension and its interaction with physical shearing. Journal of Experimental Marine Biology and Ecology 171, 187-2000
de Brouwer, J.F.C., Wolfstein, K., Ruddy, G.K., Jones, T.E.R., Stal, L.J.. 2005. Biogenic Stabilization of Intertidal Sediments: The Importance of Extracellular Polymeric Substances Produced by Benthic Diatoms. Microbial Ecology. 49, 501–512
de Brouwer, J.F.C., de Deckere, E.M.G.T., Stal, L.J., 2003. Distribution of extracellular carbohydrates in three intertidal mudflats in western Europe. Estuarine Coastal and Shelf Science 56, 313-324.
de Brouwer, J.F.C., Ruddy, G.K., Jones, T.E.R., Stal, L.J., 2002. Sorption of EPS to sediment particles and the effect on the rheology of sediments slurries. Biogeochemistry 61, 57-71
de Brouwer, J.F.C., Stal, L.J. 2001. Short-terms dynamics in microphytobenthos distribution and associated extracellular carbohydrates in surface sediments of intertidal mudflat. Mar Ecol Prog Ser. 218, 33-44
de Deckere, E.M.G.T., Tolhurst, T.J., de Brouwer, J.F.C, 2001. Destabilisation of cohesive intertidal sediments by infauna. Est Coast Shelf Sci. 53, 665-669
de Jonge, V.N., van der Bergs, J., 1987. Experiments on the resuspension of estuarine sediments containing benthic diatoms. Estuarine, Coastal and Shelf Science 24, 725-740
Dellapenna, T.M., Kuehl, S.A., Schaffner, L.C. 2003. Ephemeral deposition, seabed mixing and fine-scale strata formation in the York River estuary, Chesapeake Bay. Est. Coast. Shelf. Res. 58, 621-643
Dellapenna, T.M., Kuehl, S.A., Schaffner, L.C., 1998. Sea-bed mixing and particle residence times in biologically and physically dominated estuarine systems: a comparison of lower Chesapeake bay and the York River subestuary. Estuarine, Coastal and Shelf Science 46, 777-795
Delmotte, S., Meysman, F.J.R., Ciutat, A., Boudou, A., Sauvage, S., Gerino, M., 2007. Cadmium transport in sediments by tubificid bioturbation: An assessment of model complexity. Geochimica et Cosmochimica 71, 844-862
Chapter 9 – References
207
Dias, J.M., Lopes, J.F., 2006. Implementation and assessment of hydrodynamic, salt and heat transport models: The case of Ria de Aveiro Lagoon (Portugal). Environmental Modelling & Softaware 21, 1-15
Douvere, F., Ehler, C.N., 2009. New perspectives on sea use management: Initial findings from European experience with marine spatial planning. Journal of Environmental Management 90, 77–88
Droppo, I.G., Lau, Y.L., Mitchell, C., 2001. The effect of depositional history on contaminated bed sediment stability. Sci. Tot. Env. 266, 7-13
Dyer, K.R., Christie, M.C., Manning, A.J., 2004. The effects of suspended sediment on turbulence within an estuarine turbidity maximum. Estuarine, Coastal and Shelf Science 59, 237-248
Dyer, K.R., Christie, M.C., Wright, E.W., 2000. The classification of intertidal mudflats. Continental Shelf Research 20, 1039-1060
Dyer, K.R., 1998. The topology of intertidal mudflats. In Black, K. S., Paterson, D. M. and Cramp, A. (eds) Sedimentary processes in the intertidal zone. Geological Society, London, Special Publications 139, 11-24
Eckman, J.E., Nowell, A.R.M., 1984. Boundary skin friction and sediment transport about an animal-tube mimic. Sedimentology. 31, 851-862
Eckman, J.E., 1983. Hydrodynamic processes affecting benthic recruitment. Limnology and Oceanography. 28, 241-257.
Eckman, J.E., Nowell, A.R.M., Jumars, P.A., 1981. Sediment destabilisation by animal tubes. Journal of Marine Research. 39, 361-374
El Ganaoui, O., Schaaff, E., Boyer, P., Amielh, M., Anselmet, F., Grenz, C., 2004. The deposition and erosion of cohesive sediments determined by a multi-class model. Estuarine, Coastal and Shelf Science 60, 457–475
Engelsen, A., Pihl, L., 2008. Grazing effects by Nereis diversicolor on development and growth of green algal mats. Journal of Sea Research 59, 228–236
Englund, V.P.M., Heino, M.P., 1996. Valve movement of the freshwater mussel Anodonta
anatina: a reciprocal transplant experiment between lake and river. Hydrobiologia 328, 49-56
Ertman, S.C., Jumars, P.A., 1988. Effects of bivalve siphonal currents on the settlement of inert particles and larvae. Journal of Marine Reseach 46 (4), 797-813
Esselink, P., Zwarts, L., 1989. Seasonal trend in burrow depth and tidal variation in feeding activity of Nereis diversicolor. Marine Ecology Progress Series 56, 243-254
Fenchel, T., 1996. Worm burrows and oxic microniches in marine sediments.1.Spacial and temporal scales. Marine Biology. 127, 289-295
Fernandes, S., Sobral, P., Alcântara, F. 2009. Nereis diversicolor and copper contamination effect on the erosion of cohesive sediments: A flume experiment. Estuarine Coastal and Shelf Science (in press)
Fernandes, S., Sobral, P., van Duren, L., 2007. Clearance rates of Cerastoderma edule Ander increasing current velocity. Continental Shelf Research 27, 1104 - 1115
Fernandes, S., Sobral, P. Costa, M.H., 2006a. Nereis diversicolor effect on the stability of cohesive intertidal sediments. Aquatic Ecology 40, 567-579.
Fernandes, S., Meysman, F., Sobral, P., 2006b. The influence on Cu contamination on Nereis
diversicolor bioturbation. Marine Chemistry 102, 148-158. Fernandes, S., 2001. Bioturbation effects on the resuspension of estuarine sediments - tested
in an annular flume. M.Sc. Thesis. IST/UTL, Lisbon. 96 pages
Fernandes, S., Sobral, P., 2001. Efeito do aumento da velocidade da corrente na taxa de filtração e eficiência de absorção de alimento em Cerastoderma edule. Resultados preliminares. Revista de Biologia (Lisboa) 19, 63-70
PART VI – REFERENCES
208
Ferro, I., van Nugteren, P., Middelburg, J.J., Herman, P.M.J., Heip, C.H.R., 2003. Effect of macrofauna, oxygen exchange and particle reworking on iron and manganese sediment biogeochemistry: a laboratory experiment. Vie Millieu. 53 (4), 211-220
Fidalgo e Costa, P., Sarda, R., Cancela da Fonseca, L., 1998. Life cycle, growth and production of the polychaete Nereis diversicolor O.F. Müller in three lagoonal estuarine systems of the southerwestern portuguese coast (Odeceixe, Aljezur and Carrapateira). Écologie 29 (4), 523-533
Finelli, C.M., Hart, D.D., Fonseca, D.M., 1999. Evaluating the spatial resolution of an acoustic Doppler velocimeter and the consequences for measuring near-bed flows. Limnology and Oceanography 44, 1793-1801
Flach, E., Lavaleye, M., de Stigter, H., Thomsen, L., 1998. Feeding types of the benthos community and particle transport across the slope of the N.W. European continental margin (Goban Spur). Progress in Oceanography 42, 209-231
Fleeger, J.W., Tita, G., Carman, K.R., Millward R.N., Moser, E.B., Portier R.J., Gambrell R.P., 2006. Does bioturbation by a benthic fish modify the effects of sediment contamination on saltmarsh benthic microalgae and meiofauna? Journal of Experimental Marine Biology and Ecology 330 (1), 180-194
Flemming, B.W., 2000. A revised textural classification of gravel-free muddy sediments on the basis of ternary diagrams. Continental Shelf Research. 20, 1125-1137
Forster, S., Glud, R.N., Gundersen, J.K., Huettel, M., 1999. In situ study of bromide tracer and oxygen flux in coastal sediments. Estuarine, Coastal and Shelf Science 49, 813-827
François, F., Gerino, M., Stora, G., Durbec, J.-P., Poggiale, J.-C., 2002. Functional approach to sediment reworking by gallery-forming macrobenthic organisms: modelling and application with the polychaete Nereis diversicolor. Mar Ecol Prog Ser. 229, 127-136
François, F., Dalègre, K., Gilbert, F., Stora, G., 1999. Variabilité spécifique à l'interieur des groupes fonctionnels. Étude du remaniement sédimentaire de deux bivalves Veneridae, Ruditapes decussatus et Venerupis aurea. Écologie 322, 339-345
François, F., Poggiale, J.-C., Durbec, J.-P., Stora, G., 1997. A new approach for the modeling of sediment reworking induced by a macrobenthic comunity. Acta Biotheorethica. 45, 295-319
French, B., Turner, A., 2008. Mobilization, adsorption, and bioavailability of Pt and Pd in coastal sediments: The role of the polychaete, Arenicola marina. Environmental Science & Technology. 42, 3543-3549
Friedrichs, M., Graf, G., Springer, B., 2000. Skimming flow induced over a simulated polychaete tube lawn at low population densities. Marine Ecology Progess Series. 192, 19-228
Friend, P.L., Ciavola, P., Cappucci, S., Santos, R., 2003. Bio-dependent bed parameters as a proxy tool for sediment stability in mixed habitat intertidal areas. Continental Shelf Research. 23 (17-19), 1899-1917
Fukuda, M.S., Lick, W., 1980. The entrainment of cohesive sediments in freshwater. Journal of Geophysical Research, 85, 2813-2824
Gerino, M., Stora, G., Weber, O., 1999. Evidence of bioturbation in the Cap-Ferret Canyon in the deepo northeastern Atlantic. Deep-Sea Research II 46: 2289-2307
Gerino, M., Aller, R.C., Lee, C., Cochran, J.K., Aller, J.Y., Green, M.A., Hirschberg, D. 1998. Comparison of different tracers and methods used to quantify buiturbation during a spring bloom: 234-Thorium, luminophores and Chlorophyll a. Est. Coast. Shel. Sci. 46: 531-547
Gerino, M, Stora, G., Poydenot, F., Bourcier, M., 1995. Benthic fauna and bioturbation on the Mediterranean continental slope: Toulon Canyon. Cont. Shelf Res. 15 (11/12), 1483-1496

Chapter 9 – References
209
Gerino, M, Stora, G. Durbec, J.-P., 1994. Quantitative estimation of biodiffusive and bioadvective sediment mixing: in situ experimental approach. Ocean. Acta. 17 (5), 547-554
Gerino, M., 1991 Quantification of burrow geometry and sediment reworking by the polychaete Nereis diversicolor. Symp Zool Soc Lond. 63, 305-307
Giangrande, A., Montresor, M., Cavallo, A., Licciano, M., 2002. Influence of Naineris
laevigata (Polychaeta: Orbiniidae) on vertical grain size distribution, and dinoflagellate resting stages in the sediment. Journal of Sea Research. 47, 97-108
Giangrande, A., Lucciano, M., Fanelli, G., 2001. Bioturbation behavior in two Mediterranean polychaetes. J. Mar. Biol. Ass. U.K., 81, 341-342
Gilbert, F., Hulth, S., Stromberg, N., Ringdahl, K., Poggiale, J.-C., 2003. 2-D optical quantification of particle reworking activities in marine surface sediments. J Journal of Experimental Marine Biology and Ecology. 285-286, 251-263
Gilbert, F., Stora, G., Bertrand, J.-C., 1996. In situ bioturbation and hydrocarbon fate in an experimental contaminated Mediterranean coastal ecosystem. Chemosphere. 33 (8), 1449-1458
Gillis, P.L., Wood, C.M., Ranville, J.F., Chow-Fraser, P., 2006. Bioavailability of sediment-associated Cu and Daphnia magna. Aquatic Toxicology 77, 402-411
Gleizon, P., Punt, A.G., Lyons, M.G., 2003. Modelling hydrodynamics and sediment flux within a macrotidal estuary: problems and solutions. The Science of the Total Environment. 314-316, 589-597
Goñi-Urriza, M., de Montaudouin, X., Guyoneaud, R., Bachelet, G., de Wit, R., 1999. Effect of macrofaunal bioturbation on bacterial distribution in marine sandy sediments, with special reference to sulphur-oxidising bacteria. Journal of Sea Research. 41, 269-279
Graf, G., Rosenberg, R., 1997. Bioresuspension and biodeposition: a review. Journal of Marine Systems. 11, 269-278
Grant, A., Hateley, J.G., Jones, N.V., 1989. Mapping the ecological impact of heavy metals on the estuarine polychaete Nereis diversicolor using inherited metal tolerance. Mar. Pull. Bull, 20 (5), 235-238
Grant, J., Daborn, G., 1994. The effect of bioturbation on sediment transport on an intertidal mudflat. Netherlands Journal of Sea Research 32, 63-72.
Grasshof, K., Kremling, K., Ehrhardt, M., 1999. Methods for Seawater Analysis. 3rd Ed. Wiley-VCH. Weinheim. p.408.
Green, M.A., Aller, R.C., Cochran, J.K., Lee, C, Aller, J.Y., 2002. Boiturbation on the shelf/slope sediments off Cape Hatteras, North Carolina: the use of 234Th, Chl-a, and Br- to evaluate rates of particle and solute transport. Deep-Sea Res. II 49, 4627-4644
Green, M.A., Aller, R.C., Cochran, J.K., Lee, C, Aller, J.Y., 2002. Boiturbation on the shelf/slope sediments off Cape Hatteras, North Carolina: the use of 234Th, Chl-a, and Br- to evaluate rates of particle and solute transport. Deep-Sea Res. II 49, 4627-4644
Green, M.O., Hewitt, J.E., Thrush, S.F., 1998. Seabed drag coefficient over natural beds of horse mussels (Atrina zelandica). Journal of Marine Research. 56, 613-637
Guarini, J.-M., Blanchard, G.F., Gros, P.H., Gouleau, D., Bacher, C., 2000. Dynamic model of the short-term variability of microphytobenthic biomass on temperate intertidal mudflats. Marine Ecology Progress Series. 195, 291-303
Guñi-Urriza, M., de Montaudouin, X., Guyoneaud, R., Bachelet, G., de Wit, R., 1999. Effect of macrofaunal bioturbation on bacterial distribution in marine sandy sediments, with special reference to sulphur-oxidising bacteria. J. Sea REs. 41, 269-279
Hagopian-Schlekat, T., Chandler, G.T., Shaw T.J., 2001. Acute toxicity of five sediment-associated metals, individually and in a mixture, to the estuarine meiobenthic harpacticoid copepod Amphiascus tenuiremis. Marine Environmental Research, 51 (3), 247-264.

PART VI – REFERENCES
210
Hammerschmidt, C.R., Fitzgerald, W.F., 2004. Geochemical controls on the production and distribution of methylmercury in near-shore marine sediments. Environmental Science and Technology. 38, 1487-1495
Hansbo, S., 1957. A new approach to the determination of the shear strength of clay by the fall-cone test. Sw. Geot. Inst. Publ. No.14, Stockholm.
Hansen, K., Kristensen, E., 1998. The impact of the polychaete Nereis diversicolor and enrichment with macroalgal (Chaetomorpha linum) detritus on benthic metabolism and nutrient dynamics in organic-poor and organic-rich sediment. Journal of Experimental Marine Biology and Ecology. 231, 201-223.
Hansen, R, Forbes, T.L., Westermann, P. 1999. Importance of bioturbation and feeding by the polychaete Capitella sp. I in the degradation of di(2-ethylhexyl)phthalate (DEHP). Mar. Ecol. Prog. Ser. 182: 187-199
Hawkins, A.J.S., Bayne, B.L., Bougrier, S., Héral, M., Iglesias, J.I.P., Navarro, E., Smith, R.F.M., Urrutia, M.B., 1998. Some general relationships in comparing the feeding physiology of suspension- feeding bivalve molluscs. Journal of Experimental Marine Biology and Ecology. 219, 87-103
Heip, C.H.R., Duineveld, G., Flach, E., Graf, G., Helder, W., Herman, P.M.J., Lavaleye, M, Middelburg, J.J., Pfannkuche, O., Soetaert, K., Soltwedel, T., de Stigter, H., Thomsen, L., Vanaverbeke, J., de Wilde, P., 2001. The role of the benthic biota in sedimentary metabolism and sediment-water exchange processes in the Goban Spur area (NE Atlantic). Deep-Sea Res. 48, 3223-3243
Hewitt, J., Thrush, S., Gibbs, M., Lohrer, D., Norkko, A., 2006. Indirect effects of Atrina
zelandica on water column nitrogen and oxygen fluxes: The role of benthic macrofauna and microphytes. Journal of Experimental Marine Biology and Ecology. 330, 261-273
Houwing, E.-J., 2000. Morphodynamic development of intertidal mudflats: consequences for the extension of the pioneer zone. Continental Shelf Research. 20, 1735-1748
Houwing, E.-J., 1999 Determination of the critical erosion threshold of cohesive sediments on intertidal mudflats along the Duch Wadden Sea coast. Estuarine, Coastal and Shelf Science. 49, 545-555
Houwing, E.-J., van Rijn, L.C., 1998. In Situ Erosion Flume (ISEF): determination of bed shear stress and erosion of a kaolinite bed. Journal of Sea Research. 39, 243-253
Ibarrola, I., Etxeberria, M., Iglesias, J.I.P., Urrutia, M.B., Angulo, E., 2000. Acute and acclimated digestive responses of the cockle Cerastoderma edule (L.) to changes in the food quality and quantity II. Enzymatic, cellular and tissular responses of the digestive gland. Journal of Experimental Marine Biology and Ecology. 252, 199-219
Iglesias, J.I.P., Urrutia, M.B., Navarro, E., Alvarez-Jorna, P., Larretxea, X., Bougrier, S., Heral, M., 1996. Variability of feeding processes in the cockle Cerastoderma edule (L.) in response to changes in seston concentration and composition. Journal of Experimental Marine Biology and Ecology. 197, 121-143
Ingalls, A.E., Aller, R.C., Lee, C., Sun, M.-Y., 2002. The influence of deposit-feeding on chlorophyll-a degradation in coastal marine sediments. Journal of Marine Research. 58, 631–651
Jacobs, W., van Kesteren, W.G.M., Winterwerp, J.C., 2007. Permeability and consolidation of sediment mixtures as function of sand content and clay mineralogy. International Journal of Sediment Research. 22, 180-187
Jago, C.F., Jones, S.E., Latter, R.J., McCandliss, R.R., Hearn, M.R. Howarth, M.J., 2002. Resuspension of benthic fluff by tidal currents in deep stratified waters, northern North Sea. J Sea res. 48, 259-269
James, I.D., 2002. Modelling pollution dispersion, the ecosystem and water quality in coastal waters: a review. Env. Mod. Softw. 17, 363-385

Chapter 9 – References
211
Jarvis, P., Jefferson, B., Gregory, J., Parsons, S.A., A review of floc strength and breakage. Water Research. 39, 3121-3137
Jensen, K.T., Castro, N.F., Bachelet, G., 1999. Interactions between Himasthla spp. (Trematoda) and their second intermediate host: Cerastoderma edule; experimental infections of cockle spat. Journal of the Marine Biological Association of the UK. 79, 265-271
Johnson, B.D., Azetsu-Scott, K., 1995. Adhesion force and the character of surfaces immersed in seawater. Limnology and Oceanography 40, 802-808.
Jones, C.G., Lawton, J.H., Shachak, M., 1997. Positive and negative effects of organisms as physical ecosystem engeneers. Ecology. 78 (7), 1946-1957
Jones, C.G., Lawton, J.H., Shachak, M., 1994. Organisms as ecosystem engeneers. Oikos. 373-386
Jones, S.E., Jago, C.F., 1993. In situ assessment of modification of sediment properties by burrowing invertebrates. Marine Biology. 115, 133-142
Jonsson, P.R., van Duren, L.A., Amielh, M., Asmus, R., Aspden, R.J., Daunys, D., Friedrichs, M., Friend, P.L., Olivier, F., Pope, N., Precht, E., Sauriau, P.-G., Schaaff, E., 2006. Making water flow: a comparison of the hydrodynamic characteristics of 12 different benthic biological flumes. Aquatic Ecology. 40, 409–438
Kamermans, P., 1993. Food limitation in cockles (Cerastoderma edule (L.)): influences of location on tidal flat and of nearby presence of mussel beds. Netherlands Journal of Sea Research. 31, 71-81
Karlsson, Ő., Jonsson, P.R., Larsson, A.I., 2003. Do large seston particles contribute to the diet of the bivalve Cerastoderma edule? Marine Ecology Progress Series. 261, 161-173
Kazy, S.K., Sar, P., Singh, S.P., Sen, A.K., D’Souza, S.F. 2002. Extracellular polysaccharides of a copper-sensitive and a copper-resistant Pseudomonas aeruginosa strain: synthesis, chemical nature and copper binding. World Journal of Microbiology & Biotechnology 18, 583–588
Kim, S.-C., Friedrichs, C.T., Maa, J. P.-Y., Wright, L.D., 2000. Estimating bottom stress in tidal boundary layer from acoustic Doppler velocimeter data. Journal of hydraulic Engineering. 126, 399-406
Kornman, B.A., de Deckere, E.M., 1998. Temporal variation in sediment erodability and suspended sediment dynamics in the Dollard estuary. In: Black KS, Paterson DM and Cramp A (eds) Sedimentary processes in the intertidal zone. Special publications. Vol.139, pp. 231-241 Geological Society, London
Kristensen, E., 2000. Organic matter diagenesis at the oxic/anoxic interface in coastal marine sediments, witrh emphasis on the role of burrowing animals. Hydrobiologia. 426, 1-24
Kure, L.K., Forbes, T.L., 1997. Impact of bioturbation by Arenicola marina on the fate of particle-bound fluoranthene. Marine Ecology Progress Series. 156, 157-166.
Lawless, M., Robert, Andre., 2001 Scales of boundary resistance in coarse-grained channels: turbulent velocity profiles and implication. Geomorphology. 39, 221-238
Le Hir, P., Monbet, Y., Orvain, F., 2007. Sediment erodability in sediment transport modelling: Can we account for biota effects? Continental Shelf Research. 27, 1116-1142
Lenihan, H.S., Peterson, C.H., Allen, J.M., 1996. Does flow speed also have a direct effect on growth of active suspension-feeders: An experimental test on oysters. Limnology and Oceanography. 41, 1359-1366
Lick, W., Lick, J., Kirk Ziegler, C., 1992. Flocculation and its effect on the vertical transport of fine-grained sediments. Hydrobiologia. 235/236, 1-16
Lima, G., 2002. Respostas bioquímicas e fisiológicas do bivalve Scrobicularia plana (da Costa) em exposição a sedimentos naturais contaminados. Mc S. Thesis. FCT-UNL, Caparica. 77 pages

PART VI – REFERENCES
212
List, E. J., 1982. Turbulent jets and plumes. Annual Review of Fluid Mechanics 14, 189-212 Lorenzen, C.J., 1967. Determination of chlorophyll and pheo-pigments: spectrophotometric
equation. Limnol Oceanogr. 12 (2), 343-346 Lucas, C.H., Widdows, J., Brinsley, M.D., Salkeld, P.N., Herman, P.M.J., 2000. Benthic-
pelagic exchange of microalgae at a tidal flat. 1. Pigment analysis. Mar Ecol Prog Ser. 196, 59-73
Luckenbach, M.W., 1986. Sediment stability around animal tubes: the roles of hydrodynamic processes and biotic activity. Limnology and Oceanography 31, 779-787.
Lumborg, U., 2005. Modelling the deposition, erosion and flux of cohesive sediments through Øresund. Journal of Marine Systems. 56, 179-193
Maa J P-Y, Sanford L and Halka JP (1998) Sediment resuspension characteristics in Baltimore Harbour, Maryland. Mar Geol 146: 137-145
Mahaut, M.-L., Graf, G. 1987. A luminophore tracer technique for bioturbation studies. Oceanol. Acta 10, 323-328
Mantovanelli, A., Ridd, P.V., 2006. Devices to measure settling velocities of cohesive sediment aggregates : A reviwe of the in situ technology. Journal of Sea Research. 56, 199-226
Marcus, N. H., Schmidt-Gengenbach, J. 1986. Recrutment of individuals into the plankton: the importance of bioturbation. Limnol. Oceanogr. 31, 206-210
Mazik, K., Elliot, M., 2000. The efects of chemical pollution on the bioturbation potential of estuarine intertidal mudflats. Helgoland Marine Research 54, 99-109.
McAnally, W.H., Metha, A.J., 2002. Significance of aggregation of fine sediment particles in their deposition. Estuarine, Coastal and Shelf Science. 54, 643-653
McCool, W.W., Parsons, J.D., 2004. Sedimentation from buoyant fine-grained suspensions. Continental Shelf Research. 24, 1129-1142
Meadows, P.S., Murray, J.N.H., Meadows, A., Wood, D.M., West, F.J.C., 1998. Microscale biogeotechnical differences in intertidal sedimentary ecosystems. In Black, K. S., Paterson, D. M. and Cramp, A. (eds) Sedimentary processes in the intertidal zone. Geological Society, London, Special Publications. 139, 349-366
Meadows, P.S., Hariri, M.S.B., 1991. Effects of two infaunal polychaetes on sediment shear strength and permeability: an experimental approach. Symposium of the Zoological Society of London 63, 319-321.
Meadows, P.S., Meadows, A., 1991. The geotecnical and geochemical implications of bioturbation in marine sedimentary ecosystems. Symposium of the Zoological Society of London. 63, 157-181.
Meadows, P.S., Tate, J., Hussain, A., 1990. Effects of estuarine infaunal on sediment stability and particle sedimentation. Hydrobiologia. 190, 263-266
Meadows, P.S., Tait, J., 1989. Modification of sediment permeability and shear strength by two burrowing invertebrates. Marine Biology. 101, 75-82.
Meadows, P.S., Tufail, A., 1986. Bioturbation, microbial activity and sediment properties in an estuarine ecosystem. Proceedings of the Royal Society of Edinburg 90B, 129-142
Mehta AJ, Parchure TM, Dixit JG, Arithurai R. 1982. Resuspention potencial of deposited cohesive sediment beds. Estuarine Comparisons, V.S. Keneddy, ed., Academic Press, New York, 591-609
Mehta, A.J., Hayter, E.J., Parker, W.R., Krone, R.B., Teeter, A.M., 1989. Cohesive sediment transport. I: Process description. Journal of Hydraulic Engineering. 115 (8), 1076-1093
Meira, C.,Sellanes, J., Levin, L.A., Arntz, W.E., 2001. Meiofaunal distribution on the Peru margin: relashionship to oxygen and organic matter availability. Deep-Sea Res. I 48, 2453-2472

Chapter 9 – References
213
Meysman, F.J.R., Boudreau, B.P., Middelburg, J.J., 2003. Relations between local, non-local, discrete and continuous models of bioturbation. Journal of Marine Research. 61, 391-410
Middelburg, J. J., Soetaert, K., Herman, P. 1997. Empirical relashionships for use in global diagenic models. Deep-Sea Res. I 44,327-344
Middelburg, J.J., Klaver, G., Nieuwenhuize, J., Wielemaker, A., de Haas, W., van der Nat, J.F.W.A., 1996. Organic matter mineralization in intertidal sediments along an estuarine gradient. Marine Ecology Progress Series. 132, 157-168
Mil-Homens, M., Stevens, R.L., Abrantes, F., Cato, I., 2006. Heavy metal assesment for surface sediments from three áreas of the Portuguese Continental Shelf. Continental Shelf Research. 26, 1184-1205
Miller, D.C., Norkko, A., Pilditch, C.A., 2002. Influence of diet on dispersal of horse mussel Atrina zelandica biodeposits. Marine Ecology Progress Series. 242, 153–167
Miller, D.C., Geider, R.J. MacIntyre, H.L. 1996. Microphytobenthos: The ecological role of the "Secret Garden" of unvegatated, shallow-Water marine habitats. II. Role in sediment stability and shallow- water food webs. Estuaries, 19 (2A), 202-212
Møhlenberg, F., Riisgård, H.U., 1978. Efficiency of particle retention in 13 species of suspension feeding bivalves. Ophelia. 17, 239-246
Monismith, S.G., Koseff, J.R., Thompson, J.K., O’Riordan, C.A., Nepf, H.M., 1990. A study model bivalve siphonal currents. Limnology Oceanography. 35, 680-696
Morelli, E. Scarano G., 2004. Coppper-induced changes of non.protein thiols and antioxidant enzymes in the marine microalga Phaeodactylum tricornuntum. Plant Science 167, 289-296.
Mortimer, R.J.G., Davey, J.T., Krom, M.D., Watson, P.G., Frickers, P.E., Clifton, R.J., 1999. The effect of macrofauna on porewater profiles and nutrient fluxes in the intertidal zone of the Humber estuary. Estuarine, Coastal and Shelf Science. 48, 683-699.
Mouritsen, K.N., Mouritsen L.T., Thomas Jensen, K.T. 1998. Change of topography and sediment characteristics on an intertidal mud-flat following mass-mortality of the amphipod Corophium volutator. J Mar Biol Ass U.K 78: 1167-1180
Mugnai, C., Gerino, M., Frignani, M., Sauvage, S., Bellucci, L.G., 2003. Bioturbation experiments in the Venice Lagoon. Hydrobiologia. 494, 245-250
Mulsow, S., Landrum, P.F., Robbins, J.A., 2002. Biological mixing responses to subleathal concentrations of DDT in sediments by Heteromastus filiformis using 137Cs layer technique. Marine Ecology Progress Series. 29, 181-191
Mulsow, S., B. P. Boudreau and J. N. Smith. 1998. Bioturbation and porosity gradients. Limnol. Oceanogr. 43, 1-9
Murray, J.M.H., Meadows, A., Meadows, P.S., 2002. Biogeomorphological implications of microscale interactions between sediment geothecnics and marine benthos: a review. Geomorphology. 47, 15-30
Navarro, J.M., Widdows, J., 1997. Feeding physiology of Cerastoderma edule in response to a wide range of seston concentrations. Marine Ecology Progress Series. 152, 175-186
Neira, C., Levin, L.A., Grosholz, E.D., Mendoza, G., 2007. Influence of invasive Spartina growth stages on associated macrofaunal communities. Biological Invasions. 9, 975-993
Newell, C.R., Wildish, D.J., MacDonald, B.A., 2001. The effect of velocity and seston concentration on the exhalant siphon area, valve gape and filtration rate of the mussel Mytilus edulis. Journal of Experimental Marine Biology and Ecology. 262, 91-111
Niedoroda, A.W. Swift, D.J.P., Reed , C.W., Stull, J.K., 1996. Contaminant dispersal on the Palos Verded Continental margin: III. Processs controlling transport, accumulation and re-emergence of DDT-contaminated sediment particles. Sci. Tot. Env. 179, 109-133

PART VI – REFERENCES
214
Nielsen, O.I., Gribsholt, B., Kristensen, E., Revsbech, N.P., 2004. Microscale distribution of oxygen and nitrate in sediments inhabited by Nereis diversicolor: spatial patterns and estimated reaction rates. Aquatic Microbiology Ecology. 34, 23-32
Nikora, V., Green M.O. Thrust, S.F., Hume, T.M., Goring, D. 2002. Structure of the internal boundary layer over a patch of pinnid bivalves (Atrina zelandica) in an estuary. Journal of Marine Research. 60, 121-150
Nogaro, G., Charles, F., de Mendonça Jr, J.B., Mermillod-Blondin, F., Stora, G., François-Carcaillet, F., 2008. Food supply impacts sediment reworking by Nereis diversicolor. Hydrobiologia. 598, 403-408
O’Riordan, C.A., Monismith, S.G., Koseff, J.R., 1993. A study of concentration boundary-layer formation over a bed of model bivalves. Limnology Oceanography. 38, 1712-1729
Olsen, C.R., Cutshall, N.H., Larsen, I.L., 1982. Pollutant particulate associations and dynamics in coastal marine environments: a review. Mar. Chem. 11, 501-533
Ongley, E.D., Krishnappan, B.G., Droppo, I.G., Rao, S.S., Maguire, R.J., 1992. Cohesive sediment transport - emerging issues for toxic-chemical management. Hydrobiologia. 235, 177-187
Orvain, F., Le Hir, P., Sauriau, P.-G., 2003. A model of fluff erosion and subsequent bed erosion in the presence of the bioturbator, Hydrobia ulvae. Journal of Marine Research. 61, 823-851
Ouellette, D., Desrosiers, G. Gagne, J.-P., Gilbert, F., Poggiale, J.-C., Blier, P.U. Stora, G., 2004. Effects of temperature on in vitro sediment reworking processes by a gallery biodiffusor, the polychaete Neanthes virens. Mar. Ecol. Prog. Ser. 266, 185-193
Ozoh, P.T.E., 1994. The effects of salinity, temperature and time on the accumulation and depuration of copper in ragworm Hedistes (Nereis) diversicolor (O.F. Müller). Environmental Monitoring and Assessment. 29, 155-166
Ozoh, P.T.E., 1992. The effects of salinity, temperature and sediment on the toxicity of copper to juvenile Hedistes (Nereis) diversicolor (O.F. Müller ). Env. Monit. Assess. 21, 1-10
Ozoh, P.T.E., Jones, N.V., 1988. The effects of copper ions on embryogenesis in the polychaete, Hedistes (nereis) diversicolor. Mar. Env. Res. 24, 255-256
Paterson, D.M., Tolhurst T.J., Kelly, J.A., Honeywill, C., de Deckere, E.M.G.T., Huet, V., Shayler, S.A., Black, K.S., de Brower, J. Davidson, I. 2000. Variations in sediment properties, Skeffling mudfalt, Humber Estuary, UK. Cont Shelf Res. 20, 1373-1396
Paterson, D.M., 1989. Short-term changes in the erodability of intertidal cohesive sediments related to migratory behaviour of epipelic diatoms. Limnology and Oceanography. 34, 223-234
Peletier, H., 1996. Long-term changes in intertidal estuarine diatom assemblages related to reduce input of organic waste. Mar Ecol Prog Ser. 137, 265-271
Peña, E., Anta, J., Puertas, J., Teijeiro, T., 2008. Estimation of Drag Coefficient and Settling Velocity of the Cockle Cerastoderma edule Using Particle Image Velocimetry (PIV). Journal of Coastal Research. 24(4C), 150-158
Petersen, K., Kristensen, E., Bjerregaard, P., 1998. Influence of bioturbating animals on flux of cadmium into estuarine sediment. Marine Environmental Research. 45, 403-415
Pope, N.D., Widdows, J., Brinsley, M.D., 2006. Estimation of bed shear stress using the turbulent kinetic energy approach – A comparison of annular flume and field data. Continental Shelf Research. 26, 959-970
Power, M.E., Tilman, D., Estes, J.A., Menge, B.A., Bond, W.J., Mills, L.S., Daily, G., Castilla, J.C., Lubchenco, J., Paine, R.T., 1996. Challenges in the Quest for Keystones: Identifying keystone species is difficult—but essential to understanding how loss of species will affect ecosystems. BioScience. 46 (8), 609-620

Chapter 9 – References
215
Rabaut, M., Guilini, K., van Hoey, G., Vincx, M., Degraer, S., 2007. A bio-engineered soft-bottom environment: the impact of Lanice conchilega on the benthic species-specific densities and community structure. Estuarine, Coastal and Shelf Science. 75, 525-536
Rainbow, P.S., Gefferd, A., Jeantet, A.Y., Smith, B.D., Amiard, J.C., Amiard-Triquet, C., 2004. Enhanced food-chain transfer of coper from diet of copper-tolerant estuarine worms. Marine Ecology Progress Series 271, 183-191.
Rantala, R., Loring, D., 1975. Multi-element analysis of silicate rocks and marine sediments by atomic absorption spectrophotometry. Atomic Absorption Newsletter 14, 117-120.
Rasmussen, A.D., Banta, G.T. Andersen, O., 1998. Effects of bioturbation by the lugworm Arenicola marina on cadmium uptake and distribution in sandy sediments. Mar Ecol Prog Ser. 164, 179-188
Real, M., Munõz, I., Guasch, H., Navarro, E., Sabater, S., 2003. The effect of copper exposure on a simple aquatic food chain. Aquatic Toxicology 63, 283-/291.
Retraubun, A.S.W., Dawson, M., Evans, S.M., 1996. Spatial and temporal factors affecting sediment turnover by the lugworm Arenicola marina (L.). J. Exp. Mar. Biol. Ecol. 201, 23-35
Riethmüller, R., Heineke, M., Kühl, H., Keuker-Rüdiger 2000. Chlorophyll a concentration as an index of sediment surface stabilisation by microphytobenthos? Cont Shelf Res. 20, 1351-1372
Riisgård, H.,U., Kittner, C., Seerup, D.,F., 2003. Regulation of opening state and clearance rate in felter-feeder bivalves (Cardium edule, Mytilus edulis, Mya arenaria) in response to low algal concentration. Journal of Experimental Marine Biology and Ecology. 284, 105-127
Riisgård, H.U., 2001. On measurements of filtration rates in bivalves - the stony road to reliable data: review and interpretation. Marine Ecology Progress Series. 211, 275-291
Rossi, F., Herman, P.M.L., Middleburg, J.J., 2004. Interspecific and intraspecific variation of δ13C and δ15N in deposit - and suspension- feeding bivalves (Macoma balthica and Cerastoderma edule): Evidence of ontogenic changes in feeding mode of Macoma
balthica. Limnology and Oceanography. 49, 408-414 Rowden A.A., Jones, M.B., Morris, A.W., 1998a. The role of Callianassa subterranean
(Montagu) (Thalassinidea) in sediment resuspension in the North Sea. Cont Shelf Res. 18, 1365-1380
Rowden, A.A., Jago, C.F. Jones, S.E. 1998b. Influence of benthic macrofauna on the geothecnical and geophysical properties of surficial sediment, North Sea. Cont Shelf Res. 18, 1347-1363
Rueda, J.L., Smaal, A.C., Scholten, H., 2005. A growth model of the cockle (Cerastoderma
edule L.) tested in the Oosterschelde estuary (The Netherlands). Journal of Sea Research. 54, 276-298
Rusch, A., Huettel, M. 2000. Advective particle transport into permeable sediments – evidence from experiments in an intertidal sandflat. Limnol. Oceanogr. 45, 525-533
Rutgers van der Loeff. M,M,. Boudreau, B.P., 1997. The effect of resuspension on chemical exchanges at the sediment water interface in the deep sea - A modelling and natural radiotracer approach. J Mar Sys. 11, 305-342
Saiz-Salinas, J.I., Francés-Zubillaga, G., 1997. Nereis diversicolor: an unreliable biomonitor of metal contamination in the Ria de Bilbao (Spain). Marine Ecology 18, 113-125.
Sandnes, J., Forbes, T., Hansen, R., Sandnes, B. 2000a. Influence of particle type and faunal activity on mixing of di(2-ethylhexyl)phthalate (DEHP) in natural sediments. Mar. Ecol. Prog. Ser. 197, 151-167
Sandnes, J., Forbes, T., Hansen, R., Sandnes, B. 2000b. Bioturbation and irrigation in natural sediments, described by animal-community parameters. Mar. Ecol. Prog. Ser. 197, 169-179

PART VI – REFERENCES
216
Sanford, L.P., Maa, J. P.-Y., 2001. A unified erosion formulation for fine sediments. Marine Geology 179, 9-23.
Sauriau P-G, Kang C-K. 2000. Stable isotope evidence of benthic macroalgae-based growth and secondary production in the suspension feeder Cerastoderma edule (Mollusca, Bivalvia) in the Marennes-Oleron Bay. Hydrobiologia. 440, 317-329
Self, R.F.L., Nowell, A.R.M., Jumars, P.A., 1989. Factors controlling critical shears for deposition and erosion of individual grains. Marine Geology 86, 181-199
Shimeta, J., Amos, C.L., Beaulieu, S.E., Ashiru., O.M., 2002. Sequencial resuspension of protists by accelarating tidal flow: Implications for community structure in the benthic boundary layer. Limnol Oceanogr. 47 (4) 1152-1164
Shull, D.H., MAYER, L.M. 2002. Dissolution of particle-reactive radionuclides in deposit-feeder digestive fluids. Limnol. Oceanogr. 47, 1530-1536
Smaal AC, Haas HA. 1997. Seston dynamics and food availability on mussel and cockle beds. Estuarine Coastal Shelf Science. 45: 247-259
Smith, D., Hughes, R.G., Cox, E.J., 1996. Predation of epipelic diatoms by the amphipod Corophium volutator and the polychaete Nereis diversicolor. Marine Ecology Progress Series 145, 53-61.
Sobral, P., Widdows, J., 2000. Effects of increasing current velocity, turbidity and particle size selection on the feeding activity and scope for growth of Ruditapes decussatus
from Ria Formosa, southern Portugal. Journal of Experimental Marine Biology and Ecology. 245, 111-125
Sobral, P., Widdows, J. 1997. Effects of copper exposure on the scope for growth of the clam Ruditapes decussatus, from southern Portugal. Marine Pollution Bulletim 34, 992-1000.
Sohma, A., Sekiguchi, Y., Kuwae, T., Nakamura, Y., 2008. A benthic–pelagic coupled ecosystem model to estimate the hypoxic estuary including tidal flat - Model description and validation of seasonal/daily dynamics. Ecological Modelling. 215, 10-39
Sohma, A., Sekiguchi, Y., Yamata, H., Sato, T., Nakata, K., 2001. A new coastal marine ecosystem model study coupled with hydrodynamics and tidal flat ecosystem effect. Marine Pollution Bulletim. 43 (7-12), 187-208
Solan, M., Wigham, B.D., Hudson, I.R., Kennedy, R., Coulon, C.H., Norling, K., Nilsson, H.C., Rosenberg, R., 2004. In situ quantification of bioturbation using time-lapse fluorescent sediment profile imaging (f-SPI), luminophore tracers and model simulation. Marine Ecology Progress Series. 271, 1-12
Sondi, I., Lojen, S., Juracic, M., Prohic, E., 2008. Mechanisms of land–sea interactions – the distribution of metals and sedimentary organic matter in sediments of a river-dominated Mediterranean karstic estuary. Estuarine Coastal and Shelf Science. 80, 11-20
Soulsby, R.L. Dyer, K.R., 1981. The form of the near-bed velocity profile in a tidally accelerating flow. Journal of Geophysical Research. 86, 8067-8074
Sturley, D.R.M., Bowen, A.J., 1996. A model for contaminant transport in Lunenburg Bay, Nova Scotia. Sci. Tot. Env. 176, 161-172
Sutherland, T.F., Amos, C.L., Grant. J., 1998. The effect of buoyant films on the erodability of sublittoral sediments of a temperate microtidal estuary. Limnol Oceanogr. 43, 225-235
Sutherland, T.F., Grant, J., Amos, C.L. 1998. The effect of carbohydrate production by the diatom Nitzschia curvilineata on the erodability of sediment. Limnology and Oceanography 43, 65-72.
Swift, D.J.P., Stull, J.K., Niedoroda, A.W., Reed, C.W., Wong, G.T., 1996. Contaminant dispersal on the Palos Verdes continental margin. II. Estimates of the biodiffusion coefficient, Db, from composition of the benthic infaunal community. Sci. Tot. Env. 179, 91-107

Chapter 9 – References
217
Sze, P.W.C., Lee, S.Y., 1995. The potential role of mucus in the depuration of copper from the mussel Perna viridis (L.) and Septifer virgatus (Wiegmann). Mar. Poll. Bull. 31, 390-393
Teisson, C., Ockendeden, M., Le Hir, P., Kraneburg, C., Hamm, L., 1993. Cohesive sediment transport processes. Costal Engineering. 21, 129-162
Thompson, C.E.L., Amos, C.L., Lecouturier, M., Jones, T.E.R., 2004. Flow decelaration as a method of determining drag coefficient over roughened flat beds. Journal of Geophysical Research. 109, C03001
Thompson, C.E.L., Amos, C. L., Jones, T.E.R., Chaplin, J., 2003. The manifestation of fluid-transmitted bed shear stress in a smooth annular flume – a comparison of methods. Journal of Coastal Research. 19, 1094-1103
Tolhurst, T.J., Black, K.S., Paterson, D.M., 2009. Muddy Sediment Erosion: Insights from Field Studies. Journal of Hydraulic Engineering. 135, 73-87
Tolhurst, T.J., Black, K.S., Shayler, A.S., Mather, S., Black, I., Baker, K., Paterson, D.M., 1999. Measuring the in situ erosion shear stress of intertidal sediments with the Cohesive Strength Meter (CSM). Estuarine Coastal and Shelf Science 49, 281-294.
Trevor, J.H., 1977. The burrowing of Nereis diversicolor O.F. Müller, together with some observations on Arenicola marina (L.) (Annelida: Polychaeta). Journal of Experimental Marine Biology and Ecology. 30, 129-145
Troost, K., Stamhuis, E.J., van Duren, L.A., Wolff, W.J., 2009. Feeding current characteristics of three morphologically different bivalve suspension feeders, Crassostrea gigas, Mytilus edulis and Cerastoderma edule, in relation to food competition. Marine Biology. 156, 355-372
Turner, A., Millward, G.E., Suspended particles: their role in estuarine biogeochemical cycles. Estuarine, Coastal and Shelf Science 55: 857-883
Turnewitsch, R., Witte, U., Graf, G., 2000. Bioturbation in the abyssal Arabian Sea: influence of fauna and food supply. Deep-Sea Research. II 47, 2877-2911
Uncles, R.J., 2002. Estuarine physical processes research: some recent studies and progress. Estuarine, Coastal and Shelf Science, 829-856
Underwood, A.J. 1997. Experiments in Ecology. Cambridge University Press. Cambridge. 504 p.
Underwood, G.J.C., Smith, D.J., 1998. Predicting epipelic diatom exopolymer concentrations in intertidal sediments from Sediment Chlorophyll a. Microb Ecol. 35, 116-125
Underwood, G.J.C., Paterson, D.M., 1993a. Recovery of intertidal benthic diatoms after biocide treatment and associated sediment dynamics. J Mar Biol Ass UK. 73, 25-45
Underwood, G.J.C., Paterson, D.M., 1993b. Seasonal changes in diatoms biomass, sediment stability and biogenic stabilisation in the Severn Estuary. Journal of the Marine Biology Assossiation of the UK 73, 871-887
Urrutia, M., B., Iglesias, J.I.P., Navarro, E., Prou, J., 1996. Feeding and absorption in Cerastoderma edule under environmental conditions in the bay of Marennes-Oleron (Western France). Journal of the Marine Biological Association of the United Kingdom. 76, 431-450
Van Duren, L. A., Herman, P. M. J., Sandee, A. J. J., and Heip, C. H. R., 2006. Effects of mussel filtering activity on boundary layer structure. Journal of Sea Research. 55, 3-14
van Leussen, W., 1999. The variability of settling velocities of suspended fine-grained sediment in the Ems estuary. Journal of Sea Research. 41, 109-118
Vedel, A., Andersen, B.B., Riisgård, H.U., 1994. Field investigations of pumping activity of facultative filter-feeder polychaete Nereis diversicolor using an improved infrared phototransducer system. Marine Ecology Progress Series. 103, 91-101

PART VI – REFERENCES
218
Velasco, L.A., Navarro, J.M., 2005. Feeding physiology of two bivalves under laboratory and field conditions in response to variable food concentrations. Marine Ecology Progress Series. 291, 115-124
Vincent, B., Desrosiers, G., Gratton, Y., 1988. Orientation of the infaunal bivalve Mya
arenaria L. in relation to local current direction on a tidal flat. Journal of Experimental Marine Biology and Ecology. 124, 205-214
Vogel, S., 1994. Life in moving fluids. Princeton, New Jersey: Princeton University Press Volkenborn, N., Hedtkamp, S.I.C., van Beusekom JEE, Reise R. 2007. Effects of bioturbation
and bioirrigation by lugworms (Arenicola marina) on physical and chemical sediment properties and implications for intertidal habitat succession. Estuarine, Coastal and Shelf Science. 74, 331-343
Wang, Y.H., 2003. The intertidal erosion rate of cohesive sediment: a case study from Long Island Sound. Estuarine, Coastal and Shelf Science. 56, 891-896
Ward, J.E., Sanford, L.P., Newell, R.I.E., MacDonald, B.A., 1998. A new explanation of particle capture in suspension-feeding bivalve molluscs. Limnology and Oceanography. 43, 741-752
Watts, C.W., Tolhust, T.J., Black, K.S., Whitmore, A.P., 2003. In situ measurements of erosion shear stress and geotechnical shear strength of the intertidal sediments of the experimental managed realignment scheme at Tollesbury, Essex, UK. Estuarine, Coastal and Shelf Science. 58, 611-620
Webb, A.P., Eyre, B.D., 2004. The effect of natural populations of the burrowing and grazing soldier crab (Mictyris longicarpus) on sediment irrigation, benthic metabolism and nitrogen fluxes. Journal of Experimental Marine Biology and Ecology. 309, 1-19
Webb, D. G., and P. A. Montagna. 1993. Initial burial and subsequent degradation of sedimented phytoplankton: relative impact of macro and meiobenthos. J. Exp. Mar. Biol. And Ecol. 166, 151-163
Webster, I. T. 1992. Wave enhancement of solute exchange within empty burrows. Limnol. Oceanogr. 37, 630-643
Wheatcroft, R.A., Jumars, P.A., Smith, C.R., Nowell, A.R.M., 1990. A mechanistic view of the particulate biodiffusion coefficients: step lengths, rest periods and transport directions. Journal of Marine Research. 48, 177-207
Widdows, J., Friend, P.L., Bale, A.J., Brinsley, M.D., Pope, N.D., Thompson, C.E.L. 2007a. Inter-comparison between five devices for determining erodability of intertidal sediments. Continental Shelf Research 27, 1174–1189.
Widdows, J., Navarro, J.M., 2007b. Influence of current speed on clearance rate, algal cell depletion in the water column and resuspension of biodeposits of cockles (Cerastoderma edule). Journal of Experimental Marine Biology and Ecology. 343, 44–51
Widdows, J., Lucas, J.S., Brinsley, M.D., Salkeld, P., Staff, F.J., 2002. Investigation of the effects of current velocity on mussel feeding and mussel bed stability using an annular flume. Helgoland Marine Research. 56, 3-12
Widdows, J., Brown, S., Brinsley, M.D., Salkeld, P.N., Elliot, M., 2000a. Temporal changes in intertidal sediment erodability: influence of biological and climatic factors. Continental Shelf Research 20, 1275-1289.
Widdows, J., Brinsley, M.D., Salkeld, P.N., and Lucas, C.H., 2000b. Influence of biota on spatial and temporal variation in sediment erodability and material flux on a tidal flat (Westerschelde, The Netherlands). Mar Ecol Prog Ser. 194, 23-37
Widdows, J., Brinsley, M.D., Bowley, N., Barret, C., 1998a. A benthic annular flume for in
situ measurement of suspension feeding/biodeposition rates and erosion potential of intertidal cohesive sediments. Est Coast Shelf Sci. 46, 27-38

Chapter 9 – References
219
Widdows, J., Brinsley, M.D., Elliot, M., 1998b. Use of in situ flume to quantify particle flux (biodeposition rates and sediment erosion) for an intertidal mudflat in relation to changes in current velocity and benthic macrofauna. In: Black, K.S.; D.M. Paterson & A. Cramp (Eds.) Sedimentary processes in the intertidal zone. Special publications, Vol.139, pp. 85-97. Geological Society, London
Widdows, J., Brinsley, M.D., Salkeld, P.N., 1998c. Use of annular flumes to determine the influence of current velocity and bivalves on material flux at the sediment-water interface. Estuaries 21, 552-559.
Wildish, D.J., Miyares, M.P., 1990. Filtration rate of blue mussels as a function of flow velocity: preliminary experiments. Journal of Experimental Marine Biology and Ecology. 142, 213-219
Winterwerp, J.C., Manning, A.J., Martens, C., de Mulder, T., Vanlede, J., 2006. A heusticic formula for turbulence-induced flocculation of cohesive sediment. Estuarine, Coastal and Shelf Science. 68,195-207
Winterwerp, J.C., van Kesteren, W.G.M., 2004. Introduction to the physical of cohesive sediments in marine environment. Elsevier. Developments in sedimentology. 56. ISBN 0-4444-51553-4, ISSN 0070-4571
Winterwerp, J.C., 2002. On the flocculation and settling velocity of estuarine mud. Continental Shelf Research. 22, 1339-1360
Wooding, R.A., Bradley, E.F. & Marshall, J.K., 1973. Drag due to regular array of roughness elements of roughness elements of varying geometry. Boundary-Layer Metereology. 5, 285-308
Wright, J.P., Jones, C.G., 2006. The concept of organism as Ecossystem Engineers Ten Years on: Progress, Limitations, and Chalenges. BioScience. 56, 203-209
Xu, F., Wang, D.-P., Riemer, N., 2008. Modeling flocculation processes of fine-grained particles using a size-resolved method: Comparison with published laboratory experiments. Continental Shelf Research. 28, 2668–2677
Yallop, M.L., de Winder, B., Paterson, D.M., Stal, L.J., 1994. Comparative structure, primary production and biogenic stabilisation of cohesive and non-cohesive marine sediments inhabited by microphytobenthos. Estuarine, Coastal and Shelf Science. 39, 565-582.
Yang, Z., Baptista, A., Darland, J., 2000. Numerical modeling of flow characteristics in a rotating annular flume. Dynamics of Atmospheres and Oceans. 31, 271-294
Yentsch, C.S., Menzel, D.W., 1963. A method for the determination of phytoplankton chlorophyll and phaeophytin by fluorescence. Deep-Sea Research 10, 221-231
Ysebaert, T., Herman, P.M.J., 2002. Spatial and temporal variation in benthic macrofauna and relationships with environmental variables in an estuarine, intertidal soft-sediment environment. Marine Ecology Progress Series. 244, 105-124
Ysebaert, T., Meire, P., Herman, P.M., Verbeek, H., 2002. Macrobenthic species response surfaces along estuarine gradients: prediction by logistic regression. Marine Ecology Progress Series. 225, 79-95
Zhang, H., Madsen, O.S., Sannasiraj S.A., Chan E.S., 2004. Hydrodynamic model wave-current interaction in coastal regions. Estuarine Coastal and Shelf Science. 61, 317-324
Zimmerman, J.R., Bricker, J.D., Jones, C., Dacunto, P.J., Street, R.L., Luthy, R.G. 2008. The stability of marine sediments at a tidal basin in San Francisco Bay amended with activated carbon for sequestration of organic contaminants. Water Research. 42, 4133-4145
Zonta, R., Collavini, F., Zaggia, L., Zuliani, A., 2005. The effect of floods on the transport of suspended sediments and contaminants: A case study from the estuary of the Dese River (Venice Lagoon, Italy). Environment International. 31 (7), 948-958