community structure of macrobenthos in … structure of macrobenthos in... · community structure...
TRANSCRIPT
• , 1:.
COMMUNITY STRUCTURE OF MACROBENTHOS IN MALUDAM RIVER, BETONG, SARAWAK
Nur Aina Syuhaida Binti RusH
Bachelor of Science with HonoursQL 362 (Aquatic Resource Science and Management)
2014N974 2014

COMMUNITY STRUCTURE OF MACROBENTHOS IN MALUDAM
RIVER, BETONG, SARAWAK
NUR AINA SYUHAIDA BINTI RUSLI (31995)
This report is submitted in partial fulfilment of the requirements for the degree of Bachelor of
Science with Honours (Aquatic Resource Science and Management)
Faculty of Resource Science and Technology
Universiti Malaysia Sarawak
2014

I
Acknowledgement
“In the name of Allah, the most gracious, the most merciful”
First of all, very special thanks and thousands of appreciation rewarded to my
supervisor, Prof. Dr. Shabdin bin Mohd Long for guiding and teaching me the most valuable
knowledge in conducting the research. Thanks for all the advices and the time that had been
spent for me before this. Other than that, I would like to thanks my parent for giving me all
the things that I need such as love, support and money. Thanks to my brother Mohd Hairul
Syahid for helping me in finishing this project.
Furthermore, I wish to extend my heartfelt thanks to my lab mates Nor Syuhaidah binti
Mohd Zee Hood, Nor Suhada binti Mohd.Razali, Aaqilah Amr binti Mohd Amran and
Muhammad Nur Arif bin Othman. They are willing to help me during sampling and
laboratory works. Not only that, special thanks to my roommate in colleague Nur Hafizah
binti Ya’acob for being by my side all the time.
I would like to express my deep gratitude to all laboratories assistance in Aquatic
Department especially Mr. Richard Toh, Mr. Zaidi and Mr. Azlan for their time and energy
during fieldwork and instruments preparation. Thanks for all the accommodations and
transports provided. Not forgetting, special thanks to all the villagers of Kampung Maludam
for their warm treats during field work. Last but not least, thanks to all the individuals that
welcome me in their life.

II
TABLE OF CONTENTS
Acknowledgement....................................................................................................... I
Table of Contents........................................................................................................ II
List of Abbreviations.................................................................................................. V
List of Tables.............................................................................................................. VI
List of Figures............................................................................................................. VIII
Abstract....................................................................................................................... 1
1.0 Introduction.......................................................................................................... 2
2.0 Literature Review
2.1 Peat Swamp Ecology................................................................................ 4
2.2 Fresh Water Ecology................................................................................. 5
2.3 Pysico-chemical Water Parameters........................................................... 6
2.4 Macrobenthos and Sediment..................................................................... 8
3.0 Methodology
3.1 Study Area................................................................................................ 9
3.2 Physico-chemical Water Parameter.......................................................... 12
3.3 Sampling of Macrobenthos....................................................................... 12
3.4 Laboratory Analysis
3.4.1 Macrobenthos Sorting and Identification.................................. 13

III
3.4.2 Particle Size Analysis................................................................. 13
3.4.3 Total Organic Matter.................................................................. 15
3.4.4 Chlorophyl a Analysis............................................................... 15
3.5 Data Analysis
3.5.1 Shannon – Weaver Index (H’)................................................... 16
3.5.2 Margalef Richness Index (Df).................................................... 16
3.5.3 Pielou’s Evenness Index (J)....................................................... 17
3.5.4 Correlations................................................................................ 17
4.0 Result
4.1 Physico-chemical Water Parameters........................................................ 18
4.1.1 Temperature.............................................................................. 20
4.1.2 pH.............................................................................................. 21
4.1.3 Turbidity..................................................................................... 22
4.1.4 Salinity...................................................................................... 23
4.1.5 Transparency............................................................................. 24
4.1.6 Depth.......................................................................................... 25
4.1.7 Dissolved Oxygen...................................................................... 26
4.1.8 Current....................................................................................... 27

IV
4.2 Physico-chemicals and Biological Parameters of Sediment
4.2.1 Particle Size Analysis................................................................. 28
4.2.2 Total Organic Matter.................................................................. 29
4.2.3 Chlorophyll a............................................................................. 30
4.3 Macrobenthos Community Structure
4.3.1 Species Density, Diversity, Evenness and Richness.................. 31
4.4 Species Composition of Macrobenthos..................................................... 32
4.5 Correlations of Community Structures and Water Parameters................. 35
5.0 Discussion
5.1 Physico-chemical Water Parameters........................................................ 40
5.2 Biological Parameters............................................................................... 44
5.3 Macrobenthos Community....................................................................... 47
6.0 Conclusion............................................................................................................ 51
7.0 References............................................................................................................. 52
8.0 Appendix............................................................................................................... 56

V
LIST OF ABBREVIATIONS
Abbreviations Full Term
DO Dissolve Oxygen
GPS Global Positioning System
TOM Total Organic Matter
PSU Practical Salinity Unit
FNU Formazin Nephelometric Unit
N North
Chl a Chlorophyll a
% Percentage
g Gram
km Kilometer
m Meter
Mg/L Miligram per liter
Mg/m3 Miligram per cubic meter
Ind./m3 Individuals per meter cube
SPSS Statistical Package for Social Science

VI
LIST OF TABLES
CAPTIONS PAGE
Table 1 : Several water parameters for peat swamp forest in Malaysia – North
Selangor Peat Forest, Bebar River, Pahang, Batang Kerang, Balai
Ringin, Serian, Sarawak
5
Table 2 : Selected water parameters for freshwater ecosystem in Malaysia –
Madek River, Kluang, Johor, Perlis River, Semenyih River, Selangor
data on rainy season (RS) and dry season (DS)
7
Table 3 : The location of the sampling stations 9
Table 4 : Results of water parameters on 24th
August 2013 (Ebb tide) 18
Table 5 : Results of water parameters on 25th
August 2013 (Flood tide) 19
Table 6 : Percentage of sand, silt and clay at six stations in Maludam River 28
Table 7 : Mean and standard deviation of total organic matter 29
Table 8 : Chlorophyll a concentration in each station along Maludam river 30
Table 9 : Summary of the macrobenthos community structure in Maludam
River, Sarawak. N – Total number of individuals / m2, H’ – Shannon
Weaver Diversity Index (bits / individuals), J – Pielou’s Evenness,
Df– Species Richness and S – Species number.
31
Table 10 : Species Composition and density of macrofauna (no. ind/m2) in
Maludam River
33 – 34
Table 11 : Correlation between community structures 36
Table 12 : Strength of correlation 36

VII
Table 13 : Correlation between water parameters with community structures of
macrobenthos
37
Table 14 : Pearson correlation (r) between water parameters during ebb tide 38
Table 15 : Pearson correlation (r) between water parameters during flood tide 39

VIII
LIST OF FIGURES
CAPTIONS PAGE
Figure 1: Location of six sampling stations along the Maludam river to estuary. 11
Figure 2: Variation of temperature at six stations in Maludam River 20
Figure 3: Variation of pH at six stations in Maludam River 21
Figure 4: Variation of turbidity at six stations in Maludam River Estuary 22
Figure 5: Variation of salinity at six stations in Maludam River Estuary 23
Figure 6: Variation of transparency at six stations in Maludam River. 24
Figure 7: Variation of depth at six stations in Maludam River. 25
Figure 8: Variation of dissolved oxygen at six stations in Maludam River. 26
Figure 9: Variation of water current at six stations in Maludam River. 27
Figure 10: Percentage of sand, silt and clay at six stations in Maludam River 29
Figure 11: Total Organic Matter at six stations in Maludam River. 30

1
Community Structure of Macrobenthos in Maludam River, Sarawak
Nur Aina Syuhaida Binti Rusli
Aquatic Resource Science and Management Programme
Faculty of Resource Science and Technology
Universiti Malaysia Sarawak
ABSTRACT
Survey was conducted in the Maludam River to record the community structure of macrobenthos. Samplings
were done in six stations using Van Veen Grab sampler. There were eight parameters of water measured in-situ
namely temperature, pH, turbidity, salinity, transparency, depth, dissolved oxygen and water current. Four phylla
of macrobenthos (Mollusca, Annelida, Arthropoda and Nematoda) were recorded. There were one species of
gastropod, one species of bivalve, five species of polychaetes, seven species of oligochaetes, eight species of
aquatic insects, one species of crustacean and one species of nematode. The density of macrobenthos recorded in
Maludam River range from 37 to 757 individuals per m2. The Shannon Weaver diversity and Pielou’s Evenness
indices range from 0.7316 to 1.4977 and 0.5278 to 0.8333 respectively. The species richness for all stations
ranged from 0.4525 to 1.9386. High number of species was found assemblages in upstream of the river where
reflects the clean water of peat swamp area near the Maludam National Park. Overall, macrobenthos found in
Maludam River are common species found in tropical water ecosystem.
Key words: Macrobenthos, water parameters, community structure
ABSTRAK
Kajian telah dijalankan di Sungai Maludam bagi merekod struktur komuniti makrobentos. Persampelan telah
dilakukan di enam stesen menggunakan pengorek Van Veen. Lapan parameter air telah diukur secara in-situ
iaitu suhu, pH, kekeruhan, saliniti, kejernihan, kedalaman, oksigen larut dan arus air. Empat phyla makrobentos
(Moluska, Annelida, Arthropoda dan Nematoda) telah direkodkan. Satu spesies gastropod, satu spesies
Bivalvia,lima spesies Polychaeta, tujuh spesies Oligochaeta, lapan spesies serangga air, satu spesies krustasea
dan satu spesies Nematod telah ditemui. Kepadatan makrobentos di Sungai Maludam ialah dalam julat 37 ke
757 individu per m2. Kepelbagaian dan Kesamarataan indeks berada dalam julat 0.7316 hingga 1.4977 dan
0.5278 hingga 0.8333 masing-masing. Ketinggian bilangan spesies yang dijumpai di kawasan hulu sungai
Maludam menunjukkan kebersihan kualiti air di kawasan paya gambut berdekatan Taman Negara Maludam.
Keseluruhannya, makrobentos yang dijumpai di Sungai Maludam adalah spesies yang sering ditemui di
kawasan perairan tropika.
Kata kunci: Macrobentos, parameter air, struktur komuniti

2
1.0 Introduction
Maludam River is made up of natural peat swamp forest in the upper stream and
mangrove forest in the down stream area. Peat swamp forest possessed the ability to attract
the attention of many researchers in understanding the community structure of organisms that
lived there. Tropical peat swamp forests could be found extensively in Southeast Asia
especially on the islands of Borneo, Sumatera and Peninsular Malaysia (Kim, Stephen and
Firuza, 2013). Great effort had been given in order to document the species of plants and
animals presence in such unusual biomes (United Nations Development Programme, UNDP,
2006).
Macrobenthos can be defined as invertebrates living in or on the sediments that
retained by 500 µm sieve (Henninger, Froneman and Hodgson, 2011). Macrobenthos are
significant component of food web in river ecosystems. Macrobenthos serves as food for
higher trophic levels in the benthic environment and can be eaten by swimming predators for
examples fish, shrimp and crabs (Tan, Chukong, Shabdin, Abang, Ismail, Chernoff and Chin,
1995). They help in acceleration of decomposition process by breaking down the organic
matter into simpler form such as phosphate and nitrate (Abowei, Ezekiel and Hansen, 2012).
Macrobenthic organisms play important role as bio-indicator of water pollution as
different species had different sensitivity to organic pollutants. Anthropogenic activities
caused deterioration of water quality especially near the river mouth (Arienzo, Adamo,
Bianco and Violante, 2001).
The term “community” is used to describe macrobenthos in term of related species
distribution, grouping together of organisms under similar environmental condition and shared

3
the specific biological characteristics (Norbaiaah, 2012). A study conducted by
Piamthipmanus (1997) had shown that the macrobenthos community in Sarawak was greater
than macrobenthos community in Brunei and Sabah during pre and post North-East monsoon
period.
However, the Department of Environment (DOE) in Malaysia has not includes neither
practices the method of using macrobenthos invertebrate as the bio-indicator in the river
pollution research (Yap, Rahim, Ismail and Tan, 2003). According to Rahim, Daud, Siraj,
Arshad, Esa and Ibrahim (2009), the invertebrates in the tropic area were small in size and
their large diversity or their abundance had caused difficulty for identification process. There
are shortage of trained taxonomist and inadequate references about macrobenthos from
Sarawak river basins (Piamthipmanus, 1997: Rahim et al. 2009).
In Sarawak, the distribution study of macrobenthos community structure is still in
infancy stage especially in Maludam River due to its location in rural area. Yet, there is no
research and documented data available on macrobenthos community structure in Maludam
River. The objectives of this research are:
1. To identify the physico-chemical water parameters that influenced the macrobenthos
community structure.
2. To elucidate the relationship between macrobenthos community and physical
characteristics of sediments.
3. To determine species density, species diversity, species richness and species evenness
of macrobenthos in Maludam river estuaries.

4
2.0 Literature Reviews
2.1 Peat Swamp Ecology
Forested peat swamps in Sarawak had existed over the past 4000 years (Howes, 1998).
The swamp water contains high concentration of tannins and giving it a dark brown colour or
also known as black water swamp (Yule and Yong, 2004). The water is acidic that range
about pH 3-4 (Yule and Yong, 2004). Highly acidic condition and absence of microbial
activity inhibit the decomposition of plant litter and organic debris which lead to the
formation of peat (Rahim et al., 2009: Yule and Gomez, 2009). Peat soils help in toxicant
removal by binding with metals from waterborne such as copper, arsenic and mercury (United
Nations Development Programme, UNDP, 2006).
Aquatic invertebrates that are abundance in peat swamp area usually Odonata,
Hemiptera, Ephemeroptera, Trichoptera, Diptera and Copepoda (Yule and Yong, 2004). The
larva of tanypod chironomid equipped with gills had been found in North Selangor Peat
Swamp Forest (Yule and Yong, 2004). Trichoptera had the ability to survive in acidic flowing
water condition (Lim, 2003). According to Yule and Yong (2004), certain groups of macro
invertebrate are absent in peat swamp area for example decapods, molluscs, nematodes and
hirudineans. Low number of molluscs and lack of large crustaceans such as crabs in this area
is due to interference of their calcium metabolism with acidic water (Yule and Yong, 2004).
According to Whitmore (1984), peat swamp water had very low nutrient
concentration. The black water impedes the photosynthesis process and result in low number
of phytoplankton and algae (Yule and Yong, 2004). According to Kim et al. (2013), the
turbidity values for peat swamp water was very low even though the colour of the water was
5
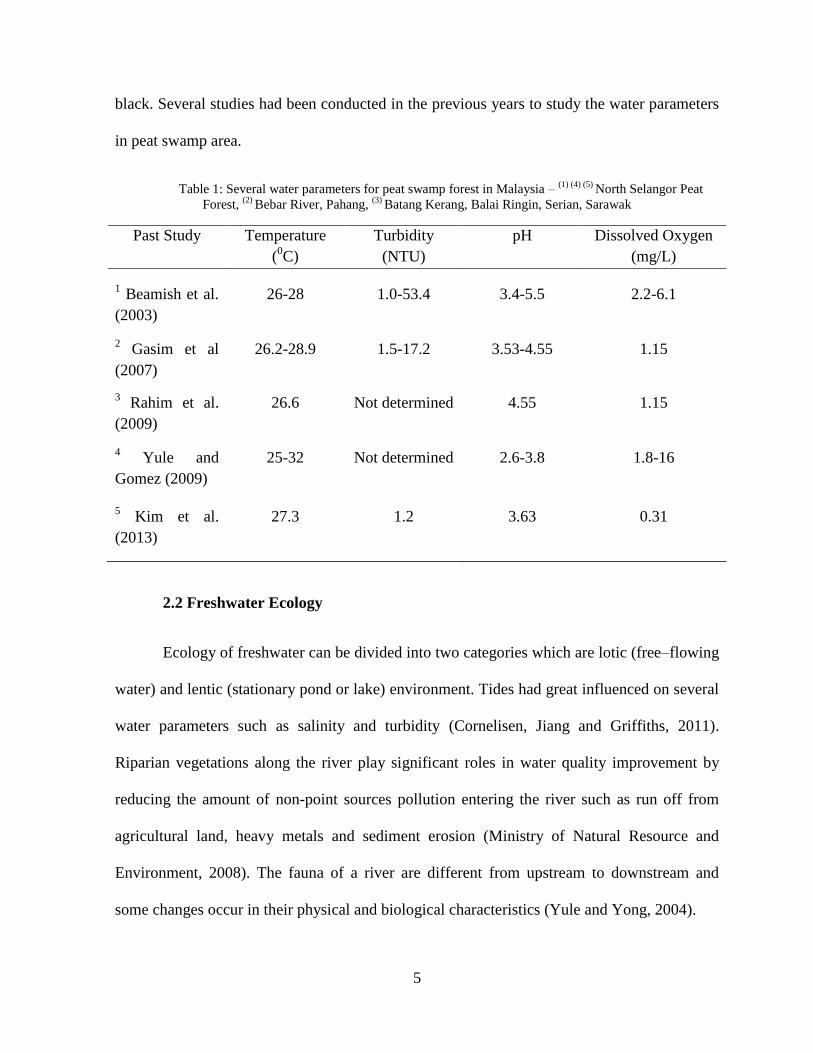
black. Several studies had been conducted in the previous years to study the water parameters
in peat swamp area.
Table 1: Several water parameters for peat swamp forest in Malaysia – (1) (4) (5)
North Selangor Peat
Forest, (2)
Bebar River, Pahang, (3)
Batang Kerang, Balai Ringin, Serian, Sarawak
Past Study Temperature
(0C)
Turbidity
(NTU)
pH Dissolved Oxygen
(mg/L)
1 Beamish et al.
(2003)
26-28 1.0-53.4 3.4-5.5 2.2-6.1
2 Gasim et al
(2007)
26.2-28.9 1.5-17.2 3.53-4.55 1.15
3 Rahim et al.
(2009)
26.6 Not determined 4.55 1.15
4 Yule and
Gomez (2009)
25-32 Not determined 2.6-3.8 1.8-16
5 Kim et al.
(2013)
27.3 1.2 3.63 0.31
2.2 Freshwater Ecology
Ecology of freshwater can be divided into two categories which are lotic (free–flowing
water) and lentic (stationary pond or lake) environment. Tides had great influenced on several
water parameters such as salinity and turbidity (Cornelisen, Jiang and Griffiths, 2011).
Riparian vegetations along the river play significant roles in water quality improvement by
reducing the amount of non-point sources pollution entering the river such as run off from
agricultural land, heavy metals and sediment erosion (Ministry of Natural Resource and
Environment, 2008). The fauna of a river are different from upstream to downstream and
some changes occur in their physical and biological characteristics (Yule and Yong, 2004).

6
From the previous study by Shabdin (2010), six phylla of macrofauna were recorded
from Rajang River. The phylla were Annelida, Arthropoda, Brachiopoda, Echinodermata,
Mollusca and Nematoda. Freshwater stations had high species number of aquatic insect
groups meanwhile at the estuarine stations, the annelids groups were found to be dominant
(Shabdin, 2010).
Research had been conducted in Langat River, Selangor by Yap, Azrina, Rahim,
Ismail and Tan (2005) which showed Chironomus sp. was found abundance in oxygen-poor
water in upstream area because this species possessed haemoglobin. The downstream area
was dominated by organisms under class Clitellata such as Limnodrilus sp. due to their ability
to survive in unfavourable condition (Yap et al., 2005). Species diversity decreased in
polluted water (Yap et al. 2005).
According to a study conducted by Norbaiaah (2012), phylum Annelida under the
class Polychaeta was the dominant macrobenthos community in Tanjung Bajong, Sarawak.
Animal under this class was found in soft bottom benthic area due to their behaviour as active
burrowers (Norbaiaah, 2012).
2.3 Physico-Chemical Water Parameters
The prime physico-chemical factors that affect estuarine organisms are salinity,
temperature, oxygen level, the nature of the substratum and the availability of nutrients
(Barnes, 1974). According to Kim et al. (2013), the pH of water at the peat area was very low
but the value increased as went down to the estuary due to presence of buffering capacity. In
their researched, they found out that there was slightly saline condition in peat swamp water
which was caused by sea water intrusion or tidal influence.

7
According to Yule and Yong (2004), in downstream of a river, the water flows slower,
turbidity increase due to high suspended material, oxygen levels drop and temperature
increase as the river become sluggish and less shade. Dissolved and suspended solid create a
turbid appearance and restrict light penetration. This may lead to oxygen deficiency and
dangerous effect on aquatic life (Yule and Yong, 2004).
According to Samkelisiwe (2002), the effluent that was high in degradable organic
matter such as domestic sewages used up dissolved oxygen resources rapidly. Increase in
temperature also lead to low concentration of dissolved oxygen (Samkelisiwe, 2002). The
macrobenthos showed low diversity and density due to stressing conditions of low salinity,
unfavorable sediments, and anoxic conditions in the deeper areas (Sanders, 1960). Different
anthropogenic activities contributed to different types of impact on water quality. Many
researches had been done to compare the water quality in fresh water ecosystem.
Table 2: Selected water parameters for freshwater ecosystem in Malaysia – (1)
Madek River, Kluang,
Johor, (2)
Perlis River, (3)
Semenyih River, Selangor data on rainy season (RS) and dry season (DS)
Past Study 1 Aweng et al.
(2011)
2 Amneera et al.
(2013)
3 Fawaz Al Badaii et al. (2013)
RS DS
Temperature (0C) 24.5 – 27.0 Not determined 26.27 – 27.55 24.71 – 27.36
Turbidity (NTU) 4.5 – 26.2 42.85 – 78.25 8.0 – 46.0 4.0 – 206.7
pH 5.48 – 7.49 6.46 – 7.38 5.23 – 6.55 7.07 – 8.04
DO (mg/L) 7.25 – 8.36 1.98 – 3.38 5.58 – 7.07 4.13 – 7.44

8
2.4 Macrobenthos and Sediment
In freshwater ecosystem, sediment size and current play significant role in the
distribution of macrobenthos (Abdul, Mohamed and Suliman, 2003). Bioturbation process by
macrobenthos affects the distribution of organic matter in the sediment (Blaire, Levin,
DeMaster and Plaia, 1996).
According to Abdul et al. (2003), Phylum Annelida and Insecta were found abundance
in upper stream of Pahang River, while Phylum Mollusca dominated rocky and sandy area
with slow current and clear water. The percent of silt and clay in certain location influenced
the abundance of the polychaete (Norbaiaah, 2012).
Batang Lupar estuary had higher percentage of sand than percentage of silt and clay
(Nurul, 2012). Sediment in Batang Saribas also contained more than 80% of sand particles
than silt and clay (Krishnan, 2004). According to Waznah et al. (2010), median size indicates
the fine sand was deposited at a moderately low energy conditions and the coarse sand was
deposited at a high energy conditions. The different in energy leads to the deposition of
sediments in different location (Waznah et al., 2010).

9
3.0 Methodology
3.1 Study Area
Field trip began on 23rd
August until 25th
August 2013 at Maludam River-Estuary,
Sarawak. Maludam River located about 78.2 kilometer from Kuching and almost three hour
journeys. Maludam is a small town and sub district in Betong Division, Sarawak. Maludam
estuary located at the river mouth of Maludam River that brings along the domestic wastes
from housing area and run-off from oil palm plantation that are located at Station 4 and 5. The
coordinate of the six stations were determined by using a hand-held Global Positioning
System 76 (GARMIN, 60 CSX) and were shown in Table 3.
Table 3: The location of the sampling stations
Station Coordinate Weather Habitat Descriptions
1 N 01° 37' 25.9"
E 111° 03' 13.6"
Sunny Sampling site: Bakong River
River width: 10m
Within Maludam National Park
jurisdiction. Water colour was black. A
hut presence near the sampling point.
Stagnant water condition. Shaded by
vegetation.
2 N 01° 37' 27.7"
E 111° 03' 12.3"
Sunny Sampling site: Jalan Sami
River width: 15m
Water colour was black. Shaded by
vegetation such as Pandanus sp.The
bottom sediment consists of huge amount
of leaf litter. Slow flowing water.

10
3 N 01° 37' 40.5"
E 111° 02' 56.9"
Sunny Sampling site: Entrance to Maludam
National Park
River width: 26m
The colour of water was black. Less
shaded by vegetation compare to station 1
and 2. Sediment made up of leaf litter.
Slow water movement.
4 N 01° 38' 22.4"
E 111° 02' 48.9"
Sunny Sampling site:Teluk Belanda
River width: 10m
Mixing of black water and white water.
The colour of water was brownish black.
Less shaded area. Presence of water
treatment plant. Muddy bottom sediment.
Fast flowing water.
5 N 01° 38' 36.6"
E 111° 02' 33.7"
Sunny Sampling site: Maludam Bridge
River Width: 28m
The water was light brownish color. Near
to fishermen village. Fast flowing water.
Bottom sediment muddy. Abundance of
Nypa sp. and Sonneratia sp. Habitat of
mudskipper.
6 N 01° 39' 50.7"
E 111° 01' 15.5"
Sunny Sampling site: Maludam Estuary
River width:40m
Brownish milk-tea colour water. Muddy
bottom sediment. Fast flowing water.
Wide exposed area. Abundance of
mangrove plants such as Avicennia sp. and
Sonneratia sp.

11
The sampling was carried out at six stations (Figure 1). Each station was chose
randomly along the Maludam River-Estuary. Three stations (Station 1, 2 & 3) (Figure 1) were
located at peat swamp area, one station (Station 4) (Figure 1) at middle stream area and two
stations (Station 5 & 6) at estuary area (Figure 1).
Figure 1: Location of six sampling stations along the Maludam river to estuary.
Legend:
Station
1-6
N
5 km
(Source: Jason Hon, 2008)
12
3.2 Physico-chemical Water Parameters
Selected water parameters such as the temperature, salinity, dissolved oxygen,
turbidity, pH, transparency and depth were measured in-situ. Dissolved Oxygen Meter Kit
(Sper Scientific Instrument, 850048) was used to measure dissolved oxygen and temperature.
Turbidity, pH and salinity were measured using turbidity meter (EUTECH Instrument, T400),
pH meter (Hanna Instrument, HI 8424), and salinometer (Milwaukee, MA 887) respectively.
Secchi disc (WILDCO) was used to measure water transparency. The depth finder
(Speedtech, 65054) was used to measure the depth of the water at each station.
A plastic strand was tied to the floating object to measure surface water current and
stop watch was used to record the time taken for floating object to move within one meter
distance. All water parameters were recorded for two days on 24/8/2013 (low tide) and
25/8/2013 (high tide). The data were recorded in triplicate to increase accuracy. Plastic tube
corer with diameter of 4 centimeter was used to obtain about 1 centimeter of sediment at each
station for chlorophyll a analysis and total organic matter.
3.3 Sampling of Macrobenthos
Van Veen grab sampler was used to obtain the sediment samples. At each station
triplicate sediment samples were taken and 500 µm mesh sieve was used to sieve them. The
residues remained on the sieve were transferred into labeled plastic bags and preserved with
5% formalin. The samples were brought to the Laboratory of Faculty Resource Science and
Technology, Universiti Malaysia Sarawak for further analysis. All the sediment in the plastic
bags were removed and stored in clean plastic containers. The sediment samples were stained
with Rose Bengal.

13
3.4 Laboratory Analysis
3.4.1 Macrobenthos Sorting and Identification
The organisms were sorted and counted in the laboratory with the aid of stereo- and
compound microscope. All the species found were classified into their groups and identified
to the lowest taxon possible using the key for macrobenthos identification in the literature
such as Michael (1997), Yule and Yong (2004), Brusca (2002), Shabdin and Rosniza (2010),
Pechenik (2010), Thorp and Rogers (2011).
3.4.2 Particle Size Analysis
Particle size analysis followed the methods recommended by Buchanan (1984). The
Udden-Wentworth scale was used to describe grains size: Very coarse sand (>1.0 mm), coarse
sand (>0.5 mm), medium sand (>0.25 mm), fine sand (>0.125 mm), very fine sand (>0.0625
mm) and silt (<0.0625 mm).
The sediment samples were dried overnight at 700 C to 100
0 C and weight up to 30
grams. Then, the sediment samples were transferred into one liter beaker containing 100 ml of
6% hydrogen peroxide and were put aside for overnight to break up any clumps in the
materials. The sediment from each station was washed onto a filter paper (Whatman 50) with
distilled water under gentle suction (filtration system). The sample was dispersed in sodium
hexametaphosphate to separate the fine/clay particles. 250 ml of distilled water and 10 ml of
6.2 g/L sodium hexametaphosphate solution were added into a beaker. The sediment and
solution were stirred mechanically for 15 minutes. The solution was soaked overnight again.

14
The soaked sediment was poured onto 63 micrometer mesh sieve and a basin at the
bottom to collect the water. The sand remained on the sieve was dried in an oven at 700 C to
1000 C for 24 hours, while the water in the basin was used in Pipette Method. The dried sand
was transferred into a petri dish and the weight was recorded. Then, the dried sand was used
in Dry Sieve Analysis. The silt content was calculated using the formula below:
Silt content (%) = (Total weight of sample – Weight of sand) X 100
Total weight of sample
Pipette Method
The water in the basin was transferred into a one liter capped measuring cylinder. The
cylinder was turned up and down to suspend the sediment evenly throughout the water
column. First pipette process was done immediately at depth of 20 cm and 20ml of water was
pipette out from the capped measuring cylinder. After 7 minutes 44 seconds, 20 ml of water
was pipette from depth of 10 cm. Third pipette process was continued after 2 hour 3 minutes
at depth 10 cm and 20ml of water was pipette out from the capped measuring cylinder.
Dry Sieve analysis
An automatic sieve shaker (Endecotts, MINOR) was used to separate the sand
fractions. Sieves with mesh size 1.0 mm, 0.5mm, 0.025mm, 0.0125mm, 0.063mm were used.
All the sand retained on each sieve was transferred into pre-weighed dish for another
weighing. The data were recorded.