functional differences in the promoter and flanking region ... 2009 readingweb/schulte gomez-chiarri...
TRANSCRIPT

Copyright 0 1997 by the Genetics Society of America
Structural and Functional Differences in the Promoter and 5' Flanking Region of Ldh-B Within and Between Populations of the Teleost Fundulus heteroclitus
Patricia M. Schulte, Marta Gomez-Chiarri and Dennis A. Powers
Hopkins Marine Station, Stanford University, Pacijic Grove, California 93950 Manuscript received June 10, 1996
Accepted for publication November 22, 1996
ABSTRACT We have investigated the mechanisms underlying differences in the transcriptional regulation of lactate
dehydrogenase-B (Ldh-B) between northern and southern populations of a teleost fish, Fundulus heterocli- tw. A 1-kb region immediately 5' of the gene was sequenced from populations throughout the species range. There were two major allele classes in the sample, one containing alleles from Maine and another containing those from Florida. Populations from intermediate localities contained both allele classes. Some individuals from Georgia had sequences intermediate between the two classes, representing either ancestral alleles or recombinants. Tests of neutralitywere applied to determine whether observed variation was consistent with neutral expectations. Significant deviations from neutral expectations were detected for the 5' flanking region, but not for other loci. The functional consequences of flanking sequence variation were assessed by transfection of reporter gene constructs into cultured cells and injection into living fish. Consistent with observed variation in Ldh-B transcription rate between populations, significant differences in reporter gene activity were driven by flanking regions from northern and southern popula- tions both in cell culture and in vivo. This functional differentiation, coupled with departures from neutral expectations, suggests that selection may have acted on the regulation of Ldh-B in F. heteroclitus.
P OPULATIONS of the killifish, Fundulus heteroclitus, occur in bays, estuaries and salt marshes along the
Atlantic coast of North America from Newfoundland to Florida. Although the species is sometimes split into two subspecies based on the genetic, morphological and behavioral differences between northern and southern populations, there is a wide zone at intermediate lati- tudes characterized by clinal variation in these charac- ters (reviewed in POWERS et al. 1993). It has been suggested that concordances in the geographic distribu- tion of these characters may be the result of secondary contact between previously isolated forms (POWERS and PLACE 1978; ABLE and FELLEY 1986; GONZALEZ-VILLASE- NOR and POWERS 1990; BERNARDI et al. 1993).
When two differentiated populations of a species come into contact, the cline formed at the intergrade zone will begin to erode due to gene flow unless selec- tion acts to maintain the differentiation. Estimates of gene flow between populations of F. heteroclitus suggest that while the characteristics that distinguish the north- ern and southern forms may have arisen in isolation, the clines are most likely maintained by selection (BROWN and CHAPMAN 1991). Since some allelic iso- zymes are not clinal, while others are clinally distributed with slopes varying from gradual to steep (reviewed in POWERS et al. 1993), it seems likely that the intensity and type of selection, if any, varies from locus to locus.
Corresponding author; Patricia M. Schulte, Hopkins Marine Station, Stanford University, Oceanview Blvd., Pacific Grove, CA 93950. E-mail: [email protected]
Genetics 145: 759-769 (March, 1997)
Allelic isozymes of the glycolytic enzyme lactate dehy- drogenase-B (LDH-B) vary from homozygous fixation for one allele at the northern extreme of the species range to fixation for an alternate allele in the south (POWERS and PLACE 1978). These alleles differ in their kinetic properties and are associated with differences in hatching time (DIMICHELE and POWERS 1982a), de- velopmental rate (DIMICHELE et al. !986), swimming performance (DIMICHELE and POWERS 1982b) and dif- ferential mortality in selection experiments conducted at elevated temperatures (DIMICHELE and POWERS 1991). Taken together, these studies strongly suggest that natural selection is operating on allelic variants of
In addition to differences in LDH-B kinetics, north- ern populations have twice as much LDH-B in liver tissue as their southern counterparts (CRAWFORD and POWERS 1989). This twofold difference in LDH-B en- zyme concentration between northern and southern populations is associated with twofold differences in both the abundance of the transcript and the transcrip- tion rate of the gene (CRAWFORD and Powxs 1992) , suggesting that the differences in LDH-B enzyme con- centration are the result of changes at the level of tran- scription. It has been suggested that the differences in enzyme concentration are functionally important (CRAWFORD and POWERS 1989) because twice as much enzyme is required to maintain the same reaction veloc- ity for every 10" decrease in temperature, and the mean annual water temperature at the northern and southern extremes of the species range differs by - 12".
Ldh-B.
760 P. M. Schulte, M. GBmez-Chiarri and D. A. Powers
Although detailed mechanistic analyses of the regula- tion of transcription have been undertaken for many genes, there have been relatively few attempts to study the evolution of differences in transcriptional regula- tion within or between species (reviewed in DICKINSON 1991; but see ODGERS 1995). In this report we describe structural and functional variation in the promoter and 5’ flanking regions of Ldh-Bwithin and between popula- tions of F. heteroclitus, and address some of the genetic and evolutionary mechanisms that may be responsible for this variation.
MATERIALS AND METHODS
DNA amplification and sequencing: F. heteroclitus were ob- tained from St. Andrew’s, New Brunswick; Wiscasset, Maine; Woods Hole, Massachusetts; Stone Harbor, New Jersey; Sa- pelo Island, Georgia; and Whitney Island, Florida. Spleens were dissected, and genomic DNA was isolated by proteinase K digestion and phenol/chloroform extraction. Approxi- mately 1 kb of the Ldh-B 5’ flanking sequence was PCR ampli- fied from genomic DNA with Tuy DNA polymerase (Perkin- Elmer) using primers (FLK) AGATATATTCCAGTTTTGCT and (UTR) CTGGGATCAGAGACTGAG (94” 1 min; 55” 1 min; 72” 2.5 min; 35 cycles). Primers were designed from a sequence of the Ldh-B 5’ flanking region obtained by screen- ing a F. heteroclitus genomic library ( SEGAL et al. 1996).
PCR products were end-polished with DNA polymerase I (Klenow fragment) and blunt-end cloned into pBluescript K S (Stratagene). At least five clones per individual were se- quenced with internal primers on both strands using Seque- nise 2.0 (Stratagene). Occasionally, three substantially differ- ent sequences were present in the original sample of five clones. In most cases this was the result of length variation in microsatellites contained within the cloned sequences. The probable cause of these errors is slippage of Tag polymerase during PCR, which has been shown to result in artefactual length variation in microsatellites (HOISTEGE et al. 1994). If more than three alleles were detected, the PCR was repeated and treated as before. Majority rule consensus was used to choose the “correct” sequence or sequences.
The sequence of the Ldh-B flanking region was obtained from a closely related congeneric species, F. grandis (obtained from Galveston Bay, Texas) for use as an outgroup. We were able to obtain the 5’ flanking region of F. ‘grundis using the primers designed for F. heteroclitus. All sequences have been deposited in GenBank under accession numbers U59833- U59856. Sequence alignments are available from the authors on request.
Phylogenetic analyses: Sequences were aligned using Gene- works (Intelligenetics) followed by alignment by eye. Because of the difficulty involved in aligning microsatellite sequences and the possibility of artefactual length variation (see above), all microsatellites and regions containing gaps were eliminated from genealogical analyses. Tree topologies were obtained us- ing both maximum parsimony (MP) and neighbor-joining (NJ) methods. NJ trees were determined using the computer program MEGA (KUMAR et al. 1993). MP trees were deter- mined using both MEGA and PAUP (SWOFFORD 1991). The degree of support for internal branches of the tree was further assessed by bootstrapping with 500 replicates (FELSENSTEIN 1985) using PAUP for the MP trees and MEGA for NJ trees.
Statistical analyses: From the aligned sequences of the 23 F. heteroclitus alleles we estimated the parameter 0 (TAJIMA 1983) excluding insertions and deletions. Tests of goodness of fit to an infinite sites models were applied (TAJIMA 1989;
Fu and LI 1993), as well as a test of the concordance between polymorphism and divergence (HKA test, HUDSON et al. 1987; KKEITMAN and HUDSON 1991). To compare the levels of varia- tion in mitochondrial and autosomal genes, the HKA test was modified so that the effective population size of mitochon- drial genes was one-quarter that of autosomal genes (see ~.g. , BEGUN and AQUADRO 1991; BALLARI~ and KREITMAN 1994). Modifications were also made to take account of the different number of alleles sampled for each locus (see e.g., BERRY et al. 1991). Variation along the sequences was also investigated by making use of a “sliding window” approach (HUDSON and KAPIAN 1988). The recombination rate in the 5’ flanking sequence was estimated by calculating the recombination pa- rameter (C) based on the variance in the distribution of num- bers of sites at which pairs of alleles differ, using the method of HUDSON (1987). Linkage disequilibrium between sites was estimated using the Fisher’s exact test (WEIR 1990).
Transfection ‘assays: Portions of the 5‘ flanking sequence were obtained by PCR amplification from the cloned 5’ flanking sequences m 4 , FLl, GA2, GA4 and GA5 using primer UTRb (AGATCAGAAGAAAAGTCTGGGATCAGAGACTGAG) , in the 5’ untranslated region of the mRNA, and one of the following primers: FLK; k00 (ATAATGAAAGTTTGTGCTC; sites 585- 603 on the aligned sequences); f400 (CCnGGCACCCTCATT- TAT; sites 709-727) (Figure 1). These amplifications resulted in products containing the 5’ untranslated region of Ldh-B up to the first intron and -1000, 500 or 400 bp of 5’ flanking sequence, respectively. The PCR products were blunt end cloned into pBluescript K S and their sequences confirmed. They were then subcloned in the appropriate orientation into the luciferase plasmid pluc (all reporter gene plasmids kindly provided by Dr. MANFRED SCHARTL) and transfected into a hu- man embryonic kidney cell line (HEK 293; ATCC) to assess transcriptional activity.
Cells were plated at a density of 1 X lo6 per 10-cm dish and transfected with plasmid DNA by the calcium phosphate method (SAMBROOK et al. 1989). All transfections utilized 10 pg of the luciferase reporter gene plasmid (pluc)/Ldh-B flanking sequence construct and 5 pg of the plasmid pCMVtklacZ (containing the P-galactosidase reporter gene) as an internal control for transfection efficiency. Three days after transfection, cells were lysed and luciferase activity in the lysate was detected using the Enhanced Luciferase Assay Kit (Analytical Luminescence Laboratory). Light emission was measured with a single photon count program in a TM Ana- lytic (MarkV) liquid scintillation counter. Galactosidase activ- ity was measured spectrophotometrically using standard tech- niques (SAMBROOK et al. 1989). Results are expressed as fg luciferase per unit P-galactosidase activity. Differences in activ- ity between constructs were tested using a two-way ANOVA followed by multiple comparisons among means ( SOKAL and ROLF 1981).
The functional activity of representative full length con- structs from Maine and Florida was also assessed by direct injection of reporter gene constructs into E heteroclitus in vivo. Similar approaches have been utilized to analyze the expres- sion of genes in both large and small mammals (WOLFF et al. 1990; VON HARSDORF et al. 1993). F. heteroclitus obtained from Whitney island Florida were acclimated to 50% seawater at 20” for a minimum of 4 months. Fish were lightly anesthetized with 3-aminobenzoic acid ethyl ester (”22) and 50 pl of transfection solution was injected into the ventral trunk mus- culature between the dorsal fin and lateral line. Transfection solution consisted of phosphate buffered saline containing 50 pg of test plasmid (full length constructs ME4 or FL1 see above), 10 pg of control plasmid (CMVtk P-galactosidase), and India ink to localize the site of injection. After 24 hr the fish were sacrificed by rapid decapitation and the region

Flanking Region Evolution 76 1
All010 groupingat A: WB, ml-5; W81, BJZ Bt NJ3, UJ4, -6 , FL3-5 Ct FL1, FL2
AAAAAPATAATAATAAC GAZ ATC-~CATA G ~ , w H ~ , om KTc-F%ZZc':TFFc':ZT% g%Is TCCTCCTCCTCCTCCTCCTCC c TCCTCCTCCTCC G N - 5
TCCTCCTCCTCCTCC gnndls """T%:y&::sg $:: ATCATCATT gnndls
AATARATAAATIWATMATAAC grmdls
FIGURE l.--Stnlct1u~ of the I,&-U 5' flanking rcgion and location of PCR primers. Solid bar represents the flanking sequence numbered from the first base downstream of the 3' PCR primer (FLK, indicated by arrow) to the last base before the 3' PCR primer (UTR), including gaps introduced into the alignment. The locations of the major transcription start sites are indicated by bent arrows. Microsatellites are indicated by open boxes and the sequences for all alleles i n the sample are shown. Alleles are named for sampling site: NU, New Brunswick; MI?, Maine; \W, Woods Hole; NJ, NewJersey; GA, Georgia; FL, Florida. For clarity, the following groupings have been defined: A, all NU and ME alleles plus WHI and 'YJ2; R, NJ3, NJ4, GA6, H35; C, F I J , FL2. Other insertion/cleletions (ins/del), arbitrarily defined relative to the majority of sequences i n the sample, are indicated by gray bars and are found in the alleles as follows: sites 30-43, del I.: sgronr/i.s; sites 174-210, del FLI, FL2; 21 1-247, ins GA2, GA5; 422-434, del NJ2; 448-450, del FL2, FL5, NJ4, GA6; 464-464, del 1VH2, NJ3, FLI, H,4; .565-572, del group A, GA3, GAI; 582-583, ins I.: pondis; 624-633, del I;. gnndis; 897-899, ins W 3 .
marked with India ink was excised. A region of equivalent weight was removed from the other side of the fish to control for endogenous &galactosidase activity, which was never >lo% of the total detected. The tissue was homogenized in lysis buffer and the homogenate clarified by microcentrifuga- tion for 15 min at 10,000 X g. Luciferase and 0-galactosidase activity in the lysate were detected as described above. Three separate experiments were performed, each with three fish injected per construct.
RESULTS AND DISCUSSION
Structure of the Mh-B flanking region: Figure 1 shows the general structure of the I;. hplmoclitus Ldh-B 5' flanking region. The transcription start sites for the gene are located in a cluster between sites 1095 and 1128, with the two major start sites at 1122 and 1128 (SEGAL et al. 1996). The proximal promoter is located between sites 950 and 1150, and contains several highly conserved sequence motifs (sites 1040-1069) that are similar to the Spl transcription factor binding site (DY- NAN and TJIAN 1983). The major transcription start sites are associated with consensus initiator motifs (ROEDER 1991). Both the initiator and Spl binding sites are func- tionally important component5 of the I.: lzd~orl i lus proximal promoter (SECAL PI nl. 1996). No TATA box is present, typical of the promoters of many housekeeping genes ( DYNAN 1986).
Sequence variation in the flanking region: One strik- ing difference between alleles is the presence of a num- ber of microsatellites and small insertion-deletions in the promoter region (Figure 1 ) . Two sets of TCC re- peats of variable length (sites 1017-1040 and 1070- 1088; Figure 1) are located surrounding the putative Spl sites (sites 1041-1069). The basic repeat unit of the Spl site (CCCCCC) is present once in alleles NB,
MEI-M1{5, WHI, Njl and Nj2; twice in alleles WH2, NJ3, Nj4, GAI, GA2, GA3, GA5, GA4, Fldl-FL5 and E grandis; and three times in allele GA4. We have previously shown that these microsatellites are functionally important components of the i:. h~tnac l i tus Ldh-B promoter, as as- sessed by transfection into a heterologous cell line (SEGAL d nl. 1996). Two additional microsatellites are located within 200 bp upstream of the promoter: a small ATC repeat (sites 882-893) and a highly variable se- quence composed almost entirely of thymine and adenine bases (sites 798-823). While no other micre satellites are located within 1 kb upstream of the tran- scription start sites, there are at least 10 additional small insertions or deletions (Figure 1 ) .
As illustrated in Figure 2, sites that are variable within populations are fairly evenly distributed throughout the flanking region, whereas sites that vary between popula- tions are unevenly distributed. The promoter (sites 950- 1150) is the least variable part of the flanking re- gion, both within and between populations. I t has only 0.89 variable sites per 100 bp, and is less variable than silent sites within the coding region (which has 1.4 vari- able sites per 100 bp; BERNARDI PI nl. 1993). Low variabil- ity has been reported for the promoter regions of other genes (KREITMAN and HUDSON 1991; ODGERS PI nl. 1995), consistent with functional constraints. In con- trast to the low variability in the promoter region, there is a peak of variability between the Maine and Florida populations near the central region of the 5' flanking sequences (Figure 2). In this central region, the average painvise difference between alleles from Maine and Florida populations is approximately five times that of the fourfold degenerate sites in the coding region (or 7.46 per 100 bp), but this region is not highly variable within populations (Table 1; Figure 2).

762 P. M. Schulte, M. G6mez-Chiarri and D. A. Powers
R
0 - . - I . - .- . - . - . -. -. -. - . - . - . " ,.. -.. ,"""", . , - . t . . " 8" I I I I
0 200 400 600 800 1000
site
FIGURE 2.-Sliding window comparisons of average pair- wise difference between Ldh-B 5' flanking sequences. Fine solid line represents average painvise difference between Maine and Florida alleles, bold line represents average pair- wise difference within the Florida population, dashed line at bottom, average pairwise difference within the Maine popula- tion. A window of width 100 bp was placed at the 5' end of the aligned sequences and the average number of nucleotide differences (excluding all insertions and deletions) between pairs of sequences was calculated for sites contained within the window. The resulting value was assigned to the nucleo- tide site at the center of the window. The window was ad- vanced in 25-bp increments. The actual width of the window was adjusted to contain 100 sites not including deletions and unalignable regions.
Geographical population structure: Most alleles of the 5' flanking region fall into one of two distinct groups, one containing all of the alleles from Maine and another containing all of the alleles from Florida (Figure 3). Alleles from Maine and Florida populations are almost as divergent from each other as they are from the outgroup, F. grundis. The average pairwise number of variable sites is 39.2 between Maine and Florida populations of F. heteroclitus, whereas the aver- age pairwise number of variable sites between F. grandis and F. heteroclitus from Maine or Florida is 41.6 and 42.6, respectively. There is higher variability within the Florida population than within the Maine population (average pairwise difference within Florida and Maine populations is 12.9 and 0.64 sites, respectively; Figure 3; Table 1). Geographically intermediate populations from New Jersey and Woods Hole contain both Maine- like and Florida-like alleles. As a result, these popula- tions have the highest level of sequence variability (aver- age pairwise difference within the New Jersey sample is 22.9 sites).
Results from previous studies using both nuclear and mitochondrial markers suggest a sharp disjunction be- tween northern and southern F. heteroclitus genotypes (GONZALEZ-VILLASENOR and POWERS 1990; BERNARDI et ul. 1993). However, in phylogenetic analyses of the 5' flanking sequences, several of the Georgia alleles (GAl, GA2, GA3, GA4) appear to be intermediate between
Maine and Florida alleles (Figure 3). These alleles could represent ancestral forms or recombinants be- tween Maine and Florida alleles. Putative recombinants have previously been observed in samples of the Ldh-B coding region from geographically intermediate popu- lations (POWELL et al. 1992; BERNARDI et nl. 1993).
Recombination: The relative rates of recombination and mutation in a gene region can be estimated based on the variance in the distribution of numbers of sites at which pairs of alleles differ (HUDSON 1987). Taking into account only point mutations, we estimate the re- combination parameter ( C ) to be 22.0 for the 5' flank- ing region (0 = 30.87; S: = 242; N= 23; HUDSON 1987). Since C = 4Nc (where c is recombination rate) and 0 = 4Np ( p = mutation rate), the ratio C0 should be an index of the relative rates of recombination and mutation. The C0 ratio for the Ldh-B flanking region in F. heteroclitus is -0.71, suggesting that recombination and mutation are about equally frequent on a per nucle- otide basis. However, this estimate assumes that the al- leles were drawn from a single randomly mating popula- tion. Because populations of F. heteroclitus throughout the species range may not satisfy this assumption, we also estimated the parameter C using only alleles from the Georgia and Florida populations. In this case, the CO is -1.3, suggesting again that recombination and mutation are about equally frequent in the 5' flanking region (0 = 30.58; S: = 206; n = 11; C = 40).
The results of the Fisher's exact test (WEIR 1990) suggest that the variable sites in the Ldh-B flanking se- quence are not in strong linkage disequilibrium (Figure 4). However, there is some indication that the flanking region can be divided into three major recombining blocks: one containing the promoter region, another in the central region of the sequence, and a third group upstream. We subdivided the sequences into these blocks, and constructed three separate phylogenetic trees (Figure 5). Trees constructed for the upstream and central regions suggest different but reasonably well supported genealogies, which is consistent with re- combination. For example, alleles GAl-GA4, which ap- pear intermediate between Maine and Florida alleles in Figure 3, group with some of the Florida alleles when only the upstream region is considered (Figure 5) and with the Maine alleles and F. grandis when only the central region is considered (Figure 5). While the hy- pothesis of recombination between Maine and Georgia alleles is reasonable, the possibility of recombination with a F. grandis allele cannot be dismissed a priori, since the ranges of F. heteroclitus and F. grandis overlap in northeastern Florida (LEE et al. 1980), and hybridiza- tion within the genus is common (NEWMAN 1908). As well as the variable positioning of alleles GAI-
GA4, there are additional differences between the phy- logenies illustrated in Figure 5 that suggest other re- combination events may have occurred. The genealogy of the region containing the promoter (sites 655-1169)

Flanking Region Evolution
. - i d a m < . . . . . . . . + . - i n 0 . c ? q y c ? * * ' c ? . : q q q q 3 o m a . 5 . . . . . . . . . . . . . c ? : : . : 3 o m m 3 o m m
W . . . . . . u . . v v u . . . . u . : c ; c ; c ; P . v . ~ v v v v v v v v v v v v v v H . . . . .
m m m g : : : : : . . . * H ' . < < < . H H H & G & E - E - E - H H H H H a < . . < < < . m r . m 3 : : : . . . . . . . . . . . . . . . . . . . . c o a m ~ . . . . . . " + " + f + + + : $ : m a 4 B . . . u . . : P + . . . . . . . . . . . . . m m 4 : : : : : ; : : : : : : : r : . : : : : : : : : : + . . . . . . . . m m m m - s - s $ : : : : ; ; : : . . . . . . , . . . . . . . . Co-sd M . . : c ? : j % $ : j ; 1 4 . . m * a m m - s v . . u . . . ' H . ~ H H H B y H y y y y y y y y m m m g ; : : : : ; : ; : . . . . 5 , . . . . . . . m N a H . . . v . ~ c ; c ; 4 ~ v < u c ; v v v v v v i . < < . . . . r . r . m u . H . . H H : y y ; E - ! € + H H H H H H . $ : : $ P P :
*i
. . . . . . . . . m m d m m m mr.m
E- . . . . . . . . cor.4 u . . . . . . . . . . . .
m a 0 . . . . . . . . . . . . . m - s m . . . . . . . . . . . .
. . . . . . . . . . . . . m m m . . . . . . . . Q
Y
E z g s : : : : : ; : : ; $ 4
8 : : : : : : , : :jjj,,,jjjjjjj; a m m
S g k s : : : : . . . H . ' - 4 : . H H : 2 2 . B : 2 + 3 j 3 3 3 3 j 3 3 p
: E % g : : : : : : P : : : : . H 3 E : : : : : : : : : : : . . . . H . . . . . . . m&s g g : : : : : : P . . . . . . . . . . . . . ::: 5
s : : : : : : : : : : : ? ; e ; : : : : : : * E-2
1 0 F
;:%j::.;;....
4 m r . g : : f
: : z g : : : : : : 5 . M . . . . . . . . . . . : ; + + : 4 $ + 2 + " + + + ? 2:s
. . . . . . . . . . . .
. . . . . . . . : c ? c ? , : c ? : : : : : : c ?
ar.3
v&$ E- . . . . . . . . . . . . H H y y 4 y y 1 : y y y y E-
a m m u , . : y : : H H . . . H H . . H e y
m a d E- . ' . v .
= m - s m u . m - s m W . : : y : : : . 2
ar.N
u . . . . . . . . . . . . . . . H . . . . . . , a a 0 u
. . . . . . . . . . v . . . . .
cr; . . . . . : y ; : ; ; : : : : ; ; ; . . . . . ;$;< 8 z 2 : g : : : : : . . . . ; + : : : : : : . : a 0 4 W
. . . . . . . . . . . . . . . . . . . . . . . . . . . . E i . . . . . " . ' " ' ' . . . . . ~ . . . . . . . . . . . W . , . . . . . .
m m * . . . . . . . . . . . v . u . v u . . . . v u . H . . c ; & . . . . . B U U U U B .
. . . . . . . . . . . . .
: $ : : $ $ : ; ; ; + + + + + + + . * 0 m 3 : : : : : . u . . v u . . . u u u u u u v . . E - . . H H . . . . H H H H H H H c ?
. .
. v u . g z g k g : : : : : V
. * m m
p 2 ; ; ; ; ; . . B . , 1 : y , h y . . . . € + E - H y H H y 1 32: 3.i
z g z 5 : . ' 1 : 1 : c ? ; . O W . ' * . W W q c ? W a W < { J z % 2 H . * ' . . . v . . . . . . . . : j 1 : j $ : : + + j j j j j j j +
E ; ; ; ; ; : y : : y y $ y y y y y y y y u v v ;;;E%
. . . . . . . , v . . v u . * , . W V V V V V V .
. H H . * . . H H
* m N u . . . . . . a . . m a . . , . W W a W W W W
:E2 W . . . . . . . . . . . . u . . . . . . ? ? ? .
z z g v . . . . . y 5 1 : $ + + + + - 4 $ + $ + + + + +
g u . . : $ : : : : : : . .E- m a * '& y ; u . . . . . . . . . . . . . . . . . . . . .
. H . . . y . ' y H H
. . . . . . . . . . . . . . . . . . . . . . m a a
N r . 4 B : ; ; : : : : c ; : ; : Nr.O
. H . : y y y 1 a . . . . . . . . . . . : c ? : : g : . . . . . NCOCO
3 1 : : : : 1 9 : : P C ? ? 1 : ~ : c ? : : c ? ? c ? : m - s a
H : : c ?
: j : : : : : : P : $ : $ $ : : : + 3
d o m a . . . . . . . . . * E - . . . . . . . . . . B B . . . . . : + : : + : : $ U U . + a P + + P 2 4 4 0
* . . H H H H B H B : $ r l m + v . . . . . . '5 €+ . . . . . . . . . . . : $ $ : P . . . . . 4 4 N
5 . . . . . . . . . . . H . . : c ? 4 m m W . . : E : ; + + ; : . 4 - s m $
. O W : y : c ? c ? : : : 1 = E ; Q
; : p ; : : + + ; 1 : $
$ 2 5 : : : : : : : : : c ? c ? : . . w j j + + ; @ E
3 4 % : : : - m a . . . : : : : : , : : : : : : : + m m N r .
u . . H : j : : 2 2 3 3 2 2 j ; j j j 3 3 : 4 0 m $ : . . . . : g : . . . . . . . . . . . : : : ?
* E -
' H H H . m * * r n d a b . . . . . .
v . . . . . . . . . H M . . . . . . . . . . . . . .I . . . . . . H . * * : c ? ? . H B & & & G H H H & B B € + H ' . . * : c ? : ' c ? c ? c ? &
m j . . . . . , H . . H H . . . . m c o m . . . . . . . . . . .
In 2 . . . . . . . H . . . . . . . . . . . . . . . yl: . . . . . . . . . . . . . . . . . . . . . . . . . . . . . . . . . . . . . . . . . . . . . * . . . . . . . . u u u u u . . . . . . .
. . . . . . . . . . . . . 4 * m
a 4 4 -
€+ . . . . . . . . . . . . . . . . . . .
.a 0 N W . . . . . C n d B . . . . . m a M
r.m W r.a W . . . . . . . . . . . < . . . . . . . . . . mr. a m m u . . . . .
. . . . . . . . . . . . : : : : . . . . . . . . . . . . . . . . . . . . . . . . .
. . . . . . . . . . . . . . . 2
. ~ V V H H V H . . .
v u *
. . . . . . . . . . . . . . . . . . . N a ~ . . ' . " . . " " . ' . ' . ' ' .
W ' H
. . . . * v . v ~ v v v v v v v v v * a E - . . . . . . . . . . . . u . . . . . . . . . .
N m . . . . . . . . . . . . . . . . . .
* 1 8 @ Z I $ @ a a E E E E E Z ~ ~ z ~ z z o o o o u u t W E 4 2 ~ w m n * q $ i % q q q , m n *
763
~

764
ME1 ME2 ME4 ME5 -ME3
-NB , WH1
GA4
I
NJ4 GA6
I F. grandis
FIGVRE 3.-Phylogenetic relationships among lactate dchy- drogenase-€3 flanking sequences of hp/n-oc/i/?c.r from various populations along the Atlantic coat of North America. This tree was constructed using the neigl1bor:joining mcthod using only transversions. All other methods of phylogenetic recon- struction resulted i n similar trees. Numhrrs along the branches of the tree are the percenragrs o f .500 bootstrap replicates supporting a particular cladc. For clarity, only hoot- strap values of 50% or greater are shown. /;/,, Florida: G A , Georgia; ,?/, New Jersey; 11Vf. M'oods Hole; M / C , " k i n C : "v~/j, New Brunswick. Numbers identify allrltx Thc following al- leles were drawn from heterozygous indi\~idrlals: "2, <Lf/Cj'; XJ2, NJ4; FI-2, H.4.
nucleotide site #
is particularly difficult to reconstruct. Although the three major groups o f alleles (Maine-like, FI,l-like and FIAike) arc still apparent, no well supported geneal- o t g y can be determined for many of the sequences and a large number of conflicting phylogenies are equally good. Since results of this kind are expected when re- constructing the genealogies of sequences that have undergone rccombination (HEIN 1993), these result5 are consistent with frequent recombination in the pro- moter region, although i t should be noted that when the data are partitioned, statistical power to detect link- age disequilibrium may be vey weak.
The genealogies i n Figure 5 are based only on point mutations. However, the majority of the variation in the promoter is due to length variation in microsatellites. To further address the possibility of recombination within the promoter, we performed Fisher's exact test5 to determine whether the alleles at the microsatellites are linked. There was no significant evidence of linkage disequilibrium (data not shown), suggesting that re- combination may have occurred, although the possibil- ity of parallel mutations cannot be ruled out. It has been suggested that the presence of microsatellites may increase the likelihood of polymerase slippage, gene conversion and recombination (see DOVER 1993 for re- view), which provides a potential mechanism for recom- bination i n the microsatellite-rich IAh-B promoter of I< hrtprorlillrs.
Tests of neutrality: The hypothesis that a11 mutations in the 3' flanking region are selectively neutral can be tested in a variety of ways. The Tajima test for data from a single locus (T..!p.,\ 1989) compares the estimate of H based on the average number of pairwise differences to that based on the number of segregating sites. The test of FL and Lr (1993) with outgroup compares esti- mates of the number of segregating sites to the number of mutations on external branches expected under neu- trality. The results of these test5 as applied to the flank- ing region and t o previously published IAh-B cDNA and
85 92 131 262 267 301 316 455 472 480 481 482 488 498 499 510 537 545 635 746 832 841 981 1095 1165
PC 0.01
::7 0.2
85
131 92
262 267 301 316 455 472 480 481 482 488 498 499 510 537
635 545
746 832 84 1
1095 981
1165
FIGC'RF. 4.-Fishrr's exact test for linkage disequilih rium for the (korgia and Florida populations. Recause of the \ c y large number of variable sites, we show only those sites with nvo alleles and for which the rare allele is found in more than three individuals.

Flanking Region Evolution 765
-tu? - ME4 FIGURE 5.-Maximum par-
. WHl 97. ME1 ME3 gions of the Ldh-l3 5' flank- . NE
ME2 -. &E4 . ME5
. NE roo ME2 100 .ME5 ing sequence: sites 1-454, ' ME5 ' ME3
ME4
" W l " M E 3 simony trees for three re-
. ME1
. WHl
- NJl . NJ2
- NE .ME2 ME1 1-454 50% majority rule
.WHl
45.5-654,;655- 1169. Sites
consensus of 10 trees; sites .Fw dtu? 455-654 generate a single
sites 6.5.5-1 169 50% major-
rNJ3 NJl
75
equally parsimonious trees. wH2
FL4 most parsimonious tree;
flanking sequence, major .N - €a - +!a Bar below represents the
- 1 0 0 .FL5 .NJ4 -GAB ity rule consensus of 53
-GAB
56 n 1
-NJ4 GA1*
-NJ4 . GA6 . NJ3
- WH2 GA3*
transcription start sites are
.Fu GA5 above branches indicate
replicates (expressed as - percentages). All values above 50% are shown.
GA4 at 1 122 and 1128. Numbers
F. Orenao . FL4
" W H Z
O M * F. g m bootstrap values for 500
site 1 455 655
mitochondrial cyt-b (cyt-b) data (BERNARDI et nL 1993) population. This result is consistent with either second- are presented in Table 2. There is no evidence for de- ary intergradation between northern and southern parture from neutrality when these tests are applied to forms, or balancing selection (Fu and LI 1993). Because pooled data from all populations, although both the data are not available for the other loci in the New Fu and LI (1993) and TAJIMA (1989) tests tend toward Jersey population, we cannot distinguish behveen these slightly negative values. Slightly negative values are to hvo possibilities, but previous studies (GONZAL~EZ-VIL be expected when one or a few sequences are drawn LASENOR and POWERS 1990) have also suggested that from several different geographic regions, since such a clines in F. hetmoclitzls may be the result of secondary sample is likely to have an excess of unique or low intergradation. frequency polymorphisms. When the approach of TA- The negative D-statistic for the flanking region of the .JIMA (1989) is applied to each population separately, Maine population (Table 2) suggests that the alleles in there is no evidence for departures from neutrality for this population are of recent origin, which is consistent any of the loci (Table 2). On the other hand, the Fu with a number of interpretations including purifying and LI (1993) test rejects the null hypothesis that all selection, background selection (CHARLESWORTH et nl. sites are neutral in the 5' flanking region for the Maine 1993), selective sweep, population bottleneck, or rapid and New Jersey populations, but not for the Ldh-I3 cod- population expansion (Fu and LI 1993). Purifying selec- ing region or cyt-b (Table 2). The difference between tion and background selection are unlikely in this case the two tests may reflect the low sensitivity of the TAJIMA because they would be expected to influence variation (1989) analysis when sample sizes are small (see SI- in all populations. Since Maine populations have lower MONSEN et d . 1995 for discussion). variability than southern populations for most molecu-
The positive D-statistic in the Fu and LI (1993) test lar markers (POWERS et al. 1993), a population bottle- for the flanking region in NewJersey population (Table neck or rapid population expansion are more reason- 2) suggests that there are two ancient alleles within the able explanations for the departures from neutrality in
TABLE 2
D statistics for various region of the F. heteroclitus genome
5' flanking region L d h B cDNA Cytochrom-b
Population Tajima FLI and Li Tajima FLI and Li Tajima FLI and Li
AI 1 -0.82 -0.72 -0.18 -0.17 -0.29 -0.73 North -0.62 - 1.99* -0.59 -0.85 -0.54 0.12 New Jersey 0.27 1.91* NA NA NA NA South -0.12 -0.75 -0.44 -0.77 -0.80 -0.89
Tajima D statistics are calculated as in T A ~ A (1989), FLI and Li D-statistics (with outgroup) are calculated as in Fu and LI (1993) using F. grandis as outgroup for the 5' flanking region and I;. pnruipinnzls as outgroup for Ldh-l3 cDNA and cytochrome- b. Ldh-B cDNA and cytochrome-b sequences from BERNARDI d al. (1993). Populations are as follows: North includes Maine and New Brunswick for the 5' flanking region; Maine and Nova Scotia for cDNA and cytochrome-b. South includes all individuals from Georgia and Florida for all loci. *Significant D-statistics, P < 0.05. NA indicates data not available.

766 P. M. Schulte, M. Gomez-Chiarri and D. A. Powers
TABLE 3
HKA tests for Mh-B 5‘ flanking region, coding region and cytochrome-b (cyt-b)
Ldh-B 5’ flanking LdhB coding cyt-b X S
Polymorphism (N) 5 ( 6 ) 6 ( 6 ) 2 (4) Flanking and coding Polymorphism (S) 29 (4) 6 (4) 5 (4) 4.95*
Divergence (N us. S) 41.8 5.8 4.5 11.24*** Polymorphism (N)/divergence 0.12 1 .03 0.44 Cyt-b and coding Polymorphism (S)/divergence 0.69 1.03 1.11 2.9
Flanking and cyt-b
The HKA test of HUDSON et al. (1987) has been modified to take into account the difference in effective population size between nuclear and mitochondrial genomes and the fact that there are different sample sizes for the two loci. Variation within populations is calculated as number of polymorphic sites within Maine, New Brunswick and Nova Scotia (N) or Florida (S). Divergence between populations is average painvise difference between N and S. “Significant, P < 0.05; ***Significant, I-’ < 0.001. Sample size indicated in parentheses.
the FU and LI tests. Based on results from a variety of other markers, we have previously suggested that the northern populations may have undergone a popula- tion expansion (CASHON et ul. 1981; POWERS et al. 1986, 1993). However, there is no indication of significant departures from neutral expectations for the Ldh-Bcod- ing region or cyt-b in the Maine population (Table 2) as would be expected if a population bottleneck or rapid population expansion had occurred. If the Fu and LI test is sufficiently sensitive to detect a population bottle- neck at cyt-b and the coding region, this discrepancy between loci suggests the possibility of a selective sweep at the 5‘ flanking region in the northern population.
The possibility that various regions of the genome are subject to different evolutionary forces can be exam- ined using the HKA test (HUDSON et nl. 1987). By com- paring the ratio of intraspecific to interspecific nucleo- tide variation at several loci, the HKA approach tests a prediction of the neutral theory that levels of polymor- phism within a species should be correlated with levels of divergence between species across all loci. This test should be able to distinguish between a population bot- tleneck, which would affect all loci, and a selective sweep, which should only affect the locus under selec- tion. We compared variation at three loci: the I d h - R coding region, mitochondrial cyt-b (BERNARDI et al. 1993) and the Ldh-B 5’ flanking region, using a modi- fied HKA test that compares average painvise difference within and between species (KREITMAN and HUDSON 1991). When polymorphism in northern and southern populations is compared to divergence between them, there is significant deviation from neutral expectations only in comparisons involving the Ldh-B 5’ flanking region (Table 3). This suggests that the deviations from neutrality are the result of variation in the 5’ flanking region rather than in one of the other two loci, possibly as a result of selection. However, the results of HKA tests should be interpreted with caution since the viola- tion of any one of the underlying assumptions may re- sult in rejection of the null hypothesis. The assumptions that may be violated by the data presented here are:
(1) no selection, (2) large constant population size, (3) no linkage between loci, (4) no recombination within a locus, and (5) no ancestral polymorphism. Violations of assumptions 3-5 are thought to make the test more conservative (see for example HUDSON et al. 1987; FORD at nl. 1994 for discussion) and thus are unlikely to ac- count for the deviations from neutrality. Therefore these results are most likely accounted for by either changes in population size or selection.
Functional analyses: If selection is acting on the 5’ flanking region, the minimal condition that must be met is evidence of some form of functional differentia- tion between alleles. To determine whether any of the sequence variability in the 5’ flanking region of E hetero- clitus has functional consequences for transcriptional regulation, we compared the ability of several randomly selected alleles from northern and southern popula- tions to promote the transcription of a luciferase re- porter gene in human embryonic kidney (HEK 293) cells. We chose to perform the initial functional experi- ments using HEK 293 due to the lack of cell lines from F. hetaroctitus and the fact that most fish cell lines and primary cultures tested showed low and variable trans- fection efficiencies (M. GOMEZ-CHIAKRI, unpublished results). HEK 293 has extremely good growth and high transfection efficiencies that maximize the sensitivity of the functional assays. This may be critical since activity differences in natural populations appear to be small (for example, see ODGERS et nl. 1995), and the twofold differences expected for F. heteroclitus Ldh-B might be essentially undetectable under many conditions.
We first assessed the luciferase activity promoted by one of the Maine alleles (ME4) and several of the most divergent alleles from southern populations (GA2, GA4, GA5, FL I ) , including two of the putative recombinants. Length variation in the microsatellites that alter the spacing between conserved, functionally important sites in the promoter does not appear to have strong effects on transcription since there are no differences in the activity of some constructs that differ in microsatellite length (e.g., GA5 and ME4; GA2 and GA4; Figure 6). In
Flanking Region Evolution 767
FL1 GA2 l- GA4 GA5 ME4
1
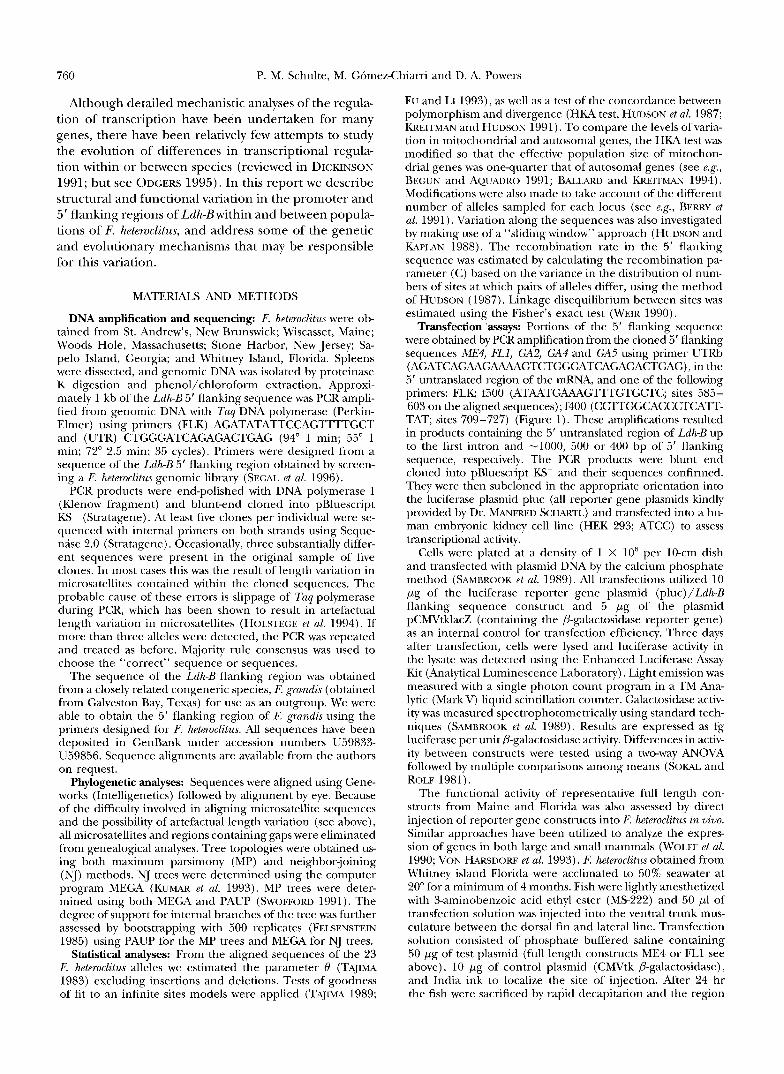
flanking region construct FIGURE 6.-Activity of Ldh-B flanking sequence constructs
ME4, GA2, GA4, GA5 and FLl when transfected into cells in culture in fg luciferase per unit @-galactosidase. Bars, mean 2 SEM ( n = 3). ME4 and GA5 are significantly different from all others P < 0.05.
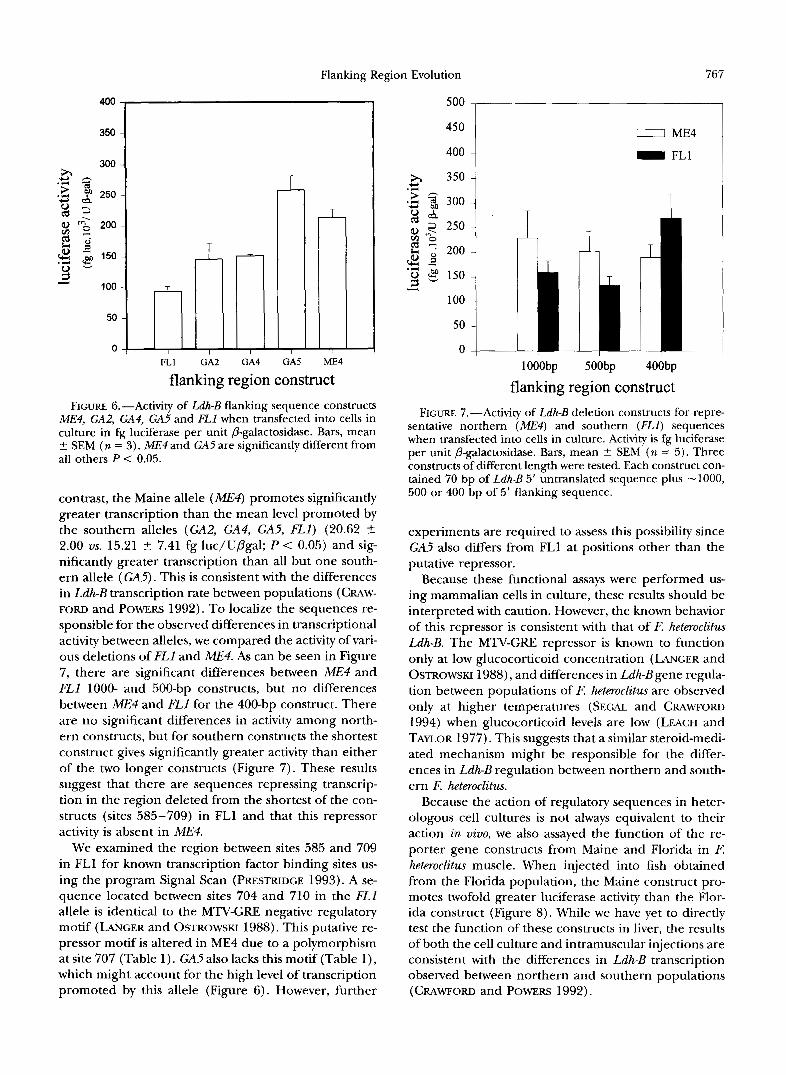
contrast, the Maine allele (ME4) promotes significantly greater transcription than the mean level promoted by the southern alleles (GA2, GA4, GA5, F L l ) (20.62 -+ 2.00 us. 15.21 -+ 7.41 fg luc/Upgal; P < 0.05) and sig- nificantly greater transcription than all but one south- ern allele ( GA5). This is consistent with the differences in Ldh-B transcription rate between populations (CRAW- FORD and POWERS 1992). To localize the sequences re- sponsible for the observed differences in transcriptional activity between alleles, we compared the activity of vari- ous deletions of FLl and ME4. As can be seen in Figure 7, there are significant differences between ME4 and FLl 1000- and 500-bp constructs, but no differences between ME4 and FLl for the 400-bp construct. There are no significant differences in activity among north- ern constructs, but for southern constructs the shortest construct gives significantly greater activity than either of the two longer constructs (Figure 7). These results suggest that there are sequences repressing transcrip tion in the region deleted from the shortest of the con- structs (sites 585-709) in FLl and that this repressor activity is absent in ME4.
We examined the region between sites 585 and 709 in FLl for known transcription factor binding sites us- ing the program Signal Scan (PRESTRIDGE 1993). A se- quence located between sites 704 and 710 in the FLl allele is identical to the MTV-GRE negative regulatory motif (LANGER and OSTROWSKI 1988). This putative re- pressor motif is altered in ME4 due to a polymorphism at site 707 (Table 1). GA5also lacks this motif (Table l ) , which might account for the high level of transcription promoted by this allele (Figure 6). However, further
500 1
450 1 400
1
I ME4 - FL1
I I
IOOObp 5OObp 400bp
flanking region construct FIGURE 7.-Activity of Ldh-B deletion constructs for repre-
sentative northern ( M E $ and southern (FLl) sequences when transfected into cells in culture. Activity is fg luciferase per unit P-galactosidase. Bars, mean 5 SEM (n = 5 ) . Three constructs of different length were tested. Each construct con- tained 70 bp of Ldh-B 5' untranslated sequence plus -1000, 500 or 400 bp of 5' flanking sequence.
experiments are required to assess this possibility since GA5 also differs from FL1 at positions other than the putative repressor.
Because these functional assays were performed us- ing mammalian cells in culture, these results should be interpreted with caution. However, the known behavior of this repressor is consistent with that of F. heteroclitus Ldh-B. The MTV-GRE repressor is known to function only at low glucocorticoid concentration (LANGER and OSTROWSKI 1988), and differences in Ldh-B gene regula- tion between populations of F. heteroclitus are observed only at higher temperatures (SEGAL and CRAWFORD 1994) when glucocorticoid levels are low (LEACH and TAYLOR 1977). This suggests that a similar steroid-medi- ated mechanism might be responsible for the differ- ences in Ldh-B regulation between northern and south- ern F. heteroclitus.
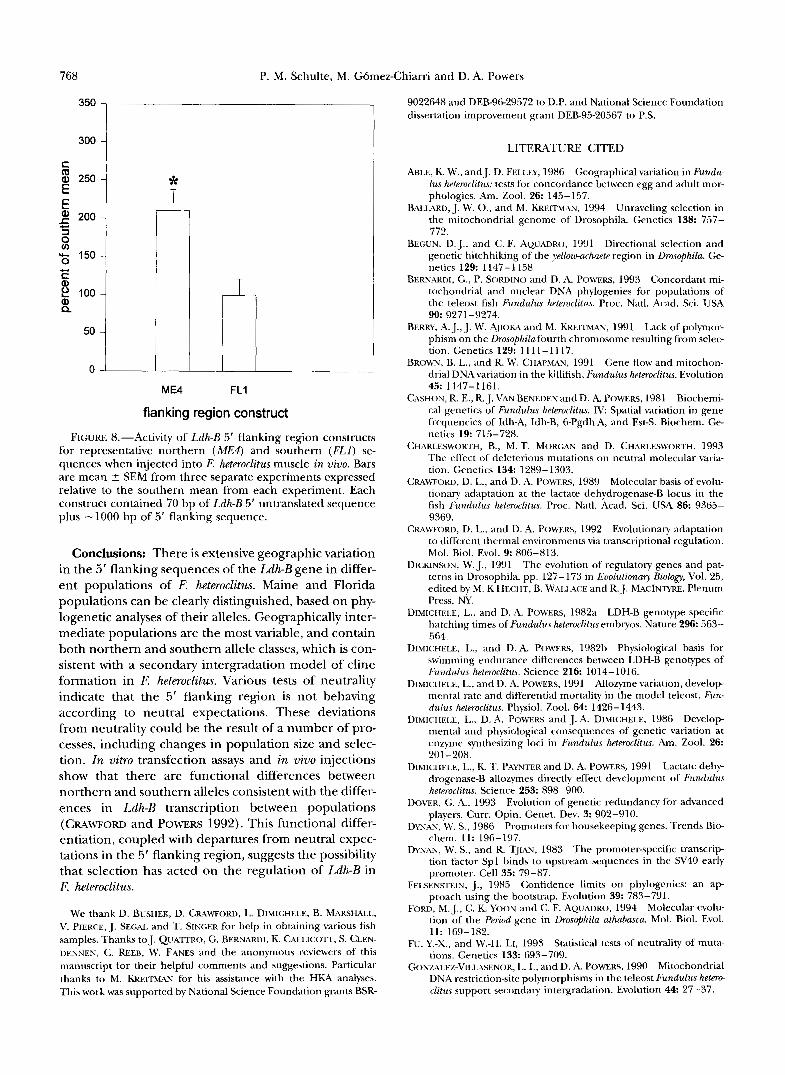
Because the action of regulatory sequences in heter- ologous cell cultures is not always equivalent to their action in vivo, we also assayed the function of the re- porter gene constructs from Maine and Florida in F. heteroclitus muscle. When injected into fish obtained from the Florida population, the Maine construct pro- motes twofold greater luciferase activity than the Flor- ida construct (Figure 8). While we have yet to directly test the function of these constructs in liver, the results of both the cell culture and intramuscular injections are consistent with the differences in Ldh-B transcription observed between northern and southern populations (CRAWFORD and POWERS 1992).
P. M. Schulte, M. G6mez-Chiarri and D. A. Powers 768
350
300
S
8 250 E C 5 200 c 3 0 u)
U- 150 0
c Q)
Q) Q
c.
2 100
50
0
*
I I 1
T
ME4 FLI
flanking region construct
FIGURE 8.-Activity of Ldh-B 5' flanking region constructs for representative northern (ME#) and southern (FLI) se- quences when injected into F. heteroclitus muscle in vivo. Bars are mean 5 SEM from three separate experiments expressed relative to the southern mean from each experiment. Each construct contained 70 bp of Ldh-B 5' untranslated sequence plus -1000 bp of 5' flanking sequence.
Conclusions: There is extensive geographic variation in the 5' flanking sequences of the Ldh-B gene in differ- ent populations of F. heteroclitus. Maine and Florida populations can be clearly distinguished, based on phy- logenetic analyses of their alleles. Geographically inter- mediate populations are the most variable, and contain both northern and southern allele classes, which is con- sistent with a secondary intergradation model of cline formation in E heteroclitus. Various tests of neutrality indicate that the 5' flanking region is not behaving according to neutral expectations. These deviations from neutrality could be the result of a number of pro- cesses, including changes in population size and selec- tion. In vitro transfection assays and in vivo injections show that there are functional differences between northern and southern alleles consistent with the differ- ences in Ldh-B transcription between populations (CRAWFORD and POWERS 1992). This functional differ- entiation, coupled with departures from neutral expec- tations in the 5' flanking region, suggests the possibility that selection has acted on the regulation of Ldh-B in F. heteroclitus.
We thank D. BUSHEK, D. CRAWFORD, L. DIMICHELE, B. MARSHALL., V. PIERCE, J. SEGAI. and T. SINGER for help in obtaining various fish samples. Thanks to J. QUATTRO, G. BERNARUI, K. CAI.I.ICOTT, S. CLEN- DENNEN, C. REER, W. EANES and the anonymous reviewers of this manuscript for their helpful comments and suggestions. Particular thanks to M. KREITMAN for his assistance with the HKA analyses. This work was supported by National Science Foundation grants BSR-
9022648 and DEB-96-2957'2 to D.P. and National Science Foundation dissertation improvement grant DEB-95-20567 to P.S.
LITERATURE CITED
ABLE, K. W., and J. D. FELLXY, 1986 Geographical variation in Fundu-
phologies. Am. Zool. 26: 145-157. lus heteroclitus: tests for concordance between egg and adult mor-
BALIARD, J. W. O., and M. KREITMAN, 1994 Unraveling selection in the mitochondrial genome of Drosophila. Genetics 138: 757- 772.
BEGUN, D. J., and C. F. AyUADRo, 1991 Directional selection and genetic hitchhiking of the yelloru-achaete region in Drosophila. Ge- netics 129: 1147-1158
BERNMIDI, G., P. SORDINO and D. A. POW.RS, 1993 Concordant mi- tochondrial and nuclear DNA phylogenies for populations of the teleost fish Fundulus heteroclitus. Proc. Natl. Acad. Sci. USA 90: 9271 -9274.
BERRY, A. J., J. W. A ~ I O K A and M. KREITMAN, 1991 Lack of polymor- phism on the Drosophilafourth chromosome resulting from selec- tion. Genetics 129: 11 11 -1 117.
BROWN, B. L., and R. W. CHAPMAN, 1991 Gene flow and mitochon- drial DNA variation in the killifish, Fundulus hpteroclitus. Evolution 45: 1147-1161.
CASHON, R. E., R. J. VAN BENEDEN and D. A. POWERS, 1981 Biochemi- cal genetics of Fundulus heteroclitus. N Spatial variation in gene frequencies of Idh-A, Idh-B, GPgdhA, and Est-S. Biochem. Ge- netics 19: 715-728.
CHARLESWORTH, B., M. T. MORGAN and D. CHARLESWOKTH, 1993 The effect of deleterious mutations on neutral molecular varia- tion. Genetics 134: 1289-1303.
CR.\MTFOKU, D. L., and D. A. POWERS, 1989 Molecular basis of evolu- tionary adaptation at the lactate dehydrogenase-B locus in the fish Fundulus heteroclitus. Proc. Natl. Acad. Sci. USA 86: 9365- 9369.
CRAUTOKU, D. L., and D. A. POUTRS, 1992 Evolutionary adaptation
Mol. Biol. Evol. 9: 806-813. to different thermal environments via transcriptional regulation.
DICKINSON, W. J., 1991 The evolution of regulatory genes and pat- terns in Drosophila, pp. 12'7-173 in Evolutionary Biology, Vol. 25, edited by M. K HECHT, B. WAI.IACE and R. J. MAC IN^. Plenum Press, NY.
DIMICHFXE, L., and D. A. POWERS, 1982a LDH-B genotype specific hatching times of Fundulus heteroclitus embryos. Nature 296 563- 564.
DIMICHELE, I.., and D. A. POWERS, 1982b Physiological basis for swimming endurance differences between LDH-B genotypes of Fundulus heteroclitus. Science 216: 1014-1016.
DIMI(:HEI.F., L., and D. A. POWERS, 1991 Allozyme variation, develop- mental rate and differential mortality in the model teleost, Fun- dulus heteroclitus. Physiol. Zool. 64: 1426- 1443.
DIMICHELE, I,., D. A. POWERS and J. A. DIMICHELE, 1986 Develop- mental and physiological consequences of genetic variation at enzyme synthesizing loci in Fundulus hetmorlitus. Am. Zool. 26: 201-208.
DIMI(:HEI.F., L., K. T. P A Y N T E R ~ ~ ~ D. A. POWERS, 1991 Lactate dehy- drogenase-B allozymes directly effect development of Fundulus heteroclitus. Science 253: 898-900.
DOVFR, G. A., 1993 Evolution of genetic redundancy for advanced players. Curr. Opin. Genet. Dev. 3: 90'2-910.
DYNAN, W. S., 1986 Promoters for housekeeping genes. Trends Bio- chem. 11: 196-197.
DYNAN, W. S., and R. TJIAN, 1983 The promoter-specific transcrip- tion factor Spl binds to upstream sequences in the SV40 early promoter. Cell 3 5 79-87.
FELSENBI'ETN, J., 1985 Confidence limits on phylogenies: an a p proach using the bootstrap. Evolution 39: 783-791.
FORD, M. J., C. K. YOON and C. F. AQKJAURO, 1994 Molecular evolu- tion of the Pm'od gene in Drosophila athabasca. Mol. Biol. Evol.
Fu, Y.-X., and W.-H. LI, 1993 Statistical tests of neutrality of mum- tions. Genetics 133: 693-709.
G O N ~ . ~ ~ ~ L E ~ - V I I . ~ A S E N O R , L. I., and D. A. POWERS, 1990 Mitochondrial DNA restriction-site polymorphisms in the teleost Fundulus hetere &us support secondary intergradation. Evolution 4 4 27-37.
11: 169-182.

Flanking Region Evolution 769
HEIN, J., 1993 A heuristic method to reconstruct the history of se- quences subject to recombination. J. Mol. Evol. 36: 396-409.
HOLSTE~~E, F. C. P., P. C. VAN DER VI.IET and H. T. M. TIMMERS, 1994 Instability of human TATA-binding protein CAG triplet repeats duringamplification by PCR. Biochem. Biophys. Acta 1219: 157- 159.
HUDSON, R. R., 1987 Estimating the recombination parameter of a finite population model without selection. Genet. Res. 17: 245- 250.
HUDSON, R. R., and N. L. KAp~kv, 1988 The coalescent process in models with selection and recombination. Genetics 120: 831- 840.
HUDSON, R. R., M. KREITMAN and M. AGUADE, 1987 A test of neutral molecular evolution based on nucleotide data. Genetics 116: 153-159.
W, H. J., W. HENDNKS, Mi. W. DE JONG, N. H. LUBSEN and J. G. SCHOENMAKERS, 1993 Duck lactate dehydrogenase B/epsilon- crystallin gene. Lens recruitment of a GC-promoter. J. Mol. Biol.
KRE~TMAU, M., and R. R. HUDSON, 1991 Inferring the evolutionary histories of the Adh and Adh-dup loci in Drosophila melanogaster from patterns of polymorphism and divergence. Genetics 127: 565-582.
KUW, S., K. TAMURA and M. NEI, 1993 MEGA: MolecularEvolution- aly Genetics Analysis, version 1.0. The Pennsylvania State Univer- slty, University Park, PA.
LANCER, S. J., and M. C. OSTROWSKI, 1988 Negative regulation of transcription in vitro by a glucocorticoid response element is mediated by a trans-acting factor. Mol. Cell. Biol. 8: 3872-3881.
LEACH, G. L., and M. H. TAYLOR, 1977 Seasonal measuremenu of serum glucose and serum cortisol in a natural population of Fundulus heteroclitus L. Comp. Biochem. Physiol. 56A 217-223.
LEE, D. S., C. R. GILBERT, C. H. HOCUTT, R. E. JENKINS, D. E. MCALLIS TER ~t al., 1980 Atlas of North Amm'can Freshwater Fishes. North Carolina State Museum of Natural History,
NEWMAN, H. H., 1908 The process of heredity as exhibited by the development of Fundulus hybrids. J. Exp. Zool. 5: 503-571.
ODGERS, W. A., M. J. HEALY and J. G. OAKESHOTT, 1995 Nucleotide polymorphism in the 5' promoter region of esterase 6 in Drosqph-
Genetics 141: 215-222. ilu mela~zoguster and its relationship to enzyme activity variation.
POwFI.I., M. A,, D. L. CRANFORD, T. LAUERUN and D. A. POWERS, 1992 Analysis of cryptic alleles of Fundulus heteroclitus lactate dehydrogenase by a novel allele-specific polymerase chain reac- tion. Mol. Mar. Biol. Biotechnol. 1: 391-396.
PON'ERS, D. A., and A. R. PIACE, 1978 Biochemical genetics of Fun- dulus heteroclitus. I. Temporal and spatial variation in gene fre- quencies of: Ldh-B, Mdh-A, Gpi-B and Pgm-A. Biochem. Genet.
229 849-859.
16: 593-607.
POWERS, D. A,, 1. ROPSON, D. BROWN, R. J. VAN BENEDEN, R. CASHON et al., 1986 Geographic variation in Fundulus heteroclitus. Am.
POWERS, D.A., M. SMITH, I. GONZALEZ-VILLASENOR, L. DIMICHELE, D. CRAWORD et aZ., 1993 A multidisciplinary approach to the selectionist/neutralist controversy using the model teleost Fundu- lus heteroclitus, pp. 43-107 in Oxfwd Survey of Evolutionaly Biology, Vol. 9, edited by D. FUTUYUMA and J. ANTONOWCS. Oxford Uni- versity Press, Oxford.
PRESTRIDGE, D. S., and G. STORM^ 1991 Signal Scan 3.0: new data base and program features. Computer Appl. Biosciences 9: 43- 108.
ROEDER, R. G., 1991 The complexities of eukaryotic transcription preinitiation complex assembly. Trends Biochem. Sci. 16: 402- 408.
SAMBROOK, J. E., E. F. FRITSCH and T. MANIATIS, 1989 Molecular Clon- ing: A Laboratoly Manual. Cold Spring Harbor Laboratory, Cold Spring Harbor, NY.
SEGAL, J. A., and D. L . CRAWFORD, 1994 LDH-B enzyme expression: the mechanisms of altered gene expression in acclimation and evolutionary adaptation. Am. J. Physiol. 267: R1150-R1153.
SEGAL, J. A,, P. M. SCHULTE, D. A. PON'ERS and D. L. CRAWORD, 1996 Descriptive and functional characterization of variation in the Fundulus heteroclitus Ldh-B proximal promoter. J. Exp. Zool. 275:
SIMONSEN, K. L., G. A. CHURCHILL and C. F. AQUADRO, 1995 Proper- ties of statistical tests of neutrality for DNA polymorphism data. Genetics 141: 413-429.
SOU, R. R., and F. J. ROLF, 1981 Biometly, Ed. 2. W. H. Freeman and Co., New York.
SWOFFORD, D. L., 1991 PAW: Phylogenetic Analysis Using Parsimony. Version 3.0. Illinois Natural History Survey. Champaign, IL.
TAJIMA, F., 1983 Evolutionary relationship of DNA sequences in fi- nite populations. Genetics 105: 437-460.
TAJIMA, F., 1989 StatisticaI method for testing the neutral mutation hypothesis by DNA polymorphism. Genetics 123: 585-595.
TAKANO, T., and S. S.-L. LI, 1989 Structure of the human lactate dehydrogenase B gene. Biochem. J. 257: 921-924.
VON HARSDORF, R., R. J. SCHOTT, Y.-T. SHEN, S. F. VATNER, V. MAH- DAW et al., 1993 Gene injection into canine myocardium as a useful model for studying gene expression in the heart of large mammals. Circ. Res. 72: 688-695.
WEIR, B. S., 1990 Genetic Data Analysis. Sinauer Associates, Sunder- land, M A .
WOLFF, J. A,, R. W. MALONE, P. WILLIAMS, W. CHONG, G. ACSADI et al., 1990 Direct gene transfer into mouse muscle in vivo. Sci- ence 247: 1456-1468.
ZOO^. 26: 131-144.
355-364.
Communicating editor: W. F. EANES