freight transportation: freight pulse 40 shipper survey...
TRANSCRIPT

Morgan Stanley does and seeks to do business with companies covered in Morgan Stanley Research. As a result, investors should be aware that the firm may have a conflict of interest that could affect the objectivity of Morgan Stanley Research. Investors should consider Morgan Stanley Research as only a single factor in making their investment decision.
For analyst certification and other important disclosures, refer to the Disclosure Section, located at the end of this report.
January 11, 2016
Freight Pulse 40 Shipper Survey: Shippers' Macro Outlook Remains Relatively Unchanged
M O R G A N S T A N L E Y R E S E A R C H Morgan Stanley & Co. LLC
N O R T H A M E R I C A
Alexander Vecchio, CFA [email protected] (212) 761-6233 Ravi Shanker [email protected] (212) 761-6350 Tracy Huang [email protected] (212) 761-3373 Diane Huang [email protected] (212) 761-8290
North America Freight Transportation
In our latest shipper surveys, respondents' economic outlook remained relatively unchanged from our previous survey with sentiment continuing to trend similar to 2013 levels. Shippers continue to report high inventory levels and the % of shippers expecting to reduce inventories remains high relative to history. Volume growth expectations remain flattish for Rail and +1-2% for TL/LTL while rate growth expectations continued to decelerate across all modes. Despite ongoing improvement in Rail service reliability, shippers expect Intermodal volume growth to decelerate over the next 6 months as falling fuel prices and looser TL capacity make TL more competitive.
Freight/Macro Highlights: (1) Shippers’ Economic Outlook Remains Relatively Unchanged; (2) Automotive Shippers Most Constructive on Macro; Chemical Shippers Least Constructive; (3) Inventories Still Elevated, with % of Shippers Expecting to Reduce Inventories Still Relatively High; (4) Expectations for Capacity Tightness Continue to Decline Across All Modes ex. Barge; (5) Barge and Rail Service Levels Show the Most Sequential Improvement.
Rail Highlights: (1) Rail Volume Growth Expectations Remain at 0.5%; (2) Shippers Expect Rail Rate Growth to Decelerate in Next 6 Months; (3) More Shippers Expect Rail Spend to Remain Unchanged Though Rate Negotiations Have Become More Difficult; (4) Avg. Intermodal Discount to Truckload (Ex. Fuel) Returns to Historical Average of ~15%; (5) Rail Service Reliability Continued to Improve Sequentially in 4Q15.
Truck Highlights: (1) Intermodal Volume Growth Expectations Decelerate to the Lowest Level Since Sept 2009; (2) Rate Growth Expectations Decelerate to ~1% across All Truck Modes; (3) Shippers Expect Capacity to Loosen Across All Truck Modes; (4) Improving Rail Service a Larger Factor Driving Intermodal Growth, but Fuel Efficiency Remains Most Important; (5) More Shippers Reporting that TL Price Discounts Have Offset Some of the Rail Cost Differential.
Parcel Highlights: (1) Air, International, and Ground Parcel Volume Growth Expectations Edge Lower; (2) Parcel Pricing Growth Expectations Remain in the 1-2% Range over the Next 6 Months; (3) Shippers Expect B2C as % of Total Parcel Shipment Stay Roughly Unchanged from Prior Survey Results; (4) Shippers See Parcel Carriers Becoming More Aggressive in Trying to Win Business; (5) According to Shippers, Discounts Off List Rates Increased Seq. for FDX Air & Ground.

M O R G A N S T A N L E Y R E S E A R C H
January 11, 2016 Freight Transportation
Alexander Vecchio, CFA, (212) 761-6233, [email protected]
2
Freight Pulse: General Freight and Macro Highlights
General Freight and Macro Highlights

M O R G A N S T A N L E Y R E S E A R C H
January 11, 2016 Freight Transportation
Alexander Vecchio, CFA, (212) 761-6233, [email protected]
3
Freight Pulse: General Freight and Macro Key Takeaways
1. Economic Outlook
2. Economic Outlook by Industry
Automotive Shippers Most Constructive on Macro; Chemical Shippers Least Constructive
3. Inventory & Restocking
Inventories Still Elevated, with % of Shippers Expecting to Reduce Inventories Still Relatively High
4. Capacity Expectations
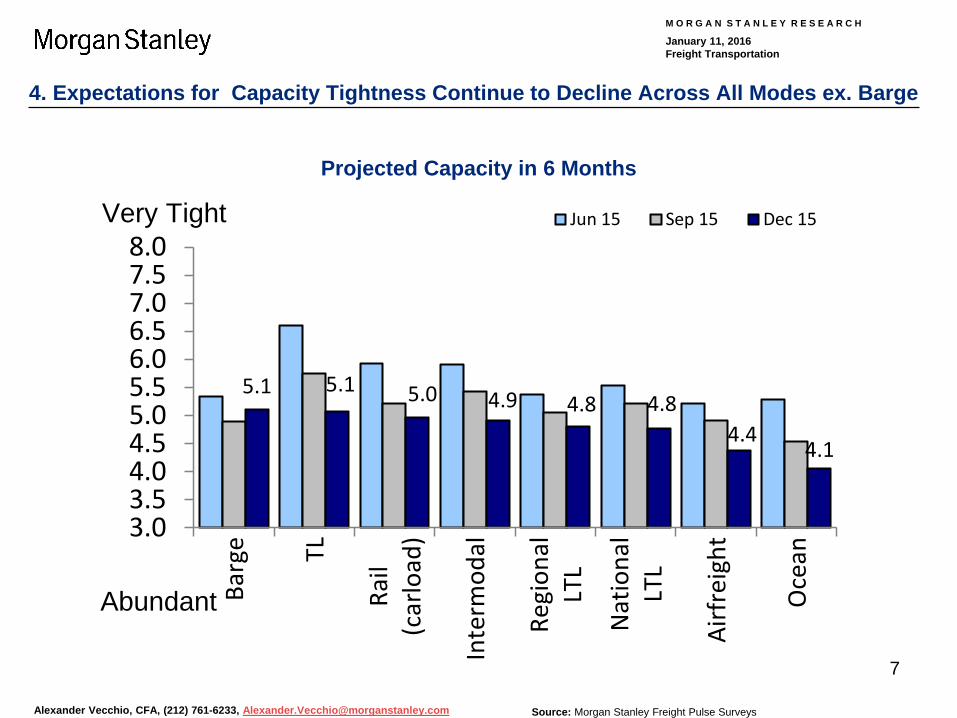
Expectations for Capacity Tightness Continue to Decline Across All Modes ex. Barge
5. Service Trends Barge and Rail Service Levels Show the Most Sequential Improvement
Shippers’ Economic Outlook Remains Relatively Unchanged

M O R G A N S T A N L E Y R E S E A R C H
January 11, 2016 Freight Transportation
Alexander Vecchio, CFA, (212) 761-6233, [email protected]
4
5.6
7.1
4.2
5.6
4.4
5.4
6.25.9
5.2 5.1
4.0
4.5
5.0
5.5
6.0
6.5
7.0
7.5
8.0StrongEconomy
No Change
Recession
1. Shippers’ Economic Outlook Remains Relatively Unchanged
Source: Morgan Stanley Freight Pulse Surveys
State of the Economy from Shippers’ Perspective

M O R G A N S T A N L E Y R E S E A R C H
January 11, 2016 Freight Transportation
Alexander Vecchio, CFA, (212) 761-6233, [email protected]
5
1
2
3
4
5
6
7
8
9
10 Food and Beverage Retailing Chemical
Manufacturing Metals and Mining Automotive
StrongEconomy
No Change
Recession
Source: Morgan Stanley Freight Pulse Surveys
Shippers’ View of the Economy by Industry
2. Automotive Shippers Most Constructive on Macro; Chemical Shippers Least Constructive

M O R G A N S T A N L E Y R E S E A R C H
January 11, 2016 Freight Transportation
Alexander Vecchio, CFA, (212) 761-6233, [email protected]
6
Source: Morgan Stanley Freight Pulse Surveys
-70%
-50%
-30%
-10%
10%
30%
50%
70%
-50%-40%-30%-20%-10%
0%10%20%30%40%50%
Apr 0
9
Apr 1
0
Jan
11
Jun
11
Dec
11
Jun
12
Dec
12
Jun
13
Dec
13
Jun
14
Dec
14
Jun
15
Dec
15
Net O
rder
ing
/ Inv
ento
ry(%
Hig
her Y
/Y -
% L
ower
)
Net C
hg in
Ord
erin
g Le
ss N
et C
hg
in In
vent
ory
(Ordering - Inventory) (LHS)
Net Ordering (RHS)
Net Inventory (RHS)
45%44%43%43%46%43%41%41%46%46%45%36%40%41%45%49%
42%42%51%
37%35%
35%33%44%39%37%
34%45%44%37%34%39%
45%37%32%33%30%
31%39%
38%
45%43%
20%23%
13%17%17%23%
14%15%17%20%17%19%23%26%
23%21%26%
20%11%
18%22%
0%10%20%30%40%50%60%70%80%90%
100%
Jan
11A
pr 1
1Ju
n 11
Sep
11D
ec 1
1M
ar 1
2Ju
n 12
Sep
12D
ec 1
2M
ar 1
3Ju
n 13
Sep
13D
ec 1
3M
ar 1
4Ju
n 14
Sep
14D
ec 1
4M
ar 1
5Ju
n 15
Sep
15D
ec 1
5
% o
f Res
pond
ents
Increaseinventory levels
Reduce inventorylevels
Maintain currentinventory levels
Shippers' Net Y/Y Orders vs. Net Y/Y Inventory Shippers' Inventory Plans
3. Inventories Still Elevated, with % of Shippers Expecting to Reduce Inventories Still Relatively High
M O R G A N S T A N L E Y R E S E A R C H
January 11, 2016 Freight Transportation
Alexander Vecchio, CFA, (212) 761-6233, [email protected]
7
4. Expectations for Capacity Tightness Continue to Decline Across All Modes ex. Barge
Source: Morgan Stanley Freight Pulse Surveys
5.1 5.1 5.0 4.9 4.8 4.84.4
4.1
3.03.54.04.55.05.56.06.57.07.58.0
Barg
e TL
Rail
(car
load
)
Inte
rmod
al
Regi
onal
LTL
Nat
iona
lLT
L
Airf
reig
ht
Oce
an
Jun 15 Sep 15 Dec 15
Abundant
Very Tight
Projected Capacity in 6 Months

M O R G A N S T A N L E Y R E S E A R C H
January 11, 2016 Freight Transportation
Alexander Vecchio, CFA, (212) 761-6233, [email protected]
8
5. Barge and Rail Service Levels Show the Most Sequential Improvement
How would you rate service levels among different modes of transportation for the past 6 months?
Source: Morgan Stanley Freight Pulse Surveys
-0.1
0.3
0.20.0
0.4
-0.1
0.30.2
0.6
0.40.3 0.3
0.30.2
0.0 0.0
-0.2
-0.1
0.0
0.1
0.2
0.3
0.4
0.5
0.6
0.7
Barge Rail(carload)
Truckload Intermodal Ocean Airfreight NationalLTL
RegionalLTL
Sequ
entia
l Poi
nt C
hang
e
Sep 15 Dec 15
Poor
Excellent

M O R G A N S T A N L E Y R E S E A R C H
January 11, 2016 Freight Transportation
Alexander Vecchio, CFA, (212) 761-6233, [email protected]
9
Freight Pulse: Railroad Highlights
Railroad Highlights

M O R G A N S T A N L E Y R E S E A R C H
January 11, 2016 Freight Transportation
Alexander Vecchio, CFA, (212) 761-6233, [email protected]
10
Freight Pulse: Rail Key Takeaways
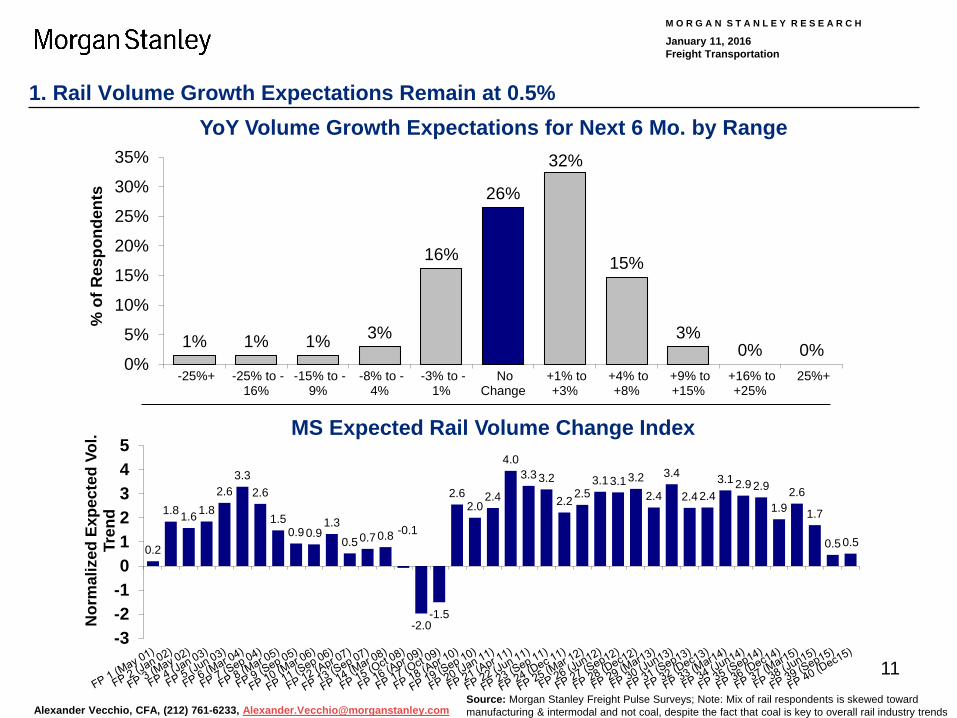
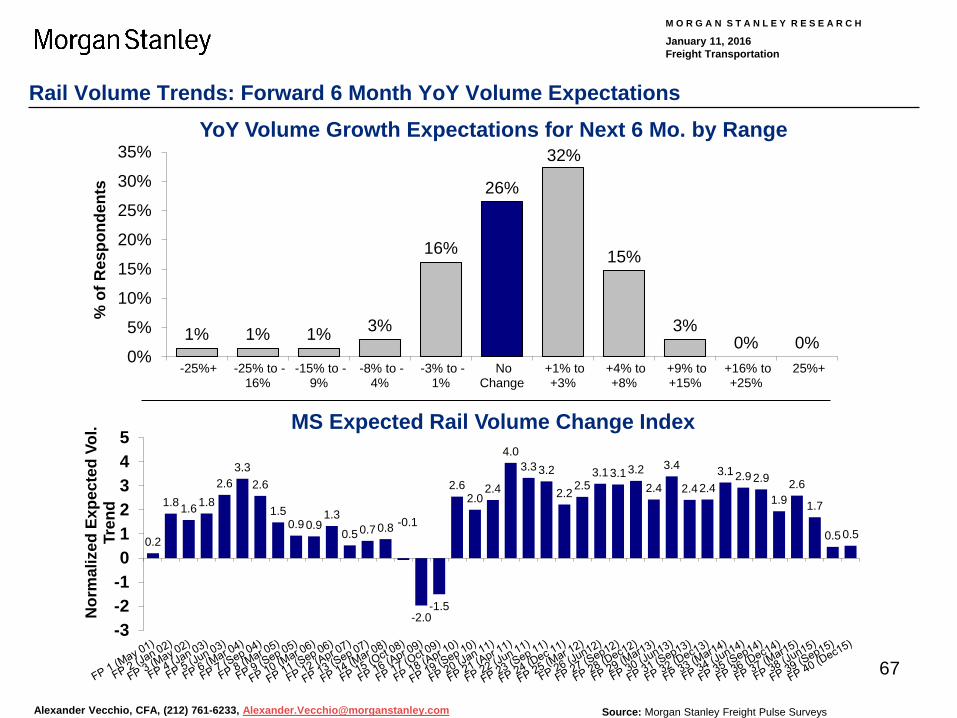
1. Rail Volume Rail Volume Growth Expectations Remain at 0.5%
2. Pricing Shippers Expect Rail Rate Growth to Decelerate in Next 6 Months
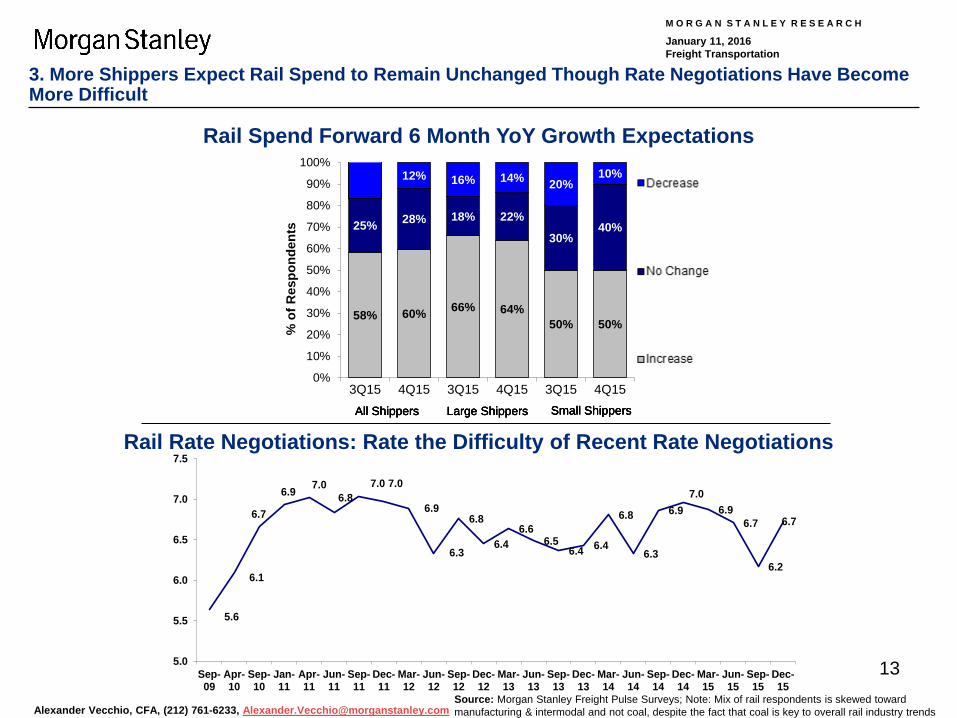
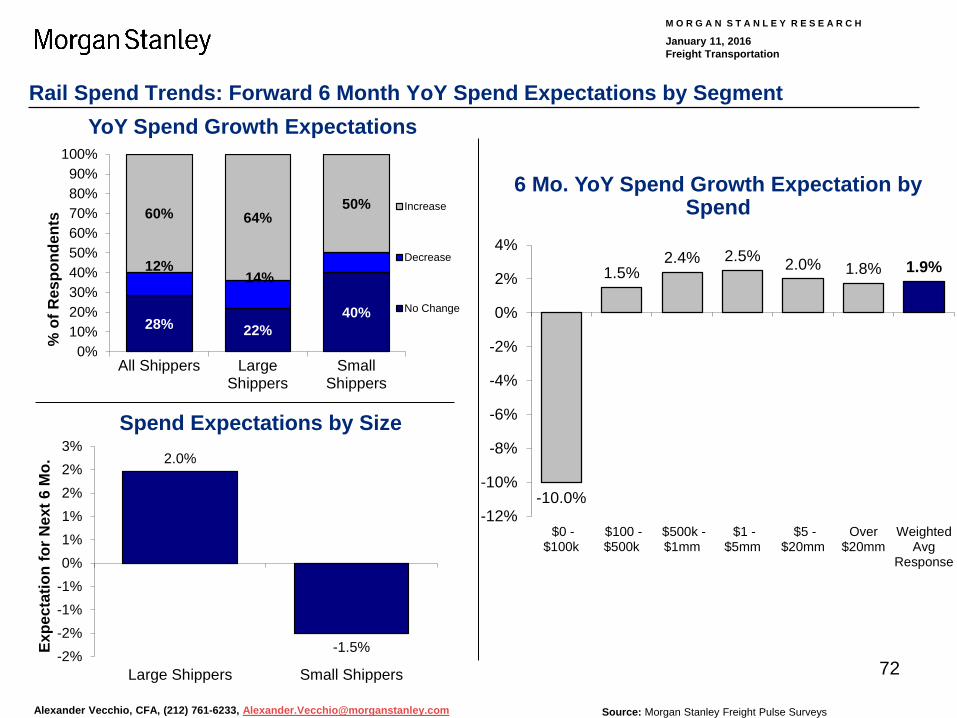
3. Spending More Shippers Expect Rail Spend to Remain Unchanged Though Rate Negotiations Have Become More Difficult
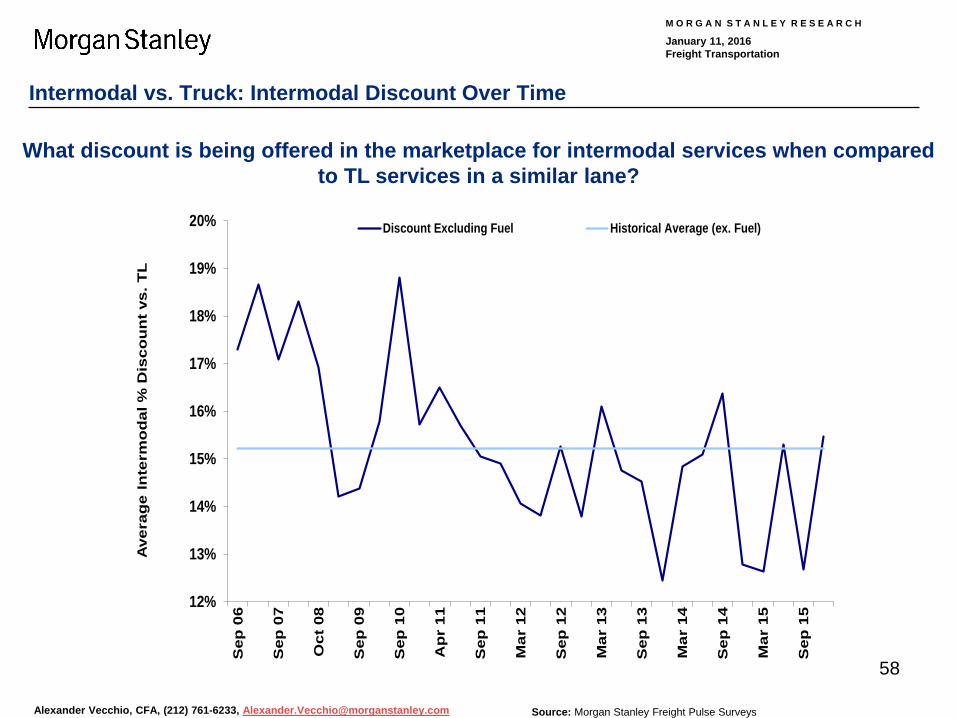
4. Intermodal Avg. Intermodal Discount to Truckload (Ex. Fuel) Returns to Historical Average of ~15%
5. Service Trends Rail Service Reliability Continued to Improve Sequentially in 4Q15
M O R G A N S T A N L E Y R E S E A R C H
January 11, 2016 Freight Transportation
Alexander Vecchio, CFA, (212) 761-6233, [email protected]
11
1% 1% 1% 3%
16%
26%
32%
15%
3%0% 0%
0%
5%
10%
15%
20%
25%
30%
35%
-25%+ -25% to -16%
-15% to -9%
-8% to -4%
-3% to -1%
NoChange
+1% to+3%
+4% to+8%
+9% to+15%
+16% to+25%
25%+
% o
f Res
pond
ents
1. Rail Volume Growth Expectations Remain at 0.5%
Source: Morgan Stanley Freight Pulse Surveys; Note: Mix of rail respondents is skewed toward manufacturing & intermodal and not coal, despite the fact that coal is key to overall rail industry trends
0.2
1.8 1.6 1.82.6
3.32.6
1.50.9 0.9
1.3
0.5 0.7 0.8 -0.1
-2.0-1.5
2.62.0
2.4
4.03.3 3.2
2.2 2.53.1 3.1 3.2
2.4
3.4
2.4 2.43.1 2.9 2.9
1.92.6
1.7
0.5 0.5
-3-2-1012345
Nor
mal
ized
Exp
ecte
d Vo
l. Tr
endYoY Volume Growth Expectations for Next 6 Mo. by Range
MS Expected Rail Volume Change Index

M O R G A N S T A N L E Y R E S E A R C H
January 11, 2016 Freight Transportation
Alexander Vecchio, CFA, (212) 761-6233, [email protected]
12
2.9%0.0% 1.5% 0.0%
4.4%
29.4%26.5%
32.4%
1.5% 1.5% 0.0%0%
5%
10%
15%
20%
25%
30%
35%
-15%+ -15% to -11%
-10% to -6%
-5% to -3%
-2% to -1%
NoChange
+1% to+2%
+3% to+5%
+6% to+10%
+11% to+15%
15%+
% o
f Res
pond
ents
2. Shippers Expect Rail Rate Growth to Decelerate in Next 6 Months
2.7
1.9
1.0
2.21.92.6
4.4 4.4
5.6 5.9
3.53.33.5
2.72.72.6
1.2
2.53.13.1
4.33.6
3.73.5 3.6
2.52.82.62.62.42.62.42.9
2.72.73.2 3.33.4
1.71.4
01234567
Nor
mal
ized
Exp
ecte
d R
ate
Tren
dYoY Rate Growth Expectations for Next 6 Mo. by Range
MS Expected Rail Rate Change Index
Source: Morgan Stanley Freight Pulse Surveys; Note: Mix of rail respondents is skewed toward manufacturing & intermodal and not coal, despite the fact that coal is key to overall rail industry trends
M O R G A N S T A N L E Y R E S E A R C H
January 11, 2016 Freight Transportation
Alexander Vecchio, CFA, (212) 761-6233, [email protected]
13
Rail Spend Forward 6 Month YoY Growth Expectations
Source: Morgan Stanley Freight Pulse Surveys; Note: Mix of rail respondents is skewed toward manufacturing & intermodal and not coal, despite the fact that coal is key to overall rail industry trends
3. More Shippers Expect Rail Spend to Remain Unchanged Though Rate Negotiations Have Become More Difficult
58% 60% 66% 64%50% 50%
25% 28% 18% 22%
30%40%
12% 16% 14% 20%10%
0%
10%
20%
30%
40%
50%
60%
70%
80%
90%
100%
3Q15 4Q15 3Q15 4Q15 3Q15 4Q15
% o
f Res
pond
ents
Decrease
No Change
Increase
All Shippers Large Shippers Small ShippersAll Shippers Large Shippers Small ShippersAll Shippers Large Shippers Small ShippersAll Shippers Large Shippers Small Shippers
Rail Rate Negotiations: Rate the Difficulty of Recent Rate Negotiations
5.6
6.1
6.7
6.9 7.0 6.8
7.0 7.0
6.9
6.3
6.8
6.4 6.6
6.5 6.4 6.4
6.8
6.3
6.9 7.0
6.9 6.7
6.2
6.7
5.0
5.5
6.0
6.5
7.0
7.5
Sep-09
Apr-10
Sep-10
Jan-11
Apr-11
Jun-11
Sep-11
Dec-11
Mar-12
Jun-12
Sep-12
Dec-12
Mar-13
Jun-13
Sep-13
Dec-13
Mar-14
Jun-14
Sep-14
Dec-14
Mar-15
Jun-15
Sep-15
Dec-15

M O R G A N S T A N L E Y R E S E A R C H
January 11, 2016 Freight Transportation
Alexander Vecchio, CFA, (212) 761-6233, [email protected]
14
Source: Morgan Stanley Freight Pulse Surveys
12%
13%
14%
15%
16%
17%
18%
19%
20%S
ep 0
6
Sep
07
Oct
08
Sep
09
Sep
10
Ap
r 11
Sep
11
Mar
12
Sep
12
Mar
13
Sep
13
Mar
14
Sep
14
Mar
15
Sep
15
Ave
rag
e In
term
od
al %
Dis
cou
nt
vs. T
L
Discount Excluding Fuel Historical Average (ex. Fuel)
What discount is being offered in the marketplace for intermodal services when compared to TL services in a similar lane?
4. Avg. Intermodal Discount to Truckload (Ex. Fuel) Returns to Historical Average of ~15%

M O R G A N S T A N L E Y R E S E A R C H
January 11, 2016 Freight Transportation
Alexander Vecchio, CFA, (212) 761-6233, [email protected]
15
5. Rail Service Reliability Continued to Improve Sequentially in 4Q15
5.76.25.96.05.75.45.45.25.15.55.35.65.56.16.16.16.25.96.06.06.26.26.26.16.36.26.76.66.56.56.15.76.05.85.95.85.76.16.2
02468
10Value for Dollar (Scale 1 = Worst to 10 = Best)
6.16.16.56.46.15.95.45.65.85.96.15.76.36.26.66.96.36.15.85.55.65.85.65.86.05.95.96.26.66.06.35.75.05.25.35.24.95.55.76.1
02468
10Service Reliability (Scale 1 = Worst to 10 = Best)
Source: Morgan Stanley Freight Pulse Surveys; Note: Mix of rail respondents is skewed toward manufacturing & intermodal and not coal, despite the fact that coal is key to overall rail industry trends

M O R G A N S T A N L E Y R E S E A R C H
January 11, 2016 Freight Transportation
Alexander Vecchio, CFA, (212) 761-6233, [email protected]
16
Freight Pulse: Trucking Highlights
Trucking Highlights

M O R G A N S T A N L E Y R E S E A R C H
January 11, 2016 Freight Transportation
Alexander Vecchio, CFA, (212) 761-6233, [email protected]
17
Freight Pulse: Trucking Key Takeaways
1. Truck Volume
2. Pricing Rate Growth Expectations Decelerate to ~1% across All Truck Modes
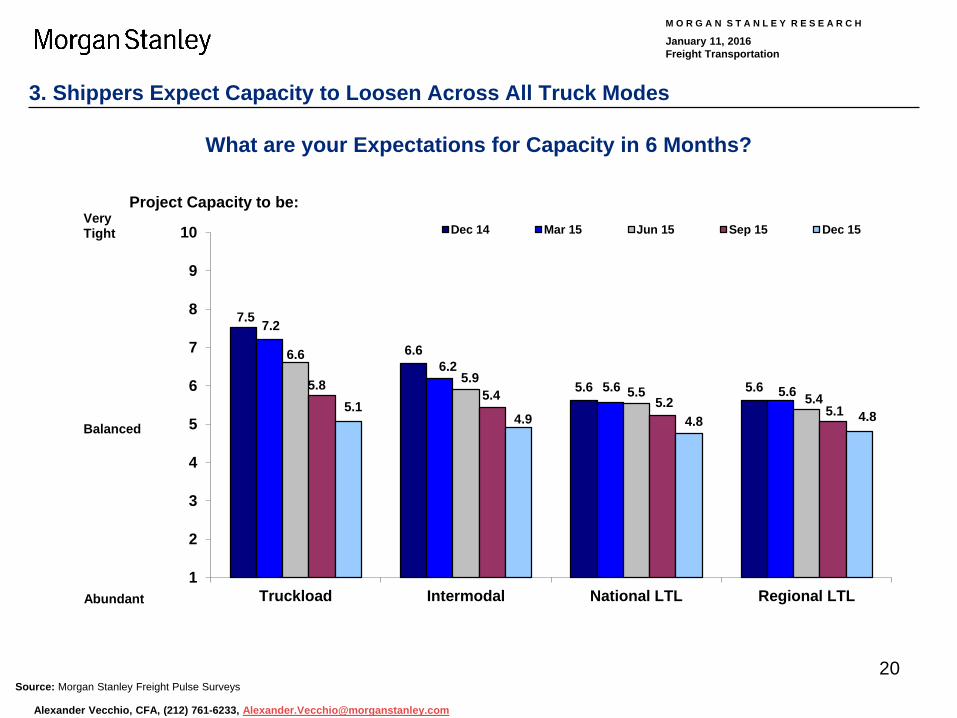
3. Capacity Shippers Expect Capacity to Loosen Across All Truck Modes
4. Intermodal Use Improving Rail Service a Larger Factor Driving Intermodal Growth, but Fuel Efficiency Remains Most Important
5. Intermodal Cost More Shippers Reporting that TL Price Discounts Have Offset Some of the Rail Cost Differential
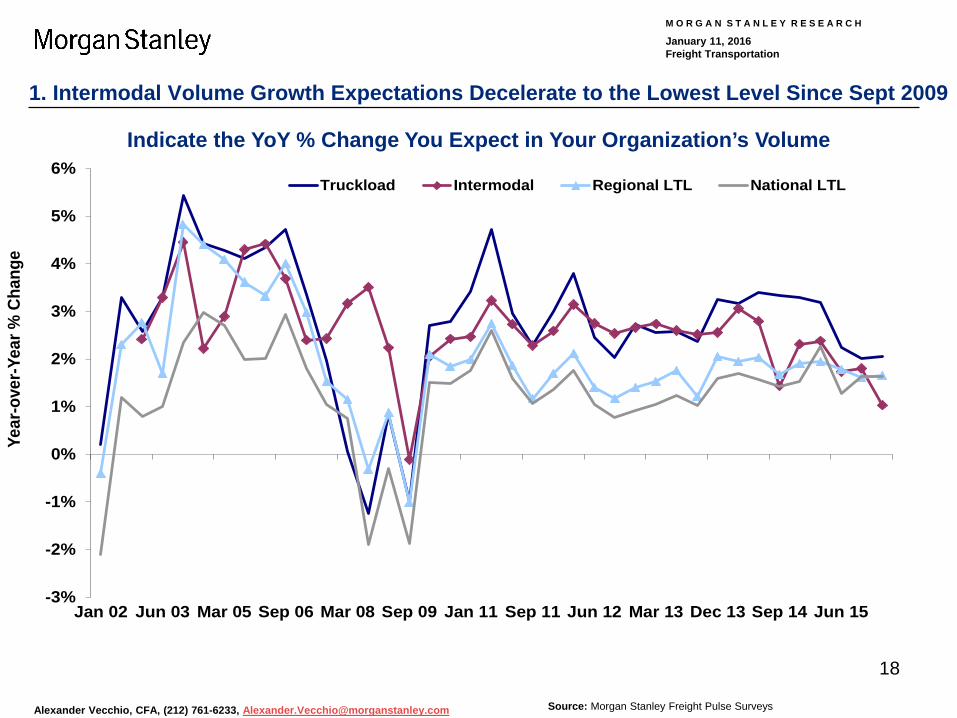
Intermodal Volume Growth Expectations Decelerate to the Lowest Level Since Sept 2009
M O R G A N S T A N L E Y R E S E A R C H
January 11, 2016 Freight Transportation
Alexander Vecchio, CFA, (212) 761-6233, [email protected]
18
-3%
-2%
-1%
0%
1%
2%
3%
4%
5%
6%
Jan 02 Jun 03 Mar 05 Sep 06 Mar 08 Sep 09 Jan 11 Sep 11 Jun 12 Mar 13 Dec 13 Sep 14 Jun 15
Year
-ove
r-Yea
r % C
hang
e
Truckload Intermodal Regional LTL National LTL
1. Intermodal Volume Growth Expectations Decelerate to the Lowest Level Since Sept 2009
Source: Morgan Stanley Freight Pulse Surveys
Indicate the YoY % Change You Expect in Your Organization’s Volume

M O R G A N S T A N L E Y R E S E A R C H
January 11, 2016 Freight Transportation
Alexander Vecchio, CFA, (212) 761-6233, [email protected]
19
-3%
-2%
-1%
0%
1%
2%
3%
4%
5%
6%
7%
Jan 02 Jun 03 Mar 05 Sep 06 Mar 08 Sep 09 Jan 11 Sep 11 Jun 12 Mar 13 Dec 13 Sep 14 Jun 15
Year
-ove
r-Yea
r % C
hang
e
Truckload Intermodal Regional LTL National LTL
Source: Morgan Stanley Freight Pulse Surveys
2. Rate Growth Expectations Decelerate to ~1% across All Truck Modes
Indicate the YoY % Change You Expect in Your Organization’s Base Rates
M O R G A N S T A N L E Y R E S E A R C H
January 11, 2016 Freight Transportation
Alexander Vecchio, CFA, (212) 761-6233, [email protected]
20
7.5
6.6
5.6 5.6
7.2
6.25.6 5.6
6.6
5.95.5 5.4
5.85.4 5.2 5.15.1
4.9 4.8 4.8
1
2
3
4
5
6
7
8
9
10
Truckload Intermodal National LTL Regional LTL
Dec 14 Mar 15 Jun 15 Sep 15 Dec 15
Abundant
Balanced
Very Tight
Project Capacity to be:
3. Shippers Expect Capacity to Loosen Across All Truck Modes
Source: Morgan Stanley Freight Pulse Surveys
What are your Expectations for Capacity in 6 Months?

M O R G A N S T A N L E Y R E S E A R C H
January 11, 2016 Freight Transportation
Alexander Vecchio, CFA, (212) 761-6233, [email protected]
21
6.9 6.77.1
6.76.3 6.3
5.7 5.96.6 6.9 7.0 6.7 6.6
6.3 6.1 6.1
7.4 7.3 7.2 7.0 6.96.4 6.2
5.8
1
2
3
4
5
6
7
8
9
10
Barge Truckload RegionalLTL
Intermodal Ocean National LTL Rail(carload)
Airfreight
Jun 15 Sep 15 Dec 15
Poor
Excellent
4. Improving Rail Service a Larger Factor Driving Intermodal Growth, but Fuel Efficiency Remains Most Important
Source: Morgan Stanley Freight Pulse Survey
6.3 6.85.6
5.0 4.6 4.5
6.1 6.6
5.3 5.24.4 4.1
5.56.3
5.4 5.24.4 4.2
5.56.4
5.05.7
4.5 4.1
123456789
10
TL Rates HaveRisen to Point
Where IntermodalIs Competitive
Intermodal is morefuel efficient
Turning to theIntermodal
Alternative MoreOften During
Periods of TightCapacity
RailroadIntermodal Service
Has Improved
Strong ImportGrowth
Strong ExportGrowth
FP 37 (Mar15) FP 38 (Jun15) FP 39 (Sep15) FP 40 (Dec15)
What Factors are Impacting Your Use of Intermodal Most?
“Value for the Dollar” for Each Mode

M O R G A N S T A N L E Y R E S E A R C H
January 11, 2016 Freight Transportation
Alexander Vecchio, CFA, (212) 761-6233, [email protected]
22
5. More Shippers Reporting that TL Price Discounts Have Offset Some of the Rail Cost Differential
Source: Morgan Stanley Freight Pulse Surveys
1 2 3 4 5 6 7 8 9
10
Oct
08
Apr 0
9Se
p 09
Apr 1
0Se
p 10
Jan
11Ap
r 11
Jun
11Se
p 11
Dec
11
Mar
12
Jun
12Se
p 12
Dec
12
Mar
13
Jun
13Se
p 13
Dec
13
Mar
14
Jun
14Se
p 14
Dec
14
Mar
15
Jun
15Se
p 15
Dec
15
Rail doesn't support faster inventory turnoverTL price discounts have offset some of the rail cost differentialOther Factors
StronglyAgree
StronglyDisagree
What Factors are Limiting your Organization from Shipping More Volume on the Railroads?

M O R G A N S T A N L E Y R E S E A R C H
January 11, 2016 Freight Transportation
Alexander Vecchio, CFA, (212) 761-6233, [email protected]
23
Freight Pulse: Parcel Highlights
Parcel Highlights

M O R G A N S T A N L E Y R E S E A R C H
January 11, 2016 Freight Transportation
Alexander Vecchio, CFA, (212) 761-6233, [email protected]
24
Freight Pulse: Parcel Key Takeaways
1. Parcel Volumes Air, International, and Ground Parcel Volume Growth Expectations Edge Lower
2. Pricing Parcel Pricing Growth Expectations Remain in the 1-2% Range over the Next 6 Months
3. B2C Shippers Expect B2C as % of Total Parcel Shipment Stay Roughly Unchanged from Prior Survey Results
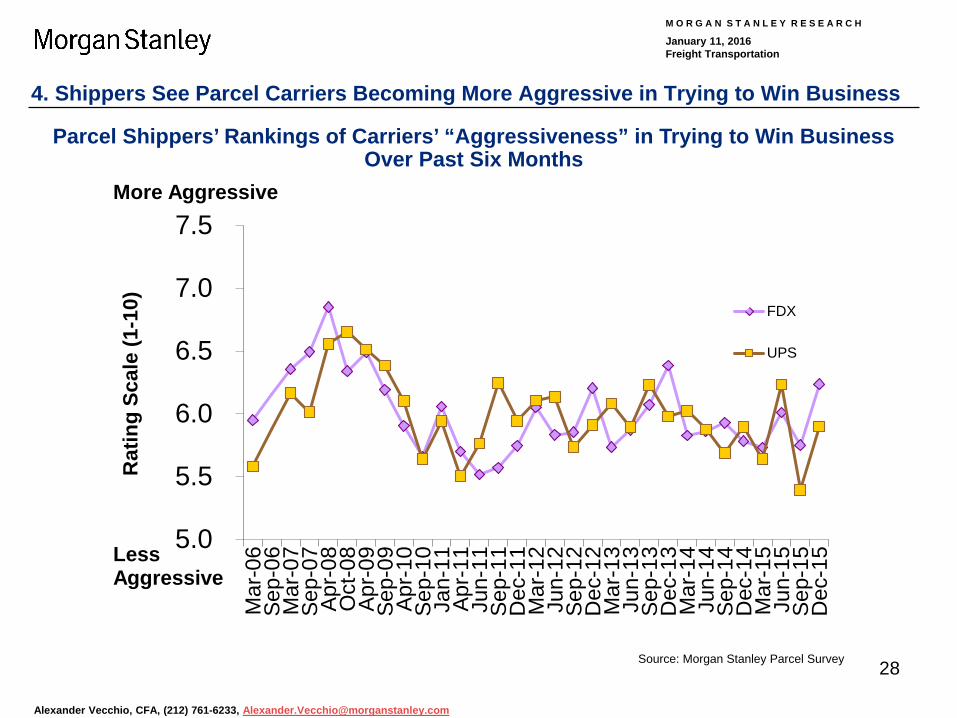
4. Aggressiveness Shippers See Parcel Carriers Becoming More Aggressive in Trying to Win Business
5. Rate Discounts According to Shippers, Discounts Off List Rates Increased Seq. for FDX Air & Ground

M O R G A N S T A N L E Y R E S E A R C H
January 11, 2016 Freight Transportation
Alexander Vecchio, CFA, (212) 761-6233, [email protected]
25
-3%
-2%
-1%
0%
1%
2%
3%
4%
5%
6%
Jan-
02M
ay-0
2Ja
n-03
Jun-
03M
ar-0
4S
ep-0
4A
pr-0
5S
ep-0
5M
ar-0
6S
ep-0
6M
ar-0
7S
ep-0
7A
pr-0
8O
ct-0
8A
pr-0
9S
ep-0
9A
pr-1
0S
ep-1
0Ja
n-11
Apr
-11
Jun-
11S
ep-1
1D
ec-1
1M
ar-1
2Ju
n-12
Sep
-12
Dec
-12
Mar
-13
Jun-
13S
ep-1
3D
ec-1
3M
ar-1
4Ju
n-14
Sep
-14
Dec
-14
Mar
-15
Jun-
15S
ep-1
5D
ec-1
5
Air Ground Int'l
1. Air, International, and Ground Parcel Volume Growth Expectations Edge Lower
Source: Morgan Stanley Parcel Survey
Volume Growth Expectations “Over the Next 6 Months” vs. Last Year

M O R G A N S T A N L E Y R E S E A R C H
January 11, 2016 Freight Transportation
Alexander Vecchio, CFA, (212) 761-6233, [email protected]
26
2. Parcel Pricing Growth Expectations Remain in the 1-2% Range over the Next 6 Months
-0.5%0.0%0.5%1.0%1.5%2.0%2.5%3.0%3.5%4.0%4.5%
Jan-
02M
ay-0
2Ja
n-03
Jun-
03M
ar-0
4S
ep-0
4A
pr-0
5S
ep-0
5M
ar-0
6S
ep-0
6M
ar-0
7S
ep-0
7A
pr-0
8O
ct-0
8A
pr-0
9S
ep-0
9A
pr-1
0S
ep-1
0Ja
n-11
Apr
-11
Jun-
11S
ep-1
1D
ec-1
1M
ar-1
2Ju
n-12
Sep
-12
Dec
-12
Mar
-13
Jun-
13S
ep-1
3D
ec-1
3M
ar-1
4Ju
n-14
Sep
-14
Dec
-14
Mar
-15
Jun-
15S
ep-1
5D
ec-1
5
Air Ground Int'l
Includes All responses, equally-weighted. Source: Morgan Stanley Parcel Survey
Average Base Rate Expectations “Over the Next 6 Months” vs. Last Year

M O R G A N S T A N L E Y R E S E A R C H
January 11, 2016 Freight Transportation
Alexander Vecchio, CFA, (212) 761-6233, [email protected]
27 Source: Morgan Stanley Parcel Survey
3. Shippers Expect B2C as % of Total Parcel Shipment Stay Roughly Unchanged from Prior Survey Results
YoY Change in B2C as % of Total
52%45% 46%
55% 58%
45%37%
53%49% 48% 45% 46% 49% 49% 45%
41%
51% 48%52% 51% 51%
42% 45% 48%
1%1%
1%
2%
1%
1%1% 1%
1% 1%0%
1%
1%2%
2% 2% 2%
1%2%
1%
10%
8%11%
8% 5%
6%11%
8%6% 9%
5% 6%5% 5%
4%3%
5% 5%4% 3% 4%
7%5%
4%
29%
37%36% 28% 29%
38%44%
32%36% 30%
34%35%
36% 37%40%
41%
27% 32%35% 34% 34%
34% 34%37%
9% 10% 6% 9% 8% 10%6% 7% 8%
12%15% 12%
9% 9% 10%14% 16%
12%7% 9% 9%
16% 15%10%
0%
10%
20%
30%
40%
50%
60%
70%
80%
90%
100%Se
p-09
Apr-1
0Se
p-10
Jan-
11Ap
r-11
Jun-
11Se
p-11
Dec
-11
Mar
-12
Jun-
12Se
p-12
Dec
-12
Mar
-13
Jun-
13Se
p-13
Dec
-13
Mar
-14
Jun-
14Se
p-14
Dec
-14
Mar
-15
Jun-
15Se
p-15
Dec
-15
% o
f Res
pond
ents
Significantly largerportion
Slightly larger portion
Slightly smaller portion
Significantly smallerportion
No change
M O R G A N S T A N L E Y R E S E A R C H
January 11, 2016 Freight Transportation
Alexander Vecchio, CFA, (212) 761-6233, [email protected]
28
5.0
5.5
6.0
6.5
7.0
7.5M
ar-0
6Se
p-06
Mar
-07
Sep-
07Ap
r-08
Oct
-08
Apr-0
9Se
p-09
Apr-1
0Se
p-10
Jan-
11Ap
r-11
Jun-
11Se
p-11
Dec
-11
Mar
-12
Jun-
12Se
p-12
Dec
-12
Mar
-13
Jun-
13Se
p-13
Dec
-13
Mar
-14
Jun-
14Se
p-14
Dec
-14
Mar
-15
Jun-
15Se
p-15
Dec
-15
FDX
UPS
More Aggressive
LessAggressive
Rat
ing
Scal
e (1
-10)
4. Shippers See Parcel Carriers Becoming More Aggressive in Trying to Win Business
Source: Morgan Stanley Parcel Survey
Parcel Shippers’ Rankings of Carriers’ “Aggressiveness” in Trying to Win Business Over Past Six Months

M O R G A N S T A N L E Y R E S E A R C H
January 11, 2016 Freight Transportation
Alexander Vecchio, CFA, (212) 761-6233, [email protected]
29 Source: Morgan Stanley Parcel Survey
5. According to Shippers, Discounts Off List Rates Increased Seq. for FDX Air & Ground
Average List Rate Discount
15%
20%
25%
30%
35%
40%
45%
50%
55%
Apr
-05
Mar
-06
Mar
-07
Apr
-08
Apr
-09
Apr
-10
Jan-
11
Jun-
11
Dec
-11
Jun-
12
Dec
-12
Jun-
13
Dec
-13
Jun-
14
Dec
-14
Jun-
15
Dec
-15
Dis
coun
t Off
List
Rat
esFDX Ground UPS Ground FDX Air UPS Air

M O R G A N S T A N L E Y R E S E A R C H
January 11, 2016 Freight Transportation
Alexander Vecchio, CFA, (212) 761-6233, [email protected]
30
Appendix
Appendix

M O R G A N S T A N L E Y R E S E A R C H
January 11, 2016 Freight Transportation
Alexander Vecchio, CFA, (212) 761-6233, [email protected]
31
About the Surveys Part 1: About the Surveys
1. General Freight 2. Rail Industry 3. Truck Industry 4. Parcel Industry
Summary of Contents
General Freight Trends
Rail Trends
Truck Trends
Parcel Trends

M O R G A N S T A N L E Y R E S E A R C H
January 11, 2016 Freight Transportation
Alexander Vecchio, CFA, (212) 761-6233, [email protected]
32
General Freight: About the Freight Pulse Survey
Note: just those shippers providing an industry classification and spend. Source: MS Freight Pulse Surveys
20% 19%18%
15%
7%5%
3% 2% 2% 2% 2% 2% 2% 1% 1% 0%0%
10%
20%
30%3P
L
Oth
er In
dust
ry
Man
ufac
turin
g
Food
and
Bev
erag
e
Ret
ailin
g
Che
mic
al
Pape
r & P
acka
ging
Com
pute
r / T
ech
Auto
mot
ive
Fore
st /
Build
ing
Prod
ucts Min
ing
Fina
ncia
l / L
egal
Serv
ices
Phar
mac
eutic
al
Indu
s Eq
uip
/ Cap
Goo
ds
Agric
ultu
re
Elec
trica
l Gen
erat
ion
Respondents by Industry

M O R G A N S T A N L E Y R E S E A R C H
January 11, 2016 Freight Transportation
Alexander Vecchio, CFA, (212) 761-6233, [email protected]
33
General Freight: Segmented by Shipper Profile
Note: just those shippers providing an industry classification and spend. Source: MS Freight Pulse Surveys
Trucking, 63%
Railroads (including
Intermodal), 3%
Both Trucking
and Railroads (including
Intermodal), 34%
< $100k, 14.8%
$100k to $500k, 4.6%
$500k to $1MM, 1.5% $1MM to
$5MM, 12.8%
$5 MM to $40 MM, 56.6%
$40MM+, 9.7%
Modes Used Respondents’ Total Spend

M O R G A N S T A N L E Y R E S E A R C H
January 11, 2016 Freight Transportation
Alexander Vecchio, CFA, (212) 761-6233, [email protected]
34
Rails: Segmented by Industry and Shipper Profile
$0 -$100k, 7%
$100 -$500k, 3%
$500k -$1mm, 8%
$1 -$5mm, 13%
$5 -$20mm,
30%
Over $20mm,
39%
Source: Morgan Stanley Freight Pulse Surveys
Rail Respondents by Industry Respondents’ Rail Spend
20% 19%
14%13%
6% 6%4% 3% 3% 3%
2% 2% 2% 1% 1% 1%0%
5%
10%
15%
20%
25%
Oth
er In
dust
ry
3PL
Man
ufac
turin
g
Food
and
Bev
erag
e
Che
mic
al
Ret
ailin
g
Pap
er &
Pac
kagi
ng
Min
ing
Aut
omot
ive
Com
pute
r/Tec
hnol
ogy
Indu
stria
lE
quip
men
t/Cap
ital…
Fina
ncia
l/Leg
alS
ervi
ces
Fore
st/B
uild
ing
Pro
duct
s
Agr
icul
ture
Pha
rmac
eutic
al
Ele
ctric
al G
ener
atio
n

M O R G A N S T A N L E Y R E S E A R C H
January 11, 2016 Freight Transportation
Alexander Vecchio, CFA, (212) 761-6233, [email protected]
35
Trucks: Segmented by Industry and Shipper Profile
Source: Morgan Stanley Freight Pulse Surveys
21%19%19%
15%
7%4% 3% 2% 2% 2% 2% 1% 1% 1% 1% 0%
0%
10%
20%
30%
3PL
Oth
er In
dust
ry
Man
ufac
turin
g
Food
and
Bev
erag
e
Ret
ailin
g
Che
mic
al
Pap
er &
Pac
kagi
ng
Com
pute
r / T
ech
Aut
omot
ive
Fore
st /
Build
ing…
Pha
rmac
eutic
al
Min
ing
Indu
s E
quip
/ C
ap…
Fina
ncia
l / L
egal
…
Agr
icul
ture
Ele
ctric
al G
ener
atio
n
< $100k, 11%
$100k to $500k, 5%
$500k to $1MM, 3%
$1MM to $5MM, 14%
$5 MM to $20 MM,
18%
$20MM+, 50%
Truck Respondents by Industry Respondents’ Truck Spend

M O R G A N S T A N L E Y R E S E A R C H
January 11, 2016 Freight Transportation
Alexander Vecchio, CFA, (212) 761-6233, [email protected]
36
Parcel: About Our Parcel Survey
$0 to $100k, 23%
$100k to $500k, 11%
$500k to $1MM, 8%$1MM to
$5MM, 21%
$5 MM to $20 MM,
17%
$20MM+, 19%
31%
20%
13% 13% 12% 12%
0%
10%
20%
30%
40%
Man
ufac
turin
g
Who
lesa
le /
Dis
tribu
tion
Oth
er
Ret
ail
3PL
Prov
ider
Con
sulta
nt
Source: Morgan Stanley Parcel Survey
Respondents' Parcel Spend Respondents' Primary Business

M O R G A N S T A N L E Y R E S E A R C H
January 11, 2016 Freight Transportation
Alexander Vecchio, CFA, (212) 761-6233, [email protected]
37
Parcel: Respondent Profile
$0 to $10, 19%
$11 - $25, 10%
$26 -$50, 5%
$51 -$100, 16%
$100 -$1,000,
14%
$1,000+, 35%
0 - 100k, 43%
100k -500k, 23%
500k -1MM, 7%
1MM -5MM, 13% 5MM+,
15%
Source: Morgan Stanley Parcel Survey
Company Sales ($MM) Parcels Shipped

M O R G A N S T A N L E Y R E S E A R C H
January 11, 2016 Freight Transportation
Alexander Vecchio, CFA, (212) 761-6233, [email protected]
38
UPS, 49%UPS, 58%
UPS, 33%
FDX, 47% FDX, 33%
FDX, 32%
USPS, 5%
USPS, 1%
DHL, 0%
DHL, 31%
Other, 1% Other, 3% Other, 4%
0%
20%
40%
60%
80%
100%
Air Ground Int'l
Dol
lar-
wei
ghte
d %
of r
espo
nden
ts
Parcel: Market Share of Respondents Roughly Consistent with Market
Source: Morgan Stanley Parcel Survey
UPS, 41% UPS, 48%
UPS, 29%
50% 40%
36%
USPS, 4% USPS, 9%
USPS, 8%
DHL, 1%
DHL, 15%
Other, 3% Other, 3%
Other, 8%
0%
20%
40%
60%
80%
100%
Air Ground Int'l
% o
f res
pond
ents
Primary Parcel Carrier – Weighted by Spend Parcel Carrier – Average of All Responses

M O R G A N S T A N L E Y R E S E A R C H
January 11, 2016 Freight Transportation
Alexander Vecchio, CFA, (212) 761-6233, [email protected]
39
Summary of Contents
Part 1: General Freight Industry Trends 1. Service Trends 2. Capacity Trends 3. Modal Shift 4. Intermodal vs. Truck
Part 2: Macro Trends 1. Inventories and Orders 2. Economic Outlook
About the Surveys
General Freight Trends
Rail Trends
Truck Trends
Parcel Trends

M O R G A N S T A N L E Y R E S E A R C H
January 11, 2016 Freight Transportation
Alexander Vecchio, CFA, (212) 761-6233, [email protected]
40
7.6 7.4 7.06.6
6.3 6.3 5.9 5.5
7.5 7.67.2 6.9
6.3 6.3 6.3 5.7
7.8 7.6 7.56.9 6.9 6.7 6.5
6.1
0
1
2
3
4
5
6
7
8
9
10
Airfreight Regional LTL Truckload National LTL Barge Intermodal Ocean Rail (carload)
Jun 15 Sep 15 Dec 15
Poor
Excellent
Service Reliability & Value by Mode: Average Across All Shippers
Source: Morgan Stanley Freight Pulse Surveys
“Service Reliability” for Each Mode
6.9 6.77.1
6.76.3 6.3
5.7 5.96.6 6.9 7.0 6.7 6.6
6.3 6.1 6.1
7.4 7.3 7.2 7.0 6.96.4 6.2
5.8
1
2
3
4
5
6
7
8
9
10
Barge Truckload RegionalLTL
Intermodal Ocean NationalLTL
Rail(carload)
Airfreight
Jun 15 Sep 15 Dec 15
Poor
Excellent “Value for the Dollar” for Each Mode

M O R G A N S T A N L E Y R E S E A R C H
January 11, 2016 Freight Transportation
Alexander Vecchio, CFA, (212) 761-6233, [email protected]
41
Capacity by Mode
Source: Morgan Stanley Freight Pulse Surveys
Current Capacity Projected Capacity in 6 Months
5.1 5.1 5.0 4.9 4.8 4.8 4.4 4.1
123456789
10
Barg
e TL
Rail
(car
load
)
Inte
rmod
al
Regi
onal
LTL
Nat
iona
lLT
L
Airf
reig
ht
Oce
an
Abundant
Very Tight
4.9 4.8 4.7 4.6 4.5 4.5 4.3 3.9
123456789
10
Barg
e
Rail
(car
load
)
Inte
rmod
al
Regi
onal
LTL
Nat
iona
lLT
L TL
Airf
reig
ht
Oce
an
Abundant
Very Tight

M O R G A N S T A N L E Y R E S E A R C H
January 11, 2016 Freight Transportation
Alexander Vecchio, CFA, (212) 761-6233, [email protected]
42
12%
5%
15%13%
41%
4%6%
2% 2% 1%0%
5%
10%
15%
20%
25%
30%
35%
40%
45%
1 2 3 4 5 6 7 8 9 10
Airfreight - % of Shippers Providing Rankings
Abundant Very Tight
Capacity Ranking Skew: Airfreight
Source: Morgan Stanley Freight Pulse Surveys
11%
4%
13% 11%
46%
4% 4% 2% 1% 2%0%
10%
20%
30%
40%
50%
60%
1 2 3 4 5 6 7 8 9 10
Airfreight - % of Shippers Providing Rankings
Abundant Very Tight
Current Capacity Projected Capacity in 6 Months

M O R G A N S T A N L E Y R E S E A R C H
January 11, 2016 Freight Transportation
Alexander Vecchio, CFA, (212) 761-6233, [email protected]
43
Capacity Ranking Skew: Ocean
15%
9%
20%
16%
25%
6%
2%
6%
1% 0%0%
5%
10%
15%
20%
25%
30%
1 2 3 4 5 6 7 8 9 10
Ocean - % of Shippers Providing Rankings
Abundant Very Tight
Source: Morgan Stanley Freight Pulse Surveys
10% 10%
22%
14%
28%
2%6% 7%
0% 1%0%
5%
10%
15%
20%
25%
30%
35%
40%
45%
1 2 3 4 5 6 7 8 9 10
Ocean - % of Shippers Providing Rankings
Abundant Very Tight
Current Capacity Projected Capacity in 6 Months

M O R G A N S T A N L E Y R E S E A R C H
January 11, 2016 Freight Transportation
Alexander Vecchio, CFA, (212) 761-6233, [email protected]
44
2%5%
15% 15%
43%
6% 5%7%
1% 1%0%
5%
10%
15%
20%
25%
30%
35%
40%
45%
1 2 3 4 5 6 7 8 9 10
Rail (carload) - % of Shippers Providing Rankings
Abundant Very Tight
Capacity Ranking Skew: Rail (Carload)
Source: Morgan Stanley Freight Pulse Surveys
1%4%
13%15%
41%
10%8%
4% 3% 1%0%
10%
20%
30%
40%
50%
60%
1 2 3 4 5 6 7 8 9 10
Rail (carload) - % of Shippers Providing Rankings
Abundant Very Tight
Current Capacity Projected Capacity in 6 Months

M O R G A N S T A N L E Y R E S E A R C H
January 11, 2016 Freight Transportation
Alexander Vecchio, CFA, (212) 761-6233, [email protected]
45
Capacity Ranking Skew: Barge
7%3%
10%7%
55%
3% 3% 3% 3% 3%
0%
10%
20%
30%
40%
50%
60%
70%
1 2 3 4 5 6 7 8 9 10
Barge - % of Shippers Providing Rankings
Abundant Very Tight
Source: Morgan Stanley Freight Pulse Surveys
0%3%
14%10%
48%
3%
14%
3%0%
3%
0%
10%
20%
30%
40%
50%
60%
70%
1 2 3 4 5 6 7 8 9 10
Barge - % of Shippers Providing Rankings
Abundant Very Tight
Current Capacity Projected Capacity in 6 Months

M O R G A N S T A N L E Y R E S E A R C H
January 11, 2016 Freight Transportation
Alexander Vecchio, CFA, (212) 761-6233, [email protected]
46
Shipper Modal Shift Statistics – Truckload to Rail
54%
42%
4%
58%
39%
3%
61%
36%
3%
61%
37%
3%
69%
30%
1%0%
10%
20%
30%
40%
50%
60%
70%
80%
90%
100%
No Yes, shifting some volume Yes, shifting a significant amount ofvolume
Dec 14 Mar 15 Jun 15 Sep 15 Dec 15
Source: Morgan Stanley Freight Pulse Surveys
Truckload to Rail
92% 89%100%
75%66%
44%60%
8% 11%0%
25%33%
56%39%
1% 1%
0%10%20%30%40%50%60%70%80%90%
100%
< $
100k
$10
0k to
$500
k
$50
0k to
$1M
M
$1M
M to
$5M
M
$5
MM
to$4
0 M
M
$40
MM
+
Wei
ghte
dAv
gR
espo
nse
% o
f Res
pond
ents
Yes, shiftinga significantamount ofvolume
Yes, shiftingsome volume
No
Truckload to Rail - Modal Shift by Spend

M O R G A N S T A N L E Y R E S E A R C H
January 11, 2016 Freight Transportation
Alexander Vecchio, CFA, (212) 761-6233, [email protected]
47
Shipper Modal Shift Statistics – Rail to Truckload
82%
15%
2%
83%
16%
1%
77%
22%
1%
78%
21%
1%
80%
18%
2%0%
10%
20%
30%
40%
50%
60%
70%
80%
90%
No Yes, shifting some volume Yes, shifting a significant amount ofvolume
Dec 14 Mar 15 Jun 15 Sep 15 Dec 15
Source: Morgan Stanley Freight Pulse Surveys
Rail to Truckload
96% 89%100%
83% 80%
44%
71%
4% 0%19%
50%
26%
0%10%20%30%40%50%60%70%80%90%
100%
< $
100k
$10
0k to
$500
k
$50
0k to
$1M
M
$1M
M to
$5M
M
$5
MM
to$4
0 M
M
$40
MM
+
Wei
ghte
dAv
gR
espo
nse
% o
f Res
pond
ents
Yes, shiftinga significantamount ofvolume
Yes, shiftingsome volume
No
Rail to Truckload - Modal Shift by Spend

M O R G A N S T A N L E Y R E S E A R C H
January 11, 2016 Freight Transportation
Alexander Vecchio, CFA, (212) 761-6233, [email protected]
48
Shipper Modal Shift Statistics – Airfreight to LTL
85%
13%
1%
90%
9%1%
86%
13%
1%
86%
13%
1%
84%
14%
1%0%
10%
20%
30%
40%
50%
60%
70%
80%
90%
100%
No Yes, shifting some volume Yes, shifting a significant amount ofvolume
Dec 14 Mar 15 Jun 15 Sep 15 Dec 15
Source: Morgan Stanley Freight Pulse Surveys
Airfreight to LTL
88%
56%67%
92% 86% 88% 87%
44%
8% 12% 13% 12%
0% 2% 1%
0%10%20%30%40%50%60%70%80%90%
100%
< $
100k
$10
0k to
$500
k
$50
0k to
$1M
M
$1M
M to
$5M
M
$5
MM
to$4
0 M
M
$40
MM
+
Wei
ghte
dAv
gR
espo
nse
% o
f Res
pond
ents
Yes, shifting asignificantamount ofvolume
Yes, shiftingsome volume
No
Airfreight to LTL - Modal Shift by Spend

M O R G A N S T A N L E Y R E S E A R C H
January 11, 2016 Freight Transportation
Alexander Vecchio, CFA, (212) 761-6233, [email protected]
49
Shipper Modal Shift Statistics – LTL to Airfreight
97%
3% 0%
96%
3% 1%
97%
3% 0%
97%
3% 0%
96%
4%0%
0%
10%
20%
30%
40%
50%
60%
70%
80%
90%
100%
No Yes, shifting some volume Yes, shifting a significant amount ofvolume
Dec 14 Mar 15 Jun 15 Sep 15 Dec 15
Source: Morgan Stanley Freight Pulse Surveys
LTL to Airfreight
92%78%
100% 96% 99% 94% 98%
22%
1% 2%
0%10%20%30%40%50%60%70%80%90%
100%
< $
100k
$10
0k to
$500
k
$50
0k to
$1M
M
$1M
M to
$5M
M
$5
MM
to$4
0 M
M
$40
MM
+
Wei
ghte
dAv
gR
espo
nse
% o
f Res
pond
ents
Yes, shifting asignificantamount ofvolume
Yes, shiftingsome volume
No
LTL to Airfreight - Modal Shift by Spend
M O R G A N S T A N L E Y R E S E A R C H
January 11, 2016 Freight Transportation
Alexander Vecchio, CFA, (212) 761-6233, [email protected]
50
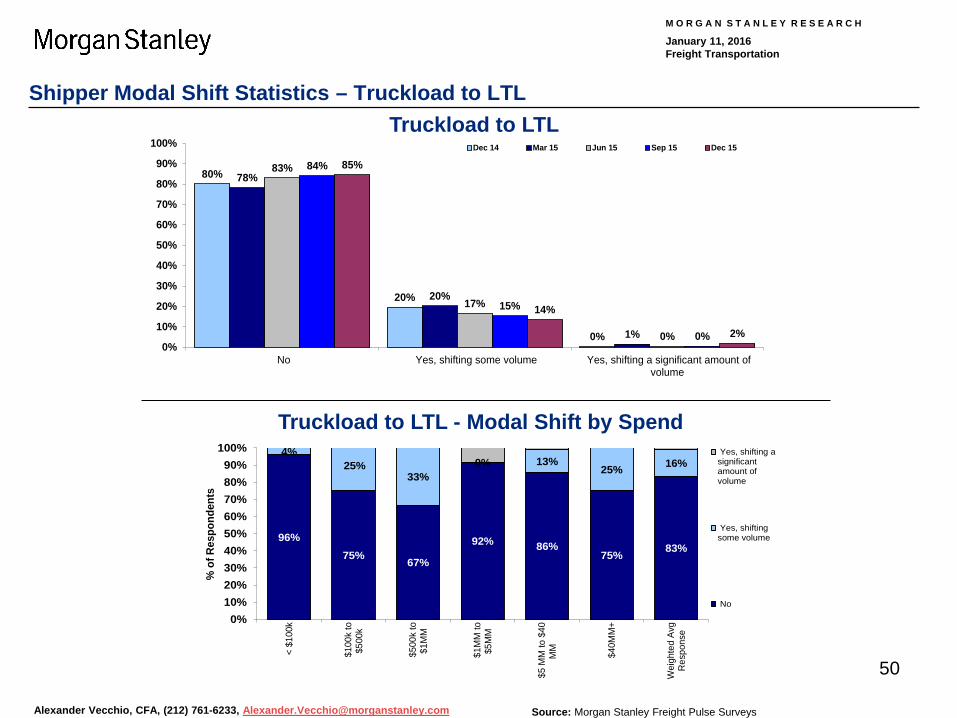
Shipper Modal Shift Statistics – Truckload to LTL
80%
20%
0%
78%
20%
1%
83%
17%
0%
84%
15%
0%
85%
14%
2%0%
10%
20%
30%
40%
50%
60%
70%
80%
90%
100%
No Yes, shifting some volume Yes, shifting a significant amount ofvolume
Dec 14 Mar 15 Jun 15 Sep 15 Dec 15
Source: Morgan Stanley Freight Pulse Surveys
Truckload to LTL
96%75% 67%
92% 86%75% 83%
4%25%
33%0% 13%
25% 16%
0%10%20%30%40%50%60%70%80%90%
100%
< $
100k
$10
0k to
$500
k
$50
0k to
$1M
M
$1M
M to
$5M
M
$5
MM
to $
40M
M
$40
MM
+
Wei
ghte
d Av
gR
espo
nse
% o
f Res
pond
ents
Yes, shifting asignificantamount ofvolume
Yes, shiftingsome volume
No
Truckload to LTL - Modal Shift by Spend

M O R G A N S T A N L E Y R E S E A R C H
January 11, 2016 Freight Transportation
Alexander Vecchio, CFA, (212) 761-6233, [email protected]
51
Shipper Modal Shift Statistics – LTL to Truckload
61%
35%
4%
65%
33%
2%
63%
35%
2%
63%
34%
2%
64%
33%
4%0%
10%
20%
30%
40%
50%
60%
70%
80%
90%
100%
No Yes, shifting some volume Yes, shifting a significant amount ofvolume
Dec 14 Mar 15 Jun 15 Sep 15 Dec 15
Source: Morgan Stanley Freight Pulse Surveys
LTL to Truckload
88%75%
67% 71%61%
44%58%
12%25% 29%
36%
44%37%
0%10%20%30%40%50%60%70%80%90%
100%
< $
100k
$10
0k to
$500
k
$50
0k to
$1M
M
$1M
M to
$5M
M
$5
MM
to$4
0 M
M
$40
MM
+
Wei
ghte
dAv
gR
espo
nse
% o
f Res
pond
ents
Yes, shifting asignificantamount ofvolume
Yes, shiftingsome volume
No
LTL to Truckload - Modal Shift by Spend

M O R G A N S T A N L E Y R E S E A R C H
January 11, 2016 Freight Transportation
Alexander Vecchio, CFA, (212) 761-6233, [email protected]
52
Shipper Modal Shift Statistics – Ocean to Rail
99%
1% 0%
98%
1% 0%
96%
4% 0%
97%
3% 0%
96%
4%0%
0%
10%
20%
30%
40%
50%
60%
70%
80%
90%
100%
No Yes, shifting some volume Yes, shifting a significant amount ofvolume
Dec 14 Mar 15 Jun 15 Sep 15 Dec 15
Source: Morgan Stanley Freight Pulse Surveys
Ocean to Rail
96% 100% 100%88%
99%88%
96%
0%10%20%30%40%50%60%70%80%90%
100%
< $
100k
$10
0k to
$500
k
$50
0k to
$1M
M
$1M
M to
$5M
M
$5
MM
to$4
0 M
M
$40
MM
+
Wei
ghte
dAv
gR
espo
nse
% o
f Res
pond
ents
Yes, shifting asignificantamount ofvolume
Yes, shiftingsome volume
No
Ocean to Rail - Modal Shift by Spend

M O R G A N S T A N L E Y R E S E A R C H
January 11, 2016 Freight Transportation
Alexander Vecchio, CFA, (212) 761-6233, [email protected]
53
Shipper Modal Shift Statistics – Rail to Ocean
97%
2% 1%
97%
3% 0%
97%
3% 0%
97%
3% 0%
97%
3% 0%0%
10%
20%
30%
40%
50%
60%
70%
80%
90%
100%
No Yes, shifting some volume Yes, shifting a significant amount ofvolume
Dec 14 Mar 15 Jun 15 Sep 15 Dec 15
Source: Morgan Stanley Freight Pulse Surveys
Rail to Ocean
96% 100% 100%91%
100%88%
97%
0%10%20%30%40%50%60%70%80%90%
100%
< $
100k
$10
0k to
$500
k
$50
0k to
$1M
M
$1M
M to
$5M
M
$5
MM
to$4
0 M
M
$40
MM
+
Wei
ghte
dAv
gR
espo
nse
% o
f Res
pond
ents
Yes, shifting asignificantamount ofvolume
Yes, shiftingsome volume
No
Rail to Ocean - Modal Shift by Spend

M O R G A N S T A N L E Y R E S E A R C H
January 11, 2016 Freight Transportation
Alexander Vecchio, CFA, (212) 761-6233, [email protected]
54
Shipper Modal Shift Statistics – Airfreight to Ocean
88%
11%
1%
91%
8%1%
86%
13%
1%
90%
9%1%
86%
11%3%
0%
10%
20%
30%
40%
50%
60%
70%
80%
90%
100%
No Yes, shifting some volume Yes, shifting a significant amount ofvolume
Dec 14 Mar 15 Jun 15 Sep 15 Dec 15
Source: Morgan Stanley Freight Pulse Surveys
Airfreight to Ocean
88%
63% 67%88% 87% 94% 88%
8% 11% 10%
0%10%20%30%40%50%60%70%80%90%
100%
< $
100k
$10
0k to
$500
k
$50
0k to
$1M
M
$1M
M to
$5M
M
$5
MM
to$4
0 M
M
$40
MM
+
Wei
ghte
dAv
gR
espo
nse
% o
f Res
pond
ents
Yes, shifting asignificantamount ofvolume
Yes, shiftingsome volume
No
Airfreight to Ocean - Modal Shift by Spend

M O R G A N S T A N L E Y R E S E A R C H
January 11, 2016 Freight Transportation
Alexander Vecchio, CFA, (212) 761-6233, [email protected]
55
Shipper Modal Shift Statistics – Ocean to Airfreight
92%
7%1%
90%
9%2%
94%
5%1%
94%
6%0%
94%
6%0%
0%
10%
20%
30%
40%
50%
60%
70%
80%
90%
100%
No Yes, shifting some volume Yes, shifting a significant amount ofvolume
Dec 14 Mar 15 Jun 15 Sep 15 Dec 15
Source: Morgan Stanley Freight Pulse Surveys
Ocean to Airfreight
96% 100%
33%
88%97% 94% 96%
0% 3% 4%
0%10%20%30%40%50%60%70%80%90%
100%
< $
100k
$10
0k to
$500
k
$50
0k to
$1M
M
$1M
M to
$5M
M
$5
MM
to$4
0 M
M
$40
MM
+
Wei
ghte
dAv
gR
espo
nse
% o
f Res
pond
ents
Yes, shifting asignificantamount ofvolume
Yes, shiftingsome volume
No
Ocean to Airfreight - Modal Shift by Spend

M O R G A N S T A N L E Y R E S E A R C H
January 11, 2016 Freight Transportation
Alexander Vecchio, CFA, (212) 761-6233, [email protected]
56
Shipper Modal Shift Statistics – Barge to Rail
99%
1% 0%
98%
2% 0%
97%
3% 0%
98%
2% 0%
98%
2% 0%0%
10%
20%
30%
40%
50%
60%
70%
80%
90%
100%
No Yes, shifting some volume Yes, shifting a significant amount ofvolume
Dec 14 Mar 15 Jun 15 Sep 15 Dec 15
Source: Morgan Stanley Freight Pulse Surveys
Barge to Rail
100%89%
100% 100% 97% 100% 98%
0%10%20%30%40%50%60%70%80%90%
100%
< $
100k
$10
0k to
$500
k
$50
0k to
$1M
M
$1M
M to
$5M
M
$5
MM
to$4
0 M
M
$40
MM
+
Wei
ghte
dAv
gR
espo
nse
% o
f Res
pond
ents
Yes, shifting asignificantamount ofvolume
Yes, shiftingsome volume
No
Barge to Rail - Modal Shift by Spend

M O R G A N S T A N L E Y R E S E A R C H
January 11, 2016 Freight Transportation
Alexander Vecchio, CFA, (212) 761-6233, [email protected]
57
Shipper Modal Shift Statistics – Rail to Barge
93%
7%0%
95%
5%0%
94%
6%0%
98%
2% 0%
96%
3% 1%0%
10%
20%
30%
40%
50%
60%
70%
80%
90%
100%
No Yes, shifting some volume Yes, shifting a significant amount ofvolume
Dec 14 Mar 15 Jun 15 Sep 15 Dec 15
Source: Morgan Stanley Freight Pulse Surveys
Rail to Barge
96% 100% 100% 96% 98% 94% 97%
6% 3%
0%10%20%30%40%50%60%70%80%90%
100%
< $
100k
$10
0k to
$500
k
$50
0k to
$1M
M
$1M
M to
$5M
M
$5
MM
to $
40M
M
$40
MM
+
Wei
ghte
d Av
gR
espo
nse
% o
f Res
pond
ents
Yes, shifting asignificantamount ofvolume
Yes, shiftingsome volume
No
Rail to Barge - Modal Shift by Spend
M O R G A N S T A N L E Y R E S E A R C H
January 11, 2016 Freight Transportation
Alexander Vecchio, CFA, (212) 761-6233, [email protected]
58
Intermodal vs. Truck: Intermodal Discount Over Time
Source: Morgan Stanley Freight Pulse Surveys
12%
13%
14%
15%
16%
17%
18%
19%
20%S
ep 0
6
Sep
07
Oct
08
Sep
09
Sep
10
Ap
r 11
Sep
11
Mar
12
Sep
12
Mar
13
Sep
13
Mar
14
Sep
14
Mar
15
Sep
15
Ave
rag
e In
term
od
al %
Dis
cou
nt
vs. T
L
Discount Excluding Fuel Historical Average (ex. Fuel)
What discount is being offered in the marketplace for intermodal services when compared to TL services in a similar lane?

M O R G A N S T A N L E Y R E S E A R C H
January 11, 2016 Freight Transportation
Alexander Vecchio, CFA, (212) 761-6233, [email protected]
59
Summary of Contents
Part 1: General Freight Industry Trends 1. Service Trends 2. Capacity Trends 3. Modal Shift 4. Intermodal vs. Truck
Part 2: Macro Trends 1. Inventories and Orders 2. Economic Outlook
About the Surveys
General Freight Trends
Rail Trends
Truck Trends
Parcel Trends

M O R G A N S T A N L E Y R E S E A R C H
January 11, 2016 Freight Transportation
Alexander Vecchio, CFA, (212) 761-6233, [email protected]
60
Shipper Inventory and Stocking Trends
Source: Morgan Stanley Freight Pulse Surveys
38%33%
30%28%
44%
28%
0%5%
10%15%20%25%30%35%40%45%50%
Higher Same Lower
% o
f Res
pond
ents
Inventory Ordering
Shipper Inventories and Orders Relative to Last Year

M O R G A N S T A N L E Y R E S E A R C H
January 11, 2016 Freight Transportation
Alexander Vecchio, CFA, (212) 761-6233, [email protected]
61
17%10%
41%46%42%47%36%
22%31%
45%
28%33%28%31%34%36%33%39%42%45%40%36%28%25%28%
36%
22%
31%34%43%37%
39%
43%
45%
39%
43%36%47%45%44%38%51%43%41%39%46%
45%48%
47%44%
47%
68%
28%20%15%16%
25%35%
24%16%
29%31%25%24%22%26%
16%18%17%16%15%19%25%28%28%
0%10%20%30%40%50%60%70%80%90%
100%
% o
f Res
pond
ents
Higher Same Lower
43% 41% 41% 46% 46% 45%36% 40% 41% 45% 49% 42% 42%
51%37% 35%
34%45% 44% 37% 34% 39%
45% 37% 32% 33% 30%31% 39%
38%
45% 43%
23%14% 15% 17% 20% 17% 19% 23% 26% 23% 21% 26% 20%
11% 18% 22%
0%10%20%30%40%50%60%70%80%90%
100%
% o
f Res
pond
ents
Maintain current inventory levels Reduce inventory levels Increase inventory levels
Shipper Inventory and Stocking Trends
Source: Morgan Stanley Freight Pulse Surveys
Y/Y Change in Shippers' Inventory Y/Y Change in Shippers' Orders

M O R G A N S T A N L E Y R E S E A R C H
January 11, 2016 Freight Transportation
Alexander Vecchio, CFA, (212) 761-6233, [email protected]
62
Assessing Restocking Potential: Net Inventory Trends and Inventory Plans
Source: Morgan Stanley Freight Pulse Surveys
-70%
-50%
-30%
-10%
10%
30%
50%
70%
-50%-40%-30%-20%-10%
0%10%20%30%40%50%
Apr 0
9
Apr 1
0
Jan
11
Jun
11
Dec
11
Jun
12
Dec
12
Jun
13
Dec
13
Jun
14
Dec
14
Jun
15
Dec
15
Net O
rder
ing
/ Inv
ento
ry(%
Hig
her Y
/Y -
% L
ower
)
Net C
hg in
Ord
erin
g Le
ss N
et C
hg
in In
vent
ory
(Ordering - Inventory) (LHS)
Net Ordering (RHS)
Net Inventory (RHS)
45%44%43%43%46%43%41%41%46%46%45%36%40%41%45%49%
42%42%51%
37%35%
35%33%44%39%37%
34%45%44%37%34%39%
45%37%32%33%30%
31%39%
38%
45%43%
20%23%
13%17%17%23%
14%15%17%20%17%19%23%26%
23%21%26%
20%11%
18%22%
0%10%20%30%40%50%60%70%80%90%
100%
Jan
11A
pr 1
1Ju
n 11
Sep
11D
ec 1
1M
ar 1
2Ju
n 12
Sep
12D
ec 1
2M
ar 1
3Ju
n 13
Sep
13D
ec 1
3M
ar 1
4Ju
n 14
Sep
14D
ec 1
4M
ar 1
5Ju
n 15
Sep
15D
ec 1
5
% o
f Res
pond
ents
Increaseinventory levels
Reduce inventorylevels
Maintain currentinventory levels
Shippers' Net Y/Y Orders vs. Net Y/Y Inventory Shippers' Inventory Plans

M O R G A N S T A N L E Y R E S E A R C H
January 11, 2016 Freight Transportation
Alexander Vecchio, CFA, (212) 761-6233, [email protected]
63
5.6
7.1
4.2
5.6
4.4
5.4
6.25.9
5.2 5.1
4.0
4.5
5.0
5.5
6.0
6.5
7.0
7.5
8.0StrongEconomy
No Change
Recession
Economic Outlook: Average Across All Shippers
State of the Economy from Shippers’ Perspective
Source: Morgan Stanley Freight Pulse Surveys

M O R G A N S T A N L E Y R E S E A R C H
January 11, 2016 Freight Transportation
Alexander Vecchio, CFA, (212) 761-6233, [email protected]
64
10.0
7.7
6.0 5.7 5.7 5.4 5.3 5.2 5.1 5.0 4.7 4.5 4.5 4.3
123456789
1011
Agric
ultu
re
Fina
ncia
l / L
egal
Serv
ices
Fore
st /
Build
ing…
Auto
mot
ive
Phar
mac
eutic
al
Reta
iling 3P
L
Oth
er In
dust
ry
Man
ufac
turin
g
Food
and
Beve
rage
Min
ing
Indu
s Eq
uip
/Ca
p G
oods
Pape
r &Pa
ckag
ing
Com
pute
r /Te
ch
Strong Economy
No Change
Recession
Economic Outlook: Granular View by Spend and Shipper Industry
Source: Morgan Stanley Freight Pulse Surveys
State of Economy - All Shippers

M O R G A N S T A N L E Y R E S E A R C H
January 11, 2016 Freight Transportation
Alexander Vecchio, CFA, (212) 761-6233, [email protected]
65
1
2
3
4
5
6
7
8
9
10 Food and Beverage Retailing Chemical
Manufacturing Metals and Mining Automotive
StrongEconomy
No Change
Recession
Economic Outlook: View by Industry Over Time
Shippers’ Historical View of the Economy by Industry Segment
Source: Morgan Stanley Freight Pulse Surveys

M O R G A N S T A N L E Y R E S E A R C H
January 11, 2016 Freight Transportation
Alexander Vecchio, CFA, (212) 761-6233, [email protected]
66
Summary of Contents
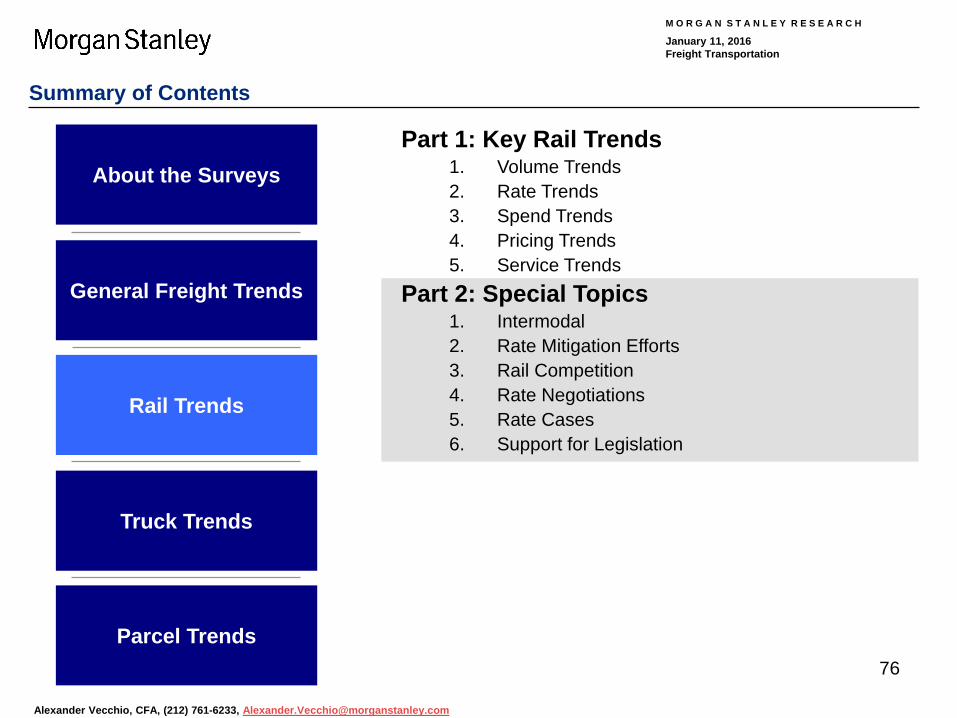
Part 1: Key Rail Trends 1. Volume Trends 2. Rate Trends 3. Spend Trends 4. Pricing Trends 5. Service Trends
Part 2: Special Topics 1. Intermodal 2. Rate Mitigation Efforts 3. Rail Competition 4. Rate Negotiations 5. Rate Cases 6. Support for Legislation
About the Surveys
General Freight Trends
Rail Trends
Truck Trends
Parcel Trends
M O R G A N S T A N L E Y R E S E A R C H
January 11, 2016 Freight Transportation
Alexander Vecchio, CFA, (212) 761-6233, [email protected]
67
Rail Volume Trends: Forward 6 Month YoY Volume Expectations
1% 1% 1% 3%
16%
26%
32%
15%
3%0% 0%
0%
5%
10%
15%
20%
25%
30%
35%
-25%+ -25% to -16%
-15% to -9%
-8% to -4%
-3% to -1%
NoChange
+1% to+3%
+4% to+8%
+9% to+15%
+16% to+25%
25%+
% o
f Res
pond
ents
0.2
1.8 1.6 1.82.6
3.32.6
1.50.9 0.9
1.3
0.5 0.7 0.8 -0.1
-2.0-1.5
2.62.0
2.4
4.03.3 3.2
2.2 2.53.1 3.1 3.2
2.4
3.4
2.4 2.43.1 2.9 2.9
1.92.6
1.7
0.5 0.5
-3-2-1012345
Nor
mal
ized
Exp
ecte
d Vo
l. Tr
end
Source: Morgan Stanley Freight Pulse Surveys
YoY Volume Growth Expectations for Next 6 Mo. by Range
MS Expected Rail Volume Change Index

M O R G A N S T A N L E Y R E S E A R C H
January 11, 2016 Freight Transportation
Alexander Vecchio, CFA, (212) 761-6233, [email protected]
68
YoY Volume Growth Expectations
Rail Volume Trends: Forward 6 Month YoY Volume Expectations by Segment
26% 22% 30%
24% 26%30%
50% 52%40%
0%10%20%30%40%50%60%70%80%90%
100%
All Shippers LargeShippers
SmallShippers
% o
f Res
pond
ents
Increase
Decrease
No Change
0.8%
-2.8%-3.5%-3.0%-2.5%-2.0%-1.5%-1.0%-0.5%0.0%0.5%1.0%1.5%
Large Shippers Small Shippers
Expe
ctat
ions
for N
ext 6
Mo.
-6.3%
1.0%
-1.6%
2.0%
0.8% 0.5% 0.6%
-7%
-6%
-5%
-4%
-3%
-2%
-1%
0%
1%
2%
3%
$0 -$100k
$100 -$500k
$500k -$1mm
$1 -$5mm
$5 -$20mm
Over$20mm
WeightedAvg
Response
Source: Morgan Stanley Freight Pulse Surveys
YoY Volume Growth Expectations 6 Mo. YoY Volume Growth Expectation by
Spend

M O R G A N S T A N L E Y R E S E A R C H
January 11, 2016 Freight Transportation
Alexander Vecchio, CFA, (212) 761-6233, [email protected]
69
Rail Rate Trends: Forward 6 Month YoY Rate Expectations
2.9%0.0% 1.5% 0.0%
4.4%
29.4%26.5%
32.4%
1.5% 1.5% 0.0%0%
5%
10%
15%
20%
25%
30%
35%
-15%+ -15% to -11%
-10% to -6%
-5% to -3%
-2% to -1%
NoChange
+1% to+2%
+3% to+5%
+6% to+10%
+11% to+15%
15%+
% o
f Res
pond
ents
2.7
1.9
1.0
2.21.92.6
4.4 4.4
5.6 5.9
3.53.33.5
2.72.72.6
1.2
2.53.13.1
4.33.6
3.73.5 3.6
2.52.82.62.62.42.62.42.9
2.72.73.2 3.33.4
1.71.4
01234567
Nor
mal
ized
Exp
ecte
d R
ate
Tren
d
Source: Morgan Stanley Freight Pulse Surveys
YoY Rate Growth Expectations for Next 6 Mo. by Range
MS Expected Rate Change Index

M O R G A N S T A N L E Y R E S E A R C H
January 11, 2016 Freight Transportation
Alexander Vecchio, CFA, (212) 761-6233, [email protected]
70
Rail Rate Trends: Forward 6 Month YoY Rate Expectations by Segment
29% 22%40%
9%8%
10%
62% 70%50%
0%10%20%30%40%50%60%70%80%90%
100%
All Shippers LargeShippers
SmallShippers
% o
f Res
pond
ents
Increase
Decrease
No Change
2.0%
-0.5%-1.0%
-0.5%
0.0%
0.5%
1.0%
1.5%
2.0%
2.5%
Large Shippers Small Shippers
Expe
ctat
ions
for N
ext 6
Mo.
-4.5%
0.0%
1.7%2.4%
2.0% 1.8% 1.9%
-5%
-4%
-3%
-2%
-1%
0%
1%
2%
3%
$0 -$100k
$100 -$500k
$500k -$1mm
$1 -$5mm
$5 -$20mm
Over$20mm
WeightedAvg
Response
Source: Morgan Stanley Freight Pulse Surveys
6 Mo. YoY Rate Growth Expectation by Spend
YoY Rate Growth Expectations
YoY Rate Growth Expectations

M O R G A N S T A N L E Y R E S E A R C H
January 11, 2016 Freight Transportation
Alexander Vecchio, CFA, (212) 761-6233, [email protected]
71
Rail Spend Trends: Forward 6 Month YoY Spend Expectations
3%0% 0% 1%
7%
28%
40%
18%
1% 0% 0%
-5%
5%
15%
25%
35%
45%
55%
(30%)+ (30) to(21%)
(20) to(11%)
(10) to(6%)
(5) to(1%)
NoChange
1 to 5% 6 to 10% 11 to 20% 21 to 30% 30%+
% o
f Res
pond
ents
Source: Morgan Stanley Freight Pulse Surveys
YoY Rail Spend Growth Expectations for Next 6 Mo. by Range
M O R G A N S T A N L E Y R E S E A R C H
January 11, 2016 Freight Transportation
Alexander Vecchio, CFA, (212) 761-6233, [email protected]
72
Rail Spend Trends: Forward 6 Month YoY Spend Expectations by Segment
28% 22%40%
12%14%
60% 64%50%
0%10%20%30%40%50%60%70%80%90%
100%
All Shippers LargeShippers
SmallShippers
% o
f Res
pond
ents
Increase
Decrease
No Change
2.0%
-1.5%-2%-2%-1%-1%0%1%1%2%2%3%
Large Shippers Small Shippers
Expe
ctat
ion
for N
ext 6
Mo.
-10.0%
1.5%2.4% 2.5% 2.0% 1.8% 1.9%
-12%
-10%
-8%
-6%
-4%
-2%
0%
2%
4%
$0 -$100k
$100 -$500k
$500k -$1mm
$1 -$5mm
$5 -$20mm
Over$20mm
WeightedAvg
Response
Source: Morgan Stanley Freight Pulse Surveys
6 Mo. YoY Spend Growth Expectation by Spend
Spend Expectations by Size
YoY Spend Growth Expectations

M O R G A N S T A N L E Y R E S E A R C H
January 11, 2016 Freight Transportation
Alexander Vecchio, CFA, (212) 761-6233, [email protected]
73
Rail Pricing Trends: Renewal Rates
0%
10%
5% 4% 4%
6%6%
15%
7%
4%
12%
3% 3% 3%
1%
0%
3%
8%
3% 3% 3%
0%
2%
4%
6%
8%
10%
12%
14%
16%
18%
$0 - $100k $100 -$500k
$500k -$1mm
$1 - $5mm $5 -$20mm
Over$20mm
WeightedAvg
Response
YoY
Incr
ease
in R
ates
Ex-
Fuel
FP 38 (Jun15) FP 39 (Sep15) FP 40 (Dec15)
Source: Morgan Stanley Freight Pulse Surveys
Expectations for Current Year YoY Pricing Ex-Fuel by Spend

M O R G A N S T A N L E Y R E S E A R C H
January 11, 2016 Freight Transportation
Alexander Vecchio, CFA, (212) 761-6233, [email protected]
74
Rail Service Trends: Average Service Levels
5.96.4 6.2 6.1 5.8
5.4 5.5 5.5 5.55.8 5.5
5.9 5.86.3 6.5 6.2 6.2
5.8 5.8 5.8 6.0 5.9 6.0 6.0 6.1 6.06.5 6.6
6.2 6.45.9
5.3 5.6 5.5 5.5 5.3 5.6 5.9 6.2
123456789
10
Source: Morgan Stanley Freight Pulse Surveys
Average Service Levels (Scale 1 = Worst to 10 = Best)

M O R G A N S T A N L E Y R E S E A R C H
January 11, 2016 Freight Transportation
Alexander Vecchio, CFA, (212) 761-6233, [email protected]
75
Rail Service Trends: Detail
6.16.16.56.46.15.95.45.65.85.96.15.76.36.26.66.96.36.15.85.55.65.85.65.86.05.95.96.26.66.06.35.75.05.25.35.24.95.55.76.1
02468
10
5.76.25.96.05.75.45.45.25.15.55.35.65.56.16.16.16.25.96.06.06.26.26.26.16.36.26.76.66.56.56.15.76.05.85.95.85.76.16.2
02468
10
Source: Morgan Stanley Freight Pulse Surveys
Service Reliability (Scale 1 = Worst to 10 = Best)
Value for Dollar (Scale 1 = Worst to 10 = Best)
M O R G A N S T A N L E Y R E S E A R C H
January 11, 2016 Freight Transportation
Alexander Vecchio, CFA, (212) 761-6233, [email protected]
76
Summary of Contents
Part 1: Key Rail Trends 1. Volume Trends 2. Rate Trends 3. Spend Trends 4. Pricing Trends 5. Service Trends
Part 2: Special Topics 1. Intermodal 2. Rate Mitigation Efforts 3. Rail Competition 4. Rate Negotiations 5. Rate Cases 6. Support for Legislation
About the Surveys
General Freight Trends
Rail Trends
Truck Trends
Parcel Trends

M O R G A N S T A N L E Y R E S E A R C H
January 11, 2016 Freight Transportation
Alexander Vecchio, CFA, (212) 761-6233, [email protected]
77
Intermodal: What Factors Are Impacting Your Use of Intermodal Most?
Source: Morgan Stanley Freight Pulse Surveys
Avg. Response on Scale of 1 (Least Impact) to 10 (Most Impact)
6.3 6.85.6
5.0 4.6 4.5
6.1 6.6
5.3 5.24.4 4.1
5.56.3
5.4 5.24.4 4.2
5.56.4
5.05.7
4.5 4.1
123456789
10
TL Rates HaveRisen to Point
Where IntermodalIs Competitive
Intermodal is morefuel efficient
Turning to theIntermodal
Alternative MoreOften During
Periods of TightCapacity
RailroadIntermodal Service
Has Improved
Strong ImportGrowth
Strong ExportGrowth
FP 37 (Mar15) FP 38 (Jun15) FP 39 (Sep15) FP 40 (Dec15)

M O R G A N S T A N L E Y R E S E A R C H
January 11, 2016 Freight Transportation
Alexander Vecchio, CFA, (212) 761-6233, [email protected]
78
Intermodal: Average % Discount to Truckload Carriers?
11121314151617181920
Avg.
Rai
l % D
isco
unt t
o Tr
uckl
oad
Avg. Excl. Fuel = 15.5%
Source: Morgan Stanley Freight Pulse Surveys
Avg. Discount Excl. Fuel

M O R G A N S T A N L E Y R E S E A R C H
January 11, 2016 Freight Transportation
Alexander Vecchio, CFA, (212) 761-6233, [email protected]
79
Rate Mitigation: What Have You Done in an Effort to Reduce Railroad Spend ?
5.9 5.65.1
4.65.4 5.5
5.9
4.55.4
5.95.5
4.65.0
5.75.1
4.4
1
2
3
4
5
6
7
8
9
10
Have Not Made AnyChanges; are Paying Higher
Rail Rates
Moved Freight to AnotherMode (i.e. Truck or Barge)
Moved Freight to AnotherRailroad
Changed Sourcing Facility toIncrease Competitive Options
FP 37 (Mar15) FP 38 (Jun15) FP 39 (Sep15) FP 40 (Dec15)StronglyAgree
StronglyDisagree
Source: Morgan Stanley Freight Pulse Surveys
All Shippers
M O R G A N S T A N L E Y R E S E A R C H
January 11, 2016 Freight Transportation
Alexander Vecchio, CFA, (212) 761-6233, [email protected]
80
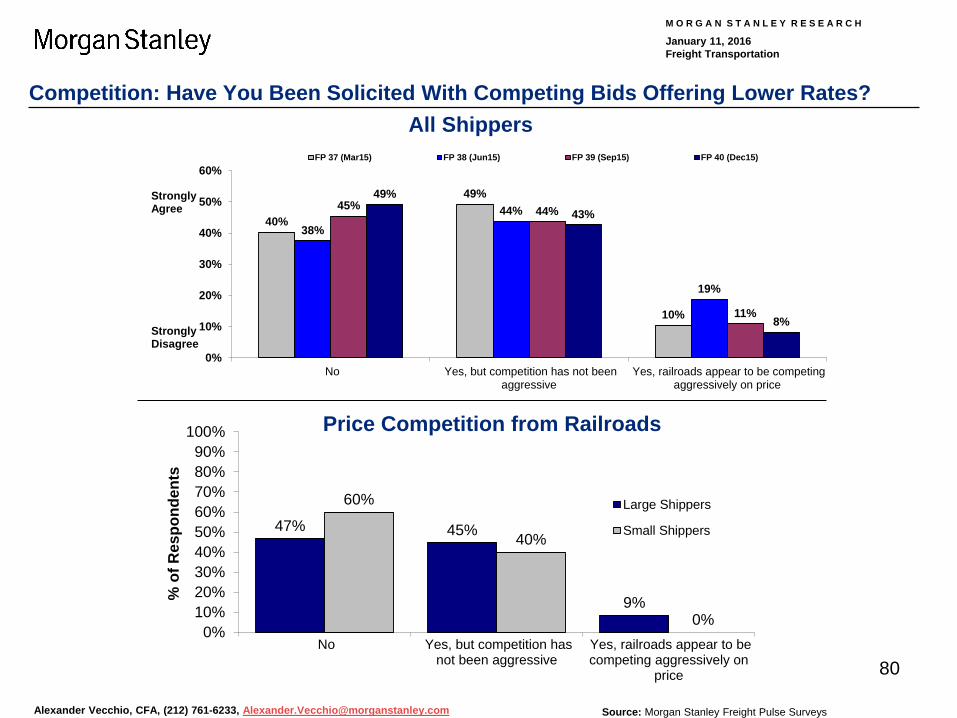
Competition: Have You Been Solicited With Competing Bids Offering Lower Rates?
47% 45%
9%
60%
40%
0%0%
10%20%30%40%50%60%70%80%90%
100%
No Yes, but competition hasnot been aggressive
Yes, railroads appear to becompeting aggressively on
price
% o
f Res
pond
ents
Large Shippers
Small Shippers
Source: Morgan Stanley Freight Pulse Surveys
Price Competition from Railroads
All Shippers
40%
49%
10%
38%44%
19%
45% 44%
11%
49%
43%
8%
0%
10%
20%
30%
40%
50%
60%
No Yes, but competition has not beenaggressive
Yes, railroads appear to be competingaggressively on price
FP 37 (Mar15) FP 38 (Jun15) FP 39 (Sep15) FP 40 (Dec15)
StronglyAgree
StronglyDisagree

M O R G A N S T A N L E Y R E S E A R C H
January 11, 2016 Freight Transportation
Alexander Vecchio, CFA, (212) 761-6233, [email protected]
81
Rail Rate Negotiations: Rate the Difficulty of Recent Rate Negotiations
5.6
6.1
6.7
6.9 7.0 6.8
7.0 7.0
6.9
6.3
6.8
6.4 6.6
6.5 6.4 6.4
6.8
6.3
6.9 7.0
6.9 6.7
6.2
6.7
5.0
5.5
6.0
6.5
7.0
7.5
Sep-09
Apr-10
Sep-10
Jan-11
Apr-11
Jun-11
Sep-11
Dec-11
Mar-12
Jun-12
Sep-12
Dec-12
Mar-13
Jun-13
Sep-13
Dec-13
Mar-14
Jun-14
Sep-14
Dec-14
Mar-15
Jun-15
Sep-15
Dec-15
Source: Morgan Stanley Freight Pulse Surveys
Scale of 1 (Least Difficult) to 10 (Most Difficult)

M O R G A N S T A N L E Y R E S E A R C H
January 11, 2016 Freight Transportation
Alexander Vecchio, CFA, (212) 761-6233, [email protected]
82
Legislation: Do You Expect to Take a More Active Role in Legislative Rail Reform?
19% 26%
50%50%
60%
31% 24%40%
0%10%20%30%40%50%60%70%80%90%
100%
All Shippers Large Shippers Small Shippers
% o
f Res
pond
ents
Don'tKnow
No
Yes
0%10%20%30%40%50%60%
Source: Morgan Stanley Freight Pulse Surveys
Action on Legislative Rail Reform
% Respondents Saying "Yes"

M O R G A N S T A N L E Y R E S E A R C H
January 11, 2016 Freight Transportation
Alexander Vecchio, CFA, (212) 761-6233, [email protected]
83
Summary of Contents
Part 1: Key Truck Trends 1. Capacity Trends 2. Volume Trends 3. Rate Trends 4. Overall Spend Trends
Part 2: Special Topics 1. Truckload Freight Index 2. Fuel Surcharge Concessions 3. Limitations on Truck to Rail Conversion
About the Surveys
General Freight Trends
Rail Trends
Truck Trends
Parcel Trends

M O R G A N S T A N L E Y R E S E A R C H
January 11, 2016 Freight Transportation
Alexander Vecchio, CFA, (212) 761-6233, [email protected]
84
1
2
3
4
5
6
7
8
9
10M
ay
02
Jan
03
Ju
n 0
3M
ar
04
Se
p 0
4M
ar
05
Se
p 0
5M
ar
06
Se
p 0
6A
pr
07
Se
p 0
7M
ar
08
Oc
t 0
8A
pr
09
Se
p 0
9A
pr
10
Se
p 1
0J
an 1
1A
pr
11
Ju
n 1
1S
ep
11
De
c 1
1M
ar
12
Ju
n 1
2S
ep
12
De
c 1
2M
ar
13
Ju
n 1
3S
ep
13
De
c 1
3M
ar
14
Ju
n 1
4S
ep
14
De
c 1
4M
ar
15
Ju
n 1
5S
ep
15
De
c 1
5
Truckload Intermodal National LTL Regional LTL
Abundant
Balanced
Very Tight
Capacity is:
Shipper Measures for Availability of Truck Capacity
Source: Morgan Stanley Freight Pulse Surveys
Trucking Shipper Responses to “How Would You Currently Characterize the Availability of Equipment?”

M O R G A N S T A N L E Y R E S E A R C H
January 11, 2016 Freight Transportation
Alexander Vecchio, CFA, (212) 761-6233, [email protected]
85
20% 25% 21% 20%
56%58% 61% 65%
24% 17% 18% 14%
0%
10%
20%
30%
40%
50%
60%
70%
80%
90%
100%
Truckload Intermodal National LTL Regional LTLPe
rcen
t of R
espo
nden
ts
Tight
Balanced
Abundant
Shipper Expectations for Availability of Truck Capacity
34% 26% 26% 29%
49% 58% 59% 60%
17% 16% 14% 12%
0%
10%
20%
30%
40%
50%
60%
70%
80%
90%
100%
Truckload Intermodal Regional LTL National LTL
Perc
ent o
f Res
pond
ents
Tight
Balanced
Abundant
Current Capacity Projected Capacity in 6 Months

M O R G A N S T A N L E Y R E S E A R C H
January 11, 2016 Freight Transportation
Alexander Vecchio, CFA, (212) 761-6233, [email protected]
86
3%5%
12%
18%
28%
10%12%
7%
2% 3%
0%
5%
10%
15%
20%
25%
30%
1 2 3 4 5 6 7 8 9 10
TL - % of Respondents
Very TightAbundant
Capacity: Distribution of Truckload Capacity Rankings
7% 8%
19% 20%
23%
6%8%
5%
2% 3%
0%
5%
10%
15%
20%
25%
30%
1 2 3 4 5 6 7 8 9 10
TL - % of Respondents
Very TightAbundant
* Shipper rankings of available capacity where 1= Abundant and 10 = Very Tight Source: Morgan Stanley Freight Pulse Surveys
Current Capacity Projected Capacity in 6 Months
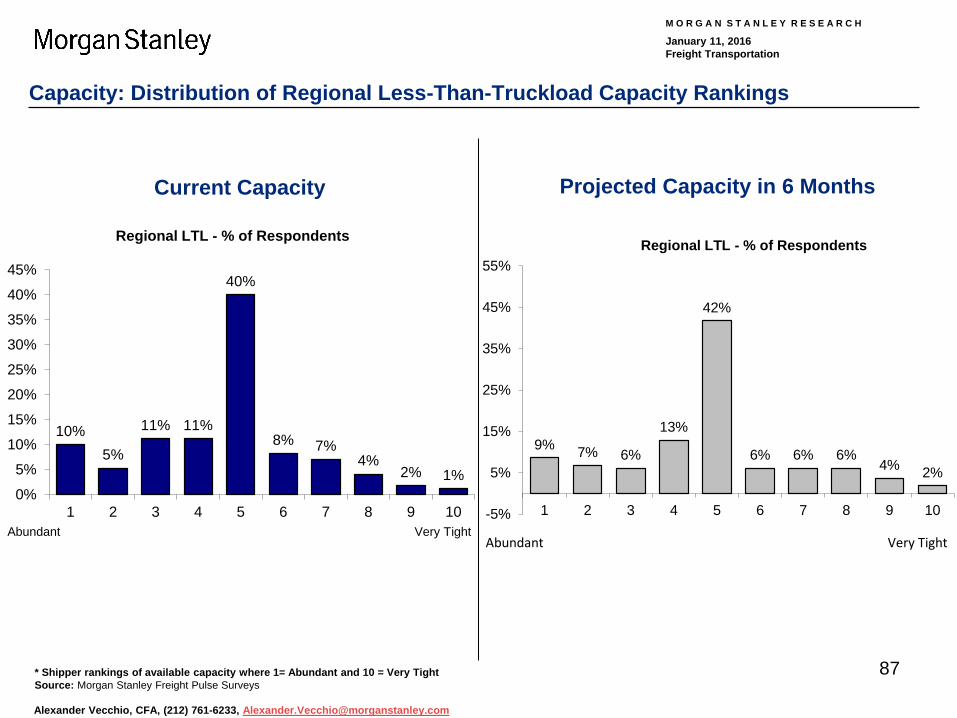
M O R G A N S T A N L E Y R E S E A R C H
January 11, 2016 Freight Transportation
Alexander Vecchio, CFA, (212) 761-6233, [email protected]
87
9% 7% 6%
13%
42%
6% 6% 6%4% 2%
-5%
5%
15%
25%
35%
45%
55%
1 2 3 4 5 6 7 8 9 10
Regional LTL - % of Respondents
Very TightAbundant
Capacity: Distribution of Regional Less-Than-Truckload Capacity Rankings
10%5%
11% 11%
40%
8% 7%4%
2% 1%0%
5%
10%
15%
20%
25%
30%
35%
40%
45%
1 2 3 4 5 6 7 8 9 10
Regional LTL - % of Respondents
Very TightAbundant
* Shipper rankings of available capacity where 1= Abundant and 10 = Very Tight Source: Morgan Stanley Freight Pulse Surveys
Current Capacity Projected Capacity in 6 Months

M O R G A N S T A N L E Y R E S E A R C H
January 11, 2016 Freight Transportation
Alexander Vecchio, CFA, (212) 761-6233, [email protected]
88
9%4%
8%
14%
45%
6% 4% 4% 2% 3%
0%
10%
20%
30%
40%
50%
60%
1 2 3 4 5 6 7 8 9 10
National LTL - % of Respondents
Very TightAbundant
Capacity: Distribution of National Less-Than-Truckload Capacity Rankings
9%6%
13% 12%
40%
8%4% 5%
1% 1%0%
10%
20%
30%
40%
50%
60%
1 2 3 4 5 6 7 8 9 10
National LTL - % of Respondents
Very TightAbundant
* Shipper rankings of available capacity where 1= Abundant and 10 = Very Tight Source: Morgan Stanley Freight Pulse Surveys
Current Capacity Projected Capacity in 6 Months

M O R G A N S T A N L E Y R E S E A R C H
January 11, 2016 Freight Transportation
Alexander Vecchio, CFA, (212) 761-6233, [email protected]
89
2%5%
17%15%
33%
9%6% 5% 4%
2%
0%
5%
10%
15%
20%
25%
30%
35%
40%
45%
1 2 3 4 5 6 7 8 9 10
Intermodal - % of Respondents
Very TightAbundant
Capacity: Distribution of Intermodal Capacity Rankings
6%
1%
19%15%
34%
8%6% 6%
3% 1%0%
5%
10%
15%
20%
25%
30%
35%
40%
45%
1 2 3 4 5 6 7 8 9 10
Intermodal - % of Respondents
Very TightAbundant
* Shipper rankings of available capacity where 1= Abundant and 10 = Very Tight Source: Morgan Stanley Freight Pulse Surveys
Current Capacity Projected Capacity in 6 Months

M O R G A N S T A N L E Y R E S E A R C H
January 11, 2016 Freight Transportation
Alexander Vecchio, CFA, (212) 761-6233, [email protected]
90
Truck Volume Outlook Over The Next 6 Months
Source: Morgan Stanley Freight Pulse Surveys
29%39% 39% 42%
14%12% 14%
10%
58%49% 47% 48%
0%
10%
20%
30%
40%
50%
60%
70%
80%
90%
100%
TL RegionalLTL
NationalLTL
Intermodal
% o
f Res
pond
ents Increase
Decrease
No Change
Shipper Growth Expectations by Mode

M O R G A N S T A N L E Y R E S E A R C H
January 11, 2016 Freight Transportation
Alexander Vecchio, CFA, (212) 761-6233, [email protected]
91
-3%
-2%
-1%
0%
1%
2%
3%
4%
5%
6%
Year
-ove
r-Ye
ar %
LTL
Vol
ume
Cha
nge
Regional LTL National LTL Truckload Intermodal
Volume Response History
Source: Morgan Stanley Freight Pulse Surveys
Trends in Trucking Shippers’ Expectations Over the Next 6 Months vs. the Same Period in the Prior Year”

M O R G A N S T A N L E Y R E S E A R C H
January 11, 2016 Freight Transportation
Alexander Vecchio, CFA, (212) 761-6233, [email protected]
92
Truckload Volume Detail by Spend, Industry, and Response Skew
1.0% 1.1%
2.8%
1.4%
1.8%
2.5%2.4%
0.0%
0.5%
1.0%
1.5%
2.0%
2.5%
3.0%
< $
100k
$10
0k to
$500
k
$50
0k to
$1M
M
$1M
M to
$5M
M
$5
MM
to $
20M
M
$20
MM
+
Wei
ghte
d A
vgR
espo
nse
Source: Morgan Stanley Freight Pulse Surveys
0% 0% 1% 2%
11%
29%
38%
13%
3% 3%1%
0%
5%
10%
15%
20%
25%
30%
35%
40%
-25%+ -25% to
-16%
-15% to
-9%
-8% to
-4%
-3% to
-1%
No Change
+1% to
+3%
+4% to
+8%
+9% to
+15%
+16% to
+25%
25%+
Avg.
Truckload - Y/Y Volume Expectation by Range Truckload - Avg Volume Change by Spend

M O R G A N S T A N L E Y R E S E A R C H
January 11, 2016 Freight Transportation
Alexander Vecchio, CFA, (212) 761-6233, [email protected]
93
National LTL - Y/Y Volume Expectation by Range
National LTL Volume Detail by Spend, Industry, and Response Skew
Source: Morgan Stanley Freight Pulse Surveys
1.3%
2.2%
5.8%
1.9%
0.3%
1.9% 1.6%
0.0%
1.0%
2.0%
3.0%
4.0%
5.0%
6.0%
7.0%
< $
100k
$10
0k to
$500
k
$50
0k to
$1M
M
$1M
M to
$5M
M
$5
MM
to $
20M
M
$20
MM
+
Wei
ghte
d A
vgR
espo
nse
0% 0% 1% 2%
11%
39%
26%
15%
2% 3%1%
0%
5%
10%
15%
20%
25%
30%
35%
40%
45%
-25%+-25% to
-16%
-15% to
-9%
-8% to
-4%
-3% to
-1%
No Change
+1% to
+3%
+4% to
+8%
+9% to
+15%
+16% to
+25%
25%+
Avg.
National LTL - Avg Volume Change by Spend

M O R G A N S T A N L E Y R E S E A R C H
January 11, 2016 Freight Transportation
Alexander Vecchio, CFA, (212) 761-6233, [email protected]
94
Regional LTL - Y/Y Volume Expectation by Range
Regional LTL Volume Detail by Spend, Industry, and Response Skew
1.2%
4.1%
5.4%
2.0%
0.3%
1.8%1.5%
0.0%
1.0%
2.0%
3.0%
4.0%
5.0%
6.0%
< $
100k
$10
0k to
$500
k
$50
0k to
$1M
M
$1M
M to
$5M
M
$5
MM
to $
20M
M
$20
MM
+
Wei
ghte
d A
vgR
espo
nse
Source: Morgan Stanley Freight Pulse Surveys
0% 0% 1% 1%
10%
39%
30%
14%
1%3%
1%0%
5%
10%
15%
20%
25%
30%
35%
40%
45%
-25%+-25% to
-16%
-15% to
-9%
-8% to
-4%
-3% to
-1%
No Change
+1% to
+3%
+4% to
+8%
+9% to
+15%
+16% to
+25%
25%+
Avg.
Regional LTL - Avg Volume Change by Spend

M O R G A N S T A N L E Y R E S E A R C H
January 11, 2016 Freight Transportation
Alexander Vecchio, CFA, (212) 761-6233, [email protected]
95
Intermodal Volume Detail by Spend, Industry, and Response Skew
0.4% 0.4%
0.8%0.7%
0.0%
1.6%
1.3%
0.0%
0.2%
0.4%
0.6%
0.8%
1.0%
1.2%
1.4%
1.6%
1.8%
< $
100k
$10
0k to
$500
k
$50
0k to
$1M
M
$1M
M to
$5M
M
$5
MM
to $
20M
M
$20
MM
+
Wei
ghte
d A
vgR
espo
nse
Source: Morgan Stanley Freight Pulse Surveys
1% 0% 0%2%
7%
42%
33%
11%
3%1% 0%
0%
5%
10%
15%
20%
25%
30%
35%
40%
45%
-25%+-25% to
-16%
-15% to
-9%
-8% to
-4%
-3% to
-1%
No Change
+1% to
+3%
+4% to
+8%
+9% to
+15%
+16% to
+25%
25%+
Avg.
Intermodal - Y/Y Volume Expectation by Range Intermodal - Avg Volume Change by Spend

M O R G A N S T A N L E Y R E S E A R C H
January 11, 2016 Freight Transportation
Alexander Vecchio, CFA, (212) 761-6233, [email protected]
96
Truck Base Rates Outlook Over The Next 6 Months
Source: Morgan Stanley Freight Pulse Surveys
26%37% 36% 43%
24%14% 13%
15%
50% 49% 51% 43%
0%10%20%30%40%50%60%70%80%90%
100%
TL RegionalLTL
NationalLTL
Intermodal
% o
f Res
pond
ents
Increase
Decrease
No Change
0.8%
1.1%1.2%
0.7%
0.3%
0.7%0.8%
0.6%
0.0%
0.2%
0.4%
0.6%
0.8%
1.0%
1.2%
1.4%
TL Regional LTL National LTL Intermodal
Average Change Weighted Average
Base Rates: Average vs. Weighted Average Shipper Rate Expectations by Mode
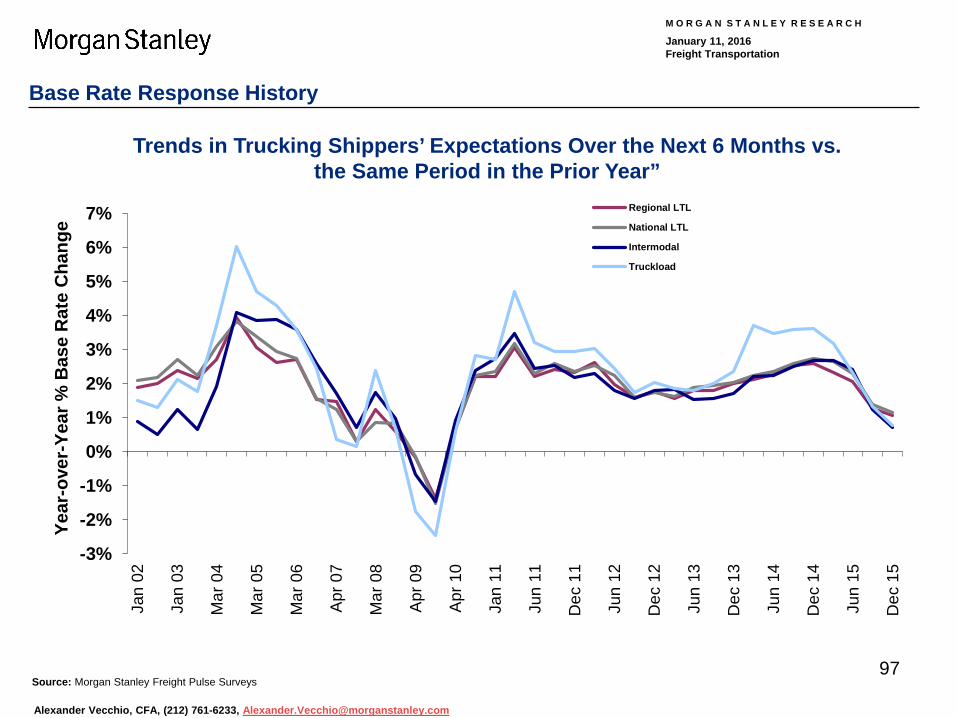
M O R G A N S T A N L E Y R E S E A R C H
January 11, 2016 Freight Transportation
Alexander Vecchio, CFA, (212) 761-6233, [email protected]
97
-3%
-2%
-1%
0%
1%
2%
3%
4%
5%
6%
7%
Jan
02
Jan
03
Mar
04
Mar
05
Mar
06
Apr
07
Mar
08
Apr
09
Apr
10
Jan
11
Jun
11
Dec
11
Jun
12
Dec
12
Jun
13
Dec
13
Jun
14
Dec
14
Jun
15
Dec
15
Year
-ove
r-Ye
ar %
Bas
e R
ate
Cha
nge
Regional LTL
National LTL
Intermodal
Truckload
Base Rate Response History
Source: Morgan Stanley Freight Pulse Surveys
Trends in Trucking Shippers’ Expectations Over the Next 6 Months vs. the Same Period in the Prior Year”

M O R G A N S T A N L E Y R E S E A R C H
January 11, 2016 Freight Transportation
Alexander Vecchio, CFA, (212) 761-6233, [email protected]
98
TL Base Rate Detail by Spend, Industry, and Response Skew
1.4%1.2%
4.2%
2.6%
0.6%0.1% 0.3%
0.0%0.5%1.0%1.5%2.0%2.5%3.0%3.5%4.0%4.5%
< $
100k
$10
0k to
$500
k
$50
0k to
$1M
M
$1M
M to
$5M
M
$5
MM
to $
20M
M
$20
MM
+
Wei
ghte
d A
vgR
espo
nse
Source: Morgan Stanley Freight Pulse Surveys
0% 1% 0%
8%
16%
26%
30%
18%
1% 1% 0%0%
5%
10%
15%
20%
25%
30%
35%
-15%+ -15% to
-11%
-10% to
-6%
-5% to
-3%
-2% to
-1%
No Change
+1% to
+2%
+3% to
+5%
+6% to
+10%
+11% to
+15%
15%+
Truckload - Y/Y Base Rate Expectation by Range TL - Avg Change by Spend

M O R G A N S T A N L E Y R E S E A R C H
January 11, 2016 Freight Transportation
Alexander Vecchio, CFA, (212) 761-6233, [email protected]
99
National LTL Base Rate Detail by Spend, Industry, and Response Skew
0.9%
2.0%
4.5%
2.5%
1.1%0.7% 0.8%
0.0%0.5%1.0%1.5%2.0%2.5%3.0%3.5%4.0%4.5%5.0%
< $
100k
$10
0k to
$500
k
$50
0k to
$1M
M
$1M
M to
$5M
M
$5
MM
to$2
0 M
M
$20
MM
+
Wei
ghte
dA
vgR
espo
nse
Source: Morgan Stanley Freight Pulse Surveys
0% 0%2% 2%
9%
36%
26%23%
2% 1% 0%0%
5%
10%
15%
20%
25%
30%
35%
40%
-15%+-15% to
-11%
-10% to
-6%
-5% to
-3%
-2% to
-1%
No Change
+1% to
+2%
+3% to
+5%
+6% to
+10%
+11% to
+15%
15%+
Avg.
National LTL - Y/Y Base Rate Expectation by Range National LTL - Avg Change by Spend
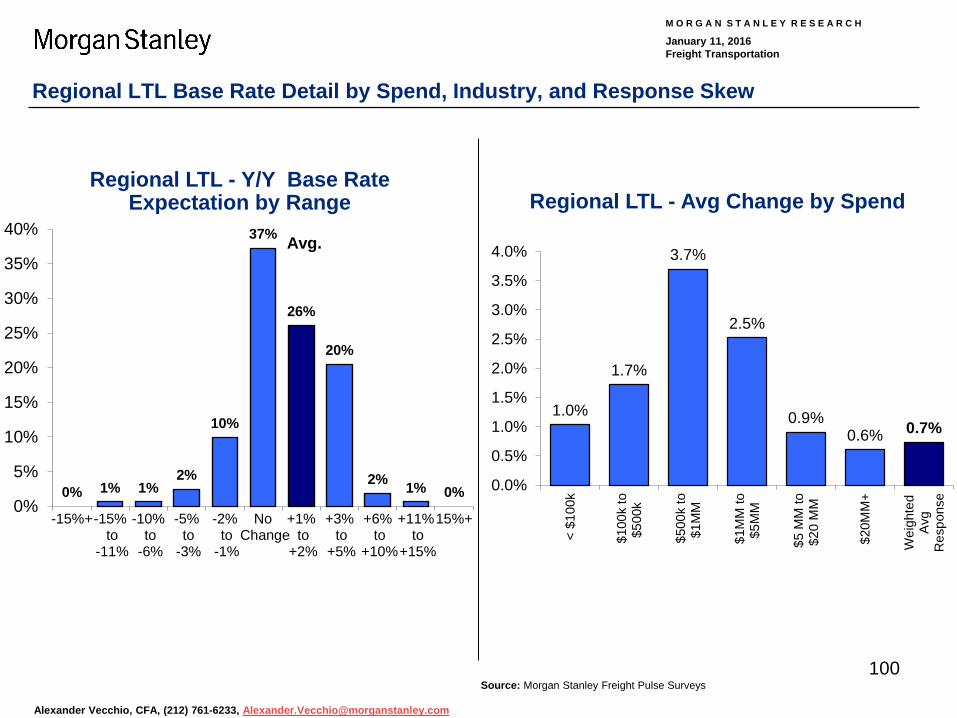
M O R G A N S T A N L E Y R E S E A R C H
January 11, 2016 Freight Transportation
Alexander Vecchio, CFA, (212) 761-6233, [email protected]
100
Regional LTL Base Rate Detail by Spend, Industry, and Response Skew
1.0%
1.7%
3.7%
2.5%
0.9%0.6% 0.7%
0.0%
0.5%
1.0%
1.5%
2.0%
2.5%
3.0%
3.5%
4.0%
< $
100k
$10
0k to
$500
k
$50
0k to
$1M
M
$1M
M to
$5M
M
$5
MM
to$2
0 M
M
$20
MM
+
Wei
ghte
dA
vgR
espo
nse
Source: Morgan Stanley Freight Pulse Surveys
0% 1% 1%2%
10%
37%
26%
20%
2% 1% 0%0%
5%
10%
15%
20%
25%
30%
35%
40%
-15%+-15% to
-11%
-10% to
-6%
-5% to
-3%
-2% to
-1%
No Change
+1% to
+2%
+3% to
+5%
+6% to
+10%
+11% to
+15%
15%+
Avg.
Regional LTL - Y/Y Base Rate Expectation by Range Regional LTL - Avg Change by Spend

M O R G A N S T A N L E Y R E S E A R C H
January 11, 2016 Freight Transportation
Alexander Vecchio, CFA, (212) 761-6233, [email protected]
101
Intermodal Base Rate Detail by Spend, Industry, and Response Skew
0.6%
1.2%
2.7%
1.6%
0.3%
0.6% 0.6%
0.0%
0.5%
1.0%
1.5%
2.0%
2.5%
3.0%
< $
100k
$10
0k to
$500
k
$50
0k to
$1M
M
$1M
M to
$5M
M
$5
MM
to $
20M
M
$20
MM
+
Wei
ghte
d A
vgR
espo
nse
Source: Morgan Stanley Freight Pulse Surveys
0% 0% 1%4%
11%
43%
30%
11%
1% 1% 0%0%
5%
10%
15%
20%
25%
30%
35%
40%
45%
-15%+-15% to
-11%
-10% to
-6%
-5% to
-3%
-2% to
-1%
No Change
+1% to
+2%
+3% to
+5%
+6% to
+10%
+11% to
+15%
15%+
Avg.
Intermodal - Y/Y Base Rate Expectation by Range Intermodal - Avg Change by Spend

M O R G A N S T A N L E Y R E S E A R C H
January 11, 2016 Freight Transportation
Alexander Vecchio, CFA, (212) 761-6233, [email protected]
102
Truck Spend Outlook Over The Next 6 Months
Source: Morgan Stanley Freight Pulse Surveys
17%33% 30% 37%
22%
16%19%
18%
61%51% 52% 45%
0%10%20%30%40%50%60%70%80%90%
100%
TL RegionalLTL
NationalLTL
Intermodal
% o
f Res
pond
ents Increase
Decrease
No Change
Shipper Spend Expectations by Mode

M O R G A N S T A N L E Y R E S E A R C H
January 11, 2016 Freight Transportation
Alexander Vecchio, CFA, (212) 761-6233, [email protected]
103
Truck Spend: Change vs. Prior Survey
Source: Morgan Stanley Freight Pulse Surveys
4%4%
3%3%3% 3%
3% 3%2%2%
2%2%2%
1%2% 2%
0.0%
1.0%
2.0%
3.0%
4.0%
5.0%
6.0%
Truckload Intermodal Regional LTL National LTL
Year
-ove
r-ye
ar C
hang
e %
Mar 15 Jun 15 Sep 15 Dec 15
YoY % Change in You Organization’s Spend Over the Next 6 Months

M O R G A N S T A N L E Y R E S E A R C H
January 11, 2016 Freight Transportation
Alexander Vecchio, CFA, (212) 761-6233, [email protected]
104
Summary of Contents
Part 1: Key Truck Trends 1. Capacity Trends 2. Volume Trends 3. Rate Trends 4. Overall Spend Trends
Part 2: Special Topics 1. Truckload Freight Index 2. Fuel Surcharge Concessions 3. Limitations on Truck to Rail Conversion
About the Surveys
General Freight Trends
Rail Trends
Truck Trends
Parcel Trends

M O R G A N S T A N L E Y R E S E A R C H
January 11, 2016 Freight Transportation
Alexander Vecchio, CFA, (212) 761-6233, [email protected]
105
0
1
2
3
4
5
6
7
8
9
103-
Jan
24-J
an
14-F
eb
7-M
ar
28-M
ar
18-A
pr
9-M
ay
30-M
ay
20-J
un
11-J
ul
1-A
ug
22-A
ug
12-S
ep
3-O
ct
24-O
ct
14-N
ov
5-D
ec
26-D
ec
2009 2010
2011 2012
2006-2014 Average* 2013
2014 2015
2016 Straight line Analysis
Through December 29
Morgan Stanley Truckload Freight Index With Straight-Line Forecast
The index measures the demand for Dry-Van Truckload services compared to the number of Dry-Van trucks on the road. The index begins in April 1994. When a given reading is above prior years’ level, it means there is more freight demand relative to available capacity. When a given reading is below prior years’ level, it means there is less freight demand relative to capacity Source: Morgan Stanley Research

M O R G A N S T A N L E Y R E S E A R C H
January 11, 2016 Freight Transportation
Alexander Vecchio, CFA, (212) 761-6233, [email protected]
106
Truckload Fuel Surcharge Concession History
Source: Morgan Stanley Freight Pulse Surveys
1 2 3 4 5 6 7 8 9
10O
ct 0
8Ap
r 09
Sep
09Ap
r 10
Sep
10Ja
n 11
Apr 1
1Ju
n 11
Sep
11D
ec 1
1M
ar 1
2Ju
n 12
Sep
12D
ec 1
2M
ar 1
3Ju
n 13
Sep
13D
ec 1
3M
ar 1
4Ju
n 14
Sep
14D
ec 1
4M
ar 1
5Ju
n 15
Sep
15D
ec 1
5
Rail doesn't support faster inventory turnoverTL price discounts have offset some of the rail cost differentialOther Factors
StronglyAgree
StronglyDisagree
What Factors are Limiting your Organization from Shipping More Volume on the Railroads?

M O R G A N S T A N L E Y R E S E A R C H
January 11, 2016 Freight Transportation
Alexander Vecchio, CFA, (212) 761-6233, [email protected]
107
6.6 6.4
5.2 5.4 4.9
6.1
4.4
1
2
3
4
5
6
7
8
9
10
Rail doesn'tsupportfaster
inventoryturnover
OtherFactors
Willing topay more forTL service
Rail notcompetitiveon price and
service
Changes insourcingreducedtransport
costs
TL pricediscountshave offsetsome of the
rail costdifferential
Rail not anoption
Dec 14 Mar 15 Jun 15 Sep 15 Dec 15StronglyAgree
StronglyDisagree
Truck to Rail Conversion: Key Obstacles to Overcome
Source: Morgan Stanley Freight Pulse Survey
What Factors are Impacting Your Decision to Keep More Volume with Truckload Carriers?

M O R G A N S T A N L E Y R E S E A R C H
January 11, 2016 Freight Transportation
Alexander Vecchio, CFA, (212) 761-6233, [email protected]
108
Summary of Contents
About the Surveys
General Freight Trends
Rail Trends
Truck Trends
Parcel Trends
Part 1: Volume Trends & Share Shift 1. Volume Outlook 2. Expectations for Total Parcel Spend 3. Product Usage (e.g. Air vs. Ground) 4. B2B vs. B2C 5. Changes in Primary Carrier
Part 2: Pricing Trends 1. Outlook for Parcel Base Rates 2. Measures of Aggressiveness 3. Trends in List Rate Discounts 4. Accessorial Charges
Part 3: Service & Value Trends 1. Service Reliability Rankings 2. Value of Service Rankings

M O R G A N S T A N L E Y R E S E A R C H
January 11, 2016 Freight Transportation
Alexander Vecchio, CFA, (212) 761-6233, [email protected]
109
28%32% 34% 34% 35%
30% 35% 39% 39% 36% 37% 40%35%
43% 38% 36% 39% 43% 39% 37%43% 38% 38% 37%
44%23% 18%
12% 11%14%
16%18% 15%
17%19% 17%
19%
18%18%
8%12%
13% 16%14%
12% 21%12% 13%
29%
45% 47%54% 54% 56%
49%43% 46% 48% 44% 43% 46%
40% 44%
56%48% 44% 45% 49% 46%
41%50% 50%
0%10%20%30%40%50%60%70%80%90%
100%
Sep
-09
Apr
-10
Sep
-10
Jan-
11A
pr-1
1Ju
n-11
Sep
-11
Dec
-11
Mar
-12
Jun-
12S
ep-1
2D
ec-1
2M
ar-1
3Ju
n-13
Sep
-13
Dec
-13
Mar
-14
Jun-
14S
ep-1
4D
ec-1
4M
ar-1
5Ju
n-15
Sep
-15
Dec
-15
No Change Decrease Increase
Parcel Volume Outlook Over the Next 6 Months
Source: Morgan Stanley Parcel Survey
25% 25% 23% 22% 23% 26% 23% 24% 27% 23% 24%29%
23% 23% 25%20% 22%
28% 31%23%
28%22% 23% 22%
30%
15%12% 8% 8%
11% 14% 11% 7% 11% 11%8%
8% 9%10%
6%10%
5%10%
10%8%
10% 10% 7%
45%
60%65%
70% 70%63%
63%65%
66%67% 65% 63% 68% 67%
64%
74%
68%67%
59%67% 64% 67% 67% 70%
0%10%20%30%40%50%60%70%80%90%
100%
Sep
-09
Apr
-10
Sep
-10
Jan-
11A
pr-1
1Ju
n-11
Sep
-11
Dec
-11
Mar
-12
Jun-
12S
ep-1
2D
ec-1
2M
ar-1
3Ju
n-13
Sep
-13
Dec
-13
Mar
-14
Jun-
14S
ep-1
4D
ec-1
4M
ar-1
5Ju
n-15
Sep
-15
Dec
-15
No Change Decrease Increase
42% 42% 41% 41%35%
40%33% 36%
43% 39% 41% 40% 38% 39% 36%31% 33%
44% 45%39% 41%
35%40% 38%
24%
11%5% 4%
4%5%
11% 7%5%
8% 7% 9%6%
11%11%
5%10%
6% 8%
9%9%
12%9%
8%
34%
47%54% 55%
61%55% 56% 57% 52% 53% 51% 51%
55%51% 53%
64%57%
49% 47%53% 50% 53% 51% 55%
0%10%20%30%40%50%60%70%80%90%
100%
Sep
-09
Apr
-10
Sep
-10
Jan-
11A
pr-1
1Ju
n-11
Sep
-11
Dec
-11
Mar
-12
Jun-
12S
ep-1
2D
ec-1
2M
ar-1
3Ju
n-13
Sep
-13
Dec
-13
Mar
-14
Jun-
14S
ep-1
4D
ec-1
4M
ar-1
5Ju
n-15
Sep
-15
Dec
-15
No Change Decrease Increase
% of Shippers Expecting Air to: % of Shippers Expecting Ground to:
% of Shippers Expecting International to:

M O R G A N S T A N L E Y R E S E A R C H
January 11, 2016 Freight Transportation
Alexander Vecchio, CFA, (212) 761-6233, [email protected]
110
Volume Trends by Product
-3%
-2%
-1%
0%
1%
2%
3%
4%
5%
6%
Jan-
02M
ay-0
2Ja
n-03
Jun-
03M
ar-0
4S
ep-0
4A
pr-0
5S
ep-0
5M
ar-0
6S
ep-0
6M
ar-0
7S
ep-0
7A
pr-0
8O
ct-0
8A
pr-0
9S
ep-0
9A
pr-1
0S
ep-1
0Ja
n-11
Apr
-11
Jun-
11S
ep-1
1D
ec-1
1M
ar-1
2Ju
n-12
Sep
-12
Dec
-12
Mar
-13
Jun-
13S
ep-1
3D
ec-1
3M
ar-1
4Ju
n-14
Sep
-14
Dec
-14
Mar
-15
Jun-
15S
ep-1
5D
ec-1
5
Air Ground Int'l
Source: Morgan Stanley Parcel Survey
Volume Growth Expectations “Over the Next 6 Months” vs. Last Year
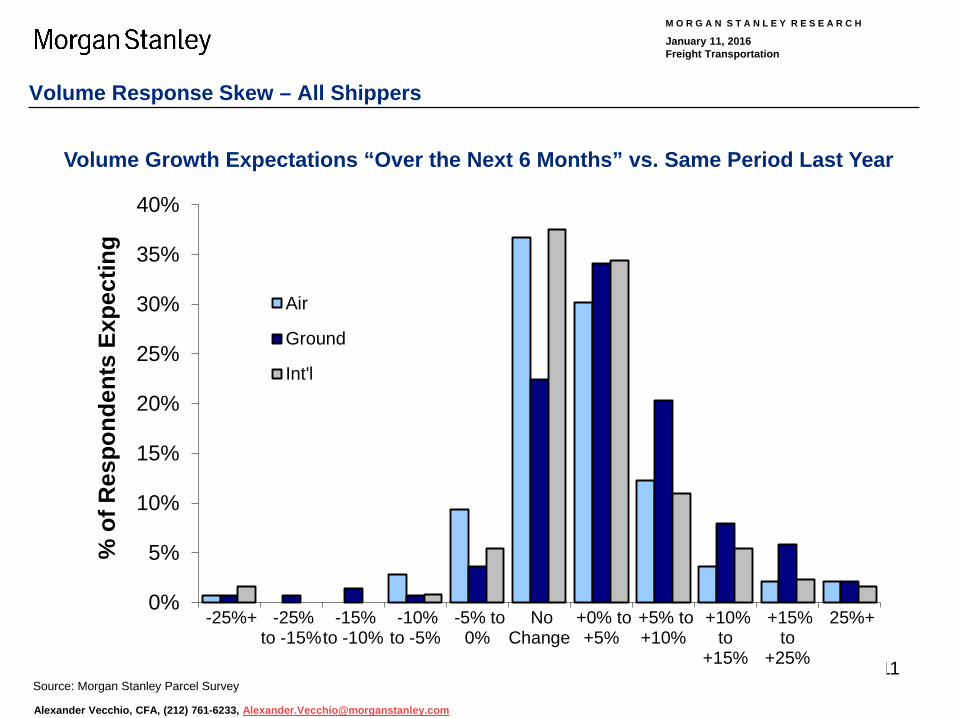
M O R G A N S T A N L E Y R E S E A R C H
January 11, 2016 Freight Transportation
Alexander Vecchio, CFA, (212) 761-6233, [email protected]
111
Volume Response Skew – All Shippers
Source: Morgan Stanley Parcel Survey
0%
5%
10%
15%
20%
25%
30%
35%
40%
-25%+ -25%to -15%
-15%to -10%
-10%to -5%
-5% to0%
NoChange
+0% to+5%
+5% to+10%
+10%to
+15%
+15%to
+25%
25%+
% o
f Res
pond
ents
Exp
ectin
g
Air
Ground
Int'l
Volume Growth Expectations “Over the Next 6 Months” vs. Same Period Last Year

M O R G A N S T A N L E Y R E S E A R C H
January 11, 2016 Freight Transportation
Alexander Vecchio, CFA, (212) 761-6233, [email protected]
112
Volume Growth Outlook by Industry
Source: Morgan Stanley Parcel Survey
1.7% 1.9%
3.1%
6.2%
1.4%2.2%
0%
1%
2%
3%
4%
5%
6%
7%
8%
Man
ufac
turin
g
Who
lesa
le /
Dis
tribu
tion
Ret
ail
3PL
Pro
vide
r
Con
sulta
nt
Oth
er
2.1%
6.3%7.3%
8.8%
1.8%2.5%
0%1%2%3%4%5%6%7%8%9%
10%
Man
ufac
turin
g
Who
lesa
le /
Dis
tribu
tion
Ret
ail
3PL
Pro
vide
r
Con
sulta
nt
Oth
er
1.0%
3.0%
5.9%
7.0%
3.8%
0.0%0%
1%
2%
3%
4%
5%
6%
7%
8%
Man
ufac
turin
g
Who
lesa
le /
Dis
tribu
tion
Ret
ail
3PL
Pro
vide
r
Con
sulta
nt
Oth
er
Air - Avg Change by Industry Ground - Avg Change by Industry
International - Avg Change by Industry

M O R G A N S T A N L E Y R E S E A R C H
January 11, 2016 Freight Transportation
Alexander Vecchio, CFA, (212) 761-6233, [email protected]
113
Volume Growth Outlook by Listed Primary Carrier
Source: Morgan Stanley Parcel Survey
1.1%
3.1%3.3%
0.0%
0.5%
1.0%
1.5%
2.0%
2.5%
3.0%
3.5%
UPS FDX USPSPrimary Carrier
5.5%
3.2%3.8%
0%
1%
2%
3%
4%
5%
6%
UPS FDX USPSPrimary Carrier
2.3%
3.1%
1.8%
2.1%
0.0%
0.5%
1.0%
1.5%
2.0%
2.5%
3.0%
3.5%
UPS FDX USPS DHLPrimary Carrier
Air - Avg Volume Change by Primary Carrier Ground - Avg Volume Change by Primary Carrier
International - Avg Volume Chg by Primary Carrier

M O R G A N S T A N L E Y R E S E A R C H
January 11, 2016 Freight Transportation
Alexander Vecchio, CFA, (212) 761-6233, [email protected]
114
18%20%25%19%16%
21%22%22%20%18%22%25%24%29%30%27%25%22%24%23%21%23%28%23%
44%
23%17%
7% 9%10%11%10% 8% 10%
10%12%16%
14%11%4% 12%
7%12%11%
8%15% 8%
6%
39%
57%58%
75%75%69%67%68%71%72%67%63%60%57%59%
69%63%
70%64%66%71%
62%64%71%
0%10%20%30%40%50%60%70%80%90%
100%
Sep-
09Ap
r-10
Sep-
10Ja
n-11
Apr-1
1Ju
n-11
Sep-
11D
ec-1
1M
ar-1
2Ju
n-12
Sep-
12D
ec-1
2M
ar-1
3Ju
n-13
Sep-
13D
ec-1
3M
ar-1
4Ju
n-14
Sep-
14D
ec-1
4M
ar-1
5Ju
n-15
Sep-
15D
ec-1
5
No Change Decrease Increase
Parcel Spend Outlook Over the Next 6 Months
Source: Morgan Stanley Parcel Survey
18%18%18%15%11%16%20%17%17%12%18%21%17%22%23%20%17%17%23%
15%17%16%20%15%
32%
18%13%
6%7%
7%9%
6% 6%7%
7%9%
6%10% 9% 1%
9% 7%7%
8% 4% 11% 7%4%
49%
65%70%79%83%78%
71%76%77%81%75%70%
77%69%68%
78%75%76%70%77%78%73%73%
80%
0%10%20%30%40%50%60%70%80%90%
100%
Sep-
09Ap
r-10
Sep-
10Ja
n-11
Apr-1
1Ju
n-11
Sep-
11D
ec-1
1M
ar-1
2Ju
n-12
Sep-
12D
ec-1
2M
ar-1
3Ju
n-13
Sep-
13D
ec-1
3M
ar-1
4Ju
n-14
Sep-
14D
ec-1
4M
ar-1
5Ju
n-15
Sep-
15D
ec-1
5
No Change Decrease Increase
32%29%28%27%22%
28%27%24%28%21%26%25%28%28%28%26%24%28%29%26%23%23%
31%26%
28%
14%10%3%
5%
5% 10%5%
5%
5%5% 8% 5% 8% 8% 2%
11% 6% 7%6% 8% 12%
7%8%
40%
57%62%69%74%
67%64%71%67%
73%68%68%66%63%64%
72%65%66%63%68%70%65%62%66%
0%10%20%30%40%50%60%70%80%90%
100%
Sep-
09Ap
r-10
Sep-
10Ja
n-11
Apr-1
1Ju
n-11
Sep-
11D
ec-1
1M
ar-1
2Ju
n-12
Sep-
12D
ec-1
2M
ar-1
3Ju
n-13
Sep-
13D
ec-1
3M
ar-1
4Ju
n-14
Sep-
14D
ec-1
4M
ar-1
5Ju
n-15
Sep-
15D
ec-1
5
No Change Decrease Increase
% of Shippers Expecting Air to: % of Shippers Expecting Ground to:
% of Shippers Expecting International to:
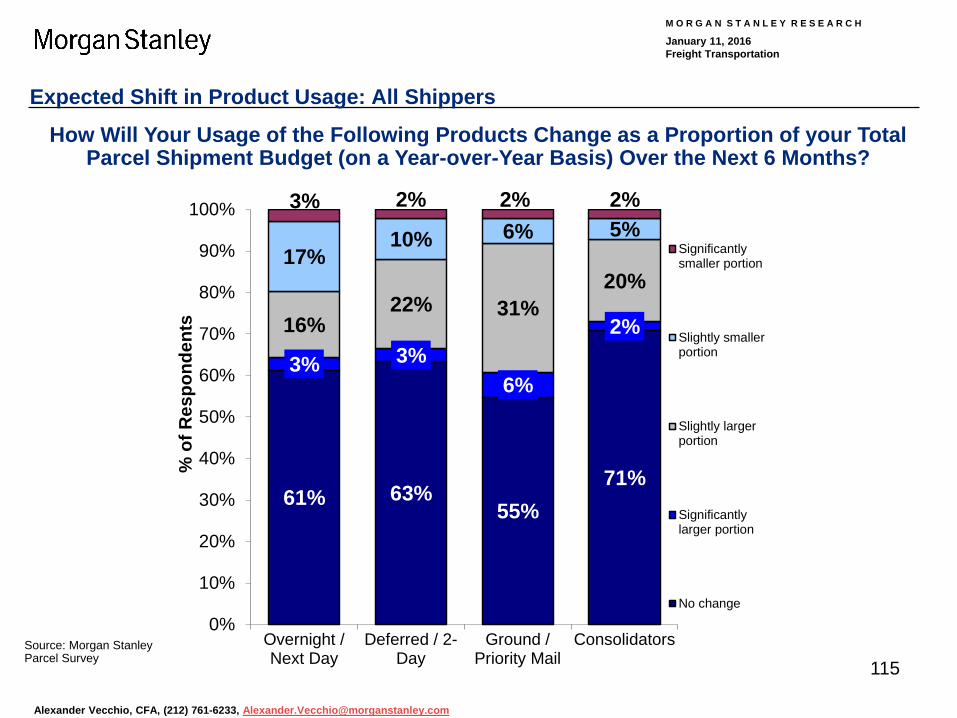
M O R G A N S T A N L E Y R E S E A R C H
January 11, 2016 Freight Transportation
Alexander Vecchio, CFA, (212) 761-6233, [email protected]
115
Expected Shift in Product Usage: All Shippers
61% 63%55%
71%
3% 3%6%
2%16%22% 31%
20%17%
10% 6% 5%3% 2% 2% 2%
0%
10%
20%
30%
40%
50%
60%
70%
80%
90%
100%
Overnight /Next Day
Deferred / 2-Day
Ground /Priority Mail
Consolidators
% o
f Res
pond
ents
Significantlysmaller portion
Slightly smallerportion
Slightly largerportion
Significantlylarger portion
No change
Source: Morgan Stanley Parcel Survey
How Will Your Usage of the Following Products Change as a Proportion of your Total Parcel Shipment Budget (on a Year-over-Year Basis) Over the Next 6 Months?
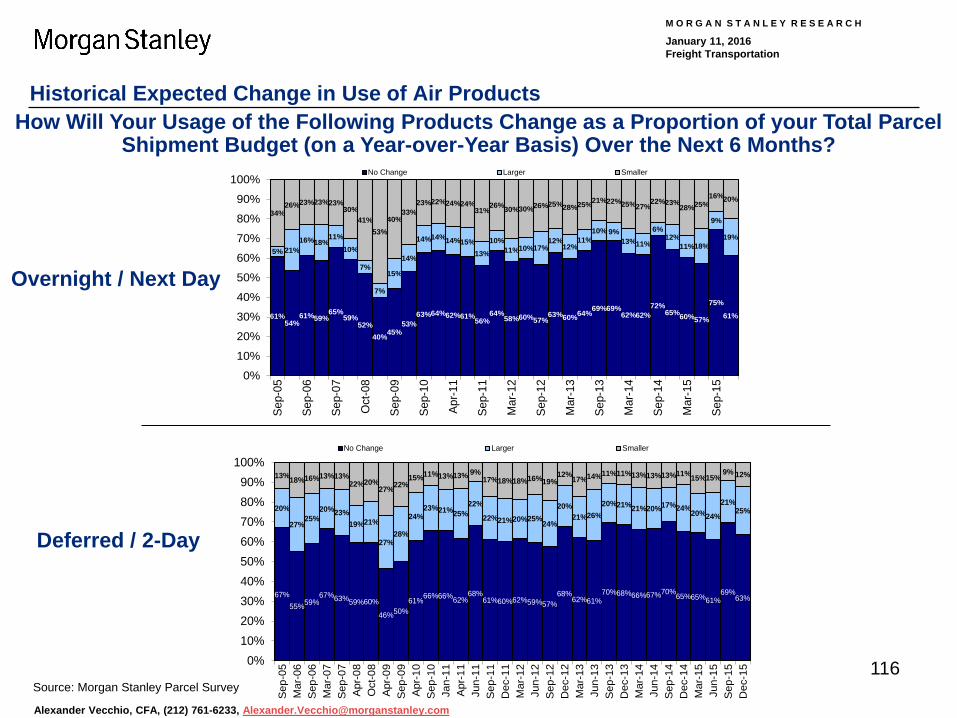
M O R G A N S T A N L E Y R E S E A R C H
January 11, 2016 Freight Transportation
Alexander Vecchio, CFA, (212) 761-6233, [email protected]
116
Historical Expected Change in Use of Air Products
67%55%59%
67%63%59%60%
46%50%61%66%66%62%
68%61%60%62%59%57%
68%62%61%
70%68%66%67%70%65%65%61%69%
63%
20%
27%25%
20%23%19%21%
27%28%
24%23%21%25%
22%
22%21%20%25%24%
20%21%26%
20%21%21%20%17%24%20%24%
21%25%
13%18%16%13%13%22%20%
27%22%15%11%13%13% 9%
17%18%18%16%19%12%17%14%11%11%13%13%13%11%15%15%
9% 12%
0%10%20%30%40%50%60%70%80%90%
100%
Sep
-05
Mar
-06
Sep
-06
Mar
-07
Sep
-07
Apr
-08
Oct
-08
Apr
-09
Sep
-09
Apr
-10
Sep
-10
Jan-
11A
pr-1
1Ju
n-11
Sep
-11
Dec
-11
Mar
-12
Jun-
12S
ep-1
2D
ec-1
2M
ar-1
3Ju
n-13
Sep
-13
Dec
-13
Mar
-14
Jun-
14S
ep-1
4D
ec-1
4M
ar-1
5Ju
n-15
Sep
-15
Dec
-15
No Change Larger Smaller
Source: Morgan Stanley Parcel Survey
61%54%
61%59%65%
59%52%
40%45%53%
63%64%62%61%56%64%
58%60%57%63%60%64%69%69%
62%62%72%
65%60%57%
75%
61%
5% 21%16%18%
11%10%
7%
7%
15%
14%
14%14%14%15%13%
10%11%10%17%
12%12%
11%10% 9%
13%11%
6%12%
11%18%
9%
19%
34%26%23%23%23%
30%41%
53%40%
33%23%22%24%24%
31%26%30%30%26%25%28%25%21%22%25%27%
22%23%28%25%
16%20%
0%
10%
20%
30%
40%
50%
60%
70%
80%
90%
100%
Sep-
05
Sep-
06
Sep-
07
Oct
-08
Sep-
09
Sep-
10
Apr-1
1
Sep-
11
Mar
-12
Sep-
12
Mar
-13
Sep-
13
Mar
-14
Sep-
14
Mar
-15
Sep-
15
No Change Larger Smaller
Overnight / Next Day
Deferred / 2-Day
How Will Your Usage of the Following Products Change as a Proportion of your Total Parcel Shipment Budget (on a Year-over-Year Basis) Over the Next 6 Months?

M O R G A N S T A N L E Y R E S E A R C H
January 11, 2016 Freight Transportation
Alexander Vecchio, CFA, (212) 761-6233, [email protected]
117
Historical Expected Change in Use of Ground and Consolidators
67%74%72%
82%70%73%71%72%
78%74%74%75%77%70%73%73%70%
76%84%
76%74%65%66%
78%71%
28%24%24%
16%
24%19%24%24%20%
23%21%20%19%25%19%20%25%19%
13%19%19%
28%26%14%
22%
5% 2% 4% 2% 6% 8% 5% 5% 1% 3% 5% 5% 3% 5% 8% 7% 5% 5% 2% 5% 6% 7% 8% 8% 7%
0%10%20%30%40%50%60%70%80%90%
100%
Sep
-05
Mar
-06
Sep
-06
Mar
-07
Sep
-07
Apr
-08
Oct
-08
Apr
-09
Sep
-09
Apr
-10
Sep
-10
Jan-
11A
pr-1
1Ju
n-11
Sep
-11
Dec
-11
Mar
-12
Jun-
12S
ep-1
2D
ec-1
2M
ar-1
3Ju
n-13
Sep
-13
Dec
-13
Mar
-14
Jun-
14S
ep-1
4D
ec-1
4M
ar-1
5Ju
n-15
Sep
-15
Dec
-15
No Change Larger Smaller
Source: Morgan Stanley Parcel Survey
65%55%
60%59%59%53%53%48%47%52%
64%54%58%61%
52%59%56%51%51%
58%54%55%58%57%56%54%60%
53%53%51%58%55%
32%41%
36%33%34%42%43%
46%45%43%
32%
38%34%35%
38%31%37%
39%43%38%
42%37%37%40%37%39%32%
37%41%41%34%37%
4% 5% 3%9% 7% 5% 5% 7% 8% 5% 4% 8% 7% 4%
9% 10% 8% 10% 7% 4% 4% 7% 6% 3% 7% 7% 8% 10% 6% 8% 8% 8%
0%
10%
20%
30%
40%
50%
60%
70%
80%
90%
100%
Sep-
05M
ar-0
6Se
p-06
Mar
-07
Sep-
07Ap
r-08
Oct
-08
Apr-0
9Se
p-09
Apr-1
0Se
p-10
Jan-
11Ap
r-11
Jun-
11Se
p-11
Dec
-11
Mar
-12
Jun-
12Se
p-12
Dec
-12
Mar
-13
Jun-
13Se
p-13
Dec
-13
Mar
-14
Jun-
14Se
p-14
Dec
-14
Mar
-15
Jun-
15Se
p-15
Dec
-15
No Change Larger Smaller
Ground
Consolidators
How Will Your Usage of the Following Products Change as a Proportion of your Total Parcel Shipment Budget (on a Year-over-Year Basis) Over the Next 6 Months?
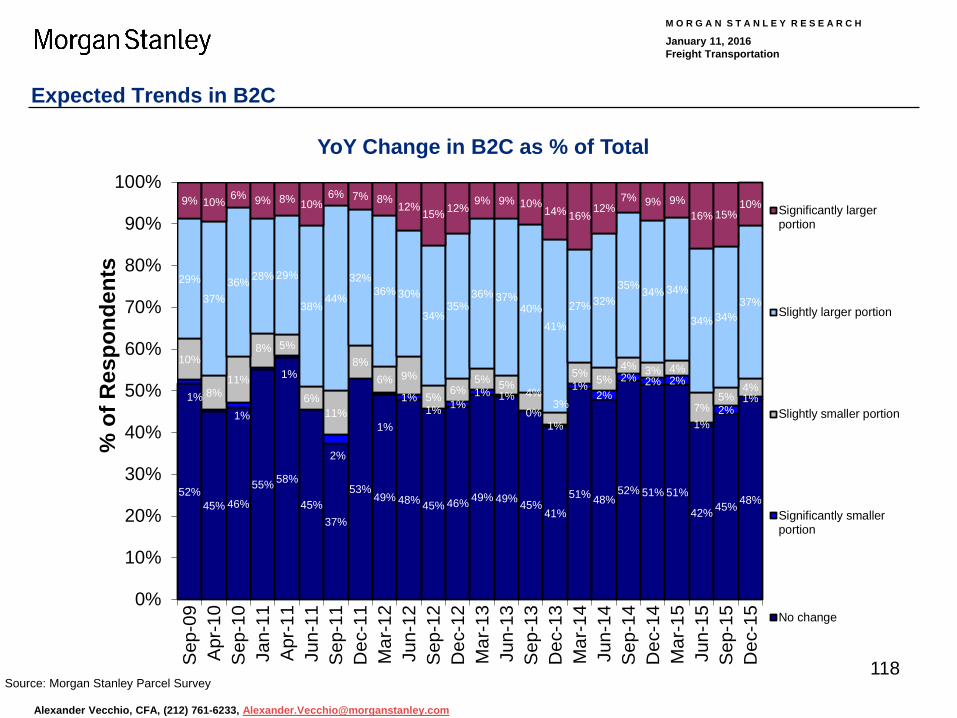
M O R G A N S T A N L E Y R E S E A R C H
January 11, 2016 Freight Transportation
Alexander Vecchio, CFA, (212) 761-6233, [email protected]
52%45% 46%
55% 58%
45%37%
53%49% 48% 45% 46% 49% 49% 45%
41%
51% 48%52% 51% 51%
42% 45% 48%
1%1%
1%
2%
1%
1%1% 1%
1% 1%0%
1%
1%2%
2% 2% 2%
1%2%
1%
10%
8%11%
8% 5%
6%11%
8%6% 9%
5% 6%5% 5%
4%3%
5% 5%4% 3% 4%
7%5%
4%
29%
37%36% 28% 29%
38%44%
32%36% 30%
34%35%
36% 37%40%
41%
27% 32%35% 34% 34%
34% 34%37%
9% 10% 6% 9% 8% 10%6% 7% 8%
12%15% 12%
9% 9% 10%14% 16%
12%7% 9% 9%
16% 15%10%
0%
10%
20%
30%
40%
50%
60%
70%
80%
90%
100%S
ep-0
9A
pr-1
0S
ep-1
0Ja
n-11
Apr
-11
Jun-
11S
ep-1
1D
ec-1
1M
ar-1
2Ju
n-12
Sep
-12
Dec
-12
Mar
-13
Jun-
13S
ep-1
3D
ec-1
3M
ar-1
4Ju
n-14
Sep
-14
Dec
-14
Mar
-15
Jun-
15S
ep-1
5D
ec-1
5
% o
f Res
pond
ents
Significantly largerportion
Slightly larger portion
Slightly smaller portion
Significantly smallerportion
No change
118
Expected Trends in B2C
Source: Morgan Stanley Parcel Survey
YoY Change in B2C as % of Total

M O R G A N S T A N L E Y R E S E A R C H
January 11, 2016 Freight Transportation
Alexander Vecchio, CFA, (212) 761-6233, [email protected]
119
Expected Trends in B2C
Source: Morgan Stanley Parcel Survey
38%
46%
42%36% 37%
49% 50%
39%44%
42%
49%47%45%
46%50%
55%
43%45%
42%43%43%
50%
49%47%
0%
10%
20%
30%
40%
50%
60%
70%Se
p-09
Apr-1
0Se
p-10
Jan-
11Ap
r-11
Jun-
11Se
p-11
Dec
-11
Mar
-12
Jun-
12Se
p-12
Dec
-12
Mar
-13
Jun-
13Se
p-13
Dec
-13
Mar
-14
Jun-
14Se
p-14
Dec
-14
Mar
-15
Jun-
15Se
p-15
Dec
-15
UPS FDX Total
% of Respondents Indicating Increase in B2C Shipping as % of Total

M O R G A N S T A N L E Y R E S E A R C H
January 11, 2016 Freight Transportation
Alexander Vecchio, CFA, (212) 761-6233, [email protected]
120
% of Respondents Switching Primary Carriers Over Time
0%
5%
10%
15%
20%
25%
30%
35%
40%
Apr-0
5Se
p-05
Mar
-06
Sep-
06M
ar-0
7Se
p-07
Apr-0
8O
ct-0
8Ap
r-09
Sep-
09Ap
r-10
Sep-
10Ja
n-11
Apr-1
1Ju
n-11
Sep-
11D
ec-1
1M
ar-1
2Ju
n-12
Sep-
12D
ec-1
2M
ar-1
3Ju
n-13
Sep-
13D
ec-1
3M
ar-1
4Ju
n-14
Sep-
14D
ec-1
4M
ar-1
5Ju
n-15
Sep-
15D
ec-1
5
Air Ground Int'l
Source: Morgan Stanley Parcel Survey
% of Shippers Switching Primary Carriers Over the Past 6 Months

M O R G A N S T A N L E Y R E S E A R C H
January 11, 2016 Freight Transportation
Alexander Vecchio, CFA, (212) 761-6233, [email protected]
121
Air Switching: Reasons for Switch and Primary Carrier
Source: Morgan Stanley Parcel Survey
20%
30%
40%
50%
60%
70%
80%
90%
100%Price Related Service Related
50%
47%
44%
44%
48%
53%
47%
45%
56%47%48%48%49%49%54%
67%
46%41%
49%49%53%49%45%47%49%
46%
46%
50%
49%
46%
40%
48%
48%
35%46%45%40%38%42%37%
28%
47%49%
44%42%43%
43%46%44%
47%
0%
20%
40%
60%
80%
100%
Apr
-09
Apr
-10
Jan-
11
Jun-
11
Dec
-11
Jun-
12
Dec
-12
Jun-
13
Dec
-13
Jun-
14
Dec
-14
Jun-
15
Dec
-15
Cum
ulat
ive
Mar
ket S
hare
(%)
Other
USPS
DHL
FDX
UPS
Air: Reason for Switching Primary Carriers Air: Dollar-weighted Market Share

M O R G A N S T A N L E Y R E S E A R C H
January 11, 2016 Freight Transportation
Alexander Vecchio, CFA, (212) 761-6233, [email protected]
122 Source: Morgan Stanley Parcel Survey
Ground Switching: Reasons for Switch and Primary Carrier
20%
30%
40%
50%
60%
70%
80%
90%
100% Price Related Service Related
59%
54%
51%
59%
54%
59%
61%
57%
73%
53%56%52%58%56%60%
66%
49%50%52%55%60%54%
49%50%58%
36%35%
37%
34%41%
33%
27%35%
21%
38%35%38%
32%34%29%20%
38%37%36%29%
32%33%
36%35%
33%
0%
20%
40%
60%
80%
100%
Apr
-09
Apr
-10
Jan-
11
Jun-
11
Dec
-11
Jun-
12
Dec
-12
Jun-
13
Dec
-13
Jun-
14
Dec
-14
Jun-
15
Dec
-15
Cum
ulat
ive
Mar
ket S
hare
(%)
Other
USPS
DHL
FDX
UPS
Ground: Reason for Switching Primary Carriers Ground: Dollar-weighted Market Share

M O R G A N S T A N L E Y R E S E A R C H
January 11, 2016 Freight Transportation
Alexander Vecchio, CFA, (212) 761-6233, [email protected]
123 Source: Morgan Stanley Parcel Survey
International Switching: Reasons for Switch and Primary Carrier
10%20%30%40%50%60%70%80%90%
100% Price Related Service Related
35%38%34%31%34%34%35%34%35%28%
39%34%38%33%40%
49%
34%31%40%
30%34%34%28%
40%33%
34%42%45%
39%36%41%39%43%34%46%28%42%32%
31%
36%20%38%
37%33%
36%40%
30%32%
35%
32%
0%
20%
40%
60%
80%
100%
Apr
-09
Apr
-10
Jan-
11
Jun-
11
Dec
-11
Jun-
12
Dec
-12
Jun-
13
Dec
-13
Jun-
14
Dec
-14
Jun-
15
Dec
-15
Cum
ulat
ive
Mar
ket S
hare
(%)
Other
USPS
DHL
FDX
UPS
International: Reason for Switching Primary Carriers
International: Dollar-weighted Market Share

M O R G A N S T A N L E Y R E S E A R C H
January 11, 2016 Freight Transportation
Alexander Vecchio, CFA, (212) 761-6233, [email protected]
124
Summary of Contents
About the Surveys
General Freight Trends
Rail Trends
Truck Trends
Parcel Trends
Part 1: Volume Trends & Share Shift 1. Volume Outlook 2. Expectations for Total Parcel Spend 3. Product Usage (e.g. Air vs. Ground) 4. B2B vs. B2C 5. Changes in Primary Carrier
Part 2: Pricing Trends 1. Outlook for Parcel Base Rates 2. Measures of Aggressiveness 3. Trends in List Rate Discounts 4. Accessorial Charges
Part 3: Service & Value Trends 1. Service Reliability Rankings 2. Value of Service Rankings

M O R G A N S T A N L E Y R E S E A R C H
January 11, 2016 Freight Transportation
Alexander Vecchio, CFA, (212) 761-6233, [email protected]
125
Parcel Pricing Outlook Over the Next 6 Months
Source: Morgan Stanley Parcel Survey
35% 38%31%
25% 21%27% 23% 20%
31%23%
29% 24% 28% 29% 30% 26% 26% 26% 28%21% 22%
30% 34%
22%
21%8%
7%
4% 8%6% 11%
7%
5%
6%3%
7%8% 8% 9%
4% 9% 5% 5%8% 7%
8%6%
7%
44%53%
62%72% 71% 67% 66%
73%64%
71% 68% 69%64% 63% 61%
69% 65% 68% 67% 71% 71%62% 61%
71%
0%10%20%30%40%50%60%70%80%90%
100%
Sep-
09Ap
r-10
Sep-
10Ja
n-11
Apr-1
1Ju
n-11
Sep-
11D
ec-1
1M
ar-1
2Ju
n-12
Sep-
12D
ec-1
2M
ar-1
3Ju
n-13
Sep-
13D
ec-1
3M
ar-1
4Ju
n-14
Sep-
14D
ec-1
4M
ar-1
5Ju
n-15
Sep-
15D
ec-1
5
No Change Decrease Increase
29% 33%28%
20% 17% 21% 22% 20%25% 21% 21% 22% 25% 28% 25% 28% 26% 23% 24% 22% 19%
28% 32%
20%
26%11%
10%
5%7%
9% 11%9%
7%9% 7% 9%
10%11% 13% 6% 8%
6% 8% 8%9%
9%8%
9%
45%56%
63%
75% 77%70% 67% 71% 68% 69% 72% 69% 65% 61% 62% 66% 65%
72% 69% 69% 72%62% 60%
72%
0%10%20%30%40%50%60%70%80%90%
100%
Sep-
09Ap
r-10
Sep-
10Ja
n-11
Apr-1
1Ju
n-11
Sep-
11D
ec-1
1M
ar-1
2Ju
n-12
Sep-
12D
ec-1
2M
ar-1
3Ju
n-13
Sep-
13D
ec-1
3M
ar-1
4Ju
n-14
Sep-
14D
ec-1
4M
ar-1
5Ju
n-15
Sep-
15D
ec-1
5
No Change Decrease Increase
28% 32%23% 20% 16% 20% 18% 17%
22% 19% 19% 18%24% 23% 25% 21% 21% 19% 22%
17% 19%24% 24%
17%
25%12%
10%
5%6%
7% 12%6%
7%6% 6% 8%
8% 11% 10%6% 8%
5% 4%9% 8%
8% 6%
7%
48%57%
67%75% 78%
73% 70%77%
71% 75% 75% 74%68% 66% 66%
73% 71% 76% 74% 74% 73%68% 70%
77%
0%10%20%30%40%50%60%70%80%90%
100%
Sep-
09Ap
r-10
Sep-
10Ja
n-11
Apr-1
1Ju
n-11
Sep-
11D
ec-1
1M
ar-1
2Ju
n-12
Sep-
12D
ec-1
2M
ar-1
3Ju
n-13
Sep-
13D
ec-1
3M
ar-1
4Ju
n-14
Sep-
14D
ec-1
4M
ar-1
5Ju
n-15
Sep-
15D
ec-1
5
No Change Decrease Increase
% of Shippers Expecting Air to: % of Shippers Expecting Ground to:
% of Shippers Expecting International to:

M O R G A N S T A N L E Y R E S E A R C H
January 11, 2016 Freight Transportation
Alexander Vecchio, CFA, (212) 761-6233, [email protected]
126
Pricing Trends by Product: Large vs. Small Shipper
-0.5%0.0%0.5%1.0%1.5%2.0%2.5%3.0%3.5%4.0%4.5%
Jan-
02M
ay-0
2Ja
n-03
Jun-
03M
ar-0
4S
ep-0
4A
pr-0
5S
ep-0
5M
ar-0
6S
ep-0
6M
ar-0
7S
ep-0
7A
pr-0
8O
ct-0
8A
pr-0
9S
ep-0
9A
pr-1
0S
ep-1
0Ja
n-11
Apr
-11
Jun-
11S
ep-1
1D
ec-1
1M
ar-1
2Ju
n-12
Sep
-12
Dec
-12
Mar
-13
Jun-
13S
ep-1
3D
ec-1
3M
ar-1
4Ju
n-14
Sep
-14
Dec
-14
Mar
-15
Jun-
15S
ep-1
5D
ec-1
5
Air Ground Int'l
Source: Morgan Stanley Parcel Survey
Average Base Rate Expectations "Over the Next 6 Months" vs. Last Year

M O R G A N S T A N L E Y R E S E A R C H
January 11, 2016 Freight Transportation
Alexander Vecchio, CFA, (212) 761-6233, [email protected]
127
Base Rate Response Skew – All Shippers
Source: Morgan Stanley Parcel Survey
0%
5%
10%
15%
20%
25%
30%
35%
40%
45%Air
Ground
Int'l
Base Rate Growth Expectations “Over the Next 6 Months” vs. Same Period Last Year

M O R G A N S T A N L E Y R E S E A R C H
January 11, 2016 Freight Transportation
Alexander Vecchio, CFA, (212) 761-6233, [email protected]
128
Pricing Outlook by Industry
Source: Morgan Stanley Parcel Survey
2.1%
1.4%
2.5%2.9% 3.1%
-0.3%-1.0%-0.5%0.0%0.5%1.0%1.5%2.0%2.5%3.0%3.5%
Man
ufac
turin
g
Who
lesa
le /
Dis
tribu
tion
Ret
ail
3PL
Prov
ider
Con
sulta
nt
Oth
er
2.3%2.1%
2.3%
3.5%
2.7%
-0.2%-0.5%0.0%0.5%1.0%1.5%2.0%2.5%3.0%3.5%4.0%
Man
ufac
turin
g
Who
lesa
le /
Dis
tribu
tion
Ret
ail
3PL
Prov
ider
Con
sulta
nt
Oth
er
2.3%
1.9%
2.3%
3.0% 3.1%
0.8%
0.0%
0.5%
1.0%
1.5%
2.0%
2.5%
3.0%
3.5%
Man
ufac
turin
g
Who
lesa
le /
Dis
tribu
tion
Ret
ail
3PL
Prov
ider
Con
sulta
nt
Oth
er
Air - Avg Change by Industry Ground - Avg Change by Industry
International - Avg Change by Industry
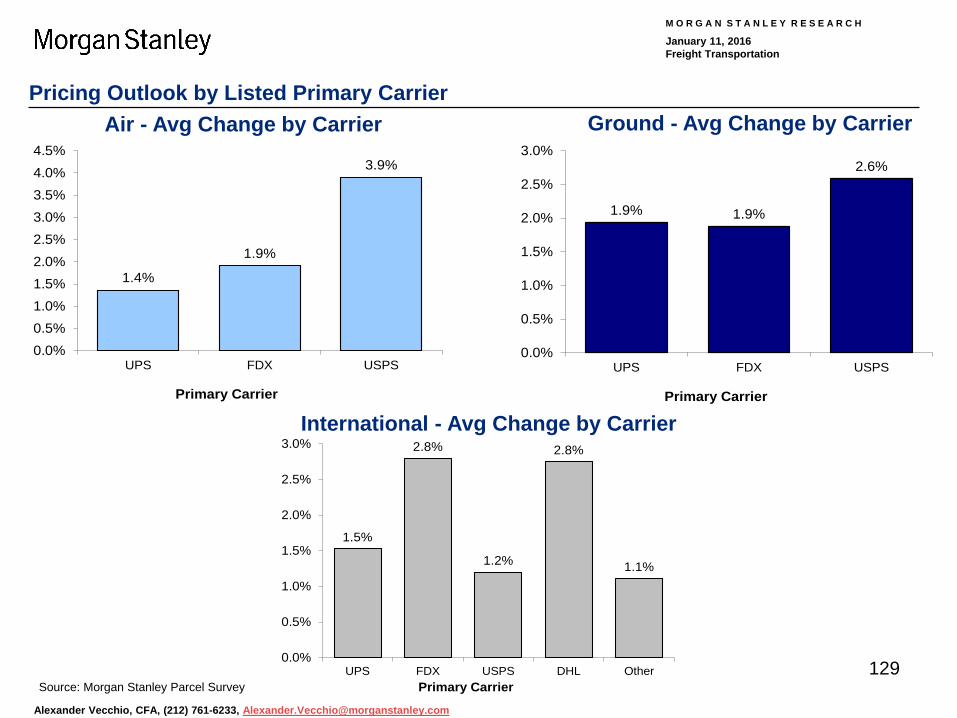
M O R G A N S T A N L E Y R E S E A R C H
January 11, 2016 Freight Transportation
Alexander Vecchio, CFA, (212) 761-6233, [email protected]
129
Pricing Outlook by Listed Primary Carrier
Source: Morgan Stanley Parcel Survey
1.4%
1.9%
3.9%
0.0%0.5%1.0%1.5%2.0%2.5%3.0%3.5%4.0%4.5%
UPS FDX USPS
Primary Carrier
1.9% 1.9%
2.6%
0.0%
0.5%
1.0%
1.5%
2.0%
2.5%
3.0%
UPS FDX USPS
Primary Carrier
1.5%
2.8%
1.2%
2.8%
1.1%
0.0%
0.5%
1.0%
1.5%
2.0%
2.5%
3.0%
UPS FDX USPS DHL OtherPrimary Carrier
Air - Avg Change by Carrier Ground - Avg Change by Carrier
International - Avg Change by Carrier
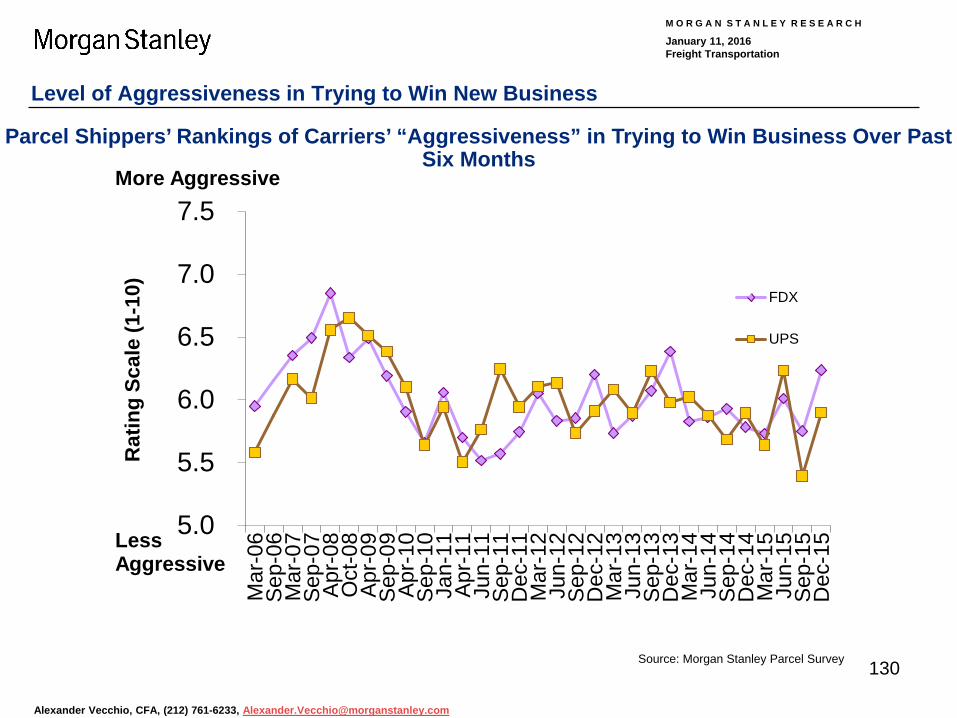
M O R G A N S T A N L E Y R E S E A R C H
January 11, 2016 Freight Transportation
Alexander Vecchio, CFA, (212) 761-6233, [email protected]
130
5.0
5.5
6.0
6.5
7.0
7.5M
ar-0
6Se
p-06
Mar
-07
Sep-
07Ap
r-08
Oct
-08
Apr-0
9Se
p-09
Apr-1
0Se
p-10
Jan-
11Ap
r-11
Jun-
11Se
p-11
Dec
-11
Mar
-12
Jun-
12Se
p-12
Dec
-12
Mar
-13
Jun-
13Se
p-13
Dec
-13
Mar
-14
Jun-
14Se
p-14
Dec
-14
Mar
-15
Jun-
15Se
p-15
Dec
-15
FDX
UPS
More Aggressive
LessAggressive
Rat
ing
Scal
e (1
-10)
Level of Aggressiveness in Trying to Win New Business
Source: Morgan Stanley Parcel Survey
Parcel Shippers’ Rankings of Carriers’ “Aggressiveness” in Trying to Win Business Over Past Six Months
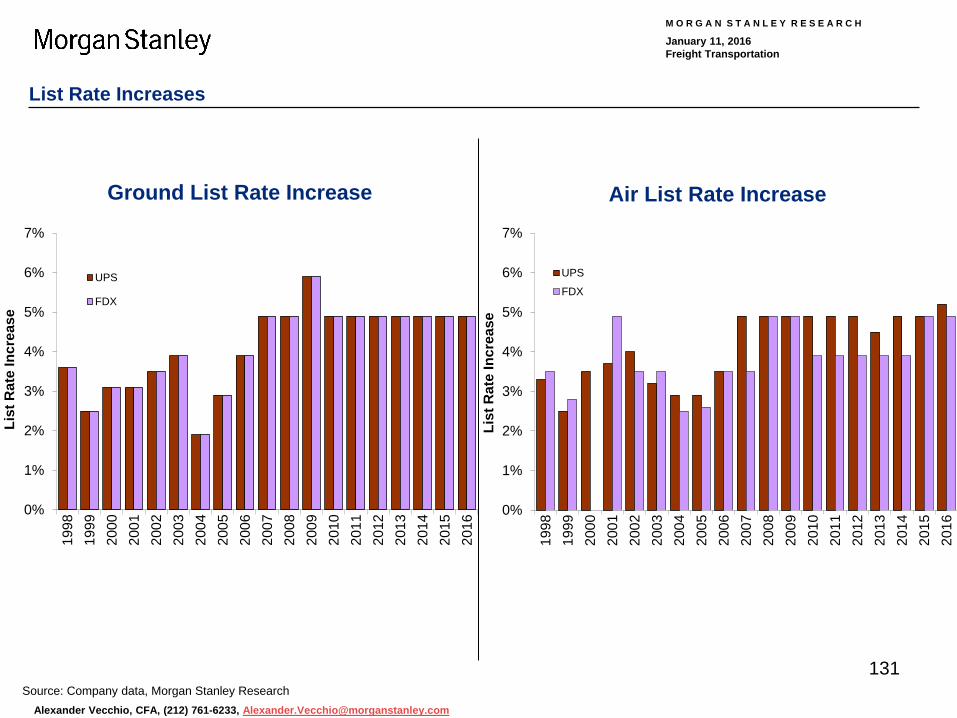
M O R G A N S T A N L E Y R E S E A R C H
January 11, 2016 Freight Transportation
Alexander Vecchio, CFA, (212) 761-6233, [email protected]
131
List Rate Increases
Source: Company data, Morgan Stanley Research
0%
1%
2%
3%
4%
5%
6%
7%
1998
1999
2000
2001
2002
2003
2004
2005
2006
2007
2008
2009
2010
2011
2012
2013
2014
2015
2016
List
Rat
e In
crea
se
UPS
FDX
0%
1%
2%
3%
4%
5%
6%
7%
1998
1999
2000
2001
2002
2003
2004
2005
2006
2007
2008
2009
2010
2011
2012
2013
2014
2015
2016
List
Rat
e In
crea
se
UPS
FDX
Ground List Rate Increase Air List Rate Increase

M O R G A N S T A N L E Y R E S E A R C H
January 11, 2016 Freight Transportation
Alexander Vecchio, CFA, (212) 761-6233, [email protected]
132
15%
20%
25%
30%
35%
40%
45%
50%Ju
n-03
Mar
-04
Sep
-04
Apr
-05
Sep
-05
Mar
-06
Sep
-06
Mar
-07
Sep
-07
Apr
-08
Oct
-08
Apr
-09
Sep
-09
Apr
-10
Sep
-10
Jan-
11A
pr-1
1Ju
n-11
Sep
-11
Dec
-11
Mar
-12
Jun-
12S
ep-1
2D
ec-1
2M
ar-1
3Ju
n-13
Sep
-13
Dec
-13
Mar
-14
Jun-
14S
ep-1
4D
ec-1
4M
ar-1
5Ju
n-15
Sep
-15
Dec
-15
Dis
coun
t Off
List
Rat
es
Ground Air
Percentage Discount Off of List Rates
Source: Morgan Stanley Parcel Survey
Average List Rate Discount

M O R G A N S T A N L E Y R E S E A R C H
January 11, 2016 Freight Transportation
Alexander Vecchio, CFA, (212) 761-6233, [email protected]
133
Percentage Discount Off of List Rates
Source: Morgan Stanley Parcel Survey
15%
20%
25%
30%
35%
40%
45%
50%
55%
Apr
-05
Mar
-06
Mar
-07
Apr
-08
Apr
-09
Apr
-10
Jan-
11
Jun-
11
Dec
-11
Jun-
12
Dec
-12
Jun-
13
Dec
-13
Jun-
14
Dec
-14
Jun-
15
Dec
-15
Dis
coun
t Off
List
Rat
esFDX Ground UPS Ground FDX Air UPS Air
Average Discount by Carrier and Product
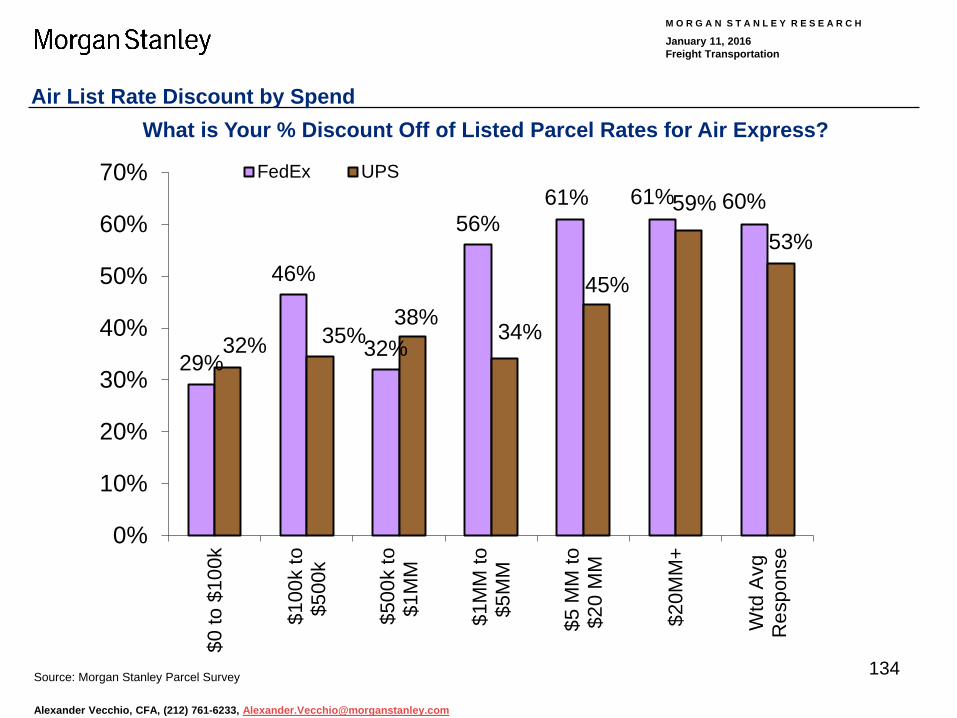
M O R G A N S T A N L E Y R E S E A R C H
January 11, 2016 Freight Transportation
Alexander Vecchio, CFA, (212) 761-6233, [email protected]
134
29%
46%
32%
56%61% 61% 60%
32% 35%38%
34%
45%
59%
53%
0%
10%
20%
30%
40%
50%
60%
70%
$0
to $
100k
$10
0k to
$500
k
$50
0k to
$1M
M
$1M
M to
$5M
M
$5
MM
to$2
0 M
M
$20
MM
+
Wtd
Avg
Res
pons
e
FedEx UPS
Air List Rate Discount by Spend
Source: Morgan Stanley Parcel Survey
What is Your % Discount Off of Listed Parcel Rates for Air Express?
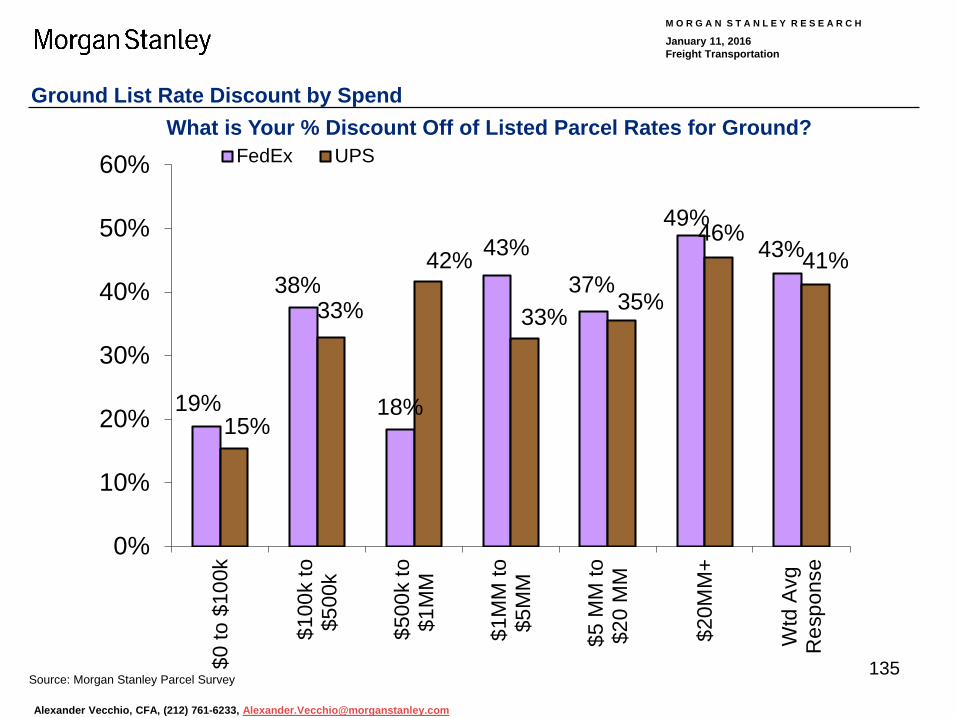
M O R G A N S T A N L E Y R E S E A R C H
January 11, 2016 Freight Transportation
Alexander Vecchio, CFA, (212) 761-6233, [email protected]
135
19%
38%
18%
43%37%
49%43%
15%
33%
42%
33% 35%
46%41%
0%
10%
20%
30%
40%
50%
60%
$0
to $
100k
$10
0k to
$500
k
$50
0k to
$1M
M
$1M
M to
$5M
M
$5
MM
to$2
0 M
M
$20
MM
+
Wtd
Avg
Res
pons
e
FedEx UPS
Ground List Rate Discount by Spend
Source: Morgan Stanley Parcel Survey
What is Your % Discount Off of Listed Parcel Rates for Ground?

M O R G A N S T A N L E Y R E S E A R C H
January 11, 2016 Freight Transportation
Alexander Vecchio, CFA, (212) 761-6233, [email protected]
136
Summary of Contents
About the Surveys
General Freight Trends
Rail Trends
Truck Trends
Parcel Trends
Part 1: Volume Trends & Share Shift 1. Volume Outlook 2. Expectations for Total Parcel Spend 3. Product Usage (e.g. Air vs. Ground) 4. B2B vs. B2C 5. Changes in Primary Carrier
Part 2: Pricing Trends 1. Outlook for Parcel Base Rates 2. Measures of Aggressiveness 3. Trends in List Rate Discounts 4. Accessorial Charges
Part 3: Service & Value Trends 1. Service Reliability Rankings 2. Value of Service Rankings
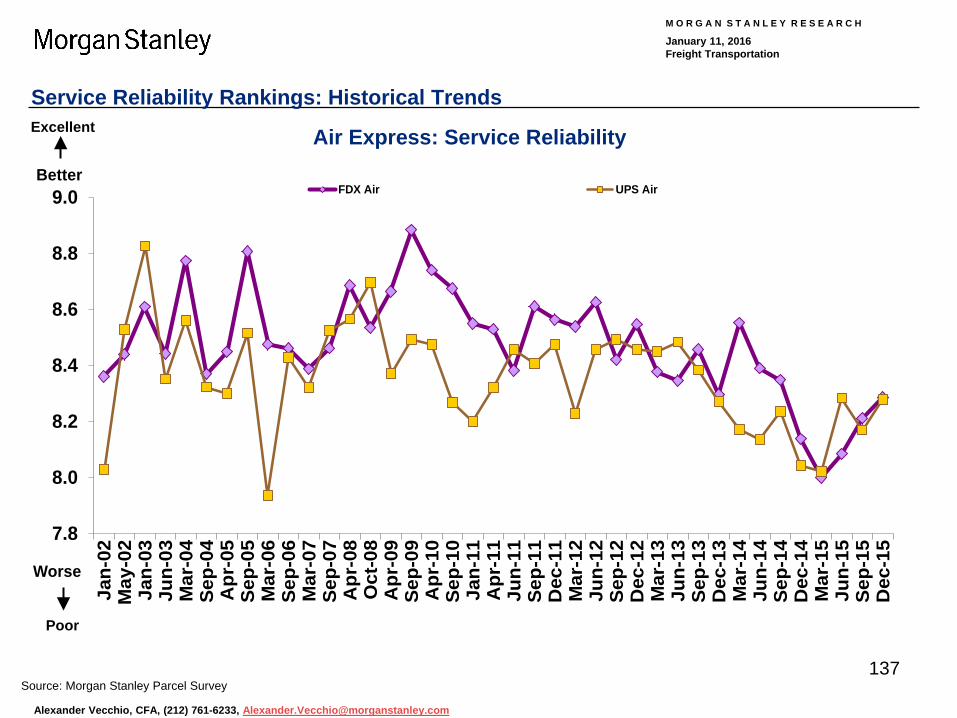
M O R G A N S T A N L E Y R E S E A R C H
January 11, 2016 Freight Transportation
Alexander Vecchio, CFA, (212) 761-6233, [email protected]
137
7.8
8.0
8.2
8.4
8.6
8.8
9.0
Jan-
02M
ay-0
2Ja
n-03
Jun-
03M
ar-0
4Se
p-04
Apr
-05
Sep-
05M
ar-0
6Se
p-06
Mar
-07
Sep-
07A
pr-0
8O
ct-0
8A
pr-0
9Se
p-09
Apr
-10
Sep-
10Ja
n-11
Apr
-11
Jun-
11Se
p-11
Dec
-11
Mar
-12
Jun-
12Se
p-12
Dec
-12
Mar
-13
Jun-
13Se
p-13
Dec
-13
Mar
-14
Jun-
14Se
p-14
Dec
-14
Mar
-15
Jun-
15Se
p-15
Dec
-15
FDX Air UPS AirBetter
Worse
Service Reliability Rankings: Historical Trends
Source: Morgan Stanley Parcel Survey
Poor
Excellent Air Express: Service Reliability

M O R G A N S T A N L E Y R E S E A R C H
January 11, 2016 Freight Transportation
Alexander Vecchio, CFA, (212) 761-6233, [email protected]
138
Service Reliability Rankings: Historical Trends
Source: Morgan Stanley Parcel Survey
5.0
5.5
6.0
6.5
7.0
7.5
8.0
8.5
9.0
9.5
Jan-
02M
ay-0
2Ja
n-03
Jun-
03M
ar-0
4Se
p-04
Apr
-05
Sep-
05M
ar-0
6Se
p-06
Mar
-07
Sep-
07A
pr-0
8O
ct-0
8A
pr-0
9Se
p-09
Apr
-10
Sep-
10Ja
n-11
Apr
-11
Jun-
11Se
p-11
Dec
-11
Mar
-12
Jun-
12Se
p-12
Dec
-12
Mar
-13
Jun-
13Se
p-13
Dec
-13
Mar
-14
Jun-
14Se
p-14
Dec
-14
Mar
-15
Jun-
15Se
p-15
Dec
-15
FDX Ground UPS Ground US Postal Consolidators
Poor
Excellent Ground: Service Reliability

M O R G A N S T A N L E Y R E S E A R C H
January 11, 2016 Freight Transportation
Alexander Vecchio, CFA, (212) 761-6233, [email protected]
139
6.2
6.4
6.6
6.8
7.0
7.2
7.4
7.6
May
-01
Jan-
02M
ay-0
2Ja
n-03
Jun-
03M
ar-0
4Se
p-04
Apr
-05
Sep-
05M
ar-0
6Se
p-06
Mar
-07
Sep-
07A
pr-0
8O
ct-0
8A
pr-0
9Se
p-09
Apr
-10
Sep-
10Ja
n-11
Apr
-11
Jun-
11Se
p-11
Dec
-11
Mar
-12
Jun-
12Se
p-12
Dec
-12
Mar
-13
Jun-
13Se
p-13
Dec
-13
Mar
-14
Jun-
14Se
p-14
Dec
-14
Mar
-15
Jun-
15Se
p-15
Dec
-15
FDX Air UPS Air
Value for Dollar Rankings: Historical Trends
Source: Morgan Stanley Parcel Survey
Poor
Excellent Air Express: Value for Dollar

M O R G A N S T A N L E Y R E S E A R C H
January 11, 2016 Freight Transportation
Alexander Vecchio, CFA, (212) 761-6233, [email protected]
140
Value for Dollar Rankings: Historical Trends
Source: Morgan Stanley Parcel Survey
6.0
6.5
7.0
7.5
8.0
8.5
9.0
Jan-
02M
ay-0
2Ja
n-03
Jun-
03M
ar-0
4Se
p-04
Apr
-05
Sep-
05M
ar-0
6Se
p-06
Mar
-07
Sep-
07A
pr-0
8O
ct-0
8A
pr-0
9Se
p-09
Apr
-10
Sep-
10Ja
n-11
Apr
-11
Jun-
11Se
p-11
Dec
-11
Mar
-12
Jun-
12Se
p-12
Dec
-12
Mar
-13
Jun-
13Se
p-13
Dec
-13
Mar
-14
Jun-
14Se
p-14
Dec
-14
Mar
-15
Jun-
15Se
p-15
Dec
-15
FDX Ground UPS Ground US Postal Consolidators
Poor
Excellent Ground: Value for Dollar

M O R G A N S T A N L E Y R E S E A R C H
January 11, 2016
Disclosure Section Morgan Stanley does and seeks to do business with companies covered in Morgan Stanley Research. As a result, investors should be aware that the firm may have a conflict of interest that could affect the objectivity of Morgan Stanley Research. Investors should consider Morgan Stanley Research as only a single factor in making their investment decision. The information and opinions in Morgan Stanley Research were prepared or are disseminated by Morgan Stanley & Co. LLC and/or Morgan Stanley C.T.V.M. S.A. and/or Morgan Stanley México, Casa de Bolsa, S.A. de C.V. and/or Morgan Stanley Canada Limited and/or Morgan Stanley & Co. International plc and/or RMB Morgan Stanley (Proprietary) Limited and/or Morgan Stanley MUFG Securities Co., Ltd. and/or Morgan Stanley Capital Group Japan Co., Ltd. and/or Morgan Stanley Asia Limited and/or Morgan Stanley Asia (Singapore) Pte. (Registration number 199206298Z) and/or Morgan Stanley Asia (Singapore) Securities Pte Ltd (Registration number 200008434H), regulated by the Monetary Authority of Singapore (which accepts legal responsibility for its contents and should be contacted with respect to any matters arising from, or in connection with, Morgan Stanley Research) and/or Morgan Stanley Taiwan Limited and/or Morgan Stanley & Co International plc, Seoul Branch, and/or Morgan Stanley Australia Limited (A.B.N. 67 003 734 576, holder of Australian financial services license No. 233742, which accepts responsibility for its contents), and/or Morgan Stanley Wealth Management Australia Pty Ltd (A.B.N. 19 009 145 555, holder of Australian financial services license No. 240813, which accepts responsibility for its contents), and/or Morgan Stanley India Company Private Limited, regulated by the Securities and Exchange Board of India (“SEBI”) and holder of licenses as a Research Analyst (SEBI Registration No. INH000001105), Stock Broker (BSE Registration No. INB011054237 and NSE Registration No. INB/INF231054231), Merchant Banker (SEBI Registration No. INM000011203), and depository participant with National Securities Depository Limited (SEBI Registration No. IN-DP-NSDL-372-2014) which accepts the responsibility for its contents and should be contacted with respect to any matters arising from, or in connection with, Morgan Stanley Research, and/or PT Morgan Stanley Asia Indonesia and their affiliates (collectively, "Morgan Stanley"). For important disclosures, stock price charts and equity rating histories regarding companies that are the subject of this report, please see the Morgan Stanley Research Disclosure Website at www.morganstanley.com/researchdisclosures, or contact your investment representative or Morgan Stanley Research at 1585 Broadway, (Attention: Research Management), New York, NY, 10036 USA. For valuation methodology and risks associated with any price targets referenced in this research report, please contact the Client Support Team as follows: US/Canada +1 800 303-2495; Hong Kong +852 2848-5999; Latin America +1 718 754-5444 (U.S.); London +44 (0)20-7425-8169; Singapore +65 6834-6860; Sydney +61 (0)2-9770-1505; Tokyo +81 (0)3-6836-9000. Alternatively you may contact your investment representative or Morgan Stanley Research at 1585 Broadway, (Attention: Research Management), New York, NY 10036 USA. Analyst Certification The following analysts hereby certify that their views about the companies and their securities discussed in this report are accurately expressed and that they have not received and will not receive direct or indirect compensation in exchange for expressing specific recommendations or views in this report: Alexander Vecchio. Unless otherwise stated, the individuals listed on the cover page of this report are research analysts. Global Research Conflict Management Policy Morgan Stanley Research has been published in accordance with our conflict management policy, which is available at www.morganstanley.com/institutional/research/conflictpolicies. Important US Regulatory Disclosures on Subject Companies As of December 31, 2015, Morgan Stanley beneficially owned 1% or more of a class of common equity securities of the following companies covered in Morgan Stanley Research: Canadian Pacific Railway Ltd., Kansas City Southern, United Parcel Service, UTi Worldwide, XPO Logistics, Inc.. Within the last 12 months, Morgan Stanley managed or co-managed a public offering (or 144A offering) of securities of Canadian Pacific Railway Ltd., CSX Corporation, Echo Global Logistics Inc, FedEx Corporation, J.B. Hunt Transport Services Inc., Kansas City Southern, Norfolk Southern Corp., Union Pacific Corp., United Parcel Service, XPO Logistics, Inc.. Within the last 12 months, Morgan Stanley has received compensation for investment banking services from Canadian Pacific Railway Ltd., CSX Corporation, Echo Global Logistics Inc, FedEx Corporation, Genesee & Wyoming Inc., J.B. Hunt Transport Services Inc., Kansas City Southern, Norfolk Southern Corp., Union Pacific Corp., United Parcel Service, XPO Logistics, Inc.. In the next 3 months, Morgan Stanley expects to receive or intends to seek compensation for investment banking services from ArcBest Corp, C.H. Robinson Worldwide Inc., Canadian National Railway Co., Canadian Pacific Railway Ltd., CSX Corporation, Echo Global Logistics Inc, FedEx Corporation, Forward Air Corp, Genesee & Wyoming Inc., Heartland Express Inc., J.B. Hunt Transport Services Inc., Kansas City Southern, Knight Transportation Inc., Landstar System Inc, Norfolk Southern Corp., Old Dominion Freight Line Inc, Roadrunner Transportation Systems Inc, Saia, Inc., Union Pacific Corp., United Parcel Service, UTi Worldwide, Werner Enterprises, XPO Logistics, Inc.. Within the last 12 months, Morgan Stanley has received compensation for products and services other than investment banking services from Canadian Pacific Railway Ltd., CSX Corporation, Genesee & Wyoming Inc., J.B. Hunt Transport Services Inc., Kansas City Southern, Old Dominion Freight Line Inc, Union Pacific Corp., United Parcel Service, XPO Logistics, Inc.. Within the last 12 months, Morgan Stanley has provided or is providing investment banking services to, or has an investment banking client relationship with, the following company: ArcBest Corp, C.H. Robinson Worldwide Inc., Canadian National Railway Co., Canadian Pacific Railway Ltd., CSX Corporation, Echo Global Logistics Inc, FedEx Corporation, Forward Air Corp, Genesee & Wyoming Inc., Heartland Express Inc., J.B. Hunt Transport Services Inc., Kansas City Southern, Knight Transportation Inc., Landstar System Inc, Norfolk Southern Corp., Old Dominion Freight Line Inc, Roadrunner Transportation Systems Inc, Saia, Inc., Union Pacific Corp., United Parcel Service, UTi Worldwide, Werner Enterprises, XPO Logistics, Inc.. 141

M O R G A N S T A N L E Y R E S E A R C H
January 11, 2016
Within the last 12 months, Morgan Stanley has either provided or is providing non-investment banking, securities-related services to and/or in the past has entered into an agreement to provide services or has a client relationship with the following company: C.H. Robinson Worldwide Inc., Canadian National Railway Co., Canadian Pacific Railway Ltd., CSX Corporation, FedEx Corporation, Genesee & Wyoming Inc., J.B. Hunt Transport Services Inc., Kansas City Southern, Norfolk Southern Corp., Old Dominion Freight Line Inc, Union Pacific Corp., United Parcel Service, XPO Logistics, Inc.. An employee, director or consultant of Morgan Stanley is a director of Norfolk Southern Corp.. This person is not a research analyst or a member of a research analyst's household. Morgan Stanley & Co. LLC makes a market in the securities of ArcBest Corp, C.H. Robinson Worldwide Inc., Canadian National Railway Co., Canadian Pacific Railway Ltd., CSX Corporation, Echo Global Logistics Inc, Expeditors International of Washington I, FedEx Corporation, Forward Air Corp, Genesee & Wyoming Inc., Heartland Express Inc., Hub Group Inc, J.B. Hunt Transport Services Inc., Kansas City Southern, Knight Transportation Inc., Landstar System Inc, Norfolk Southern Corp., Old Dominion Freight Line Inc, Roadrunner Transportation Systems Inc, Saia, Inc., Swift Transportation, Union Pacific Corp., United Parcel Service, UTi Worldwide, Werner Enterprises, XPO Logistics, Inc.. The equity research analysts or strategists principally responsible for the preparation of Morgan Stanley Research have received compensation based upon various factors, including quality of research, investor client feedback, stock picking, competitive factors, firm revenues and overall investment banking revenues. Morgan Stanley and its affiliates do business that relates to companies/instruments covered in Morgan Stanley Research, including market making, providing liquidity, fund management, commercial banking, extension of credit, investment services and investment banking. Morgan Stanley sells to and buys from customers the securities/instruments of companies covered in Morgan Stanley Research on a principal basis. Morgan Stanley may have a position in the debt of the Company or instruments discussed in this report. Certain disclosures listed above are also for compliance with applicable regulations in non-US jurisdictions. STOCK RATINGS Morgan Stanley uses a relative rating system using terms such as Overweight, Equal-weight, Not-Rated or Underweight (see definitions below). Morgan Stanley does not assign ratings of Buy, Hold or Sell to the stocks we cover. Overweight, Equal-weight, Not-Rated and Underweight are not the equivalent of buy, hold and sell. Investors should carefully read the definitions of all ratings used in Morgan Stanley Research. In addition, since Morgan Stanley Research contains more complete information concerning the analyst's views, investors should carefully read Morgan Stanley Research, in its entirety, and not infer the contents from the rating alone. In any case, ratings (or research) should not be used or relied upon as investment advice. An investor's decision to buy or sell a stock should depend on individual circumstances (such as the investor's existing holdings) and other considerations. Global Stock Ratings Distribution (as of December 31, 2015) For disclosure purposes only (in accordance with NASD and NYSE requirements), we include the category headings of Buy, Hold, and Sell alongside our ratings of Overweight, Equal-weight, Not-Rated and Underweight. Morgan Stanley does not assign ratings of Buy, Hold or Sell to the stocks we cover. Overweight, Equal-weight, Not-Rated and Underweight are not the equivalent of buy, hold, and sell but represent recommended relative weightings (see definitions below). To satisfy regulatory requirements, we correspond Overweight, our most positive stock rating, with a buy recommendation; we correspond Equal-weight and Not-Rated to hold and Underweight to sell recommendations, respectively. Stock Rating Category Count
% ofTotal Count
% ofTotal IBC
% of RatingCategory
Overweight/Buy 1193 35% 324 43% 27%Equal-weight/Hold 1449 43% 330 44% 23%Not-Rated/Hold 89 3% 12 2% 13%Underweight/Sell 660 19% 88 12% 13%Total 3,391 754
Investment Banking Clients (IBC)Coverage Universe
Disclosure Section (cont’d)
142

M O R G A N S T A N L E Y R E S E A R C H
January 11, 2016
Disclosure Section (cont’d) Data include common stock and ADRs currently assigned ratings. Investment Banking Clients are companies from whom Morgan Stanley received investment banking compensation in the last 12 months. Analyst Stock Ratings Overweight (O or Over) - The stock's total return is expected to exceed the total return of the relevant country MSCI Index or the average total return of the analyst's industry (or industry team's) coverage universe, on a risk-adjusted basis over the next 12-18 months. Equal-weight (E or Equal) - The stock's total return is expected to be in line with the total return of the relevant country MSCI Index or the average total return of the analyst's industry (or industry team's) coverage universe, on a risk-adjusted basis over the next 12-18 months. Not-Rated (NR) - Currently the analyst does not have adequate conviction about the stock's total return relative to the relevant country MSCI Index or the average total return of the analyst's industry (or industry team's) coverage universe, on a risk-adjusted basis, over the next 12-18 months. Underweight (U or Under) - The stock's total return is expected to be below the total return of the relevant country MSCI Index or the average total return of the analyst's industry (or industry team's) coverage universe, on a risk-adjusted basis, over the next 12-18 months. Unless otherwise specified, the time frame for price targets included in Morgan Stanley Research is 12 to 18 months. Analyst Industry Views Attractive (A): The analyst expects the performance of his or her industry coverage universe over the next 12-18 months to be attractive vs. the relevant broad market benchmark, as indicated below. In-Line (I): The analyst expects the performance of his or her industry coverage universe over the next 12-18 months to be in line with the relevant broad market benchmark, as indicated below. Cautious (C): The analyst views the performance of his or her industry coverage universe over the next 12-18 months with caution vs. the relevant broad market benchmark, as indicated below. Benchmarks for each region are as follows: North America - S&P 500; Latin America - relevant MSCI country index or MSCI Latin America Index; Europe - MSCI Europe; Japan - TOPIX; Asia - relevant MSCI country index or MSCI sub-regional index or MSCI AC Asia Pacific ex Japan Index. Stock Price, Price Target and Rating History (See Rating Definitions) Important Disclosures for Morgan Stanley Smith Barney LLC Customers Important disclosures regarding the relationship between the companies that are the subject of Morgan Stanley Research and Morgan Stanley Smith Barney LLC or Morgan Stanley or any of their affiliates, are available on the Morgan Stanley Wealth Management disclosure website at www.morganstanley.com/online/researchdisclosures. For Morgan Stanley specific disclosures, you may refer to www.morganstanley.com/researchdisclosures. Each Morgan Stanley Equity Research report is reviewed and approved on behalf of Morgan Stanley Smith Barney LLC. This review and approval is conducted by the same person who reviews the Equity Research report on behalf of Morgan Stanley. This could create a conflict of interest. Other Important Disclosures Morgan Stanley & Co. International PLC and its affiliates have a significant financial interest in the debt securities of C.H. Robinson Worldwide Inc., Canadian National Railway Co., Canadian Pacific Railway Ltd., CSX Corporation, FedEx Corporation, Genesee & Wyoming Inc., Kansas City Southern, Norfolk Southern Corp., Union Pacific Corp., United Parcel Service, XPO Logistics, Inc.. Morgan Stanley is not acting as a municipal advisor and the opinions or views contained herein are not intended to be, and do not constitute, advice within the meaning of Section 975 of the Dodd-Frank Wall Street Reform and Consumer Protection Act. Morgan Stanley produces an equity research product called a "Tactical Idea." Views contained in a "Tactical Idea" on a particular stock may be contrary to the recommendations or views expressed in research on the same stock. This may be the result of differing time horizons, methodologies, market events, or other factors. For all research available on a particular stock, please contact your sales representative or go to Matrix at http://www.morganstanley.com/matrix. Morgan Stanley Research is provided to our clients through our proprietary research portal on Matrix and also distributed electronically by Morgan Stanley to clients. Certain, but not all, Morgan Stanley Research products are also made available to clients through third-party vendors or redistributed to clients through alternate electronic means as a convenience. For access to all available Morgan Stanley Research, please contact your sales representative or go to Matrix at http://www.morganstanley.com/matrix. Any access and/or use of Morgan Stanley Research is subject to Morgan Stanley's Terms of Use (http://www.morganstanley.com/terms.html). By accessing and/or using Morgan Stanley Research, you are indicating that you have read and agree to be bound by our Terms of Use (http://www.morganstanley.com/terms.html). In addition you consent to Morgan Stanley processing your personal data and using cookies in accordance with our Privacy Policy and our Global Cookies Policy (http://www.morganstanley.com/privacy_pledge.html), including for the purposes of setting your preferences and to collect readership data so that we can deliver better and more personalized service and products to you. To find out more information about how Morgan Stanley processes personal data, how we use cookies and how to reject cookies see our Privacy Policy and our Global Cookies Policy (http://www.morganstanley.com/privacy_pledge.html). If you do not agree to our Terms of Use and/or if you do not wish to provide your consent to Morgan Stanley processing your personal data or using cookies please do not access our research.
143

M O R G A N S T A N L E Y R E S E A R C H
January 11, 2016
144
Disclosure Section (cont’d) Morgan Stanley Research does not provide individually tailored investment advice. Morgan Stanley Research has been prepared without regard to the circumstances and objectives of those who receive it. Morgan Stanley recommends that investors independently evaluate particular investments and strategies, and encourages investors to seek the advice of a financial adviser. The appropriateness of an investment or strategy will depend on an investor's circumstances and objectives. The securities, instruments, or strategies discussed in Morgan Stanley Research may not be suitable for all investors, and certain investors may not be eligible to purchase or participate in some or all of them. Morgan Stanley Research is not an offer to buy or sell or the solicitation of an offer to buy or sell any security/instrument or to participate in any particular trading strategy. The value of and income from your investments may vary because of changes in interest rates, foreign exchange rates, default rates, prepayment rates, securities/instruments prices, market indexes, operational or financial conditions of companies or other factors. There may be time limitations on the exercise of options or other rights in securities/instruments transactions. Past performance is not necessarily a guide to future performance. Estimates of future performance are based on assumptions that may not be realized. If provided, and unless otherwise stated, the closing price on the cover page is that of the primary exchange for the subject company's securities/instruments. The fixed income research analysts, strategists or economists principally responsible for the preparation of Morgan Stanley Research have received compensation based upon various factors, including quality, accuracy and value of research, firm profitability or revenues (which include fixed income trading and capital markets profitability or revenues), client feedback and competitive factors. Fixed Income Research analysts', strategists' or economists' compensation is not linked to investment banking or capital markets transactions performed by Morgan Stanley or the profitability or revenues of particular trading desks. The "Important US Regulatory Disclosures on Subject Companies" section in Morgan Stanley Research lists all companies mentioned where Morgan Stanley owns 1% or more of a class of common equity securities of the companies. For all other companies mentioned in Morgan Stanley Research, Morgan Stanley may have an investment of less than 1% in securities/instruments or derivatives of securities/instruments of companies and may trade them in ways different from those discussed in Morgan Stanley Research. Employees of Morgan Stanley not involved in the preparation of Morgan Stanley Research may have investments in securities/instruments or derivatives of securities/instruments of companies mentioned and may trade them in ways different from those discussed in Morgan Stanley Research. Derivatives may be issued by Morgan Stanley or associated persons. With the exception of information regarding Morgan Stanley, Morgan Stanley Research is based on public information. Morgan Stanley makes every effort to use reliable, comprehensive information, but we make no representation that it is accurate or complete. We have no obligation to tell you when opinions or information in Morgan Stanley Research change apart from when we intend to discontinue equity research coverage of a subject company. Facts and views presented in Morgan Stanley Research have not been reviewed by, and may not reflect information known to, professionals in other Morgan Stanley business areas, including investment banking personnel. Morgan Stanley Research personnel may participate in company events such as site visits and are generally prohibited from accepting payment by the company of associated expenses unless pre-approved by authorized members of Research management. Morgan Stanley may make investment decisions that are inconsistent with the recommendations or views in this report. To our readers in Taiwan: Information on securities/instruments that trade in Taiwan is distributed by Morgan Stanley Taiwan Limited ("MSTL"). Such information is for your reference only. The reader should independently evaluate the investment risks and is solely responsible for their investment decisions. Morgan Stanley Research may not be distributed to the public media or quoted or used by the public media without the express written consent of Morgan Stanley. Information on securities/instruments that do not trade in Taiwan is for informational purposes only and is not to be construed as a recommendation or a solicitation to trade in such securities/instruments. MSTL may not execute transactions for clients in these securities/instruments. To our readers in Hong Kong: Information is distributed in Hong Kong by and on behalf of, and is attributable to, Morgan Stanley Asia Limited as part of its regulated activities in Hong Kong. If you have any queries concerning Morgan Stanley Research, please contact our Hong Kong sales representatives. Certain information in Morgan Stanley Research was sourced by employees of the Shanghai Representative Office of Morgan Stanley Asia Limited for the use of Morgan Stanley Asia Limited.

M O R G A N S T A N L E Y R E S E A R C H
January 11, 2016
145
Disclosure Section (cont’d)
Morgan Stanley is not incorporated under PRC law and the research in relation to this report is conducted outside the PRC. Morgan Stanley Research does not constitute an offer to sell or the solicitation of an offer to buy any securities in the PRC. PRC investors shall have the relevant qualifications to invest in such securities and shall be responsible for obtaining all relevant approvals, licenses, verifications and/or registrations from the relevant governmental authorities themselves. Morgan Stanley Research is disseminated in Brazil by Morgan Stanley C.T.V.M. S.A.; in Mexico by Morgan Stanley México, Casa de Bolsa, S.A. de C.V which is regulated by Comision Nacional Bancaria y de Valores. Paseo de los Tamarindos 90, Torre 1, Col. Bosques de las Lomas Floor 29, 05120 Mexico City; in Japan by Morgan Stanley MUFG Securities Co., Ltd. and, for Commodities related research reports only, Morgan Stanley Capital Group Japan Co., Ltd; in Hong Kong by Morgan Stanley Asia Limited (which accepts responsibility for its contents) and by Bank Morgan Stanley AG, Hong Kong Branch; in Singapore by Morgan Stanley Asia (Singapore) Pte. (Registration number 199206298Z) and/or Morgan Stanley Asia (Singapore) Securities Pte Ltd (Registration number 200008434H), regulated by the Monetary Authority of Singapore (which accepts legal responsibility for its contents and should be contacted with respect to any matters arising from, or in connection with, Morgan Stanley Research) and by Bank Morgan Stanley AG, Singapore Branch (Registration number T11FC0207F); in Australia to "wholesale clients" within the meaning of the Australian Corporations Act by Morgan Stanley Australia Limited A.B.N. 67 003 734 576, holder of Australian financial services license No. 233742, which accepts responsibility for its contents; in Australia to "wholesale clients" and "retail clients" within the meaning of the Australian Corporations Act by Morgan Stanley Wealth Management Australia Pty Ltd (A.B.N. 19 009 145 555, holder of Australian financial services license No. 240813, which accepts responsibility for its contents; in Korea by Morgan Stanley & Co International plc, Seoul Branch; in India by Morgan Stanley India Company Private Limited; in Indonesia by PT Morgan Stanley Asia Indonesia; in Canada by Morgan Stanley Canada Limited, which has approved of and takes responsibility for its contents in Canada; in Germany by Morgan Stanley Bank AG, Frankfurt am Main and Morgan Stanley Private Wealth Management Limited, Niederlassung Deutschland, regulated by Bundesanstalt fuer Finanzdienstleistungsaufsicht (BaFin); in Spain by Morgan Stanley, S.V., S.A., a Morgan Stanley group company, which is supervised by the Spanish Securities Markets Commission (CNMV) and states that Morgan Stanley Research has been written and distributed in accordance with the rules of conduct applicable to financial research as established under Spanish regulations; in the US by Morgan Stanley & Co. LLC, which accepts responsibility for its contents. Morgan Stanley & Co. International plc, authorized by the Prudential Regulatory Authority and regulated by the Financial Conduct Authority and the Prudential Regulatory Authority, disseminates in the UK research that it has prepared, and approves solely for the purposes of section 21 of the Financial Services and Markets Act 2000, research which has been prepared by any of its affiliates. RMB Morgan Stanley (Proprietary) Limited is a member of the JSE Limited and regulated by the Financial Services Board in South Africa. RMB Morgan Stanley (Proprietary) Limited is a joint venture owned equally by Morgan Stanley International Holdings Inc. and RMB Investment Advisory (Proprietary) Limited, which is wholly owned by FirstRand Limited. The information in Morgan Stanley Research is being disseminated by Morgan Stanley Saudi Arabia, regulated by the Capital Market Authority in the Kingdom of Saudi Arabia , and is directed at Sophisticated investors only. The information in Morgan Stanley Research is being communicated by Morgan Stanley & Co. International plc (DIFC Branch), regulated by the Dubai Financial Services Authority (the DFSA), and is directed at Professional Clients only, as defined by the DFSA. The financial products or financial services to which this research relates will only be made available to a customer who we are satisfied meets the regulatory criteria to be a Professional Client. The information in Morgan Stanley Research is being communicated by Morgan Stanley & Co. International plc (QFC Branch), regulated by the Qatar Financial Centre Regulatory Authority (the QFCRA), and is directed at business customers and market counterparties only and is not intended for Retail Customers as defined by the QFCRA. As required by the Capital Markets Board of Turkey, investment information, comments and recommendations stated here, are not within the scope of investment advisory activity. Investment advisory service is provided exclusively to persons based on their risk and income preferences by the authorized firms. Comments and recommendations stated here are general in nature. These opinions may not fit to your financial status, risk and return preferences. For this reason, to make an investment decision by relying solely to this information stated here may not bring about outcomes that fit your expectations. The trademarks and service marks contained in Morgan Stanley Research are the property of their respective owners. Third-party data providers make no warranties or representations relating to the accuracy, completeness, or timeliness of the data they provide and shall not have liability for any damages relating to such data. The Global Industry Classification Standard (GICS) was developed by and is the exclusive property of MSCI and S&P. Morgan Stanley Research, or any portion thereof may not be reprinted, sold or redistributed without the written consent of Morgan Stanley.
145

M O R G A N S T A N L E Y R E S E A R C H
January 11, 2016
146
Disclosure Section (cont’d)
146 © 2016 Morgan Stanley