morgan stanley global metals & mining...
TRANSCRIPT

Morgan Stanley Global Metals &
Mining Conference
November 2011

1
Disclaimer
•Forward-Looking Statements
This document may contain forward-looking information and statements about
ArcelorMittal and its subsidiaries. These statements include financial projections and estimates
and their underlying assumptions, statements regarding plans, objectives and expectations with
respect to future operations, products and services, and statements regarding future performance.
Forward-looking statements may be identified by the words “believe,” “expect,” “anticipate,”
“target” or similar expressions. Although ArcelorMittal‟s management believes that the
expectations reflected in such forward-looking statements are reasonable, investors and holders
of ArcelorMittal‟s securities are cautioned that forward-looking information and statements are
subject to numerous risks and uncertainties, many of which are difficult to predict and generally
beyond the control of ArcelorMittal, that could cause actual results and developments to differ
materially and adversely from those expressed in, or implied or projected by, the forward-looking
information and statements. These risks and uncertainties include those discussed or identified in
the filings with the Luxembourg Stock Market Authority for the Financial Markets (Commission de
Surveillance du Secteur Financier) and the United States Securities and Exchange Commission
(the “SEC”) made or to be made by ArcelorMittal, including ArcelorMittal‟s Annual Report on Form
20-F for the year ended December 31, 2010 filed with the SEC. ArcelorMittal undertakes no
obligation to publicly update its forward-looking statements, whether as a result of new
information, future events, or otherwise.
2
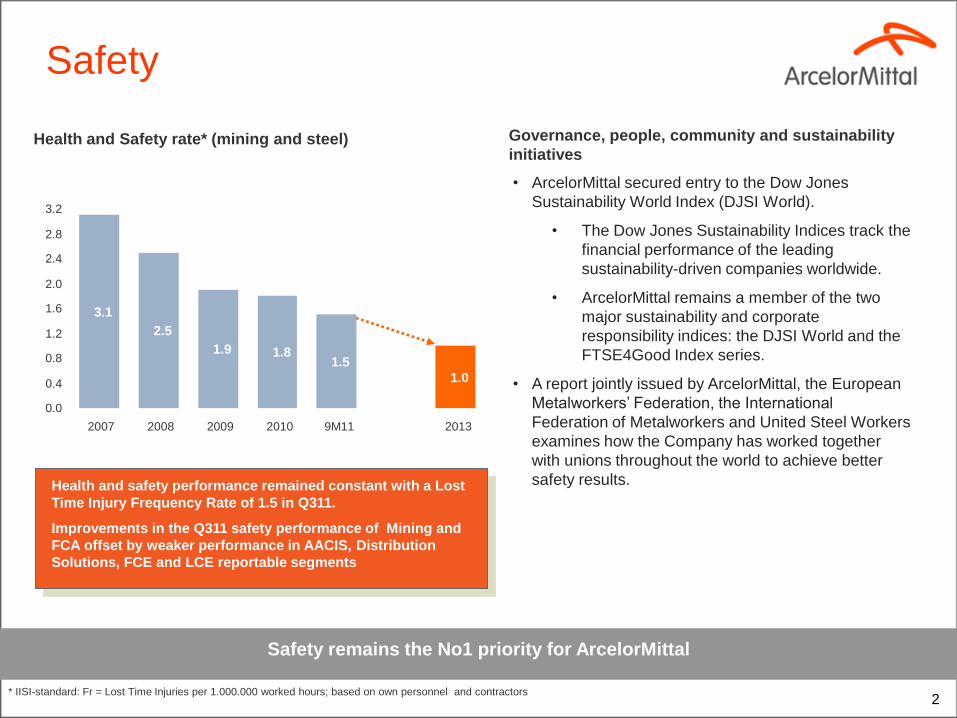
Safety
* IISI-standard: Fr = Lost Time Injuries per 1.000.000 worked hours; based on own personnel and contractors
Health and safety performance remained constant with a Lost
Time Injury Frequency Rate of 1.5 in Q311.
Improvements in the Q311 safety performance of Mining and
FCA offset by weaker performance in AACIS, Distribution
Solutions, FCE and LCE reportable segments
Safety remains the No1 priority for ArcelorMittal
Governance, people, community and sustainability
initiatives
• ArcelorMittal secured entry to the Dow Jones
Sustainability World Index (DJSI World).
• The Dow Jones Sustainability Indices track the
financial performance of the leading
sustainability-driven companies worldwide.
• ArcelorMittal remains a member of the two
major sustainability and corporate
responsibility indices: the DJSI World and the
FTSE4Good Index series.
• A report jointly issued by ArcelorMittal, the European
Metalworkers‟ Federation, the International
Federation of Metalworkers and United Steel Workers
examines how the Company has worked together
with unions throughout the world to achieve better
safety results.
Health and Safety rate* (mining and steel)
3.1
2.5
1.9 1.8 1.5
1.0
0.0
0.4
0.8
1.2
1.6
2.0
2.4
2.8
3.2
2007 2008 2009 2010 9M11 2013

3
Core strengths
• High quality core assets – Utilising 71% of our capacity ArcelorMittal delivered an average EBITDA/tonne of $114/t in 3Q‟11
– ~40% of “steel EBITDA” in 9M‟11 was generated from production outside Europe/North America
• Industry leading automotive steel franchise – 40% share of core markets
– Higher (and growing) market share in advanced high strength steels
• A world-class and growing mining business – 4.3bn tonnes of iron ore reserves with a further 11.3bn tonnes of resources
– Competitive on cost and quality; margins on “marketable tonnes” comparable with industry leaders
• Good track record of consistent management gains – $3.8bn achieved since 2008 and on track for $4.8bn by end 2012
– New $1bn Asset Optimisation Plan launched to generate sustainable EBITDA improvement
• A strong balance sheet – 5.1yr average maturity with no covenants on term debt*
– $11.3bn of liquidity** at September 30, 2011
* Covenant of 3.5x Net Debt/EBITDA applies only to available liquidity lines ($10.6bn of which $2.1bn drawn at September 30, 2011); ** Cash and cash equivalents and available drawing capacity under credit lines; Refer to
resource and reserve definitions as provided by in the September 2011 investor day materials
ArcelorMittal in a strong position to respond to evolving markets

4
1H
1H1H
2H
2H
2H
0
2000
4000
6000
8000
10000
12000
2009 2010 2011
EBITDA progression (US$mn)
14532162 2408
114/t
105/t
81/t
0
500
1000
1500
2000
2500
3000
3500
Q3'09 Q3'10 Q3'11
0
20
40
60
80
100
120
Snapshot: Profitability improving Y-o-Y
• 3Q‟11 EBITDA increased 11.4% y-o-y to $2.4 billion; 9M11 EBITDA $8.4bn, 25.9% higher than 9M10
• 3Q‟11 EBITDA/t of $114, 8.5% higher than 3Q‟10
• Own iron ore production 14.1Mt in 3Q‟11 and 39.0Mt in 9M11; on track for 10% growth this year
• Net debt at September 30, 2011 of $24.9 billion as compared to $25.0 billion at June 30, 2011
• Guidance: 2H‟11 EBITDA expected to be above 2H‟10
2H 2011 EBITDA expected to exceed the level of 2H 2010
Group EBITDA (US$mn)
5
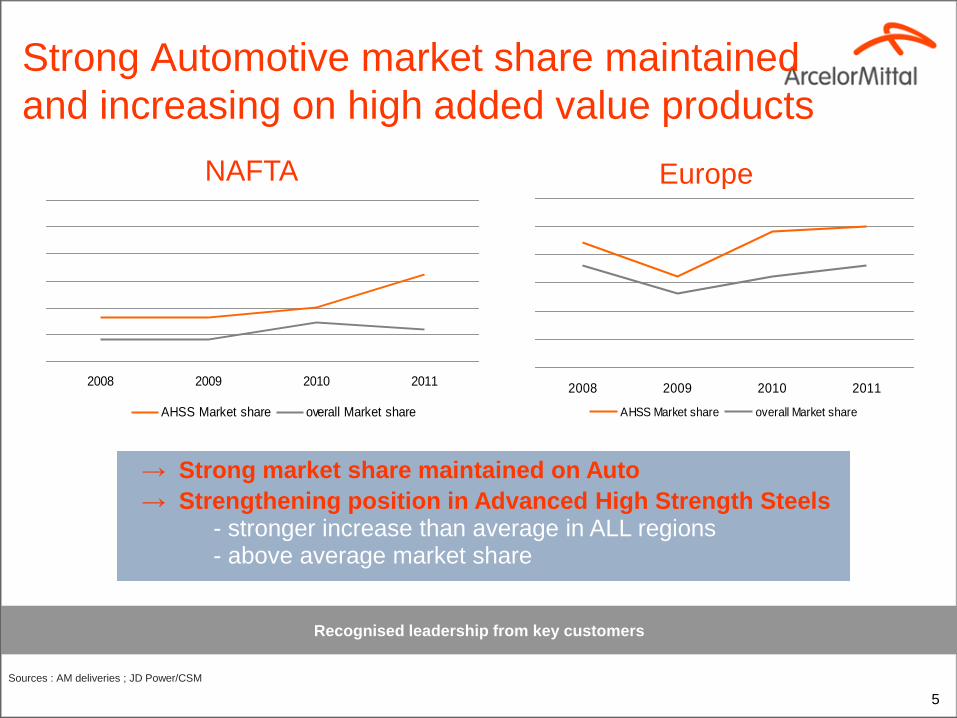
Strong Automotive market share maintained
and increasing on high added value products
→ Strong market share maintained on Auto
→ Strengthening position in Advanced High Strength Steels - stronger increase than average in ALL regions - above average market share
Sources : AM deliveries ; JD Power/CSM
NAFTA Europe
2008 2009 2010 2011
AHSS Market share overall Market share
2008 2009 2010 2011
AHSS Market share overall Market share
Recognised leadership from key customers
6
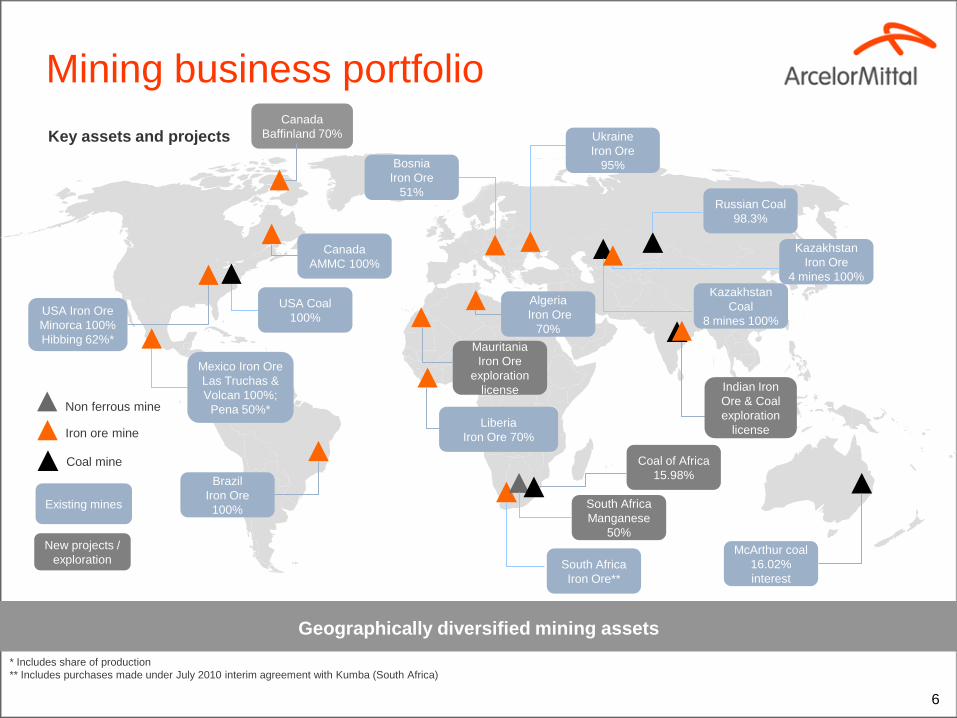
Geographically diversified mining assets
South Africa
Iron Ore**
* Includes share of production
** Includes purchases made under July 2010 interim agreement with Kumba (South Africa)
Mining business portfolio
Key assets and projects
USA Iron Ore
Minorca 100%
Hibbing 62%*
Mexico Iron Ore
Las Truchas &
Volcan 100%;
Pena 50%* Liberia
Iron Ore 70%
Algeria
Iron Ore
70%
Brazil
Iron Ore
100%
New projects /
exploration
Existing mines
Mauritania
Iron Ore
exploration
license
Canada
AMMC 100%
Bosnia
Iron Ore
51%
USA Coal
100%
South Africa
Manganese
50%
Indian Iron
Ore & Coal
exploration
license
Ukraine
Iron Ore
95%
Kazakhstan
Coal
8 mines 100%
Kazakhstan
Iron Ore
4 mines 100%
Russian Coal
98.3%
Iron ore mine
Non ferrous mine
Coal mine
McArthur coal
16.02%
interest
Coal of Africa
15.98%
Canada
Baffinland 70%

7
Type of product
Region
Proven & probable
reserves
Measured & indicated
resources
Inferred
resources
Mtonnes %Fe Mtonnes %Fe Mtonnes %Fe
Canada (AMMC) 2,350 29 3,442 30 1,025 28
Canada
(Baffinland) 375 65 41 66 444 65
USA 581 20 41 23 90 23
Central America 308 29 117 29 88 28
South America 134 58 321 38 130 37
West Africa 22 61 1,539 44 1,522 41
Eastern Europe 366 37 866 38 - -
Central Asia 120 41 1,629 40 30 51
TOTAL 4,255 33 7,997 36 3,329 39
Iron ore reserves and resources
2010 year-end estimates
The life of mine plans of operations and planned expansion projects
are 90% based on ore reserve estimates
Lumps
Fines
Pellet feed
Conc
• Tonnage and grade estimates are reported as „Run of Mine‟. Tonnage is reported on a wet metric basis. Where we own less than 100% of the operation, the estimates have not been adjusted to reflect our ownership interest.
• Mineral resource estimates are reported in addition to ore reserve estimates.
• The ore reserve and mineral resource estimates have been prepared under the supervision of ArcelorMittal qualified personnel . Detailed independent audits are conducted on a regular basis.
The terms "mineral resource", "measured mineral resource", "indicated mineral resource" and "inferred mineral resource" are defined in, and have been calculated in accordance with the guidelines set forth in,
Canadian National Instrument 43-101 (“NI 43-101”). NI 43-101 is a codified set of rules and guidelines for reporting and displaying information related to mineral properties owned by, or explored by, companies which
report results on stock exchanges within Canada, and is recognized by several other international stock exchanges and regulatory bodies. However, these terms are not defined terms under SEC Industry Guide 7 and
(absent an applicable exception) are not permitted to be used in reports and registration statements filed with the SEC. Investors are cautioned not to assume that any part or all of mineral deposits in these categories
will ever be converted into reserves. "Inferred mineral resources" have a great amount of uncertainty as to their existence, and great uncertainty as to their economic and legal feasibility. It cannot be assumed that all
or any part of an inferred mineral resource will ever be upgraded to a higher category.
8
0
10000
20000
30000
40000
50000
60000
70000
80000
90000
2010 2011F 2012 2013 2014 2015
Cost plus tonnage Marketable tonnage
97%
Growth
41%
Growth
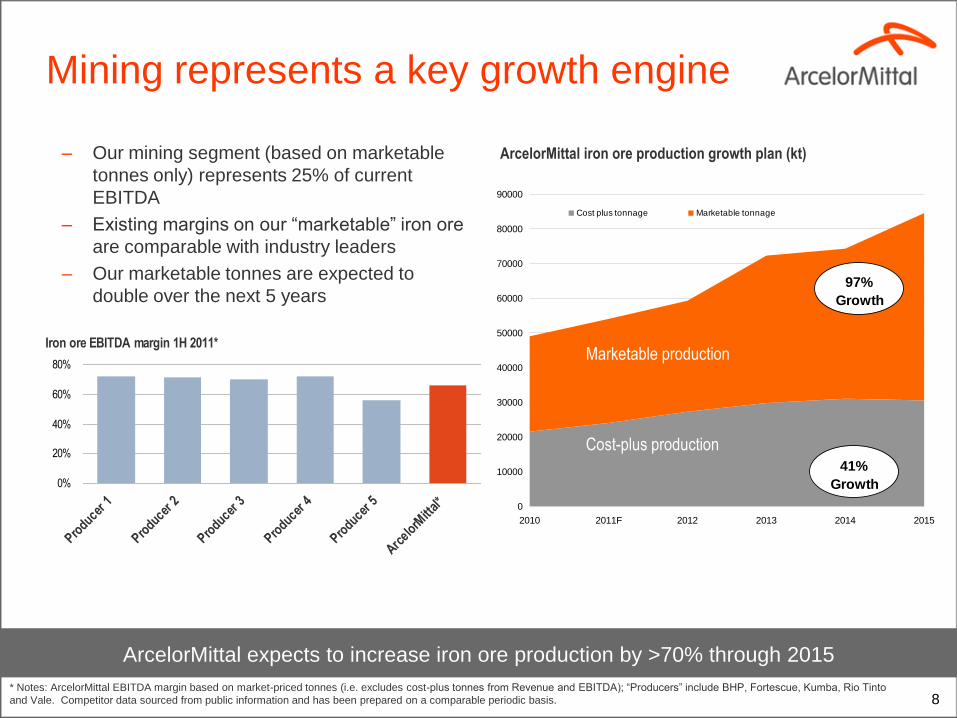
Mining represents a key growth engine
ArcelorMittal iron ore production growth plan (kt)
Marketable production
Cost-plus production
ArcelorMittal expects to increase iron ore production by >70% through 2015
Iron ore EBITDA margin 1H 2011*
0%
20%
40%
60%
80%
Producer
1
Producer
2
Producer
3
Producer
4
Producer
5
Arcelo
rMitt
al*
– Our mining segment (based on marketable
tonnes only) represents 25% of current
EBITDA
– Existing margins on our “marketable” iron ore
are comparable with industry leaders
– Our marketable tonnes are expected to
double over the next 5 years
* Notes: ArcelorMittal EBITDA margin based on market-priced tonnes (i.e. excludes cost-plus tonnes from Revenue and EBITDA); “Producers” include BHP, Fortescue, Kumba, Rio Tinto
and Vale. Competitor data sourced from public information and has been prepared on a comparable periodic basis.
9
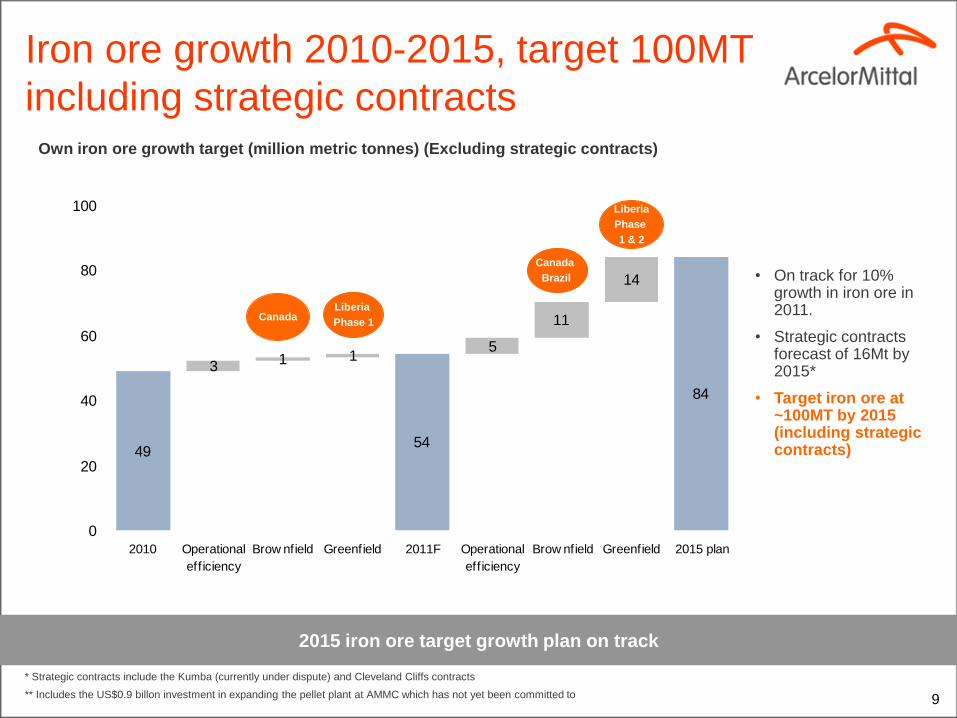
Iron ore growth 2010-2015, target 100MT
including strategic contracts
2015 iron ore target growth plan on track
Canada
Brazil
Liberia
Phase
1 & 2
Liberia
Phase 1
Own iron ore growth target (million metric tonnes) (Excluding strategic contracts)
Canada
• On track for 10% growth in iron ore in 2011.
• Strategic contracts forecast of 16Mt by 2015*
• Target iron ore at ~100MT by 2015 (including strategic contracts)
* Strategic contracts include the Kumba (currently under dispute) and Cleveland Cliffs contracts
** Includes the US$0.9 billon investment in expanding the pellet plant at AMMC which has not yet been committed to
49
3 1 1
54
5
11
14
84
0
20
40
60
80
100
2010 Operational
eff iciency
Brow nfield Greenfield 2011F Operational
eff iciency
Brow nfield Greenfield 2015 plan

10
1.9
4.0
$0bn
$1bn
$1bn
$2bn
$2bn
$3bn
$3bn
$4bn
$4bn
$5bn
2009 2012
2012 supported by management gains
• Management gains will contribute more to EBITDA than it did in
2009
Management gains will have a significantly higher contribution to EBITDA in 2012 than in 2009
*
* This assumes that we exit 2011 with management gains of $4bn and make no further progress in 2012; at end of 2Q‟11 $3.6bn had been achieved and end-
2012 target remains $4.8bn
Contribution of management gains to EBITDA (US$bn)

11
-
200
400
600
800
1,000
1,200
2011 2012 2013
2012 supported by Asset Optimisation
• Focus on “Core” assets will ensure lowest cost footprint
achieved and yield significant savings; target $1bn by end-2012
Asset Optimisation Plan will further support EBITDA in 2012
Expected Contribution of Asset Optimisation Plan to EBITDA (US$mn)
12
0.0
2.0
4.0
6.0
8.0
10.0
12.0
2011 2012 2013 2014 2015 2016 Thereafter
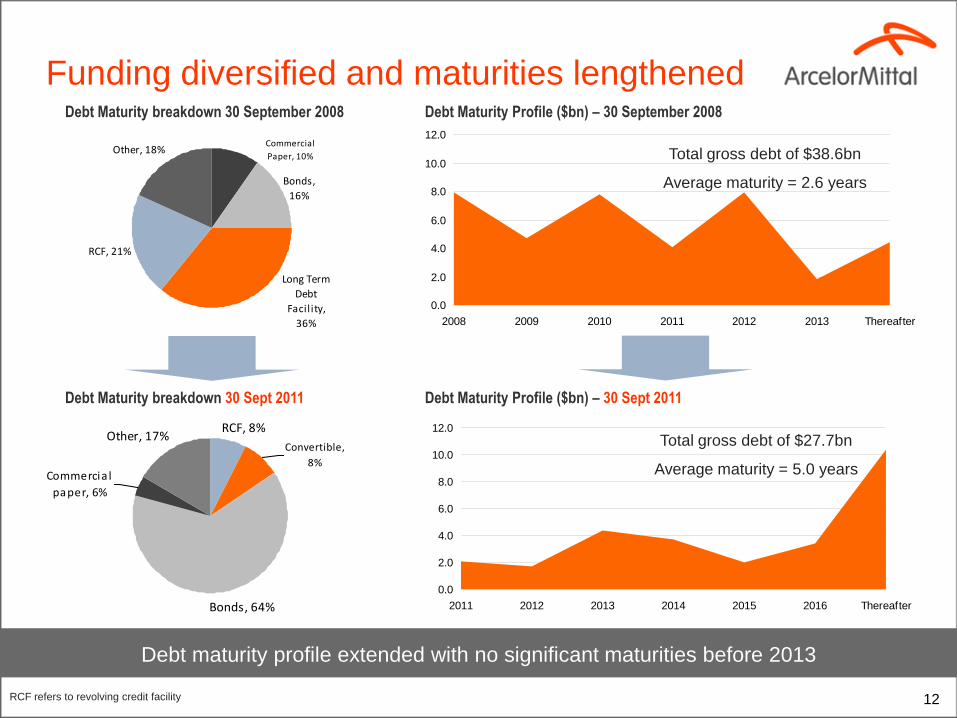
RCF, 8%
Bonds, 64%
Other, 17%
Commercia l
paper, 6%
Convertible,
8%
0.0
2.0
4.0
6.0
8.0
10.0
12.0
2008 2009 2010 2011 2012 2013 Thereafter
Funding diversified and maturities lengthened
Debt maturity profile extended with no significant maturities before 2013
Debt Maturity breakdown 30 Sept 2011 Debt Maturity Profile ($bn) – 30 Sept 2011
Debt Maturity Profile ($bn) – 30 September 2008 Debt Maturity breakdown 30 September 2008
RCF refers to revolving credit facility
Total gross debt of $38.6bn
Average maturity = 2.6 years
Total gross debt of $27.7bn
Average maturity = 5.0 years
RCF, 21%
Other, 18%
Long Term
Debt
Facility,
36%
Bonds,
16%
Commercial
Paper, 10%

13
• We have $11.3bn of liquidity at 30 Sept 2011
Liquidity is significant and diversified
Continued strong liquidity position and lengthening of debt maturities
8.5
1.1
1.02.8
Liquidity at 30/9/11 Debt due in 2011
Unused
credit line
Cash &
Equivalent
Short term & Others
11.3
Commercial paper
2.1
– We have no significant counterparty risk on our liquidity lines of $10.6bn
– Exposure is widely spread amongst 28 different banks with average exposure of ~$350mm
Liquidity lines:
– $4bn syndicated credit facility matures 06/05/15
– $6bn syndicated credit facility matures 18/03/16
– $0.6bn bilateral facility matures 30/06/13
14
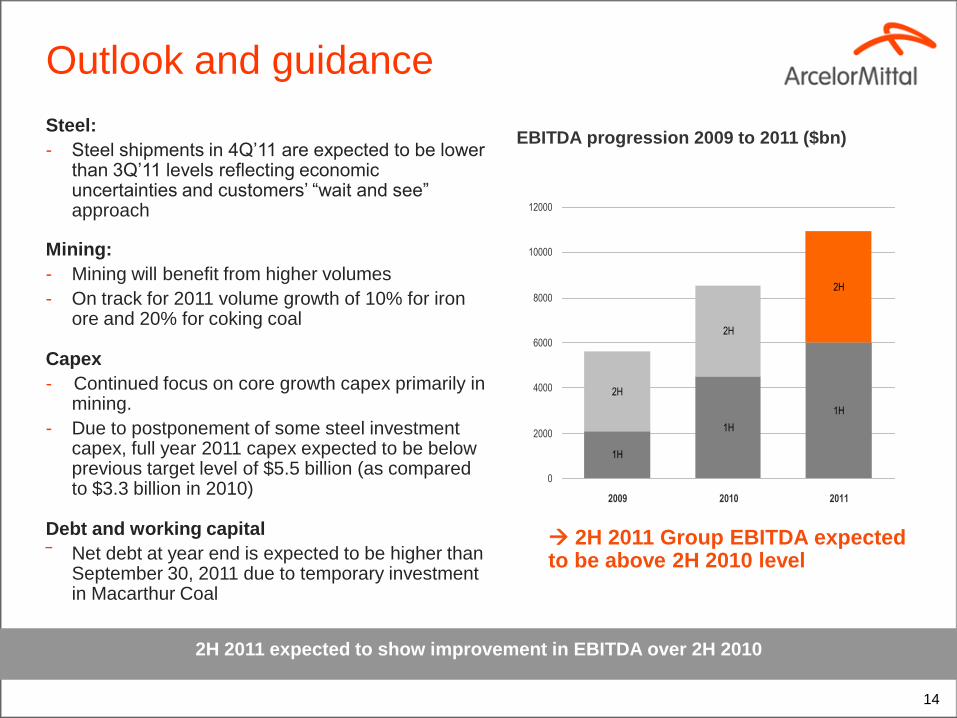
Outlook and guidance
2H 2011 expected to show improvement in EBITDA over 2H 2010
Steel:
- Steel shipments in 4Q‟11 are expected to be lower than 3Q‟11 levels reflecting economic uncertainties and customers‟ “wait and see” approach
Mining:
- Mining will benefit from higher volumes
- On track for 2011 volume growth of 10% for iron ore and 20% for coking coal
Capex
- Continued focus on core growth capex primarily in mining.
- Due to postponement of some steel investment capex, full year 2011 capex expected to be below previous target level of $5.5 billion (as compared to $3.3 billion in 2010)
Debt and working capital
‾ Net debt at year end is expected to be higher than September 30, 2011 due to temporary investment in Macarthur Coal
1H
1H
1H
2H
2H
2H
0
2000
4000
6000
8000
10000
12000
2009 2010 2011
2H 2011 Group EBITDA expected to be above 2H 2010 level
EBITDA progression 2009 to 2011 ($bn)

15
Appendix
16
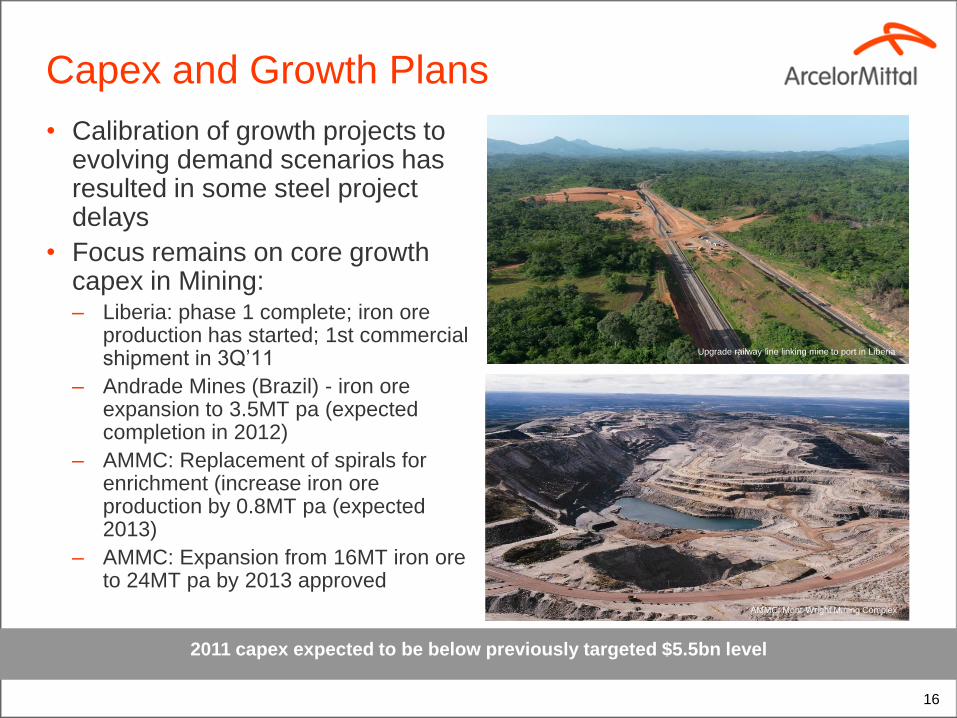
Capex and Growth Plans
• Calibration of growth projects to evolving demand scenarios has resulted in some steel project delays
• Focus remains on core growth capex in Mining: – Liberia: phase 1 complete; iron ore
production has started; 1st commercial shipment in 3Q‟11
– Andrade Mines (Brazil) - iron ore expansion to 3.5MT pa (expected completion in 2012)
– AMMC: Replacement of spirals for enrichment (increase iron ore production by 0.8MT pa (expected 2013)
– AMMC: Expansion from 16MT iron ore to 24MT pa by 2013 approved
2011 capex expected to be below previously targeted $5.5bn level
Upgrade railway line linking mine to port in Liberia
AMMC: Mont-Wright Mining Complex
0
5
10
15
20
25
30
35
2009 2010 2011F 2012F
0
1
2
3
4
5
6
7
Iron ore (LHScale) Coal (RHScale)
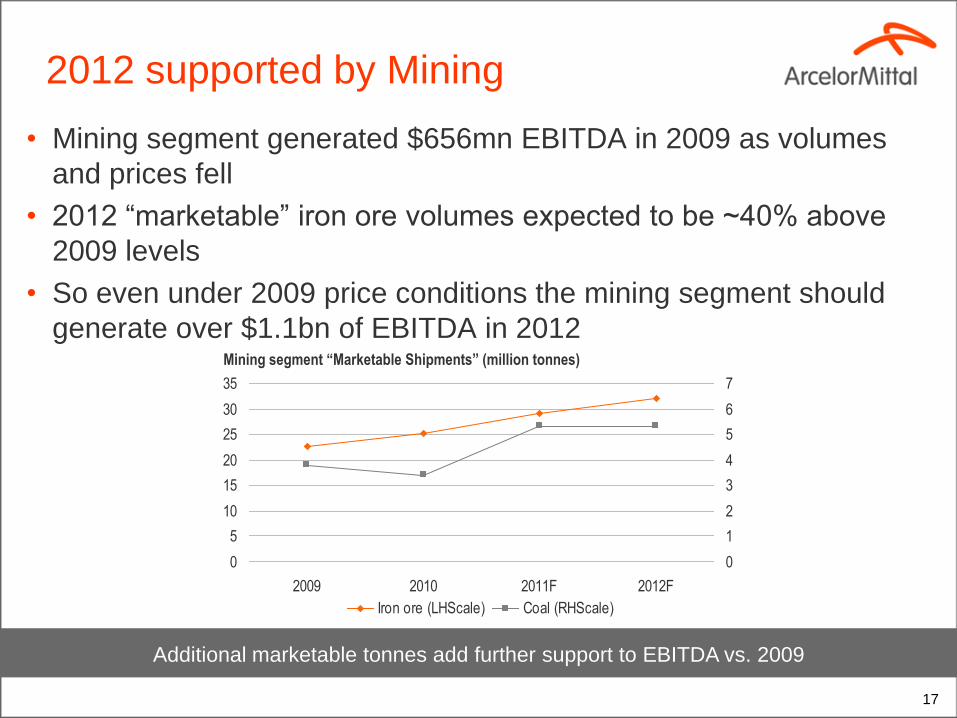
• Mining segment generated $656mn EBITDA in 2009 as volumes
and prices fell
• 2012 “marketable” iron ore volumes expected to be ~40% above
2009 levels
• So even under 2009 price conditions the mining segment should
generate over $1.1bn of EBITDA in 2012
2012 supported by Mining
Additional marketable tonnes add further support to EBITDA vs. 2009
17
Mining segment “Marketable Shipments” (million tonnes)
0.0
0.5
1.0
1.5
2.0
2.5
3.0
3.5
Jan 0
8
Mar
08
May 0
8
Jul 08
Sep 0
8
Nov 0
8
Jan-0
9
Mar-
09
May-0
9
Jul-09
Sep-0
9
Nov-0
9
Jan-1
0
Mar-
10
May-1
0
Jul-10
Sep-1
0
Nov-1
0
Jan-1
1
Mar-
11
May-1
1
Jul-11
0
2,000
4,000
6,000
8,000
10,000
12,000
US Service Centre Inventories (tonnes) Inventory/Shipments (MoS)
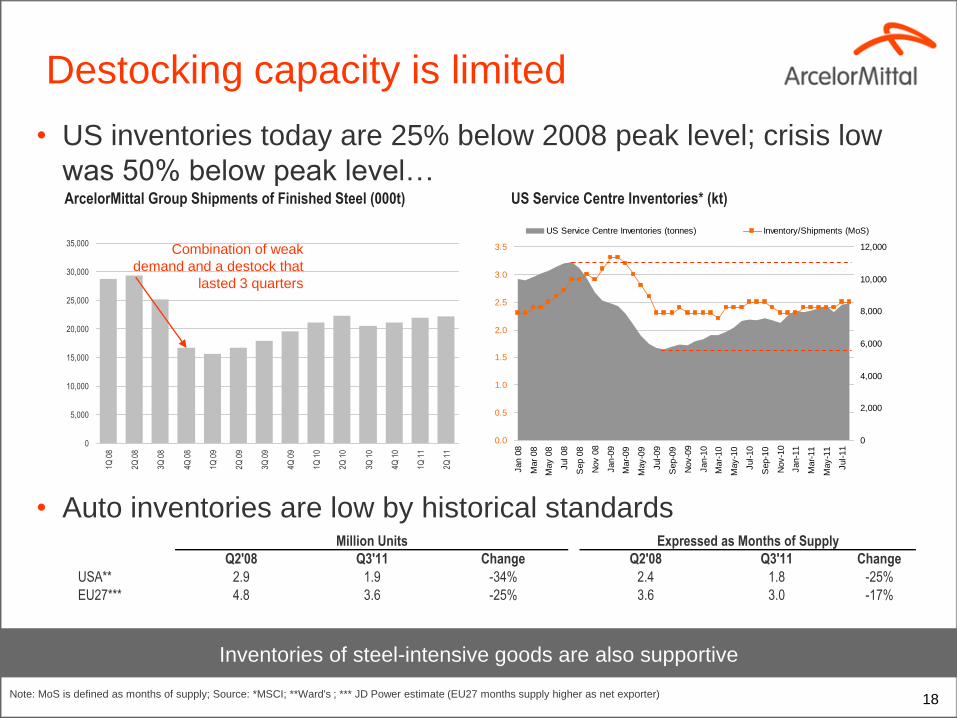
Destocking capacity is limited
• US inventories today are 25% below 2008 peak level; crisis low
was 50% below peak level…
• Auto inventories are low by historical standards
18
0
5,000
10,000
15,000
20,000
25,000
30,000
35,000
1Q 0
8
2Q 0
8
3Q 0
8
4Q 0
8
1Q 0
9
2Q 0
9
3Q 0
9
4Q 0
9
1Q 1
0
2Q 1
0
3Q 1
0
4Q 1
0
1Q 1
1
2Q 1
1
ArcelorMittal Group Shipments of Finished Steel (000t) US Service Centre Inventories* (kt)
Inventories of steel-intensive goods are also supportive
Combination of weak
demand and a destock that
lasted 3 quarters
Note: MoS is defined as months of supply; Source: *MSCI; **Ward's ; *** JD Power estimate (EU27 months supply higher as net exporter)
Million Units Expressed as Months of Supply
Q2'08 Q3'11 Change Q2'08 Q3'11 Change
USA** 2.9 1.9 -34% 2.4 1.8 -25%
EU27*** 4.8 3.6 -25% 3.6 3.0 -17%

19
Outlook for Steel
20
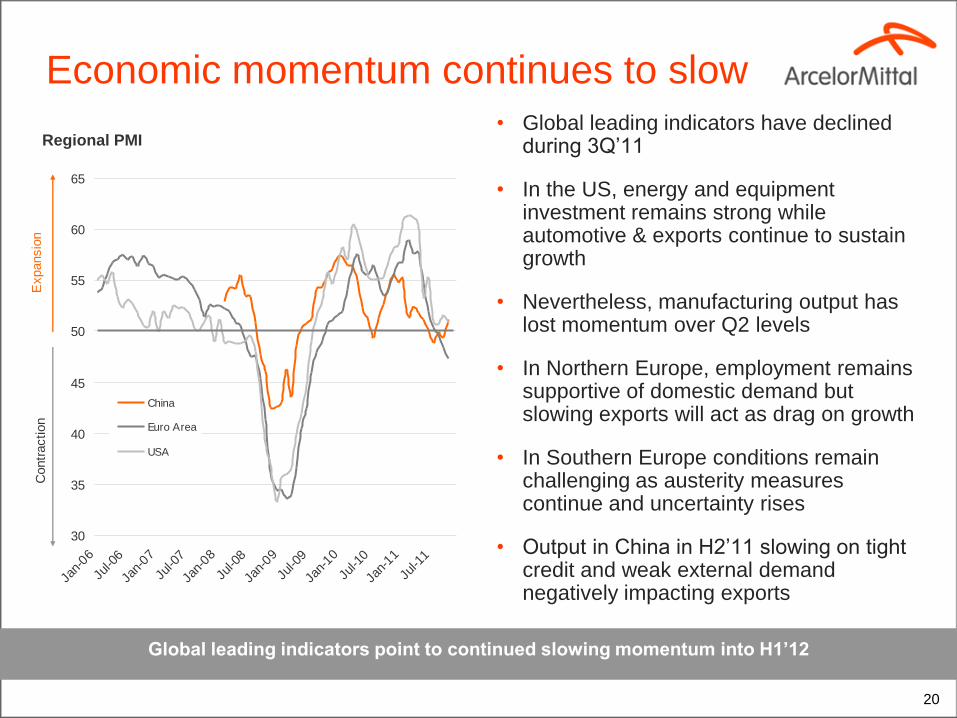
• Global leading indicators have declined during 3Q‟11
• In the US, energy and equipment investment remains strong while automotive & exports continue to sustain growth
• Nevertheless, manufacturing output has lost momentum over Q2 levels
• In Northern Europe, employment remains supportive of domestic demand but slowing exports will act as drag on growth
• In Southern Europe conditions remain challenging as austerity measures continue and uncertainty rises
• Output in China in H2‟11 slowing on tight credit and weak external demand negatively impacting exports
Regional PMI
Global leading indicators point to continued slowing momentum into H1’12
Economic momentum continues to slow
30
35
40
45
50
55
60
65
Jan-
06
Jul-0
6
Jan-
07
Jul-0
7
Jan-
08
Jul-0
8
Jan-
09
Jul-0
9
Jan-
10
Jul-1
0
Jan-
11
Jul-1
1
China
Euro Area
USA
Expansio
nC
ontr
action
21
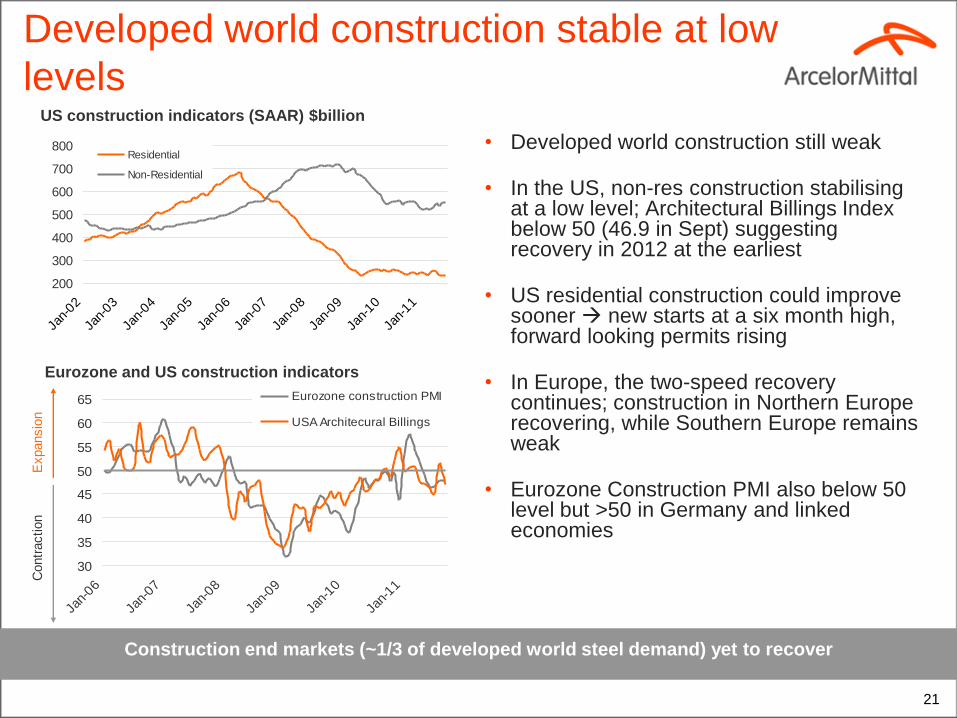
Developed world construction stable at low
levels
• Developed world construction still weak
• In the US, non-res construction stabilising at a low level; Architectural Billings Index below 50 (46.9 in Sept) suggesting recovery in 2012 at the earliest
• US residential construction could improve sooner new starts at a six month high, forward looking permits rising
• In Europe, the two-speed recovery continues; construction in Northern Europe recovering, while Southern Europe remains weak
• Eurozone Construction PMI also below 50 level but >50 in Germany and linked economies
Eurozone and US construction indicators
US construction indicators (SAAR) $billion
Construction end markets (~1/3 of developed world steel demand) yet to recover
Expansio
nC
ontr
action
30
35
40
45
50
55
60
65
Jan-
06
Jan-
07
Jan-
08
Jan-
09
Jan-
10
Jan-
11
Eurozone construction PMI
USA Architecural Billings
Index
200
300
400
500
600
700
800
Jan-
02
Jan-
03
Jan-
04
Jan-
05
Jan-
06
Jan-
07
Jan-
08
Jan-
09
Jan-
10
Jan-
11
Residential
Non-Residential

22
Pace of growth in China slowing
• We expect a soft landing for the Chinese economy
• Construction remained strong in 1H‟11 but signs of slowing in 2H‟11
• Controls on private real estate market are having an impact; but any slowdown should be offset by increased public housing spend
• We expect a slowdown in steel production in the coming months, but we still expect ASC growth of over 8.5% in 2011
• Exports peaked at 4.8mmt in Mar‟11, and so far fallen -14.3% from these levels to 4.2mt in Sept‟11
• Overall 2011 net exports expected at 32mt vs 24.5mt in 2010
China ASC growth >8.5% in 2011
-0.5
0.5
1.5
2.5
3.5
4.5
5.5
6.5
Jan-0
6
Jul-0
6
Jan-0
7
Jul-0
7
Jan-0
8
Jul-0
8
Jan-0
9
Jul-0
9
Jan-1
0
Jul-1
0
Jan-1
1
Jul-1
1
70
90
110
130
150
170
190
210
230
250
270
290
310
330
Jan-
05
Jan-
06
Jan-
07
Jan-
08
Jan-
09
Jan-
10
Jan-
11
Floor Space under construction (12mma)
New ly Started Construction (SA, 3mma)
China Construction Indicator (Million Metre sq.)
Net Exports of Finished Steel (000t)

23
0
2000
4000
6000
8000
10000
12000
14000
Jan-
07
Jul-0
7
Jan-
08
Jul-0
8
Jan-
09
Jul-0
9
Jan-
10
Jul-1
0
Jan-
11
Jul-1
1
2
2.2
2.4
2.6
2.8
3
3.2
3.4
3.6
USA (MSCI)
Months Supply
Destocking capacity is limited
Europe Service Centre Inventories (Mn MT)
Brazil Service Centre Inventories (Mn MT)
US Service Centre Total Steel Inventories (Mn MT)
China Inventories in 25 Major Cities (Mn MT)
Inventory levels are at normal levels in US and China, reducing in Brazil and have increased in Europe
1000
1200
1400
1600
1800
2000
2200
2400
Jan-
07
Jul-0
7
Jan-
08
Jul-0
8
Jan-
09
Jul-0
9
Jan-
10
Jul-1
0
Jan-
11
Jul-1
1
1.6
1.8
2
2.2
2.4
2.6
2.8
3
3.2
3.4
3.6EU (EASSC)
Months Supply
2
4
6
8
10
12
14
16
18
20
Jan-
07
Apr-0
7
Jul-0
7
Oct-0
7
Jan-
08
Apr-0
8
Jul-0
8
Oct-0
8
Jan-
09
Apr-0
9
Jul-0
9
Oct-0
9
Jan-
10
Apr-1
0
Jul-1
0
Oct-1
0
Jan-
11
Apr-1
1
Jul-1
1
Oct-1
1
Flat Long
400
500
600
700
800
900
1,000
1,100
1,200
1,300
1,400
Jan-
07
Jul-0
7
Jan-
08
Jul-0
8
Jan-
09
Jul-0
9
Jan-
10
Jul-1
0
Jan-
11
Jul-1
1
1.5
2
2.5
3
3.5
4
4.5Flat stocks at service centres
Months of supply

24
Slowing underlying demand and weaker
sentiment impacting on prices
Spot iron ore, coking coal and scrap price
(index IH 2008=100) Regional Steel price HRC ($/t)
Raw material prices have recently come under pressure
30
40
50
60
70
80
90
100
110
120
130
Jan-
08
Jul-0
8
Jan-
09
Jul-0
9
Jan-
10
Jul-1
0
Jan-
11
Jul-1
1
Iron Ore
Coking Coal
Scrap
400
500
600
700
800
900
1000
1100
1200
1300
Jan-
08
Jul-0
8
Jan-
09
Jul-0
9
Jan-
10
Jul-1
0
Jan-
11
Jul-1
1
China domestic Shanghai
N.America FOB Midwest
N.Europe domestic ex-works

25
0
200
400
600
800
1000
1200
1400
2008 2009 2010 2011 2012
China EU27 NAFTA ROW
Global apparent steel consumption
6.5-7% 6.5-7%
6.5-7%
6.5-7%
China: +5% YoY
EU27: +6.1% YoY
RoW: +5.5% YoY
NAFTA: +5% YoY*
We expect global Apparent Steel Consumption growth of +7% in 2011 slowing to ~5%* in 2012
RoW: +4.6% YoY
NAFTA: +9% YoY
China: >8.5% YoY
EU27: +/- 1% YoY*
* Base case assumption is low single-digit growth in developed world apparent steel consumption (ASC); a consumer-sentiment driven technical recession in EU and US could lead to a low
single-digit decline in developed world ASC; a deeper Euro-debt crisis with negative YoY GDP growth could see low double-digit decline in developed world ASC
26
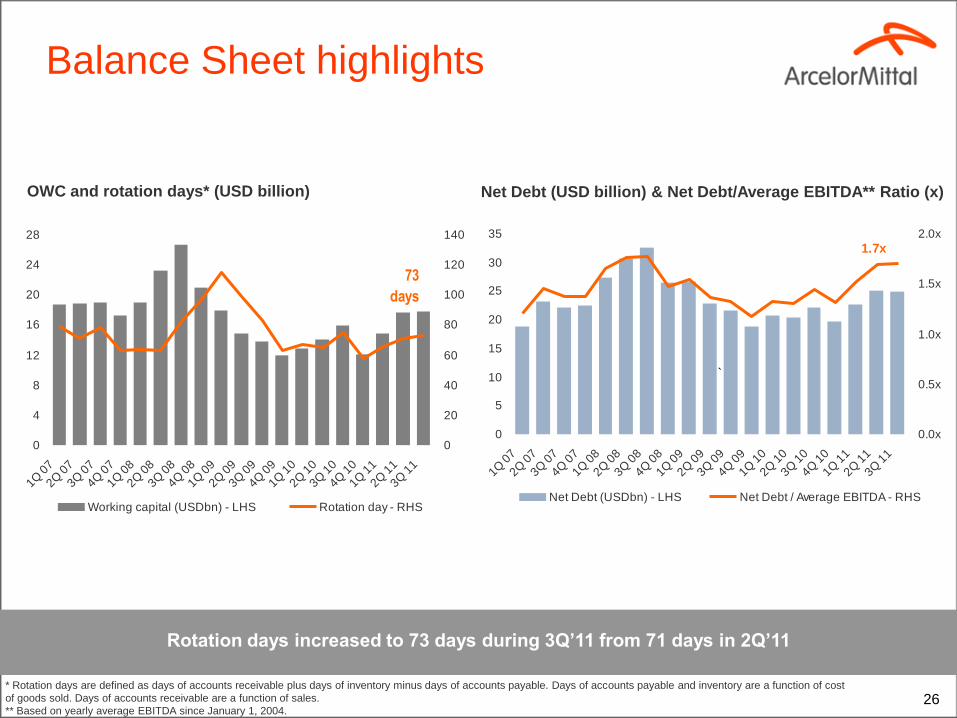
Balance Sheet highlights
OWC and rotation days* (USD billion) Net Debt (USD billion) & Net Debt/Average EBITDA** Ratio (x)
* Rotation days are defined as days of accounts receivable plus days of inventory minus days of accounts payable. Days of accounts payable and inventory are a function of cost
of goods sold. Days of accounts receivable are a function of sales.
** Based on yearly average EBITDA since January 1, 2004.
Rotation days increased to 73 days during 3Q’11 from 71 days in 2Q’11
0
5
10
15
20
25
30
35
1Q 0
7
2Q 0
7
3Q 0
7
4Q 0
7
1Q 0
8
2Q 0
8
3Q 0
8
4Q 0
8
1Q 0
9
2Q 0
9
3Q 0
9
4Q 0
9
1Q 1
0
2Q 1
0
3Q 1
0
4Q 1
0
1Q 1
1
2Q 1
1
3Q 1
1
0.0x
0.5x
1.0x
1.5x
2.0x
Net Debt (USDbn) - LHS Net Debt / Average EBITDA - RHS
1.7x
`
0
4
8
12
16
20
24
28
1Q 0
7
2Q 0
7
3Q 0
7
4Q 0
7
1Q 0
8
2Q 0
8
3Q 0
8
4Q 0
8
1Q 0
9
2Q 0
9
3Q 0
9
4Q 0
9
1Q 1
0
2Q 1
0
3Q 1
0
4Q 1
0
1Q 1
1
2Q 1
1
3Q 1
1
0
20
40
60
80
100
120
140
Working capital (USDbn) - LHS Rotation day - RHS
73
days

27
Net debt scenarios
• We expect to achieve net debt target of <$22.5bn by mid 2012
• Under these economic scenarios: we expect to achieve our net debt target by mid-2012
we retain significant headroom to the 3.5x net debt/LTM** EBITDA covenants on our liquidity lines
Net debt is expected to decline under these scenarios
The following financial metrics are for illustrative purposes only and should not be
construed as guidance
Economic Scenarios EBITDA Working Capital Net Debt ND/EBITDA
Low growth* Greater than 2011 Neutral <$22.5bn <2.0
Recession* Lower than 2011 but above crisis Release <$22.5bn >2.0 but <3.0
2009-type crisis 2009 Level + Delta Management Gains + Mining Growth Significant Release <$22.5bn <3.0
* Low-growth scenario suggests low single-digit growth in developed world apparent steel consumption (ASC); a consumer-sentiment driven technical recession could lead to a low single-digit
decline in developed world ASC; a deeper Euro-debt crisis with negative YoY GDP growth could see low double-digit decline in developed world ASC ** LTM refers to last twelve months

28
ArcelorMittal Mines Canada (AMMC):
expansion underway
• Expansion of our Mont Wright mine at AMMC and concentrate capacity to 24Mt pa due 2013 (from 16Mtpa post operational improvements) approved
• Expansion capitalising on existing infrastructure, product quality and experienced workforce
• Capex C$1.2bn for mine and concentrator plant expansion*
• Cash cost is circa US$35/tonne
• Advantageously located with easy access to European and US markets
Mining expansion plan (concentrate) Million mt
Canadian industrial location ArcelorMittal Mines Canada overview
* Total scheme investment of US$2.1 billion includes investment in expanding the pellet plant which has not yet been committed to
Bloom LakeBloom Lake
Strategic advantage from exclusive use of own rail and port facilities
14 15
1
9
5
10
15
20
25
2011F 2013
Brownfield expansion
Canada base
`
* AMMC 2013 brownfield expansion includes 1mt increase for spirals

29
14
15
0
4
8
12
16
2011F 2012 2015
`
• Phase 1: DSO complete
– 240km rail rehabilitation completed
– Upgrade of Buchanan port and material handling facilities completed
– First direct shipping ore (“DSO”) product shipped in September 2011
– Ramping up to 4mtpa in 2012
• Phase 2: 15mtpa concentrate from 2015
– Expansion to 15mtpa requires investment in a concentrator currently in the final stages of approval
Liberia progress
Liberia greenfield planned expansion (Million MT)
Industrial location of mine
All marketable tonnes
Guinea
Atlantic
Ocean
Liberia
Ivory Coast Yekepa
Buchanan
Sierra Leone
Railway link from Yekepa
to Buchanan (240km)
Liberia progress on track
Liberia greenfield progress
• Total project capex (Phase 1 and 2) US$2 billion
• Expected capex of US$0.7 billion by end of 2011
30
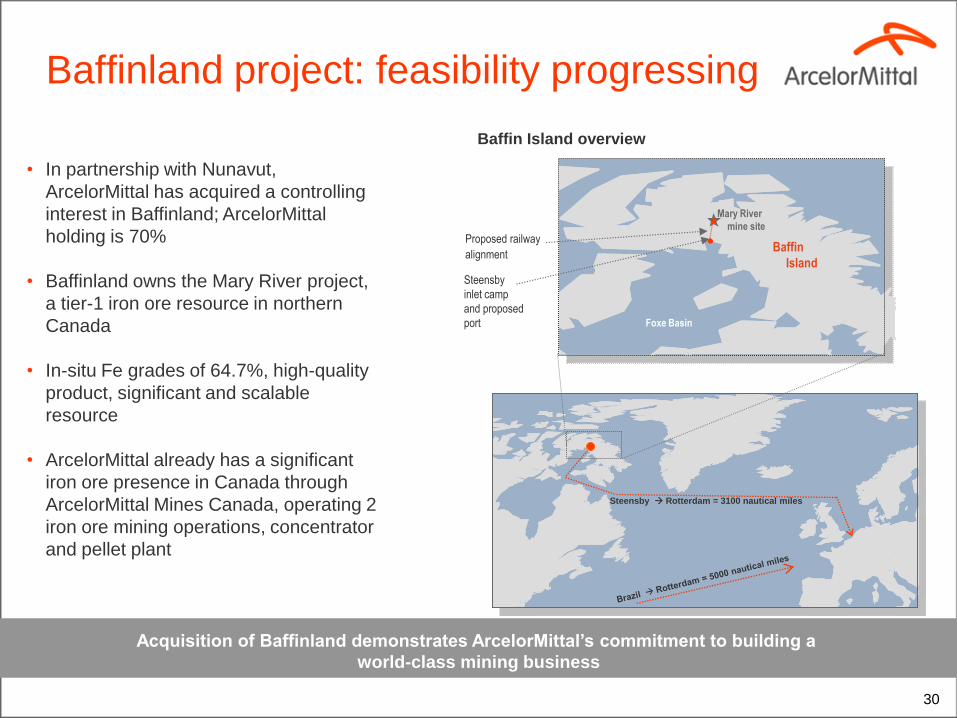
Baffinland project: feasibility progressing
Acquisition of Baffinland demonstrates ArcelorMittal’s commitment to building a
world-class mining business
• In partnership with Nunavut,
ArcelorMittal has acquired a controlling
interest in Baffinland; ArcelorMittal
holding is 70%
• Baffinland owns the Mary River project,
a tier-1 iron ore resource in northern
Canada
• In-situ Fe grades of 64.7%, high-quality
product, significant and scalable
resource
• ArcelorMittal already has a significant
iron ore presence in Canada through
ArcelorMittal Mines Canada, operating 2
iron ore mining operations, concentrator
and pellet plant
Baffin
Bay
Foxe Basin
Baffin
Island
Mary River
mine site
Proposed railway
alignment
Steensby
inlet camp
and proposed
port
Baffin Island overview
Steensby Rotterdam = 3100 nautical miles

31
70
80
90
100
110
120
130
140
150
160
2011F 2012 2013 2014 2015
70
80
90
100
110
120
130
140
150
160
Iron ore production Operating unit cost
Iron ore and coal production and opex
As production increases for iron ore and coal, operating costs are expected to fall
Iron ore production and operating unit cost
(Index base 100=2011)
Coal production and operating unit cost
(Index base 100=2011)
• Investments in AMMC and Liberia reduce the cost position of iron ore (excluding Baffinland)
• 2015 iron ore cash costs expected to be ~15% lower than 2011 (constant $ basis)
70
80
90
100
110
120
130
2011F 2012 2013 2014 2015
70
80
90
100
110
120
130
Coal production Operating unit cost
Index Index
Note: Operating unit costs shown are on a FOB basis
32
Tendering MCC shares to Peabody
• ArcelorMittal will sell its stake in Macarthur to Peabody
• Capital requirement was higher than anticipated for a non-
controlling investment
• ArcelorMittal believes it is more appropriate to focus capital
elsewhere in the business
• Cash out in 4Q‟11 of up to $1.2bn; this cash will return in
1Q‟12 along with a further $0.8bn proceeds for original
16.1% stake
• P&L loss but essentially cash neutral after dividend and
forex
ArcelorMittal is expected to receive $0.8bn for its existing 16.1% stake in Macarthur in Q1’12
33
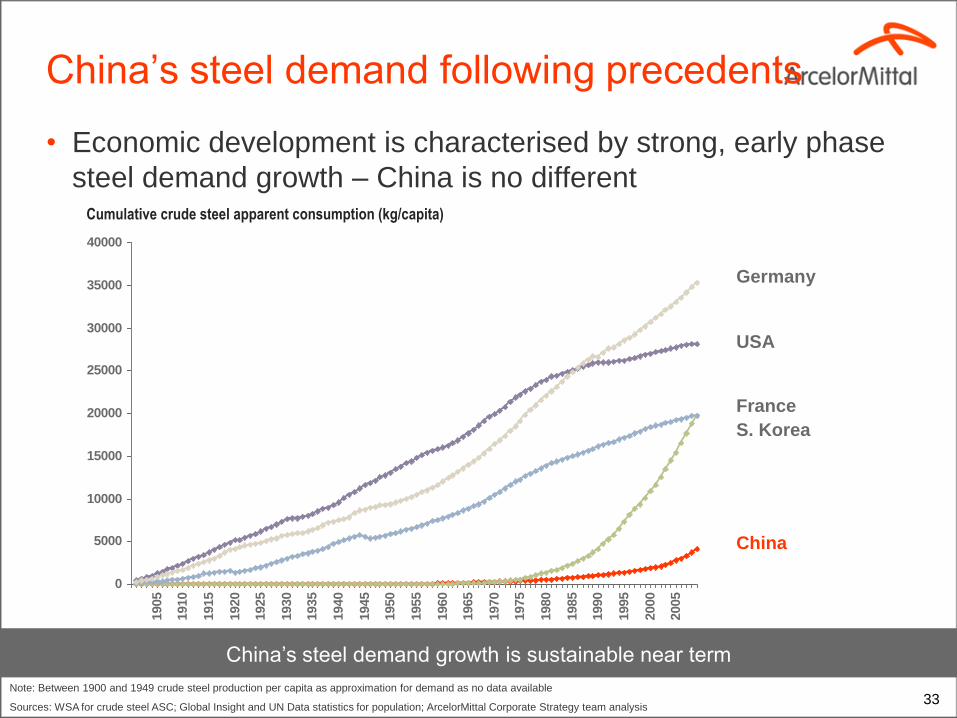
China‟s steel demand following precedents
• Economic development is characterised by strong, early phase
steel demand growth – China is no different
China‟s steel demand growth is sustainable near term
Note: Between 1900 and 1949 crude steel production per capita as approximation for demand as no data available
Sources: WSA for crude steel ASC; Global Insight and UN Data statistics for population; ArcelorMittal Corporate Strategy team analysis
0
5000
10000
15000
20000
25000
30000
35000
40000
1905
1910
1915
1920
1925
1930
1935
1940
1945
1950
1955
1960
1965
1970
1975
1980
1985
1990
1995
2000
2005
China
S. Korea
France
Germany
USA
Cumulative crude steel apparent consumption (kg/capita)

34 Sources: NBS, Mysteel, local governments‟ 12th 5-year plans, ArcelorMittal Corporate Strategy
0
100
200
300
400
500
600
700
800
900
2003 2004 2005 2006 2007 2008 2009 2010 2011 2012 2013 2014 2015 2016 2017 2018 2019 2020
East
North
South
Southwest
Northeast
Northwest
• China steel growth shifting from East/North to South/Southwest
China‟s steel demand growth is expected to be sustained
China steel demand growth will continue
Apparent steel consumption (million tonnes)
Demand projections
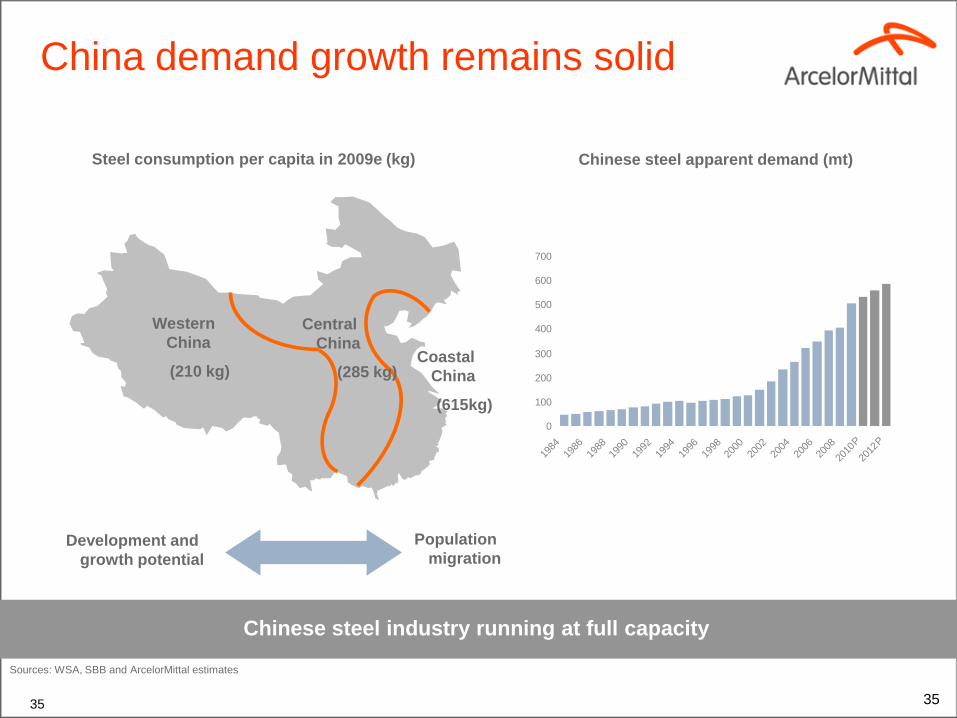
35 35
Chinese steel industry running at full capacity
Sources: WSA, SBB and ArcelorMittal estimates
Steel consumption per capita in 2009e (kg)
Western
China
(210 kg) Coastal
China
(615kg)
Central
China
(285 kg)
Development and
growth potential
Population
migration
Chinese steel apparent demand (mt)
China demand growth remains solid
0
100
200
300
400
500
600
700
1984
1986
1988
1990
1992
1994
1996
1998
2000
2002
2004
2006
2008
2010
P
2012
P
36 Source: ArcelorMittal Corporate Strategy
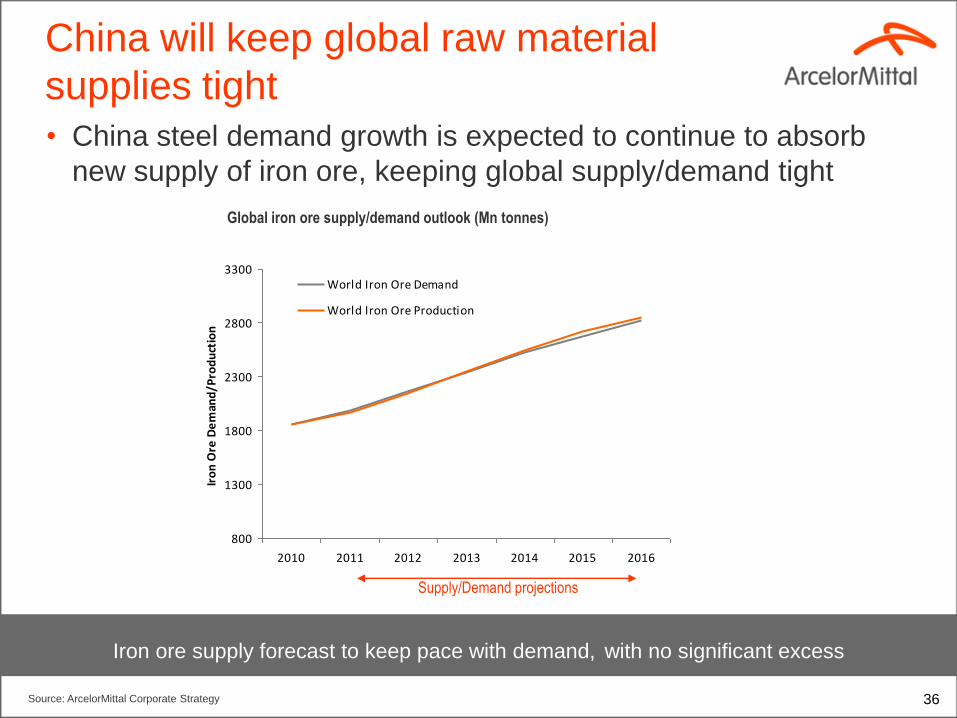
• China steel demand growth is expected to continue to absorb
new supply of iron ore, keeping global supply/demand tight
Iron ore supply forecast to keep pace with demand, with no significant excess
China will keep global raw material
supplies tight
Global iron ore supply/demand outlook (Mn tonnes)
800
1300
1800
2300
2800
3300
2010 2011 2012 2013 2014 2015 2016
Iro
n O
re D
em
and
/Pro
du
ctio
n
World Iron Ore Demand
World Iron Ore Production
Supply/Demand projections
37
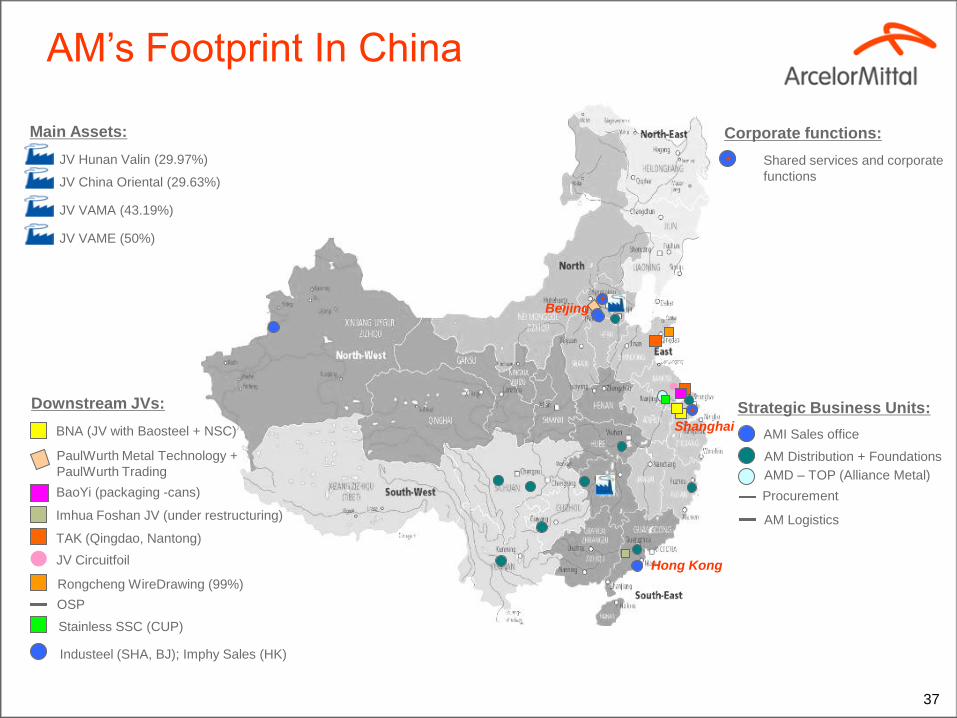
Beijing
Hong Kong
Shanghai
Main Assets:
JV Hunan Valin (29.97%)
JV China Oriental (29.63%)
JV VAMA (43.19%)
JV VAME (50%)
Corporate functions:
Strategic Business Units:
AMI Sales office
AMD – TOP (Alliance Metal)
PaulWurth Metal Technology +
PaulWurth Trading
Imhua Foshan JV (under restructuring)
BaoYi (packaging -cans)
TAK (Qingdao, Nantong)
OSP
BNA (JV with Baosteel + NSC)
Downstream JVs:
JV Circuitfoil
Rongcheng WireDrawing (99%)
Stainless SSC (CUP)
Industeel (SHA, BJ); Imphy Sales (HK)
AM Distribution + Foundations
Procurement
AM Logistics
AM‟s Footprint In China
Shared services and corporate
functions
38
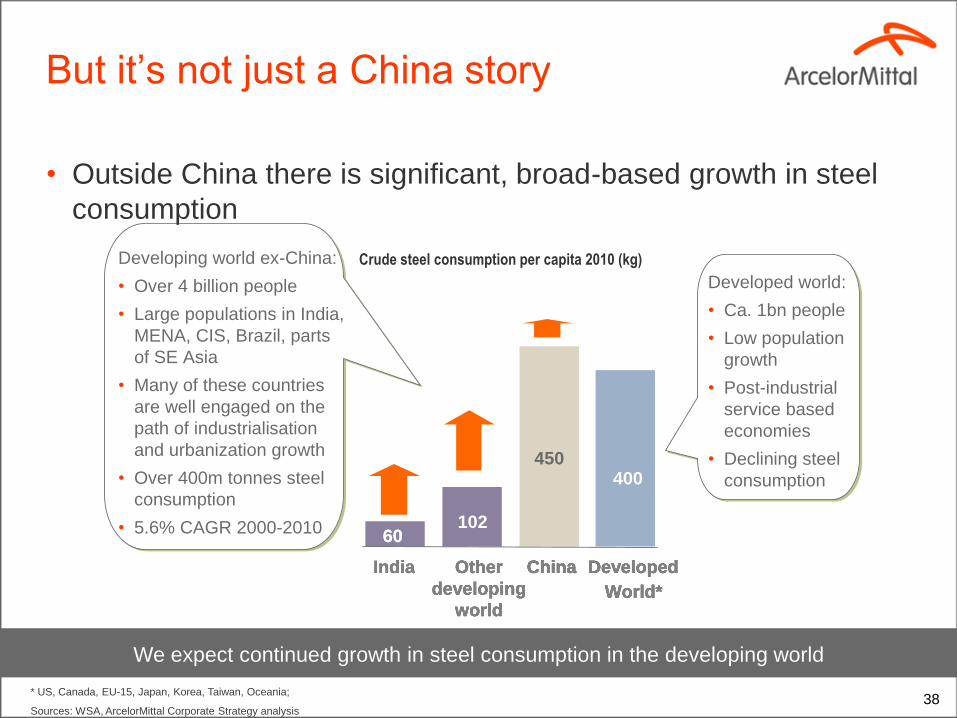
102
450400
60
India Other
developing
world
China Developed
World*
Developing world ex-China:
• Over 4 billion people
• Large populations in India,
MENA, CIS, Brazil, parts
of SE Asia
• Many of these countries
are well engaged on the
path of industrialisation
and urbanization growth
• Over 400m tonnes steel
consumption
• 5.6% CAGR 2000-2010
Developed world:
• Ca. 1bn people
• Low population
growth
• Post-industrial
service based
economies
• Declining steel
consumption
China Developed
World*
Other
developing
world
China Developed
World*
India Other
developing
world
China Developed
World*
60
India Other
developing
world
China Developed
World*
* US, Canada, EU-15, Japan, Korea, Taiwan, Oceania;
Sources: WSA, ArcelorMittal Corporate Strategy analysis
But it‟s not just a China story
• Outside China there is significant, broad-based growth in steel
consumption
Crude steel consumption per capita 2010 (kg)
We expect continued growth in steel consumption in the developing world
39
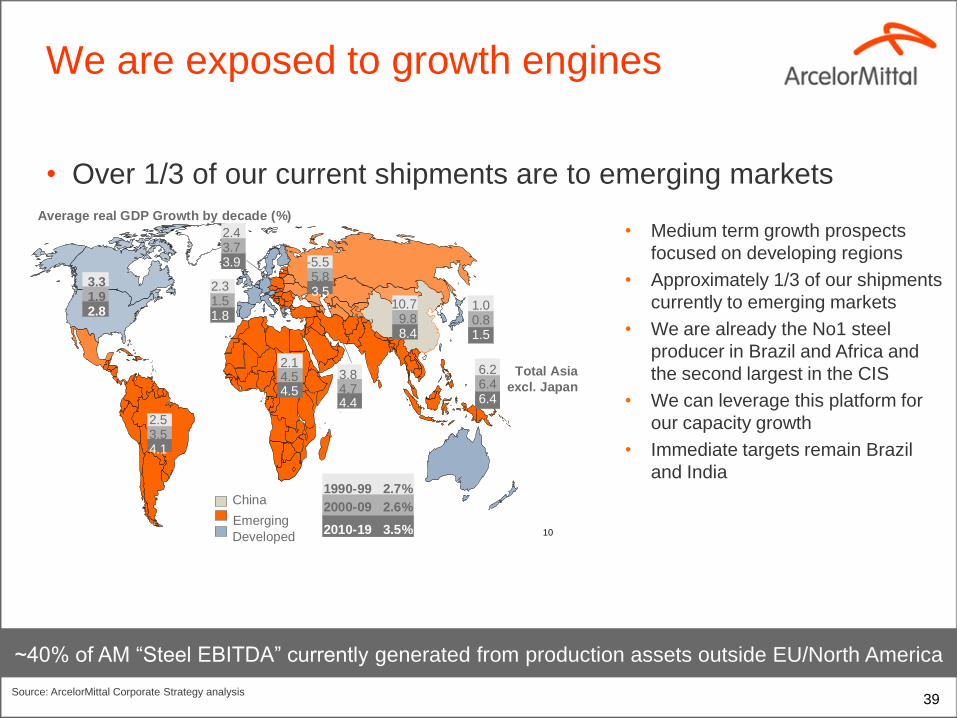
We are exposed to growth engines
• Over 1/3 of our current shipments are to emerging markets
10
Source: Global Insight
Average real GDP Growth by decade (%)
2.31.51.8
3.31.92.8 1.0
0.81.5
10.79.88.4
2.14.54.5
2.43.73.9 -5.5
5.83.5
3.84.74.4
6.26.46.4
2.53.54.1
Total Asia
excl. Japan
1990-99 2.7%
2000-09 2.6%
2010-19 3.5%
China
Emerging
Developed
Global medium term prospects centred on
growth in the developing regions
• Medium term growth prospects
focused on developing regions
• Approximately 1/3 of our shipments
currently to emerging markets
• We are already the No1 steel
producer in Brazil and Africa and
the second largest in the CIS
• We can leverage this platform for
our capacity growth
• Immediate targets remain Brazil
and India
~40% of AM “Steel EBITDA” currently generated from production assets outside EU/North America
Source: ArcelorMittal Corporate Strategy analysis

40
High capex will constrain supply growth
• Returns on greenfield steel capex are unattractive
Margins need to improve before new capacity is justified outside China
0
200
400
600
800
1000
1200
1400
Greenfield Brownfield
Typical capex per tonne for HRC (US$/t) – Capacity growth in developed
world constrained by
environmental considerations
– Beyond China, capacity growth in
developing world is not keeping
pace with demand growth
– Typical greenfield capacity would
require an EBITDA/t margin of
~$250/t to deliver a 15% post-
tax* return on investment
Source: ArcelorMittal Corporate Strategy analysis; *Note assumes a tax rate of 30%
41
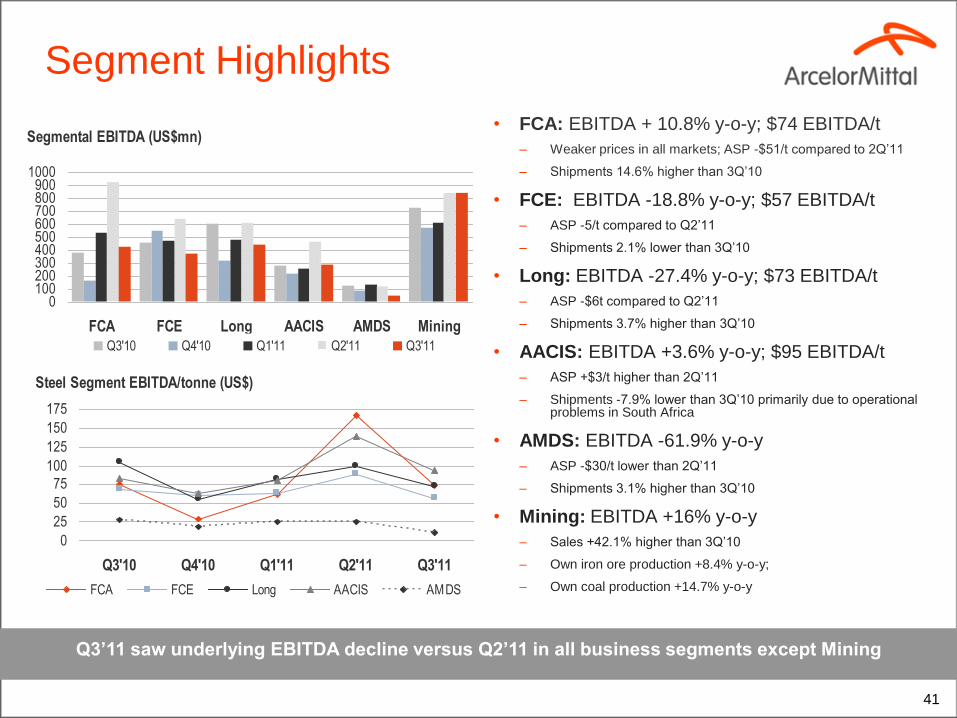
Segment Highlights
Q3’11 saw underlying EBITDA decline versus Q2’11 in all business segments except Mining
• FCA: EBITDA + 10.8% y-o-y; $74 EBITDA/t
– Weaker prices in all markets; ASP -$51/t compared to 2Q‟11
– Shipments 14.6% higher than 3Q‟10
• FCE: EBITDA -18.8% y-o-y; $57 EBITDA/t
– ASP -5/t compared to Q2‟11
– Shipments 2.1% lower than 3Q‟10
• Long: EBITDA -27.4% y-o-y; $73 EBITDA/t
– ASP -$6t compared to Q2‟11
– Shipments 3.7% higher than 3Q‟10
• AACIS: EBITDA +3.6% y-o-y; $95 EBITDA/t
– ASP +$3/t higher than 2Q‟11
– Shipments -7.9% lower than 3Q‟10 primarily due to operational problems in South Africa
• AMDS: EBITDA -61.9% y-o-y
– ASP -$30/t lower than 2Q‟11
– Shipments 3.1% higher than 3Q‟10
• Mining: EBITDA +16% y-o-y
– Sales +42.1% higher than 3Q‟10
– Own iron ore production +8.4% y-o-y;
– Own coal production +14.7% y-o-y
Segmental EBITDA (US$mn)
0100200300400500600700800900
1000
FCA FCE Long AACIS AMDS Mining
Q3'10 Q4'10 Q1'11 Q2'11 Q3'11
Steel Segment EBITDA/tonne (US$)
0
25
50
75
100
125
150
175
Q3'10 Q4'10 Q1'11 Q2'11 Q3'11
FCA FCE Long AACIS AMDS
42
Contacts
Daniel Fairclough – Global Head Investor Relations
+44 207 543 1105
Hetal Patel – UK/European Investor Relations
+44 207 543 1128
Valérie Mella – Investor Relations
+44 207 543 1156
Maureen Baker – Fixed Income/Debt Investor Relations
+33 1 71 92 10 26
Steve John – SRI Relations
+44 203 214 2854
Thomas A McCue – US Investor Relations
+312-899-3927
Lisa Fortuna – US Investor Relations
+312-899-3985