framework: the atherosclerosis risk in communities (aric
TRANSCRIPT

Page 1/25
Dynamic Predictive Accuracy of ElectrocardiographicBiomarkers of Sudden Cardiac Death within a SurvivalFramework: The Atherosclerosis Risk in Communities (ARIC)studyErick Perez-Alday
Oregon Health & Science UniversityAron Bender
Oregon Health & Science UniversityDavid German
Oregon Health & Science UniversitySrini Mukundan
Oregon Health & Science UniversityChristopher Hamilton
Oregon Health & Science UniversityJason Thomas
Oregon Health & Science UniversityYin Li-Pershing
Oregon Health & Science UniversityLarisa G Tereshchenko ( [email protected] )
Oregon Health and Science University https://orcid.org/0000-0002-6976-1313
Research article
Keywords: electrocardiography, sudden cardiac death, vectorcardiography, dynamic prediction, global electrical heterogeneity
Posted Date: October 25th, 2019
DOI: https://doi.org/10.21203/rs.2.10472/v3
License: This work is licensed under a Creative Commons Attribution 4.0 International License. Read Full License
Version of Record: A version of this preprint was published on November 14th, 2019. See the published version athttps://doi.org/10.1186/s12872-019-1234-9.

Page 2/25
AbstractBackground—The risk of sudden cardiac death (SCD) is known to be dynamic. However, the accuracy of a dynamic SCDprediction is unknown. We aimed to measure the dynamic predictive accuracy of ECG biomarkers of SCD and competing non-sudden cardiac death (non-SCD). Methods—Atherosclerosis Risk In Community study participants with analyzable ECGs insinus rhythm were included (n=15,716; 55% female, 73% white, age 54.2±5.8 y). ECGs of 5 follow-up visits were analyzed.Global electrical heterogeneity and traditional ECG metrics (heart rate, QRS, QTc) were measured. Adjudicated SCD was theprimary outcome; non-SCD was competing outcome. Time-dependent area under the receiver operating characteristic curve(ROC(t) AUC) analysis was performed to assess the prediction accuracy of a continuous biomarker in a period of 3,6,9 months,and 1,2,3,5,10, and 15 years using survival analysis framework. Reclassi�cation improvement as compared to clinical riskfactors (age, sex, race, diabetes, hypertension, coronary heart disease, stroke) was measured. Results—Over a median 24.4 yfollow-up, there were 577 SCDs (incidence 1.76 (95%CI 1.63-1.91)/1,000 person-years), and 829 non-SCDs [2.55 (95%CI 2.37-2.71)]. No ECG biomarkers predicted SCD within 3 months after ECG recording. Within 6 months, spatial ventricular gradient(SVG) elevation predicted SCD (AUC 0.706; 95%CI 0.526-0.886), but not a non-SCD (AUC 0.527; 95%CI 0.303-0.75). SVGelevation more accurately predicted SCD if ECG was recorded 6 months before SCD (AUC 0.706; 95%CI 0.526-0.886) than 2years before SCD (AUC 0.608; 95%CI 0.515-0.701). Within the �rst 3 months after ECG recording, only SVG azimuth improvedreclassi�cation of the risk beyond clinical risk factors: 18% SCD events were reclassi�ed from low or intermediate risk to a high-risk category. Long-term, QRS-T angle was the strongest predictor of SCD (AUC 0.710; 95%CI 0.668-0.753 for ECG recordedwithin 10 years before SCD). Conclusion—Short-term and long-term predictive accuracy of ECG biomarkers of SCD differed,re�ecting differences in transient vs. persistent SCD substrates. The dynamic predictive accuracy of ECG biomarkers should beconsidered for competing SCD risk scores. The distinction between markers predicting short-term and long-term events mayrepresent the difference between markers heralding SCD (triggers or transient substrates) versus markers identifying persistentsubstrate.
BackgroundSudden cardiac death (SCD) is a major contributor to cardiovascular mortality, accounting for 40-50% of the years of potentiallife lost from all cardiovascular diseases (CVD).[1, 2] In the United States (US), more than 350,000 emergency medical services-assessed out-of-hospital sudden cardiac arrests occur annually.[1] There remains a lack of reliable, dynamic predictors of SCD.[3]
An electrocardiogram (ECG) can characterize the presence and properties of the electrophysiological substrate of SCD. Ourgroup recently showed that global electrical heterogeneity (GEH), as measured by �ve metrics [spatial QRS-T angle, spatialventricular gradient (SVG) azimuth, elevation, and magnitude, and sum absolute QRST integral (SAI QRST)] is independently(after comprehensive adjustment for time-updated CVD events and their risk factors) associated with SCD, representing anunderlying substrate of SCD.[4] The subsequent discovery of 10 genetic loci, associated with GEH at a genome-widesigni�cance level, con�rmed the presence of several underlying mechanisms behind the GEH ECG phenotype.[5] We alsodeveloped a competing risk score of SCD and showed that the addition of GEH measures to clinical risk factors signi�cantlyimproves the reclassi�cation of SCD risk.[4]
The risk of SCD is known to be dynamic. However, current risk models predict SCD using baseline risk factors measured at asingle point in time. Therefore, evaluating the accuracy of a dynamic prediction is, therefore, necessary to better understand thetemporal relationship between substrate and events. The goal of this study was to investigate the dynamic predictive accuracyof GEH and traditional ECG biomarkers of SCD within a survival framework in comparison with competing non-sudden cardiacdeath (non-SCD) in the Atherosclerosis Risk in Community (ARIC) study participants.
MethodsStudy Population

Page 3/25
The ARIC study is an ongoing prospective cohort study evaluating risk factors, progression, and outcomes of atherosclerosis in15,792 participants (45% male, 74% white) enrolled in four US communities in 1987-1989. The ARIC study protocol and designhave been previously described[6].
We excluded ARIC participants with absent or poor-quality ECGs due to noise, artifacts, or missing leads (n=24), atrial �brillation(AF) (n=36), and ventricular pacing (n=16) at the baseline study visit. Only participants in normal sinus rhythm were included inthis study (n=15,716). If AF or ventricular pacing were diagnosed at any time during follow-up, such participants were includedfor a period until AF or ventricular pacing were diagnosed on 12-lead ECG.
Prevalent CVD was de�ned as the presence of at least one baseline prevalent condition: coronary heart disease (CHD), heartfailure (HF), stroke, peripheral artery disease (PAD), atrioventricular (AV) block II-III, atrial or ventricular pacing, or Wolff-Parkinson-White ECG phenotype.
Clinical characteristics of participants
Prevalent CHD was de�ned as a history of myocardial infarction (MI), or coronary revascularization via coronary artery bypasssurgery or percutaneous coronary intervention. Prevalent MI was de�ned as a self-reported history of MI and/or ECG evidence ofMI as de�ned by the Minnesota code[7]. Prevalent AF was de�ned as either a self-reported and validated history of AF or adiagnosis of AF on the baseline ECG. Prevalent HF was de�ned as self-reported use of HF medication or evidence ofsymptomatic HF as de�ned by stage 3 of the Gothenburg criteria[8], which required the presence of speci�c cardiac andpulmonary symptoms in addition to medical treatment of HF. Prevalent stroke in ARIC was de�ned by a stroke and transientischemic attack diagnostic algorithm, as previously described.[9] PAD was de�ned as the ankle-brachial index ≤0.90. Details ofankle-brachial index measurement in the ARIC study have been previously described.[10]
De�nition of a primary outcome: sudden cardiac death
A follow-up of ARIC participants was previously reported.[11] SCD was de�ned as a sudden pulseless condition in a previouslystable individual without evidence of a non‐cardiac cause of cardiac arrest if the cardiac arrest occurred out of the hospital or inthe emergency room. To identify cases of SCD in ARIC, cases of fatal CHD that occurred by December 31, 2012 were reviewedand adjudicated by a committee of physicians in two phases, as previously described.[12] CHD deaths occurring on or beforeDecember 31, 2001 were adjudicated in the �rst phase. CHD deaths occurring between January 1, 2002 and December 31, 2012were adjudicated in the second phase. Available data from death certi�cates, informant interviews, physician questionnaires,coroner reports, prior medical history, and hospital discharge summaries were reviewed, in addition to circumstancessurrounding the event. Each event was adjudicated independently by two physicians. In cases of disagreement, a third reviewerindependently reviewed the event to provide �nal classi�cation.
De�nite, probable, or possible SCD was included in this study as a primary outcome: the strength of available evidencedetermined this strati�cation. De�nite SCD included cases of witnessed SCD with de�nite evidence such as an available rhythmstrip of life-threatening cardiac arrhythmia, or primary emergency medical services impression of cardiac arrest. Probable SCDwas de�ned as SCD with uncertainty either due to concomitant clinical conditions that can muddle the exact cause of demise,or limited information to adjudicate an event. Possible SCDs were adjudicated only in the second phase of reviews. Thestrength of evidence for probable SCD was greater than the strength of evidence for possible SCD. Possible SCD included casesof death that were unwitnessed but had speci�ed SCD on a death certi�cate and did not document another cause of death.Participants were censored at the time of loss to follow‐up, incident AF or ventricular pacing on 12-lead ECG, or death if thecause of death was any other than SCD.
Competing mortality outcome: non-sudden cardiac death
Cases of fatal CHD were adjudicated by the ARIC Morbidity and Mortality Classi�cation Committee, as previously described.[11]Fatal CHD that did not meet the criteria of SCD comprised the non-SCD outcome.
12 lead ECG Recording
Page 4/25
12-lead ECG was recorded according to the ARIC study protocol and manual (version 1.0; August 1987). The method andprocedure for 12-lead ECG recording, as described in the ARIC manual, are outlined below. During the baseline examination, astandard supine 12-lead ECG was recorded after a 12-hour fast followed by a light snack and at least one hour after smoking oringestion of caffeine. The standard electrocardiograph for the ARIC study was the MAC PC by Marquette Electronics, Inc. A 12-lead resting ECG was obtained consisting of 10 seconds of each of the leads (I, II, III, aVR, aVL, aVF, Vl-V6) simultaneouslyrecorded.
In an effort to enable longitudinal comparisons of ECGs, ARIC investigators developed and implemented a uniform procedurefor electrode placement and skin preparation. The participant, stripped to the waist, was instructed to lie on the recording bedwith arms relaxed at the sides. The individual was asked to avoid movements that may cause errors in marking the electrodelocations. For optimal electrode/skin interface, the electrodes were placed on the skin at least 2-3 minutes before recording theECG. A pen was used to mark the six chest electrode positions. The chest was wiped with a sterile alcohol prep. Left legelectrode was placed on the medial surface of the left ankle. Right leg electrode was placed on the medial surface of the rightankle. Left arm electrode was placed on the medial surface of the left wrist. Right arm electrode was placed on the medialsurface of the right wrist. Electrode V1 was located in the 4th intercostal space at the right sternal border, immediately to theright of the sternum. Electrode V2 was located in the 4th intercostal space, immediately to the left of the sternal border. Next, E-point was located by �nding the 5th intercostal space, and following it horizontally to the midsternal line. Location of V6electrode was found using the chest square. V6 was located at the same level as the E point in the midaxillary line (straightdown from the center of the armpit). If breast tissue was over the V6 area, V6 was placed on top of the breast. No attempt wasmade to move the breast. Electrode V4 was located using a �exible ruler, as a midway between E and V6. Electrode V3 waslocated using a �exible ruler, midway between V2 and V4. Using a �exible ruler, electrode V5 was located midway between thelocations of V4 and V6. After placing the electrodes on the skin, the participant’s information was input to the MAC PC. It wasrequired that electrodes must be on the skin for at least 3 minutes before taking the ECG. During the ECG recording, specialattention was paid to the quality of recording. Quality control and technical troubleshooting procedures were in place tominimize errors (lead switch), noise, and artifacts.
Recorded 12-lead ECGs were originally saved in the memory of the ECG machine and transmitted to a MUSE database (GEMarquette, Milwaukee, WI) within the Halifax ECG Computing Center via the phone line. Later, the MUSE database wastransferred from the Halifax ECG Computing Center to the Epidemiological Cardiology Research Center (EPICARE, Wake ForestUniversity, NC), and then to the Tereshchenko laboratory at Oregon Health & Science University.
Electrocardiogram analyses
ECG data from all �ve follow-up visits were analyzed. Traditional ECG intervals were reported by the 12 SL algorithm usingMagellan ECG Research Workstation V2 (GE Marquette Electronics, Milwaukee, WI). QT interval was corrected for heart rateaccording to Bazett's formula.
We analyzed raw, digital, 10-second, 12-lead ECGs (sampling rate of 500Hz and amplitude resolution of 1µV). Origin andconduction path of each cardiac beat was adjudicated by the team of physicians (DG, AB, SVM, LGT), and each beat wasmanually labeled by investigators (CH, JAT) for subsequent automated analyses. A representative normal sinus median beatwas constructed. For the development of a normal sinus median beat, sinus beats before and after premature ventricularcomplexes, and noisy or distorted beats were excluded. In this study, only the normal sinus median beat was used for ouranalysis.
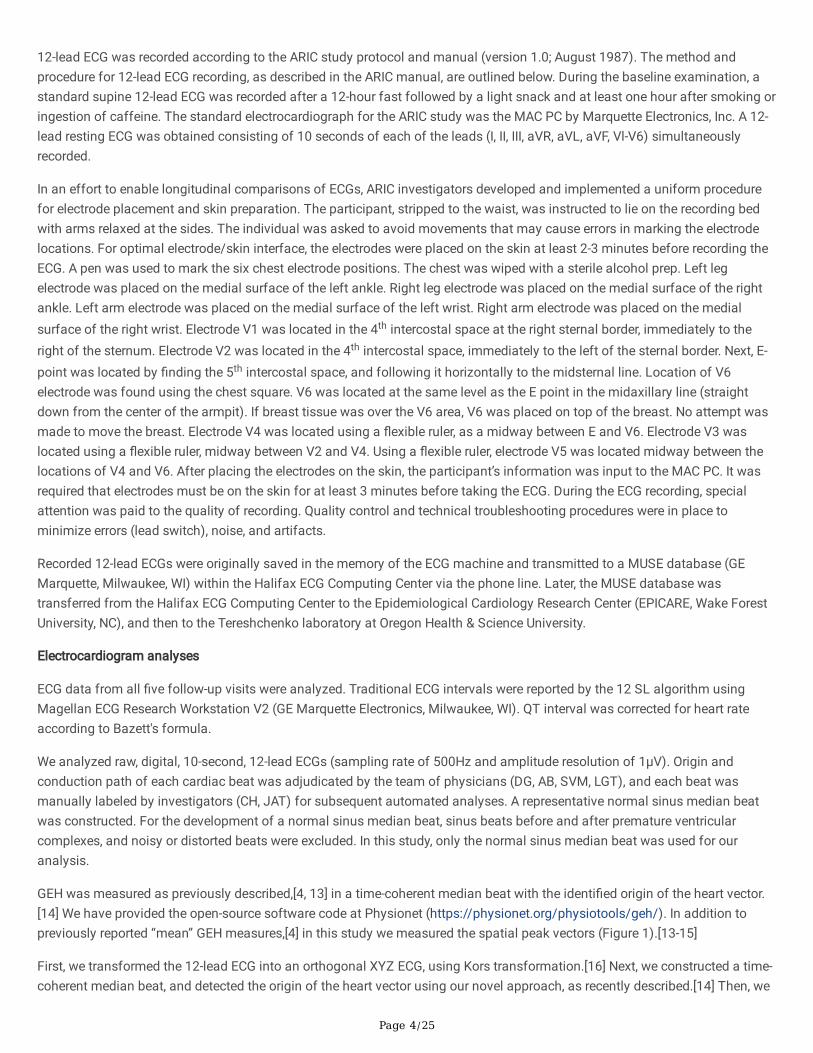
GEH was measured as previously described,[4, 13] in a time-coherent median beat with the identi�ed origin of the heart vector.[14] We have provided the open-source software code at Physionet (https://physionet.org/physiotools/geh/). In addition topreviously reported “mean” GEH measures,[4] in this study we measured the spatial peak vectors (Figure 1).[13-15]
First, we transformed the 12-lead ECG into an orthogonal XYZ ECG, using Kors transformation.[16] Next, we constructed a time-coherent median beat, and detected the origin of the heart vector using our novel approach, as recently described.[14] Then, we

Page 5/25
performed calculations of GEH metrics using the following equations. (See Equations in the Supplemental Files)
Statistical analysis
Time-dependent area under the receiver operating characteristic curve (ROC(t)AUC) analysis was performed to assess thepredictive accuracy of a continuous biomarker in a period of 3, 6, 9 months, and 1,2,3,5,10, and 15 years, using an unadjustedsurvival analysis framework approach[17, 18]. We used the nearest neighbor estimator, which allows the censoring to dependon the marker and is therefore realistic. The percentage of observations included in each neighborhood was de�ned by theequation 0.25* ), where n is the number of observations. All available �ve visits’ ECG data were included in time-dependent AUCanalysis.[4] To satisfy the requirement for ROC analysis, and to perform internal validation of study �ndings, we divided thedataset into �ve unique (non-overlapping) partitions. In each partition, a study participant was presented not more than once,with a unique time to event de�ned as time from ECG recording to the time of outcome (or censoring). If a participant had �veECGs recorded at �ve study visits, each ECG contributed to a different partition. Those participants who had less than 5visits/ECGs were randomly distributed across 5 partitions. Bootstrapping with 500 replications was performed to determine a95% con�dence interval (CI) of ROC(t) AUC in each partition, separately. Then, ROC(t) AUC point estimates, and lower and upperboundaries of 95%CI were averaged across 5 partitions, then presented as a �nal summary result.
To assess the statistical power of ROC(t) AUC analysis at each time period, we compared observed 95%CI width with expected95% CI width. Expected 95%CI width was calculated for observed sample size and observed AUC values at each time period.
We summarized clinical characteristics of study participants with an SCD outcome within the �rst 3 months, 3-6 months, 6months-1 year, 1-2 years, 2-5 years, and more than 5 years after ECG recording in a longitudinal dataset, reporting between-participant standard deviation (SD) for continuous variables, and between-participant frequencies for categorical variables.
We then assessed whether the addition of traditional ECG metrics (heart rate, QRS, QTc) and GEH metrics to our previouslyidenti�ed clinical risk factors of SCD[4] (age, sex, race, diabetes, hypertension, CHD, and stroke) resulted in better predictiveaccuracy for SCD and non-SCD within the �rst 3 months, 3-6 months, 6 months-1 year, 1-2 years, 2-5 years, and more than 5years after ECG recording. We calculated absolute integrated discrimination improvement (IDI), and net reclassi�cationimprovement (NRI) using multivariate logistic regression.[19, 20] IDI estimates improvement in average sensitivity andspeci�city. We estimated category-free NRI and two-category NRI for events, de�ning the high-risk category as a ≥25% risk ofSCD/non-SCD within the �rst 3 months, 3-6 months, and 6 months-1 year after ECG recording. The high-risk category for eventsoccurring 1-2 years, 2-5 years, and more than 5 years after ECG recording was de�ned as ≥ 10% risk of SCD/non-SCD.
Statistical analysis was performed using STATA MP 15.1 (StataCorp LP, College Station, TX, USA). A P-value of < 0.05 wasconsidered signi�cant. PASS 2019 Power Analysis and Sample Size Software (NCSS, LLC. Kaysville, Utah, USA) was used forthe calculations of the expected 95% CI width.
ResultsStudy population
The clinical characteristics of the study population are shown in Table 1. Approximately half of the study participants werefemale, and 73% were white. Average traditional ECG parameters were normal. During the SCD adjudication, the inter‐revieweragreement was 83.2%, and agreement across phases was 92.5%. Over a median follow-up of 24.4 years, there were 577 SCDs(incidence 1.76 (95%CI 1.63-1.91) per 1,000 person-years), and 829 non-SCDs (incidence 2.54 (95%CI 2.37-2.71) per 1,000person-years).
SCD victims who died within the �rst three months after ECG recording were more likely to be CVD-free white males with fewerprevalent CVD risk factors. In contrast, SCD victims who died more than �ve years after ECG recording had nearly equalprobabilities of being male or female, white or non-white (Table 1).
Time-dependent AUC analyses of SCD and competing outcome

Page 6/25
Detailed results for all 5 partitions are provided in Supplemental Table 1 and Figures 2-4. Considering the results of robustvalidation analysis, no ECG biomarkers predicted SCD within three months after ECG recording. Forward-directed SVG azimuthwas signi�cant predictor in some, but not all partitions: peak SVG azimuth partition #1 AUC 0.828 (95%CI 0.709-0.947), andpartition #2 AUC 0.727 (95%CI 0.712-0.742). Predicted 95%CI width (Table 2) indicated insu�cient statistical power forprediction of SCD within 3 months after ECG recording for most ECG biomarkers.
At 6 months, SVG elevation was the only short-term statistically signi�cant biomarker of SCD (area SVG elevation AUC 0.706;95%CI 0.526-0.886), which speci�cally predicted SCD, but did not predict non-SCD (Figure 6C).
Figure 6 illustrates trends in variations in SVG vector direction (azimuth and elevation) predicting SCD versus non-SCD within 9months – 1 year after ECG recording, when upward, and more likely forward-directed SVG vector predicted SCD, whereasleaning backward-directed SVG predicted non-SCD. In contrast, long-term (2 years and beyond) predictors of SCD and non-SCDhad many similarities. Wide spatial QRS-T angle and backward [towards left ventricle (LV)] – directed SVG vector predicted bothSCD and non-SCD.
The most accurate prediction of SCD was provided by ECG biomarkers recorded within 2 years before the outcome (Figures 5-6). Most ECG biomarkers predicted both mortality outcomes, with few exceptions. SVG magnitude did not predict any outcome.At any time, heart rate and QTc were stronger predictors of non-SCD than SCD (Figure 5).
Neither heart rate nor QTc improved risk reclassi�cation beyond traditional clinical risk factors of SCD (Table 3), whereas QRSduration improved reclassi�cation of SCD risk for events occurring 2-5 years after ECG recording. Within the �rst 3 months afterECG recording, only SVG azimuth improved reclassi�cation of the risk beyond traditional clinical risk factors (18% SCD eventswere reclassi�ed from a low or intermediate-risk category to a high-risk category). All GEH metrics signi�cantly improvedreclassi�cation of both SCD and non-SCD beyond clinical risk factors for events occurring at least 1 year after ECG recording(Table 3).
Comparison of area-based versus peak-based SVG and QRS-T angle measurements
SCD predictive accuracy of peak-vector-based versus area-based spatial QRS-T angle, SVG direction, and SVG magnitude wassimilar (Figure 7), with a trend towards slightly better prediction by peak-vector-based QRS-T angle and SVG azimuth, ascompared to area-based QRS-T angle and SVG azimuth metrics.
Internal validation
Results of internal validation are shown in Supplemental Table 1 and Figures 2-4. As expected, long-term prediction of SCD wasconsistent across all 5 study partitions, whereas short-term (within 3-9 months) prediction was unreliable for most ECGvariables (except SVG elevation). Consistently, statistical power was reliably su�cient for ROC(t) AUC analyses for outcomesoccurring at least one year after ECG recording, and beyond (Table 2).
DiscussionIn this study, we described the dynamic predictive accuracy of ECG and VCG biomarkers of two competing mortality outcomes:SCD and non-SCD within a survival framework. Within the identi�ed dynamic predictors of SCD, there was a distinction betweenmarkers predicting short-term events (within 6 months) and markers predicting more intermediate- and long-term events. Thismay represent the difference between markers heralding SCD (triggers or transient substrates) versus markers identifyingpersistent substrate. As expected, transient substrate of non-SCD (describing structural heart disease substrate) wascharacterized by wide QRS-T angle, SVG vector pointing backward (towards LV), wide QRS, prolonged QTc, and increased heartrate. A transient substrate of SCD was characterized by SVG vector pointing upward (towards the out�ow tract). Dynamicpredictive accuracy of ECG and VCG biomarkers of SCD should be taken into account for development of dynamic and life-longprediction of SCD and non-SCD. Importantly, the addition of GEH metrics (but not QTc) to known demographic and clinical risk

Page 7/25
factors (age, sex race, CHD, stroke, diabetes, and hypertension) signi�cantly improved reclassi�cation of risk, supportinginclusion of GEH metrics into dynamic risk scores for SCD.
Triggers, or transient substrate of SCD event
An SCD event represents a “perfect storm,” requiring both susceptible anatomical/functional substrate and a trigger/transientinitiating event.[21] Short-term predictors of SCD in our study re�ect possible SCD triggers. The SVG vector direction predictingshort-term SCD risk differed from SVG vector direction of the intermediate- and long-term risk of SCD. The short-term risk wasuniquely predicted by an SVG vector pointing upward (toward the out�ow tract), suggesting that short total recovery time in theout�ow tracts (as the SVG vector points towards an area with the shortest total refractory time)[22] may represent an SCDtrigger. SVG azimuth was the only ECG metric which improved reclassi�cation of the risk beyond known clinical anddemographic risk factors. Indeed, it is known that “malignant” idiopathic ventricular �brillation and polymorphic ventriculartachycardia can be triggered by ventricular ectopy arising from the out�ow tracts.[23] Early cardiac development affects thegeneration of electrophysiological heterogeneities in the adult heart.[24] There may be a genetic basis for this phenomenon asGEH-associated genetic polymorphisms indicated the involvement of HAND1 and TBX3 genes[5], both of which play a role inout�ow tract development.
Intermediate and long-term substrates of SCD
All ECG measurements (except SVG magnitude) predicted SCD long-term. The long-term substrate of SCD was characterized byan SVG vector pointing backward (toward the LV), a wide spatial QRS-T angle, and a large SAI QRST. Reliable long-termprediction of SCD offers an opportunity for early preventive intervention. Many GEH-associated genetic loci are implicated incardiac development.[5] Further studies of the underlying biology behind GEH-associated loci will help to uncover novelmechanisms of SCD and develop primary prevention strategies. A recent case-control genome-wide association study ofsudden cardiac arrest[25] did not identify any variants at genome-wide statistical signi�cance. An ideal case-control study ofparoxysmal life-threatening arrhythmias (e.g. SCD) would require evidence of freedom from arrhythmogenic substrate incontrols, which is di�cult to achieve. As both trigger and substrate are required for the development of sudden cardiac arrest, alow yield from a case-control genome-wide association study of sudden cardiac arrest is to be expected. In contrast, genomicstudies of electrophysiological substrates have the advantage of a more accurate measurement of phenotype and largerstatistical power (as an outcome is a continuous variable), providing higher yield.
Dynamic predictive accuracy of biomarkers within a survival framework
The dynamic nature of SCD risk is well-recognized. However, the dynamic predictive accuracy of SCD risk markers has not beenpreviously studied. Our large prospective epidemiological study used repeated ECG measures, obtained at �ve follow-up visits,which ensured stable estimates of the dynamic predictive accuracy of ECG biomarkers within a survival framework. Ananalytical framework for the assessment of a dynamic predictive accuracy of biomarkers for censored survival data wasdeveloped fairly recently.[17] Heagerty et al[17] showed that a simple estimator based on Kaplan-Meier method has seriousshortcomings for characterization of accuracy for censored survival outcomes, and developed the nearest neighbor estimatoras a valid ROC solution for prediction accuracy assessment, allowing the censoring process to depend on the marker.
In this study, we used an analytical approach to answer an agnostic predictive accuracy question. To mimic the real-life clinicalscenarios, we intentionally did not adjust for confounders and therefore did not comment on the independence of associationof ECG biomarkers with SCD at any given time point. There were noticeable differences in the clinical characteristics of studyparticipants who died suddenly within 3 months after ECG recording, as compared to those who experienced SCD 5 years afterECG recording. Nevertheless, observed dissimilarities in a dynamic predictive accuracy of ECG biomarkers suggested differentmechanisms behind short-term SCD triggers (or transient substrates) and long-term SCD substrates. A study of SCD triggers isobjectively di�cult to conduct. The methodological approach of the dynamic predictive accuracy of ECG biomarkers within thesurvival framework can provide unique perspective on transient substrates and triggers of SCD, which prompts furtherinvestigation.

Page 8/25
Global Electrical Heterogeneity
The GEH concept is based on Wilson’s ventricular gradient.[22, 26] SVG de�nes a vector that characterizes the magnitude anddirection of the steepest gradient between the longest and the shortest total recovery time across the entire heart, both left andright ventricles.[27] SVG vector is directed towards a zone with the shortest total recovery time. Therefore, GEH is a globalmeasure of the dispersion of total recovery time across the heart, a marker of an underlying arrhythmogenic substrate,encompassing dispersion in both activation and refractoriness.
We comprehensively characterize GEH by measuring �ve features of the SVG vector (Figure 1): SVG magnitude, SVG direction(azimuth and elevation), QRS-T angle, and SVG’s scalar SAI QRST. The spatial QRS-T angle[28] is a well-known marker of therisk of SCD and cardiovascular mortality. SAI QRST is a scalar analog of the SVG [15, 29-31], associated with ventriculartachyarrhythmias in heart failure.[29, 30, 32] We previously showed that GEH is associated with SCD after adjustment fortraditional ECG metrics and a comprehensive list of cardiovascular risk factors.[4] Five GEH metrics only weekly correlate witheach other and traditional ECG measures,[5] and, therefore, are well-suited for inclusion in SCD risk scores. Importantly, GEHgenome-wide association study[5] provided �rst clues about underlying biology behind GEH, which can lead to the futuredevelopment of novel methods of SCD prevention.
In vectorcardiography, there are two major approaches to de�ne spatial vectors: either measuring spatial peak or area vectors.[33] In our study, some peak-based GEH metrics outperformed area-based GEH metrics. This �nding may be at least partiallyexplained by the fact that we used a physiologically sound de�nition of the heart vector origin point and time-coherent globalmedian beat[14], which permitted accurate measurement of peak vectors. GEH metrics are highly reproducible[34], which is anessential factor for their future implementation in clinical practice. Of note, GEH can be calculated using 12-lead ECG that wasrecorded by any manufacturer ECG machine. The open-source software code for GEH calculation is provided athttps://github.com/Tereshchenkolab/Origin and https://www.physionet.org/content/geh.
Clinical implications
Our study is the �rst step towards the development of dynamic SCD risk prediction. Recently, we developed an SCD risk score[4],available at www.ecgpredictscd.org. However, our SCD risk model, similarly to other risk models[35, 36], includes risk factorsthat were measured once at baseline. Further improvement of SCD risk strati�cation requires knowledge of the dynamicpredictive accuracy of ECG biomarkers of SCD. After validation of our study �ndings in another cohort, recommendationsregarding an optimal frequency of ECG recordings can be developed.
Strengths and Limitations
The strength of our study derives from the large prospective cohort design, with �ve longitudinal ECG recordings, long-term(median 24 years) follow-up, and a well-adjudicated SCD outcome. However, limitations of the study should be taken intoaccount. The small number of events within 3 and 6 months after ECG recording limited the statistical power of SCD triggeranalyses. It is worth noting that 9 out of 11 ARIC participants who succumbed to SCD within 3 months after ECG recording weremen. We cannot rule out the possibility that the observed transient substrate of SCD is sex-speci�c. Further studies of SCDtriggers in women are needed.
While we performed robust internal validation of our �ndings using bootstrapping in �ve partitions of the dataset, replication ofthe SCD trigger analyses in another prospective cohort is needed. Nevertheless, this is the largest prospective study of SCDtriggers and substrates, suggesting differences between long-term and transient SCD-speci�c and non-SCD-speci�c substrates.[37] In this study, correlation between GEH metrics and heart rate was weak (r values between 0.1-0.2), and we did not normalizeGEH metrics by heart rate. However, further studies are needed to determine whether normalization by heart rate can furtherimprove the predictive value of GEH.
Conclusions

Page 9/25
Dynamic predictive accuracy of ECG and VCG biomarkers should be taken into account for the development of dynamic riskscores of competing SCD risk. The distinction between markers predicting short-term and long-term events may represent thedifference between markers heralding SCD (triggers or transient substrates) versus markers identifying persistent substrate.
AbbreviationsSCD: sudden cardiac death. CVD: cardiovascular disease. US: United States. ECG: electrocardiogram. GEH: global electricalheterogeneity. SVG: spatial ventricular gradient. SAI QRST: sum absolute QRST integral. Non-SCD: non-sudden cardiac death.ARIC: Atherosclerosis Risk In Community study. AF: atrial �brillation. CHD: coronary heart disease. HF: heart failure. PAD:peripheral artery disease. AV: atrioventricular. MI: myocardial infarction. ROC: receiver operating characteristic. AUC: area underthe curve. CI: con�dence interval. SD: standard deviation. IDI: integrated discrimination improvement. NRI: net reclassi�cationimprovement. LV: left ventricle. RVOT: right ventricular out�ow tract. VM: vector magnitude.
DeclarationsEthics approval and consent to participate
This study was approved by the Oregon Health & Science University and the Johns Hopkins University Institutional Reviewboards (IRB). The ARIC study protocol was approved by the IRB at all participating institutions: University of North Carolina atChapel Hill IRB, Johns Hopkins University IRB, University of Mississippi Medical Center IRB, and University of Minnesota IRB. Allparticipants signed informed consent before entering the study. The study protocol conforms to the ethical guidelines of the1975 Declaration of Helsinki.
Consent for publication
Not applicable
Availability of data and materials
After the ethical approval at a requestor institution, the de-identi�ed ARIC data can be obtained from the National Heart, Lung,and Blood Institute – maintained BioLINCC repository [38], and via ARIC Coordinating Center at the University of North Carolina—Chapel Hill[39]. The BioLINCC website[38] includes detailed information about the process to obtain such data. Details aboutthe procedures for data request from the ARIC Coordinating Center at the University of North Carolina—Chapel Hill can be foundonline [39]. GEH results were reported to the ARIC Coordinating Center by the ARIC ancillary study “Novel ECG measures and riskof sudden cardiac death” (principal investigator Tereshchenko).
We provided open-source MATLAB (MathWorks, Natick, MA, USA) code at: https://github.com/Tereshchenkolab/Global-Electrical-Heterogeneity, and https://github.com/Tereshchenkolab/Origin. SCD risk calculator is available athttp://www.ecgpredictscd.org/.
Competing interests
The authors declare that they have no competing interests.
Funding
The ARIC study has been funded in whole or in part with Federal funds from the National Heart, Lung, and Blood Institute,National Institutes of Health, Department of Health and Human Services, under Contract nos. (HHSN268201700001I,HHSN268201700002I, HHSN268201700003I, HHSN268201700004I, HHSN268201700005I). This work was supported byHL118277 (LGT). The funding body had no role in the design of the study and collection, analysis, and interpretation of dataand in writing the manuscript.
Authors' contributions

Page 10/25
EAPA and LGT designed the study. AB, DG, SVM and LGT reviewed 12-lead ECGs and adjudicated origin and conduction of eachcardiac beat. EAPA and YLP developed MATLAB software code for automated ECG analyses and analyzed digital ECG signal.CH and JT checked quality of automated ECG analysis and veri�ed accuracy of �ducial points detection. LGT performed thestatistical analyses. EAPA and LGT wrote the �rst draft of the manuscript. All authors participated in data interpretation,discussion and preparation of the �nal manuscript, and read and approved the �nal manuscript.
Acknowledgements
The authors thank the staff and participants of the ARIC study for their important contributions. We would like to acknowledgethe SCD mortality classi�cation committee members: Nona Sotoodehnia (lead), Selcuk Adabag, Sunil Agarwal, Lin Chen, RajatDeo, Leonard Ilkhanoff, Liviu Klein, Saman Nazarian, Ashleigh Owen, Kris Patton, and Larisa Tereshchenko.
References[1] Benjamin EJ, Virani SS, Callaway CW, Chamberlain AM, Chang AR, Cheng S, et al. Heart Disease and Stroke Statistics-2018Update: A Report From the American Heart Association. Circulation. 2018;137(12):e67-e492.
[2] Stecker EC, Reinier K, Marijon E, Narayanan K, Teodorescu C, Uy-Evanado A, et al. Public health burden of sudden cardiacdeath in the United States. Circ Arrhythm Electrophysiol. 2014;7(2):212-7.
[3] Morin DP, Link MS. Advances in the Risk Strati�cation, Prevention, and Treatment of Sudden Cardiac Death. ProgCardiovasc Dis. 2019;62(3):203-4.
[4] Waks JW, Sitlani CM, Soliman EZ, Kabir M, Ghafoori E, Biggs ML, et al. Global Electric Heterogeneity Risk Score forPrediction of Sudden Cardiac Death in the General Population: The Atherosclerosis Risk in Communities (ARIC) andCardiovascular Health (CHS) Studies. Circulation. 2016;133(23):2222-34.
[5] Tereshchenko LG, Sotoodehnia N, Sitlani CM, Ashar FN, Kabir M, Biggs ML, et al. Genome-Wide Associations of GlobalElectrical Heterogeneity ECG Phenotype: The ARIC (Atherosclerosis Risk in Communities) Study and CHS (CardiovascularHealth Study). J Am Heart Assoc. 2018;7(8):e008160.
[6] The ARIC Investigators. The Atherosclerosis Risk in Community (ARIC) Study: Design and Objectives. Am J Epidemiol.1989;129(4):687-702.
[7] Blackburn H, Keys A, Simonson E, Rautaharju P, Punsar S. The electrocardiogram in population studies. A classi�cationsystem. Circulation. 1960;21:1160-75.
[8] Eriksson H, Caidahl K, Larsson B, Ohlson LO, Welin L, Wilhelmsen L, et al. Cardiac and pulmonary causes of dyspnoea--validation of a scoring test for clinical-epidemiological use: the Study of Men Born in 1913. Eur Heart J. 1987;8(9):1007-14.
[9] Toole JF, Chambless LE, Heiss G, Tyroler HA, Paton CC. Prevalence of stroke and transient ischemic attacks in theatherosclerosis risk in communities (ARIC) study. Annals of Epidemiology. 1993;3(5):500-3.
[10] Weatherley BD, Chambless LE, Heiss G, Catellier DJ, Ellison CR. The reliability of the ankle-brachial index in theAtherosclerosis Risk in Communities (ARIC) study and the NHLBI Family Heart Study (FHS). BMC cardiovascular disorders.2006;6:7.
[11] White AD, Folsom AR, Chambless LE, Sharret AR, Yang K, Conwill D, et al. Community surveillance of coronary heartdisease in the Atherosclerosis Risk in Communities (ARIC) Study: methods and initial two years' experience. Journal of clinicalepidemiology. 1996;49(2):223-33.
[12] Bogle BM, Sotoodehnia N, Kucharska-Newton AM, Rosamond WD. Vital exhaustion and sudden cardiac death in theAtherosclerosis Risk in Communities Study. Heart. 2018;104(5):423-9.

Page 11/25
[13] Thomas JA, E AP-A, Junell A, Newton K, Hamilton C, Li-Pershing Y, et al. Vectorcardiogram in athletes: The Sun Valley SkiStudy. Ann Noninvasive Electrocardiol. 2019;24(3):e12614.
[14] Perez-Alday EA, Li-Pershing Y, Bender A, Hamilton C, Thomas JA, Johnson K, et al. Importance of the heart vector originpoint de�nition for an ECG analysis: The Atherosclerosis Risk in Communities (ARIC) study. Comput Biol Med. 2019;104:127-38.
[15] Sur S, Han L, Tereshchenko LG. Comparison of sum absolute QRST integral, and temporal variability in depolarization andrepolarization, measured by dynamic vectorcardiography approach, in healthy men and women. PLoS One. 2013;8(2):e57175.
[16] Kors JA, van HG, Sittig AC, van Bemmel JH. Reconstruction of the Frank vectorcardiogram from standardelectrocardiographic leads: diagnostic comparison of different methods. EurHeart J. 1990;11(12):1083-92.
[17] Heagerty PJ, Lumley T, Pepe MS. Time-dependent ROC curves for censored survival data and a diagnostic marker.Biometrics. 2000;56(2):337-44.
[18] Cattaneo M, Malighetti P, Spinelli D. Estimating receiver operative characteristic curves for time-dependent outcomes: Thestroccurve package. Stata Journal. 2017;17(4):1015-23.
[19] Pencina MJ, D'Agostino RB, Sr., D'Agostino RB, Jr., Vasan RS. Evaluating the added predictive ability of a new marker: fromarea under the ROC curve to reclassi�cation and beyond. Stat Med. 2008;27(2):157-72; discussion 207-12.
[20] Pencina MJ, D'Agostino RB, Sr., Steyerberg EW. Extensions of net reclassi�cation improvement calculations to measureusefulness of new biomarkers. StatMed. 2011;30(1):11-21.
[21] Zipes DP, Wellens HJ. Sudden cardiac death. Circulation. 1998;98(21):2334-51.
[22] Waks JW, Tereshchenko LG. Global electrical heterogeneity: A review of the spatial ventricular gradient. J Electrocardiol.2016;49(6):824-30.
[23] Noda T, Shimizu W, Taguchi A, Aiba T, Satomi K, Suyama K, et al. Malignant entity of idiopathic ventricular �brillation andpolymorphic ventricular tachycardia initiated by premature extrasystoles originating from the right ventricular out�ow tract. JAm Coll Cardiol. 2005;46(7):1288-94.
[24] Boukens BJ, Christoffels VM, Coronel R, Moorman AF. Developmental basis for electrophysiological heterogeneity in theventricular and out�ow tract myocardium as a substrate for life-threatening ventricular arrhythmias. Circ Res. 2009;104(1):19-31.
[25] Ashar FN, Mitchell RN, Albert CM, Newton-Cheh C, Brody JA, Muller-Nurasyid M, et al. A comprehensive evaluation of thegenetic architecture of sudden cardiac arrest. Eur Heart J. 2018;39(44):3961-9.
[26] Wilson FN, Macleod AG, Barker PS, Johnston FD. The determination and the signi�cance of the areas of the ventricularde�ections of the electrocardiogram. American Heart Journal. 1934;10(1):46-61.
[27] Burger HC. A theoretical elucidation of the notion ventricular gradient. American Heart Journal. 1957;53(2):240-6.
[28] Oehler A, Feldman T, Henrikson CA, Tereshchenko LG. QRS-T Angle: A Review. Annals Noninvasive Electrocardiol2014;19(6):534-42.
[29] Tereshchenko LG, McNitt S, Han L, Berger RD, Zareba W. ECG marker of adverse electrical remodeling post-myocardialinfarction predicts outcomes in MADIT II study. PLoS One. 2012;7(12):e51812.
[30] Tereshchenko LG, Cheng AA, Fetics BJ, Butcher B, Marine JE, Spragg DD, et al. A new electrocardiogram marker to identifypatients at low risk for ventricular tachyarrhythmias: sum magnitude of the absolute QRST integral. Journal ofElectrocardiology. 2011;44(2):208-16.

Page 12/25
[31] Kozmann G, Tuboly G, Szathmáry V, Švehlíková J, Tyšler M. Computer modelling of beat-to-beat repolarizationheterogeneity in human cardiac ventricles. Biomedical signal processing and control. 2014;14(0):285-90.
[32] Tereshchenko LG, Cheng A, Fetics BJ, Marine JE, Spragg DD, Sinha S, et al. Ventricular arrhythmia is predicted by sumabsolute QRST integralbut not by QRS width. J Electrocardiol. 2010;43(6):548-52.
[33] Oehler A, Feldman T, Henrikson CA, Tereshchenko LG. QRS-T Angle: A Review. Ann Noninvasive Electrocardiol.2014;19(6):534-42.
[34] Perez-Alday E, Hamilton, C. Li-Pershing, Y Monroy-Trujillo, J. M. Estrella, M. Sozio, Stephen Jaar, B. Parekh, RulanTereshchenko, L. . The Reproducibility of Global Electrical Heterogeneity ECG Measurements. Computing in cardiology: IEEEExplore; 2018. p. 162-6.
[35] Deo R, Norby FL, Katz R, Sotoodehnia N, Adabag S, DeFilippi CR, et al. Development and Validation of a Sudden CardiacDeath Prediction Model for the General Population. Circulation. 2016;134(11):806-16.
[36] Bogle BM, Ning H, Goldberger JJ, Mehrotra S, Lloyd-Jones DM. A Simple Community-Based Risk-Prediction Score forSudden Cardiac Death. Am J Med. 2018;131(5):532-9 e5.
[37] Escobar-Robledo LA, Bayes-de-Luna A, Lupon J, Baranchuk A, Moliner P, Martinez-Selles M, et al. Advanced interatrial blockpredicts new-onset atrial �brillation and ischemic stroke in patients with heart failure: The "Bayes' Syndrome-HF" study. Int JCardiol. 2018;271:174-80.
[38] NIH/NHLBI. Biologic Specimen and Data Repository Information Coordinating Center. 1987. Available at:https://biolincc.nhlbi.nih.gov/. Accessed June 22, 2018.
[39] ARIC. Study Description. 1987. Available at: http://www2.cscc.unc.edu/aric/distribution-agreements. Accessed June 22nd,2018. http://www2.cscc.unc.edu/aric/distribution-agreements
TablesTable 1. Clinical characteristics of study population

Page 13/25
SCD event within the following time interval after ECG recording:
racteristic n=15,716 1-90 days(n=11; T=1)
91-180 days(n=16; T=1)
181-365 d(n=47; T=1)
365-730 d(n=84; T=1)
731-1825 d(n=495; T=2.5)
>5 years(n=320;T=1.1)
±SD, years 54.2±5.8 63±5 58±6 62±6 60±7 59±6 62±7male, n(%) 8,680(55.2) 18% 31% 30% 29% 36% 42%
te, n(%) 11,431(72.7) 82% 50% 60% 60% 59% 56%betes, n(%) 1,867(12.0) 40% 47% 39% 38% 39% 40%ertension, n(%) 5,475(35.0) 40% 60% 64% 68% 71% 68%-hypertensive
gs, n(%)4,803(30.6) 40% 53% 62% 70% 68% 66%
D, n(%) 756(4.8) 20% 33% 36% 39% 30% 25%rt failure, n(%) 732(4.7) 0 25% 15% 9% 10% 9%ke, n(%) 269(1.7) 0 13% 7% 18% 10% 10%pheral artery
ease, n(%)630(4.2) 0 0 14% 17% 9% 14%
rent smoking,)
4,107(26.2) 40% 47% 36% 39% 38% 29%
y-mass-ex±SD, kg/m2
27.7±5.4 32.4±5.8 29.2±5.4 29.1±6.7 28.8±6.2 29.4±5.9 30.4±6.6
alesterol±SD,ol/L
5.6±1.1 5.3±0.8 5.0±1.2 5.2±1.2 5.2±1.2 5.6±1.0 5.3±1.1
lycerides±SD,ol/L
1.5±1.0 2.3±2.0 1.5±0.7 1.7±1.1 1.9±1.5 1.7±1.2 1.7±1.2
oholsumption±SD,k
42.4±97.0 11±23 130±390 28±75 44±94 46±102 33±76
rt rate±SD,m
66.3±10.3 74±13 68±11 65±10 69±14 67±10 66±12
rected QT±SD, 416.4±19.7 428±20 436±44 429±33 433±35 423±23 424±22
S duration±SD, 92.3±12.7 97±16 99±12 109±24 105±24 98±18 98±18
B/IVCD, n(%) 666(4.2) 9% 6% 19% 13% 12% 12%B, n(%) 111(0.7) 4.5% 3.1% 2.7% 3.0% 1.0% 1.2%
T=average number of visits (ECGs) per participant
Table 2. Calculated/predicted and observed two-sided 95% con�dence interval width for a range of observed AUC values

Page 14/25
Calculated / predicted ObservedTime N
eventsn non-events
ECGpredictor
ROCAUC
95%CIwidth
Lower CIlimit
Upper CIlimit
ROCAUC
Lower CIlimit
Upper CIlimit
3months
11 15705 HR 0.809 0.311 0.654 0.964 0.809 0.493 0.963QTc 0.604 0.355 0.427 0.781 0.604 0.312 0.903QRS 0.506 0.343 0.335 0.677 0.506 0.162 0.817
pQRST 0.473 0.335 0.306 0.640 0.473 0.135 0.807pSVGaz 0.363 0.293 0.216 0.510 0.363 0.143 0.594pSVGel 0.71 0.346 0.537 0.883 0.71 0.306 0.98
pSVGmag 0.502 0.342 0.331 0.673 0.502 0.189 0.687aQRST 0.492 0.339 0.322 0.662 0.492 0.181 0.826aSVGaz 0.347 0.286 0.204 0.490 0.347 0.117 0.587aSVGel 0.688 0.350 0.513 0.863 0.688 0.261 0.974
aSVGmag 0.562 0.352 0.386 0.738 0.562 0.159 0.8SAIQRST 0.534 0.346 0.360 0.708 0.534 0.196 0.812
6months
16 15700 HR 0.686 0.290 0.541 0.831 0.686 0.477 0.895QTc 0.656 0.293 0.509 0.803 0.656 0.385 0.923QRS 0.647 0.294 0.500 0.794 0.647 0.421 0.873
pQRST 0.706 0.288 0.556 0.844 0.706 0.456 0.949pSVGaz 0.613 0.294 0.466 0.760 0.613 0.356 0.871pSVGel 0.699 0.288 0.556 0.844 0.699 0.514 0.883
pSVGmag 0.5 0.283 0.358 0.642 0.5 0.236 0.765aQRST 0.713 0.286 0.570 0.856 0.713 0.466 0.957aSVGaz 0.53 0.289 0.390 0.678 0.53 0.237 0.824aSVGel 0.706 0.287 0.562 0.850 0.706 0.526 0.886
aSVGmag 0.549 0.292 0.416 0.708 0.549 0.279 0.819SAIQRST 0.655 0.293 0.509 0.803 0.655 0.454 0.85
1 year 47 15,669 HR 0.598 0.172 0.512 0.684 0.598 0.461 0.737QTc 0.628 0.172 0.542 0.714 0.628 0.482 0.774QRS 0.698 0.168 0.614 0.784 0.698 0.563 0.833
pQRST 0.721 0.166 0.638 0.805 0.721 0.58 0.862pSVGaz 0.633 0.172 0.547 0.719 0.633 0.477 0.79pSVGel 0.668 0.171 0.583 0.753 0.668 0.518 0.818
pSVGmag 0.514 0.167 0.431 0.597 0.514 0.346 0.683aQRST 0.681 0.170 0.596 0.766 0.681 0.543 0.819aSVGaz 0.55 0.170 0.465 0.635 0.55 0.396 0.704aSVGel 0.652 0.171 0.566 0.738 0.652 0.531 0.774
aSVGmag 0.55 0.170 0.465 0.635 0.55 0.373 0.726SAIQRST 0.661 0.171 0.576 0.746 0.661 0.515 0.807
2 years 84 15,632 HR 0.618 0.129 0.554 0.682 0.618 0.522 0.715QTc 0.625 0.129 0.561 0.689 0.625 0.528 0.722QRS 0.682 0.127 0.618 0.746 0.682 0.595 0.769
pQRST 0.738 0.123 0.677 0.799 0.738 0.661 0.814pSVGaz 0.673 0.127 0.609 0.737 0.673 0.567 0.779pSVGel 0.64 0.128 0.576 0.704 0.64 0.549 0.731
pSVGmag 0.503 0.124 0.441 0.565 0.503 0.399 0.608aQRST 0.689 0.127 0.626 0.752 0.689 0.602 0.776aSVGaz 0.611 0.129 0.547 0.675 0.611 0.504 0.717aSVGel 0.608 0.129 0.544 0.672 0.608 0.515 0.701
aSVGmag 0.545 0.127 0.482 0.608 0.545 0.448 0.642SAIQRST 0.687 0.127 0.624 0.750 0.687 0.600 0.775
5 years 495 15,221 HR 0.581 0.053 0.554 0.608 0.581 0.508 0.654QTc 0.604 0.054 0.577 0.631 0.604 0.548 0.659QRS 0.681 0.053 0.655 0.717 0.681 0.62 0.743
pQRST 0.715 0.052 0.689 0.741 0.715 0.652 0.779pSVGaz 0.646 0.053 0.619 0.673 0.646 0.572 0.72pSVGel 0.624 0.054 0.597 0.651 0.624 0.577 0.671
pSVGmag 0.486 0.051 0.460 0.512 0.486 0.403 0.568

Page 15/25
aQRST 0.691 0.053 0.665 0.717 0.691 0.633 0.749aSVGaz 0.622 0.054 0.595 0.649 0.622 0.557 0.687aSVGel 0.612 0.054 0.585 0.639 0.612 0.549 0.675
aSVGmag 0.512 0.052 0.486 0.538 0.512 0.444 0.581SAIQRST 0.657 0.053 0.630 0.684 0.657 0.594 0.72
> 5years
320 15,396 HR 0.55 0.066 0.517 0.583 0.55 0.507 0.593QTc 0.577 0.066 0.544 0.610 0.577 0.532 0.622QRS 0.655 0.066 0.622 0.688 0.655 0.617 0.693
pQRST 0.71 0.064 0.678 0.742 0.71 0.668 0.753pSVGaz 0.612 0.066 0.579 0.645 0.612 0.567 0.657pSVGel 0.602 0.066 0.567 0.633 0.602 0.561 0.643
pSVGmag 0.491 0.064 0.459 0.523 0.491 0.444 0.537aQRST 0.675 0.066 0.642 0.708 0.675 0.636 0.714aSVGaz 0.587 0.066 0.554 0.610 0.587 0.544 0.629aSVGel 0.596 0.066 0.563 0.629 0.596 0.555 0.636
aSVGmag 0.523 0.065 0.491 0.555 0.523 0.479 0.568SAIQRST 0.635 0.066 0.602 0.668 0.635 0.598 0.672
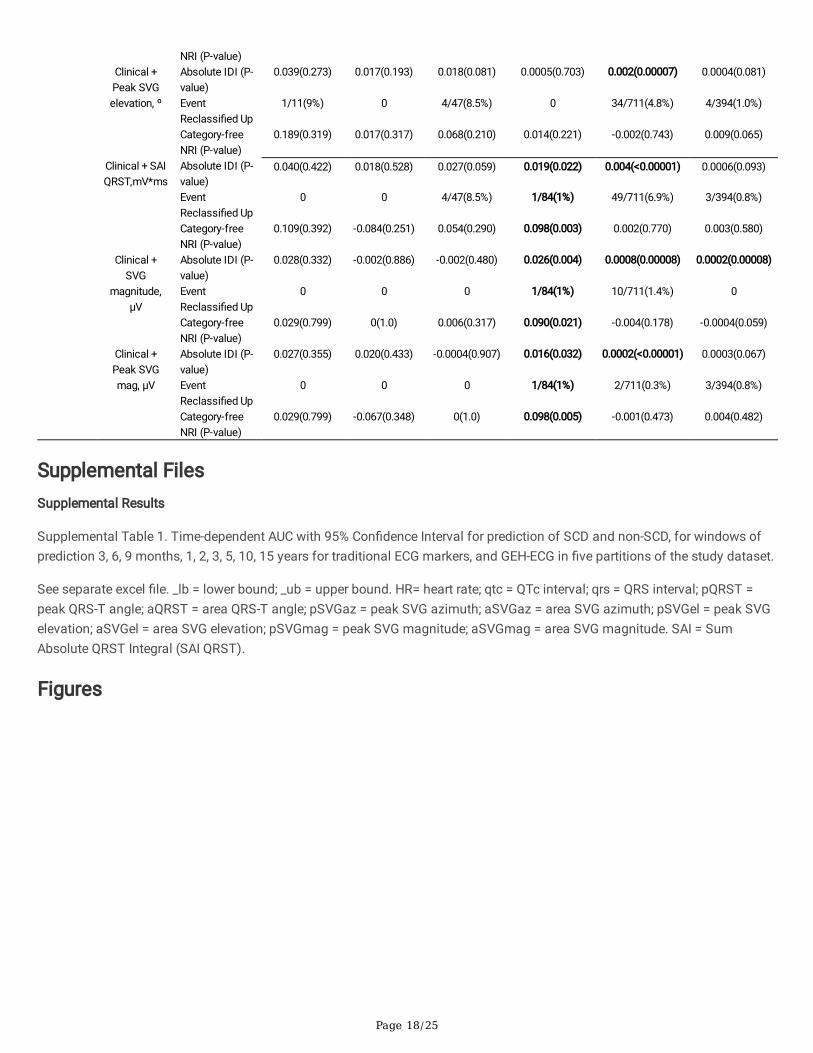
Table 3. Integrated Discrimination Improvement (IDI) and Net Reclassi�cation Improvement (NRI) for ECG metrics added toclinical predictors of SCD and nonSCD outcomes (age, sex, race, coronary heart disease, stroke, hypertension, diabetes)

Page 16/25
Outcome Predictionmodel
Reclassi�cationindex
1-90 days(high risk≥25%)
91-180 d (highrisk ≥25%)
181-365 d (highrisk ≥25%)
365-730 d (highrisk ≥10%)
731-1825 d (highrisk ≥10%)
>5 years (highrisk ≥10%)
Suddencardiacdeath
Clinical +QTc, ms
Absolute IDI (P-value)
0.063(0.109) 0.007(0.437) 0.001(0.695) 0.004(0.236) 0.001(0.020) 0.0003(0.424)
EventReclassi�ed Up
2/11(18%) 0 2/47(4.3%) 3/84(3.6) 11/495(2%) 0
Category-freeNRI (P-value)
0.331(0.106) -0.049(0.473) 0.057(0.114) 0.011(0.677) 0.005(0.226) -0.003(0.432)
Clinical +QRS, ms
Absolute IDI (P-value)
0.012(0.430) 0.004(0.785) 0.013(0.097) 0.003(0.215) 0.002(0.00006) 0.001(0.070)
EventReclassi�ed Up
0 0 0 3/84(3.6%) 19/495(3.8%) 1/320(0.3%)
Category-freeNRI (P-value)
-0.023(0.839) -0.015(0.853) 0.058(0.018) 0.003(0.919) 0.009(0.032) -0.009(0.198)
Clinical +heart rate,
bpm
Absolute IDI (P-value)
0.00004(0.978) 0.026(0.244) 0.020(0.030) 0.0003(0.664) -0.0002(0.402) 0.0005(0.410)
EventReclassi�ed Up
0 0 4/47(8.5%) 3/84(3.6%) 11/495(2.2%) 3/320(1%)
Category-freeNRI (P-value)
0(1.0) -0.067(0.420) 0.029(0.671) 0.034(0.109) 0.003(0.433) -0.004(0.630)
Clinical+ AreaQRS-T angle,
º
Absolute IDI (P-value)
0.001(0.784) 0.066(0.046) 0.0001(0.852) 0.005(0.195) 0.005(<0.00001) 0.002(0.029)
EventReclassi�ed Up
0 1/16(6.3%) 0 2/84(2.4%) 46/495(9.6%) 1/320(0.3%)
Category-freeNRI (P-value)
0(1.0) -0.032(0.801) -0.006(0.317) 0.035(0.118) 0.021(0.003) -0.006(0.308)
Clinical+Peak QRS-T
angle, º
Absolute IDI (P-value)
0.032(0.328) 0.048(0.083) -0.00001(0.986) 0.007(0.084) 0.007(<0.00001) 0.001(0.045)
EventReclassi�ed Up
2/11(18%) 1/16(6.3%) 0 5/84(6.0) 52/495(10.5%) 1/320(0.3%)
Category-freeNRI (P-value)
0.216(0.246) -0.101(0.420) -0.012(0.157) 0.041(0.252) 0.021(0.006) -0.015(0.067)
Clinical+ AreaSVG azimuth,
º
Absolute IDI (P-value)
0.012(0.607) 0.007(0.651) 0.002(0.665) 0.020(0.001) 0.002(0.004) -0.0002(0.0008)
EventReclassi�ed Up
2/11(18%) 0 1/47(2.1%) 7/84(7.1%) 21/495(4.2%) 0
Category-freeNRI (P-value)
0.277(0.068) -0.050(0.541) 0.023(0.398) 0.055(0.152) 0.003(0.578) 0.0002(0.083)
Clinical+Peak SVGazimuth, º
Absolute IDI (P-value)
0.015(0.608) 0.045(0.141) -0.0001(0.880) 0.017(0.005) 0.003(0.00005) -0.0001(0.568)
EventReclassi�ed Up
2/11(18%) 0 0 5/84(6%) 27/495(5.5%) 0
Category-freeNRI (P-value)
0.277(0.068) -0.133(0.221) -0.006(0.564) 0.020(0.598) 0.004(0.538) 0.0009(0.003)
Clinical +Area SVG
elevation, º
Absolute IDI (P-value)
0.002(0.735) 0.050(0.063) 0.004(0.398) -0.00001(0.990) 0.0001(0.576) -0.0004(0.045)
EventReclassi�ed Up
0 1/16(6.3%) 0 3/84(3.6%) 11/495(2.2%) 0
Category-freeNRI (P-value)
0.038(0.317) -0.118(0.349) 0.018(0.257) 0.037(0.093) 0.001(0.847) 0.0004(0.034)
Clinical +Peak SVGelevation, º
Absolute IDI (P-value)
0.003(0.663) 0.046(0.112) 0.002(0.463) 0.0004(0.879) 0.0002(0.387) -0.0003(0.023)
EventReclassi�ed Up
0 0 0 5/84(6%) 7/495(1.4%) 0
Category-freeNRI (P-value)
0.038(0.317) -0.084(0.276) 0.006(0.564) 0.070(0.017) -0.004(0.240) 0.0005(0.020)
Clinical + SAIQRST,mV*ms
Absolute IDI (P-value)
0.0001(0.755) 0.023(0.339) 0.002(0.522) 0.012(0.040) 0.002(0.0004) 0.001(0.061)
EventReclassi�ed Up
0 0 0 1/84(1.2%) 23/495(4.6%) 1/320(0.3%)

Page 17/25
Category-freeNRI (P-value)
0(1.0) -0.151(0.151) 0.006(0.564) 0.007(0.778) 0.013(0.005) 0.0005(0.909)
Clinical +SVG
magnitude,µV
Absolute IDI (P-value)
0.015(0.566) -0.0002(0.954) 0.0002(0.884) 0.0009(0.188) -0.0002(0.00003) 0.00007(0.764)
EventReclassi�ed Up
0 0 0 2/84(2.4%) 0 0
Category-freeNRI (P-value)
-0.023(0.839) -0.052(0.083) -0.012(0.157) 0.018(0.318) 0.0001(0.371) -0.002(0.516)
Clinical +Peak SVGmag, µV
Absolute IDI (P-value)
0.001(0.748) 0.0003(0.959) 0.0002(0.869) 0.0006(0.095) -0.00006(0.676) -0.0002(0.189)
EventReclassi�ed Up
0 0 0 3/84(3.6%) 7/495(1.4%) 0
Category-freeNRI (P-value)
0(1.0) -0.052(0.180) -0.012(0.157) 0.032(0.135) 0.004(0.144) 0.0003(0.102)
Non-Suddencardiacdeath
Clinical +QTc, ms
Absolute IDI (P-value)
0.069(0.170) 0.006(0.667) 0.015(0.200) 0.0001(0.843) 0.003(<0.00001 0.001(0.040)
EventReclassi�ed Up
0 0 2/47(2.3%) 0 46/711(6.5%) 10/394(2.5%)
Category-freeNRI (P-value)
0.200(0.059) 0(1.0) -0.006(0.880) -0.011(0.225) 0.002(0.749) 0.016(0.064)
Clinical +QRS, ms
Absolute IDI (P-value)
0.028(0.467) 0.187(0.001) -0.002(0.702) 0.0007(0.623) 0.002(0.0001) 0.001(0.051)
EventReclassi�ed Up
0 2/16(12.5%) 0 0 34/711(4.8%) 10/394(2.5%)
Category-freeNRI (P-value)
-0.011(0.919) 0.136(0.230) 0.014(0.561) 0.011(0.225) 0.004(0.395) 0.009(0.337)
Clinical +heart rate,
bpm
Absolute IDI (P-value)
0.060(0.160) -0.0001(0.981) 0.0005(0.909) 0.0003(0.779) 0.005(<0.00001) 0.002(0.010)
EventReclassi�ed Up
0 0 1/47(2.1%) 0 89/711(12.5%) 14/394(3.6%)
Category-freeNRI (P-value)
0.200(0.059) 0(1.0) 0.037(0.158) -0.0002(0.990) 0.014(0.060) 0.014(0.207)
Clinical+ AreaQRS-T angle,
º
Absolute IDI (P-value)
0.053(0.272) 0.012(0.625) 0.059(0.002) 0.007(0.120) 0.010(<0.00001) 0.004(0.0004)
EventReclassi�ed Up
1/11(9%) 0 4/47(8.5%) 0 108/711(15%) 19/394(4.8%)
Category-freeNRI (P-value)
0.120(0.411) -0.049(0.499) 0.060(0.286) 0.084(0.0003) 0.017(0.034) 0.021(0.097)
Clinical+Peak QRS-T
angle, º
Absolute IDI (P-value)
0.169(0.026) 0.077(0.030) 0.072(0.0004) 0.005(0.180) 0.009(<0.00001) 0.005(0.00002)
EventReclassi�ed Up
1/11(9%) 0 6/47(12.8%) 0 114/711(16%) 24/394(6.1%)
Category-freeNRI (P-value)
0.120(0.411) -0.084(0.276) 0.01(0.167) 0.052(0.006) 0.017(0.033) 0.034(0.011)
Clinical+ AreaSVG azimuth,
º
Absolute IDI (P-value)
0.183(0.003) 0.123(0.010) 0.014(0.093) 0.0008(0.534) 0.003(<0.00001) 0.003(0.0006)
EventReclassi�ed Up
1/11(9%) 0 1/47(2.1%) 0 57/711(8.0%) 13/394(3.3%)
Category-freeNRI (P-value)
0.200(0.202) -0.049(0.574) -0.005(0.899) -0.0002(0.994) 0.009(0.109) 0.06(0.112)
Clinical+Peak SVGazimuth, º
Absolute IDI (P-value)
0.164(0.015) 0.005(0.740) 0.007(0.315) 0.0003(0.642) 0.003(<0.00001) 0.003(0.001)
EventReclassi�ed Up
1/11(9%) 0 2/47(2.3%) 0 45/711(6.3%) 17/394(4.3%)
Category-freeNRI (P-value)
0.240(0.138) 0.017(0.317) -0.008(0.840) -0.002(0.782) 0.003(0.600) 0.027(0.019)
Clinical +Area SVG
elevation, º
Absolute IDI (P-value)
0.025(0.398) 0.058(0.057) 0.007(0.370) 0.0008(0.356) 0.0005(0.015) 0.0006(0.044)
EventReclassi�ed Up
0 0 4/47(8.5%) 0 16/711(2.3%) 9/394(2.3%)
Category-free -0.051(0.608) 0(1.0) 0.114(0.007) -0.007(0.549) -0.005(0.216) 0.018(0.025)
Page 18/25
NRI (P-value)Clinical +Peak SVGelevation, º
Absolute IDI (P-value)
0.039(0.273) 0.017(0.193) 0.018(0.081) 0.0005(0.703) 0.002(0.00007) 0.0004(0.081)
EventReclassi�ed Up
1/11(9%) 0 4/47(8.5%) 0 34/711(4.8%) 4/394(1.0%)
Category-freeNRI (P-value)
0.189(0.319) 0.017(0.317) 0.068(0.210) 0.014(0.221) -0.002(0.743) 0.009(0.065)
Clinical + SAIQRST,mV*ms
Absolute IDI (P-value)
0.040(0.422) 0.018(0.528) 0.027(0.059) 0.019(0.022) 0.004(<0.00001) 0.0006(0.093)
EventReclassi�ed Up
0 0 4/47(8.5%) 1/84(1%) 49/711(6.9%) 3/394(0.8%)
Category-freeNRI (P-value)
0.109(0.392) -0.084(0.251) 0.054(0.290) 0.098(0.003) 0.002(0.770) 0.003(0.580)
Clinical +SVG
magnitude,µV
Absolute IDI (P-value)
0.028(0.332) -0.002(0.886) -0.002(0.480) 0.026(0.004) 0.0008(0.00008) 0.0002(0.00008)
EventReclassi�ed Up
0 0 0 1/84(1%) 10/711(1.4%) 0
Category-freeNRI (P-value)
0.029(0.799) 0(1.0) 0.006(0.317) 0.090(0.021) -0.004(0.178) -0.0004(0.059)
Clinical +Peak SVGmag, µV
Absolute IDI (P-value)
0.027(0.355) 0.020(0.433) -0.0004(0.907) 0.016(0.032) 0.0002(<0.00001) 0.0003(0.067)
EventReclassi�ed Up
0 0 0 1/84(1%) 2/711(0.3%) 3/394(0.8%)
Category-freeNRI (P-value)
0.029(0.799) -0.067(0.348) 0(1.0) 0.098(0.005) -0.001(0.473) 0.004(0.482)
Supplemental FilesSupplemental Results
Supplemental Table 1. Time-dependent AUC with 95% Con�dence Interval for prediction of SCD and non-SCD, for windows ofprediction 3, 6, 9 months, 1, 2, 3, 5, 10, 15 years for traditional ECG markers, and GEH-ECG in �ve partitions of the study dataset.
See separate excel �le. _lb = lower bound; _ub = upper bound. HR= heart rate; qtc = QTc interval; qrs = QRS interval; pQRST =peak QRS-T angle; aQRST = area QRS-T angle; pSVGaz = peak SVG azimuth; aSVGaz = area SVG azimuth; pSVGel = peak SVGelevation; aSVGel = area SVG elevation; pSVGmag = peak SVG magnitude; aSVGmag = area SVG magnitude. SAI = SumAbsolute QRST Integral (SAI QRST).
Figures

Page 19/25
Figure 1
GEH measurement example of peak and area vectors, and vector magnitude (VM). (A) (i) VM plotted over time, and (ii)corresponding X, Y, and Z leads. (B) VM plotted in a three-dimensional space. Color-coded progression from QRS onset (red) tothe end of T (purple) is shown. (C) Measurement of (i) QT integral on VM, and (ii) SAI QRST. (D). Measurement of peak SVGvector magnitude, azimuth, and elevation.

Page 20/25
Figure 2
Internal validation of time-dependent AUC with 95% CI for prediction of SCD, for windows of prediction 3, 6, 9 months, 1, 2, 3, 5,10, 15 years for heart rate, QTc, QRS duration, and SAI QRST in �ve partitions of the study dataset.

Page 21/25
Figure 3
Internal validation of time-dependent AUC with 95% CI for prediction of SCD, for windows of prediction 3, 6, 9 months, 1, 2, 3, 5,10, 15 years for spatial peak and area QRS-T angle and SVG magnitude in �ve partitions of the study dataset.

Page 22/25
Figure 4
Internal validation of time-dependent AUC with 95% CI for prediction of SCD, for windows of prediction 3, 6, 9 months, 1, 2, 3, 5,10, 15 years for peak and area SVG azimuth and elevation in �ve partitions of the study dataset.

Page 23/25
Figure 5
Time-dependent AUC with 95% CI for prediction of SCD (red diamonds), and non-SCD (blue circles) for windows of prediction 3,6, 9 months, 1, 2, 3, 5, 10, 15 years for (A) heart rate, (B) QTc interval, (C) QRS duration, (D) SAI QRST measured at visits 1, 2, 3,4, and 5.

Page 24/25
Figure 6
Time-dependent AUC with 95% CI for prediction of SCD (red diamonds), and non-SCD (blue circles) for windows of prediction 3,6, 9 months, 1, 2, 3, 5, 10, 15 years for (A) spatial peak QRS-T angle , (B) area SVG azimuth, (C) area SVG elevation, (D) areaSVG magnitude measured at visits 1, 2, 3, 4, and 5.

Page 25/25
Figure 7
Comparison of time-dependent AUC (with 95% CI) for windows of SCD prediction 3, 6, 9 months, 1, 2, 3, 5, 10, 15 years, for peak-based SVG vector measurements (orange squares) vs. area-based SVG vector measurements (green circles): (A) QRS-T angle,(B) SVG azimuth, (C) SVG elevation, (D) SVG magnitude.
Supplementary Files
This is a list of supplementary �les associated with this preprint. Click to download.
SupplTable1.xlsx
Equations.jpg