forty years of fanger’s model of thermal comfort: comfort for all?
TRANSCRIPT

Forty years of Fanger�s model of thermal comfort:
comfort for all?
Introduction
Thermal comfort contributes to overall satisfaction,well-being and performance. Comfort is an importantparameter in the building design process as modernman spends most of the day indoors. In the 1970s and1980s, the development and usage of energy balancemodels of the human body came within the focus ofhuman biometeorology (Hoppe, 1997). The mostimportant contributor was P.O. Fanger (1934–2006),who created a predictive model for general, or whole-body, thermal comfort during the second half of the1960s from laboratory and climate chamber research.In that period, environmental techniques were improv-ing, wealth increased and workers wanted the bestindoor environment, while at the same time offices were
growing larger (McIntyre, 1984). With his work,Fanger wanted to present a method for use by heatingand air-conditioning engineers to predict, for any typeof activity and clothing, all those combinations of thethermal factors in the environment for which thelargest possible percentage of a given group of peopleexperience thermal comfort (Fanger, 1967). It provideda solution for predicting the optimum temperature fora group in, for instance, an open plan office, whichcould be provided by architects and engineers (McIn-tyre, 1984). This new predicted mean vote (PMV)model has become the internationally accepted modelfor describing the predicted mean thermal perceptionof building occupants.Fanger (1970) defined PMV as the index that
predicts, or represents, the mean thermal sensation
Abstract The predicted mean vote (PMV) model of thermal comfort, createdby Fanger in the late 1960s, is used worldwide to assess thermal comfort. Fangerbased his model on college-aged students for use in invariant environmentalconditions in air-conditioned buildings in moderate thermal climate zones.Environmental engineering practice calls for a predictive method that is appli-cable to all types of people in any kind of building in every climate zone. In thispublication, existing support and criticism, as well as modifications to the PMVmodel are discussed in light of the requirements by environmental engineeringpractice in the 21st century in order to move from a predicted mean vote tocomfort for all. Improved prediction of thermal comfort can be achievedthrough improving the validity of the PMV model, better specification of themodel�s input parameters, and accounting for outdoor thermal conditions andspecial groups. The application range of the PMV model can be enlarged, forinstance, by using the model to assess the effects of the thermal environment onproductivity and behavior, and interactions with other indoor environmentalparameters, and the use of information and communication technologies. Evenwith such modifications to thermal comfort evaluation, thermal comfort for allcan only be achieved when occupants have effective control over their ownthermal environment.
J. van HoofFaculty Chair of Demand Driven Care, Faculty of HealthCare, Hogeschool Utrecht, Utrecht, The Netherlands,Faculty of Architecture, Building and Planning,Technische Universiteit Eindhoven, Eindhoven, TheNetherlands
Key words: Thermal comfort; PMV model; Validity;Adaptive; Personal control.
J. van HoofLectoraat Vraaggestuurde ZorgFaculteit GezondheidszorgHogeschool UtrechtBolognalaan 1013584 CJ UtrechtThe NetherlandsTel.: +31 30 2585268Fax: +31 30 2540608e-mail: [email protected]
Received for review 20 May 2007. Accepted forpublication 30 December 2007.� Indoor Air (2008)
Practical ImplicationsThe paper treats the assessment of thermal comfort using the PMV model of Fanger, and deals with the strengths andlimitations of this model. Readers are made familiar to some opportunities for use in the 21st-century informationsociety.
Indoor Air 2008; 18: 182–201www.blackwellpublishing.com/inaPrinted in Singapore. All rights reserved
� 2008 The AuthorJournal compilation � Blackwell Munksgaard 2008
INDOOR AIRdoi:10.1111/j.1600-0668.2007.00516.x
182

vote on a standard scale for a large group of persons forany given combination of the thermal environmentalvariables, activity and clothing levels. PMV is based onFanger�s comfort equation (Fanger, 1967). The satisfac-tion of the comfort equation is a condition for optimalthermal comfort of a large group of people, or, whenmost of this group experiences thermal neutrality, andno local discomfort exists. Based on PMV, the predictedpercentage of dissatisfied (PPD) can be determined
PPD ¼ 100� 95� eð�0:03353�PMV4�0:2179�PMV2Þ ð1Þ
(Equation 1). Fanger foresaw applications for thecomfort equation in thermostats, the design of lifesupport systems, work units and in relation to mete-orology. For application in environmental engineering,PMV was needed to assess a given room climate interms of deviations from an optimum thermal situa-tion. This became of great importance after the oilcrisis, when the focus of research abandoned thecentral optimum, and began to explore the edges ofcomfort, searching for how cold or warm it could getbefore getting uncomfortable (McIntyre, 1984). ThePMV model has since been the basis of numerousstudies and experiments worldwide. As with anymodel, it has been subject to criticism and support.The PMV model applies to healthy adult people and
cannot, without corrections, be applied to children,older adults and the disabled. The model has beenglobally applied for almost 40 years throughout allbuilding types, although Fanger was quite clear thathis PMV model was intended for application by theheating, ventilation and air-conditioning (HVAC)industry in the creation of artificial climates incontrolled spaces (de Dear and Brager, 2002; Fanger,1970). Fanger�s PMV model is adopted by many(inter)national standards and guidelines, for instance,ISO 7730, ASHRAE Standard 55, and CEN CR 1752,for providing an index of thermal comfort, and, evenafter the latest rounds of thermal comfort standardrevisions, is still the official tool to evaluate thermalcomfort, although a new adaptive model developed inthe 1990s by Brager and de Dear was incorporatedalongside the PMV model as an optional method.Given the passing away of Fanger in September 2006,
numerous (field) validation studies on thermal comfort,the emergence of adaptive thermal comfort models andthe ever growing need and search for improved comfortfor all building occupants, it is time to give consider-ation to Fanger�s contribution, or legacy, to the worldthermal comfort research, and to explore what hismodel might bring us in the near future. The central goalof this article is to provide an overview of the develop-ments in thermal comfort practice since the introductionof the PMV model by Fanger in 1970. It explores themeaning and potential of the PMV model by literatureresearch for past and present use, and future application
by, indoor air scientists, environmental engineers, andthe HVAC industry. Fanger�s elaborate work in thefield of indoor air quality (Fanger, 2004a, 2006) is notpart of the scope of this paper. The objectives ofthis publication, which have been chosen in accordancewith questions from engineering practice, are to:(i) summarize criticism regarding the PMV model andits input parameters, and (ii) the validity of the model,while at the same time, (iii) extending its applicationdomain, and (iv) improving individual comfort.
Literature review
The literature search was divided into several catego-ries: (i) studies regarding the validity of the PMVmodel, (ii) studies regarding the model�s input para-meters, (iii) studies regarding the application of themodel in relation to building type and climate, (iv) theuse of the PMV model for special groups, (v) studiesregarding the new applications of the model, and (vi)individualized thermal comfort.Electronic databases of scientific publications that
were searched include ScienceDirect, PubMed, andWeb of Science. Also, selected journals were searchedfor relevant articles: Building and Environment,Energy and Buildings, International Journal of Bio-meteorology, ASHRAE Transactions, Indoor Air,Proceedings of Indoor Air and Healthy Buildings.The university libraries of Eindhoven and Delft werealso browsed for non-digitally available books anddissertations. Articles providing relevant backgroundinformation were also taken into account.
Basis of the PMV model
The human body produces heat, exchanges heat withthe environment, and loses heat by diffusion andevaporation of body liquids. During normal activitiesthese processes result in an average core body temper-ature of approximately 37�C (Prek, 2005). The body�stemperature control system tries to maintain thesetemperatures even when thermal disturbances occur.The human body should meet a number of conditionsin order to perceive thermal comfort. According toFanger (1970), these requirements for steady-statethermal comfort are: (i) the body is in heat balance,(ii) mean skin temperature and sweat rate, influencingthis heat balance, are within certain limits, and (iii) nolocal discomfort exists. Local discomfort to be avoidedincludes draughts, radiant asymmetry, or temperaturegradients. Moreover, high frequency of temperaturefluctuation should be minimized as well. In order todescribe these physical processes, Fanger derived hiscomfort equation (Fanger, 1967) based on college-agestudents exposed to steady-state conditions in a climatechamber for a 3-h period in winter at sea level(1,013 hPa) while wearing standardized clothing and
Fanger�s model of thermal comfort
183

performing standardized activities, for use withintemperate climate zones (Fanger, 1970). Although thecomfort equation may probably be applied in thetropics as well, Fanger (1970) stated this needed furtherresearch. Also, there were no reliable correctionsavailable for extreme climate conditions.For practical applications, in which subjects do not
feel neutral, an extension of the comfort equation wasneeded. By combining data (n = 1396) from variousstudies, Fanger expanded his comfort equation into thecurrent PMV model. This thermal sensation indexpredicts the mean thermal sensation vote for a largegroup of persons and indicates the deviation frompresumed �optimal� thermal comfort, i.e., thermoneu-trality. Results of the PMV model are expressed on the7-point ASHRAE scale of thermal sensation. Thecentral three categories of this scale are labeled �slightlycool,� �neutral,� and �slightly warm.� It is generallyaccepted that a person with a thermal sensation in oneof these three categories considers his environmentacceptable, and that someone voting in one of the fourouter categories is dissatisfied with his thermal envi-ronment (McIntyre, 1984).The PMV model includes all the major variables
influencing thermal sensation and quantifies the abso-lute and relative impact of six factors of which airtemperature, mean radiant temperature, air velocityand relative humidity are measured, and activity leveland clothing insulation are estimated using tables.Activity level is measured in terms of metabolic rate, ormet units, and clothing insulation in clo units (Gaggeet al., 1941). To insure a comfortable indoor environ-ment, PMV should be kept 0 with a tolerance of ±0.5scale units (ISO, 2005a). In his dissertation, Fangerstated that the PMV model was derived in laboratorysettings and should therefore be used with care forPMV values below )2 and above +2. Especially on thehot side, Fanger foresaw significant errors.
Criticism of the PMV model
Since the introduction of the PMV model, numerousstudies on thermal comfort in both real-life situationsand in climate chambers have been conducted. Themodel�s validity and application range were subject tostudy. Many studies have given support to the PMVmodel while others showed discrepancies (Bentonet al., 1990). Criticism involves various aspects, forinstance, the model as a whole, its geographic appli-cation range, application in various types of buildings,and the model�s input parameters.
Validation
The process of validation of PMV for everyday userequires the results ofmanyfield studies, covering indoorenvironmental conditions found in buildings across the
world. An early field validation byHowell andKennedy(1979) showed that PMV and PPD provide just a firstapproximation to the prediction of thermal comfort in�natural� settings. The three middle categories of theASHRAE 7-point scale of thermal sensation seem to benot entirely valid, andmodal comfort is somewhat closerto the cooler-than-normal position.Croomeet al. (1993)suggest that the PMV model underestimates thermalimpressions and undervalues the swings of these impres-sions, due to the assumption of steady-state laboratoryconditions in the derivation of the model, an oversim-plification ofmetabolic rates, and the sensitivity of PMVto clo-values. When deriving his model, Fanger consid-ered his test persons to be dissatisfied if they judged thethermal environment as cold, cool, warm, or hot, or outof the range of )2 to +2 on the ASHRAE 7-point scaleof thermal sensation. However, data referred to byFanger show that discomfort already arises in somewhatcooler and warmer than neutral conditions, and grad-ually increases.Results of the PMV model are interpreted as what a
hypothetical �average� person will feel, or as the averageresponse of large group of people experiencing thesame conditions. The model was designed to predictthe latter. Within a large group, optimal thermalconditions are likely to vary between individuals by upto 1.15 K according to Fanger and Langkilde (1975),or up to 1.0 scale unit (on the ASHRAE 7-point scaleof thermal sensation) according to Humphreys andNicol (2002). Fountain et al. (1996) stated that indi-vidual differences are frequently greater than 1.0 scaleunit when people are exposed to the same environment(inter-individual variance). In addition, how a personfeels in the same environment from day-to-day canalso vary on the order of 1.0 scale value (intra-individual variance). This corresponds to approxi-mately 3 K; the full width of the comfort zone ineither summer or winter (Fountain et al., 1996).Therefore, it is impossible to exactly predict thermalcomfort for individuals, and that is the reason thecomfort zone is as wide as it is, and why it isunreasonable to expect all people to be satisfied withina centrally controlled environment, even when thethermal conditions meet current standards.A validation by Humphreys and Nicol (2002) based
on a meta-analysis of data from the ASHRAE RP-884database (de Dear et al., 1997), showed that PMV wasa valid index. It predicted thermal sensation within0.11 ± 0.01 scale units of the observed votes. Whenseparate database samples were analyzed, 33 out of atotal of 41 samples showed evidence of bias in PMV,often exceeding 0.25 scale units, and reaching as muchas 1.0 scale unit. Humphreys and Nicol (2002) foundthat the more thermal conditions moved away fromneutral, the larger the bias. PMV is only reliablebetween )0.5 and 0.5, unlike the range of validitystated by Fanger and given in ISO 7730
van Hoof
184
()2.0 < PMV < 2.0). This makes the PMV modelseem unrealistic for application in field settings.Researchers have compared the results of the PMV
model against the votes of subjects (actual mean vote,AMV) on the ASHRAE 7-point scale of thermalsensation. Doherty and Arens (1988) reviewed climatechamber studies and found that there were discrepan-cies between predicted and actual thermal sensation aslarge as 1.3 scale units. A comparison of the actual andPMVs by Parsons (2002) showed that the PMVspredicted AMVs within 0.5 of a scale value for neutraland warm conditions. However, in slightly cool to coolconditions subjects were between neutral and slightlycool, and hence, warmer than predicted. Parsonsconcluded that changes in thermal comfort responsesin neutral and slightly warm environments are smalland unlikely to be of practical significance. Kahkonen(1991) assessed thermal comfort in 17 enterprises at 129work sites in shops, stores, and offices. The estimatedPMV indicated that the thermal environment was toowarm, and in fact, the calculated PMVs were usuallylower than the estimated ones. In a previous study byKahkonen and Ilmarinen (1989) in 13 shops and stores,workers were asked to rate their subjective thermalsensations (n = 96). No correlation was foundbetween calculated PMV and subjective ratings.Various researchers found a different relationship
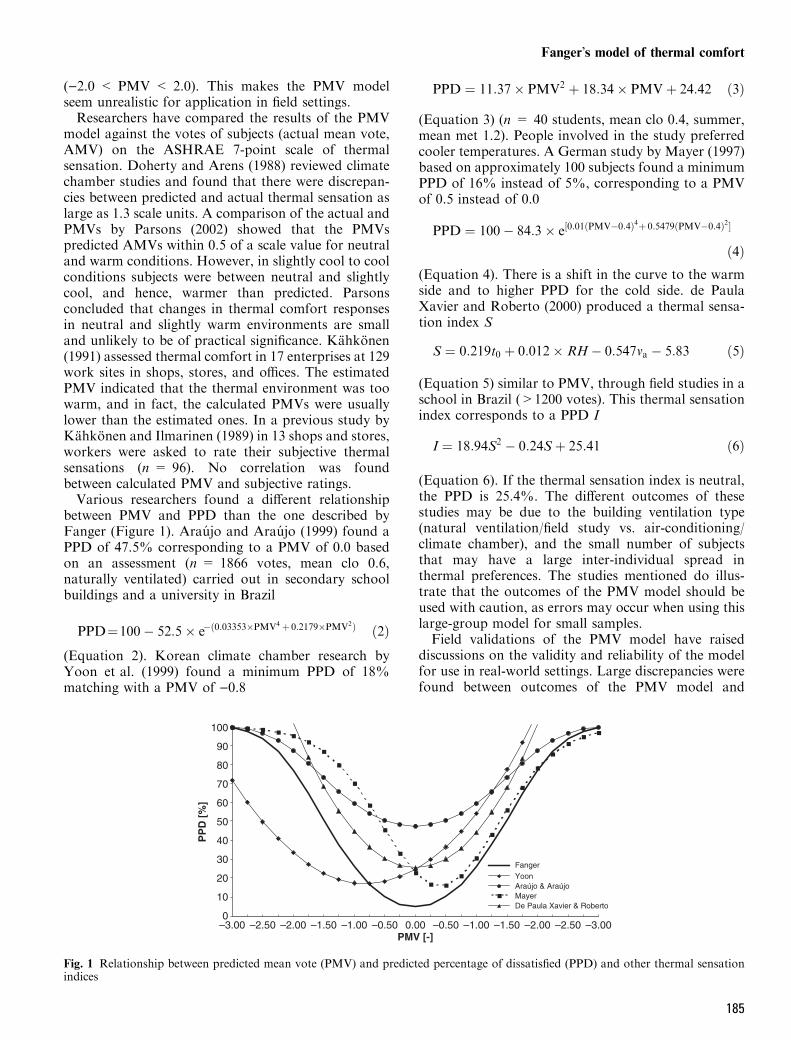
between PMV and PPD than the one described byFanger (Figure 1). Araujo and Araujo (1999) found aPPD of 47.5% corresponding to a PMV of 0.0 basedon an assessment (n = 1866 votes, mean clo 0.6,naturally ventilated) carried out in secondary schoolbuildings and a university in Brazil
PPD¼100� 52:5� e�ð0:03353�PMV4 þ 0:2179�PMV2Þ ð2Þ(Equation 2). Korean climate chamber research byYoon et al. (1999) found a minimum PPD of 18%matching with a PMV of )0.8
PPD ¼ 11:37� PMV2 þ 18:34� PMVþ 24:42 ð3Þ
(Equation 3) (n = 40 students, mean clo 0.4, summer,mean met 1.2). People involved in the study preferredcooler temperatures. A German study by Mayer (1997)based on approximately 100 subjects found a minimumPPD of 16% instead of 5%, corresponding to a PMVof 0.5 instead of 0.0
PPD ¼ 100� 84:3� e½0:01ðPMV�0:4Þ4þ 0:5479ðPMV�0:4Þ2�
ð4Þ(Equation 4). There is a shift in the curve to the warmside and to higher PPD for the cold side. de PaulaXavier and Roberto (2000) produced a thermal sensa-tion index S
S ¼ 0:219t0 þ 0:012� RH� 0:547va � 5:83 ð5Þ
(Equation 5) similar to PMV, through field studies in aschool in Brazil (>1200 votes). This thermal sensationindex corresponds to a PPD I
I ¼ 18:94S2 � 0:24Sþ 25:41 ð6Þ
(Equation 6). If the thermal sensation index is neutral,the PPD is 25.4%. The different outcomes of thesestudies may be due to the building ventilation type(natural ventilation/field study vs. air-conditioning/climate chamber), and the small number of subjectsthat may have a large inter-individual spread inthermal preferences. The studies mentioned do illus-trate that the outcomes of the PMV model should beused with caution, as errors may occur when using thislarge-group model for small samples.Field validations of the PMV model have raised
discussions on the validity and reliability of the modelfor use in real-world settings. Large discrepancies werefound between outcomes of the PMV model and
0
10
20
30
40
50
60
70
80
90
100
–3.00 –3.00–2.00 –2.00–1.00 –1.00–2.50 –2.50–1.50 –1.50–0.50 –0.500.00PMV [-]
PP
D [
%]
FangerYoonAraújo & AraújoMayerDe Paula Xavier & Roberto
Fig. 1 Relationship between predicted mean vote (PMV) and predicted percentage of dissatisfied (PPD) and other thermal sensationindices
Fanger�s model of thermal comfort
185

comfort votes of subjects. Also, various researchersfound a different relationship between thermal votesand dissatisfaction than the one described by Fanger,in smaller climate chamber and field studies.
Thermoneutrality vs. preferred thermal sensation
The PMV model is based on the concept of thermo-neutrality, and PMV expresses how warm or cooloccupants perceive the thermal environment. Thisthermal sensation is a measure of how occupantsperceive a certain thermal condition. Other measuressuch as thermal satisfaction, thermal acceptability,thermal comfort, and thermal preference, also dealwith the appropriateness of a given thermal condition.Values ranging from )1 to 1 on the ASHRAE scale ofthermal sensation are often considered to reflectsatisfaction with a given thermal environment. How-ever, direct measures of thermal satisfaction andacceptability are not incorporated in the currentPMV model. Thermal neutrality does not necessarilyhave to correspond to the desired or preferred thermalsensation, for instance, when people like it slightlywarm (Humphreys and Hancock, 2007). In addition,Fountain et al. (1996) mentioned two fundamentalassumptions that need further discussion: (i) optimumtemperature corresponds to a �neutral� thermal sensa-tion, and (ii) the notion of �acceptability� is associatedwith specific thermal sensations on the ASHRAE7-point scale of thermal sensation. It is suggestedthat thermal sensation cannot be assumed to bethe equivalent of evaluative measures mentionedabove, and that the PMV model requires a critical
interpretation and application (Fountain et al., 1996).These considerations are supported by other studies(Table 1).Various field and climate chamber studies showed
differences between both neutral and preferred tem-peratures, as well as differences between field andclimate chamber research. In a review by Humphreys(1994), the observed neutral temperatures in eightclimate chamber studies were between 0.8 K lower and3 K higher than predicted by the PMV model. In acombined field (n = 497) and climate chamber(n = 455) study in the UK (season and buildingventilation type unknown), Williams (1995) found thatpeople preferred lower temperatures. Field datashowed a 2.5 K difference between the air temperatureat which people felt most comfortable and thatpredicted using PMV, whereas the climate chamberonly gave a 0.5 K difference compared to PMV. In areview of field studies in air-conditioned and naturallyventilated buildings, Brager and de Dear (1998) foundthat the observed and predicted neutral temperatureswere overestimated by as much as 2.1 K (Melbourne,summer), and underestimated by up to 3.4 K (Bang-kok, time of year not mentioned); both extremes innaturally ventilated buildings.Various studies from Asia on neutral and preferred
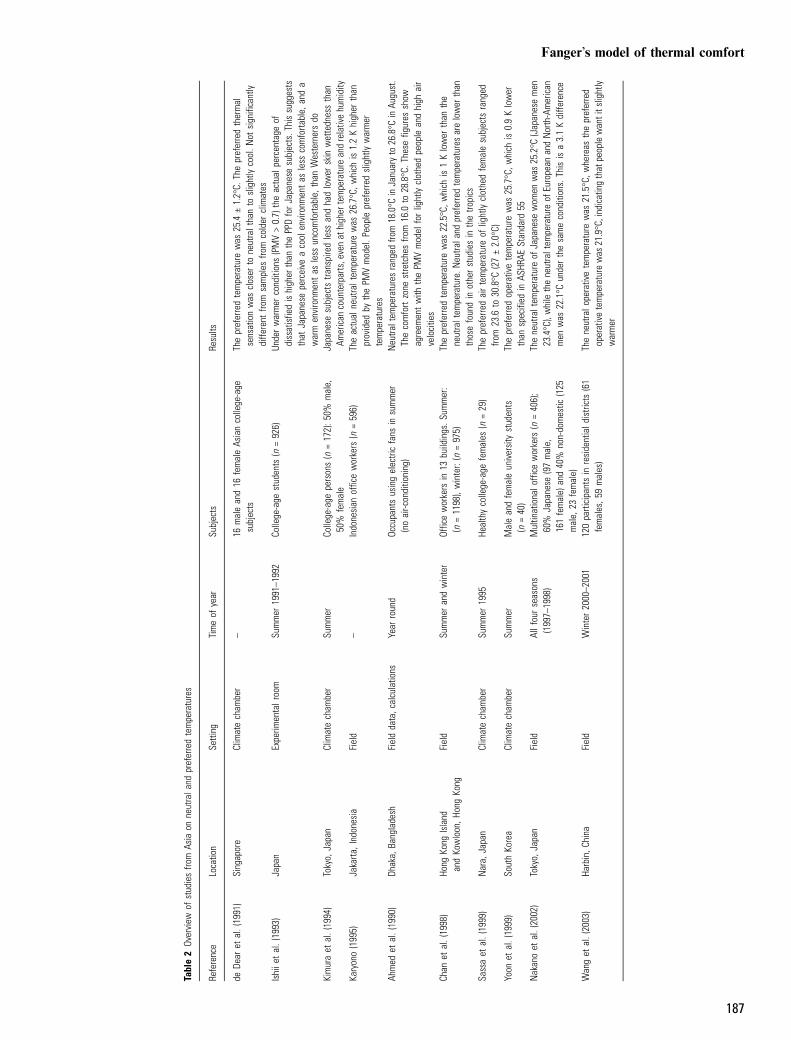
temperatures found that these temperatures were oftenhigher than based on the PMV model, and foundconsiderable between-subjects differences (Table 2).For instance, Humphreys (1994) provides an overviewof mainly Asian studies on this matter, and mentionsthat one study on Malays in London and Malaysia hada difference in neutral temperature as large as 3 K.
Table 1 Selection of studies showing that thermal comfort does not only occur around thermal neutrality
Reference Location Setting Time of year Subjects Results
Schiller (1990) San FranciscoBay Area, USA
Field Winter andsummer 1987
304 subjects(187 females, 117 males)in 10 office buildings(2342 visits)
People generally felt warmer than predicted more often than theyfelt cooler, in both seasons. 22% (winter) and 15% (summer)of people voting +2 and +3 on a 7-point scale of thermalsensation stated to be moderately to very comfortable on a6-point scale of thermal comfort. At the same time, 17% (winter)and 34% (summer) of people voting )2 and )3 stated to be moderatelyto very comfortable too
Busch (1990, 1992) Bangkok,Thailand
Field Hot seasonand wetseason 1988
Over 1,100 Thai officeworkers in AC andNV buildings
36% of people voting neutral preferred to feel warmer or cooler
Brager et al. (1994) Variouscountries
Review offield studies
Summers andwinters
Office workers Of occupants voting in the outer categories of the thermalsensation scale ()3,)2,+2,+3), 0 to 50% preferred nochange to their thermal environment. Also, of occupantsvoting in the same outer categories()3,)2,+2,+3, other studies reviewed), 3–66% were comfortable
Paciuk and Becker (2002) Haifa, Israel Field Summer 117 AC and NVowner-occupieddwellings
Of residents of NV homes, voting between )1 and +1(on the 7-point scale of thermal sensation), about 47%were not comfortable (as rated on a 5-point thermal comfort scale).In AC homes, the majority of dwellers voted to be comfortable (81%),although thermal votes ranged from )1 to +3 on the 7-point scale
AC, air-conditioned; NV, naturally ventilated.
van Hoof
186
Tabl
e2
Over
view
ofst
udie
sfro
mAs
iaon
neut
rala
ndpr
efer
red
tem
pera
ture
s
Refe
renc
eLo
catio
nSe
tting
Tim
eof
year
Subj
ects
Resu
lts
deDe
aret
al.(
1991
)Si
ngap
ore
Clim
ate
cham
ber
–16
mal
ean
d16
fem
ale
Asia
nco
llege
-age
subj
ects
The
pref
erre
dte
mpe
ratu
rew
as25
.4€
1.2�
C.Th
epr
efer
red
ther
mal
sens
atio
nw
ascl
oser
tone
utra
ltha
nto
slig
htly
cool
.Not
sign
ifica
ntly
diffe
rent
from
sam
ples
from
cold
ercl
imat
esIs
hiie
tal
.(19
93)
Japa
nEx
perim
enta
lroo
mSu
mm
er19
91–1
992
Colle
ge-a
gest
uden
ts(n
=92
6)Un
der
war
mer
cond
ition
s(P
MV
>0.
7)th
eac
tual
perc
enta
geof
diss
atis
fied
ishi
gher
than
the
PPD
forJ
apan
ese
subj
ects
.Thi
ssu
gges
tsth
atJa
pane
sepe
rcei
vea
cool
envi
ronm
ent
asle
ssco
mfo
rtabl
e,an
da
war
men
viro
nmen
tas
less
unco
mfo
rtabl
e,th
anW
este
rner
sdo
Kim
ura
etal
.(19
94)
Toky
o,Ja
pan
Clim
ate
cham
ber
Sum
mer
Colle
ge-a
gepe
rson
s(n
=17
2):5
0%m
ale,
50%
fem
ale
Japa
nese
subj
ects
trans
pire
dle
ssan
dha
dlo
wer
skin
wet
tedn
ess
than
Amer
ican
coun
terp
arts
,eve
nat
high
erte
mpe
ratu
rean
dre
lativ
ehu
mid
ityKa
ryon
o(1
995)
Jaka
rta,I
ndon
esia
Fiel
d–
Indo
nesi
anof
fice
wor
kers
(n=
596)
The
actu
alne
utra
ltem
pera
ture
was
26.7
�C,w
hich
is1.
2K
high
erth
anpr
ovid
edby
the
PMV
mod
el.P
eopl
epr
efer
red
slig
htly
war
mer
tem
pera
ture
sAh
med
etal
.(19
90)
Dhak
a,Ba
ngla
desh
Fiel
dda
ta,c
alcu
latio
nsYe
arro
und
Occu
pant
sus
ing
elec
tric
fans
insu
mm
er(n
oai
r-con
ditio
ning
)N
eutra
ltem
pera
ture
sra
nged
from
18.0
�Cin
Janu
ary
to26
.8�C
inAu
gust
.Th
eco
mfo
rtzo
nest
retc
hes
from
16.0
to28
.8�C
.The
sefig
ures
show
agre
emen
tw
ithth
ePM
Vm
odel
for
light
lycl
othe
dpe
ople
and
high
air
velo
citie
sCh
anet
al.(
1998
)Ho
ngKo
ngIs
land
and
Kow
loon
,Hon
gKo
ngFi
eld
Sum
mer
and
win
ter
Offic
ew
orke
rsin
13bu
ildin
gs.S
umm
er:
(n=
1198
),w
inte
r:(n
=97
5)Th
epr
efer
red
tem
pera
ture
was
22.5
�C,w
hich
is1
Klo
wer
than
the
neut
ralt
empe
ratu
re.N
eutra
land
pref
erre
dte
mpe
ratu
res
are
low
erth
anth
ose
foun
din
othe
rst
udie
sin
the
tropi
csSa
ssa
etal
.(19
99)
Nar
a,Ja
pan
Clim
ate
cham
ber
Sum
mer
1995
Heal
thy
colle
ge-a
gefe
mal
es(n
=29
)Th
epr
efer
red
air
tem
pera
ture
oflig
htly
clot
hed
fem
ale
subj
ects
rang
edfro
m23
.6to
30.8
�C(2
7€
2.0�
C)Yo
onet
al.(
1999
)So
uth
Kore
aCl
imat
ech
ambe
rSu
mm
erM
ale
and
fem
ale
univ
ersi
tyst
uden
ts(n
=40
)Th
epr
efer
red
oper
ativ
ete
mpe
ratu
rew
as25
.7�C
,whi
chis
0.9
Klo
wer
than
spec
ified
inAS
HRAE
Stan
dard
55N
akan
oet
al.(
2002
)To
kyo,
Japa
nFi
eld
Allf
our
seas
ons
(199
7–19
98)
Mul
tinat
iona
loffi
cew
orke
rs(n
=40
6);
60%
Japa
nese
(97
mal
e,16
1fe
mal
e)an
d40
%no
n-do
mes
tic(1
25m
ale,
23fe
mal
e)
The
neut
ralt
empe
ratu
reof
Japa
nese
wom
enw
as25
.2�C
(Jap
anes
em
en23
.4�C
),w
hile
the
neut
ralt
empe
ratu
reof
Euro
pean
and
Nor
th-A
mer
ican
men
was
22.1
�Cun
der
the
sam
eco
nditi
ons.
This
isa
3.1
Kdi
ffere
nce
Wan
get
al.(
2003
)Ha
rbin
,Chi
naFi
eld
Win
ter
2000
–200
112
0pa
rtici
pant
sin
resi
dent
iald
istri
cts
(61
fem
ales
,59
mal
es)
The
neut
ralo
pera
tive
tem
pera
ture
was
21.5
�C,w
here
asth
epr
efer
red
oper
ativ
ete
mpe
ratu
rew
as21
.9�C
,ind
icat
ing
that
peop
lew
anti
tslig
htly
war
mer
Fanger�s model of thermal comfort
187
In a normally distributed population, about 95% ofneutral temperatures of subjects will be within therange of four times the standard deviation (Wyon,1994). Wyon (1994) further stated that in the deriva-tion of the PMV model this range was 6.4 K, whereas aFrench study found a 10.4 K range, and an Americanstudy even a 13.6 K range. Wyon (1994) continues bystating that �when individual variation is so large, […]the practical value of estimating group mean neutraltemperatures is very limited. It is more important toprovide the practical means for individuals to adjusttheir own heat loss, than to try to guess what thecollective average of their individually preferred tem-peratures might be.�Differences found between field and climate chamber
research are explained by the greater variation inoccupants� clothing patterns in real buildings, comparedto the standard uniforms used in laboratory studies. Toohigh estimations by the PMV model might be found inerroneous values formetabolism and clothing insulationduring the derivation of the comfort equation. Fanger�stest persons wore the KSU clothing combination, ofwhich the insulation was estimated at 0.6 clo. Accordingto Nishi et al. (1975), this turned out to be only 0.32. Awrong estimation in clothing insulation, however, can-not be the only explanation.In conclusion, (i) thermal neutrality is not necess-
arily ideal for a significant number of people, and(ii) preferences for non-neutral thermal sensationsare common, very asymmetrically around neutrality,and in several cases are influenced by season. Also,(iii) thermal sensations outside of the three centralcategories of the ASHRAE 7-point scale of thermalsensation do not necessarily reflect discomfort for asubstantial number of persons.
Differences among building types
At present, the PMV model is applied globallythroughout every type of building. However, the modelwas developed from laboratory studies, and the effectsof building type were not considered. In practice,differences in the perception of the thermal environ-ment were found among occupants of naturallyventilated (also referred to as free-running), fullyair-conditioned and mixed mode or hybrid buildings(de Dear et al., 1997). It was found that for naturallyventilated buildings the indoor temperature regardedas most comfortable increased significantly in warmerclimatic contexts, and decreased in colder climate zones(de Dear, 2004). This is reflected by numerous studies,which showed that the neutral temperature observed inair-conditioned buildings differs from that observed innaturally ventilated buildings in the same climaticcontext (Table 3).de Dear et al. (1997) showed that occupants of
air-conditioned buildings are twice as sensitive to
temperature changes as those of naturally ventilatedbuildings. In contrast, Humphreys and Nicol (2002)found no difference between the accuracy of thepredicted responses in air-conditioned and free-run-ning buildings because of noticeable variations inthermal environments of the buildings. PMV provideslarger accuracy in terms of the average preferences forair-conditioned buildings due to narrower bandwidthsof the thermal environment. It is wrong to assume thatthe use of PMV is without exception correct when usedfor people in air-conditioned buildings (Humphreysand Nicol, 2002). According to de Dear and Brager(1998), the PMV model is not applicable to naturallyventilated buildings, because it only partly accounts forthermal adaptation to the indoor environment. Or, asstated by de Dear (2004), the PMV model has lostmuch of its predictive ability in naturally ventilatedbuildings. Therefore, a model of adaptive thermalcomfort has been proposed for free-running buildings,which relates the neutral temperature indoors to themonthly average temperature outdoors (de Dear andBrager, 1998). This model is incorporated into ASH-RAE (2004) Standard 55 as an optional method,applicable in naturally ventilated office buildings forpeople engaged in sedentary activity, when outdoortemperatures are between 10 and 33�C. Above 33�Cthe only predictive tool available is the PMV model,which is unreliable for predicting thermal responses ofpeople in free-running buildings (de Dear et al., 1997;Humphreys and Nicol, 2002). In temperate climatezones, the comfort zones of adaptive models and thePMV model are largely superimposed over one another(van Hoof and Hensen, 2007). An adaptive modelproposed earlier for fully air-conditioned buildings hasnot been included in the ASHRAE Standard.Fanger and Toftum (2002) see the exclusion of the
six input parameters of PMV that have an impact onthe human heat balance as an obvious weakness of theadaptive model. Although the PMV model is oftenreferred to as a �static� model, it turns out to be anadaptive model as it accounts for behavioral adjust-ments and fully explains adaptation occurring in air-conditioned buildings (de Dear and Brager, 2002).Fanger (2004b) expressed some thoughts on thelinguistic problems concerning the term �adaptive�.‘‘Adaptation should be a process of machines adaptingto human requirements and ergonomics, not theadaptation of humans to technology.’’Although the PMV model is still applied throughout
every type of building all across the globe, it was foundthat (i) for naturally ventilated buildings the indoortemperature regarded as most comfortable increasessignificantly in warmer climatic contexts, and decreasesin colder climate zones, and that (ii) the neutraltemperature observed in air-conditioned buildingsdiffers from that observed in naturally ventilatedbuildings in the same climatic context. This led to the
van Hoof
188

Tabl
e3
Over
view
ofst
udie
ssh
owin
gth
atth
ene
utra
ltem
pera
ture
obse
rved
inai
r-con
ditio
ned
(AC)
and
natu
rally
vent
ilate
d(N
V)bu
ildin
gsdi
ffers
from
each
othe
rin
the
sam
ecl
imat
icco
ntex
t
Refe
renc
eLo
catio
nSe
tting
Tim
eof
year
Subj
ects
Resu
lts
deDe
aran
dAu
licie
ms
(198
5)Br
isba
nean
dM
elbo
urne
,Aus
tralia
Fiel
dSu
mm
erOc
cupa
nts
ofai
r-con
ditio
ned
and
free-
runn
ing
offic
ebu
ildin
gs(n
=22
42)
Diffe
renc
esin
neut
ralt
empe
ratu
res
wer
e1.
7K
and
)1.
3K
betw
een
ACan
dN
Vbu
ildin
gsin
Bris
bane
and
Mel
bour
nein
sum
mer
Schi
ller
(199
0)Sa
nFr
anci
sco
Bay
Area
,USA
Fiel
dW
inte
ran
dsu
mm
er19
8730
4su
bjec
ts(1
87fe
mal
es,1
17m
ales
)in
10of
fice
build
ings
(234
2vi
sits
)In
win
ter,
the
mea
sure
dne
utra
ltem
pera
ture
(ET*
)was
22.0
�C,v
s.24
.4�C
pred
icte
dby
PMV.
Insu
mm
er,t
hem
easu
red
neut
ralt
empe
ratu
re(E
T*)
was
22.6
�C,v
s.25
.0�C
pred
icte
dby
PMV.
Inbo
thse
ason
s,th
ere
was
a2.
4K
diffe
renc
ebe
twee
nm
easu
rem
ents
and
pred
ictio
nsBu
sch
(199
0,19
92)
Bang
kok,
Thai
land
Fiel
dHo
tse
ason
and
wet
seas
on19
88Ov
er1,
100
Thai
offic
ew
orke
rsin
ACan
dN
Vbu
ildin
gsFo
rbo
thse
ason
s,te
mpe
ratu
res
atw
hich
peop
leex
pres
sed
optim
alco
mfo
rtha
da
slig
htly
broa
der
band
wid
thin
NV
offic
ebu
ildin
gsco
mpa
red
toAC
build
ings
.In
NV
build
ings
,the
PMV
mod
elun
dere
stim
ated
neut
ralt
empe
ratu
res
by3.
5K,
whi
lein
ACbu
ildin
git
over
estim
ated
by0.
5K.
The
uppe
rlim
itsfo
rth
erm
alco
mfo
rtin
both
type
sof
offic
ebu
ildin
gsw
ere
high
erth
anst
ated
inst
anda
rds
Fan
etal
.(19
93)
Wux
i,Ch
ina
Fiel
dAl
lyea
rro
und
10st
uden
ts(5
mal
es,5
fem
ales
),in
resi
dent
ialb
uild
ings
and
asc
hool
Peop
lepr
efer
diffe
rent
ther
mal
cond
ition
sdu
ring
long
-term
expo
sure
with
out
spac
ehe
atin
gor
cool
ing
than
base
don
ther
mal
com
fort
stan
dard
s.Lo
caly
oung
peop
leac
cept
edop
erat
ive
tem
pera
ture
sof
10–1
2�C
inw
inte
rOs
elan
d(1
996)
UKFi
eld
Win
ter
and
sum
mer
Win
ter:
(n=
935
ques
tionn
aire
s)+
6,05
0ha
lf-da
yqu
estio
nnai
res.
Sum
mer
:(n
=5,
037
ques
tionn
aire
s),i
n4
NV
and
4AC
build
ings
InN
Vof
fices
,the
neut
ralt
empe
ratu
rew
as1.
3to
2.2
K(w
inte
r-sum
mer
)lo
wer
than
inAC
build
ings
.At
the
sam
etim
e,th
ere
wer
eon
lym
inor
diffe
renc
esbe
twee
ndr
ess
code
and
activ
ityle
vels
.Dis
crep
anci
esof
upto
4K
wer
efo
und
betw
een
the
obse
rved
neut
ralt
empe
ratu
res
inN
Vbu
ildin
gsan
dth
ose
pred
icte
dby
the
PMV
mod
elEa
liwa
etal
.(19
99)
Ghad
ames
,Lib
yaFi
eld
Sum
mer
1997
–199
8Re
side
nts
(n=
60)o
fN
V(5
0%)
and
mec
hani
cally
(50%
)ven
tilat
eddw
ellin
gs
Occu
pant
sw
ere
com
forta
ble
atte
mpe
ratu
res
to35
.6�C
intra
ditio
nal
build
ings
com
pare
dto
30.0
�Cin
ACbu
ildin
gs.T
hePM
Vm
odel
faile
dto
pred
ict
com
fort
tem
pera
ture
sad
equa
tely
Nic
olet
al.(
1999
)Ka
rach
i,M
ulta
n,Qu
etta
,Is
lam
abad
,Pe
shaw
ar,a
ndSa
idu
Shar
if,Pa
kist
an
Fiel
d(2
stud
ies)
(1)L
ongi
tudi
nali
nsu
mm
eran
dw
inte
r,an
d(2
)tra
nsve
rse
with
mon
thly
surv
eys
over
aye
ar
Both
resi
dent
iala
ndco
mm
erci
albu
ildin
gs.(
n=
36su
bjec
ts,n
=49
27qu
estio
nnai
res)
.Stu
dy2:
(n=
846
subj
ects
,n
=7,
112
data
sets
)
PMV
tend
edto
over
estim
ate
the
impa
ctof
high
indo
orte
mpe
ratu
res
espe
cial
lyin
sum
mer
time
cond
ition
s,ov
erem
phas
izing
the
need
for
air-c
ondi
tioni
ng.T
here
was
gene
rally
little
disc
omfo
rtat
indo
orgl
obe
tem
pera
ture
sbe
twee
n20
and
30�C
van
der
Lind
enet
al.
(200
2)th
eN
ethe
rland
sFi
eld
Sum
mer
(£19
90)
Sam
ples
from
29AC
build
ings
,32
with
indi
vidu
alte
mpe
ratu
reco
ntro
l,of
whi
ch21
with
natu
rala
nd11
mec
hani
calv
entil
atio
n.N
umbe
rof
subj
ects
not
men
tione
d
Occu
pant
sof
NV
and
mec
hani
cally
vent
ilate
dbu
ildin
gsex
perie
nced
the
indo
orcl
imat
eas
bein
gw
arm
erth
anin
ACbu
ildin
gs,e
ven
thou
ghth
epe
rcen
tage
ofdi
ssat
isfie
d(P
D)is
low
erin
the
first
two
build
ings
(PD
25%
,AM
V0.
5/PD
41%
,AM
V1.
0)th
anin
air-c
ondi
tione
dbu
ildin
gs(P
D42
%,A
MV
0.5/
PD49
%,A
MV
1.0)
Heid
aria
ndSh
arpl
es(2
002)
Ilam
,Ira
nFi
eld
Hot
sum
mer
and
cold
win
ter
1998
,and
who
leye
ar19
99
Occu
pant
sof
NV
build
ings
.Hot
sum
mer
(n=
513)
,Col
dw
inte
r(n
=37
8),w
hole
year
(n=
30pe
ople
,n=
3819
ques
tionn
aire
s)
The
neut
ralt
empe
ratu
redu
ring
the
hot
sum
mer
inth
esh
ort-t
erm
stud
yw
as28
.4�C
,and
26.7
�Cfo
rthe
long
-term
stud
y.Th
ene
utra
ltem
pera
ture
durin
gth
eco
ldw
inte
rin
the
shor
t-ter
mst
udy
was
20.8
�C,a
nd21
.2�C
for
the
long
-term
stud
y.Pe
ople
inN
Vbu
ildin
gsw
ere
com
forta
ble
atin
door
high
erte
mpe
ratu
res
than
reco
mm
ende
dby
stan
dard
sFe
riadi
and
Hien
(200
3)Sa
mpl
esfro
mSi
ngap
ore
and
Indo
nesi
aFi
eld
data
,si
mul
atio
nsRa
iny
and
dry
seas
ons
(200
0–20
02)
Sing
apor
e(n
=53
8),
Indo
nesi
a(n
=52
5)PM
Vm
odel
has
disc
repa
ncie
sfo
rN
Vbu
ildin
gsin
the
tropi
csin
term
sof
tole
ranc
ean
dpe
rcep
tion
ofth
erm
alco
mfo
rt,w
hich
isdu
eto
lexi
cal
unce
rtain
tyof
the
ASHR
AE7-
poin
tsca
leof
ther
mal
sens
atio
n.Pe
ople
inth
etro
pics
may
have
anot
her
perc
eptio
nof
the
mea
ning
ofth
ew
ord
�war
m�
than
peop
lefro
mte
mpe
rate
mar
itim
ecl
imat
es.I
ntro
pica
lco
nditi
ons
itfa
ilsto
give
accu
rate
info
rmat
ion
abou
tth
ete
mpe
ratu
res
peop
lefin
dco
mfo
rtabl
e
Fanger�s model of thermal comfort
189

development of a model of adaptive thermal comfort,which is now an optional method alongside the PMVmodel for application to naturally ventilated buildings.
Improving the PMV model
Many researchers have tried to find ways to optimizethe use of the PMV model, for instance, by improvingthe model and enlarging its application domain.Improving the original PMV model is twofold; first,by correcting or adjusting the model itself, second byintroducing methods to increasing the accuracy of themodel�s input parameters.
Adjusting the model
The ability to incorporate expectation into the evalua-tion of thermal comfort is an areawhere the heat balancemodels offer no information. The difference does not liein physiology but in expectation (Fountain et al., 1996).Fanger and Toftum (2002) acknowledged some of thelimitations of the PMV model, as Fanger already did inhis 1970 dissertation, and proposed an extension to free-running buildings in warm climates by introducing twocorrection factors. First, factor �e� should be introducedto account for expectancyof the occupants dependingonprevious thermal experiences. This factor is to bemultiplied with PMV to reach the mean thermalsensation vote of the occupants. Based on professionaljudgment, evaries between1and0.5 (1 for buildingswithHVAC, for buildings without HVAC e is assumed todependon the annual durationof thewarmweather, andif these buildings can be compared with other buildingswithHVAC in the region) (Table 4). The second factor isa reduced activity level, as it is slowed down uncon-sciously by people feeling warm as a form of adaptation.The new extension predicts the actual votes well, and itacknowledges the importance of expectations accountedfor by the adaptive model, while at the same time notabandoning the current PMVmodel�s input parameterswith direct impact on the human heat balance.Humphreys and Nicol (2002) provide a statistical
method named PMVnew, which is illustrative only, andis not recommended for using as a replacement index
Tabl
e3
(Con
tinue
d)
Refe
renc
eLo
catio
nSe
tting
Tim
eof
year
Subj
ects
Resu
lts
Fato
etal
.(20
04),
Cont
ean
dFa
to(2
000)
Bari,
Italy
Fiel
dSu
mm
er(1
995,
1999
),an
dw
inte
r(1
996,
2000
)Un
iver
sity
stud
ents
.Sam
ple
size
:423
in19
95,1
034
in19
96,2
50in
1999
,an
d13
3in
2000
.Bui
ldin
gty
pe(tw
om
odes
):AC
inw
inte
r,N
Vin
sum
mer
Neu
tralt
empe
ratu
res
wer
e24
.4�C
insu
mm
er19
95,2
6.3�
Cin
sum
mer
1999
,20.
7�C
inw
inte
r19
96,a
nd20
.6�C
inw
inte
r20
00.O
ccup
ants
ofN
Vbu
ildin
gs(s
umm
er)r
egar
ded
a3.
3K
and
2.1
Kba
ndw
idth
tobe
acce
ptab
leco
mpa
red
to3.
6K
inAC
build
ings
(win
ter)
Yam
traip
atet
al.(
2005
)Th
aila
nd(C
hian
gM
ai,B
angk
ok&
Mah
asar
akha
m,P
rach
uabk
irikh
an)
Fiel
dAu
gust
2001
User
sof
ACbu
ildin
gsin
priv
ate
and
publ
icse
ctor
s(n
=15
20)
The
neut
ralt
empe
ratu
reof
peop
lew
itha
post
-gra
duat
eed
ucat
ion
leve
lw
asth
elo
wes
taro
und
25.3
�C,w
hile
that
ofth
eot
herg
roup
s(g
radu
ate
and
scho
lar)
was
high
erat
26.0
�C.F
orpe
ople
with
air-c
ondi
tioni
ngho
me,
the
diffe
renc
ebe
twee
nne
utra
ltem
pera
ture
ofev
ery
educ
atio
nle
veli
sra
ther
smal
l(0.
3K)
.How
ever
,for
the
othe
rgr
oup
(no
air-c
ondi
tioni
ng),
the
diffe
renc
eof
0.9
Kis
larg
er.P
eopl
ew
ithhi
gher
educ
atio
nald
egre
esar
efo
und
topr
efer
low
erin
door
tem
pera
ture
com
pare
dto
the
less
-edu
cate
d
Table 4 Expectancy factors in relation to building classification and expectation (Fangerand Toftum, 2002)
ExpectationBuildingclassification
Expectancyfactor e
High Non-HVAC in regions where HVAC buildingsare common. Warm periods occurring brieflyduring summer season
0.9–1.0
Moderate Non-HVAC in regions with some HVAC buildings.Warm summer season
0.7–0.9
Low Non-HVAC in regions with few HVAC buildings.Warm weather during all seasons
0.5–0.7
van Hoof
190

PMVnew ¼ 0:8ðPMV�DPMVÞ ð7Þ
DPMV ¼ �4:03þ 0:0949T0 þ 0:00584
� RHþ 1:201ðMIclÞ þ 0:000838T2out ð8Þ
(Equations 7 and 8). They state that the appropriatemethod to revise the PMV model would be to revise itspsychophysical and physiological construction, ratherthan to make empirical statistical adjustments. Therevised PMV has a reduced bias against all thecontributing variables and the ranges of validity aregreatly extended. The bias against PMVnew itself ismuch less than the PMV, extending the range ofapplication about three-fold, though it is still unsatis-factory in cold environments. Holmer (2004) statedthat for use in moderately cold and cold environments,the basic comfort criteria may also apply, but thecomplex heat transfer through multilayer clothingshould be considered in a more adequate way. Amodified PMV model was proposed by modification ofthe sweating criteria and some of the heat transferequations. The suggested criteria provide more realisticand reliable prediction of heat balance and conditionsfor comfort in colder environments.Gagge et al. (1986) proposed PMV* for any dry or
humid environment by replacing operative temperaturein Fanger�s comfort equation by standard effectivetemperature (SET*). Two classic indices of tempera-ture sensation and warm discomfort (PMV and DISC)are combined as generalized index PMV*, which isdirectly related to new effective temperature (ET*).PMV* is responsive to thermal stress caused by heatload, as well as to the physiological heat strain causedby changing humidity of the environment and bychanging vapor pressure permeability properties ofclothing worn. Gagge�s PMV* model has been used ina limited number of studies, for instance, by Priantoand Depecker (2003). Unfortunately, the modificationis unjust because Gagge and colleagues assumed thatFanger used different comfort criteria for cold andheat, instead of one. Also, Prek (2005) made acomparison between exergy consumption and theexpected level of thermal comfort. Since this analysisused the two-node model and special attention wasgiven to heat and mass transfer, a new PMV index(PMV*) was used. This model can be used for any dryor humid environment by replacing the operativetemperature in Fanger�s comfort equation with rationalET*. According to Prek, this modification representsan improvement as it includes the physiologic heatstrain caused by the relative humidity and vaporpermeability properties of clothing.The calculation of PMV is complicated as it is
nonlinear and iterative. Sherman (1985) proposed amodel based on Fanger�s original work to calculatePMV without iteration, by linearizing the radiation
exchange terms, simplifying the convection coefficient,and using dew-point temperature. Sherman indicatedthat these simplifications should not affect the precisionof PMV only when the occupants are near the comfortzone. Federspiel (1992) proposed another thermalsensation index V, which is a modification of thePMV index. He simplified the derivation by supposingthat radiative exchange and heat transfer coefficient arelinear, assuming that bodily heat production andclothing insulation are constant, and that the occu-pants are in a thermally neutral condition. V is alinearly parameterized function of the four environ-mental variables and becomes nonlinear when activitylevel or clothing insulation is changed, which is alimitation to the applicability of the model.Anothermethod for adjusting the current PMVmodel
is through fuzzy logics, for instance, by Feriadi andHien(2003). Hamdi et al. (1999) proposed a fuzzy thermalsensation index based on the original work of Fangerthat can be used in feedbackHVAC control applicationswith online calibration and without requiring anysimplification. The difference between PMV and fuzzyPMV values was found to be lower than 0.05 for anystate of the six input parameters, which indicates highprecision of the proposed fuzzy PMV model.Although many modifications to the original PMV
model have been proposed and tested to date, none ofthese developments have yet found widespread appli-cation in environmental engineering practice. The mostpromising application is the extension of the PMVmodel to free-running buildings in warm climates byFanger and Toftum (2002), which incorporates expec-tation into the evaluation of thermal comfort. Engi-neering practice has not yet come up with practicalmethods to use the extension.
The PMV model�s input parameters
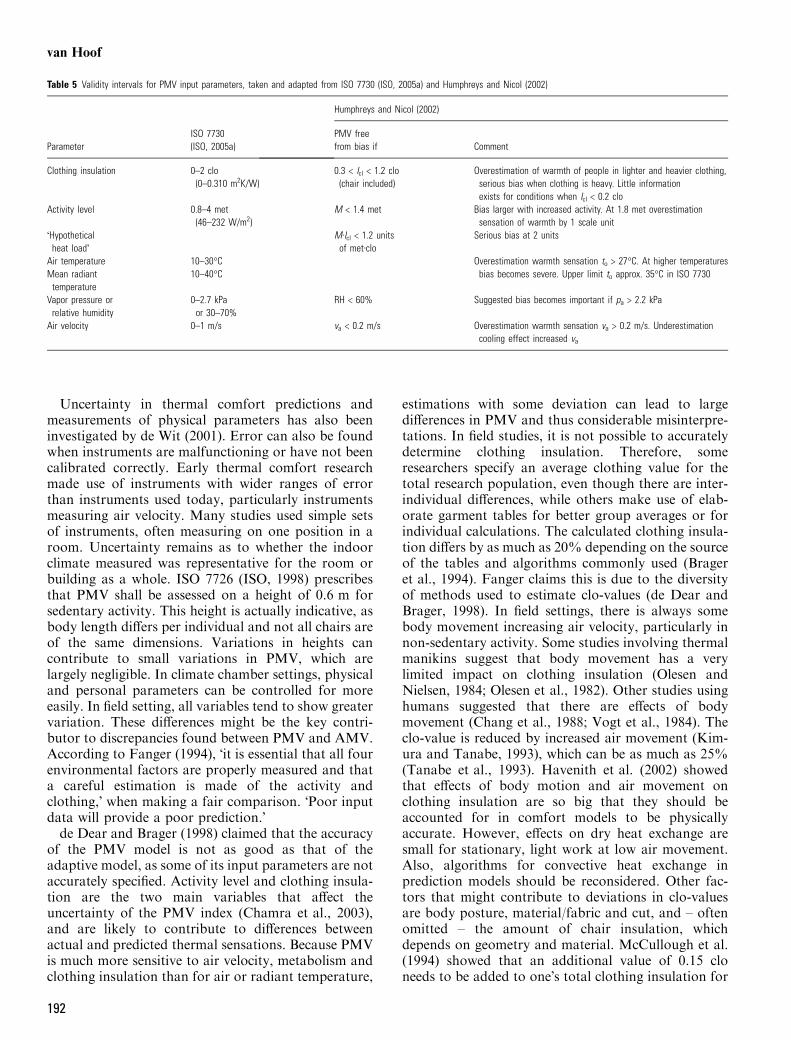
For an appropriate use of the PMV model, theparameters involved in the calculation of PMV needto be within certain limits (Table 5) according to ISO7730. The validity intervals stated in this standardcontribute largely to the biases in PMV (Humphreysand Nicol, 2002). Bandwidths of comfort parametersmatching correct PMV are narrower than that stated inISO 7730. The current intervals are too large, and nearthe extremes there is not sufficient data to confirm thevalidity. However, fortunately the PMV model has abias-free range of conditions (Humphreys and Nicol,2002). In tropical areas air temperatures frequently riseabove 30�C, and air velocities in excess of 1 m/s areseen. In Jakarta, for instance, the maximum average airtemperature is 33�C (Karyono, 2000). In case ofnaturally ventilated buildings, the PMV model cannotbe used without error according to ISO 7730. Similarsituations are found for architecture in deserts andvernacular buildings in cold climate zones.
Fanger�s model of thermal comfort
191
Uncertainty in thermal comfort predictions andmeasurements of physical parameters has also beeninvestigated by de Wit (2001). Error can also be foundwhen instruments are malfunctioning or have not beencalibrated correctly. Early thermal comfort researchmade use of instruments with wider ranges of errorthan instruments used today, particularly instrumentsmeasuring air velocity. Many studies used simple setsof instruments, often measuring on one position in aroom. Uncertainty remains as to whether the indoorclimate measured was representative for the room orbuilding as a whole. ISO 7726 (ISO, 1998) prescribesthat PMV shall be assessed on a height of 0.6 m forsedentary activity. This height is actually indicative, asbody length differs per individual and not all chairs areof the same dimensions. Variations in heights cancontribute to small variations in PMV, which arelargely negligible. In climate chamber settings, physicaland personal parameters can be controlled for moreeasily. In field setting, all variables tend to show greatervariation. These differences might be the key contri-butor to discrepancies found between PMV and AMV.According to Fanger (1994), �it is essential that all fourenvironmental factors are properly measured and thata careful estimation is made of the activity andclothing,� when making a fair comparison. �Poor inputdata will provide a poor prediction.�de Dear and Brager (1998) claimed that the accuracy
of the PMV model is not as good as that of theadaptive model, as some of its input parameters are notaccurately specified. Activity level and clothing insula-tion are the two main variables that affect theuncertainty of the PMV index (Chamra et al., 2003),and are likely to contribute to differences betweenactual and predicted thermal sensations. Because PMVis much more sensitive to air velocity, metabolism andclothing insulation than for air or radiant temperature,
estimations with some deviation can lead to largedifferences in PMV and thus considerable misinterpre-tations. In field studies, it is not possible to accuratelydetermine clothing insulation. Therefore, someresearchers specify an average clothing value for thetotal research population, even though there are inter-individual differences, while others make use of elab-orate garment tables for better group averages or forindividual calculations. The calculated clothing insula-tion differs by as much as 20% depending on the sourceof the tables and algorithms commonly used (Brageret al., 1994). Fanger claims this is due to the diversityof methods used to estimate clo-values (de Dear andBrager, 1998). In field settings, there is always somebody movement increasing air velocity, particularly innon-sedentary activity. Some studies involving thermalmanikins suggest that body movement has a verylimited impact on clothing insulation (Olesen andNielsen, 1984; Olesen et al., 1982). Other studies usinghumans suggested that there are effects of bodymovement (Chang et al., 1988; Vogt et al., 1984). Theclo-value is reduced by increased air movement (Kim-ura and Tanabe, 1993), which can be as much as 25%(Tanabe et al., 1993). Havenith et al. (2002) showedthat effects of body motion and air movement onclothing insulation are so big that they should beaccounted for in comfort models to be physicallyaccurate. However, effects on dry heat exchange aresmall for stationary, light work at low air movement.Also, algorithms for convective heat exchange inprediction models should be reconsidered. Other fac-tors that might contribute to deviations in clo-valuesare body posture, material/fabric and cut, and – oftenomitted – the amount of chair insulation, whichdepends on geometry and material. McCullough et al.(1994) showed that an additional value of 0.15 cloneeds to be added to one�s total clothing insulation for
Table 5 Validity intervals for PMV input parameters, taken and adapted from ISO 7730 (ISO, 2005a) and Humphreys and Nicol (2002)
ParameterISO 7730(ISO, 2005a)
Humphreys and Nicol (2002)
PMV freefrom bias if Comment
Clothing insulation 0–2 clo(0–0.310 m2K/W)
0.3 < Icl < 1.2 clo(chair included)
Overestimation of warmth of people in lighter and heavier clothing,serious bias when clothing is heavy. Little informationexists for conditions when Icl < 0.2 clo
Activity level 0.8–4 met(46–232 W/m2)
M < 1.4 met Bias larger with increased activity. At 1.8 met overestimationsensation of warmth by 1 scale unit
�Hypotheticalheat load�
MÆIcl < 1.2 unitsof metÆclo
Serious bias at 2 units
Air temperature 10–30�C Overestimation warmth sensation to > 27�C. At higher temperaturesbias becomes severe. Upper limit to approx. 35�C in ISO 7730Mean radiant
temperature10–40�C
Vapor pressure orrelative humidity
0–2.7 kPaor 30–70%
RH < 60% Suggested bias becomes important if pa > 2.2 kPa
Air velocity 0–1 m/s va < 0.2 m/s Overestimation warmth sensation va > 0.2 m/s. Underestimationcooling effect increased va
van Hoof
192
the impact of a chair. CEN Report 1752 (CEN, 1998)mentions an additional 0.1–0.3 clo for chairs. A goodexample of the impact of omitting the thermal insula-tion posed by chairs is the aforementioned study byBrager et al. (1994). Data from the Californian officeswere reanalyzed, accounting for an extra chair insula-tion of 0.15 clo. Also, adjustments were made based onrecent clothing insulation tables (an additional 0.1 clo).The results of the new analysis showed a bettercorrespondence between AMV and PMV.For precise comfort assessments, a precise measure
of activity level or metabolic rate is needed. In fieldstudies, measuring physiologic parameters can beinvasive and time-consuming tasks. As with clothinginsulation, activity level is often equal for a group as awhole. According to Havenith et al. (2002), the meth-ods for determining metabolic rate provided in ISO8996 (ISO, 2004) do not provide sufficient accuracy toclassify buildings to within 0.3 PMV scale units. Inorder to improve metabolic rate estimation based onISO 8996, more data and detail are needed for activitieswith a metabolic rate below 2 met units. According toGoto et al. (2002), the metabolic rate is influenced by aperson�s body mass, blood flow, and fitness. Wyon(1975) found that performing mental tasks can increaseactivity levels up to 1.3 met units, while Humphreys(1994) states that the vigor with which certain activitiesare carried out can affect met values. Rowe (2001)conducted a study involving 144 occupants filling outactivity checklists (n = 1,627). The mean activity levelwas 1.2 met units, with inter-individual and over-timedifferences ranging from 1.0 to 1.9 met.Errors in clothing insulation and activity level are
found to contribute to the inaccuracy of PMV,particularly in field studies. As differences betweenAMV and PMV are larger than could reasonably beattributed to these errors, other factors are probablyinvolved as well. As comment on de Dear and Brager(1998), Fanger says: �A careful assessment of an‘‘average’’ building occupant�s metabolic rate couldbe in error as much as plus or minus 0.3 met units andthat what researchers might rate as a ‘‘typical officetask’’ 1.2 met is in fact a ‘‘siesta’’ 0.9 met in certainparts of the world. In view of this enormous difficultyin getting the PMV-inputs right, we feel that […] anadaptive model is probably not such a bad thing afterall…�For an appropriate use of the PMV model, the
parameters involved in the calculation of PMV need tobe within certain limits, but the bandwidths of comfortparameters are subject to discussion. The quality ofpredictions and evaluations also depends on theaccuracy of input parameters, especially clothing insu-lation and activity level, and measurements. Wrongestimations of clothing insulation and activity levelmay even be contributing to the inaccuracy of PMV,particularly in field studies.
Extensions to the application domain
The current PMV model is used for assessing andpredicting thermal comfort in indoor spaces, oftenoffices with presumably stable thermal conditions. Newinsight is gained for application in semi-outdoorenvironments and in transient thermal conditions, aswell as on interaction between various indoor environ-mental parameters and the use of the PMV model fornon-office workers, such as older adults. Moreover, themodel holds interesting promises for other applica-tions, such as in a control strategy for optimizingproductivity and in relation to environmental psycho-logical factors. The latter also play a major role inoffering modes for individualized thermal comfort.
The PMV model for (semi-)outdoor use. Potter and deDear (2000) asked themselves a question: �Why doholiday makers deliberately seek out thermal environ-ments, that would rate ‘‘off the scale’’ if they wereencountered indoors?� In their investigation of outdoorscenarios, the researchers found that outdoor neutraltemperatures were about 3 K higher than for indoorspaces. Indoor and outdoor thermal sensations areperceived in a different manner.Current comfort standards do not clearly address
transitional spaces, locations where the physical envi-ronment bridges between the interior and exteriorenvironment. Outdoor situations are not includedeither. When designing the PMV model, it was neverintended for use in such spaces. Clothing insulation isgenerally higher in transitional spaces, as people areoften traveling to another destination and dress for theoutdoor weather. Field research from Thailand ontransitional spaces by Jitkhajornwanich et al. (1998)showed that the neutral temperature was 27.1�C whilethe thermal acceptability was between 25.5 and 31.5�C,whereas the expected neutral temperature, based on thePMV model, was 26.7�C. Chun et al. (2004) found thatthe PMV model cannot be used for thermal comfortpredictions in transitional spaces, because of unstableand dynamic physical conditions and met values. Thisis especially true for outdoor pavilions, where PMVoften travels out of the validity range of )2 <PMV < +2. These two studies from Asia suggestthat PMV cannot be used as an evaluative parameter insemi-outdoor spaces.Thermal sensation outdoors is perceived differently
from that of indoors. This implies that models forindoor thermal comfort are not applicable to theoutdoor settings (Hoppe, 2002). By parameterizationof the complex radiation fluxes outdoors, Fanger�scomfort equation became a universally acceptablemodel, which is used today under the name ofKlima-Michel-Modell (Hoppe, 1997). Various similarefforts have been undertaken by various researchersworldwide.
Fanger�s model of thermal comfort
193
Transient thermal conditions. In practice, the indoorenvironment is often characterized by transient orspatially non-uniform thermal conditions. Fanger(1970) stated that his model was valid only forinvariant conditions – constant environmental values.Thermal conditions in buildings are seldom steady, dueto the interaction between building structure, climate,occupancy, and HVAC system (Hensen, 1990). Tran-sient conditions in the indoor environment includeperiodic variations, ramps, and drifts. In his disserta-tion, Fanger mentioned that unhealthy shock effectsmay be found in air-conditioned spaces when peoplemove from hot to cold.According to Goto et al. (2002), steady-state models
for the prediction of thermal sensation seem to beapplicable after approximately 15 min of constantactivity. Climate chamber research by Iwamoto andYoneki (1999), comparing thermal sensation at thestart of a low humidity air-conditioning system anddomestic air conditioner from subjects� votes(n = 104), showed that soon after starting the air-conditioning, subjects did not feel so hot as indicatedby PMV. Such research sets limits to the application ofthe PMV model, which is designed for use in artificialindoor environments, in which occupants do notnecessarily have to be involved in constant activity.Currently, much investigation is carried out on tran-sient thermal conditions, and how such conditionsimpact the applicability of the PMV model. Newresearch can contribute to a proper assessment ofthermal comfort in non–steady-state conditions, forwhich PMV was not developed according to Fanger.
Interactions. Thermal comfort has been widely investi-gated and standardized. In practice, overall comfortalso originates from other physical parameters such asodor, lighting, and noise. Little research has beencarried out on the combined effects and interactionsbetween these different parameters. In 2004, de Dearstated that it has not been possible to assess howdissatisfactions from multiple sources are combined. Itis unknown whether the dissatisfaction resulting fromgeneral thermal discomfort is additive with the per-centages of those who are dissatisfied because of localdiscomforts, or whether the total dissatisfied may beless than the sum of the individual percentages.A study by Pellerin and Candas (2002) on the
combined effects of noise and temperature showed thatfemales accepted noisier environments than males,suggesting that thermal comfort is more dominant forwomen. Noise may alter thermal pleasantness in warmconditions. Nagano and Horikoshi (2005) studied thecombined effects of operative temperature and noise(n = 22). Results showed that both sound and tem-perature affected the sensation of one another. Almet al. (1999) studied temperature, air quality, andsound pressure level as a whole and showed that out
of 27 different combinations rising temperature is themost dominant factor in thermal discomfort. A differ-ence of 1 K has the same effect on thermal perceptionas a difference in sound pressure level of 3.8 dB(A) or adifference in air pollution of 7 decipol at 26�C. Theonly significant interaction was the one betweentemperature and desired air quality. The perceptionof indoor air quality is improved when temperaturesare cooler, and therefore, ventilation rates can bedecreased by lowering the indoor temperature (de Dearand Brager, 2002). Elevated air speeds also have apositive influence. Within the occupied zone it couldmean that thermal comfort can be achieved at highertemperatures, while simultaneously improving per-ceived air quality. More research on the combinedeffects of indoor air quality and thermal comfort wasconducted by Fang et al. (2000). The higher the air�senthalpy, the staler the air is perceived. In short, peopleprefer rather dry and cool air (Fanger, 2001). Santosand Gunnarsen (1999) studied the interaction betweenthermal comfort, sound, view, and daylight, andshowed that a decrease in the operative temperatureof 1 K has the same effect on total comfort as anincrease in 0.5 m2 of window surface area or a decreasein the sound level of 7 dB(A). Kim and Jeong (2002)studied the effects of different levels of illuminationbelow 1,000 lx on temperature regulation of humans(n = 7). The subjects preferred heavier clothing andshowed stronger vasoconstriction in the upper limbs indim light.In case of healthy persons, building occupants
balance the good features against the bad to reachtheir overall assessment of the indoor environment(Humphreys, 2005). Not all aspects are equally impor-tant in this subjective averaging process; for instance,satisfaction with warmth and air quality is moreimportant than satisfaction with the level of lightingor humidity. Moreover, the relative importance of thevarious aspects differ from country to country(Humphreys, 2005).Results of interaction studies lead to a better
understanding of the influence of the total indoorenvironment on occupants, and may one day lead to anintegration of aspects of the PMV model with otherindoor environmental parameters as people try toquantify overall comfort.
Gender, age, and disablement. In the 1960s, Fangercarried out a series of experiments to investigate theeffects of inter-individual differences. From thesestudies, Fanger (1970) concluded that the neutraltemperature of a large group of people was indepen-dent of age, body size, menstrual cycle, time of day,color and crowding of the room, gender, race, ornational geographic location. The current PMV modeldoes not account for groups other than students andpeople in sedentary activity, as the model was derived
van Hoof
194
based on tests with approximately 1,300 students. Realbuildings involve much larger and diverse samples ofreal occupants as opposed to college-age subjects (deDear, 2004). In his experiments, Fanger (1970) foundthat women were more sensitive to fluctuations inoptimum temperature than men. A comparison of theactual and PMVs by Parsons (2002) showed that forcool conditions (PMV = )2.0), females tended to besignificantly cooler (P < 0.05) than males, and theresponses of the females were close to the PMVs. Also,Nakano et al. (2002) found differences in neutraltemperature between males and females (Table 2).Fanger (1970) concluded that women are more sensi-tive to deviations than men. Parsons concluded that foridentical clothing and activity, there are few genderdifferences in thermal comfort responses for neutraland slightly warm conditions, although females tend tobe cooler than males in cool conditions.In a study by Karjalainen (2007), gender differences
in thermal comfort were examined by a quantitativeinterview survey (n = 3094), and by controlled exper-iments. Females were less satisfied with room temper-atures, preferred higher room temperatures, and feltboth uncomfortably cold and uncomfortably hot moreoften than males.Thermal comfort is not only important in work
settings. In our ageing society, the voice of older adultsis growing ever louder and there is a tendency ofcreating a more fitting building stock to accommodatethis group of people. This is also expressed in the desirefor excellent indoor environments, which offer thermalcomfort in compliance with physical needs.Fanger (1970) validated his model for older adults by
carrying out experiments involving 128 older subjectsto study the influence of age and aging. Some scientists,most of them from Japan, have since repeated studieson the effects of aging on comfort sensation. Moststudies confirm that in principle older adults do notperceive comfort differently from younger groups.However, older adults have a lower activity level andbasal metabolism, resulting in a preference of higherambient temperature (Havenith, 2001; van Hoof andHensen, 2006). These differences may also result fromdifferences in clothing between the age groups.Physically disabled persons respond as predicted by
the PMV model, although the range of responses forphysically disabled is much greater than that of healthypeople at PMVs of )1.5 and 0 (Webb and Parsons,1998). Multiple sclerosis patients are shown to havelarger actual PPD than based on Fanger�s PPD, andthe preferred environment (PMV = 0) is slightlywarmer than 23�C. Further work is needed to qualifywhether preferred environments match that ofPMV +1 and PMV )1 and to identify whether anyof the factors such as age, duration of disability, andmedication affect the actual mean vote (Webb et al.,1999). According to Haghighat et al. (1999), physically
handicapped persons demonstrate thermoregulatoryabnormalities in the affected portion of their bodies.Measured thermal sensations for physically handi-capped persons were found to have no generaltendencies. In 2002, Parsons stated that there are fewgroup differences between thermal comfort require-ments of people with and without physical disabilities.However, there is a greater necessity to considerindividual requirements for people with a physicaldisability.The technical specification ISO/TS 14415 (ISO,
2005b) deals with thermal comfort requirements ofpeople with special needs and impairments. However,this technical specification is far from complete, as sofew studies have been conducted in the field. Moreresearch is needed on the requirements of particularlyvulnerable groups of older adults, such as those withdementia, who are hypothesized to perceive theirthermal environment differently because of atrophyof their brain tissue, and who are unable to express theneed for cooler or warmer conditions. Similarly, peoplewith psychiatric impairments may respond differentlyto the thermal environment.A promising new application of the PMV model for
use for older adults is relating (extreme) climaticconditions to increased mortality rates in summer(Luscuere and Borst, 2002). National governments inEurope are stressing the importance of air-conditioningas a protective measure, but the impact on thermalcomfort and preferences remain unclear. In nursinghomes, the PMV model could be used for determiningcomfort of all occupants, mortality/morbidity riskresulting from heat and cold, and even productivitylevel of nursing staff in relation to the thermalconditions.Besides the aged and aging, more research is needed
on infants and children, who have a different meta-bolism and posture, especially in light of studies of theindoor environment in daycare centers and primaryschools in relation to well-being and school produc-tivity.
Productivity and the role of environmental psychology.The application range of the PMV model can beenlarged, for instance, for the prediction of productiv-ity in relation to the thermal climate. Productivity onthe work floor is affected by indoor environmentalparameters, including noise and thermal discomfort.Kosonen and Tan (2003 and 2004) made a PMV-basedproductivity model to estimate the effects of differentthermal conditions on productivity, as task-relatedperformance is correlated with the human perceptionof thermal environment. The theoretical optimalproductivity occurs when the PMV value is )0.21(around 24�C). The normally accepted PMV valueof +0.5 leads to about 12% productivity loss (PL)in thinking and 26% in typing. The mathematical
Fanger�s model of thermal comfort
195
expressions of PL for typing and thinking tasks inoffices (boundary constraints: PMV )0.21 and PMV+1.28), are given by
PLtyping task ¼ �60:543� PMV6 þ 198:41
� PMV5 � 183:75� PMV4 � 8:1178
� PMV3 þ 50:24� PMV2 þ 32:123
� PMVþ 4:8988
ð9Þ
PLthinking ¼ 1:5928� PMV5 � 1:5526� PMV4
� 10:401� PMV3 þ 19:226� PMV2
þ 13:389� PMVþ 1:873
ð10Þ
(Equations 9 and 10). More studies have been carriedout on the influence of thermal comfort and the indoorenvironment on productivity that promise interestingfield of application for the PMV model in the nearfuture.The perception of thermal comfort is closely related
to environmental psychology. The important role ofenvironmental psychology has been discussed earlierby Heijs and Stringer (1987) and de Dear (2004). Forthe integrity of person–environment relationships to bepreserved, thermal comfort research must be con-ducted within natural contexts (de Dear, 2004). In air-conditioned settings, the occupant is regarded as apassive recipient of the thermal stimuli presented bytheir environment, with the latter being assessedsubjectively against very specific expectations of whatsuch an environment should be like (de Dear, 2004). Afield study by Howell and Stramler (1981) on the roleof cognitive psychological variables (n = 260) foundthat there was a substantial impact of cognitivevariables on thermal sensation judgments. The mostimportant determinant of perceived comfort was,perhaps not surprisingly, perceived temperature. Roh-les (1980) found that adding wood paneling, carpets,comfortable furniture and soft lights, without anychanges in thermal parameters in a climate chamber,made people feel warmer. Even providing information(both true and false) could influence feelings of warmthand comfort. In winter, people preferred warm tem-peratures to cold temperatures, while in summer theopposite situation was found.Other psychological factors related to thermal cli-
mate are manifold. Anderson et al. (1996) reportedeffects of extreme temperatures on arousal, cognition,and affect. High temperatures increase levels of aggres-sion. Simister and Cooper (2005) reported evidencethat violent crime rates vary from month to month in aseasonal pattern, and this evidence is consistent withthe hypothesis that the seasonal pattern is caused by
temperature. This seasonal pattern might be due to theside effects of stress hormones, which the bodygenerates to cope with thermal stress.Perhaps, input from environmental psychology can
one day be combined with the PMV model, as a meansto quantify the thermal environment, to predict thelevel of arousal and aggression, for instance, inhospitals, jails, or police offices.
Individual control. It is generally believed that mostcomfort standards specify conditions that providecomfort for everybody. The PMV model is oftenapplied bearing this idea in mind. Unfortunately,fulfilling the criteria does not mean 100% acceptabilitybecause of individual differences in preferred temper-ature. �When the building is later constructed andoccupied, it is sometimes believed that the buildingshould be operated strictly according to [such criteria].This was never the intention. The standard should be aservant, not a master� (Fanger, 1994). Selection of anacceptable PPD often depends on economy andtechnical feasibility (Fanger, 1984, 2001; Olesen et al.,2001). In practice this means �quite a number ofdissatisfied persons� (if the thermal climate is main-tained in compliance with the international standards,there will be up to 10% dissatisfied people due towhole-body discomfort), �while few seem to be ready tocharacterize the indoor environment as outstanding�(Fanger, 2001).Individual differences in comfort temperature are so
large that it would be a historical mistake to developnew models and standards focusing on guaranteeingthermal comfort for a group as a whole (Wyon, 1994).In air-conditioned environments, the occupants are notexpected to attenuate it, or their responses to it, in anysignificant way. There is no need for prescriptivestandards if individual control over the thermal climateis provided, allowing all occupants to be satisfied(Fanger, 2001; Fountain et al., 1996), for instance, bybeing able to slightly adjust temperature at the work-place level. This requires systems designed for userinvolvement, both physical (individual temperaturecontrol), or �social, where the physical conditions areseen as a natural consequence of the situation, ratherthan arbitrarily imposed� (McIntyre, 1984).Palonen et al. (1993) recommended that a tempera-
ture range of 20–24�C without individual temperaturecontrol is too wide a range from the point of thermalcomfort. Room temperature should stay between 21and 23�C if no control is available. The best solution isan individual temperature control that gives thepossibility to adjust the room temperature at22 ± 2�C. In rooms with conventional mixing ofventilation air, the air should be kept at a moderatelylow temperature that corresponds to the coolesttemperature preferred by any of the occupants(Fanger, 2001). All other occupants should have access
van Hoof
196
to additional personalized local heating to obtain theirown preferred operative temperature. These smallheating flows should be provided by radiation orconduction in order to keep the air for inhalation cool(Fanger, 2001). Individual thermal control by airmovement should be avoided because of the risk ofdraught (Fanger, 2001). In a study investigating the useof thermostats, Karjalainen (2007) concluded that eventhough females were more critical of their thermalenvironments, males used thermostats in householdsmore often than females. Would this mean that inoffice settings women are more reluctant to controltheir indoor environment and that men are morewilling to operate technological means? More researchis needed on means to individualize thermal comfort.Having control over the environment is a very effectiveway to limit negative health effects of stress, as one canuse external coping strategies (Vroon, 1990). Providingall kinds of pseudo solutions, for instance, imitationthermostats, may have a positive effect in the begin-ning, but can have serious counterproductive effectssome time later, as occupants feel not taken seriously(Vroon, 1990). A negative placebo effect (nocebo effect)can emerge resulting in a further increase in dissatis-faction with the environment (Vroon, 1990). In linewith these statements, attention needs to be paid to thenature of building structures in relation to preferredfast gratification. Changes to the indoor temperaturedepend both on the system of heating and coolingavailable, and the thermal mass of the structure. Inthermal activation of building parts, changes in tem-perature may be slow. Thermostat control may nothave an immediate effect and therefore lead to moredissatisfaction and complaints.The PMV model can be used for providing a basic
thermal environment that meets the preferences of agroup of people. On an individual level, people shouldbe equipped with simple means to control the directthermal environment in order to maximize satisfactionand comfort.
ICT and thermal comfort. The emergence of informationand communication technologies (ICT) in buildingservices engineering will lead to the development ofreal-time thermostats that incorporate software basedon the comfort equation and the PMV model. Suchsystems will be at the basis of environmental systemsthat control the indoor climate, and offer means forcontrolling local environments to individual needs andin relation to the thermal conditions in adjacent spaces.Personal user profiles, based on a one�s preferredtemperature, and one�s sensitivity to deviations on thelower and warmer side, may be incorporated in time tocontrol the overall indoor climate. The speed at whichlocal environments can be adapted to these needs will beessential in the success of individualized solutions. Theintroduction and development of these systems will
undoubtedly be closely linked to energy conservationand management. Fanger (2006) stated that compro-mises are needed between energy conservation and bestpossible indoor environments. New developments inthe field of indoor air quality may provide room forsimultaneous energy savings. According to de Dear andBrager (2002), a more integrative view of optimizing theindoor environment, energy consumption, and produc-tivity is needed. Based on building automation andadvances in sensor technology, we will see the moni-toring and control of the indoor environment of officesin relation to achieving optimal conditions for maxi-mum productivity. In other types of buildings, otherpsychophysiological parameters may be coupled to thePMV model when controlling the indoor environment.Also, the previously described modified PMV modelsmay be used for computerized control strategies.The current use of building performance simulation
tools providing iso-PMV lines as output are an exampleof misuse of ICT, as PMV is not the property of a singlepoint in space, but rather a whole-body sensation. Theincreasing important of ICT solutions means that forcomplex and detailed simulations, new multi-segmentalmodels of human physiology and thermal comfort areincreasingly used, for instance, models by Fiala et al.(2001) and Huizenga et al. (2001). These models arebased on earlier work by Gagge and Stolwijk (seeGagge et al. (1971) for an example of their occasionalcollaborations) from the 1980s, and represent the bodyas a sum of separate body parts. These models candescribe local effects due to non-uniform environmentsand/or non-uniform clothing coverage. Although theyhave found little application outside of the laboratory,the new models are able to deal with real-world thermalcomplexities, and may therefore gain importance.
Conclusions
After almost 40 years of practical experience with thePMV model, the foundation of the model and its use,particularly in air-conditioned buildings, are growingever more solid. In four decades, numerous studieshave been conducted on thermal comfort in both fieldsettings and in climate chambers. These studies haveprovided valuable insight into the principles on whichthe PMV model is based.Thermal neutrality is not necessarily the ideal ther-
mal condition as preferences for non-neutral thermalsensations are common. At the same time, very lowand very high PMV values do not necessarily reflectdiscomfort for a substantial number of persons.The PMV model is applied throughout every type of
building all across the globe and its use is prescribed inthermal comfort standards. However, it was found thatfor naturally ventilated buildings the indoor tempera-ture regarded as most comfortable increases signifi-cantly in warmer climatic contexts, and decreases in
Fanger�s model of thermal comfort
197
colder climate zones. This important milestone inthermal comfort research led to the development ofan adaptive comfort model. The support for the PMVmodel is still larger than that for this adaptive model,which was expressed by the latest round of standardrevisions that only included the adaptive model as anoptional method in very restricted conditions.Many researchers have tried to improve the PMV
model, and enlarge its application domain. Improve-ments can be made by correcting or adjusting themodel itself, or by introducing methods to increasingthe accuracy of the model�s input parameters.Although many modifications to the original PMVmodel have been proposed and tested to date, none ofthese developments have yet found widespread appli-cation in environmental engineering practice. Theaccuracy of the PMV model and the quality of itspredictions gain in strength when users are able tomore precisely determine the model�s input parameters,particularly clothing and activity levels. This requiresmore sophisticated tables and tools for use in dailypractice, and in case of office settings, should alsoprovide accurate data on the insulation of varioustypes of chairs.The current PMV model is used for assessing and
predicting thermal comfort in indoor spaces, oftenoffices. The model, however, holds interesting promisesfor other applications that go beyond the originalscope, such as optimizing productivity. Thermal com-fort plays a major role among other indoor environ-mental parameters. The exact interactions betweenthese parameters are not yet fully understood, and
subject of many studies, as are transient thermalconditions. Also, groups other than college-age stu-dents and occupants of office buildings need to bestudied in terms of thermal preferences.There is a tendency, influenced by the emancipation
of building occupants and energy conservation, to setthe general indoor climate in accordance with require-ment of the PMV model, while on an individual level,people are equipped with simple means to control thedirect thermal environment. The development of indi-vidualized thermal comfort in work spaces takes placesimultaneously with the computerization of the workfloor. In the near future, the thermal environment maybe set in compliance with personal preferences storedin an automated user profile that allows for furtherpersonal fine-tuning, energy conservation, and couplingwith other indoor environmental parameters.Fanger�s PMV model is almost 40 years old and still
used as the number one method for evaluating thermalcomfort. Even the incorporation of an adaptivemodel inAHSRAEStandard 55 did little harm to the status of thePMV model, as it is still recognized as valid for allbuildings types. The quality of the outcomes of the PMVmodel is as good as that of its input parameters specifiedby the model�s user. The many input parameters of thecomfort equation make PMV an index with greatpotential for the computerized 21st century in whichoccupants have increased demands regarding the indoorenvironment. In combination with means for individualcontrol, engineers should be able to create indoorenvironments that provide nearly 100% acceptabilityand comfort to all, based on the work of Fanger.
References
Ahmed, Z.N., Howarth, A.T. and Zunde,J.M. (1990) Thermal comfort studies andapplications for Dhaka, Build. Serv. Eng.Res. Technol., 11, 105–108.
Alm, O., Witterseh, T., Clausen, G., Toftum,J. and Fanger, P.O. (1999) The impact onhuman perception of simultaneousexposure to thermal load, low-frequencyventilation noise and indoor air pollution.In: Raw, G., Aizlewood, C. and Warren,P. (eds) Proceedings of Indoor Air �99,Vol. 5, Edinburgh, 270–275.
Anderson, C.A., Anderson, K.B. and Deu-ser, W.E. (1996) Examining an affectiveaggression framework: weapon and tem-perature effects on aggressive thoughts,affect, and attitudes, Pers. Soc. Psychol.Bull., 22, 366–367.
Araujo, V.M.D. and Araujo, E.H.S. (1999)The applicability of ISO 7730 for theassessment of the thermal conditions ofusers of the buildings in Natal-Brazil. In:Raw, G., Aizlewood, C. and Warren, P.
(eds) Proceedings of Indoor Air �99, Vol. 2,Edinburgh, 148–153.
ASHRAE (2004) Thermal EnvironmentalConditions for Human Occupancy,Atlanta, American Society of Heating,Refrigerating and Air-ConditioningEngineers (ANSI/ASHRAE Standard55-2004).
Benton, C.C., Bauman, F.S. and Fountain,M.E. (1990) A field measurement systemfor the study of thermal comfort, ASH-RAE Trans., 96, 623–633.
Brager, G.S. and de Dear, R.J. (1998) Ther-mal adaptation in the built environment:a literature review, Energy Build., 27, 83–96.
Brager, G.S., Fountain, M.E., Benton, C.C.,Arens, E.A. and Bauman, F.S. (1994) Acomparison of methods for assessingthermal sensation and acceptability in thefield. In: Oseland, N.A. and Humphreys,M.A. (eds) Proceedings Thermal Comfort,Past, Present and Future, Garston, 17–39.
Busch, J.F. (1990) Thermal responses to theThai office environment, ASHRAETrans., 96, 859–872.
Busch, J.F. (1992) A tale of two populations:thermal comfort in air-conditioned andnaturally ventilated offices in Thailand,Energy Build., 18, 235–249.
CEN (1998) Ventilation for Buildings: DesignCriteria for the Indoor Environment,Brussels, European Committee for Stan-dardization (Technical report CR 1752).
Chamra, L.M., Steele, W.G. and Huynh, K.(2003) The uncertainty associated withthermal comfort, ASHRAE Trans., 109,356–365.
Chan, D.W.T., Burnett, J., de Dear, R.J. andNg, S.C.H. (1998) A large-scale survey ofthermal comfort in office premises inHong Kong, ASHRAE Trans., 104, 1172–1180.
Chang, S.K.W., Arens, E. and Gonzalez,R.R. (1988) Determination of the effect ofwalking on the forced convection heat
van Hoof
198
transfer coefficient using an articulatedmanikin, ASHRAE Trans., 94, 71–82.
Chun, C., Kwok, A. and Tamura, A. (2004)Thermal comfort in transitional spaces –basic concepts: literature review and trialmeasurement, Build. Environ., 39, 1187–1192.
Conte, E. and Fato, I. (2000) Thermal com-fort in mixed mode buildings. In: Seppa-nen, O. and Sateri, J. (eds) Proceedings ofHealthy Buildings 2000, Vol. 2, Espoo,581–586.
Croome, D.J., Gan, G. and Awbi, H.B.(1993) Thermal comfort and air quality inoffices. In: Jaakkola, J.J.K., Ilmarinen, R.and Seppanen, O. (eds) Proceedings ofIndoor Air �93, Vol. 6, Helsinki, 37–42.
de Dear, R. (2004) Thermal comfort inpractice, Indoor Air, 14, s32–s39.
de Dear, R.J. and Auliciems, A. (1985) Va-lidation of the predicted mean vote modelof thermal comfort in six Australian fieldstudies, ASHRAE Trans., 91, 452–468.
de Dear, R.J. and Brager, G.S. (1998) De-veloping an adaptive model of thermalcomfort and preference, ASHRAE Trans.,104, 145–167.
de Dear, R.J. and Brager, G.S. (2002) Ther-mal comfort in naturally ventilatedbuildings, revisions to ASHRAE Stan-dard 55, Energy Build., 34, 549–561.
de Dear, R.J., Leow, K.G. and Ameen, A.(1991) Thermal comfort in the humidtropics – part I, climate chamber experi-ments on temperature preferences in Sin-gapore, ASHRAE Trans., 97, 874–879.
de Dear, R.J., Brager, G.S. and Cooper, D.(1997) Developing an Adaptive Model ofThermal Comfort and Preference, FinalReport ASHRAE RP- 884, Atlanta,American Society of Heating, Refrigerat-ing and Air-Conditioning Engineers.
Doherty, T.J. and Arens, E. (1988) Evalua-tion of the physiological bases of thermalcomfort models, ASHRAE Trans., 94,1371–1385.
Ealiwa, M.A., Taki, A.H., Howarth, A.T.and Seden, M.R. (1999) Field investiga-tion of thermal comfort in both naturallyand mechanically ventilated buildings inGhadames, Libya. In: Raw, G., Aizle-wood, C. and Warren, P. (eds) Proceed-ings of Indoor Air �99, Vol. 2, Edinburgh,166–171.
Fan, Y., Lang, S. and Xu, W. (1993) Fieldstudy on acceptable thermal conditionsfor residential buildings in transitionzone of China. In: Jaakkola, J.J.K.,Ilmarinen, R. and Seppanen, O. (eds)Proceedings of Indoor Air �93, Vol. 6,Helsinki, 109–114.
Fang, L., Clausen, G. and Fanger, P.O.(2000) Temperature and humidity:important factors for perception of airquality and for ventilation requirements,ASHRAE Trans., 100, 503–510.
Fanger, P.O. (1967) Calculation of thermalcomfort: introduction of a basic comfort
equation, ASHRAE Trans., 73, III.4.1–III.4.20.
Fanger, P.O. (1970) Thermal Comfort,Copenhagen, Danish Technical Press.
Fanger, P.O. (1984) The philosophy behind acomfort standard. In: Berglund, B.,Lindvall, T. and Sundell, J. (eds) Pro-ceedings of Indoor Air �84, Vol. 1, Stock-holm, 91–98.
Fanger, P.O. (1994) How to apply modelspredicting thermal sensation and dis-comfort in practice. In: Oseland, N.A.and Humphreys, M.A. (eds) ProceedingsThermal Comfort, Past, Present andFuture, Garston, 11–17.
Fanger, P.O. (2001) Human requirements infuture air-conditioned environments, Int.J. Refrigeration, 24, 148–153.
Fanger, P.O. (2004a) Curriculum vitae,Indoor Air, 14, s12–s17.
Fanger, P.O. (2004b) Oral communication,Eindhoven, Technische UniversiteitEindhoven, June 10 2004.
Fanger, P.O. (2006) What is IAQ?, IndoorAir, 16, 328–334.
Fanger, P.O. and Langkilde, G. (1975)Interindividual differences in ambienttemperatures preferred by seated persons,ASHRAE Trans., 81, 140–147.
Fanger, P.O. and Toftum, J. (2002) Exten-sion of the PMV model to non-air-con-ditioned buildings in warm climates,Energy Build., 34, 533–536.
Fato, I., Martellotta, F. and Chiancarella, C.(2004) Thermal comfort in the climaticconditions of Southern Italy, ASHRAETrans., 110, 578–593.
Federspiel, C.C. (1992) User-adaptable andMinimum-Power Thermal Comfort Con-trol, Cambridge MIT (Dissertation).
Feriadi, H. and Hien, W.N. (2003) Model-ling thermal comfort for tropics usingfuzzy logic. In: Hensen, J.L.M. andAugenbroe, G. (eds) Proceedings BuildingSimulation 2003, Vol. 1, Eindhoven, 323–330.
Fiala, D., Lomas, K.J. and Stohrer, M.(2001) Computer prediction of humanthermoregulation and temperatureresponses to a wide range of environ-mental conditions, Int. J. Biometeorol.,45, 143–159.
Fountain, M.E., Brager, G.S. and de Dear,R.J. (1996) Expectations of indoor cli-mate control, Energy Build., 24, 179–182.
Gagge, A.P., Burton, A.C. and Bazett, H.C.(1941) A practical system of units for thedescription of the heat exchange of manwith his environment, Science, 94, 428–430.
Gagge, A.P., Stolwijk, J.A.J. and Nishi, Y.(1971) An effective temperature scalebased on a simple model of human phy-siological regulatory response, ASHRAETrans., 77, 247–262.
Gagge, A.P., Fobelets, A.P. and Berglund,L.G. (1986) A standard predictive indexof human response to the thermal
environment, ASHRAE Trans., 92, 709–731.
Goto, T., Toftum, J., de Dear, R. and Fan-ger, P.O. (2002) Thermal sensation andcomfort with transient metabolic rates,In: Levin, H. (ed.) Proceedings of IndoorAir �02, Vol. 1, Monterey, 1038–1043.
Haghighat, F., Donnini, G., Megri, A.C. andGiorgi, G. (1999) Prediction of thermalperception of disabled persons vs mea-surement. In: Raw, G., Aizlewood, C. andWarren, P. (eds) Proceedings of Indoor Air�999, Vol. 2, Edinburgh, 113–118.
Hamdi, M., Lachiver, G. and Michaud, F.(1999) A new predictive thermal sensationindex of human response, Energy Build.,29, 167–178.
Havenith, G. (2001) Temperature regulationand technology, Gerontechnology, 1, 41–49.
Havenith, G., Holmer, I. and Parsons, K.(2002) Personal factors in thermal com-fort assessment: clothing properties andmetabolic heat production, Energy Build.,34, 581–591.
Heidari, S. and Sharples, S. (2002) A com-parative analysis of short-term and long-term thermal comfort surveys in Iran,Energy Build., 34, 607–614.
Heijs, W. and Stringer, P. (1987) Comfort asa property of the dwelling: a conceptualanalysis, Neth. J. Housing Environ. Res.,2, 331–356.
Hensen, J.L.M. (1990) Literature review onthermal comfort in transient conditions,Build. Environ., 25, 309–316.
Holmer, I. (2004) Cold but comfortable?Application of comfort criteria to coldenvironments, Indoor Air, 14, 27–31.
van Hoof, J. and Hensen, J.L.M. (2006)Thermal comfort and older adults, Ger-ontechnology, 4, 223–228.
van Hoof, J. and Hensen, J.L.M. (2007)Quantifying of relevance of adaptivethermal comfort models in moderatethermal climate zones, Build. Environ., 42,156–170.
Hoppe, P. (1997) Aspects of human bio-meteorology in past, present and future,Int. J. Biometeorol., 40, 19–23.
Hoppe, P. (2002) Different aspects of asses-sing indoor and outdoor thermal comfort,Energy Build., 34, 661–665.
Howell, W.C. and Kennedy, P.A. (1979)Field validation of the Fanger thermalcomfort model, Hum. Factors, 21, 229–239.
Howell, W.C. and Stramler, C.S. (1981) Thecontribution of psychological variables tothe prediction of thermal comfort judg-ments in real world settings, ASHRAETrans., 87, 609–621.
Huizenga, C., Hui, Z. and Arens, E. (2001) Amodel of human physiology and comfortfor assessing complex thermal environ-ments, Build. Environ., 36, 691–699.
Humphreys, M.A. (1994) Field studies andclimate chamber experiments in thermal
Fanger�s model of thermal comfort
199

comfort research. In: Oseland, N.A. andHumphreys, M.A. (eds) ProceedingsThermal Comfort, Past, Present andFuture, Garston, 52–72.
Humphreys, M.A. (2005) Quantifying occu-pant comfort: are combined indices of theindoor environment practicable?, Build.Res. Inf., 33, 317–325.
Humphreys, M.A. and Hancock, M. (2007)Do people like to feel �neutral�?: exploringthe variation of the desired thermal sen-sation on the ASHRAE scale’’, EnergyBuild., 39, 867–874.
Humphreys, M.A. and Nicol, J.F. (2002)The validity of ISO-PMV for predictingcomfort votes in every-day thermalenvironments, Energy Build., 34, 667–684.
Ishii, A., Iwamoto, S., Sakai, E., Katayama,T. and Tsutsumi, J. (1993) The effect ofhumidity reduction on thermal sensa-tions. In: Jaakkola, J.J.K., Ilmarinen, R.and Seppanen, O. (eds) Proceedings ofIndoor Air �93, Vol. 6, Helsinki, 115–120.
ISO (1998) Ergonomics of the ThermalEnvironment – Instruments for MeasuringPhysical Quantities, Geneva, Interna-tional Organization for Standardization(ISO 7726).
ISO (2004) Ergonomics of the ThermalEnvironment – Determination of MetabolicRate, Geneva, International Organizationfor Standardization (ISO 8996).
ISO (2005a) Ergonomics of the ThermalEnvironment – Analytical Determinationand Interpretation of Thermal ComfortUsing Calculation of the PMV and PPDIndices and Local Thermal Comfort Cri-teria, Geneva, International Organizationfor Standardization (ISO 7730).
ISO (2005b) Ergonomics of the ThermalEnvironment – Application of InternationalStandards to People with SpecialRequirements, Geneva, InternationalOrganization for Standardization (Tech-nical Specification ISO/TS 14415).
Iwamoto, S. and Yoneki, T. (1999) Indoorthermal environment in transient condi-tion. In: Raw, G., Aizlewood, C. andWarren, P. (eds) Proceedings of Indoor Air�99, Vol. 2, Edinburgh, 178–183.
Jitkhajornwanich, K., Pitts, A.C., Malama,A. and Sharples, S. (1998) Thermal com-fort in transitional spaces in the coolseason of Bangkok, ASHRAE Trans.,104, 1181–1193.
Kahkonen, E. (1991) Draught, radiant tem-perature asymmetry and air temperature– a comparison between measured andestimated thermal parameters, Indoor Air,1, 439–447.
Kahkonen, E. and Ilmarinen, R. (1989)Assessing indoor thermal climate – a cri-tical discussion. Environ. Int., 15, 531–535.
Karjalainen, S. (2007) Gender differences inthermal comfort and use of thermostats ineveryday thermal environments, Build.Environ., 42, 1594–1603.
Karyono, T.H. (1995) Higher PMV causeshigher energy consumption in air-condi-tioned buildings, a case study in JakartaIndonesia. In: Nicol, J.F., Humphreys,M.A., Sykes, O. and Roaf, S. (eds) Stan-dards for Thermal Comfort, Indoor AirTemperature Standards for the 21st Cen-tury, London, Chapman & Hall, 219–226.
Karyono, T.H. (2000) Report on thermalcomfort and building energy studies inJakarta-Indonesia, Build. Environ., 35,77–90.
Kim, S.H. and Jeong, W.S. (2002) Influenceof illumination on autonomic thermo-regulation and choice of clothing, Int. J.Biometeorol., 46, 141–144.
Kimura, K. and Tanabe, S. (1993) Re-commended air velocity against combi-nations of temperature and humidity forsedentary occupants in summer clothing.In: Jaakkola, J.J.K., Ilmarinen, R. andSeppanen, O. (eds) Proceedings of IndoorAir �93, Vol. 6, Helsinki, 61–66.
Kimura, K., Tanabe, S. and Iwata, T. (1994)Climate chamber studies for hot andhumid regions. In: Oseland, N.A. andHumphreys, M.A. (eds) ProceedingsThermal Comfort, Past, Present andFuture, Garston, 88–105.
Kosonen, R. and Tan, F. (2003) PMV-derived productivity model as a tool toassess productivity loss. In: Tham, K.W.,Sekhar, S.C. and Cheong, K.W.D. (eds)Proceedings of Healthy Buildings 2003,Vol. 1, Singapore, 749–754.
Kosonen, R. and Tan, F. (2004) Assessmentof productivity loss in air-conditionedbuildings using PMV, Energy Build., 36,987–993.
van der Linden, A.C., Boerstra, A.C., Raue,A.K. and Kurvers, S.R. (2002) Thermalindoor climate building response char-acterized by human comfort response,Energy Build., 23, 737–744.
Luscuere, P.G. and Borst, V. (2002) Air-conditioning in nursing homes till deathdo us part? In: Levin, H. (ed.) Proceedingsof Indoor Air �02, Vol. 1, Monterey, 1032–1037.
Mayer, E. (1997) A new correlation betweenpredicted mean votes (PMV) and pre-dicted percentages of dissatisfied (PPD).In: Woods, J.E., Grimsrud, D.T. andBoschi, N. (eds) Proceedings of HealthyBuildings/IAQ �97, Vol. 2, Washington,189–194.
McCullough, E., Olesen, B.W. and Hong, S.(1994) Thermal insulation provided bychairs, ASHRAE Trans., 100, 795–802.
McIntyre, D.A. (1984) Evaluation of thermaldiscomfort. In: Berglund, B., Lindvall, T.and Sundell, J. (eds) Proceedings of IndoorAir �84, Vol. 1, Stockholm, 147–158.
Nagano, K. and Horikoshi, T. (2005) Newcomfort index during combined condi-tions of moderate low ambient tempera-ture and traffic noise, Energy Build., 37,287–294.
Nakano, J., Tanabe, S. and Kimura, K.(2002) Differences in perception of indoorenvironment between Japanese and non-Japanese workers, Energy Build., 34, 615–621.
Nicol, J.F., Raja, I.A., Allaudin, A. andJamy, G.N. (1999) Climatic variations incomfortable temperatures, the Pakistanprojects, Energy Build., 30, 261–279.
Nishi, Y., Gonzalez, R.R. and Gagge, A.P.(1975) Direct measurement of clothingheat transfer properties during sensibleand insensible heat exchange with thermalenvironment, ASHRAE Trans., 81, 183–199.
Olesen, B.W. and Nielsen, R. (1984) Acomparison of the thermal insulationmeasured on a thermal manikin and onhuman subjects. In: Berglund, B., Lind-vall, T. and Sundell, J. (eds) Proceedingsof Indoor Air �84, Vol. 5, Stockholm, 315–320.
Olesen, B.W., Sliwinski, E., Madsen, T.L.and Fanger, P.O. (1982) The effect ofposture and activity on the thermalinsulation of clothing: measurement by amoveable thermal manikin, ASHRAETrans., 88, 791–805.
Olesen, B.W., de Dear, R.J. and Brager, G.S.(2001) Status and new developments inindoor thermal environmental standards,J. Hum. Environ. Syst., 5, 1–12.
Oseland, N.A. (1996) Thermal comfort innaturally ventilated versus air-condi-tioned offices. In: Yoshizawa, S., Kimura,K., Ikeda, K., Tanabe, S. and Iwata, T.(eds) Proceedings of Indoor Air �96, Vol. 1,Tokyo, 215–220.
Paciuk, M. and Becker, R. (2002) Predictedvs. recorded summer thermal responses inair-conditioned and naturally ventilateddwellings in Israel. In: Levin, H. (ed.)Proceedings of Indoor Air �02, Vol. 5,Monterey, 104–109.
Palonen, J., Reinikainen, L.M. and Jaakola,J.J.K. (1993) The effects of air tempera-ture and relative humidity on thermalcomfort in the office environment. In:Jaakkola, J.J.K., Ilmarinen, R. and Sep-panen, O. (eds) Proceedings of Indoor Air�93, Vol. 6, Helsinki, 43–48.
Parsons, K.C. (2002) The effects of gender,acclimation state, the opportunity to ad-just clothing and physical disability onrequirements for thermal comfort, EnergyBuild., 34, 593–599.
de Paula Xavier, A.A. and Roberto, L.(2000) Indices of thermal comfort devel-oped from field survey in Brazil, ASH-RAE Trans., 106, 45–58.
Pellerin, N. and Candas, V. (2002) Combinedeffects of temperature and noise onhuman discomfort, Physiol. Behav., 78,99–106.
Potter, J.C. and de Dear, R.J. (2000) Fieldstudy to calibrate outdoor thermal com-fort index. In: de Dear, R.J., Kalma, J.D.,Oke, T.R. and Auliciems, A. (eds)
van Hoof
200
Biometeorology and urban climatology atthe turn of the millennium, Geneva, WorldMeteorological Organization, 315–320.
Prek, M. (2005) Thermodynamic analysis ofhuman heat and mass transfer and theirimpact on thermal comfort, Int. J. HeatMass Transfer, 48, 731–739.
Prianto, E. and Depecker, P. (2003) Opti-mizing of architectural design elements intropical humid region with thermal com-fort approach, Energy Build., 35, 273–280.
Rohles, F.H. (1980) Temperature or tem-perament: a psychologist looks at thermalcomfort, ASHRAE Trans., 86, 541–551.
Rowe, D.M. (2001) Activity rates and ther-mal comfort of office occupants in Syd-ney, J. Thermal Biol., 26, 415–418.
Santos, A.M.B. and Gunnarsen, L. (1999)Optimizing linked pairs of indoor climateparameters. In: Raw, G., Aizlewood, C.and Warren, P. (eds) Proceedings ofIndoor Air �99, Vol. 3, Edinburgh, 191–196.
Sassa, N., Kubo, H., Isoda, N. and Yanase,T. (1999) The individual differences ofpreferred air temperature at the directdetermination and exposure to estab-lished air temperature. In: Raw, G.,Aizlewood, C. and Warren, P. (eds)Proceedings of Indoor Air �99, Vol. 1,Edinburgh, 638–643.
Schiller, G.E. (1990) A comparison of mea-sured and predicted comfort in officebuildings, ASHRAE Trans., 96, 609–622.
Sherman, M. (1985) A simplified model ofthermal comfort, Energy Build., 8, 37–50.
Simister, J. and Cooper, C. (2005) Thermalstress in the U.S.A.: effects on violenceand on employee behaviour, StressHealth, 21, 3–15.
Tanabe, S., Hasebe, Y. and Kimura, K.(1993) Reduction of clo value withincreased air movement. In: Jaakkola,J.J.K., Ilmarinen, R. and Seppanen, O.(eds) Proceedings of Indoor Air �93, Vol. 6,Helsinki, 139–144.
Vogt, J.J., Meyer, J.P., Sagot, J.C. andCandas, V. (1984) Basic, effective andresultant clothing insulations, ASHRAETrans., 90, 1091–1098.
Vroon, P.A. (1990) Psychologische aspectenvan ziekmakende gebouwen, Utrecht,Rijksuniversiteit Utrecht (in Dutch).
Wang, Z.-J., Wang, G. and Lian, L.-M.(2003) A field study of the thermalenvironment in residential buildings inHarbin, ASHRAE Trans., 109, 350–355.
Webb, L.H. and Parsons, K.C. (1998) Casestudies of thermal comfort for people withphysical disabilities, ASHRAE Trans.,104, 883–895.
Webb, L.H., Parsons, K.C. and Hodder,S.G. (1999) Thermal comfort require-ments. A study of people with multiplesclerosis, ASHRAE Trans., 105, 648–660.
Williams, R.N. (1995) A field investigationof thermal comfort, environmentalsatisfaction and perceived control levels in
UK office buildings. In: Maroni, M. (ed.)Proceedings of Healthy Buildings �95, Vol.3, Milan, 1181–1186.
de Wit, M.S. (2001) Uncertainty in Predic-tions of Thermal Comfort in Buildings,Delft, Technische Universiteit Delft(Dissertation).
Wyon, D.P. (1975) The mental performanceof subjects clothed for comfort of twodifferent temperatures, Ergonomics, 18,359–374.
Wyon, D.P. (1994) Assessment of humanthermal requirements in the thermalcomfort region. In: Oseland, N.A. andHumphreys, M.A. (eds) ProceedingsThermal Comfort, Past, Present andFuture, Garston, 144–156.
Yamtraipat, N., Khedari, J. and Hirunlabh,J. (2005) Thermal comfort standardsfor air conditioned buildings in hotand humid Thailand considering addi-tional factors of acclimatization andeducation level, Solar Energy, 78, 504–517.
Yoon, D.W., Sohn, J.Y. and Cho, K.H.(1999) The comparison on the thermalcomfort sensation between the results ofquestionnaire survey and the calculationof the PMV values. In: Raw, G., Aizle-wood, C. and Warren, P. (eds) Proceed-ings of Indoor Air �99, Vol. 2, Edinburgh,137–141.
Fanger�s model of thermal comfort
201