fortum corporationapps.fortum.fi/gallery/fortum_interim_report_q1_2015.pdf · fortum corporation ....
TRANSCRIPT

Fortum Corporation Domicile Espoo Business ID 1463611-4
Fortum Corporation Interim Report January–March 2015
29 April 2015

2 (53)
Contents Successful divestment of the Swedish electricity distribution business 3 Fortum’s interim CEO Timo Karttinen 4 Fortum’s Distribution divestment concluded 5 Fortum updated its long-term financial targets 5 IFRS restatement relating to discontinued operations 6 Financial results 6 Financial position and cash flow 7 Market conditions 9 Segment reviews 10 Capital expenditures, divestments and investments in shares 15 Shares and share capital 16 Group personnel 16 Research and development 16 Sustainability 17 Changes in Fortum’s Management 19 Annual General Meeting 2015 19 Outlook 20 Dividend payment 23
Tables to the financial statements bulletin Condensed consolidated income statement 25 Condensed consolidated balance sheet 27 Condensed consolidated statement of changes in total equity 28 Condensed consolidated cash flow statement 29 Change in net debt and key ratios 31 Notes to the condensed consolidated interim financial statements 32 Definition of key figures 49 Market conditions and achieved power prices 51 Production and sales volumes 52 Figures in brackets refer to the comparison period, i.e. the same period last year, unless otherwise stated.

3 (53)
Fortum Corporation Interim Report January−March 2015 29 April 2015 at 9:00 EET
Successful divestment of the Swedish electricity distribution business January−March 2015, continuing operations
• Comparable operating profit EUR 343 (358) million, -4% • Operating profit EUR 350 (366) million, of which EUR 7 (8) million relates to
items affecting comparability and sales gains • Earnings per share EUR 0.33 (0.35), -6%, of which EUR 0.01 (0.01) per share
relates to items affecting comparability and sales gains. EPS for total Fortum including the effect from discontinued operations is 0.40 (2.53), -84%.
• Cash flow from operating activities totalled EUR 516 (405) million, +27% • Sale of Fortum’s electricity distribution business in Sweden concludes the
Distribution divestment process • Distribution business treated as discontinued oprerations according to IFRS 5 • Pekka Lundmark appointed President and CEO; to start in the beginning of
September
Key figures I/15 I/14 2014 LTM Sales, EUR million 1,040 1,208 4,088 3,920 Operating profit, EUR million
continuing operations 350 366 1,296 1,280 discontinued operations 81 1,968 2,132 245 total Fortum 431 2,333 3,428 1,526
Comparable operating profit, EUR million continuing operations 343 358 1,085 1,070 discontinued operations 82 119 266 229 total Fortum 425 477 1,351 1,299
Profit before taxes, EUR million continuing operations 350 374 1,232 1,208 discontinued operations 80 1,968 2,128 240 total Fortum 431 2,341 3,360 1,450
Earnings per share, EUR continuing operations 0.33 0.35 1.22 1.20 discontinued operations 0.07 2.18 2.33 0.22 total Fortum 0.40 2.53 3.55 1.42 Net cash from operating activities, EUR million, continuing operations 516 405 1,406 1,517 Shareholders’ equity per share, EUR 11.73 13.63 12.23 Interest-bearing net debt (at end of period), EUR million 3,714 4,838 4,217 Interest-bearing net debt without Värme financing 3,176 3,765 3,664

4 (53)
Key financial ratios * 2014 LTM Return on capital employed, % 19.5 9.0 Net debt/EBITDA 1.1 1.8 Comparable net debt/EBITDA 2.3 2.1 Comparable net debt/EBITDA without Värme financing 2.0 1.8 * Key figure financial ratios are based on total Fortum, including discontinued operations
Summary of outlook
• Fortum continues to expect the annual electricity demand to grow in the Nordic countries on average by approximately 0.5% in the coming years
• Power and Technology segment's Nordic generation hedges: for the rest of the year 2015, approx. 50% hedged at EUR 41 per MWh; and for 2016, approx. 20% hedged at EUR 37 per MWh
• The run-rate operating profit level (EBIT) for the Russia segment, RUB 18.2 billion, is targeted to be reached during 2015. The euro-denominated result level will be volatile, due to the translation effect
Fortum’s interim CEO Timo Karttinen “Fortum’s market environment remained weak during the first quarter of 2015. Results declined, mainly due to lower electricity prices and warm weather. Comparable operating profit totalled EUR 343 million. Cash flow from operating activities was strong and totalled EUR 516 million. This was mainly due to the positive impact of realised foreign exchange differences and changes in working capital. Looking at the comparable operating profit per segment, Power and Technology’s comparable result was burdened by the low electricity system spot-price levels as well as somewhat lower volumes. Heat, Electricity Sales and Solutions’ results improved mainly due to lower fuel costs. The Russia segment’s comparable result showed improvement due to the new capacity, although the weak rouble, especially at the beginning of the year, clearly had a negative impact on the segment’s euro results. Fortum’s binding agreement to sell the Swedish electricity distribution business, signed during the first quarter, was an important step in the company’s transformation. This concludes the total sale of the Distribution segment. The Swedish deal is to be finalised in the second quarter of this year and is the biggest in Fortum's history. After the finalisation of the sale of Distribution, Fortum will be a producer and supplier with strategic focus on clean energy. The company already has a very strong competitive position, whether measured by emissions-free production volumes, expertise, production structure, flexibility of capacity, cost structure, sustainable operations, or occupational safety. About 2/3 of Fortum’s production and a significant share of our expertise are based on emissions-free hydro and nuclear power. Supplemented by efficient combined heat and power production, Fortum is well prepared for capturing opportunities in Fortum's current areas as well as in wider integrated European markets. We continue to develop Fortum in line with our strategy. Discussions and preparations regarding Fortum’s and Gazprom Energoholding’s possible ownership restructuring of Territorial Generating Company 1 (TGC-1) in Russia continue. We are also pursuing combined heat and power opportunities, and we recently announced that we will build a new multifuel CHP plant in Zabrze, Poland, to be commissioned in 2018.

5 (53)
The divestment of our distribution assets also presented an opportune time to update Fortum’s financial targets so that they better describe the future Fortum. The new targets reflect the new business mix and give relevant guidance on Fortum's view of the company's long-term value creation potential and growth strategy. Finally, I would like to take this opportunity to welcome Fortum’s newly appointed President and CEO Pekka Lundmark, who will join the company at the beginning of September."
Fortum’s Distribution divestment concluded In March 2015, Fortum signed a binding agreement to divest its electricity distribution business in Sweden. The agreement is subject to the necessary regulatory approvals as well as customary closing conditions. The total consideration is approximately SEK 60.6 billion on a debt- and cash-free basis, corresponding to approximately EUR 6.6 billion. Fortum expects to complete the divestment and to book a one-time sales gain of approximately EUR 4.4 billion, corresponding to approximately EUR 5 per share, in its second-quarter 2015 results. The buyer is a consortium comprising Swedish national pension funds Första AP-Fonden (12.5%) and Tredje AP-Fonden (20.0%), the Swedish mutual insurance and pension savings company Folksam (17.5%) and the international infrastructure investor Borealis Infrastructure Management Inc. (50%). The transaction concludes the divestment process of Fortum's Distribution segment. The total consideration from divestments in Finland, Sweden and Norway will be approximately EUR 9.3 billion on a debt- and cash-free basis with approximately EUR 6.3 billion non-taxable sales gain booked during 2014 and 2015. The strategic assessment of the future alternatives of Fortum's electricity distribution business was originally made in 2013.
Fortum updated its long-term financial targets
After the divestment of Distribution, Fortum's business has a somewhat higher risk profile, which will correspondingly require a stronger balance sheet in order to maintain financial flexibility. The financial targets continue to reflect the long-term business nature of the company and give relevant guidance on Fortum's view of the company's long-term value creation potential and growth strategy. The updated long-term financial targets are: Return on capital employed (ROCE) 12% and comparable net debt/EBITDA around 2.5 times. The previous financial targets were: ROCE 12%, comparable net debt/EBITDA around 3 and return on shareholders' equity (ROE) 14%.

6 (53)
IFRS restatement relating to discontinued operations After the divestment of the Swedish distribution business, Fortum will not have any distribution operations; therefore, as of the first-quarter 2015 interim financial statements, the Distribution segment will be treated as discontinued operations according to IFRS 5 "Non-current assets held for sale and Discontinued operations". The IFRS standard requires restatement of the 2014 comparative period information for the income statement and cash flow. The restatement is done to the income statement including other comprehensive income, cash flow statement and certain key ratios. In the segment information, the Distribution segment is reclassified as discontinued operations. Reclassification of discontinued operations does not impact the balance sheet. The assets and liabilities of the Swedish distribution business are classified as assets held for sale in the balance sheet of 31 March 2015. Financial results discussed in this interim release are for the continuing operations of Fortum Group. The Distribution segment has been reclassified as Discontinued operations in the tables including the comparative period information. Restated information for the interim periods of 2014 can be found in the stock exchange release published on 15 April 2015.
Financial results January–March 2015 In the first quarter of 2015, sales were EUR 1,040 (1,208) million. Comparable operating profit totalled EUR 343 (358) million and the reported operating profit totalled EUR 350 (366) million. Fortum's operating profit for the period was affected by non-recurring items. Sales gains, IFRS accounting treatment (IAS 39) of derivatives, mainly used for hedging Fortum's power production, as well as nuclear fund adjustments amounted to EUR 7 (8) million (Note 4). Sales by segment EUR million I/15 I/14 2014 LTM Power and Technology 500 586 2,156 2,070 Heat, Electricity Sales and Solutions 406 446 1,332 1,292 Russia 263 333 1,055 985 Other 29 14 58 73 Netting of Nord Pool transactions -119 -133 -422 -408 Eliminations -38 -37 -91 -92 Total continuing operations 1,040 1,208 4,088 3,920 Discontinued operations 180 300 751 631 Eliminations -20 -35 -89 -74 Total Fortum 1,200 1,473 4,751 4,478

7 (53)
Comparable operating profit by segment EUR million I/15 I/14 2014 LTM Power and Technology 203 251 877 829 Heat, Electricity Sales and Solutions 58 48 104 114 Russia 97 73 161 185 Other -15 -14 -57 -58 Total continuing operations 343 358 1,085 1,070 Discontinued operations 82 119 266 229 Total Fortum 425 477 1,351 1,299 Operating profit by segment EUR million I/15 I/14 2014 LTM Power and Technology 203 262 855 796 Heat, Electricity Sales and Solutions 64 45 337 356 Russia 98 73 161 186 Other -15 -14 -58 -59 Total continuing operations 350 366 1,296 1,280 Discontinued operations 81 1,968 2,132 245 Total Fortum 431 2,333 3,428 1,526 The share of profit from associates was EUR 58 (69) million, of which Fortum Värme represents EUR 38 (44) million. The share of profit from Hafslund and TGC-1 are based on the companies' published fourth-quarter 2014 interim reports (Note 13). The net financial expenses were EUR -57 (-62) million. Net financial expenses include changes in the fair value of financial instruments of EUR -8 (-3) million. Profit before taxes was EUR 350 (374) million. Taxes for the period totalled EUR -55 (-62) million. The tax rate according to the income statement was 15.8% (16.6%). The tax rate, excluding the impact of the share of profit from associated companies and joint ventures as well as non-taxable capital gains, was 19.0% (20.5%). The profit for the period was EUR 295 (312) million. Earnings per share for continuing operations were EUR 0.33 (0.35), of which EUR 0.01 (0.01) per share relates to items affecting comparability. Earnings per share for total Fortum, including the effect from discontinued operations were EUR 0.40 (2.53). Earnings per share for total Fortum in 2014 were impacted by EUR 2.08 per share from the sale of the Finnish electricity distribution business.
Financial position and cash flow Cash flow In the first quarter of 2015, total net cash from operating activities increased by EUR 111 million to EUR 516 (405) million, mainly due to the EUR 94 million positive impact of realised foreign exchange differences and of EUR 74 million changes in working capital, which were partly offset by lower EBITDA. Realised foreign exchange gains and losses of EUR 168 (76) million were related to the rollover of foreign exchange contract hedging loans to Fortum's Swedish and Russian subsidiaries. Capital expenditures decreased by EUR 22 million to EUR 101 (123) million. Total net cash used in investing activities was EUR -46 (-74) million. Cash flow before financing activities, i.e. financing, decreased by EUR 2,439 million to EUR 514 (2,953) million including the net impact of

8 (53)
discontinued operations of EUR -2,578 million, mainly arising from the divestment of the Finnish distribution business during the first quarter of 2014.
Assets and capital employed Total assets increased by EUR 807 million to EUR 22,182 (21,375 at year-end 2014) million. Translation differences increased intangible assets, property, plant and equipment as well as participation in associates and joint ventures by EUR 535 million. Liquid funds increased by EUR 502 million to EUR 3,268 (2,766 at year-end 2014) million. Presenting the Swedish distribution business as Assets held for sale impacted the structure of the balance sheet as all assets and liabilities belonging to the operations were presented separately on one line both in assets and liabilities (Note7). Capital employed for total Fortum was EUR 17,482 (17,918 at year-end 2014) million, a decrease of EUR 436 million.
Equity Total equity was EUR 10,501 (10,935 at year-end 2014) million, of which equity attributable to owners of the parent company totalled EUR 10,421 (10,864 at year-end 2014) million. The decrease in equity attributable to owners of the parent company totalled EUR 443 million and was mainly from the dividend for 2014, EUR -1,155 million, offset by the net profit of EUR 354 million for the period and translation differences of EUR 386 million.
Financing Net debt decreased during the first quarter of 2015 by EUR 503 million to EUR 3,714 (4,217 at year-end 2014) million. Net debt without Värme financing was EUR 3,176 million (3,664 at year-end 2014). At the end of March 2015, the Group’s liquid funds totalled EUR 3,268 (2,766 at year-end 2014) million. Liquid funds include cash and bank deposits held by OAO Fortum amounting to EUR 200 (134 at year-end 2014) million. In addition to liquid funds, Fortum had access to approximately EUR 2.2 billion of undrawn committed credit facilities. The net financial expenses in the first quarter of 2015 were EUR -57 (-62) million. Net financial expenses include changes in the fair value of financial instruments of EUR -8 (-3) million. Fortum Corporation's long-term credit rating with both S&P and Fitch is A- (negative outlook). In March, S&P put Fortum on Credit Watch negative.
Key figures For the last twelve months, net debt to EBITDA was 1.8 (1.1 at year-end 2014) and comparable net debt to EBITDA 2.1 (2.3). Fortum is currently financing Fortum Värme, and these loans, EUR 538 (553) million, are presented as interest-bearing loan receivables in Fortum’s balance sheet. However, the aim is to refinance the loans during 2015. If these loans are deducted from the net debt, the last-twelve-months comparable net debt to EBITDA is 1.8 (2.0). Gearing was 35% (39%) and the equity-to-assets ratio 47% (51%). Equity per share was EUR 11.73 (12.23). Return on capital employed totalled 9.0% (19.5%).

9 (53)
Market conditions Nordic countries According to preliminary statistics, electricity consumption in the Nordic countries was 110 (110) terawatt-hours (TWh) during the first quarter of 2015. In the beginning of the year, the temperature in the Nordic countries was 2.6 degrees above normal, and 0.2 degrees above the exceptionally mild first quarter of 2014. Both industrial and non-industrial consumption were nearly unchanged from the year-ago period. At the beginning of 2015, the Nordic water reservoirs were at 80 TWh, 3 TWh below the long-term average and 3 TWh lower than a year earlier. By the beginning of the second quarter, the reservoirs were 1 TWh above the long-term average, but 3 TWh lower than a year before. Precipitation during the first quarter was 9 TWh above average and 8 TWh above last year’s level. In the first quarter of 2015, the average system spot price of electricity in Nord Pool was EUR 28.1 (30.2) per megawatt-hour (MWh). The decline was driven by decreased cost of coal condense (and high precipitation) which typically is the benchmark price in the Nordic market. Prices were also affected by high wind power generation volumes. The intense precipitation early in the quarter caused price volatility. High net exports continued, but also imports from Russia increased. The average area price in Finland was EUR 32.1 (35.2) per MWh, and in Sweden SE3 (Stockholm) EUR 28.6 (30.0) per MWh. The difference in area prices compared to the spot price was mainly due to the fact that Finland continued exporting power to Estonia, while high Swedish hydropower volumes and good availability of the Swedish nuclear power plants kept Swedish area prices close to the system level. In Germany, the average spot price during the first quarter of 2015 was EUR 32.1 (33.5) per MWh. The market price of CO2 emission allowances (EUA) was at approximately EUR 7 per tonne at the beginning of the year as well as at the end of March 2015. Prices were, however, volatile during the quarter, following newsflows on the market stability reserve (MSR). Dialogue on MSR and its potential implementation will continue at least over the current quarter.
Russia Fortum operates in the Urals and Western Siberia in the Tyumen and Khanty-Mansiysk area, where industrial production is dominated by the oil and gas industries, and in the Chelyabinsk area, which is dominated by the metal industry. According to preliminary statistics, Russia consumed 276 (277) TWh of electricity during the first quarter of 2015. The corresponding figure in Fortum’s operating area in the First price zone (European and Urals part of Russia) was 211 (211) TWh. In the first quarter of 2015, the average electricity spot price, excluding capacity price, increased by 1% to RUB (Russian rouble) 1,122 (1,116) per MWh in the First price zone. More detailed information about the market fundamentals is included in the tables at the end of the report (page 51).
European business environment and carbon market Energy Union The EU Commission published a policy Communication on the EU Energy Union in February. Although security of supply concerns have been the main driver for the Energy Union initiative, the

10 (53)
Commission is expected to utilise the momentum to strive for a better coordinated and more harmonised energy policy for Europe with a high focus on completion of the internal energy market. The first concrete proposals can be expected during the second half of 2015. EU power market development In line with the Energy Union Communication, the Commission has started to prepare a document on the development of the current wholesale power market design. Developing a reference model for capacity mechanisms will be one of the key issues. The Commission has indicated to start investigating the compatibility of national capacity mechanisms with EU legislation. The UK capacity mechanism is the only one approved by the Commission, so far. EU emissions trading reform The proposal on the market stability reserve (MSR) of the EU emissions trading system is being negotiated in the trilogue between the European Parliament, the Council and the Commission. The adoption of the legislation is expected during the first half of 2015. The MSR will be followed by the Comission’s proposal for the revision of the Emissions Trading Directive. Heating and cooling strategy A conference for drafting a Heating and Cooling Strategy for Europe was held in February. The Commission is addressing the sector, due to its large share of final energy consumption and the big potential associated with it in terms of efficiency improvements and emissions reductions, thereby contributing to the EU energy and climate policy targets. Fortum hopes the strategy will promote market-based developments, competition and customer choice in the heating and cooling sectors. The strategy proposal is expected by the end of 2015.
Segment reviews Power and Technology Power and Technology consists of Fortum's hydro, nuclear and thermal power generation, Power Solutions with expert services, portfolio management and trading, as well as technology and R&D functions. The segment incorporates two divisions: the Hydro Power and Technology Division and the Nuclear and Thermal Power Division. EUR million I/15 I/14 2014 LTM Sales 500 586 2,156 2,070 - power sales 484 546 2,026 1,964 of which Nordic power sales* 453 500 1,845 1,798 - other sales 16 40 130 106 Operating profit 203 262 855 796 Comparable operating profit 203 251 877 829 Comparable EBITDA 232 282 998 948 Net assets (at period-end) 6,019 6,276 6,001 Return on net assets, % 13.6 12.9 Comparable return on net assets, %
14.2 13.6
Capital expenditure and gross investments in shares 28 35
198 191
Number of employees 1,350 1,672 1,639

11 (53)
Power generation by source, TWh I/15 I/14
2014 LTM
Hydro and wind power, Nordic 6.2 6.4 22.4 22.2 Nuclear power, Nordic 6.3 6.6 23.8 23.5 Thermal power, Nordic 0.1 0.2 0.9 0.8 Total in the Nordic countries 12.6 13.2 47.1 46.5 Thermal power in other countries 0.0 0.3 0.7 0.4 Total 12.6 13.5 47.9 47.0 Nordic sales volumes, TWh I/15 I/14 2014 LTM Nordic sales volume 13.2 13.6 48.6 48.2 of which Nordic power sales volume* 12.0 12.6 44.6 44.0 * The Nordic power sales income and volume does not include thermal generation, market price-related purchases or minorities (i.e. Meri-Pori, Inkoo and imports from Russia). Sales price, EUR/MWh I/15 I/14 2014 LTM Power and Technology's Nordic power price** 37.7 39.7 41.4 40.8 ** Power and Technology's Nordic power price does not include sales income from thermal generation, market price-related purchases or minorities (i.e. Meri-Pori, Inkoo and imports from Russia). January–March 2015 In the first quarter of 2015, the Power and Technology segment's comparable operating profit was EUR 203 (251) million, i.e. EUR 48 million lower than in the corresponding period in 2014. The achieved power price was lower than in the corresponding period in 2014. In addition, hydro volumes were lower due to later spring floods than in 2014. Nuclear volumes were impacted by several small unplanned outages in Fortum’s co-owned nuclear power plants. Operating profit, EUR 203 (262) million, was affected by sales gains totalling EUR 3 (1) million and by the IFRS accounting treatment (IAS 39) of derivatives, mainly used for hedging Fortum's power production, and by nuclear fund adjustments amounting to EUR -3 (10) million (Note 4). Power and Technology's achieved Nordic power price was EUR 37.7 (39.7) per MWh, EUR 2.0 per MWh lower than in the corresponding period in 2014. The system and all area prices were lower during the first quarter of 2015 compared to the same period in 2014. The average system spot price of electricity in Nord Pool was EUR 28.1 (30.2) per MWh. The average area price in Finland was EUR 32.1 (35.2) per MWh and in Sweden SE3 (Stockholm) EUR 28.6 (30.0) per MWh. The segment's total power generation in the Nordic countries was 12.6 (13.2) TWh. Thermal production totalled 0.1 (0.2) TWh. CO2-free production amounted to 99% (96%).

12 (53)
Heat, Electricity Sales and Solutions Heat, Electricity Sales and Solutions consists of combined heat and power (CHP) production as well as heat and electricity sales and development of customer-oriented solutions. The business operations are located in the Nordics, the Baltic countries, Poland and India. The segment also includes Fortum’s 50% holding in Fortum Värme, which is a joint venture and is accounted for using the equity method. EUR million I/15 I/14 2014 LTM Sales 406 446 1,332 1,292 - heat sales 161 164 430 427 - power sales 230 257 783 756 - other sales 15 25 119 109 Operating profit 64 45 337 356 Comparable operating profit 58 48 104 114 of which Electricity Sales 12 9 48 51 Comparable EBITDA 82 74 204 212 Net assets (at period-end) 2,164 2,365 2,112 Return on net assets, % 19.1 19.6 Comparable return on net assets, %
8.7 8.6
Capital expenditure and gross investments in shares 12 13
124 123
Number of employees 1,434 1,960 1,807 January–March 2015 In the first quarter of 2015, heat sales volumes of the Heat, Electricity Sales and Solutions segment amounted to 3.2 (3.3) TWh. During the same period, power sales volumes from CHP production totalled 0.9 (1.0) TWh. Comparable operating profit was EUR 58 (48) million. The main drivers for the improvement were lower fuel costs and higher heat prices during the period. In retail electricity the customer base continued to grow and the sales margin improved. Operating profit totalled EUR 64 (45) million and was affected by sales gains totalling EUR 3 (1) million and an IFRS accounting treatment (IAS 39) (Note 4). Heat sales by country, TWh I/15 I/14 2014 LTM Finland 1.2 1.2 3.2 3.2 Poland 1.5 1.5 3.4 3.4 Other countries 0.5 0.6 1.3 1.2 Total 3.2 3.3 7.9 7.8 Power sales, TWh I/15 I/14 2014 LTM CHP 0.9 1.0 2.8 2.7 Electricity Sales 4.4 4.4 13.8 13.8 Total 5.2 5.4 16.5 16.3

13 (53)
Russia The Russia segment consists of power and heat generation and sales in Russia. The segment also includes Fortum’s over 29% holding in TGC-1, which is an associated company and is accounted for using the equity method. EUR million I/15 I/14 2014 LTM Sales 263 333 1,055 985 - power sales 183 218 758 723 - heat sales 80 112 285 253 - other sales 0 3 11 8 Operating profit 98 73 161 186 Comparable operating profit 97 73 161 185 Comparable EBITDA 94 113 304 285 Net assets (at period-end) 3,104 3,619 2,597 Return on net assets, % 5.6 6.5 Comparable return on net assets, %
5.6 6.5
Capital expenditure and gross investments in shares 45 59
367 353
Number of employees 4,198 4,169 4,213 The liberalisation of the Russian wholesale power market was completed in the beginning of 2011. However, all generating companies continue to sell a part of their electricity and capacity – an amount equalling the consumption of households and a few special groups of consumers – under regulated prices. During January-March 2015, Fortum sold approximately 83% of its power production in Russia at a liberalised electricity price. The capacity selection for generation built prior to 2008 (CCS – “old capacity”) for 2015 was held in September 2014. All of Fortum’s capacity was allowed to participate in the selection for 2015, and the majority of Fortum’s plants were also selected. The volume of Fortum’s installed capacity not selected in the auction totalled 195 MW (approximately 7% of Fortum’s total old capacity in Russia) for which Fortum has obtained forced mode status, i.e. will get payments for the capacity. The generation capacity built after 2007 under the Russian Government's capacity supply agreements (CSA – “new capacity”) receives guaranteed payments for a period of 10 years. The period and the prices for capacity under CSA were defined to ensure a sufficient return on investments. At the time of the acquisition in 2008, Fortum made a provision, as penalty clauses are included in the CSA agreement in case of possible delays. If the new capacity is delayed or if the agreed major terms of the capacity supply agreement are not otherwise fulfilled, possible penalties can be claimed. The effect of changes in the timing of commissioning of new units is assessed at each balance sheet date and the provision is changed accordingly (Note 17). Received capacity payments differ depending on the age, location, type and size of the plant as well as seasonality and availability. The CSA payments can also vary somewhat annually because they are linked to the Russian Government long-term bonds with 8 to 10 years maturity. In addition, the regulator will review the guaranteed CSA payments by re-examining earnings from the electricity-only market three and six years after the commissioning of a unit and could revise the CSA payments accordingly. In February 2015, the System Administrator of the wholesale market published data on the weighted average cost of capital (WACC) and the consumer price index (CPI) for the year of 2014, which is used to calculate the sales price on CSA in 2015. The CSA payments were revised upwards accordingly to reflect the higher bond rates.

14 (53)
January–March 2015 In the first quarter of 2015, the Russia segment's power sales volumes amounted to 8.4 (7.1) TWh. Heat sales totalled 9.5 (9.7) TWh during the same period. The Russia segment’s comparable operating profit was EUR 97 (73) million. The positive effect from the new units receiving CSA payments amounted to approximately EUR 85 (49) million, including EUR 29 (0) million of CSA provision release and EUR -41 (-9) million due to the weaker rouble. Lower heat volumes, due to warm weather, and bad debt provisions for heat trade receivables impacted the result negatively. Overall, the weakened Russian rouble affected the Russian result negatively by EUR 47 (14) million. Operating profit was EUR 98 (73) million. The third unit of Fortum's Nyagan power plant started commercial operation at the end of 2014 and started receiving capacity payments under the Russian Government's capacity supply agreement for 418 megawatts (MW) as of 1 January 2015. Key electricity, capacity and gas prices for Fortum Russia I/15 I/14 2014 LTM Electricity spot price (market price), Urals hub, RUB/MWh 1,051 1,018 1,089 1,097 Average regulated gas price, Urals region, RUB/1000 m3 3,362 3,362 3,362 3,362 Average capacity price for CCS “old capacity”, tRUB/MW/month* 163 183 167 162 Average capacity price for CSA “new capacity”, tRUB/MW/month* 715 609
552 589
Average capacity price, tRUB/MW/month 394 335 304 321 Achieved power price for OAO Fortum, EUR/MWh 26.0 30.7 30.4 29.0 *Capacity prices paid for the capacity volumes, excluding unplanned outages, repairs and own consumption Discontinued operations (Distribution) EUR million I/15 I/14 2014 LTM Sales 180 300 751 631 - distribution network transmission 152 241 590 501 - regional network transmission 24 46 120 98 - other sales 4 14 41 31 Operating profit 81 1,968 2,132 245 Comparable operating profit 82 119 266 229 Comparable EBITDA 112 171 416 357 Net assets (at period-end) 2,634 2,872 2,615 Return on net assets, % 73.6 9.1 Comparable return on net assets, % 9.3 8.5 Capital expenditure and gross investments in shares 20 25
147 142
Number of employees 401 466 390 The table above includes January-March 2014 results for the Finnish Distribution business, January-May 2014 results for the Norwegian Distribution business and full-year 2014 results for the Swedish Distribution business.

15 (53)
January–March 2015 In March 2015, Fortum signed a binding agreement to divest its electricity distribution business in Sweden. The transaction is expected to be completed during the second quarter of 2015. In the first quarter of 2015, the Swedish electricity distribution and regional network transmission volume totalled 4.2 (4.2) TWh and 3.7 (3.8) TWh, respectively. The comparable operating profit from the discontinued operations was EUR 82 (119) million, and operating profit totalled EUR 81 (1,968) million.
Capital expenditures, divestments and investments in shares Capital expenditures and investments in shares, for continuing operations, totalled EUR 87 (111) million in the first quarter of 2015. Investments, excluding acquisitions, were EUR 85 (110) million (Note 4). Fortum expects to start the supply of power and heat from new power plants and to upgrade existing plants as follows:
Type
Electricity capacity, MW
Heat capacity, MW
Supply starts
Power and Technology Hydro refurbishment Hydro 12 2015 Loviisa 1 refurbishment Nuclear 6 2H 2015 Russia* Chelyabinsk 1 Gas (CCGT) 248 175 2H 2015 Chelyabinsk 2 Gas (CCGT) 248 175 2H 2015 * Start of commercial operation.
Power and Technology Through its interest in Teollisuuden Voima Oyj (TVO), Fortum is participating in the building of Olkiluoto 3 (OL3), a 1,600-MW nuclear power plant unit in Finland. The start of commercial electricity production of the plant is expected to take place in late 2018, according to the plant supplier AREVA-Siemens Consortium. TVO has withdrawn a EUR 200 million shareholder loan from the total EUR 600 million commitment. Fortum's share of the EUR 200 million withdrawal is approximately EUR 50 million. Fortum’s remaining commitment for OL3 is EUR 100 million (Note 14).
Heat, Electricity Sales and Solutions Through Fortum’s interests in Fortum Värme, Fortum's joint venture with the City of Stockholm, the company is investing in a new biofuel CHP plant in Värtan, Stockholm, Sweden. The new CHP plant will replace some of the existing heat production, and it is planned to be commissioned in 2016. The new plant will have a production capacity of 280 MW heat and 130 MW electricity. In addition, Fortum is participating in its joint venture Turun Seudun Energiantuotanto Oy’s (TSE) new CHP plant in Naantali, Finland, which will replace the old existing plant. The plan is to

16 (53)
commission the new power plant in 2017. The plant’s production capacity will be 244 MW heat and 142 MW electricity. In March 2015, Fortum decided to build a new multifuel CHP plant in Zabrze, Poland. The total value of the investment is approximately EUR 200 million. The new plant is planned to start commercial operation by the end of 2018, providing district heating to some 70,000 households in Zabrze and Bytom.
Shares and share capital Fortum Corporation is listed on the Nasdaq Helsinki. During the first quarter of 2015, a total of 133.8 (130.6) million Fortum Corporation shares, totalling EUR 2,607 million, were traded. The highest quotation of Fortum Corporation shares during the reporting period was EUR 21.59, the lowest EUR 16.83, and the volume-weighted average EUR 19.47. The closing quotation on the last trading day of the first quarter was EUR 19.56 (16.50). Fortum's market capitalisation, calculated using the closing quotation of the last trading day of the review period, was approximately EUR 17,376 million. In addition to the Nasdaq Helsinki, Fortum shares were traded on several alternative market places, for example Boat, BATS Chi-X and Turquoise, and on the OTC market. During the first quarter of 2015, approximately 60% of Fortum's shares were traded on markets other than the Nasdaq Helsinki. On 31 March 2015, Fortum Corporation’s share capital was EUR 3,046,185,953 and the total number of registered shares was 888,367,045. Fortum Corporation did not own its own shares. The number of registered shareholders was 113,231. The Finnish State's holding in Fortum was 50.8%, and the proportion of nominee registrations and direct foreign shareholders was 29.5% at the end of the review period. Fortum Corporation received on 25 March 2015 an announcement under Chapter 9 Section 5 of the Securities Markets Act, according to which Capital Group Companies Inc's ("CGC") holding in Fortum was below the threshold of 5 per cent on 18 March 2015. The Board of Directors has no unused authorisations from the Annual General Meeting of Shareholders to issue convertible loans or bonds with warrants or to issue new shares.
Group personnel Fortum’s operations are mainly based in the Nordic countries, Russia and the Baltic Rim area. The total number of employees at the end of March was 8,378 (8,592 at the end of 2014). At the end of March 2015, Power and Technology had 1,350 (1,639) employees; Heat, Electricity Sales and Solutions 1,434 (1,807); Russia 4,198 (4,213); Other 995 (543); and Discontinued operations 401 (390). In the beginning of 2015, Fortum centralised the IT and customer service functions. As a result of the centralisation a total of 464 employees transferred from Heat, Electricity Sales and Solutions and Power and Technology segments to Other.
17 (53)
Research and development Sustainability is at the core of Fortum’s strategy and, alongside Fortum’s current businesses, the company is carefully exploring and developing new sources of growth within renewable energy production. Fortum is particularly interested in developing environmentally-benign energy solutions (CO2-free) and new CHP concepts, such as pyrolysis. The company is also researching and developing its solar energy competences and is also involved in wave power pilot projects. In addition, Fortum is developing new customer solutions in electricity and heat for better user experience and demand-response services. In January, Fortum launched a greenfield solar PV plant Kapeli, in Madhya Pradesh, India. This solar plant is Fortum's second solar energy project in the country. The 10-MW solar plant will offset more than 18,000 tonnes of CO2 emissions equivalent annually. The Group reports its R&D expenditure on a yearly basis. In 2014, Fortum’s R&D expenditure was EUR 41 (49) million or 0.9% (0.9%) of sales.
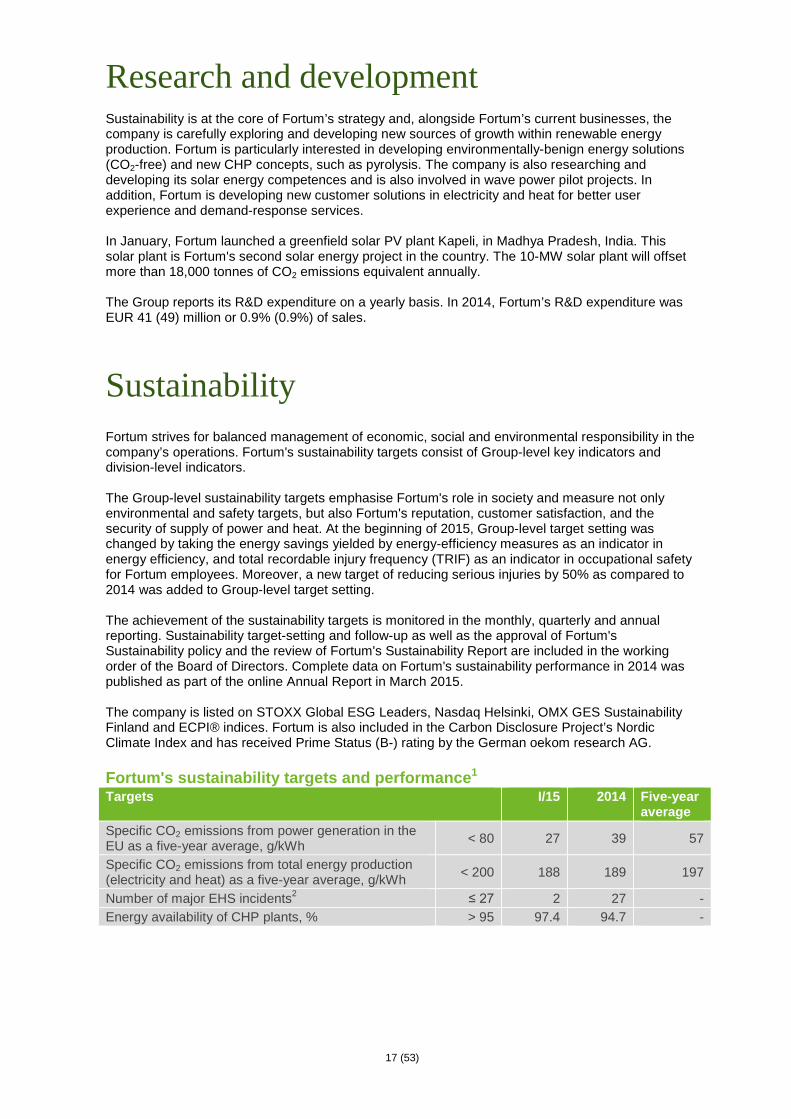
Sustainability Fortum strives for balanced management of economic, social and environmental responsibility in the company’s operations. Fortum's sustainability targets consist of Group-level key indicators and division-level indicators. The Group-level sustainability targets emphasise Fortum's role in society and measure not only environmental and safety targets, but also Fortum's reputation, customer satisfaction, and the security of supply of power and heat. At the beginning of 2015, Group-level target setting was changed by taking the energy savings yielded by energy-efficiency measures as an indicator in energy efficiency, and total recordable injury frequency (TRIF) as an indicator in occupational safety for Fortum employees. Moreover, a new target of reducing serious injuries by 50% as compared to 2014 was added to Group-level target setting. The achievement of the sustainability targets is monitored in the monthly, quarterly and annual reporting. Sustainability target-setting and follow-up as well as the approval of Fortum's Sustainability policy and the review of Fortum's Sustainability Report are included in the working order of the Board of Directors. Complete data on Fortum's sustainability performance in 2014 was published as part of the online Annual Report in March 2015. The company is listed on STOXX Global ESG Leaders, Nasdaq Helsinki, OMX GES Sustainability Finland and ECPI® indices. Fortum is also included in the Carbon Disclosure Project’s Nordic Climate Index and has received Prime Status (B-) rating by the German oekom research AG. Fortum's sustainability targets and performance1 Targets I/15 2014 Five-year
average Specific CO2 emissions from power generation in the EU as a five-year average, g/kWh < 80 27 39 57
Specific CO2 emissions from total energy production (electricity and heat) as a five-year average, g/kWh < 200 188 189 197
Number of major EHS incidents2 ≤ 27 2 27 - Energy availability of CHP plants, % > 95 97.4 94.7 -

18 (53)
Total recordable injury frequency (TRIF) for own personnel 2 ≤ 2.5 2.0 2.0 -
Lost workday injury frequency (LWIF) for contractors 2 ≤ 3.2 2.6 3.2 - Number of serious accidents2 ≤ 8 5 15 1 Targets for reputation, customer satisfaction and energy efficiency are monitored annually. 2 Includes the impact from the Distribution divestment Economic responsibility In the area of economic responsibility, the focus is on competitiveness, performance excellence and market-driven production. The aim is to create long-term economic value and enable profitable growth and added value for shareholders, customers, employees, suppliers, and other key stakeholders in the company's operating areas. Fortum's goal is to achieve excellent financial performance in strategically selected core areas through strong competence and responsible ways of operating. Fortum updated its long-term financial targets in March 2015, and measures financial success with return on capital employed (target: 12%) and capital structure (target: net debt/EBITDA around 2.5). In addition, as of January 1, 2014, Fortum has used the applicable Global Reporting Initiative (GRI) G4 indicators for reporting economic responsibility.
Environmental responsibility Fortum's environmental responsibility emphasises mitigation of climate change, efficient use of resources as well as management of the impacts of its energy production and supply chain. The company’s know-how in carbon-free hydro and nuclear power production and in energy-efficient CHP production is highlighted in environmental responsibility. Fortum’s Group-level environmental targets are related to CO2 emissions, energy efficiency as well as major environmental, health and safety (EHS) incidents. At the end of March 2015, ISO 14001 certification covered 100% of Fortum's power and heat production and distribution operations worldwide. Fortum’s climate targets over the next five years are: specific CO2 emissions from power generation in the EU below 80 grams per kilowatt-hour (g/kWh) and total specific CO2 emissions from both electricity and heat production in all countries below 200 g/kWh. Both targets are calculated as a five-year average. At the end of March 2015, the five-year average for specific CO2 emissions from power generation in the EU was at 57 (59) g/kWh and the total specific CO2 emissions from energy production was at 197(197) g/kWh, both better than the target level. Fortum's total CO2 emissions in the first quarter of 2015 amounted to 6.0 (6.0) million tonnes (Mt), of which 0.8 (1.1) Mt were within the EU's emissions trading scheme (ETS). Since 2013, electricity production has not received free allowances in the EU ETS. The amount of free allowances for heat will gradually decrease during 2013-2020 as well. Fortum's free allowances in 2014 totalled 1.4 Mt and the estimate for 2015 is 1.3 Mt.
By 2020, Fortum's target is to improve energy efficiency of the existing power plants and heat distribution networks by over 1,400 GWh annually, as compared with 2012. At the end of 2014, about 680 GWh of this target was achieved. In January 2015, a heat pump facility was inaugurated at the Suomenoja power plant in Finland. Heat pumps will transfer heat energy from the waste waters of the city of Espoo to the district heat network in Espoo. The annual energy savings is an estimated to be 200 GWh. In India, Fortum inaugurated the Kapeli solar power plant, which will produce about 20 GWh of renewable power annually.
Fortum’s total CO2 emissions (million tonnes, Mt)
I/15 I/14 2014 LTM
Total emissions 6.0 6.0 20.2 20.4 Emissions subject to ETS 0.8 1.1 3.6 3.3 Free emissions allocation 1.4 Emissions in Russia 5.2 4.9 16.6 17.0

19 (53)
Fortum's target is for fewer than 27 major EHS incidents annually. In January-March 2015, 2 (10) major EHS incidents took place in Fortum's operations, one explosion and one leak of district heat water into the environment. These incidents did not have significant environmental or financial impacts.
Social responsibility In the area of social responsibility, Fortum's innovations and the secure supply of low-CO2 power and heat support the development of the society and increase well-being. Good corporate citizenship, reliable energy supply and ensuring a safe working environment for all employees and contractors at Fortum sites are emphasised. At the end of March 2015, OHSAS 18001 certification covered 75% of Fortum's power and heat production and distribution operations worldwide. In the first quarter of 2015, the average energy availability of Fortum's CHP plants was 97% (98%), which is clearly above the annual target level of 95%. At the end of March 2015, the total recordable injury frequency (TRIF) for Fortum employees was 2.0 (1.3). This complies with the Group-level frequency target of less than 2.5 per million working hours for own personnel. The lost-workday injury frequency for contractors was 2.6 (3.9). The number of serious occupational accidents was 5, which is still too many. Implementation of the agreed actions to improve contractor safety continues with a specific focus on construction projects. Fortum's categorical target is to avoid serious injuries. Fortum expects its business partners to act responsibly and to comply with the Fortum Code of Conduct and the Fortum Supplier Code of Conduct. Fortum assesses the performance of its business partners with supplier pre-selection and supplier audits. The target is to audit 15 suppliers based on risk and materiality assessments during 2015.
Changes in Fortum’s Management
Tapio Kuula, President and CEO, retired starting 1 February 2015. Tapio Kuula had been the President and CEO of Fortum Corporation since 2009. On 2 April 2015, Pekka Lundmark, M.Sc. (Eng.), 51, was appointed President and CEO of Fortum Corporation. He is transferring from Konecranes Plc, where he has been President and CEO for the past ten years. Mr. Lundmark will start at Fortum at the beginning of September 2015. Until the commencement of Mr. Lundmark as President and CEO, CFO Timo Karttinen will also act as interim President and CEO of Fortum.
Annual General Meeting 2015 Fortum Corporation’s Annual General Meeting, which was held in Helsinki on 31 March 2015, adopted the financial statements of the parent company and the Group for the financial period 1 January 31 December 2014 and discharged the members of Fortum's Board of Directors as well as the President and CEO and his deputy from liability for the year 2014. The Annual General Meeting decided to pay a dividend of EUR 1.10 per share and an extra dividend of EUR 0.20 per share, i.e. a total amount of EUR 1.30 per share for the financial year that ended 31 December 2014. The record date for the dividend payment was 2 April 2015, and the dividend payment date was 14 April 2015.

20 (53)
The Annual General Meeting confirmed the number of members in the Board of Directors to be eight. Ms Sari Baldauf was re-elected as Chairman, Mr Kim Ignatius was elected as Deputy Chairman, Ms Minoo Akhtarzand, Mr Heinz-Werner Binzel, Mr Petteri Taalas and Mr Jyrki Talvitie were re-elected as members, and Ms Eva Hamilton and Mr Tapio Kuula were elected as new members. The Annual General Meeting confirmed the remuneration of EUR 75,000 per year to the Chairman, EUR 57,000 per year to the Deputy Chairman and EUR 40,000 per year to each member of the Board, as well as EUR 57,000 per year to the Board member acting as the Chairman of the Audit and Risk Committee if he or she is not at the same time acting as Chairman or Deputy Chairman of the Board. In addition, a EUR 600 meeting fee is paid for Board meetings as well as for committee meetings. The meeting fee is doubled for Board members who live outside Finland in Europe and tripled for members living outside Europe. For Board members living in Finland, the proposed fee for each Board and Board Committee meeting will be doubled for meetings held outside Finland, and tripled for meetings outside Europe. For Board and Committee meetings held as a telephone conference, the proposed fee will be paid as single to all members. No fee will be paid for decisions made without a separate meeting. In addition, Authorised Public Accountant Deloitte & Touche Ltd was re-elected as auditor, and the auditor’s fee is paid pursuant to an invoice approved by the company. After the Annual General Meeting, Fortum’s Board of Directors elected from among its members to the Nomination and Remuneration Committee Sari Baldauf as Chairman and Eva Hamilton, Tapio Kuula, and Petteri Taalas as members. Furthermore, the Board elected to the Audit and Risk Committee Kim Ignatius as Chairman and Minoo Akhtarzand, Heinz-Werner Binzel and Jyrki Talvitie as members. Outlook Key drivers and risks Fortum's financial results are exposed to a number of economic, strategic, political, financial and operational risks. One of the key factors influencing Fortum's business performance is the wholesale price of electricity in the Nordic region. The key drivers behind the wholesale price development in the Nordic region are the supply-demand balance, prices of fuel and CO2 emissions allowances as well as the hydrological situation. The completion of Fortum’s investment programme in Russia is also one key driver to the company’s result growth, due to the increase in production volumes and CSA payments. The continued global economic uncertainty and Europe's sovereign-debt crisis has kept the outlook for economic growth unpredictable. The overall economic uncertainty impacts commodity and CO2 emissions allowance prices, and this could maintain downward pressure on the Nordic wholesale price for electricity. In Fortum's Russian business, the key factors are economic growth, the rouble exchange rate, the regulation around the heat business, and further development of electricity and capacity markets. Operational risks related to the investment projects in the current investment programme are still valid. In all regions, fuel prices and power plant availability also impact profitability. In addition, increased volatility in exchange rates due to financial turbulence could have both translation and transaction effects on Fortum's financials, especially through the Russian rouble (RUB) and Swedish krona (SEK). In the Nordic countries, also the regulatory and fiscal environment for the energy sector has added risks for utility companies.

21 (53)
Nordic market Despite macroeconomic uncertainty, electricity is expected to continue to gain a higher share of the total energy consumption. Fortum continues to expect the annual growth rate in electricity consumption to be on average approximately 0.5%, while the growth rate for the next few years will largely be determined by macroeconomic development in Europe and especially in the Nordic countries. During the first quarter of 2015, the price of European Union emissions allowances (EUA) appreciated, whereas oil and coal prices declined. The price of electricity for the upcoming twelve months declined in the Nordic area as well as in Germany. In late April 2015, the future quotation for coal (ICE Rotterdam) for the rest of 2015 was around USD 58 per tonne, and the price for CO2 emission allowances for 2015 was about EUR 7 per tonne. The electricity forward price in Nasdaq Commodities for the rest of 2015 was around EUR 25 per MWh and for 2016 around EUR 28 per MWh. In Germany, the electricity forward price for the rest of 2015 was around EUR 32 per MWh and for 2016 around EUR 32 per MWh. Nordic water reservoirs were about 1 TWh above the long-term average and 3 TWh below the corresponding level of 2014.
Power and Technology The Power and Technology segment’s Nordic power price typically depends on factors such as hedge ratios, hedge prices, spot prices, availability and utilisation of Fortum's flexible production portfolio, and currency fluctuations. Excluding the potential effects from changes in the power generation mix, a 1 EUR/MWh change in the Power and Technology segment’s Nordic power sales (achieved) price will result in an approximately EUR 45 million change in Fortum's annual comparable operating profit. In addition, the comparable operating profit of the Power and Technology segment will be affected by the possible thermal power generation volumes and its profits. The ongoing, multi-year Swedish nuclear investment programmes are expected to enhance safety, improve long-term availability and increase the capacity of the current nuclear fleet. The implementation of the investment programmes could, however, affect availability. Fortum’s power procurement costs from co-owned nuclear companies are affected by these investment programmes through increased depreciation and finance costs of associated companies. As a result of the nuclear stress tests in the EU, the Swedish nuclear safety authority (SSM) has decided to propose new regulations for Swedish nuclear reactors. The process is ongoing. Fortum emphasises that maintaining a high level of nuclear safety is the highest priority, but considers EU-level harmonisation of nuclear safety requirements to be of utmost importance. In 2014, the Swedish Government decided to increase the nuclear waste fund fee from approximately 0.022 to approximately 0.04 SEK/kWh for the period 2015 to 2017. The estimated impact on Fortum will be approximately EUR 25 million annually. The process to review the Swedish nuclear waste fees is done in a three-year cycle. In March 2015, the Swedish Government decided to re-propose an increase of 17% on the tax on installed nuclear capacity to the spring budget. Provided that Fortum obtained a more than 75% ownership in TGC-1 hydro assets, Fortum would be ready to participate with a minority stake (max. 15%) in the Finnish Fennovoima nuclear power project on the same terms and conditions as the other Finnish companies currently participating in the project. Russia The generation capacity built after 2007 under the Russian Government's capacity supply agreements (CSA – “new capacity”) receives guaranteed capacity payments for a period of 10

22 (53)
years. Prices for capacity under CSA are defined in order to ensure a sufficient return on investments. A regulation draft concerning the prolonging of CSA payments from 10 to 15 years has been submitted to the Russian Government, and the decision is anticipated during 2015. A prolonged period is expected to have a neutral net present value impact. The capacity selection for generation built prior to 2008 (CCS – “old capacity”) for 2015 was held in September 2014. All of Fortum’s capacity was allowed to participate in the selection for 2015, and the majority of Fortum’s plants were also selected. The volume of Fortum’s installed capacity not selected in the auction totalled 195 MW (approximately 7% of Fortum’s total old capacity in Russia) for which Fortum has obtained forced mode status, i.e. will get payments for the capacity. The Russia segment's new capacity will be a key driver for earnings growth in Russia, as it is expected to bring income from new volumes sold and to also receive considerably higher capacity payments than the old capacity. The received capacity payment will differ depending on the age, location, size and type of the plants as well as on seasonality and availability. The return on the new capacity is guaranteed, as regulated in the CSA. CSA payments can vary somewhat annually because they are linked to Russian Government long-term bonds with 8 to 10 years maturity. In addition, the regulator will review the earnings from the electricity-only market three years and six years after the commissioning of a unit and could revise the CSA payments accordingly. In February 2015, the System Administrator of the wholesale market published data on the weighted average cost of capital (WACC) and the consumer price index (CPI) for the year of 2014, which is used to calculate the sales price on CSA in 2015. The CSA payments were revised upwards accordingly to reflect the higher bond rates. The new units in Chelyabinsk are estimated to be delayed by some months. The value of the remaining part of the investment programme calculated at the exchange rates prevailing at the end of March 2015, is estimated to be approximately EUR 0.2 billion, as of April 2015. The Russian result is impacted by seasonal volatility caused by the nature of the heat business, with the first and last quarter being clearly the strongest. The run-rate operating profit (EBIT) level of RUB 18.2 billion in the Russia segment is targeted to be reached during 2015 after finalising the ongoing investment programme. The segment’s profits are mainly impacted by changes in power demand, gas prices and other regulatory development. Fortum is keeping its rouble-denominated target intact, but, mainly due to the translation effect, the euro-denominated result level will be volatile. The income statements of non-euro subsidiaries are translated into the Group reporting currency using the average exchange rates. In 2014, the new heat market model roadmap proposed by the Ministry of Energy was approved by the Russian Government; the reform should give heat market liberalisation by 2020 or, in some specific areas, by 2023. As forecasted by the Russian Ministry of Economic Development, Russian gas price growth is estimated to be 3.5% in 2015. Restructuring of TGC-1 according to strategy in Russia In December 2014, Fortum and Gazprom Energoholding signed a protocol to start a restructuring process of their ownership of TGC-1 in Russia. Discussions and preparations have continued during the first quarter of 2015. TGC-1 owns and operates hydro and thermal power plants in north-western Russia as well as heat distribution networks in St. Petersburg. Currently, Gazprom Energoholding owns 51.8% of the TGC-1 shares and Fortum owns 29.5%. As part of the restructuring, Fortum would establish a company together with Rosatom to own the hydro assets of TGC-1, while Gazprom Energoholding would continue with the heat and thermal power businesses of TGC-1. By utilising its present stake in TGC-1, Fortum would obtain a more than 75% ownership in the hydro power company. Rosatom would have a less than 25% minority holding in the hydro power company. The company would be consolidated to Fortum Group as a subsidiary.

23 (53)
Capital expenditure and divestments Fortum currently expects its capital expenditure in 2015 to be approximately EUR 0.8 billion, excluding potential acquisitions and excluding the Distribution segment. The annual maintenance capital expenditure (excluding the Distribution segment) is estimated to be about EUR 300-350 million in 2015, below the level of depreciation. During 2015, Fortum will gradually decrease its financing to Fortum Värme, the CHP joint venture with the City of Stockholm, operating in the capital area in Sweden. At the end of March 2015, Fortum Värme's remaining interest-bearing liability to Fortum was approximately EUR 0.5 billion.
Taxation The effective corporate income tax rate for Fortum in 2015 is estimated to be 19–21%, excluding the impact of the share of profits of associated companies and joint ventures, non-taxable capital gains and non-recurring items. In August 2014, the Finnish Board of Adjustment of the Large Taxpayers’ Office approved Fortum Corporation's appeal of the income tax assessment imposed on Fortum for the year 2007 in December 2013. The Tax Recipients’ Legal Services Unit appealed the matter (Note 22). In December 2014, Fortum received a non-taxation decision regarding its financing companies for the remaining years 2008−2011, based on the same audit. This is in line with the Supreme Administrative Court’s (SAC) precedent decision. The Tax Recipients' Legal Services Unit has appealed the decisions in February 2015 and the cases for years 2008−2011 are now pending the Board of Adjustment of the Large Taxpayers' Office decision. In line with the 2007 case, Fortum considers the claims unjustifiable. In March 2015, the Swedish Government decided to re-propose an increase of 17% on the tax on installed nuclear capacity to the spring budget. The budget proposal was presented to the Parliament on 15 April, and the voting on the budget will take place at the end of May or in the beginning of June. The implementation is proposed as of 1 August 2015. Fortum's position is that the tax issue should be referred to the upcoming parliamentary energy commission in order to get a broadly established view on how the needs of energy and effect can be resolved. If implemented, the estimated impact on Fortum would be approximately EUR 15 million annually, albeit tax-deductable.
Hedging At the end of March 2015, approximately 50% of Power and Technology's estimated Nordic power sales volume was hedged at approximately EUR 41 per MWh for the rest of the year 2015. The corresponding figures for the calendar year 2016 were approximately 20% at approximately EUR 37 per MWh. The hedge price for Power and Technology segment's Nordic generation excludes hedging of the condensing power margin. In addition, the hedge ratio excludes the financial hedges and physical volume of Fortum's coal-condensing generation as well as the segment’s imports from Russia. The reported hedge ratios may vary significantly, depending on Fortum's actions on the electricity derivatives markets. Hedges are mainly financial contracts, most of them Nasdaq Commodities forwards.

24 (53)
Dividend payment The Annual General Meeting decided to pay a dividend of EUR 1.10 per share and an extra dividend of EUR 0.20 per share, i.e. a total amount of EUR 1.30 per share for the financial year that ended 31 December 2014. The record date for the dividend was 2 April 2015, and the dividend payment date was 14 April 2015. Espoo, 28 April 2015 Fortum Corporation Board of Directors Further information: Timo Karttinen, CFO, Interim President and CEO, tel. +358 10 453 6555 Fortum’s Investor Relations, Sophie Jolly, tel. +358 10 453 2552, Rauno Tiihonen, tel. +358 10 453 6150, Marja Mäkinen +358 10 452 3338 and [email protected] The condensed interim report has been prepared in accordance with International Accounting Standard (IAS) 34, Interim Financial Reporting, as adopted by the EU. The interim financials have not been audited. Publication of financial results in 2015 - January-June on 17 July 2015 at approximately 9:00 EEST - January-September on 22 October 2015 at approximately 9:00 EEST Distribution: Nasdaq Helsinki Key media www.fortum.com More information, including detailed quarterly information, is available on Fortum’s website at www.fortum.com/investors.

Fortum CorporationJanuary-March 2015Interim Financial Statements are unaudited
EUR million Note Q1 2015Q1 2014 restated*
2014 restated*
Last twelve months
Continuing operations:Sales 4 1,040 1,208 4,088 3,920Other income 8 6 60 62Materials and services -433 -551 -1,825 -1,707Employee benefits -83 -97 -369 -355Depreciation, amortisation and impairment charges 4,11,12 -83 -97 -377 -363Other expenses -105 -110 -492 -487Comparable operating profit 4 343 358 1,085 1,070Items affecting comparability 7 8 211 210Operating profit 4 350 366 1,296 1,280Share of profit/loss of associates and joint ventures 4, 13 58 69 146 135
Interest expense -53 -68 -249 -234Interest income 14 19 84 79Fair value gains and losses on financial instruments -8 -3 -5 -10Other financial expenses - net -10 -11 -40 -39
Finance costs - net -57 -62 -210 -205Profit before income tax 350 374 1,232 1,208Income tax expense 9 -55 -62 -143 -136Profit for the period from continuing operations 295 312 1,089 1,072
Discontinued operations:Profit for the period from discontinued operations 6 63 1,943 2,073 193Profit for the period 358 2,255 3,161 1,264
Attributable to:Owners of the parent 354 2,251 3,154 1,257Non-controlling interests 4 4 7 7
358 2,255 3,161 1,264
Earnings per share for profit from total Fortum attributable to the equity owners of the company during the year (in € per share)Basic 0.40 2.53 3.55 1.42Diluted 0.40 2.53 3.55 1.42
Earnings per share for profit from continuing operations attributable to the equity owners of the company during the year (in € per share)Basic 0.33 0.35 1.22 1.20Diluted 0.33 0.35 1.22 1.20
Earnings per share for profit from discontinued operations attributable to the equity owners of the company during the year (in € per share)Basic 0.07 2.18 2.33 0.22Diluted 0.07 2.18 2.33 0.22
EUR million Q1 2015Q1 2014 restated*
2014 restated*
Last twelve months
Comparable operating profit 343 358 1,085 1,070Non-recurring items (capital gains and losses) 7 1 305 311Changes in fair values of derivatives hedging future cash flow -3 10 -91 -104Nuclear fund adjustment 3 -4 -3 4Items affecting comparability 7 8 211 210
Operating profit 350 366 1,296 1,280
Condensed consolidated income statement
*Comparative period information for the income statement and cash flow for 2014 in this interim statement has been restated as Distribution segment has been treated as discontinued operations according to IFRS 5. For further information, see Notes 2 and 6.
25(53)

Fortum CorporationJanuary-March 2015
EUR million Q1 2015Q1 2014 restated
2014 restated
Last twelve months
Profit for the period 358 2,255 3,161 1,264
Other comprehensive income
Cash flow hedgesFair value gains/losses in the period 16 57 17 -24Transfers to income statement -9 -13 -70 -66Transfers to inventory/fixed assets -1 -2 -4 -3Tax effect -2 -9 12 19
Net investment hedgesFair value gains/losses in the period -33 36 149 80Tax effect 7 -7 -28 -14
Exchange differences on translating foreign operations 387 -232 -1,323 -704Share of other comprehensive income of associates and joint ventures 0 1 -3 -4Other changes 0 0 -3 -3
366 -169 -1,253 -718
Actuarial gains/losses on defined benefit plans -1 0 -77 -78Actuarial gains/losses on defined benefit plans in associates -2 0 -13 -15
-2 0 -90 -92
363 -169 -1,344 -812
5 -3 -19 -11Total comprehensive income for the year 724 2,083 1,799 440
Total comprehensive income attributable to Owners of the parent 715 2,083 1,815 447Non-controlling interests 9 0 -16 -7
724 2,083 1,799 440
Other comprehensive income for the period from continuing operations, net of taxOther comprehensive income for the period from discontinuing operations, net of tax
Condensed consolidated statement of comprehensive income
Items that will not be reclassified to profit or loss in subsequent periods:
Items that may be reclassified to profit or loss in subsequent periods:
26(53)

Fortum CorporationJanuary-March 2015
EUR million NoteMarch 31
2015March 31
2014Dec 31
2014
ASSETSNon-current assetsIntangible assets 11 277 381 276Property, plant and equipment 12 9,074 12,536 11,195Participations in associates and joint ventures 4, 13 2,130 2,374 2,027Share in State Nuclear Waste Management Fund 16 781 750 774Other non-current assets 70 67 68Deferred tax assets 83 118 98Derivative financial instruments 5 512 461 595Long-term interest-bearing receivables 14 2,041 2,526 2,041Total non-current assets 14,969 19,213 17,074
Current assetsInventories 247 237 256Derivative financial instruments 5 345 382 448Trade and other receivables 637 852 830 Bank deposits 1,494 0 757 Cash and cash equivalents 15 1,773 2,989 2,009Liquid funds 3,268 2,989 2,766Assets held for sale 7 2,716 0 0Total current assets 7,212 4,460 4,301
Total assets 22,182 23,673 21,375
EQUITYEquity attributable to owners of the parentShare capital 3,046 3,046 3,046Share premium 73 73 73Retained earnings 7,290 8,874 7,708Other equity components 12 116 36Total 10,421 12,109 10,864Non-controlling interests 80 97 71Total equity 10,501 12,207 10,935
LIABILITIESNon-current liabilitiesInterest-bearing liabilities 15 5,944 6,903 5,881Derivative financial instruments 5 254 198 247Deferred tax liabilities 692 1,332 1,159Nuclear provisions 16 781 750 774Other provisions 17 13 95 17Pension obligations 142 49 140Other non-current liabilities 156 148 154Total non-current liabilities 7,983 9,475 8,373
Current liabilitiesInterest-bearing liabilities 15 1,038 924 1,103Derivative financial instruments 5 177 109 76Trade and other payables 1) 1,874 958 888Liabilities related to assets held for sale 7 609 0 0Total current liabilities 3,698 1,991 2,067
Total liabilities 11,681 11,466 10,440
Total equity and liabilities 22,182 23,673 21,3751) Trade and other payables as of 31 March 2015 include dividends EUR 1 155 million (31 March 2014: 0) paid on 14 April 2015.
Condensed consolidated balance sheet
27(53)

Fortum CorporationJanuary-March 2015
Share capital
Share premium
Retained earnings Other equity components Owners of the
parent
Non-controlling
interests
Total equity
EUR million
Retained earnings
and other funds
Translation of foreign
operations
Cash flow hedges
Other OCI items
OCI items associated companies
and joint ventures
Total equity 31 December 2014 3,046 73 9,676 -1,968 19 -5 22 10,864 71 10,935Net profit for the period 354 354 4 358Translation differences 382 2 -1 -1 382 5 387Other comprehensive income 4 -26 -2 -24 -24OCI related to discontinued operations 5 5 5Total comprehensive income for the period 354 386 6 -27 -3 715 9 724Cash dividend -1,155 -1,155 -1,155Other -3 -3 -3Total equity 31 March 2015 3,046 73 8,871 -1,581 25 -32 19 10,421 80 10,501
Total equity 31 December 2013 3,046 73 7,500 -649 66 -51 38 10,024 101 10,124Net profit for the period 2,251 2,251 4 2,255Translation differences -227 -1 -227 -4 -232Other comprehensive income 33 29 1 63 63OCI related to discontinued operations -3 -4 -4Total comprehensive income for the period 2,251 -230 32 29 1 2,083 0 2,083Other 2 2 -3 -1Total equity 31 March 2014 3,046 73 9,753 -879 98 -22 40 12,109 97 12,207
Total equity 31 December 2013 3,046 73 7,500 -649 66 -51 38 10,024 101 10,124Net profit for the period 3,154 3,154 7 3,161Translation differences -1,299 -3 2 0 -1,300 -23 -1,323Other comprehensive income -3 -43 44 -17 -19 0 -20OCI related to discontinued operations -20 -19 -19Total comprehensive income for the period 3,151 -1,319 -47 46 -16 1,815 -16 1,799Cash dividend -977 -977 -977Dividends to non-controlling interests 0 -2 -2Changes due to business combinations 6 6 -11 -5Other -4 -4 -1 -4Total equity 31 December 2014 3,046 73 9,676 -1,968 19 -5 22 10,864 71 10,935
A dividend for 2014 of EUR 1.10 per share and an extra dividend of EUR 0.20 per share, amounting to a total of EUR 1,155 million, was decided at the Annual General Meeting on 31 March 2015. The dividend and the extra dividend were paid on 14 April 2015.
A dividend for 2013 of EUR 1.10 per share, amounting to a total of EUR 977 million, was decided at the Annual General Meeting on 8 April 2014. The dividend was paid on 22 April 2014.
Translation differences impacted equity attributable to owners of the parent company with EUR 386 million during Q1 2015 (Q1 2014: -231). Translation differences are mainly related to RUB. Part of this translation exposure has been hedged and the hedge result, amounting to EUR -33 million during Q1 2015 (Q1 2014: 37), is included in the other OCI items.
Translation of financial information from subsidiaries in foreign currency is done using average rate for the income statement and end rate for the balance sheet. The exchange rate differences occurring from translation to EUR are booked to equity. For information regarding exchange rates used, see Note 8 Exchange rates.
Condensed consolidated statement of changes in total equity
Translation differences
The impact on equity attributable to owners of the parent from fair valuation of cash flow hedges, EUR 6 million during Q1 2015 (Q1 2014: 32), mainly relates to cash flow hedges hedging electricity price for future transactions, where hedge accounting is applied. When electricity price is lower/higher than the hedging price, the impact on equity is positive/negative.
Cash dividends
Cash flow hedges
28(53)

Fortum CorporationJanuary-March 2015
EUR million Q1 2015Q1 2014 restated
2014 restated
Last twelve months
Cash flow from operating activitiesNet profit for the period 295 312 1,089 1,072Adjustments: Income tax expenses 55 62 143 136Finance costs - net 57 62 210 205Share of profit of associates and joint ventures -58 -69 -146 -135Depreciation, amortisation and impairment charges 83 97 376 362Operating profit before depreciations 433 463 1,673 1,643Non-cash flow items and divesting activities -46 -14 -244 -276Interest received 14 27 99 86Interest paid -104 -126 -323 -301Dividends received 0 0 58 58Realised foreign exchange gains and losses and other financial items 168 76 349 441Taxes 18 20 -163 -165Funds from operations 482 446 1,447 1,483Change in working capital 34 -40 -42 32Net cash from operating activities continuing operations 516 405 1,406 1,517Net cash from operating activities discontinued operations 87 161 356 282Total net cash from operating activities 603 566 1,762 1,799
Cash flow from investing activitiesCapital expenditures -101 -123 -622 -600Acquisitions of shares -1 -1 -69 -69Proceeds from sales of fixed assets 9 2 26 33Divestments of shares 27 1 473 499Shareholder loans to associated companies and joint ventures 20 46 425 399Change in other interest-bearing receivables 0 1 8 7Net cash used in investing activities continuing operations -46 -74 241 269Net cash used in investing activities discontinued operations -43 2,461 2,574 70Total net cash from investing activities -89 2,387 2,816 340
Cash flow before financing activities 514 2,953 4,578 2,139
Cash flow from financing activitiesProceeds from long-term liabilities 33 47 50 36Payments of long-term liabilities -3 -753 -1,480 -730Change in short-term liabilities -75 -494 -580 -161Dividends paid to the owners of the parent 0 0 -977 -977Other financing items 2 -1 -1 2Net cash used in financing activities continuing operations -42 -1,201 -2,988 -1,829Net cash used in financing activities discontinued operations 0 -19 -19 0Total net cash used in financing activities -42 -1,220 -3,007 -1,829
Total net increase(+) / decrease(-) in liquid funds 473 1,734 1,571 310 Liquid funds at the beginning of the period 2,766 1,265 1,265 2,989Foreign exchange differences in liquid funds 29 -10 -70 -31
Liquid funds at the end of the period 3,268 2,989 2,766 3,268
Non-cash flow items and divesting activities
Realised foreign exchange gains and losses and other financial items
Non-cash flow items and divesting activities mainly consist of capital gains EUR -7 million (Q1 2014: -2) and adjustments for unrealised fair value changes of derivatives EUR 3 million (Q1 2014: -12). The actual proceeds for divestments are shown under cash flow from investing activities.
Realised foreign exchange gains and losses and other financial items include foreign exchange gains and losses of EUR 168 million for Q1 2015 (Q1 2014: 74) related mainly to financing of Fortum's Swedish and Russian subsidiaries and the fact that the Group's main external financing currency is EUR. The foreign exchange gains and losses arise from rollover of foreign exchange contracts hedging the internal loans as major part of these forwards is entered into with short maturities i.e. less than twelve months.
Condensed consolidated cash flow statement
29(53)

Fortum CorporationJanuary-March 2015
Change in working capital
EUR million Q1 2015Q1 2014 restated
2014 restated
Last twelve months
Change in interest-free receivables, decrease (+)/increase (-) 51 -14 4 69Change in inventories, decrease (+)/increase (-) 14 24 -13 -23Change in interest-free liabilities, decrease (-)/increase (+) -31 -50 -33 -14Total 34 -40 -42 32
Capital expenditure in cash flow
EUR million Q1 2015Q1 2014 restated
2014 restated
Last twelve months
Capital expenditure 85 108 625 602Change in not yet paid investments, decrease(+)/increase(-) 26 25 44 45Capitalised borrowing costs -10 -10 -47 -47Total 101 123 622 600
Acquisition of shares in cash flow
Divestment of shares in cash flow
EUR million Q1 2015Q1 2014 restated
2014 restated
Last twelve months
Proceeds from sales of subsidiaries, net of cash disposed 0 0 160 160Proceeds from sales of associates 27 1 311 337Proceeds from available for sale financial assets 0 0 1 1Total 27 1 473 499
Additional cash flow information for continuing operations
Acquisition of shares, net of cash acquired, amounted to EUR 1 million during Q1 2015 (Q1 2014: 1).
Capital expenditures for intangible assets and property, plant and equipment were in Q1 2015 EUR 85 million (Q1 2014: 108). Capital expenditure in cash flow in Q1 2015 EUR 101 million (Q1 2014: 123) is without not yet paid investments i.e. change in trade payables related to investments EUR 26 million (Q1 2014: 25) and capitalised borrowing costs EUR -10 million (Q1 2014: -10), which are presented in interest paid.
30(53)

Fortum CorporationJanuary-March 2015
EUR million Q1 2015 Q1 2014 2014
Last twelve
months
Net debt beginning of the period 4,217 7,793 7,793 4,838Foreign exchange rate differences 1 -23 -81 -57 EBITDA 544 2,483 3,954 2,015
0 -1,917 -2,147 -230 Change in working capital 60 0 -46 14 Capital expenditures -144 -162 -768 -750 Acquisitions -1 -1 -69 -69 Divestments 35 2,427 3,089 697
0 77 131 54 Shareholder loans to associated companies 20 46 425 399 Change in other interest-bearing receivables 0 1 8 7 Dividends 0 0 -977 -977 Other financing activities 2 -1 -1 2Net cash flow (- increase in net debt) 517 2,953 3,600 1,164
13 21 105 97Net debt end of the period 3,714 4,838 4,217 3,714
March 31 2015
March 31 2014
Dec 31 2014
Last twelve
monthsEBITDA total Fortum, EUR million 544 2,483 3,954 2,015EBITDA continuing operations, EUR million 433 463 1,673 1,643Comparable EBITDA total Fortum, EUR million 508 627 1,873 1,754Comparable EBITDA continuing operations, EUR million 396 456 1,457 1,397
Earnings per share total Fortum Group (basic) EUR 0.40 2.53 3.55 1.42Earnings per share continuing operations (basic), EUR 0.33 0.35 1.22 1.20Earnings per share discontinued operations (basic), EUR 0.07 2.18 2.33 0.22
Capital employed, EUR million 17,482 20,033 17,918Interest-bearing net debt, EUR million 3,714 4,838 4,217Interest-bearing net debt without Värme financing, EUR million 3,176 3,765 3,664
106 135 843 814Capital expenditure total Fortum, EUR million 105 134 774 745
86 111 695 670Capital expenditure continuing operations, EUR million 85 110 626 601
Return on capital employed total Fortum, % 10.9 20.8 19.5 9.0
Return on shareholders' equity total Fortum, % 13.2 30.9 30.0 11.1
Net debt / EBITDA total Fortum 1.7 1.1 1.1 1.8Comparable net debt / EBITDA total Fortum 1.8 1.9 2.3 2.1Comparable net debt / EBITDA without Värme financing total Fortum 1.6 1.5 2.0 1.8
Interest coverage total Fortum 10.9 45.6 19.9 9.5Interest coverage including capitalised borrowing costs total Fortum 8.6 38.1 15.7 7.3Funds from operations/interest-bearing net debt total Fortum, % 45.0 42.3 42.9 48.0Funds from operations/interest-bearing net debt without Värme financing total Fortum, % 52.6 54.4 49.3 56.2
Gearing, % 35 40 39Equity per share, EUR 11.73 13.63 12.23Equity-to-assets ratio, % 47 52 51
Number of employees total Fortum 8,378 8,770 8,592Number of employees continuing operations 7,977 8,304 8,202Average number of employees total Fortum 8,431 9,054 8,821Average number of employees continuing operations 8,037 8,335 8,329
Average number of shares, 1 000 shares 888,367 888,367 888,367888,367 888,367 888,367888,367 888,367 888,367
Change in net debt
For definitions, see Note 25.
Key ratios
Paid net financial costs, taxes and adjustments for non-cash and divestment items
Capital expenditure and gross investments in shares total Fortum, EUR million
Diluted adjusted average number of shares, 1 000 sharesNumber of registered shares, 1 000 shares
Fair value change of bonds, amortised cost valuation and other
Capital expenditure and gross investments in shares continuing operations, EUR million
Proceeds from the interest-bearing receivables relating to divestments
31(53)

Fortum Corporation Notes to the condensed consolidated interim financial statementsJanuary-March 2015
Sales
EUR million Q1 2015Q1 2014 restated
2014 restated
Last twelve
monthsPower sales excluding indirect taxes 757 861 3,102 2,998Heating sales 241 289 753 705Other sales 42 58 233 217Total for continuing operations 1,040 1,208 4,088 3,920
4. Segment information
Notes to the condensed consolidated interim financial statements
1. Basis of preparationThe condensed interim financial statements have been prepared in accordance with International Accounting Standard (IAS) 34, Interim Financial Reporting, as adopted by the EU. The condensed interim financial report should be read in conjunction with the consolidated financial statements for the year ended 31 December 2014.
All figures in the consolidated interim financial statements have been rounded and consequently the sum of individual figures may deviate from the sum presented. Key figures have been calculated using exact figures.
Discontinued operationsOn 15 April 2015 Fortum published a stock exchange release regarding the IFRS 5 restatement of income statement and cash flow for 2014. As described in the release, Distribution segment is treated as discontinued operations in the first quarter interim report 2015 and the income statement and cash flow for the comparative period 2014 have been restated accordingly. Reclassification of discontinued operations does not impact the balance sheet. However, the Swedish distribution business' assets and liabilities are classified as assets held for sale in the balance sheet of 31 March 2015.
More information on the impact of the reclassification can be found in Note 6 and the stock exchange release published on 15 April 2015.
2. Accounting policies
The same accounting policies and presentation have been followed in these condensed interim financial statements as were applied in the preparation of the consolidated financial statements for the year ended 31 December 2014.
The preparation of interim financial statements requires management to make judgements, estimates and assumptions that affect the reported amounts of assets and liabilities, income and expense. Actual results may differ from these estimates.
In preparing these interim financial statements, the significant judgements made by management in applying the Group's accounting policies and the key sources of estimation uncertainty were the same as those that applied to the consolidated financial statements as at and for the year ended 31 December 2014.
3. Critical accounting estimates and judgements
The distribution operations have been classified as discontinued operations in the first quarter interim report. See further information on the reclassification in Note 6 and in the stock exhange release on 15 April 2015.
As of January 1 2015 Fortum centralised the IT and customer service functions. As a result of this centralisation a total of 464 employees transferred from Heat, Electricity Sales and Solutions and Power and Technology segments to Other segment. The comparable segment information has not been restated due to the reorganisation.
32(53)

Fortum Corporation Notes to the condensed consolidated interim financial statementsJanuary-March 2015
Sales by segment
EUR million Q1 2015Q1 2014 restated
2014 restated
Last twelve
monthsPower and Technology 1) 500 586 2,156 2,070- of which internal 29 39 85 75Heat, Electricity Sales and Solutions 1) 406 446 1,332 1,292- of which internal 3 18 34 19Russia 263 333 1,055 985- of which internal 0 0 0 0Other 1) 29 14 58 73- of which internal 21 12 44 53Netting of Nord Pool transactions 2) -119 -133 -422 -408Eliminations -38 -37 -91 -92Total for continuing operations 1,040 1,208 4,088 3,920Discontinued operations (Distribution) 180 300 751 631Eliminations 3) -20 -35 -89 -74Total 1,200 1,473 4,751 4,478
Comparable operating profit by segment
EUR million Q1 2015Q1 2014 restated
2014 restated
Last twelve
monthsPower and Technology 203 251 877 829Heat, Electricity Sales and Solutions 58 48 104 114Russia 97 73 161 185Other -15 -14 -57 -58Total for continuing operations 343 358 1,085 1,070Discontinued operations (Distribution) 82 119 266 229Total 425 477 1,351 1,299
Operating profit by segment
EUR million Q1 2015Q1 2014 restated
2014 restated
Last twelve
monthsPower and Technology 203 262 855 796Heat, Electricity Sales and Solutions 64 45 337 356Russia 98 73 161 186Other -15 -14 -58 -59Total for continuing operations 350 366 1,296 1,280Discontinued operations (Distribution) 81 1,968 2,132 245Total 431 2,333 3,428 1,526
Non-recurring items by segment
EUR million Q1 2015Q1 2014 restated
2014 restated
Last twelve
monthsPower and Technology 3 1 52 54Heat, Electricity Sales and Solutions 3 1 254 256Russia 1 0 0 1Total for continuing operations 7 1 305 311Discontinued operations (Distribution) 0 1,850 1,865 15Total 7 1,851 2,171 327
1) Sales, both internal and external, includes effects from realised hedging contracts. Effect on sales can be negative or positive depending on the average contract price and realised spot price. 2) Sales and purchases with Nord Pool Spot is netted on Group level on an hourly basis and posted either as revenue or cost depending on if Fortum is a net seller or net buyer during any particular hour.3) Sales to and from discontinued operations
Non-recurring items in first quarter 2015 include gains from sale of property, plant and equipment.
33(53)

Fortum Corporation Notes to the condensed consolidated interim financial statementsJanuary-March 2015
Other items affecting comparability by segment
EUR million Q1 2015Q1 2014 restated
2014 restated
Last twelve
monthsPower and Technology 1) -3 10 -73 -86Heat, Electricity Sales and Solutions 3 -4 -20 -13Total for continuing operations 0 6 -94 -100Discontinued operations (Distribution) -1 -1 0 0Total -1 5 -94 -100
1) Including effects from the accounting of Fortum's part of the Finnish State Nuclear Waste Management Fund with (EUR million): 3 -4 -3 4
Comparable EBITDA by segment
EUR million Q1 2015Q1 2014 restated
2014 restated
Last twelve
monthsPower and Technology 232 282 998 948Heat, Electricity Sales and Solutions 82 74 204 212Russia 94 113 304 285Other -13 -13 -49 -49Total for continuing operations 396 456 1,457 1,397Discontinued operations (Distribution) 112 171 416 357Total 508 627 1,873 1,754
Q1 2015Q1 2014 restated
2014 restated
Last twelve
monthsPower and Technology 29 31 121 119Heat, Electricity Sales and Solutions 24 25 100 99Russia 27 40 147 134Other 3 1 8 10Total for continuing operations 83 97 377 363Discontinued operations (Distribution) 30 52 150 128Total 113 150 526 489
Q1 2015Q1 2014 restated
2014 restated
Last twelve
monthsPower and Technology 1), 2) -4 -10 -14 -8Heat, Electricity Sales and Solutions 43 57 88 74Russia 12 14 35 33Other 7 9 37 35Total for continuing operations 58 69 146 135Discontinued operations (Distribution) 0 3 3 0Total 58 72 149 135
1) Including effects from the accounting of Fortum's associates part of Finnish and Swedish Nuclear Waste Management Funds with (EUR million): 0 -2 -1 1
EBITDA is calculated by adding back depreciation, amortisation and impairment charges to operating profit. Comparable EBITDA does not include items affecting comparability and net release of CSA provision.
Depreciation, amortisation and impairment charges by segment
EUR million
Share of profit/loss in associates and joint ventures by segment
EUR million
2) The main part of the associated companies in Power and Technology are power production companies from which Fortum purchases produced electricity at production costs including interest costs, production taxes and income taxes.
Other items affecting comparability mainly include effects from financial derivatives hedging future cash-flows where hedge accounting is not applied according to IAS 39. Other segment includes mainly the effect arising from changes in hedge accounting status on group level. In Power and Technology segment there are also effects from the accounting of Fortum's part of the Finnish State Nuclear Waste Management Fund where the asset in the balance sheet cannot exceed the related liabilities according to IFRIC interpretation 5.
34(53)

Fortum Corporation Notes to the condensed consolidated interim financial statementsJanuary-March 2015
March 31 2015
March 31 2014
Dec 31 2014
Power and Technology 859 882 859Heat, Electricity Sales and Solutions 543 532 523Russia 391 444 326Other 338 463 319Assets related to discontinued operations (Distribution) 0 54 0Total 2,130 2,374 2,027
Capital expenditure by segment
EUR million Q1 2015Q1 2014 restated
2014 restated
Last twelve
monthsPower and Technology 28 35 197 190Heat, Electricity Sales and Solutions 11 13 86 84Russia 45 58 340 327Other 1 3 3 1Total for continuing operations 85 110 626 601Discontinued operations (Distribution) 20 25 147 142Total 105 134 774 745
Of which capitalised borrowing costs 10 10 47 47
Gross investments in shares by segment
EUR million Q1 2015Q1 2014 restated
2014 restated
Last twelve
monthsPower and Technology 0 0 2 2Heat, Electricity Sales and Solutions 1 0 37 38Russia 0 1 27 26Other 0 0 4 4Total for continuing operations 1 1 69 69Discontinued operations (Distribution) 0 0 0 0Total 1 1 69 69
Gross divestments of shares by segment
EUR million Q1 2015Q1 2014 restated
2014 restated
Last twelve
monthsPower and Technology 0 1 67 66Heat, Electricity Sales and Solutions 27 0 446 473Russia 0 0 0 0Other 0 0 2 2Total for continuing operations 27 1 515 541Discontinued operations (Distribution) 0 2,501 2,681 180Total 27 2,502 3,196 721
Net assets by segment
EUR millionMarch 31
2015March 31
2014Dec 31
2014Power and Technology 6,019 6,276 6,001Heat, Electricity Sales and Solutions 2,164 2,365 2,112Russia 3,104 3,619 2,597Other 180 374 496Net assets related to discontinued operations (Distribution) 2,634 2,872 2,615Total 14,101 15,505 13,820
Participation in associates and joint ventures by segment
EUR million
See Note 7 and additional cash flow information for more information about gross divestments in shares.
See Note 13 for information on participation in associates and joint ventures and Note 7 for information on associated company divestments.
35(53)
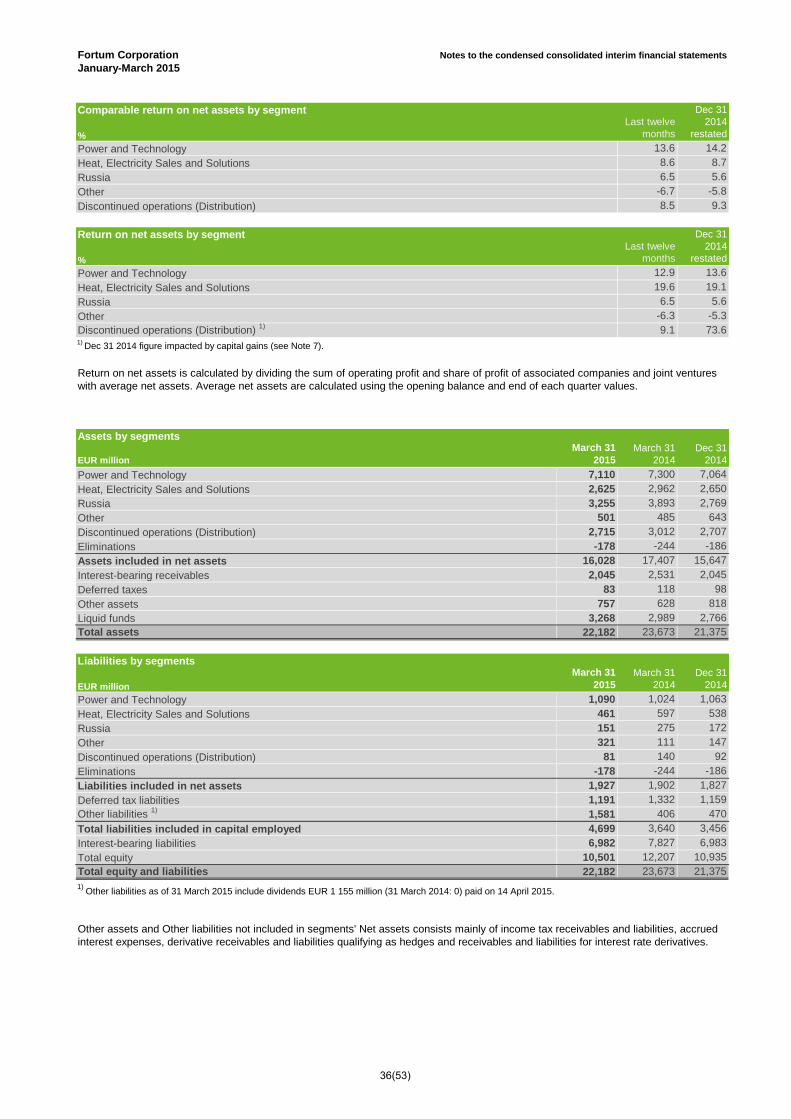
Fortum Corporation Notes to the condensed consolidated interim financial statementsJanuary-March 2015
Last twelve months
Dec 31 2014
restatedPower and Technology 13.6 14.2Heat, Electricity Sales and Solutions 8.6 8.7Russia 6.5 5.6Other -6.7 -5.8Discontinued operations (Distribution) 8.5 9.3
Return on net assets by segment
%Last twelve
months
Dec 31 2014
restatedPower and Technology 12.9 13.6Heat, Electricity Sales and Solutions 19.6 19.1Russia 6.5 5.6Other -6.3 -5.3Discontinued operations (Distribution) 1) 9.1 73.61) Dec 31 2014 figure impacted by capital gains (see Note 7).
Assets by segments
EUR millionMarch 31
2015March 31
2014Dec 31
2014Power and Technology 7,110 7,300 7,064Heat, Electricity Sales and Solutions 2,625 2,962 2,650Russia 3,255 3,893 2,769Other 501 485 643Discontinued operations (Distribution) 2,715 3,012 2,707Eliminations -178 -244 -186Assets included in net assets 16,028 17,407 15,647Interest-bearing receivables 2,045 2,531 2,045Deferred taxes 83 118 98Other assets 757 628 818Liquid funds 3,268 2,989 2,766Total assets 22,182 23,673 21,375
Liabilities by segments
EUR millionMarch 31
2015March 31
2014Dec 31
2014Power and Technology 1,090 1,024 1,063Heat, Electricity Sales and Solutions 461 597 538Russia 151 275 172Other 321 111 147Discontinued operations (Distribution) 81 140 92Eliminations -178 -244 -186Liabilities included in net assets 1,927 1,902 1,827Deferred tax liabilities 1,191 1,332 1,159Other liabilities 1) 1,581 406 470Total liabilities included in capital employed 4,699 3,640 3,456Interest-bearing liabilities 6,982 7,827 6,983Total equity 10,501 12,207 10,935Total equity and liabilities 22,182 23,673 21,375
Return on net assets is calculated by dividing the sum of operating profit and share of profit of associated companies and joint ventures with average net assets. Average net assets are calculated using the opening balance and end of each quarter values.
Other assets and Other liabilities not included in segments' Net assets consists mainly of income tax receivables and liabilities, accrued interest expenses, derivative receivables and liabilities qualifying as hedges and receivables and liabilities for interest rate derivatives.
Comparable return on net assets by segment
%
1) Other liabilities as of 31 March 2015 include dividends EUR 1 155 million (31 March 2014: 0) paid on 14 April 2015.
36(53)

Fortum Corporation Notes to the condensed consolidated interim financial statementsJanuary-March 2015
Number of employeesMarch 31
2015
March 31 2014
restated
Dec 31 2014
restatedPower and Technology 1,350 1,672 1,639Heat, Electricity Sales and Solutions 1,434 1,960 1,807Russia 4,198 4,169 4,213Other 995 503 543Total for continuing operations 7,977 8,304 8,202Discontinued operations (Distribution) 401 466 390Total 8,378 8,770 8,592
Average number of employees
Q1 2015Q1 2014 restated
2014 restated
Power and Technology 1,399 1,695 1,685Heat, Electricity Sales and Solutions 1,442 1,952 1,913Russia 4,198 4,165 4,196Other 998 524 536Total for continuing operations 8,037 8,335 8,329Distribution (Distribution) 394 719 492Total 8,431 9,054 8,821
Average number of employees is based on a monthly average for the whole period in question.
37(53)

Fortum Corporation Notes to the condensed consolidated interim financial statementsJanuary-March 2015
Financial assets
Mar 31 2015
Mar 31 2014
Dec 31 2014
Mar 31 2015
Mar 31 2014
Dec 31 2014
Mar 31 2015
Mar 31 2014
Dec 31 2014
Mar 31 2015
Mar 31 2014
Dec 31 2014
Mar 31 2015
Mar 31 2014
Dec 31 2014
1 1 1 28 29 29 29 30 30
Hedge accounting 6 64 6 -5 -12 -5 2 52 1Non-hedge accounting 76 110 66 -19 -44 -17 58 66 49
Hedge accounting 281 165 335 281 165 335Non-hedge accounting 158 171 206 158 171 206
Hedge accounting 0 0 0Non-hedge accounting 6 7 1 7 1 6 -3 13 8 3
Total in non-current assets 7 8 2 528 511 619 28 29 29 -24 -56 -25 541 492 625
Hedge accounting 87 165 79 -11 -25 -11 76 140 67Non-hedge accounting 2 155 278 153 -103 -177 -106 52 103 47
Hedge accounting 98 6 48 98 6 48Non-hedge accounting 75 72 274 75 72 274
Hedge accounting 0 0 0 0Non-hedge accounting 37 64 30 11 9 -4 -2 -26 44 62 12
Total in current assets 37 66 30 426 521 563 0 0 0 -118 -204 -143 346 382 44844 74 32 954 1,032 1,182 28 29 29 -142 -260 -168 886 874 1,073
Interest rate and currency derivatives
Oil and other futures and forward contracts
Total
In current assetsDerivative financial instruments
Electricity derivatives
Level 1 Level 2
Interest rate and currency derivatives
Oil and other futures and forward contracts
EUR million
Electricity derivatives
In non-current assetsAvailable for sale financial assets 1)
Derivative financial instruments
5. Financial risk management
The Group has not made any significant changes in policies regarding risk management during the period. Aspects of the Group's financial risk management objectives and policies are consistent with those disclosed in the consolidated financial statements for the year ended 31 December 2014.
Fair value hierarchy information
Level 3 Netting 2) Total
Level 2: inputs other than quoted prices included within Level 1 that are observable for the asset or liability, either directly (i.e. as prices) or indirectly (i.e. derived from prices);
Level 3: inputs for the asset or liability that is not based on observable market data (unobservable inputs).
See also accounting policies in the consolidated financial statements 2014, in Note 17 Financial assets and liabilities by fair value hierarchy
Financial instruments that are measured in the balance sheet at fair value are presented according to following fair value measurement hierarchy:
Level 1: quoted prices (unadjusted) in active markets for identical assets or liabilities;
38(53)

Fortum Corporation Notes to the condensed consolidated interim financial statementsJanuary-March 2015
Financial liabilities
Mar 31 2015
Mar 31 2014
Dec 31 2014
Mar 31 2015
Mar 31 2014
Dec 31 2014
Mar 31 2015
Mar 31 2014
Dec 31 2014
Mar 31 2015
Mar 31 2014
Dec 31 2014
Mar 31 2015
Mar 31 2014
Dec 31 2014
1,040 1,196 1,454 1,040 1,196 1,454
Hedge accounting 6 20 11 -5 -12 -5 1 8 7Non-hedge accounting 73 97 62 -19 -44 -17 55 53 45
Hedge accounting 103 69 96 103 69 96Non-hedge accounting 82 63 96 82 63 96
Non-hedge accounting 11 5 5 2 2 -3 12 5 3
Total in non-current liabilities 11 5 5 1,306 1,445 1,721 0 0 0 -24 -56 -25 1,293 1,394 1,701
Hedge accounting 12 25 12 -11 -25 -11 1 0 1Non-hedge accounting 3 130 208 134 -103 -177 -106 26 34 27
Hedge accounting 21 6 22 21 6 22Non-hedge accounting 95 27 22 95 27 22
Hedge accounting 0 0 0Non-hedge accounting 33 45 29 4 2 -4 -2 -26 35 43 4
Total in current liabilities 33 48 29 262 266 192 0 0 0 -118 -204 -143 177 109 7644 53 34 1,568 1,711 1,913 0 0 0 -142 -260 -168 1,470 1,503 1,778
Derivative financial instruments
In non-current liabilities
2) Receivables and liabilities against electricity, oil and other commodity exchanges arising from standard derivative contracts with same delivery period are netted.
1) Available for sale financial assets, i.e. shares which are not classified as associated companies or joint ventures, consists mainly of shares in unlisted companies of EUR 28 million (Dec 31 2014: 29), for which the fair value cannot be reliably determined. These assets are measured at cost less possible impairment. Available for sale financial assets include listed shares at fair value of EUR 1 million (Dec 31 2014: 1). The cumulative fair value change booked in Fortum's equity was EUR -3 million (Dec 31 2014: -3).
Interest rate and currency derivatives
Oil and other futures and forward contracts
Total
Net fair value amount of interest rate and currency derivatives is EUR 311 million, assets EUR 612 million and liabilities EUR 301 million. Fortum has cash collaterals based on Credit Support Annex agreements with some counterparties. At the end of March 2015 Fortum had received EUR 211 million from Credit Support Annex agreements. The received cash has been booked as short term liability.
Regarding the relevant interest-bearing liabilities, see Note 15 Interest-bearing liabilities and Note 18 Pledged assets.
Electricity derivatives
Interest rate and currency derivatives
Oil and other futures and forward contracts
In current liabilitiesDerivative financial instruments
Electricity derivatives
3) Fair valued part of bonds when hedge accounting is applied (fair value hedge).
Total
Interest-bearing liabilities 3)
EUR million
Level 1 Level 2 Level 3 Netting 2)
39(53)

Fortum Corporation Notes to the condensed consolidated interim financial statementsJanuary-March 2015
Q1 2015Q1 2014 restated
2014 restated
Last twelve
monthsSales 160 265 662 557Other income 1 2 15 14Materials and services -21 -49 -114 -86Employee benefits -9 -18 -44 -35Depreciation, amortisation and impairment charges -30 -52 -150 -128Other expenses -19 -29 -104 -94Comparable operating profit 82 119 266 229Items affecting comparability -1 1,849 1,866 16Operating profit 81 1,968 2,132 245Share of profit/loss of associates and joint ventures 0 3 3 0Finance costs - net -1 -2 -7 -6Profit before income tax 80 1,968 2,128 240Income tax expenses -18 -24 -56 -50
63 1,943 2,073 1931) Including eliminations between continuing and discontinued operations.
Q1 2015Q1 2014 restated
2014 restated
Last twelve
monthsNet cash from operating activities 87 161 356 282Net cash used in investing activities -43 2,461 2,574 70Net cash from financing activities 0 -19 -19 0Total net increase in liquid funds 44 2,603 2,911 352
Result of discontinued operations 1)
EUR million
Net cash flows attributable to the discontinued operations
EUR million
6. Discontinued operationsIn March 2015 Fortum signed a binding agreement to sell the Swedish Distribution business. The total consideration is approximately SEK 60.6 billion on a debt- and cash-free basis (corresponding to approximately EUR 6.6 billion). Fortum expects to complete the divestment during the second quarter of 2015 after the necessary regulatory approvals and the fulfilment of customary closing conditions. Fortum expects to book a one-time sales gain of approximately EUR 4.4 billion corresponding to approximately EUR 5 per share in its second quarter 2015 results. In 2014 Fortum divested both the Finnish and Norwegian Distribution operations. For information regarding the divestments and assets held for sale see Note 7.
After the divestment of the Swedish Distribution business Fortum does not have any distribution operations and therefore Distribution segment has been treated as discontinued operations in these interim financial statements according to IFRS 5 Non-current Assets held for Sale and Discontinued operations. Discontinued operations are disclosed on one line, net of tax, in the face of the income statement. In the cash flow statement the net cash flows attributable to the operating, investing and financing activities of the discontinued operations are disclosed separately. In accordance with IFRS 5 the 2014 comparable information for income statement and cash flow statement has been restated.
Cash flow from discontinued operations include cash flow from distribution operations and allocated taxes, impact from sale of shares in Distribution companies and proceeds from interest-bearing receivables from sold subsidiaries.
Discontinued operations include the distribution operations in Fortum, including sales gains from the divestment of Finnish and Norwegian distribution operations in 2014, and effects from internal sales and purchases have also been included. The net financial costs allocated to discontinued operations are based on the fact that the financing activities and risk management have been centralised on group level and subsidiaries have been funded with intra-group loans. No corporate overhead costs have been allocated to the discontinued operations.
Profit for the year from discontinued operations attributable to the owners of the parent
40(53)

Fortum Corporation Notes to the condensed consolidated interim financial statementsJanuary-March 2015
EUR million Q1 2015 Q1 2014 2014Last twelve
months0 2,424 2,750 3260 77 131 540 0 2 2
0 2,501 2,884 38327 1 311 337
0 0 1 1Total 27 2,502 3,196 721Gross divestment of available for sale financial assets
7. Acquisitions, disposals and assets held for sale
Acquisitions
Disposals
There were no material acquisitions during the first quarter of 2015.
In July 2014, Fortum acquired E.ON Ruhrgas International GmbH's shareholding of 33.66% in the Estonian natural gas import, sales and distribution company AS Eesti Gaas and a similar shareholding in the gas transmission service company AS Võrguteenus Valdus.
In January 2014, Fortum agreed to sell its Tohkoja wind power project located in Kalajoki, in western Finland, to wpd europe GmbH, part of the international wpd group. The transaction was completed during the second quarter of 2014 and had a minor positive impact on Power and Technology segment’s results.
In January 2014 Fortum agreed to sell its 30%-stake in the Swedish power company Karlshamns Kraft AB to the company's majority owner E.ON. The sale had a minor impact on Power and Technology segment’s first quarter 2014 results.
In December 2013 Fortum announced that it had agreed to sell its Finnish electricity distribution business to Suomi Power Networks Oy, owned by a consortium of Finnish and international investors. The total consideration was EUR 2.55 billion on a debt- and cash-free basis. Fortum booked a one-time sales gain of EUR 1.85 billion corresponding to EUR 2.08 per share. The sales gain was reported in Fortum's Distribution segment in the first quarter of 2014.
In April 2014 Fortum agreed to sell its Norwegian electricity distribution to the Hafslund Group, listed on the Oslo Stock Exchange, and its heat businesses in Norway to iCON Infrastructure Partners II, L.P. fund. In addition, Fortum agreed to sell its shareholding in Fredrikstad Energi AS (49%) and Fredrikstad Energi Nett AS (35%) to the Hafslund Group. The divestments were completed during the second quarter after the necessary regulatory approvals and customary closing conditions were met. The total consideration was approximately EUR 340 million on a debt- and cash-free basis. The sales gains were booked in Fortum's Distribution segment, EUR 16 million, and Heat and Electricity Sales and Solutions segment, EUR 52 million in the second quarter 2014 results. The one time sales gains correspond to approximately EUR 0.08 per share.
Disposals during 2015Fortum has during Q1 sold its 51.4%-shareholding in the associated company AS Võrguteenus Valdus to the Estonian electricity transmission system operator Elering AS.
In October 2014 Fortum sold its UK-based subsidiary Grangemouth CHP Limited to its long term customer INEOS Industries Holdings Ltd. Grangemouth CHP Limited owns and operates a natural gas-fired combined heat and power (CHP) plant located at Grangemouth in Scotland. The total sales price was approximately GBP 54 million (corresponding to approximately EUR 70 million). Fortum booked a gain in 2014 fourth quarter results of Fortum's Power and Technology segment.
In November 2014 Fortum sold its 31 %-shareholding in the Finnish natural gas company Gasum Oy to the Finnish State. The sales price for the total amount of Fortum's shares was approximately EUR 310 million. Fortum booked a gain of roughly EUR 190 million,corresponding to approximately EUR 0.22 per share. The sales gain was booked in 2014 fourth quarter results of Fortum's Heat, Electricity Sales and Solutions segment.
Disposals during 2014
Gross divestments of shares, Fortum total operations
Gross divestments of shares in subsidiariesGross divestment of associates
Proceeds settled in cashInterest bearing debt in sold subsidiariesChange in receivables relating to divestments
41(53)
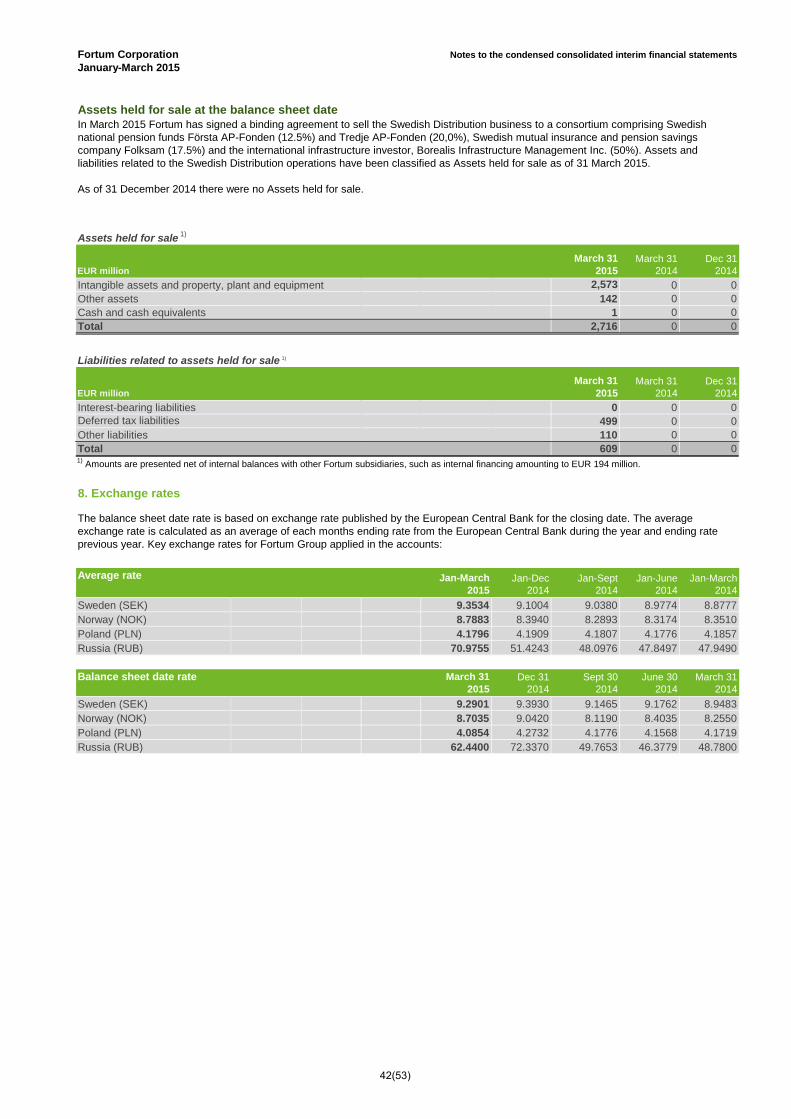
Fortum Corporation Notes to the condensed consolidated interim financial statementsJanuary-March 2015
EUR million March 31
2015March 31
2014Dec 31
20142,573 0 0
142 0 01 0 0
Total 2,716 0 0
EUR millionMarch 31
2015March 31
2014Dec 31
20140 0 0
Deferred tax liabilities 499 0 0110 0 0
Total 609 0 0
Average rate Jan-March 2015
Jan-Dec 2014
Jan-Sept 2014
Jan-June 2014
Jan-March 2014
Sweden (SEK) 9.3534 9.1004 9.0380 8.9774 8.8777Norway (NOK) 8.7883 8.3940 8.2893 8.3174 8.3510Poland (PLN) 4.1796 4.1909 4.1807 4.1776 4.1857Russia (RUB) 70.9755 51.4243 48.0976 47.8497 47.9490
Balance sheet date rate March 312015
Dec 312014
Sept 302014
June 302014
March 312014
Sweden (SEK) 9.2901 9.3930 9.1465 9.1762 8.9483Norway (NOK) 8.7035 9.0420 8.1190 8.4035 8.2550Poland (PLN) 4.0854 4.2732 4.1776 4.1568 4.1719Russia (RUB) 62.4400 72.3370 49.7653 46.3779 48.7800
The balance sheet date rate is based on exchange rate published by the European Central Bank for the closing date. The average exchange rate is calculated as an average of each months ending rate from the European Central Bank during the year and ending rate previous year. Key exchange rates for Fortum Group applied in the accounts:
8. Exchange rates
In March 2015 Fortum has signed a binding agreement to sell the Swedish Distribution business to a consortium comprising Swedish national pension funds Första AP-Fonden (12.5%) and Tredje AP-Fonden (20,0%), Swedish mutual insurance and pension savings company Folksam (17.5%) and the international infrastructure investor, Borealis Infrastructure Management Inc. (50%). Assets and liabilities related to the Swedish Distribution operations have been classified as Assets held for sale as of 31 March 2015.
As of 31 December 2014 there were no Assets held for sale.
Assets held for sale at the balance sheet date
Assets held for sale 1)
Intangible assets and property, plant and equipmentOther assets
Other liabilities
1) Amounts are presented net of internal balances with other Fortum subsidiaries, such as internal financing amounting to EUR 194 million.
Cash and cash equivalents
Liabilities related to assets held for sale 1)
Interest-bearing liabilities
42(53)

Fortum Corporation Notes to the condensed consolidated interim financial statementsJanuary-March 2015
EUR millionMarch 31
2015March 31
2014Dec 31
2014Opening balance 276 384 384Capital expenditures 2 12 22Changes of emission rights 0 1 -1Depreciation, amortisation and impairment 1) -6 -7 -25Divestments 0 0 -23Reclassifications 5 8 21Moved to assets held for sale 2) -29 0 0Translation differences and other adjustments 29 -17 -102Closing balance 277 381 276
Goodwill included in closing balance 197 256 17027 -19 -101
EUR millionMarch 31
2015March 31
2014Dec 31
2014Opening balance 11,195 12,849 12,849Acquisitions 1 0 0Capital expenditures 104 122 752Changes of nuclear asset retirement cost 0 -1 -3Disposals -2 0 -7Depreciation, amortisation and impairment 1) -107 -143 -502Divestments 0 0 -229Reclassifications -5 -8 -21Moved to assets held for sale 2) -2,544 0 0Translation differences and other adjustments 431 -284 -1,643Closing balance 9,074 12,536 11,1951) Including depreciations related to discontinued operations2) Swedish Distribution business which was classified as assets held for sale at the end of March 2015.
9. Income tax expense
Tax rate according to the income statement for Q1 2015 was 15.8% (Q1 2014: 16.6%). The tax rate used in the income statement is always impacted by the fact that the share of profits of associates and joint ventures is recorded based on Fortum's share of profits after tax. Tax rate for Q1 2015, excluding the impact of share of profits of associated companies and joint ventures, non-taxable capital gains was 19.0% (Q1 2014: 20.5%).
11. Changes in intangible assets
12. Changes in property, plant and equipment
Change in goodwill during the period due to translation differences
10. Dividend per share
A dividend for 2014 of EUR 1.10 per share and an extra dividend of EUR 0.20 per share, amounting to a total of EUR 1,155 million, was decided at the Annual General Meeting on 31 March 2015. The dividend and the extra dividend were paid on 14 April 2015.
A dividend in respect of 2013 of EUR 1.10 per share, amounting to a total dividend of EUR 977 million, was decided at the Annual General Meeting on 8 April 2014. The dividend was paid on 22 April 2014.
43(53)

Fortum Corporation Notes to the condensed consolidated interim financial statementsJanuary-March 2015
EUR millionMarch 31
2015March 31
2014Dec 31
2014Opening balance 2,027 2,341 2,341Acquisitions 0 0 62Share of profits of associates and joint ventures 1) 58 72 149Dividend income received 0 -1 -57OCI items associated companies -3 1 -16Translation differences and other adjustments 75 -39 -270Divestments -26 0 -181Closing balance 2,130 2,374 2,0271) Including shares of profits related to discontinued operations
Carrying Fair Carrying Fairamount value amount value
EUR millionMarch 31
2015March 31
2015Dec 31
2014Dec 31
2014
Long-term loan receivables 1) 2,044 2,177 2,044 2,2161) Carrying amount including current portion of long-term receivables EUR 3 million (Dec 31 2014: 3).
Carrying Fair Carrying Fairamount value amount value
EUR millionMarch 31
2015March 31
2015Dec 31
2014Dec 31
2014Bonds 4,779 5,204 4,748 5,093Loans from financial institutions 729 788 722 777Other long term interest-bearing debt 1) 1,260 1,331 1,226 1,296Total long term interest-bearing debt 2) 6,768 7,323 6,696 7,166Short term interest-bearing debt 214 214 287 287Total 6,982 7,537 6,983 7,453
At the end of March 2015, the amount of short term financing was EUR 214 million (Dec 31 2014: 287). The interest-bearing debt decreased during the first quarter by EUR 1 million from EUR 6,983 million to EUR 6,982 million.
Total liquid funds increased by EUR 502 million from EUR 2,766 million to EUR 3,268 million during the first quarter. At the end of the quarter liquid funds held by OAO Fortum amounted to EUR 200 (Dec 31 2014: 134) million.
Share of profits from associates and joint ventures
13. Changes in participations in associates and joint ventures
According to Fortum Group accounting policies the share of profits from Hafslund and TGC-1 are included in Fortum Group figures based on the previous quarter information since updated interim information is not normally available.
1) Including loans from Finnish State Nuclear Waste Fund and Teollisuuden Voima EUR 1,074 million (Dec 31 2014: 1,040), loans from Fortum´s Finnish pension institutions EUR 78 million (Dec 31 2014: 78) and other loans EUR 108 million (Dec 31 2014: 108).
14. Interest-bearing receivables
Long-term loan receivables include receivables from associated companies and joint ventures EUR 2,041 million (Dec 31 2014: 2,041). These receivables include EUR 1,326 million (Dec 31 2014: 1,310) from Swedish nuclear companies, OKG AB and Forsmarks Kraftgrupp AB, which are mainly funded with shareholder loans, pro rata each shareholder’s ownership. Long-term loan receivables include also receivables from Fortum Värme, EUR 538 (Dec 31 2014: 553) and Teollisuuden Voima Oyj (TVO), EUR 110 million (Dec 31 2014: 110).
TVO is building Olkiluoto 3, a nuclear power plant, which is funded through external loans, share issues and shareholder loans according to shareholders' agreement between the owners of TVO. At end of March 2015 Fortum has EUR 95 million outstanding receivables regarding Olkiluoto 3 and is additionally committed to provide at maximum EUR 100 million. A subordinated shareholder loan EUR 15 million has also been given to fund planning of Olkiluoto 4, to which Fortum has additionally committed to provide EUR 57 million.
15. Interest-bearing liabilities and cash and cash equivalents
Fortum's share of profit from associates and joint ventures in Q1 2015 was EUR 58 million (Q1 2014: 72), of which Hafslund represented EUR 8 million (Q1 2014: 8), Territorial Generating Company 1 (TGC-1) EUR 12 million (Q1 2014: 14) and Fortum Värme EUR 38 million (Q1 2014: 44).
2) Including current portion of long-term debt.
In March 2015 Fortum increased the amount of re-borrowing from the Finnish nuclear waste fund and Teollisuuden Voima by EUR 34 million to EUR 1,074 million.
44(53)

Fortum Corporation Notes to the condensed consolidated interim financial statementsJanuary-March 2015
EUR millionMarch 31
2015March 31
2014Dec 31
2014Carrying values in the balance sheetNuclear provisions 781 750 774Share in the State Nuclear Waste Management Fund 781 750 774
Legal liability and actual share of the State Nuclear Waste Management FundLiability for nuclear waste management according to the Nuclear Energy Act 1,084 1,059 1,084Funding obligation target 1,074 1,039 1,074
1,074 1,039 1,039
EUR millionMarch 31
2015March 31
2014Dec 31
2014March 31
2015March 31
2014Dec 31
2014Opening balance 56 103 103 26 14 14Unused provisions reversed -29 0 -4 0 -1 -3Increase in the provisions 0 0 0 1 8 22Provisions used 0 0 -14 -4 -1 -4Unwinding of discount 0 2 6 0 0 0Exchange rate differences 5 -7 -35 1 0 -3Moved to assets held for sale 0 0 0 -1 0 0Closing balance 32 97 56 23 19 26Current provisions 1) 32 19 56 9 2 10Non-current provisions 0 78 0 13 17 171) Included in trade and other payables in the balance sheet.
Nuclear related provisions
Other provisions
Fortum contributes funds to the Finnish State Nuclear Waste Management Fund based on the yearly funding obligation target decided by the governmental authorities in December in connection with the decision of size of the legal liability. The current funding obligation target decided in December 2014 is EUR 1,074 million. Fortum has paid the fee of EUR 24 million in March 2015 whereafter Fortum's share of the State Nuclear Waste Management Fund is fully funded. According to Nuclear Energy Act, Fortum is obligated to contribute fund in full to the State Nuclear Waste Management Fund to cover legal liability. Based on the law, Fortum applied for periodising of the payments to the fund over three years, due to proposed increase in the legal liability. The application was approved by the Ministry of the Employment and the Economy in December 2013. The Fund is from an IFRS perspective overfunded with EUR 293 million, since Fortum's share of the Fund on 31 March 2015 was EUR 1,074 million and the carrying value in the balance sheet was EUR 781 million.
Associated companies
17. Other provisions
CSA provisions
Operating profit in Power and Technology segment is affected by the accounting principle for Fortum's share of the Finnish Nuclear Waste Management Fund, since the carrying value of the Fund in Fortum's balance sheet can in maximum be equal to the amount of the provisions according to IFRS. As long as the Fund is overfunded from an IFRS perspective, the effects to operating profit from this adjustment will be positive if the provisions increase more than the Fund and negative if actual value of the fund increases more than the provisions. This accounting effect is not included in Comparable operating profit in Fortum financial reporting, see Other items affecting comparability in Note 4. Fortum had an effect from this adjustment in Q1 2015 of EUR 3 million, compared to EUR -4 million in Q1 2014.
Fortum has minority shareholdings in associated Finnish and Swedish nuclear production companies. Fortum has for these companies accounted for its share of the effects from nuclear related assets and provisions according to Fortum accounting principles.
Fortum's share of the State Nuclear Waste Management Fund
Effects to comparable operating profit and operating profit
According to Nuclear Energy Act Fortum submits the proposal for the nuclear waste management liability regarding the Loviisa nuclear power plant to the Ministry of Employement and Economy by end of June every third year. The liability is based on nuclear waste management plan which is also updated every third year. The cost estimates related to the new nuclear waste management plan were completed in Q2 2013. The overall future cost estimate increased mainly due to higher costs for interim and final storage of spent fuel and decommissioning of the power plant. The liability was decided by the Ministry of Employment and Economy at the end of year 2014.
The legal liability on 31 March 2015, decided by the the Ministry of Employment and Economy in December 2014, was EUR 1,084 million. The provision in the balance sheet related to nuclear waste management is based on cash flows for future costs which uses the same basis as the legal liability. The carrying value of the nuclear provision, calculated according to IAS 37, increased by EUR 7 million compared to 31 December 2014, totalling EUR 781 million on 31 March 2015. The main reason for the difference between the carrying value of the provision and the legal liability is the fact that the legal liability is not discounted to net present value.
16. Nuclear related assets and liabilities
Fortum's share in the State Nuclear Waste Management Fund
45(53)

Fortum Corporation Notes to the condensed consolidated interim financial statementsJanuary-March 2015
EUR millionMarch 31
2015March 31
2014Dec 31
2014On own behalfFor debt
Pledges 289 299 292Real estate mortgages 137 137 137
For other commitmentsReal estate mortgages 137 103 137
EUR millionMarch 31
2015March 31
2014Dec 31
2014Due within a year 24 23 24Due after one year and within five years 42 38 43Due after five years 79 102 76Total 1) 145 162 142
EUR millionMarch 31
2015March 31
2014Dec 31
2014Property, plant and equipment 460 504 458Intangible assets 4 6 3Total 1) 464 510 461
1) Including operating lease commitments for discontinued operations EUR 75 million at 31 March 2015.
Fortum's investment programme in Russia is subject to possible penalties that can be claimed if the new capacity is substantially delayed or agreed major terms of the capacity supply agreement (CSA) are not otherwise fulfilled. The provision made for possible penalties is assessed at each balance sheet date and the assessment is based on changes in estimated risks and timing related to commissioning of the remaining power plants in the investment programme.
The remaining CSA provision at the end of Q1 2015 amounts to EUR 32 million (at year end 2014: 56). In Q1 2015 EUR 29 million of the provision was reversed to the income statement after the finalisation of Nyagan 3.
19. Operating lease commitments
Fortum has given real estate mortgages in power plants in Finland, total value of EUR 137 million in March 2015 (Dec 31 2014: 137), as a security to the Finnish State Nuclear Waste Management Fund for the uncovered part of the legal liability and unexpected events relating to future costs for decomissioning and disposal of spent fuel in Loviisa nuclear power plant. The size of the securities given is updated yearly in Q2 based on the decisions regarding the legal liabilities and the funding target which take place around year end every year.
Participants in the Finnish State Nuclear Waste Management Fund are allowed to borrow from the Fund. Fortum has pledged shares in Kemijoki Oy as a security. As of 31 March 2015 the value of the pledged shares amounted to EUR 269 million (Dec 31 2014: 269).
Pledges also include bank deposits as trading collateral of EUR 1 million (Dec 31 2014: 3) for trading of electricity and CO2 emission allowances in Nasdaq OMX Commodities Europe, in Intercontinental Exchange (ICE) and European Energy Exchange (EEX).
Fortum Tartu in Estonia (60% owned by Fortum) has given real estate mortgages for a value of EUR 96 million (Dec 31 2014: 96) as asecurity for an external loan. Real estate mortgages have also been given for loans from Fortum's pension fund for EUR 41 million(Dec 31 2014: 41).
Regarding the relevant interest-bearing liabilities, see Note 15 Interest-bearing liabilities and cash and cash equivalents.
Pledged assets for debt
Pledged assets for other commitments
18. Pledged assets
1) Including capital commitments for discontinued operations EUR 29 million at 31 March 2015.
There are no pledged assets for discontinued operations at 31 March 2015.
20. Capital commitments
46(53)

Fortum Corporation Notes to the condensed consolidated interim financial statementsJanuary-March 2015
EUR millionMarch 31
2015March 31
2014Dec 31
2014On own behalf
Other contingent liabilities 67 72 64On behalf of associated companies and joint ventures
Guarantees 463 510 459Other contingent liabilities 125 125 125
On behalf of othersGuarantees 0 2 0
Guarantees on behalf of associated companies
Group companies
There are no contingent liabilities for discontinued operations at 31 March 2015.
22. Legal actions and official proceedings
Guarantees and other contingent liabilities on behalf of associated companies and joint ventures mainly consist of guarantees relating to Fortum's associated nuclear companies (Teollisuuden Voima Oyj, Forsmarks Kraftgrupp AB and OKG AB). The guarantees given on behalf of Forsmarks Kraftgrupp AB and OKG AB amounted to SEK 3,696 million (EUR 398 million) at 31 March 2015 (Dec 31 2014: EUR 393 million). The guarantee given on behalf of Teollisuuden Voima Oyj to the Finnish State Nuclear Waste Management Fund amounted to EUR 41 million at 31 March 2015 (Dec 31 2014: 41).
In December 2014 Fortum Oyj received a non-taxation decision from the large Taxpayers’ office for the years 2008-2011 regarding the activities in the Belgian and Dutch financing companies. The decision was given due to the transfer pricing audit carried out in 2013-2014 and was in line with the Board of Adjustment's decision with respect to Fortum for the year 2007. The Tax Recipients' Legal Services Unit has appealed the decisions in February 2015 and the cases are now pending before the Board of Adjustment of the Large Taxpayers' Office. According to the claim of correction, the non-taxation decision of the Large Taxpayers' office should be reversed and the interest income that Fortum Project Finance NV has received from its loans in 2008-2011 should be taxed in Finland, not in Belgium. If the claim of correction of the Tax Recipients' Legal Services Unit would be successful, the impact on net profit would be approximately EUR 140 million for the year 2008, EUR 99 million for the year 2009, EUR 76 million for the year 2010 and EUR 90 million for the year 2011. Moreover, Fortum Oyj would be liable to pay penalty interest. In line with the 2007 case Fortum considers the claims unjustifiable. Based on legal analysis and a supporting legal opinion, no provision has been accounted for in the financial statements.
21. Contingent liabilities
Fortum received income tax assessments in Sweden for the years 2009, 2010, 2011 and 2012 in December 2011, December 2012, December 2013 and October 2014, respectively. According to the tax authorities, Fortum would have to pay additional income taxes for the years 2009, 2010, 2011 and 2012 for the reallocation of loans between the Swedish subsidiaries in 2004-2005, as well as additional income taxes for the years 2010, 2011 and 2012 for financing of the acquisition of TGC 10 (current OAO Fortum) in 2008. The claims are based on a change in tax regulation as of 2009. Fortum considers the claims unjustifiable and has appealed the decisions. The cases are pending before the Administrative Court. In January 2015 the Swedish tax authority announced to the Administrative Court that it has abandoned its claim regarding the year 2010 with respect to financing the acquisition of TGC 10.
Based on legal analysis supporting legal opinions, no provision has been recognised in the financial statements. If the decisions by the tax authority remain final despite the appeals processes, the impact on net profit would be approximately SEK 425 million (EUR 46 million) for the year 2009, approximately SEK 379 million (EUR 41 million) for the year 2010, approximately SEK 511 million (EUR 55 million) for the year 2011 and approximately SEK 173 million (EUR 19 million) for the year 2012.
Fortum received an income tax assessment in Finland for 2007 in December 2013. Tax authorities claim in the transfer pricing audit, that detailed business decisions are done by Fortum Oyj and therefore re-characterize the equity Fortum has injected to its Belgium subsidiary Fortum Project Finance NV not to be equity, but funds to be available for the subsidiary. Tax authorities' view is that the interest income that Fortum Project Finance NV received from its loans should be taxed in Finland, not Belgium. Fortum considered the claims unjustifiable both for legal grounds and interpretation. Fortum appealed the decision.
The Board of Adjustment of the Large Taxpayers' Office approved Fortum's appeal for the year 2007 on 21 August 2014. The Board of Adjustment's decision is in line with the principle adopted in the Supreme Administrative Court's precedent in June 2014, according to which, under transfer pricing rules, the nature of business cannot be re-characterized for tax purposes, but can only adjust the pricing of goods or services. Despite the new precedent, the Tax Recipients' Legal Services Unit within the tax authorities has appealed this decision to the Administrative Court in Helsinki. If the appeal of the Tax Recipients' Legal Services Unit would be successful in court, the impact on net profit would be approximately EUR 136 million for the year 2007. Based on legal analysis and a supporting legal opinion, no provision has been accounted for in the financial statements.
Fortum has received income tax assessments in Belgium for the years 2008, 2009, 2010 and 2011. Tax authorities disagree with the tax treatment of Fortum EIF NV. Fortum finds the tax authorities' interpretation not to be based on the local regulation and has appealed the decisions. The court of First instance in Antwerpen rejected Fortum's appeal for the years 2008 and 2009 in June 2014. Fortum finds the decision unjustifiable and has appealed to the Court of Appeal. Based on legal analysis and a supporting legal opinion, no provision has been accounted for in the financial statements. If the decision of the tax authorities remain final despite the appeal process, the impact on the net profit would be approximately EUR 36 million for the year 2008, approximately EUR 27 million for the year 2009, approximately EUR 15 million for the year 2010 and approximately EUR 21 million for the year 2011.The tax has already been paid. If the appeal is approved, Fortum will receive a 7% interest on the amount.
47(53)

Fortum Corporation Notes to the condensed consolidated interim financial statementsJanuary-March 2015
Associated companies
EUR million Q1 2015Q1 2014 restated
2014 restated
Sales 14 6 76Interest on loan receivables 8 16 59Purchases 131 170 564
Associated company and joint ventures balances
EUR millionMarch 31
2015March 31
2014Dec 31
2014Long-term interest-bearing loan receivables 2,041 2,517 2,041Trade receivables 6 14 17Other receivables 16 20 15
Long-term loan payables 271 261 262Trade payables 1 11 7Other payables 4 3 4
24. Events after the balance sheet date
Transactions with associated companies and joint ventures
Related parties are described in the annual financial statements as of the year ended 31 December 2014. No material changes have occurred during 2015.
At the year-end 2014 the Finnish State owned 50.76% of the shares in Fortum. There has been no change in the shareholding during 2015.
In November 2014 Fortum sold its 31 %-shareholding in the Finnish natural gas company Gasum Oy to the Finnish State. See further information on the disposal in note 7 Acquisitions, disposals and assets held for sale.
The Swedish Energy Authority (EI), which regulates and supervises the distribution network tariffs in Sweden, has issued a decision concerning the allowed income frame for the years 2012-2015. The decision was appealed by more than 80 distribution companies and the dispute is now finally settled. EI was not granted leave of appeal to Supreme Administrative Court and, therefore, the decision of the Court of Appeal has become legally binding. New decision regarding allowed revenue will be taken by EI for each company.
In addition to the litigations described above, some Group companies are involved in other routine tax and other disputes incidental to their normal conduct of business. Based on the information currently available, management does not consider the liabilities arising out of such litigations likely to be material to the Group's financial position.
23. Related party transactions
There are no material events after balance sheet date.
In Finland Fortum is participating in the country's fifth nuclear power plant unit, Olkiluoto 3 (OL3), through the shareholding in Teollisuuden Voima Oyj (TVO) with an approximately 25% share representing some 400 MW in capacity. The civil construction works of the Olkiluoto 3 plant unit have been mainly completed, and the reactor main components are installed. The first phase of the turbine plant commissioning is completed. Preservation of the systems is ongoing. Conservation of the low-pressure turbine rotors has been completed. Reactor containment pressure and leak-tightness tests have been completed. Instrumentation and control system tests in the test bay in Erlangen, Germany continued alongside planning and licensing. In September 2014 TVO received additional data about the schedule for the OL3 project from the Supplier, AREVA-Siemens. According to this data, the start of regular electricity production of the plant unit will take place in late 2018. Detailed evaluation of the received data is ongoing.
In December 2008 the OL3 Supplier initiated the International Chamber of Commerce (ICC) arbitration proceedings and submitted a claim concerning the delay and the ensuing costs incurred at the Olkiluoto 3 project. The updated quantification which the Supplier submitted in October 2014 and corrected in November 2014 brings the total amount claimed by the Supplier for events occurring during the construction period ending June 2011 to approximately EUR 3.4 billion.
In 2012, TVO submitted a counter-claim and defense in the matter. The quantification estimate of TVO's costs and losses updated in October 2014 is approximately EUR 2.3 billion until the end of 2018, which according to the schedule submitted by the OL3 Supplier in September 2014, is the estimated start of the regular electricity production of OL3. The companies belonging to the Plant Supplier Consortium (AREVA GmbH, AREVA NP SAS and Siemens AG) are jointly and severally liable of the Plant Contract obligations. The arbitration proceedings may continue for several years and the claimed amounts may change.
48(53)

Fortum Corporation Notes to the condensed consolidated interim financial statementsJanuary-March 2015
EBITDA (Earnings before interest, taxes, depreciation and amortisation)
=
Comparable EBITDA =
Items affecting comparability =
Comparable operating profit =
Non-recurring items =
Other items affecting comparability =
Funds from operations (FFO) =
Capital expenditure =
Gross investments in shares =
Return on shareholders' equity, % = x 100
Return on capital employed, % = x 100
Return on net assets, % =x 100
Comparable return on net assets, % =
x 100
Capital employed =
Net assets =
Includes effects from financial derivatives hedging future cash-flows where hedge accounting is not applied according to IAS 39 and effects from the accounting of Fortum´s part of the Finnish Nuclear Waste Fund where the asset in the balance sheet cannot exceed the related liabilities according to IFRIC interpretation 5.
25. Definition of key figures
Operating profit + Depreciation, amortisation and impairment charges
EBITDA - items affecting comparability - Net release of CSA provision
Operating profit - non-recurring items - other items affecting comparability
Mainly capital gains and losses
Non-recurring items + other items affecting comparability
Net cash from operating activities before change in working capital
Profit for the year
Investments in subsidiary shares, shares in associated companies and other shares in available for sale financial assets. Investments in subsidiary shares are net of cash and grossed with interest-bearing liabilities in the acquired company.
Capitalised investments in property, plant and equipment and intangible assets including maintenance, productivity, growth and investments required by legislation including borrowing costs capitalised during the construction period. Maintenance investments expand the lifetime of an existing asset, maintain useage/availability and/or maintains reliability. Productivity investments improve productivity in an existing asset. Growth investments' purpose is to build new assets and/or to increase customer base within existing businesses. Legislation investments are done at certain point of time due to legal requirements.
Total equity average
Net assets average
Capital employed average
Comparable operating profit + Share of profit (loss) in associated companies and joint ventures (adjusted for IAS 39 effects, nuclear fund adjustments and major sales gains or losses)
Non-interest bearing assets + interest-bearing assets related to the Nuclear Waste Fund - non-interest bearing liabilities - provisions (non-interest bearing assets and liabilities do not include finance related items, tax and deferred tax and assets and liabilities from fair valuations of derivatives where hedge accounting is applied)
Profit before taxes + interest and other financial expenses
Operating profit + Share of profit (loss) in associated companies and joint ventures
Comparable net assets average
Total assets - non-interest bearing liabilities - deferred tax liabilities - provisions
49(53)

Fortum Corporation Notes to the condensed consolidated interim financial statementsJanuary-March 2015
25. Definition of key figures
Comparable net assets =
Interest-bearing net debt =
Gearing, % = x 100
Equity-to-assets ratio, % = x 100
Net debt / EBITDA =
Comparable net debt / EBITDA =
Interest coverage =
Interest coverage including capitalised borrowing costs
=
Earnings per share (EPS) =
Equity per share =
Last twelve months (LTM) =
Interest-bearing net debt
Operating profit + Depreciation, amortisation and impairment chargesInterest-bearing net debt
Twelve months preceding the reporting date
Shareholder's equity
Comparable EBITDA
Operating profitNet interest expenses
Net interest expenses - capitalised borrowing costs
Number of shares at the end of the period
Average number of shares during the periodProfit for the period - non-controlling interest
Operating profit
Interest-bearing net debt
Total assets
Total equity
Total equity including non-controlling interest
Interest-bearing liabilities - liquid funds
Net assets adjusted for non-interest bearing assets and liabilities arising from financial derivatives hedging future cash flows where hedge accounting is not applied according to IAS 39
50(53)

Fortum CorporationJanuary-March 2015
Power consumption
TWh Q1 2015 Q1 2014 2014
Last twelve
monthsNordic countries 110 110 378 378Russia 276 277 1,021 1,020Tyumen 24 24 93 93Chelyabinsk 10 10 36 36Russia Urals area 69 70 260 259
Average prices
Q1 2015 Q1 2014 2014
Last twelve
monthsSpot price for power in Nord Pool power exchange, EUR/MWh 28.1 30.2 29.6 29.1Spot price for power in Finland, EUR/MWh 32.1 35.2 36.0 35.2Spot price for power in Sweden, SE3, Stockholm EUR/MWh 28.6 30.0 31.6 31.3Spot price for power in Sweden, SE2, Sundsvall EUR/MWh 27.7 29.8 31.4 30.9Spot price for power in European and Urals part of Russia, RUB/MWh 1) 1,122 1,116 1,163 1,165Average capacity price, tRUB/MW/month 394 335 304 321Spot price for power in Germany, EUR/MWh 32.1 33.5 32.8 32.4Average regulated gas price in Urals region, RUB/1000 m3 3,362 3,362 3,362 3,362Average capacity price for old capacity, tRUB/MW/month 2) 163 183 167 162Average capacity price for new capacity, tRUB/MW/month 2) 715 609 552 589Spot price for power (market price), Urals hub, RUB/MWh 1) 1,051 1,018 1,089 1,097CO2, (ETS EUA), EUR/tonne CO2 7 6 6 6Coal (ICE Rotterdam), USD/tonne 61 79 75 71Oil (Brent Crude), USD/bbl 55 108 99 861) Excluding capacity tariff.2) Capacity prices paid only for the capacity available at the time.
Water reservoirs
TWhMarch 31
2015March
31 2014Dec 31
2014Nordic water reservoirs level 42 45 80Nordic water reservoirs level, long-term average 41 41 83
Export/import
TWh (+ = import to, - = export from Nordic area) Q1 2015 Q1 2014 2014
Last twelve
monthsExport / import between Nordic area and Continental Europe+Baltics -4 -5 -14 -13Export / import between Nordic area and Russia 2 1 4 5Export / import Nordic area, Total -2 -4 -10 -8
Power market liberalisation in Russia
% Q1 2015 Q1 2014 2014
Last twelve
monthsShare of power sold at the liberalised price by OAO Fortum 83 82 81 82
Achieved power prices
EUR/MWh Q1 2015 Q1 2014 2014
Last twelve
monthsPower's Nordic power price 37.7 39.7 41.4 40.8Achieved power price for OAO Fortum 26.0 30.7 30.4 29.0
Market conditions and achieved power prices
51(53)

Fortum CorporationJanuary-March 2015
Power generation
TWh Q1 2015 Q1 2014 2014Last twelve
monthsFortum power generation in the EU and Norway 13.3 14.3 50.1 49.1Fortum power generation in Russia 7.5 6.3 23.3 24.5Total 20.8 20.6 73.4 73.6
Heat production
TWh Q1 2015 Q1 2014 2014Last twelve
monthsHeat production in the EU and Norway 2.3 3.0 8.2 7.5Heat production in Russia 9.5 9.9 26.4 26.0Total 11.9 12.9 34.6 33.6
Power generation capacity by segment
MW March 31
2015March 31
2014Dec 31
2014Power 9,068 9,176 9,063Heat, Electricity Sales and Solutions 749 793 803Russia 4,663 4,292 4,758Total 14,479 14,261 14,624
Heat production capacity by segment
MWMarch 31
2015March 31
2014Dec 31
2014Power 0 250 0Heat, Electricity Sales and Solutions 3,913 4,230 3,936Russia 12,994 13,466 13,466Total 16,906 17,946 17,402
Power generation by source in the Nordic area
TWh Q1 2015 Q1 2014 2014Last twelve
monthsHydro and wind power 6.2 6.4 22.4 22.2Nuclear power 6.3 6.6 23.8 23.5Thermal power 0.4 0.5 1.8 1.7Total 12.8 13.5 48.0 47.3
Power generation by source in the Nordic area
% Q1 2015 Q1 2014 2014Last twelve
monthsHydro and wind power 48 48 46 46Nuclear power 49 49 50 50Thermal power 3 3 4 4Total 100 100 100 100
Power sales
EUR million Q1 2015Q1 2014 restated
2014 restated
Last twelve months
Power sales in the EU and Norway 574 643 2,344 2,275Power sales in Russia 183 218 758 723Total 757 861 3,102 2,998
Fortum's production and sales volumes
52(53)

Fortum CorporationJanuary-March 2015
Fortum's production and sales volumes
Heat sales
EUR million Q1 2015 Q1 2014 2014Last twelve
monthsHeat sales in the EU and Norway 161 177 468 452Heat sales in Russia 80 112 285 253Total 241 289 753 705
Power sales by area
TWh Q1 2015 Q1 2014 2014Last twelve
monthsFinland 5.7 6.0 21.6 21.3Sweden 8.0 8.2 28.2 28.0Russia 8.4 7.1 26.5 27.8Other countries 0.9 1.1 3.8 3.6Total 23.1 22.4 80.1 80.8
NordPool transactions are calculated as a net amount of hourly sales and purchases at the Group level.
Heat sales by area
TWh Q1 2015 Q1 2014 2014Last twelve
monthsRussia 9.5 9.7 26.0 25.8Finland 1.2 1.3 3.2 3.1Poland 1.5 1.5 3.4 3.4Other countries1) 0.5 1.1 2.8 2.2Total 12.7 13.6 35.4 34.51) Including the UK, which is reported in the Power and Technology segment, other sales.
53(53)