formation of nanotubular tio2 bioactive oxide layer on ...laporan akhirskim geran.penyeudikanasas...
TRANSCRIPT

UNlVERSm SAINS MALAYSIA
Laporan Akhir Projek Penyelidikan Jangka Pendek
Formation of Nanotubular TiOa Bioactive
Oxide Layer on Titanium and CellResponse Studies
byAssoc. Prof. Dr. Srimala Sreekantan
Prof. Zainal Arifin Ahmad
Mr. Ishak Mat
Norehan Mokhtar
2011

%
/i, bUKANU hKUa - P31K)
B
FINAL REPORTFUNDAMENTAL RESEARCH GRANT SCHEME (FRGS)
Laporan Akhir Skim Geran.PenyeUdikan Asas (FRGS) IPTPlndaam1/2010
RESEARCH TITLE
Tajuk Penyelldikan
PROJECT LEADERKetua Projek
PROJECT MEMBERS
(including GRA)
Ahli Projek
: Formation of NanotubularTi02Bioactive oxide layer on titanium and ceil response
m
Srimaia Sreekantan
1. Zainai Arifin Ahmad
2. Ishak Mat
3. Norehan Mokhtar
""'msi'P/mi• r.
I.;.-, s'•
ACHIEVEMENT PERCENTAGE
Project progress according tomilestones achieved up to thisperiod
Percentage (based on the revisedobjectives and'tnilestone)
0-50% 61 -75%
RESEARCH OUTPUT
76 -100%
Number of articles/ manuscripts/books
(Please attach the First Page ofPublication)
indexed Journal Non-Indexed Journal
1 (Journal of Nanomaterials)Prove Attachedin Appendix A
0
Conference Proceeding(Please attach the First Page ofPublication)
International National
0 0
intellectual Property(Please specify) : .-.uS... .
t - ••• • • "^zr.a
HUMAN CAPiTAI^^OfeVELOPMENT'
Human CapitalNumber . Others
(please specify)On-£loing Graduated
Citizen MalaysianNan
MalaysianMalaysian
Non
Malaysian
PhD Student -
Master Student
Undergraduate Student 2
Total 2

Budget Approved (Peruntukan diluluskan)Amount Spent (Jumlah Perbelanjaan)
Balance (Baki)Percentage of Amount Spent(Peratusan Belanja)
Account Statement is attached in Appendix B
RM 24,000.00RM 31,766.53
RIVI -7.766.53
132.00.%
ang. kepa^. pembaRayjja^^
1 internationalActivity Date (Month. Year) Organizer
(e.g : Course/ Seminar/ Symposium/Conference/ Workshop/ SiteVisit)
0
1 NationalActivity Date (Month, Year) Organizer
(e.g : Course/ Seminar/ Symposium/Conference/ Workshop/ SiteVisit)
0
We only manage to complete a portion of the proposed projecLfor.thebudget approved for this work not sufficienttocomplete ailthe objectives. The cell interaction is notinvestigatedfrrdetailfor the budget approved only 24, 000 and it iscertainly not sufficient for such studies. Therefore we jusf:manageta work on the formation of Ti02 nanotubes on Tialloys which supplied by Straits Orthopaedics.
'^Rehambahiiaikkh)- ''
Hope thebudget allocated is adequeat to conduct comprehensive work on such studies. This will allow us to understandthe fundamental knowledge lies in the project an propose mechanistic model of such cell interaction on nanotubularstructure. This ultimateoutput will contribute to the field of health science.

^AABSfRAGTf^ot More ^ 20W6x^s-(lAbsfraR:'̂ ^eMiiianM
This work focus on the formation of titanium oxide {Ti02) nanotubes on theTi-6AI-4V alloy by anodization method inorganic ethylene giycoi electrolyte (EG). The dimension of nancAubes could betuned by changing the electrochemicalparameters such as NH4F content, voltage applied; and anodizationtime. The average nanoporous or nonotubediameter and length were found to increase with increasing ambunt of fluoride, anodization voltage and anodizationtime. Minimum of 0.5 g NH4F is required for growth of nanotubes.:TT02 nanotubes with average diameter of 110 nmand 3.1 pm lengths were obtained in EG containing 0.7 g NH4F. Upon annealing from temperature 400°C to 600°C inargon atmosphere shows crystallization of the nanotubes to anatase phase exists at 400°C while rutile dominantly existsat eOO^C. Anodization in the organic electrolyte resulted in homogeneous structure unlike the one reported in aqueousacidified fluoride solution which resulted in inhomogeneous stnjcture due to the severe attack of the p-phase. For thecase of behavior of cell interaction using human foreskin fibrobfast cells line (HS27) studies shown that amorphous Ti02nanotubes structure has better cellular interaction as compare to anatase and rutile crystal structure.
The Full technical report is attached in Appendix C
24 Aug 2011 Project Leader's Signature;Tandatangan Ketua Projek

H
91^^ Nu <!hctab. UAeigwii^ 1
Name:
Nama:
Date:
Tarikh:
Signature: iTandatangan:

uo|)i>oi|qAj
IIKipudddu
('
).I

Hindawi
EQuj^^ ;/C -v',-:'-g^f
239289.V3 (Research Article)
Journal
Additional Files
Manuscript Number
Resubmitted On
Authors
Characterization and photocatalytic activity ofenhanced copper-silica loaded titania prepared viahydrothermal method
Journal of Nanomaterlals
Regular
Reply to review reports
239289.v3 (Research Article)
2011-06-23
t. '± Ramarao Poliahj t: 5 Srimala Sreekanta
t_ -5 Edward Andrew Payzant (Assigned on 2011-06-23)
Editorial Recommendation Publish Unaltered (Made On 2011-07-13)
Editorial Decision Accepted (Made On 2011-07-13)
Cha
ract
eriz
atio
nan
dph
otoc
atal
ytic
activ
ityof
enha
nced
copp
er-s
ilica
load
ed
tita
nia
prep
ared
via
hydr
othe
nnal
met
hod
Ram
arao
Polia
h',S
rim
alaS
reek
anta
n^*
^Sch
ool
ofM
ater
ials
and
Min
eral
Res
ourc
esEn
gine
erin
g,U
nive
rsiti
Sain
sM
alc^
sia,
Engi
neer
ing
Cam
pus,
Nib
ongT
ebai
,Seb
eran
gPe
raiS
elat
an,P
ulau
Pina
ng14
300,
Mal
aysia
.
Em
ail:
ram
arao
2609
@gm
ail.c
om.s
nmal
a@en
g.us
m.m
y
*Cor
resp
ondi
ngau
thor
.
—Sc
hool
ofM
ater
ials
and
Min
eral
Res
ourc
esEn
gine
erin
g,U
nive
rsiti
Sain
sM
alay
sia,
Eng
inee
ring
Cam
pus,
Nib
ong
Teba
l,Se
bera
ngPe
raiS
elat
an,P
ulau
Pina
ng14
300,
Mal
aysi
a.
Tel
:+
604
5995
255:
Fax:
.+60
459
4101
1
E-m
ail:
srim
ala@
.eng
.usm
.my
(S.S
reek
antp
n).
Ab
str
act
TiO
ina
nopo
wde
r,lo
aded
with
SiO
zan
dC
u-Si
Oz,
was
prep
ared
unde
rbo
thac
idic
and
basi
c
envi
ronm
ents
via
the
hydr
othe
imal
met
hod.
The
mor
phol
ogy
and
stru
ctur
eo
fTiO
zw
ere
stud
ied
byX
RD
,TE
Man
dFT
-IR
.The
phot
ocat
alyt
icac
tivity
ofsa
mpl
esw
asst
udie
dby
mon
itori
ngth
e
degr
adat
ion
ofm
ethy
lora
nge,
usin
ga
UV
-vis
ible
spec
trop
hoto
met
er.T
heef
fect
ofT
i/Sir
atio
,
pH,a
ndad
ditio
non
the
form
atio
nof
TiO
zand
itsph
otoc
atal
ytic
activ
ityw
ere
inve
stig
ated
inde
tail.
The
resu
ltssh
owth
ata
larg
esu
rfac
ear
eaan
da
high
sur&
ceac
idity
wer
eim
port
ant
fact
orst
oac
hiev
ego
odT
iOzp
erfo
rman
ce.
The
pres
ence
ofT
i-O
-Sib
ondi
ngen
hanc
edsu
rfec
e
acid
ity,w
hich
impr
oved
itsab
ility
toad
sorb
mor
ehy
drox
ylra
dica
lsan
din
crea
sed
itssu
rfac
e
area
.A
dditi
onof
0.1m
ol%
conc
entr
atio
nof
Cu^
*an
d2S
mol
%Si
Oz
inT
iOz
indu
ced
the
form
atio
no
fnew
stat
escl
ose
toth
eco
nduc
tion
band
,whi
chna
rrow
edth
eba
ndga
pen
ergy
and
enha
nced
the
phot
odeg
rada
tion
effi
cien
py.
:,•
.
Keyw
ords
:Tita
nia;S
ilica
;Cop
per;
Hytjf
btherm
a!;Ph
otopa
talyti
pacti
vity;
pH

1.0 Introduction
In recent years, cases of air and water pollution have been increasing due to the
continuous rise inpopulation Mdurbanization. Improper waste management has been identified
as one of the prime factors that contribute to the pollution. In 2003, the average amount of
municipal solid waste (MSW) generated in Malaysia was 0.5-0.8 kg/person/day, which has
further increased to 1.7 kg/person/day in major cities [1]. Solid waste management continues to
bea major challenge throughout the world, particularly in rapidly growing cities and towns [2].
Land filling and incineration are two of the most common methods of solid waste
disposal. Unlike land filling, incineration requires minimum land, reduces thevolume of solid
waste by half, and can be operated in any weather. Nevertheless, emission of pollutants,
especially dioxin and furan, is themajor drawback of incineration. Among thevarious solutions
available, photocatalysis is considered to be a green technique that has great potential to
decompose contaminants witiiout leaving bagful intermediates [3-5].Choiet al. reported that
the polychlorinated dibenzo-p-dioxins such as mono-, tetra-, h®Pta-, and octachlorinated
congeners weresuccessfully degraded bya TiOifilm qnder UV or So|arlightirradiation [6].
Titaniumdioxide is the most promisingphotocatalyst due to its superior properties such
as low cost, environmental compatibility, and long term photochemical stability [7-10].
However, its wide band gap energy (3.0 for rutile; 3.2 for anatase) limits its use as a
photocatalyst in various applications. The large surface area,high crystallinity, low crystallite
size, and crystal structureare important properties that influence the photccatalytic activityof
TiOj. In recent years, much efibrt has been directed towardTiOj modification to enhance its
photccatalytic activity [11-15]. For instance, TiOa loaded with various secondary oxides such
asZr02 [16], WO3, Mn02, CuO, VzOj, A^Cb [17] and transition metals saltsuch as Cu^* [18]
and Fe '̂̂ [19,20], has been reported to be a more efficient photocatalyst than pureTi02. The
composite Ti02-Si02 has attracted great interest because of its ability to prevent the grain3
growthof TiOi particlesand enhancethe thermalstabilityfor the phasetransformation ofTi02
from anatase to rutile [21-27]. Xu et al. [24] studied the effect of a wide range of SiCb levels
added to the microstructure and the photccatalytic activity of TiO: powder; preparation
involved the sol-gel methodand calcination at various temperatures. Addition of SiOz resulted
in a marked reduction in grain size and an increase in the surface area of the catalyst. Results of
other studies are summarized in Table 1. Although many reports describe the effect ofSi02 on
the photccatalytic activity of Ti02, the results do not agree with one another, possibly due to
differences in the processing methods or experimental conditions. On the other hand, Chen et al.
[18] has been reported that 0.1wt% of Cu^"*" doped Ti02-Si02 showed higher photccatalytic
activity than that of undoped Ti02-Si02. The effects of pH value on pureTiOz formation have
been reported by several groups [28,29].Yu et al. preparedTIO2 powderat differentpH values
throughthe hydrothermal method[28].They found that the pH valueof the startingsolutionhas
a significant effect on the crystallinity, crystallite size, phase structure, and photocatalytic
activity ofthe synthesized Ti02 powder. They proposer) that basic conditions are favorable for
the formation of pure anatase. Samples preparerl at pl^ 9rlispjay higjier phojocatalytic activity.
However, this result contradicts those obtained by ICaraiTii eta|. [29], who concluded that Ti02
prepared under acidic conditions (plf 3) threngh the so|-ge| method has higher photocatalytic
activity. ....
Although the sol-gel method is widely used due to its simplicity and low cost,
calcination in air is requiredfor the formation of the anatase phase from amorphous TiCb. Li et
al. [26] did a comparative study of the sol-gel and hydrothermal methods for the synthesis of
Ti02-SiO2 compositenanoparticles, and found that samples prepared through the hydrothermal
routestill possess a stableanatase phase, a largespecific surface area,a small particle size,and
a highphotocatalytic activity, evenwhen calcined at 1000 °C. However, they did notreporttlie
effectof pH on the formation of Ti02-Si02 nanoparticles. In the present snidy, the effectof pH
values on photocatalytic activity andtheoptimum Ti/Siratiofor photocatalytic activity of Ti02

powderpreparedbyhydrothermalmetliodwereexamined.TheeffectofCu-SiC)2additionon
thephasestructureandthephotocatalyticactivityofTi02werealsostudied.
Table1PhotocatalyticactivityofTiOzwiflivariousSiOicontent
Ti/SiRatioPreparationCrytallitePhasePhotocatalytic(%)MethodSize(nm)StructureActivity(%)
1:1(50%)[18]5-8
1:1(50%)[19]9h)'00-120A:100%95(RhodamineB.2h)
19:1(5%)[20]fsoo^ocih)0.7A:1Q0%73(MO.1h)3*1^25%^1211Sol-gel4.5(A) j.l(25/0)IZIJ2h)9.2(R)
7:3(30%)[22]2h)
3:2(40%)(23]7
_3.^(25%)[24]
A:100%90(MB,2h)
A;43.3%65(MO,2h)
A:|00%9;i(MO,5h)
A:100%95(MB,1h)
A:100%80(MB,8h)
Aanatase,R=rutile,MB=methylblue.MO»methylorange
2.0ExperimentalProcedure
2.1Preparation
Initially,theoxidepowderTiOi-SiOzwithvariousTi/SiratiosatpH3and9were
prepared,andthephotocatalyticperformancewasevaluatedtoselecttheoptimumTi/Siratio.
TheTi/SiratiosandpHvaluesintheexperimentaresummarizedinTable2.
Tetrabutylorthotitanate(TBOT)withanormalpurityof97%(Aldrich,US)and
tetraethylorthosilicate(TEOS)withanormalpurityof98%(Merck,Germany)wereusedasthe
sourceoftitaniumandsilicon,respectively.Bothweredissolvedinequalvolumesofethanol,
afterwhichafewdropsofhydrochloricacjdwereaddedtoTEOSascatalyst.Afterward,the
mixturewaskeptinawaterbathmaintainedat70"Cfor2h.TheTEOSandTBOTprecursors
werethenmixedandstirredfor15minutesbeforeacldingthedesiredamountofcopper(ll)
nitrate.ThepHvalueswereadjustedbyadding{lydfocjijprjcacidfortheacidiccondition,and
sodiumhydroxideforthebasiccondition.Thissolutionwasstirredfor1hatroomtemperature
andplacedinaTeflon-linedstainlesssteelautoclave,inwhichitwasheatedat150°Cfor24h,
andthencooledtoroomtemperatpre.filesatppieobtainedwaswashedandthendriedat100
"C.Apowderwasobtained.
2.2Characterizationandphotocatalyticdegradation
ThepowdersampleswerecharacterizedbyX-raydifftaction(XRD)usingaBrukerD8
powderdifftactometeremployingCuKaradiation.Theacceleratingvoltageandtheapplied
currentwere40kVand40mA,respectively.TheaveragecrystallitesizeoftheTiOi-SiOi
oxidepowderwascalculatedusingX-raylinebroadeningmethodsbasedontheScherrer
formula.Additionally,themorphologyofthepowderwasobservedbytransmissionelectron
microscopy(TEM)usingaPhilips420T.Thechemicalstructureinformationoftheparticles

was obtained by Fourier transform infrared spectroscopy (Spectrum One, Perkin Elmer, US).
Photocatalytic degradation studies were performed using 30 mg/L methyl orange (MO)
solution. A total of 0.1 g TiOi-SiOj oxide powder was added to 30 mL ofMO solution and
photoirradiated for 1h at room temperature using aTUV 18W UV-C Germicidal light The
concentration of the degraded MO was determined using a UV-visible spectrophotometer
(Varian, Gary 50 Cone).
Table2 Crystal properties ofTi02-Si02 oxide powder
Sample Ti/Si RatioSi02 Final Crystallite size/nm
SAO I: 0 0 3 6.30
SA5 19 : 1 5 3 6.63
SAID 9 1 10 3 7.06
SA16 5 1 16.67 3 8.91
SA20 4 1 2P 3 9.54
"SA25 3 1 25 3 6.88
SA2S-Cu(0.05) 3 1 25 3 10.8
SA25-Cu(0.1) 3 I 25 3 9.48
SA2S-Cu(0.15) 3 1 25 3 9.62
SA2S-Cu(0.2) 3 1 25 3 10.11
SA25-Cu(0.5) 3 1 25 3 8.21
SA25-5 3 1 25 5 8.63
SN25-7 3 1 25 7 9.98
SA30 7 3 30 3 11.78
_SA50 1 1 50 3 11.76
SBO I 0 0 9 3.75
SB16 5 1 16.67 9 -
SB20 4 1 20 9 -
SB2S 3 1 25 9 -
SB2S-12 3 1 25 12 -
SB25-14 3 1 25 14 4.57
SB30 7 3 30 9 -
SBSO I 1 50 9 -
—SA-= Acid, SB = Basic, SN = Neutral
3.0 Results and discussion
3.1 Effect ofSi02 content
XRD was used to analyze the formation of the crystalline phase of the Ti02 powder
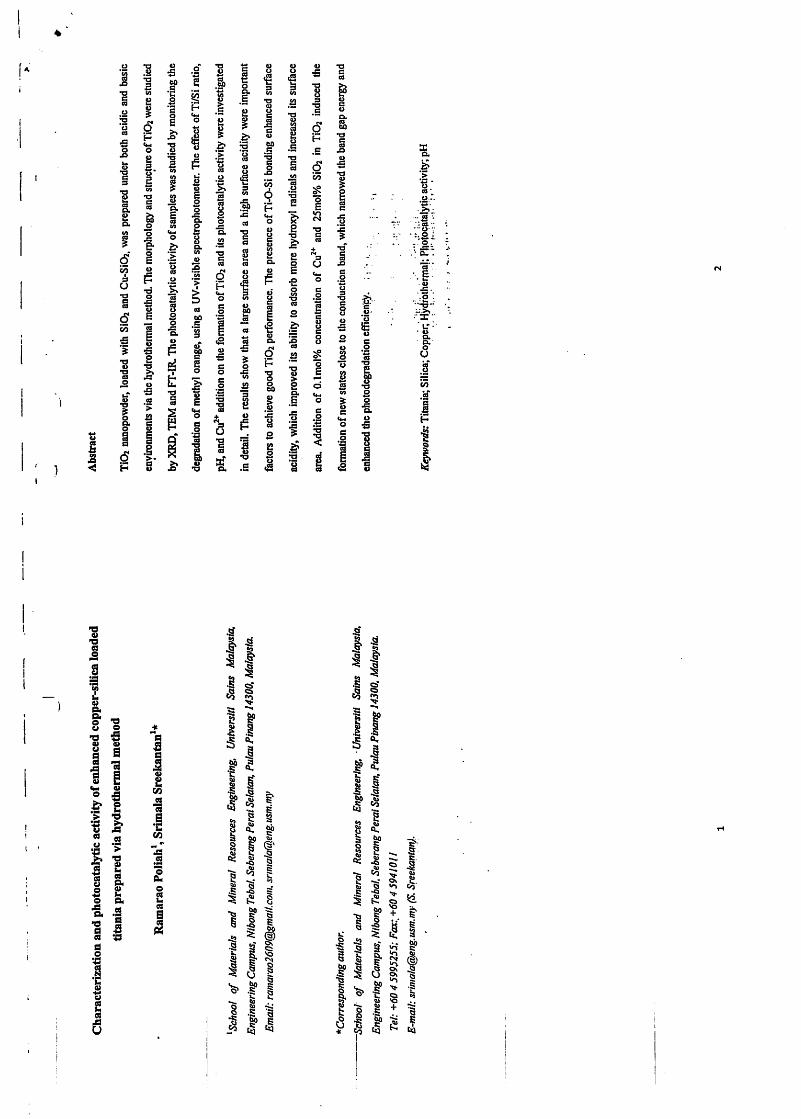
prepared with various amounts of Si02 in both acidic and basic environments. Figure 1
illustrates the XRD patterns of Ti02 prepared at pH 3 with various Ti/Si ratios. The Ti02
prepared at various Ti/Si ratios led to formation of the anatase phase. Patterns of samples
without Si02 (SAO) shows peak for anatase and a small peak for the brookite phase at a
diffiraction angle of~20''. Therelative intensities oftheanatase diffraction peaks ineach sample
aredifferent; this suggests thatthe degree ofcrystallinity isaffected bythe Si02 content. A high
crystallinity of Ti02 was obtained with addition of 30 mol% Si02 (SA30), whereas low
crystallinity was observed insamples with 25 ino|% SjOa {SA25). No Si02 crystal phase was
identified in all samples. This indjcates that SjOj existerj as an amorphous phase in the Ti02-
Si02 composite.
The formation ofbrookite phpsc jn san]p|c SAO (^cidic condition) could be explained as
follows [28]: Ti(OH)^OC4H9)+« a r®?Mlt ofjiydfolysis reaction between TBOT and
HCI where * was related to therH vajue ofstarting sojution. Since the ligand field strength of
Cr ions was larger than that of butojq' group inHCI solution, thus the CI* ions could substitute
tlie butoxy group in the Ti(OH)x(OC4H9)4.r complex and led to the formation of complex
Ti(OH)2Cl2. The complex Ti(OH)2Cl2 actually existed in the form of Ti(0H)2Cl2(H20)2 in a
solution due to theTi(IV)(3d°) complex ions are all octahedrally coordinated in solution and
crystal. It is reported that Ti(0H)2Cl2(H20)2 could be the precursor of brookite. This
mechanism was favored to explaintheoccurrence of brookitein thesample.
The XRDpatterns of Ti02 prepared at pH 9 with various Ti/Si ratios (notshown here)
shows samples prepared without Si02 (SBO) produced peaks characteristic of anatase at 26 of
24,34,39, and 48°, and thepeak ofmtile at 28°. However, thepeak intensity of this sample is8
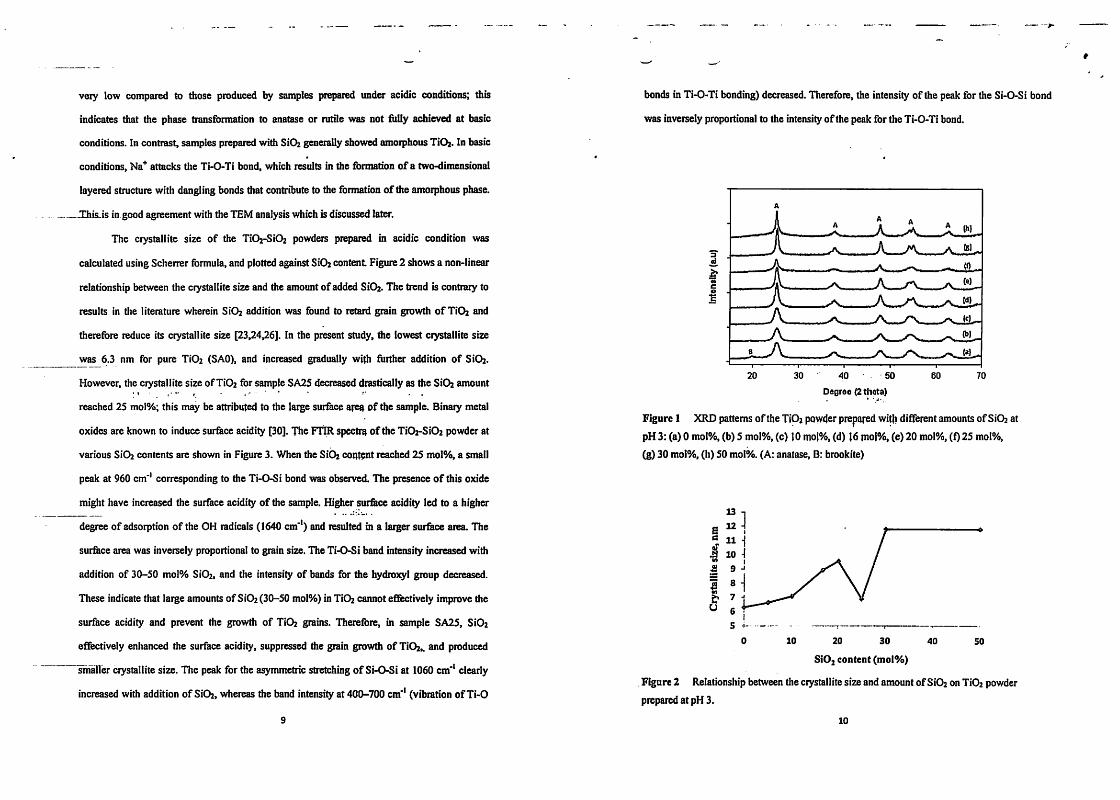
very low compared to those produced by samples prepared under acidic conditions; this
indicates that the phase transformation to anatase or rutile was not fully achieved at basic
conditions. In contrast, samples prepared with SiOr generallyshowed amorphous Ti02. In basic
conditions,Na^ attacks tire Ti-O-Ti bond, which results in the formationofa two-dimensional
layered structure with dangling bonds that contributeto the formationof the amorphous phase.
This-is in good agreement with the TEM analysiswhichis discussedlater.
The crystallite size of the Ti02-Si0z powders prepared in acidic condition was
calculated using Scherrer formula, and plottedagainstSiOzcontent Figure2 shows a non-linear
relationship between the crystallitesize and the amountof added SiOz. The trend is contrary to
results in the literature wherein SiOz addition was found to retard grain growth of TiOz and
therefore reduce its crystallite size [23,24,26]. In the present study, the lowest crystallite size
was 6.3 nm for pure TiOz (SAO), and increased gradually wifh further addition of SiOz.
However, the crystallite size ofTiOz for sample SA2S decreased drastically as the SiOz amount
reached 25 moi%; this may be attributed to the large surface atea of the sample. Binary metal
oxides areknown to induce surface acidity [30]. TheFTTR spectra of theTiOz-SiOz powder at
various SiOz contents are shown in Figure 3. When the SiOz corttent reached 25 moI%, a small
peak at 960 cm*' corresponding to theTi-O-Si bond was observed. Thepresence of thisoxide
miglit have increased the surface acidity of the sample. Higher sur&ce acidity led to a higher
degree of adsorption of theOH radicals (1640 cm*') and resulted ina larger sur&ce area. The
sur&ce area was inversely proportional to grain size. The Ti-O-Si band intensity increased with
addition of 30-50 mol% SiOz, and the intensity of bands for the hydro}tyl group decreased.
These indicate that large amounts of SiOz(30-50 mol%) in TiOzcannot effectively improve the
surface acidity and prevent the growth of TiOz grains. Therefore, in sample SA25, SiOz
effectively enhanced the surface acidity, suppressed &e grain growth of TiOz,. und produced
"smaller crystallite size. Tlie peak fortheasymmetric stretching of Si-O-Si at 1060 cm*' clearly
increased with addition of SiOz, whereas theband intensity at 400-700 cm*' (vibration ofTi-0
9
bonds in Ti-O-Ti bonding)decreased.Therefore, the intensity of the peak for the Si-O-Si bond
was inverselyproportional to the intensityof the peak for the Ti-O-Ti bond.
40 50
Oegroe (2theta)
Figure 1 XRD patterns ofthe TiOz povvder prepared with different amounts ofSiOz at
pH 3; (a) 0 mol%, (b) 5 mol%, (c) 10 mo|%, (d) 16 mo|%, (e) 20 mol%, (0 25 mol%,
(g) 30 moI%, (h) 50 mol%. (A: anatase, B; brookite)
10 20 30
Si02 content (mol%)
Figure 2 Relationship betweenthe crystallitesize and amount of SiOzon TiOzpowder
prepared at pH 3.
10

OH
gro
uS8
0rn
-o-T
i)
35
00
30
00
25
00
20
00
15
00
10
00
50
0
Wav
enu
mb
er(c
m'M
Figu
re3
FTIR
spec
traof
TiOi
-SiO
zoxi
depo
wder
cont
ainin
gSiC
h:(a
)0in
ol%
,(b
)5m
ol%,(
c)10
mol%
,(d)
16m
ol%,(
e)20
mo!%
,(f)
25m
ol%,(
g)30
mol%
,(h)
50m
ol%.
Ain
dica
tesab
sorp
tion
band
sat9
60cm
"',w
hich
isch
arac
teris
ticof
Ti-O
-Sib
ondi
ng.
3.2
Eff
ect
ofp
Hva
lue
Figu
re4
show
sth
eXR
Dpa
ttern
ofTi
Ozpo
wder
with
25m
ol%
SiO
i(Ti
02-2
5ino
l%
Si02
)atv
ario
uslev
elsof
pH.I
nth
epre
senc
eofS
iO:,
anac
idic
cond
ition
wasf
evor
able
tofo
rm
anat
ase
struc
ture
.A
sthe
syste
mis
shift
edfro
mac
idic
tone
utra
l,th
ein
tens
ityof
thea
nata
se
peak
(20
=25
°)an
dth
ecr
ystal
lite
size
incr
ease
d.Th
us,p
Hva
lue
also
affe
cted
the
degr
eeof
crys
tallin
ityde
spite
the
pres
ence
ofSi
Oj.
AtpH
12,t
hecr
ystal
struc
ture
ofsa
mpl
eSB
25-1
2
coul
dno
tcor
resp
ond
toan
atase
,ru
tile
orbr
ooki
te.It
was
simila
rto
that
ofN
a207
Ti3[
31],
-H2n
024S
i3Ti4
and
H4Na
40i6S
i4Ti2
prob
ably
due
toth
eir
sam
ela
yere
dtit
anat
efa
mily
[32]
.
Furth
erin
crea
sein
basic
cond
ition
(pH
14)r
esul
ted
info
rmat
ion
ofth
epar
tiala
nata
seph
ase,
as
seen
inth
eTEM
imag
esof
TiC)
2-25
mol%
Si02
pow
ders
prep
ared
atva
rious
pHva
lues
inFi
gure
5.Sp
heric
allik
epa
rticle
s(F
igur
e5a
and
b)we
reob
serv
edin
sam
ples
prep
ared
inac
idic
and
11
neut
ralc
ondi
tions
.Atp
H12
,ala
mel
lars
truct
ure
(two-
dim
ensio
nal
laye
red
struc
ture
s)fo
rmed
asa
resu
ltof
ther
eact
ion
betw
een
thes
ampl
ean
dNaO
H(F
igur
e5c
),w
hich
invo
lved
atta
ckof
Na"*"
onth
eTi
-O-T
ibo
nd.
The
edge
sof
the
lam
ella
rst
ruct
ure
mig
htha
vem
any
atom
sw
ith
dang
ling
bond
sw
ithen
ough
ener
gyto
dest
abili
zeth
etw
o-di
men
siona
lstru
ctur
es[3
3].A
sthe
syste
msh
ifted
tow
ard
high
pH,t
hela
mel
larT
i02
defo
rmed
tosa
tura
teth
eda
nglin
gbo
nds.
At
pH14
,the
trans
ition
thre
e--»
•tw
o-on
edi
men
sion
was
alm
ostc
ompl
ete,
whi
leth
elam
ella
r
struc
ture
form
edtu
bes
(Fig
ure
5d);
tliis
resu
lted
ina
parti
alan
atas
eph
ase.
Thus
,th
epH
appe
ared
toha
vea
sign
ifica
ntef
fect
onTi
02ph
ase
stru
ctur
ean
dm
orph
olog
y.
Figu
re6
illus
trate
sth
eFT
IRtra
nsm
issio
nsp
ectra
ofTi
Or2
5m
ol%
Si02
pow
der
prep
ared
atva
rious
pHva
lues
and
auto
clave
dat
150
°Cfo
r24
h.Th
esp
ectru
mof
pure
Ti02
is
also
includ
edas
refere
nce.
The
broa
dpe
aks
at34
00cm
"'an
dthe
peak
sat
1640
cm'i
nall
spec
traar
eatt
ribut
edto
surfa
ce-a
dsor
bed
wate
rand
tlie
bend
ing
mod
eofh
ydro
xylg
roup
s.Th
e
surfa
ce-a
dsor
bed
water
and
hydr
oxyl
grou
pde
creas
edsji
gl]tly
asthe
pHinc
rease
d;thi
sis
poss
ibly
due
toth
ere
duct
ion
insii
rface
afc^
ofth
esa
mpl
e,w
hich
prev
ented
furth
erw
ater
vapo
r
abso
rption
.This
isco
nsist
entv
vj|lit
heres
pjtsw
herei
nsam
plesp
mparc
dat
pH3
had
highe
r
phot
ocata
lytic
activ
ityco
mpa
red
with
thos
epr
epar
edat
pH7.
The
peak
s,wh
ichwe
reab
sent
in
pure
Ti02
,app
eared
at96
0cm
''an
d10
40-1
070
cm*'
due
tothe
Ti-O
-Sis
tretch
ingan
dthe
asym
metr
icstr
etch
ing
vibr
ation
ofSi
-OSi
,res
pecti
vely
.The
sepe
aks
grad
ually
decr
ease
dan
d
even
tual
lydi
sapp
eare
dat
high
erpH
.Thi
sim
plies
that
the
Ti-O
-Sib
onds
wea
kene
das
the
pH
increa
sed.
Thes
tretch
ing
vibrat
ionof
Ti-0
bond
sinT
i-O-T
ican
beob
serv
edat
400-
700
cm"'.
Peak
sre
lated
toca
rbox
ylgr
oups
were
obse
rved
atthe
1340
-147
0cm
"'ran
ge.T
heca
rbox
yl
grou
psm
ight
bea
resu
ltof
oxid
ation
ofor
gani
cspe
ciesd
urin
ghy
drot
herm
altre
atmen
t[28
].A
s
the
prep
arati
onco
nditi
onss
hifte
dfro
mac
idic
toba
sic,t
heox
idati
onpr
oces
swas
inhi
bited
;thi
s
caus
edth
epe
aks
todi
sapp
earc
ompl
etel
y.
12
Degree (2 theta)
Figure 4 XRD pattern of 25 mol%SiOj-loadedTiOzpowderat various pH values:
(a) pH 14, (b)pH 12, (c)pH9,(d)pH7,(e)pH5,(f)pH3.(A; anai^e)
(c) r ...m
....
m.m
.t>t'V^
SOnm
Figure 5 TEM Imagesof Ti02-25% SiOi oxide powderpreparedat variouspHvalues:
(a) pH 3, (b) pH 7, (c) pH 12, (d) pH 14.
f&'Sll

OH
grou
p
3S
00
30
00
25
00
20
00
1500
Wav
en
um
bers
10
00
50
0
Figu
re6
FTIR
spec
traof
TiO
r25%
Si02
oxide
powd
erpr
epare
datv
ariou
spH
value
s:(a
)pur
eTi
Oi(
pH3)
.(b)p
H3,
(c)p
H5.
(d)p
H7,
(e)p
H9,
(f)p
H12
.A
indi
cates
abso
rptio
nba
ndsa
t960
cm"',
whi
chis
char
acter
istic
ofTi
-O-S
ibo
ndin
g.
3.3
Effe
ctof
Cu^"^
addi
tion
inTi
Oi-S
102
pwcj
ef
The
XRD
patte
rnso
fCu^
*-lo
aded
Ti02
-Si0
2ar
esho
wn
inFi
gure
7.Th
eTi
Oi-S
iCb
load
edwi
thva
rious
amou
ntso
fCu^
^m
aintai
ned
anan
atase
phas
e!Th
epre
senc
eofC
u^*w
as
hard
lyde
tect
edby
XRD
due
toits
low
cont
ent.
How
ever
,the
rela
tive
inte
nsiti
esof
the
anat
ase
peak
vary
amon
gsam
ples.
High
TiOj
ciysta
llinity
waso
btaine
dwith
addit
ionof
0.2mo
l%Cu
^*
_and
,low
erde
gree
sofc
rysta
llini
tyw
ere
obse
rved
insa
mpl
esco
ntai
ning
0.5m
ol%
copp
er,w
hich
wer
edu
eto
the
poor
distr
ibut
ion
ofCu
^^in
theT
i02
matr
ix.T
heTi
Oiw
ithou
tCu
prod
uced
relat
ively
small
diffr
actio
npe
akso
fana
tase
at25
°(10
1),i
nco
ntra
stto
the
patte
rnso
fthe
sample
swith
Cu^"^
.TTie
refore
,pha
setra
nsfor
matio
nwas
notf
ullya
chiev
edwi
thout
Cu^"*"
,asthe
Ti0
2re
tain
edpo
rtio
nsof
the
inac
tive
amor
phou
spha
se.
15
i
40
so
Dag
rae
(2th
«ta
)
Figu
re7
XR
Dpa
ttern
of25
%Si
02-lo
aded
Ti0
2pow
derw
ithva
rious
copp
erco
nten
ts:
(a)0
mol
%,(
b)0.
05m
ol%
,(c)
0.1
mol
%,(
d)0.
15m
ol%
,(e)
0.2
mol
%,(
f)0.
5m
ol%
.
(A:
anat
ase)
3.4
Phot
ocat
alyt
icac
tivity
The
photo
catal
ytic
activ
ityof
JjieTj
Qi-S
iOjp
qwde
r,pr
epare
dun
dera
cidic
and
basic
cond
ition
sw
asev
alua
ted
thro
ugh
thed
egra
datio
nof
tpef
hylo
rang
e(M
O)u
nder
ultra
viol
etlig
ht
irrad
iatio
nfo
r1h
atro
omte
mpe
ratu
re.E
valu
atio
nw
asre
peat
edfo
r3tim
esan
dave
rage
valu
es
wer
epl
otte
d.Sa
mpl
espr
epar
edin
acid
icco
nditi
ons
disp
laye
dph
otoc
atal
ytic
activ
ityhi
gher
than
that
ofsa
mpl
espr
epar
edin
basic
cond
ition
s(Fi
gure
8).T
his
isat
tribu
ted
toth
epre
senc
eof
anat
ase
inth
esam
ples
prep
ared
unde
raci
dic
cond
ition
s.Ph
otoc
atal
ytic
activ
ities
ofth
esam
ples
with
diff
eren
tTi/S
irat
iova
ry.
Pure
Ti0
2(SA
O)
prep
ared
inac
idic
cond
ition
sre
sulte
din
high
phot
ocat
alyt
icac
tivity
.H
owev
er,a
dditi
onof
25an
d50
mol
%of
Si02
inTi
Oi
prod
uced
the
high
est
phot
ocat
alyt
icac
tivity
com
pare
dw
ithpu
reTi
02.
Thus
,th
epr
esen
ceof
SiO
aw
as
esse
ntia
lto
high
erph
otoc
atal
ytic
activ
ity.A
sthe
Si02
pres
enti
nTi
02pr
omot
eda
high
degr
ee
ofan
atas
eci
ysta
llini
ty,a
low
ercr
ysta
llite
size
was
prod
uced
due
tosu
ppre
ssio
nof
TiO
agr
ain
16

growth. This might have contributed to die larger sur&ce area of the Ti02 particles. The
addition of SiOz in TiOz also enhanced the acidity of the binaiy oxide. A model has been
proposed to explain this increase in acidity [34]. In this model, the silicon cation enters the
lattice of the host oxide, TiOz. and retains its original coordination number. Since the silicon
cation is still bonded to same number of oxygen atoms despite coordination changes in the
oxygen atoms, a charge imbalance is created. The charge imbalance must be satisfied. Thus,
Lewis sitesare expected to form dueto the positive charge in the TiOj-SiOz. Thesurface with
improved acidity canadsorb more OHradicals, thus resulted ina larger surfece area. Thismight
enhanced the photocatalytic activity and ledto complete degradation of MO. This is consistent
with the FTIR results of the sample (pH 3) possessed high intensity of hydroxyl group. The
result also indicates that sample prepared atbasic conditions ^howpd the poor h40 degradation,
which is in agreement with theobservations of Yuet a|. [23]. Tj^ey revealed that amorphous
""TiOz has a lower photocataljrtic activity compared with ciystalline TiOz- Hence, SiOrloaded
TiOz powder prepared under basic conditions isinefficient fpthjg]) photodegradation.
To understand the degradation of MO with time, samples were irradiated and collected
every IS min.PureTiOz showed rapiddegradation at thebeginningwhich eventually remained
constant after 15 min (Figure 9). This is due to the low anatase poncentration of TiOz, and its
inherent structure and low surface area. The TiOz with 25 and 50 mol% SiOz had low
^degradation rate during the first 15 min. Afterward, degradation markedly increased; both
samples completely degraded MO within 1 h. It is worth to note that the complete
mineralization of MO in sample SA25 was faster than that of sample SA50. The TiOz with 25
mol% SiOz exhibited the highest photocatalytic activity, which can be attributed to the
combination of several factors including large sur&ce area, high degree ofanatase ciystallinity,
and improved sur&ce acidity. Hence, an optimumamountof SiOz(25 moI%)added to TiOz
systems may be essential to enhance the photocatalyticactivity.
17
Since SA25 was found to be the best sample for MO degradation, this was used to
investigate the effect of pH on photocatalyticactivity. The TiOz-SiOz powder prepared at pH 3
and pH 5 showed the highest photocatalytic activity (Figure 10). Rapid degradation rates were
observed and resulted in nearly 100% degradation of MO. In contrast, the photocatalytic
activity ofsamples prepared at pH 7,9, and 12 were very low. Samples from neutral conditions
(pH 7) had the anatase structure and high ciystallinity, but showed lower photocatalyticactivity.
As the pH increased from 3 to 7, the crystallite size increased while the surfece area decreased,
which resulted in lower photocatalytic activity. These observations also indicate that a neutral
environment for the synthesis could not enhance the photocatalytic activity. Overall, TiOz
powder loaded with 25 mol% SiOz prepared at pH 3 was the sample with the highest
photocatalyticactivity.
To investigate the effect of op photocatalytic activity, SA25 was loaded with
vaiying amounts ofCu^*. The photocatalytic activity was piarkedly enhanced in the presence of
Cu^* (Figure 11). About 97% ofMO was mineralized with the addition of0.1 mol% ofCu^^
This is mainly due to tlie high degree qfciystallinity ofthe samples and the capability ofCu^* to
induce the formation of new states close to the conduction band, which leads to reduction of the
band gap energy and an increase in the photodegradation efficiency. However, as the Cu^*^
increased, the photocatalytic activity decreased rapidly. The photocatalytic activitydropped to
~21% when the Cu '̂̂ content reached 0.5mol%. Thismaybe attributed tothe lowcrystallinity
and the behavior ofCu^"^ at high concentrations, wherein it becomes a recombination center for
the photo-induced electrons and holes thereby inhibits photocatalysis [20]. Hence, an optimum
amount of Cu^"^ inTiOz-SiOz isessential toimprove itsphotodegradation efficiency.
18

r
10
01
40
20
10IS
20
253
03
5
Sil
ica
con
ten
t(ni
ol%
)
40
45
50
Figu
re8
Phot
odeg
rada
tion
ofM
O(1
hr)o
nTi
Oz-
SiO
ipow
derp
repa
red
at(a
)pH
3,
(b)p
H9
.
01
53
04
5
Deg
rada
tion
time
(min
utes
)
Figu
re9
Phot
odeg
rada
tion
ofM
Oon
Ti0
2-Si
02w
ithva
rious
Sico
nten
t,pre
pare
dat
pH3:
(a)
0%Si
.(b)
16%
Si.(
c)25
%Si
,(d)
50%
Si. 1
9
*-n
40
M2
0-
15
30
45
Deg
rada
tion
tim
e(m
inut
es)
Figu
re10
Phot
odeg
rada
tion
ofM
Oon
Ti0
2-25
mo!
%Si
Oip
owde
rpre
pare
dat
vari
ous
pHva
lues
:a)
pH3,
b)pH
5,c)
pH7,
d)pH
9.e)
pH12
.
00.
10
.2O
J
00^*
*^co
nten
t(m
ol%
)
Figu
re11
Phot
odeg
rada
tion
ofM
O(1
h)on
Cu'̂̂-
loade
dTi
02-2
5m
oI%
Si02
pow
der
prep
ared
atpH
3.
20

4.0 Conclusion
The efifect of SiOz content and pH value on the TiOi photocataljrtic activity was
investigated. Addition of SiOzinto the TiOzstrongly affected the degree of crystallinityof the
composite.The phase structure was dependenton pH value in the presenceofSiOj. An acidic
environment led to anatase phase formation, and samplesprepared in basicconditionsexhibited
the amorphous phase. Addition of SiOa improved the surfece area of TiOz particles
enhancing tlie surface acidity; this led to high photocatalyticactivity compared widi pure TiOj.
A higher degree of MO degradation was produced by Ti02 saixtples with 25 mol% SiOi
prepared at pH 3. The Ti02 loaded with 0.1 moi% 00'"^ and 25 mol% SiOz exhibited
photocatalytic activity higher tlian that without Cu^^ Therefore, the optimum amount of SiOz
and €0^"^ and the pHduring preparation were essential fo ^cjiievjpg high photocatalytic TiOz
activity.
Acknowledgments
The authors would like to thank the Universiti Sains Malaysia Fundamental Research Grant
Scheme (Grant No. 6071195) and die USM Fellowship for their sponsorship.
21
References
[1] S. Kathirvale, M.N.MuhdYunus,K. Sopian,A.H. Samsuddin, Renewable Energy.29,
559(2003)
PJ L.A. ManaC M.AA. Samah,N.I.M.Zukki, Waste Management. 29,2902 (2009)
P] J.L. Graham,C.B.AlmquisI; S. Kumar,S. Sidhu,Catai Today. 88,73 (2003)
[4] Y. Ide, K. Kashiwabara, S. Okada,T. Mori, M. Hara, Chemosphere 32, 189(1996)
[5] R. Weber, T. Sakurai, H. Hagenmaien, Appl. Catai B: Environmentai 20,249 (1999)
[6] W. Choi, S.J. Hong, Y.S. Chang, Y. Cho, Environ^SctTechnol. 34,4810 (2000)
[7] A.L.Linsebigler, G. Lu,J.T. YatesJr., Chem. Rev. 95,735 (1995)
[8] K. Hashimoto, H.Irie, A.Fujishima, Jpn^. J. Appi Phys. 44,8269 (2005)
[9] X. Chen, S.S. Mao, C/rem. J?ev. 107,2891 (2007)
b.- ...
[10] X. Chen, CA/rt. J. CatoA 30,839 (2009)
[11] M. Bellardita,M. Addamo,^ D| Paoja,G. Nlarcj, (w. Falmisano, j^. Gassar,M. Borsa,
J. Hazardous Materials (^IQ) -
[12] J. Bennani, R. Dillert, T.M. Gesing, D. Bahnemann,Separation and Purification
Technology 61,173 (2009)
[13] Y. Arai, K. Tanaka, A.L. Klilaifat,J. MoL Catai A 243,85 (2006)
[14] RA. Aziz, I. Sopyan, Indian J. Chem.48,951 (2009)
[15] RN. Viswanath,S. Ramasamy,ColloidsandSurfaces. A 133,49 (1998)
[16] K.Y. Jung, S.B. Park, Mater. Utt. 58,2897 (2004)
22

[17] S.R. Kumar, C.Suresh, A.K. Vasudevan, N.R. Suja, P.Mukundan, K.G.K. Warner,
Mater. LetL 38,161 (1999)
[18] R.F. Chen, C.X. Zhang, J. Deng, G.Q. Song, InL J. Minerals, Metallurgy and Materials
16,220(2009)
[19] H. Chun,T. Yuchao, T. Hongxiao, Catal. Today. 90,325 (2004)
[20] D. Zhang, TransitionMet. Chem. 35,933 (2010)
[21] C.H.Kwon, J.H Kim, I.S.Jung, H. Shin,K.H. Yoon K H, Ceram. Inter.29,851 (2003)
[22] L.Zhou,S. Yan, B. Tian, J. Zhang, M. Anpo, Mater.Lett 60,396 (2006)
[23] J.G. Yu, J.C. Yu, X. Zhao, J. Sol-GelSci. 24,95 (2002) • n .
[24] G.Xu,Z.Zheng,Y. Wu,N.p?ngN,'Cera/»./«ter.35, l(2QQ9)
[25] P. Cheng, M. Zheng, Y. Jin, Q. Huang, M. Gu, Mater.Left.57,2989 (2003)
[26] Z. Li, B. Hou, Y. Xu, D. Wu, Y. Sun, W. Hu, F- Pang F, J. Solid Siate Chem. 178, 1395
(2005) ' •-
[27] M.Hirano, K. Ota, J. Am, Ceram. Soc. 87, 1567(2004)
[28] J.G. Yu, Y. Su, B. Cheng, M. Zhou, J. Mol. Catal. A 258,104 (2006)
[29]^ A. Karami, J. Iran, Chem. Soc. 7,154 (2010)
[30] K. Guan, B. Lu, Y. Yin, Surface and Coating Technology 173,219 (2003)
[31] J.G. Yu, H. Yu, B. Cheng, C.Trapalis, J. Mol. Catal. A 249, 135 (2006)
[32] J.G. Yu, H. Yu, B. Cheng, X. Zhao, Q. Zhang, y. Photochem. Photobiol. A 182,121
(2006)
23
[33] Y.Q. Wang, G.Q. Hu, X.F. Duan, H.L. Sun, Q.K. Xue, Chem. Phys. Lett. 365,427 (2002)
[34] K. Guan,Surface and CoatingTechnology 191,155(2005)
24

: (
j • i:.-
7 . •
flppendiK B
flceounl Kcilemenl

'eboo* OA I1 a
Purchase Requlsttton • Purchase Order
UseiCoda: HAIZAN / USMKCTUVE / PBAHAN
Current Date: 26/08/20U 11:13:39 AM
P Suppliers > Maintenance
Proeratn Code: Votebook9100
Version: 13.92r Updated at 30/05/2011
Rnandals P Coda Info P Reports
Current Program: Votebook (Header)
Admin
DB: 13.00, 09/18/2010 VB: 13.01, 03/14/2011 Switch Language: English /Malay
Wlidcaid: eg. Uke 100%, Like10%1, Uke %1
Hement i: Element 2: % Element 4: Ipbahan
Elements: 6071195 Yean 2011
Detail Excel 116
116
Detail Excel 117
Ddall Excel 117
Detail Excel 117
117
9999
BudgetControl
Account Description Budget Account Code Rollover Budget Cash Received Advanced . Commit Actual Available Percentage
T Penyefidikan Rindamentals (FGRS) 203.111.0.PBAHAN.6071195 3,859.95 0.00 0.00 0.00 0.00 0.00 3,859.95 0.00%
T SubTotal 3,859.95 0.00 0.00 0.00 0.00 0.00 3,859.95 0.00%
T Penyelidikan Fundamentals(FGRS) 203.22L0.PBAHAN.6071195 -532.00 0.00 aoo 0.00 0.00 0.00 •532.00 0.00%
T Penyeiidikan Fundamentals (FGRS) 203.227.0.PSAHAN.6071195 -3,892.40 0.00 0.00 0.00 6,378.50 5,244.00 -15,514.90 0.00%
T Penyelidikan Fundamentals (FGRS) 203,^9,0.PBAHAN.6O71195 4,870.42 0.00 0.00 0.00 0.00 450.00 4,420.42 0.00%
T SubTotal 446.02 0.00 0.00 0.00 M7i5p 5,0M.ap -11,626.48 0.00%
GrandTot^ 4,305.97 0.00 0.00 0,00 6,378,50 5,691.pp -7,766.53 0.00%
http://10203.18.3/eprocurenient.kctA^otebook9100A_LIST.asi«K

flppendiH C
Tochniecil Reporl

Introduction
Final Technical Report FRGS(1 Mei 2010-Aug 2011)
• Titanium (Ti) and its alloys have be^. wiWy. used; as important biomaterials formany years. In particular, Ti-6A1-4V is widely iis^ as,a;bi6material for artificial hip or dentalimplants because ofits special mechanical, cHemicai-^d biological properties. Itcan providedirect physical bonding with adjacent bone snrfece without forming a fibrous tissue interfacelayer. Although the success rates ofimplant are vei^ high,: implants occasionally loosen andfail. PureTi metal lacks desirable bioactive (bonerg!:owth),properties, a thin TiOz passivationlayer forms on Ti surface to impart bioactivity and chemicalilionding to bone. Such a layer,however, is composed ofsmooth and dense Ti02 layer and" is>susceptible to the formation offibrous tissue that prohibits osteoblastic cells from firmly attaching onto the surface, and cancause the loosening of implant and inflammation (Yu et al., 2010). Thus surfacemodifications, altering topography and chemical composition-of these materials, are requiredto enhance direct structural and functional anchoring of the prostliesis to the living bone(osseointegration). The most common surface treatments of commercially available implantsand prosthesis encompass pickling, sandblasting, plasma spraying, anodizing, and micro-arcoxidation. For decades, until recently, cell interactions and bone response were studied onimplant surfaces with micrometer-scale topography. It have shown that nanoscale topographyas well as the order of the nanofeatures organisation is a critical factor romoting early cellresponses to the implant surface (Das et al., 2009). Hence the fabrication of highly orderedTi02 nanotube films for biomedical applications is attracting much attention. Among theseprocesses, electrochemical anodization of titanium in fluorinated electrolytes is a relativelysimple method to synthesize porous or tubular structures. In this work, anodization processwas performed in ethylene glycol containing fluoride and de-ionized water to produce thenanotubes structure. Then heat treatment was conducted to produce various crystallinestructure which are anatase and rutile phase ofTi02. The final stage was on testing the cellinteraction on the different crystallinesTi02 nanotubes.
Problem statement
Ti-6A1-4V alloys possessed two-phase of alpha and beta structures which arealuminum and vanadium, respectively. It has been reported that this alloy associated withlong term health problem due to toxicity ofaluminum and vanadium released. Titaniumbased alloy tends to undergo severe wearwhen rubbed ^th dther metals, it is also stated thatthe two-phase equiaxed microstructure more susceptible to corrosion as the compositionaldifference across the grain boundaries increases which leads to the galvanic cell formation(Geetha et al., 2009). Thus, surface treatment modification such as formation of thick Ti02nanotubes that protects the surface of implants as well as giving good adhesion with cell hasbeen applied on titanium and titanium alloys to increase the longevity of implant. Surfacemicrostructure is an important factor in modulating cell response at the implant/boneinterface. In the formation ofTi02 nanotubes highly dependent on the electrolyte compositionand electrochemical conditions. There are not many literatures reports on the formation ofTi02 nanotubes of Ti alloys in organic electrolytes especially in ethylene glycol. It isanticipated that ifthe morphology is well defined, the cell interaction study will be improveddue to the improvement of the interaction of nanotubes with cells. Therefore in this workcomprehensive investigation on the formation of nanotubes on Ti alloy was reported.
Objectives of this project

• The objectives of this research are as follows:• To grow TiO: nanotubes on Ti-6A1-4V alloy via anodization method.• To study the effect of NH4F content, applied voltage, and anodization time on
the formation of TiOi nanotubes on Ti-6A1-4V alloy.• To characterize crystal structure phase and morphology ofTi02 nanotubes.• To study the response of human foreskin fibroblast (HS27) cell on optimized
TIO2 nanotubes with different crystalline structure.
Results and Discussionsy
Morphology of Ti-6Al-4V
Prior to anodization experiment, Ti alloysheet was chemically cleaned by solution of1 M HNO3 and 0.45 M NH4F to remove native oxide layer on the surface of Ti-6A1-4V.Figure 1 shows FESEM images ofTi-6A1-4V after the cleaning process. As seen, the surfaceof the Ti alloy is rough and irregular with two different distinct regions. Certain regioncomposed of small grain while the others are large. EDX analysis was used to test thedifference within this two regions and it wasfound the small grains are enriched with V whilethe big grains are composed of Al.
0-phases
tsvaui
a-phoses
Mags 3.OQKX ^ 'iVB • fl-DTi EMf • SXO.Vv SgnsIA • InLeni
C-aie 8 iai 2011 Tri» 1747 09
Figure 1: FESEM Image showing the TI6Ai4V alloy sheet ofafter the cleaning process (a andp phases are an-noted with arrows; a-phases are dark; p-phases are bright). The imageacquired after ultrasonlcally cleaned in IM HNO3 and 0.45 M NH4F for 1 minute. The pphases are enriched In V.Anodization ofTi-6Al-4Vin ethylene glycol
Effect ofNH4F content onthe anodization of Ti alloys inethylene glycol
In this part, the experiment was conducted to investigate the effect of differentamount of NH4F on the morphologies of the nanotubes. Hence optimum weight of NH4F toproduce self organized nanotubes can be determined. All samples are anodized in 99 ml

ethylene glycol and 1ml H2O at 60V for 1hour and were annealed at400 °C. This parameterwas selected based on our preliminary studies (Sreekantan et a)., 2010). The content of NH4Fwas varied from 0.1 g, 0.3 g, 0.5 g and 0.7 g. The surface morphology of Ti-6A!-4V sheetanodized in ethylene glycol with different fluoride content lead to different morphologies(Figure 2). Anodization of Ti alloy in electrolyte containing O.lg NH4F gives an irregularnanoporous structure (Figure 2a). There are areas covered with small pits while other havelarger pores. The pits or pores are formed due. to the different in the degree of localizeddissolution of the oxide layer. (Figure 2b) shows the Tr alloys anodized at 0.3 g NH4F. Asseen the pit and pores which are seen for 0.1 g.^4F have been converted into sponge likestructure. The inset shows length of sponge.like structuresiofabout 163.8 nm. It could alsobe found that the entire metallic surface: was,-not uniformly covered with nanoporousstructure.
For 0.5 g and 0.7 g NH4F, selforganized TiOznanotubes-aitay is formed (Figure 2 cand d). The average diameter ofthe nanotubes is: approximately 81 and 110 nm for 0.5 g andfor 0.7 g, respectively. Generally the pores orthe nanotube diameter are found to be largerwith increasing fluoride content in the electrolyte.. This •is due to enhanced chemicaldissolution makes the barrier layer at the bottom relatively thin, which in turn lead to easiertransport of the fluoride ions in oxide layer. Such condition increases the electrical fieldintensity resulting in further pore or nanotube growth.
200nm WD= emm EHT=5.00kV Signal A= InLensMag - 30.00 KX[—_j Dal6:ajan2011 Time ;17:50:48
Figure 2(a): FESEM images ofTiOa nanotubes anodized in 99 ml ethylene glycol + 1ml HjOwith 0.1 gNH4F, at 60V for 60 minutes.

Mag = 30 00 KX EHTaS.OOkV Sign8l.A= InlensI I 0alo:8Jart20H TImo iT ^O O?
t'. ^.T-'V u' io-1
Figure 2(b): FESEM images ofTi02 nanotubes anodized in 99 m! ethylene glycol + 1ml H2Owith 0.3g of NH4F, at 60V for 60 minutes. Inset showsthe cross sectional view.
>
m
200nm WD= 6 mm EHT=5.00kV SignalA = InLensMag = 30.00 K X TkKC^
Date ;8 Jan 2011 Time :17;34;3S
Figure 2(c): FESEM images ofTi02 nanotubes anodized in 99 ml ethylene glycol + 1ml H2Owith-0.5 g of NH4F, at 60V for 60 minutes. >

200nm WD= 5 mm EHT=5.00kV Signal A = InLensMag = 30.00 KX Date :31 Dec 2010 Time :11:01:40 ZEISS
Figure 2(d): FESEM images ofTiOi nanotubes anodized in 99 ml ethylene glycol + 1 ml HjOwith 0.7 g of NH4F, at 60V for 60 minutes.
A 11' X a*TiA R-Tl; '- A •a-Ti (e) ;
• ''' ''V
• J| 1. A
28 (degree)
Figure 3; XRD pattern of the annealed Ti-6AI-4V alloy sheets anodized In EG at 60V for 60minutes with (a) as-anodized at 30 V (b) 0.1 g, (c) 0.3 g, (d) 0.5 g, and (e) 0.7 g weight ofNH4F. A = Anatase, a-Ti = alphaTi and P-Ti = BetaTi.

The corresponding XRD pattern of the Ti alloy sheet anodized in 0.1 g, 0.3 g, 0.5 g and 0.7 gNH4F is shown in Figure 3. After annealing at 400 °C, the diffraction peak appears at 20 of25° representing (101) plane of anatase Ti02. In addition, diffraction pattern of a-Ti at 20 =35.18°, 40.26°, 53.08° and 63.19° corresponding to the (100), (101), (102), (110) plane and p-Ti peak at38.75° corresponding at(002) plane were detected. These peaks are originated fromthe substrate of the Ti alloy. It is worth nothingthe peakrintensityof a and p Ti decreased asthe content of fluoride .increased.5This.Ts-jli.kely due? ta larger Sickness of the oxide layerformed on the Ti alloy.
Effect ofvoltage on anodization ofIT alloy in ethyleneglycol
Experiment was continued in sfmilarelectrolyte with 0.7 g NH4F to investigate theeffect of voltage on the Ti alloy. The voltajge was varied fronx 10 V, 20 V, 30 V, 40 V, and 60V for 1 hour. Different voltage in anodization process leads to different surface structure ofTi02. At low anodization voltage (lOV) in Figure 4a, small pits are observed on the surfaceof the oxide layer. At this stage the dissolution of titanium had just occurred. As the voltageincreased to 20 V in Figure 4b, the pits nucleate to form large porous structure. However, notall the surface is covered with porous Ti02. There are still areas covered with oxide layer.This is due to the insufficient voltage to induce complete dissolution and breakdovm ofbarrierlayers to dissolve the oxide into tubes.
When voltage increasedto 30V up to 60V, selforganizednanotube arrays are formed.Howeverthe lengths of the nanotubes in certain area are relatively low as compared to others(insets in Figure 4c). This finding is different compared to few authors who claimed theexistence of two kinds of the nanostructure on the surface of the Ti alloy. One was selforganized nanotubearrays and the other was irregularnanoporous structure.Accordingto fewauthors (Luo et al., 2008 and Matykinaa et al., 2011), the self organized nanotubes arrays areproven to be grown on the a phase region and nanoporous structure on P phase region. The aphase are enriched with Al whereas P phase region enriched with V. Because of the differentchemistries of these phases, the formation of the nanotubular oxide layer is not uniform as pphases get etched preferentially by the electrolyte. Different results were obtained in thiswork probably due to different electrolyte used. Most of the aforementioned studies utilizeaqueous solution which subjected highchemical dissolution rate. In here the use of ethyleneglycol with pH 6.5 could avoid the significant attack on P phase and produce homogeneousmicrostructure. However, the length, of the nanotubes are different within the a and p phaseregion, beingshort at p phase regionas the, splubility ofrV;is fasterthanthe Al.
The average diameter and the length ofT the. nanotubes formed with variousanodization voltages are shown in Figure 5. Generally itwas found that raising the appliedvoltage leadsto larger diameter and length. This is dueto the high applied electricfield whichleads to enhance polarization of Ti-O bond and thus weakened to promote dissolution of themetal oxide. This lead to greater driving force for ionic transport through the barrier layeratthe bottom of the nanotubes favouring formation of [TiFe]" complex that will eventuallyaccelerate the pore growth. At the. same time, the faster movement of the Ti/Ti02 interfaceinto the metal (Shankar et. al, 2007) resulted in the formation of long nanotubes. The standarddeviation of nanotube diameter at different voltages is almost constant, in the range of (5-lOnm) but for length showed significant difference due to high solubility of V which reducesthe length of the nanotubes in certain region. The side view of the nanotubes is relativelysmooth as seen in Figure 6. However, TEM analysis showed the presence of small ridges atthe wall. It is also found that the nanotubes are uniform with hollow nature of tube opening.The thickness ofthe wall was approximately 20 nm.

ijkr, < »»•
S|S> j
mmmm^ WmBmm200nfn WD= 5 mm EHT=5.00kV Signal A = InLens
Mag - 50.00 KX [— —| DatB:7Feb2011 111118:9:53:37
Figure 4(a): FESEM images ofTi02 nanotubes anodized in 99 ml ethylene glycol + 1ml H2O+ 0.7 g NH4Ffor 60 minutes at 10 V.
m
g*'\^
m71-r.:
.i . I K'
1
lOOnm WD= 5 mm EKT= S.OOkV SignaJA=]nL6ns
H Date :7 Feb 2011 Time :9:47:39Mag = 50.00 KX [_^
Compact
"tj"structure
m
Figure 4(b): FESEM images ofTiO? nanotubes anodized in 99 ml ethylene glycol + I ml H2O+ 0.7 gNH4F for 60 minutes at 20 V.

.00 nm
i. - w.%7"-'iff?/
w A ">*- * i*.' ' '• *
MMmm
Mag = 60.00 K X
If «' «,4^-i
200nm WD= 5mm EHT=5.00kV Signal A = lnLens
I ! Date :7Feb 2011 Time :9:40:55
Figure 4(c): FESEM images ofTI02 nanotubes anodized in 99 ml ethylene glycol + 1ml HjO+ 0.7 gNH4F for 60 minutes at 30 V. Inset showsthe cross sectional view.
Af* »'l' \ *
f
rj / '
-.K V, 200nm WD= 6 mm EHT=5.00kV Signal A= InLensMag - 50.00 KX |—_—| Date;8Jan2011 Time:17;44:02
Figure 4(d): FESEM images ofTiOi nanotubes anodized in 99 ml ethylene glycol + 1ml H2O+ 0.7 gNH4F for 60 minutes at 40 y. 1

1um WD= 4rrBTr EHT=5.0QW SignalA = InLensMag= 15.00 KX I 1 Date:18Feb201l Time:16:21:47
Figure 6: FESEM image ofside view with T1O2 nanotubes

c:\edax32\genesis\genmap$.spc 07-Feb-201110:53:22LSecs: 101
478-,
Figure 8: EDX spectra of the oxide residua! found on the Ti alloysurfaceafter anodized in 99ml ethylene giyco! + I ml H2O + 0.7 g NH4F, at 40 V

The chemical composition of the Ti02 nanotubes prepared at various voltages wasdetermined using EDX analysis. The representative spectrum of the Ti alloy anodized atvarious voltages is shown in Figure 8. The result clearly shows the presence of C, O, Al, Tiand V. EDX spectrum of the other sample are almost similar (not shown), only slightvariation on the At % of all the elements. However it is interesting to note that thecomposition of the vanadium slightly reduced from 2,3% to 1.76 % with increase voltagefrom 10 to 60 V. This is probably due to-preferenti^-etching of V at high voltage ascompared to other phases.
Table 4.1: EDX spectrum atvarious:Woltagesi'
Element At % at different voltai
10 V 40 V i 60 V
C 03.42 05.13 04.58
0 47.10 39.86 1 43.68
Al 04.68 05.50 04.19
Ti 39.53 44.20 42.77
V 02.30 02.16 01.76
X-ray Photoelectron Spectroscopy (XPS)
The chemical composition present at the surface of Ti-6A1-4V nanotube subjected toannealing at 400 °C for 4 hours under Argon atmosphere was investigate using XPS analysis,and the result is shown in Figure 9. Based on the result, the binding energies of Ti2p3/2 andTi2pi/2 were found at 456.5 eV and 463.3 eV, respectively (Figure 9a). This is likely due tothe presence of Ti"^ oxidation state. The Ti''̂ ions reacted with O^* ions during anodization,and consequently formed Ti02. This was confirmed by the presence of Ti-0 (527.5-527.7eV) in 01s (Figure 9b). Besides, the presence of OH' ions and absorbed H2O was detected at528.9 eV and 531.9 eV. Other than the information of Ti02, binding energy of A12p wastraced at 72.1 eV, 72.2 eV and 73.9 eV (Figure 9c). This is attributed to the binding energy ofAl-0, which in agreement with that report by Li et al, (2008). In addition, the V2p3/2 peakcorresponding to the metallic V appears at 515.5 eV and 518.2 eV(Figure 9d). This is duetothe fact that the affinity of Al and Ti with 0 is stronger than that of V. Al and Ti diffusedoutward, bringing on implanted layer outward growing, therefore V is deficient relatively inthe outmost layer. However, the existing of oxidized state of Al, and the leaching of Vcontribute to the reduce cellular toxicily of Al and V:of Ti-6A1-4V as biomaterial (Li et al.,2008). • • ' Vi

0
CQ
CO
d
(a) (Ti2p3;2)A456.5 eV W Ti2p
1 41 4i 41 4I A
(Ti2pi/,)463.3 e¥
AF *
m •
1
445 450 455 460 465 470Binding energy (eV)
Figure 9(a): XPS spectraof Ti2p region
475
27.7 eV
527.5 eV
524 526 528 530 . 532 534Binding energy (eV)
Figure 9 (b): XPS spectraof01s region
536

67
S
A
d0)
(d)
505
72.2 eV
69 71 73 75
Binding energy (eV)
Figure 9(c): XPS spectra of A12p region
518.2 eV
515.5 eV
510 515 520
Binding energy (eV)
Figure 9(d): XPS spectra ofV2p.region
77
V2p
525

Effect ofanodization time on anodlzed Ti alloys in ethylene glycol
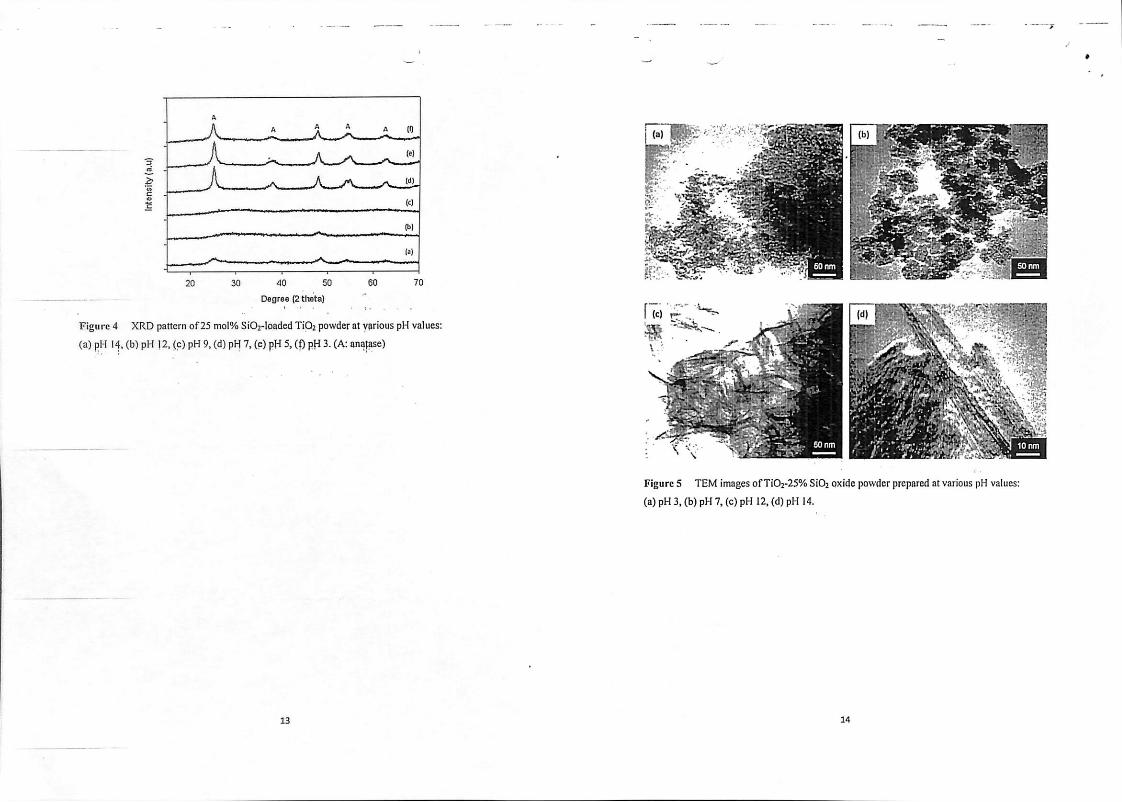
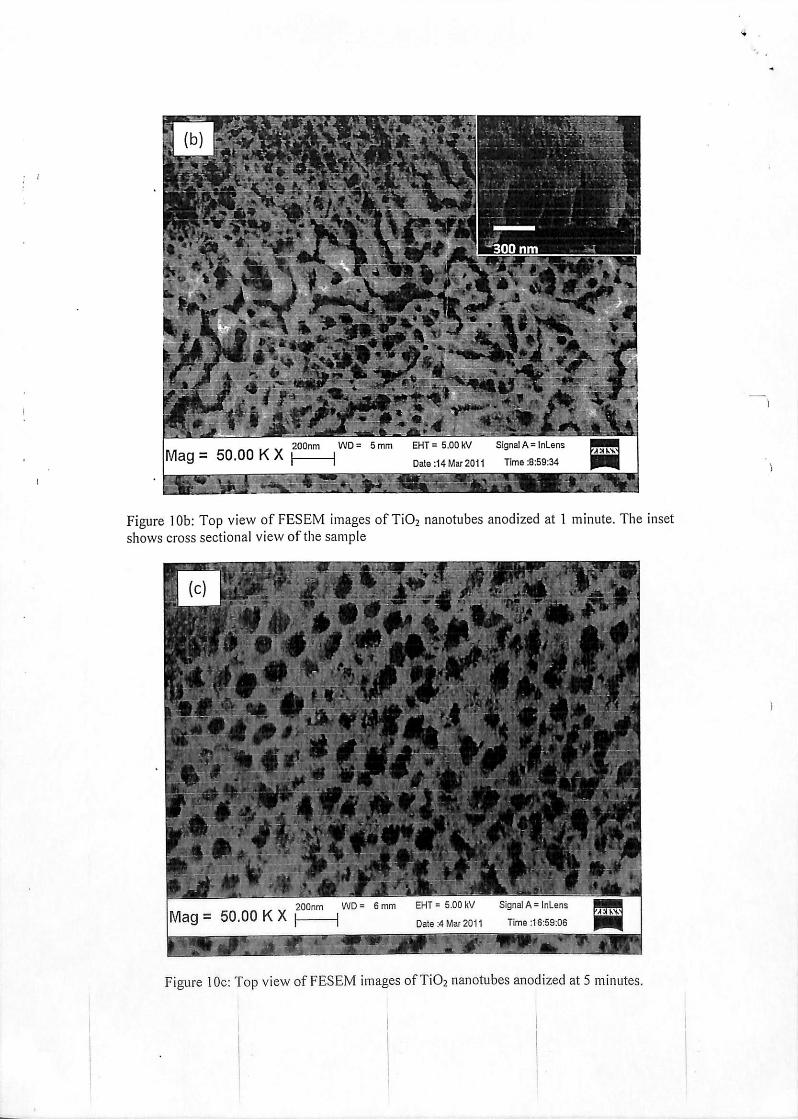
This set of experiments was done to monitor the growth of nanotubes with increasinganodization time. The experiment was carried out in similar electrolyte with 0.7 g F at 60V.The growth of the nanotubes was monitored by taking FESEM images of various timeintervals (20 seconds, 1 minute, 5 minutes, 10 minutes, 15 minutes, 30 minutes, 1 hour and 6hours). Table 4.2 shows the diameter and length of nanotubes!Ti-6Al-4V alloy formed in thevariation of anodization time. ^
i ' •j
Table 4.2: Diameter and Length ofTi02 nanotubes in diffefentanodization time
Time (minutes]20 sec
Tube Diameter (nm)' Tube Lent MorphologyCompact structurePits formation
Porous structure
nanotubesnanotubesnanotubesnanotubes
1; -
5 64
i:o 68
70
30 100
1 hour 110
6 hours 159
0.4 • •
XA1.7
^,83.1
nanotubes
Figure 10a shows the image of the surface of 20 seconds. An oxide layers are formedon the surface of the ofTi alloy due to the interaction within O^" and OH". After 1minute theoxide layer has been etched in certain area, thus forming irregular pits due to localizeddissolution (Figure 10b). After 5 minutes of anodization, the pits are converted to largerpores(Figure 10c). However mostof the areas arestill covered with oxide layer. At 10minutes, thepore density is increased and the cross sectional view (Figure lOd) confirms the formation ofnanotube structure. After 15 minutes, the surface is completely filled with self organizednanotubes arrays (Figure lOe). Prolonging the anodization time to 30 minutes (Figure lOf), 1hour (Figure 2d) and 6 hours (Figure lOg) resulted in larger diameter and tube length. Theoverall formation of the nanotubes on Ti alloy (Ti-6A1-4V) is similar to the Ti-8Mn reportedby Mohapatra et al.
Mags 50.00KX
• - ...... ..
V Y-. ». • ... .1. .». • . t. A— ........ . - .
WQs {mm SHT: &<|l>kV
I Doto'ldUar^lQIISgn^A^inlenf
Tin-^
Figure 10a: Top view of FESEM images ofTi02 nanotubes anodlzed at 20seconds.I
IVlag= 50.00 KX200nm WD= 5 mm EHT=5.00IW Signal A = InLens
I I Date;14Mar2011 Tlme:8:59:34
Figure 10b: Top view of FESEM images ofTiOz nanotubes anodized at 1 minute. The insetshows cross sectional view of the sample
200nm WD= 6mm EHT=5.00kV SignalA= InLensIVlag= 50.00 KX | [ Date:4Mar2011 Time :16;59:06
1
Figure 10c: Top view of FESEM images of TiOz nanotubes anodized at 5 minutes.

%
f
I If-
M
M
Map fin nn Ky WD= Smm EHT= 5.00kV Signal A=InLens^ I Date:4Mar2011 Time :16;52:55
'V
I
Figure lOd: Topview of FESEM images ofTiOi nanotubes anodized at 10 minutes.
Wlag = 50.00 K X 2Q0nm WD= 5 mm •EHT=5.00kV SignalA = InLens
Date :4 Mar 2011 Time :16:56:16
Figute lOe: Top view of FESEM images ofTiOz nanotubes anodized at 15 minutes, The insetshows cross sectional view.
i." "ft.V' K - . 4.
.» 't'.'i'* t.7 ^ •'
;.:KP- - (ffrlVrl l'.. ^
•jf'fli ;! '̂ •I'bll J.;T^ ^
Mag = 50.00 K X200nni WD = 5 mm EHT=5.00kV Signal A = lnLens
Date ;4 Mar 2011 Time :16:43:02
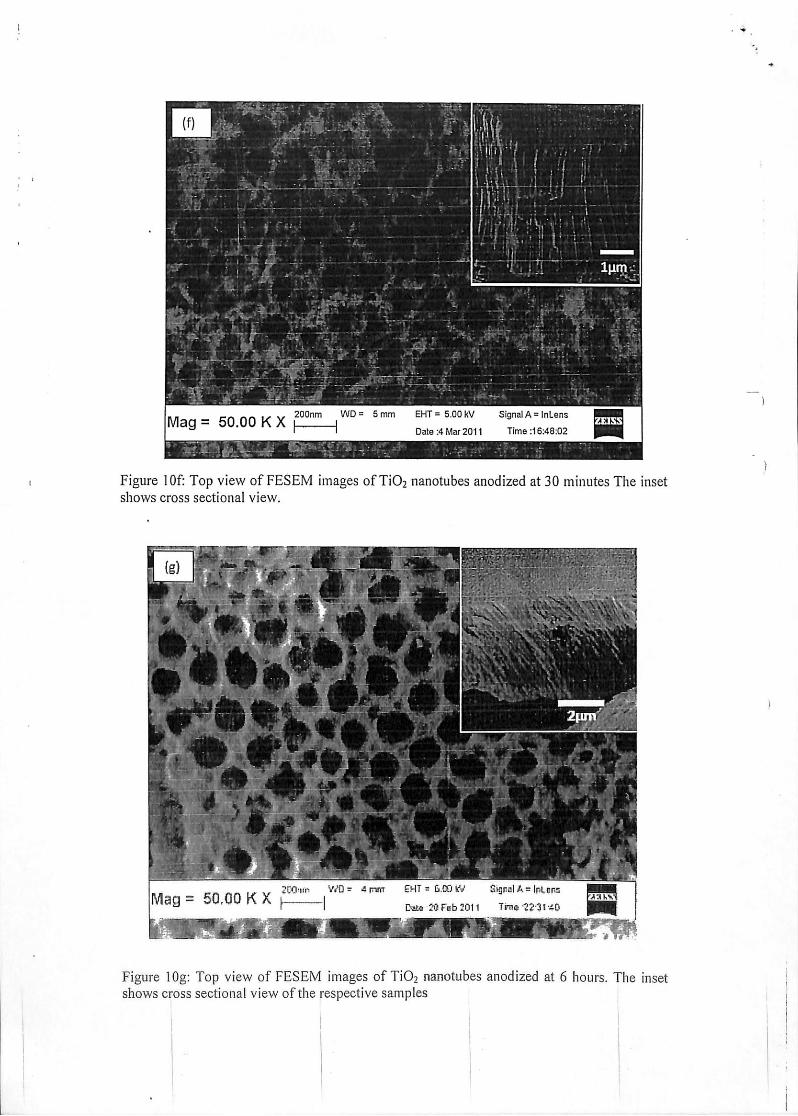
Figure lOf: Top view of FESEM images of Ti02 nanotubes anodized at 30 minutes The insetshows cross sectional view.
Mag = 50,00 K X2KI'ifri 4trmT EHT= G.CO kV StgnoiA= jptena
Date 20 Feb 2011 Tni#'22-3ri0
•r^.nk
Figure lOg: Top view of FESEM Images of Ti02 nanotubes anodized at 6 hours. The insetshows cross sectional view of the respective samples

0.03
0.02
I 0.01
a
0
0 60 120 180
Time (inin)
Figure 11: Current density profileofTi alloy
Figure 11 shows the current density profile recorded during anodization. Three stageof current density were observed in ethylene glycol. Stage 1, represent formation of oxidelayer, stage 2 signified nucleation of nanoporous and stage 3 denoted formations ofnanotubes. Growth of nanotubes structure occurred at stage 3 where by the length of thenanotubes increased from 2.8 to 6.4 pm.
Effect ofannealing temperature
Figure 12 shows the XRD paittem of the as anodized and annealedTiOa nanotubes atdifferent temperatures. The result clearly shows the crystal structure of TiOi depends on theannealing treatment. The XRD of the as-anodized saniple indicate amorphous structure asonly a and p-Ti peaks were pb^rvecL.Annealing.at'400;i?G haspromoted the crystallization ofanatase phase at 20 of 25° and 48°j corresponding 01) and>'(200) plane, respectively.Dominant structure of the sample annealed at-^600 °C M'rutile, implies completetransformation from anatase to rutile at this temperatures
The morphology of the as anodized Ti02 without heat treatment and annealed at500°C, 550°C as well as 600°Gare shown in Figure B. a,b,c and d, respectively. The sampleheat treated at 400°C is discussed previously in section 4.1. Overall, the results show therobustness of Ti02 nanotubes formed on Ti alloy is teiriperature dependent. The nanotubesstructure is sustained till 400°C. At 500°C and 550°C, thickening of titania nanotubes walloccurred due to mass transport involving Ti''̂ diffusion at the bottom and wall of the Ti02nanotubes. Finally, at 600°C, tubular structure is completely damaged and nanorod likestructure is formed. The schematic diagram explaining the morphologies changes withtemperature are illustrated in Figure 14.


Nanotubular
structure
initia
barrier
layer
Growth of wall thickness
and barrier layer
Dense nanorod
like strcuture
Figure 14: Schematic illustration to show the growth of the nanotubes during thermalannealing
Surface Roughness
AFM topographic maps of as anodized andannealed Ti02 are shown in Figure 15 a-c.The surface roughness parameter Ra, Rq and Z range of each sample were examined andsummarized in Table 3. It can be seen that higher annealing temperature induces higherroughness level as a consequence of an increased in densification of the nanotubes.
Table 3: Theroughness parameter obtained upon annealing temperature variation
"" :—-.-Annealing temperature (®C) I ^ •'
Roughness Parameters (nm)f~~~^^ ^ •"
Ra (average)RMSZ range (max.-min.)
48.65^
60.49
292.30
. 67.25
84.56
521.10
95.97
122.60
646.90

Stxrrr :
Figure 15: AFM topography and 3D morphology ofTi02 nanotube (a) 0°C (b) 400°C and (c)600°C
Cell interaction
In this part, the behavior of cellular interaction on three different types of anatase,amorphous and rutlle TiOz using fibroblast cells line was done. MTS assay was performed tostudy the cells viability. The cellular activities of cell viability for fibroblast cells on threedifferent types of crystal structures are .shown in Figure 16. Cell proliferation is theattachment of the cells on the material surface. The results shows no significant valueobtained for 24 and 48 hours of cell culture for ai! three crystal structures. At 72 hours,amorphous structure has significant value; this reveals increase in proliferation HS27 cells onas-anodized TiOi nanotubes surface TRi^^sftow HS27 fibroblast cells has better cellularinteraction on amorphous Ti02 nanotubes as compared to anatase or rutile. It also indicatesthat fibroblast cells like surface with lower surface rou^ness of about 49 to 60 nm.

Amorphous Anatase
•24h
B48h
a72h
Rutile
Figure 16: MTS assay data showing the optical density (OD) of reaction product of the MTSworking solution with HS27 fibrobiast cells cultured as-anodized, annealed at 400°C and 600°C amorphous Ti02 nanotubes, and heat-treated (anatase) TiO, nanotubes after 24 h, 48 h, and72 h of incubation. The error bars in the figure represent the standard deviation forVoursamples for each data.
Conclusion
^The TiOs nanotubes were fabricated on Ti-6AI-4V alloy by anodization process.Optimized condition for formation of TiOs on Ti alloy are: electrolyte with 99 ml ethyleneglycol +1ml H2O +0.7 gNH4F, voltage 60 Vand time ofanodization is 60 minutes. Ti02nanotubes with average diameter of110 nm and 3.1 pm length are obtained. Cell interactionstudy on Ti alloy with various crystalline structure om fibrobiast cells line showed thatamorphous structure possess good proliferation, followeAby,anatase and rutile phase.
References •
Bose, Bandyopadhyay, (2009) Enhanced "Fatigue"'Ferformance of Porous CoatedTi6A14V Biomedical Alloy, 225. ; -Li, Xiao, Liu. (2008) Synthesis And Bioactivity Of Highty Ordered Ti02 Nanotube ArraysApplied SurfaceScience, 255. 365-367Luo,Yang, Liu, Fu, Sun, Yuan, Zhang ,Liu. (2008).; Fabrication And Characterization OfSelf-Organized Mixed Oxide Nanotube Arrays By Electrochemical Anodization OfTi-6A1-4V AlloyMaterials Letter,s 62.4512-4515Malykinaa, &J. M. (2011). Morphologies Of Nanostructured Tio2 Doped With F On Ti-6A1-4V Alloy, Electrochimica Acta, 56, 2221-2229. • :Shankar, Mor, Prakasam, Yoriya, Paulose, Varghese, Grimes. (2007) Highly-ordered Ti02nanotube arrays up to 220 pm in length: use in water photoelectrolysis and dye-sensitizedsolarcells Nanotechnology 18, 1-11

Sreekantan, Saharudin, Lockman, & Tzu. (2010). Fast-Rate Formation Of Ti02 NanotubeArrays In An Organic Bath And Their Applications In Photocatalysis. Nanotechnology, 21Yu, Jiang, Zhang & Xu, L. (2010). The Effect Of Anatase Ti02 Nanotube Layers OnMC3T3-B1 Preosteoblast Adhesion, Proliferation, And Differentiation. 1012-1021.

4>
• •• ^'}'0'O.''''yr-f Vv- -Va
:. ^ 'y <\ M-^VV
. v .'j-w-^r:'w-o-*^viii v 'A..f \...v: '^Vr:"I,.';•••-•.- ••» , .S),'"f,5*V'i.k't'
>'•-'iv '••'Tr- V >•!»• .tiv .i .̂t.r .\ -l-!•>>:• •""Y V
^^®^|gp^llll^i^p|l|l|l^'
A.
B.
C.
1.
2.
3.
4.
5.
6.
7.
8.
TITLE OF RESEARCH:Tajukpenyelidikan:
Formation ofNanotuhular Ti02 Bioactive OxideLayer onTitanium and Cell Response Studies
PERSONAL PARTICULARS OF RESEARCHER / MaJdumat Penyelidik:
(i)Name of Research Leader:
Nama Ketua Penyelidik:Dr. Sreemala Sreekantan
(ii)School/Institute/Centre/Unit:
Pusat Pengajian /Institut/Pusat/Unit:Pusat Pengajian Kejuruteraan Bahan &SumberMineral
(Hi)
(iv)
(V)
Phone No. (Office):No. Tel (Pejabat):
Hand Phone No:
No. TelefonBimbit:
Fax. No:
No. Faks:
SUMMARY OF ASSESSMENT
(Tick (ylj the appropriate box. Also, provide additionalcomments in Section F)
Achievement of Project Objectives
Quality ofOutput
Quality of Organisational outcomes
Quality of sectoraPnational impacts
TechnologyTransfer / Commercialization Potential
Quality and Intensity of Collaboration
Overall Financial Expenditure
Overall A^essment of Beneflts
Inadequate Acceptable Very Good
^ 1
H
ZTI
Z1
3
H
Office ofResearch Platform - Universiti Sains Malaysia - February 2011

D OUTPUT SUMMARY
1 Achievement Percentage
Project progress according tomilestones achieved up to this period
25% 50% 75% 100%
2 Research Findings
ISl JournalInternational
JournalNational Journal
Number of articles/ manuscripts/books \
International National
Paper presentations
\
Others
(Please specify)
3 Human Capital Development
Number
On-going Graduated
M'sian Non- M'sian M'sian Non- M'sian
Ph D Student
M Sc Student
Undergraduate FinalYearProject z
Temporary Research Officer
Temporary Research Assistant
Others (Please specify)
Total
Office of Research Platform - Universiti Sains Malaysia - February 2011

E.
F.
G*
H.
I.
ACTION TO BE TAKEN (Tick (^) the appropriate boxes)
]/Project file to beclosed. (Forfinancial andadministrationpurposes)
• Project to be Reviewed Once Additionni InforniBtion Has Been Obtained by the Project Leader(Please see section E)
•
•
•
Forward to Innovation Office for Consideration:
CH Patent ED CommercialisationI IOthers (Please specify):
•
Forward to Division of Industry & Community Network(DICN)
Others (Pleasespecify):(E.g.: Formations ofteams or cluster etc.)
Technology Transfer
Additional information to beprovided bytheProject Leader [Please provide details ofthe specific informationbeing requested from the project Leader inthe areas identified in Section E]
Comments Regarding Assessment (Please provide below anexplanation of any assessment made inSection Cshowing a ratingbelow"acceptable"]
Overall Comments
Name of Panel: Signature
Date
Endorsement & Comments/Suggestions of Research Dean:
Signature: Date
Officeof Research Platform - Universiti SainsMalaysia - February 2011