forests nsw annual report 2009-10 - nsw department of ... · pdf file2 forests nsw annual...
TRANSCRIPT
Annual Report 2009–10Social,Environmental andEconomic Performance
Forests NSW is a public trading enterprise within Industry & Investment NSW
Forests NsW

2 Forests NSW Annual Report 2009–10 Social, Environmental and Economic Performance
The Hon. Steve Whan, MP Minister for Primary Industries Minister for Emergency Services and Minister for Rural Affairs
Level 33 Governor Macquarie Tower 1 Farrer Place SYDNEY NSW 2000
Dear MinisterI am pleased to submit for presentation to Parliament the Annual Report of Forests NSW for the period 1 July 2009 to 30 June 2010.The report complies with the requirements of the Annual Reports (Statutory Bodies) Act 1984, and the Public Finance and Audit Act 1983.Copies have been made available for tabling in Parliament.Yours sincerely
Nick Roberts Chief Executive Officer Forests NSW
Letter to the Minister
ContentsPart OneOverview 3Forests NSW – About us 4Organisational structure 5Communicating our performance 6Five year comparison 8Summary of significant achievements and challenges 9Corporate Business Strategy performance table 10The year ahead 11
Performance spheresSocial 12Environmental 18Economic 26Sustainability 32
Indicators 36
Places of business 50
Part Two (Part 2 is primarily available as a PDF only from www.industry.nsw.gov.au)
Financial statements 51
Statutory information 114
Abbreviations and acronyms Inside back cover
This report was written and compiled by Forests NSW. The project team was:
Data collation and report content: Morgan Roche and Ann Denlow
Graphic design: Ross Longley
Photography: Forests NSW Image Library and as acknowledged.
The report represents a combined effort of Forests NSW corporate and operational branches in terms of data collection and content. Thanks must go to all employees who contributed to the report production and provided feedback.
AcknowledgementsPDF format copies of this and previous Forests NSW Reports are available from the Forests NSW website: www.industry.nsw.gov.au/forests
To provide feedback or obtain hard copies of this report, contact Forests NSW at: T: 1300 655 687 E: [email protected]
© State of New South Wales 2010 ISSN 1837-5456 Job No. 10121 Oct 2010 Annual Report production cost $7 469.00 inc. GST
In the interest of protecting and preserving our environment, Forests NSW has used Nordset paper which is made with fibre obtained from sustainably managed forests. It is oxygen bleached, Totally Chlorine Free (TCF), dioxin and acid free.

3Forests NSW Annual Report 2009–10 Social, Environmental and Economic Performance
Overview
Managing forests has many interrelated processes. Like a puzzle, it is only when they all fit together that we see the full picture. The design of this Annual Report was chosen to convey the interdependence of each part of managing our State forests to achieve a range of benefits, all coming together to deliver sustainable management of State forests and a return to the community.
During the year Forests NSW economic performance remained under the spotlight in a difficult economic climate. Pleasingly, the financial results did not reflect the downturn that was projected due to the global financial crisis. The market responded well to various economic initiatives and demand for timber was strong. Higher sales volumes together with price increases and savings from business improvement processes enabled the business to achieve a trading profit of $19.7 million, a better than anticipated trading result.
Importantly, Forests NSW was able to generate a cash surplus of $38.9 million which was used to pay down $28 million of debt and accrued interest resulting in a net reduction of $24.5 million in the organisation’s total debt. Ongoing saving in interest costs as a result of lower debt is around $2.2 million a year. The cash surplus also allowed the investment of $13.3 million in new light and heavy fleet.
Another standout result for the year was the Moody’s credit rating upgrade for Forests NSW from BB to BB+.
It is disappointing that, with a Recordable Incident Rate of 7.3, Forests NSW safety performance was below the previous year’s result of 4.7. Despite this setback Forests NSW remains committed to aiming for a Recordable Incident Rate of less than one. The impact of a workplace injury on our employees and their families cannot be overstated, and reductions in the Recordable Incident Rate have real implications for them, their quality of life, and their families.
That the Recordable Incident Rate of one or less is achievable was proven in Forests NSW Central Region, which reached this world industry benchmark safety standard by the end of the year. Congratulations to all the staff from the Central Region for this outstanding safety achievement.
Following extensive negotiations with the hardwood sawmilling industry, the first of six planned successive structural price increases of 3 per cent each for hardwood logs was implemented in April 2010. These increases are designed to better align Forests NSW hardwood prices with current market prices.
With the end of the financial year came the transfer of over 100 000 hectares of river red gum-dominated State forests to reserves. The transfer was the result
of the Natural Resources Commission red gum regional assessment and the NSW Government red gum decision, which saw $97 million put aside for reserves management and a structural adjustment package for the red gum timber industry. It is proposed that a small but viable red gum timber industry will remain in the Riverina, based on harvesting from the Koondrook-Perricoota and Campbells Island State Forests.
We are pleased to report that Forests NSW certification to ISO 14001 and Australian Forestry Standard was again reaffirmed by third party independent audits. This provides assurance to the community that environmental values of State forests are preserved and sustained for future generations.
Amenity of State forests for public use was an area of focus during the year. Picnic sites, walking tracks and other facilities were enhanced in several State forests. This included a major upgrade of facilities and a complete refurbishment of the Visitor Centre at Cumberland State Forest in Sydney, which is expected to be completed in time for the Cumberland Forest Fair in October 2010.
As Forests NSW continues to strive to be the best and the safest forest manager in Australasia, this would not be possible without the dedicated and professional staff of the agency. We thank all Forests NSW staff for their hard work over the year.
Richard SheldrakeDirector-General Industry & Investment NSW Commissioner for Forests
Nick RobertsChief Executive Officer Forests NSW

4 Forests NSW Annual Report 2009–10 Social, Environmental and Economic Performance
Forests NSW
A leader in safe, ecologically sustainable forest management
Forests NSW is the registered business name of the Forestry Commission of New South Wales and operates as a public trading enterprise within Industry & Investment NSW (I&I NSW). The Forestry Commission is constituted under the Forestry Act 1916, and is subject to the direction of the responsible Minister. We also administer the Timber Marketing Act 1977, which provides for control of the sale and use of certain timbers in NSW.
Our vision is to be the best and safest commercial forest manager in Australasia. To achieve this we will provide safe and cost-effective forest management services to the Government and people of NSW and independent investors, while increasing the value of their investment.
Forests NSW manages 1.9 million hectares within the public native forest estate and an additional 0.5 million hectares within the planted forest estate, of which over 210 000 hectares are retained native vegetation. As of 1 July, 2010 the area of native State forests in the south west of the State will reduce by 106 515 hectares, as these forests become national and regional parks (see page 20 for more details).
As well as managing these forests we also provide services in private forest harvest planning, plantation establishment, carbon emissions trading, bioenergy and land repair. Forest products and services are supplied by Forests NSW to a wide range of valued customers located within NSW, across Australia and overseas. A committed group of contractors and consultants are engaged by Forests NSW to deliver these products and
services and to maintain and develop the forest estate for the benefit of the people of NSW.
As public land managers we receive funding from the NSW Government to provide specific public services, such as education and recreational facilities. However, our primary source of funds is through revenue associated with the services we provide and the sale of timber.
The objects or purposes of the Forestry Commission are set out in the Forestry Act 1916. The Commission is required to:
conserve and utilise timber under its management to •the best advantage of the State;
provide adequate supplies of timber for building, •commercial, industrial, agricultural, mining and domestic purposes;
preserve and improve, in accordance with •good forestry practice, the soil resources and water catchment capabilities of lands under its management;
encourage the use of timber derived from trees •grown in the State;
preserve the native flora, promote and encourage •the use of State forests for recreation, and conserve birds and animals, consistent with the use of State forests for the purposes of forestry and of flora reserves;
provide natural resource environmental services •(whether within or outside New South Wales); and
take all practical steps to ensure the preservation and •enhancement of the quality of the environment.
Photo by David Barnes

5Forests NSW Annual Report 2009–10 Social, Environmental and Economic Performance
Organisational structure
Minister for Primary IndustriesThe Hon. Steve Whan, MP
Director-GeneralIndustry & Investment NSWCommissioner for ForestsDr Richard SheldrakeMSc Agr PhD FASM FAICD
Chief Executive OfficerForests NSWNick RobertsBSc (Forestry)(Hons), MSc (Forestry)
Government & Community Relations
Rahmat KhaiamiBSc, MSc
• Regulatory & Performance Reporting • Ministerial & Policy
• Audit & Risk Management • Strategic Projects, Planning
& Secretariat • Community Interaction
• Public Programs• GIPA
Native Forests Operations
Erle RobinsonBSc (Forestry)
MPP (Masters Degree Public Policy)
Regional Operations• Central (Wauchope)
• North East (Coffs Harbour)• Southern (Batemans Bay)
• Western (Dubbo)
Land Management & Forestry Services
Ross DicksonBAgSc (Hons)
Sc (Plant Science) PhD (Forestry Science)
• Amenity Nurseries• Assets
• Fire Management• Forest Information & Planning
• Production Nurseries• Tree & Plantation Improvement
Planted Forests OperationsIan BrownBSc (Forestry)
Regional Operations• Hume (Tumut)
• Macquarie (Bathurst)• Monaro (Bombala)• Northern (Grafton)
MarketingDean Anderson
BSc (Forestry)• Contract & Sales
Administration• Carbon & Investor Sales
• Hardwood Sales• Legal
• Market & Business Analysis• Softwood Sales
• Timber Inspection
Financial & Operational Business
ServicesSean Hooper
CA• Business Services• Corporate Finance
• Information Technology• Workshops
• Radio Services
I&I NSWPeople, Learning & Culture
Della FarthingGraduate Certificate of Management
• Administration & Projects• Industrial Relations Operations
• Organisation Development & Training• Safety
• Workers Compensation

6 Forests NSW Annual Report 2009–10 Social, Environmental and Economic Performance
Communicating our performance
Sustaining forest values now and into the future is a day-to-day challenge for responsible forest managers across the globe. We, as the managers of NSW State forests, take our role as a leader in sustainable forest management and in reporting to the community very seriously.
In previous years Forests NSW has produced a separate sustainability report called the Seeing Report. Building on the success of last year we have again produced one combined annual report on our social, environmental and economic performance. In order to make the best use of valuable paper resources and keep costs down, this report has been produced in two parts. The full report will be produced in a small print run, which is presented to the NSW Parliament as part of our Statutory reporting obligations. This full report is also available from our website, along with supplementary material.
Forests NSW sustainability reportingBy producing our first annual sustainability report 12 years ago Forests NSW pioneered broader accountability to its stakeholders. In recognition of this leading role Forests NSW Seeing Report was determined to represent best practice in 2005 by the NSW Legislative Assembly Public Accounts Committee following an inquiry into sustainability reporting in the NSW Public Sector.
The relevance of indicators to our social, environmental and economic performance have changed over time and, as part of the process of continual improvement, Forests NSW reviews and amends our suite of indicators
to more closely align them with the International Montreal Process Criteria, GRI 3 Sustainability Reporting Guidelines1 and business information requirements. Data relating to the indicators is found in the appendices of part one of this report.
Information on our policy framework, governance structure, codes of practice, the regulation of forestry activities and the full details of Forests NSW reporting framework can be found on the Forests NSW website at www.industry.nsw.gov.au/forests
Independent reviewNSW Auditor-General’s office has audited the financial indicators within this report and reviewed the report for completeness. The independent auditor’s reports can been found in part two of this report.
Symbol interpretation
Target achieved or maintained
On track to meeting target
Target not achieved – action required
More information available at: www.industry.nsw.gov.au/forests
1 The Global Reporting Initiative’s (GRI) framework sets out the principles and indicators that organisations can use to measure and report their economic, environmental, and social performance. An assessment of how we meet these guidelines is available from our website.
Average m3/employee Timber revenue/employee ($‘000) Operating profit/employee ($’000)
($’0
00)
Ave
rage
m3 /e
mpl
oyee
-25
0
25
50
75
100
125
150
175
200
0
1000
2000
3000
4000
5000
6000
0
1 000
2 000
3 000
4 000
5 000
6 000
2000–01 2001–02 2002–03 2003–04 2004–05 2005–06 2006–07 2007–08 2008–09 2009–10
Productivity measures 2009–10

Types of harvest operations undertaken by area1
1 Descriptions of the native forest harvest methods can be found in the Forests NSW Native Forest Silviculture Manual, and involve retaining a percentage of trees in the harvested area.
2 Western Region estimates. Non-commercial is defined as areas thinned according to silvicultural practices for the purpose of improving future productivity of a stand, but which do not yield a commercial product.
3 Relates to post-1994 hardwood plantations only.
7Forests NSW Annual Report 2009–10 Social, Environmental and Economic Performance
0
500 000
1 000 000
1 500 000
2 000 000
2 500 000
3 000 000
3 500 000
State forests and the area subject to harvesting operations
2005–062000–011999–00 2006–072001–02 2007–082002–03 2008–092003–04 2009–102004–05
State forests (ha) Area subject to harvesting operations
Native forest area harvested Plantation area harvested
Single Tree Selection 23 733 ha Hardwood clearfall3 0 ha
Non-commercial thinning2 285 ha Hardwood thinning3 0 ha
Australian Group Selection 1 226 ha Softwood clearfall 8 035 ha
Cypress release2 7 650 ha Softwood thinning 5 456 ha
Commercial thinning 4 772 ha
Alternate coupe 1 118 ha
Total 38 784 ha
Total 13 491 ha
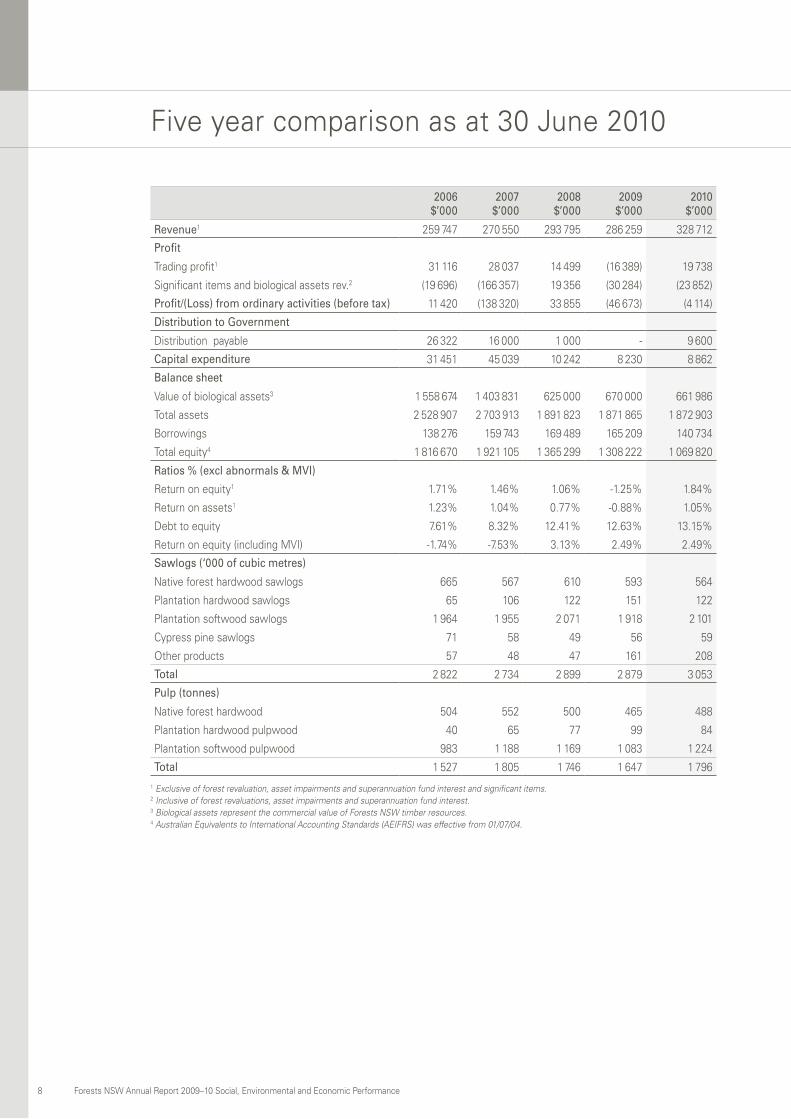
Five year comparison as at 30 June 2010
8 Forests NSW Annual Report 2009–10 Social, Environmental and Economic Performance
2006$’000
2007$’000
2008$’000
2009$’000
2010$’000
Revenue1 259 747 270 550 293 795 286 259 328 712
Profit
Trading profit1 31 116 28 037 14 499 (16 389) 19 738
Significant items and biological assets rev.2 (19 696) (166 357) 19 356 (30 284) (23 852)
Profit/(Loss) from ordinary activities (before tax) 11 420 (138 320) 33 855 (46 673) (4 114)
Distribution to Government
Distribution payable 26 322 16 000 1 000 - 9 600
Capital expenditure 31 451 45 039 10 242 8 230 8 862
Balance sheet
Value of biological assets3 1 558 674 1 403 831 625 000 670 000 661 986
Total assets 2 528 907 2 703 913 1 891 823 1 871 865 1 872 903
Borrowings 138 276 159 743 169 489 165 209 140 734
Total equity4 1 816 670 1 921 105 1 365 299 1 308 222 1 069 820
Ratios % (excl abnormals & MVI)
Return on equity1 1.71% 1.46% 1.06% -1.25% 1.84%
Return on assets1 1.23% 1.04% 0.77% -0.88% 1.05%
Debt to equity 7.61% 8.32% 12.41% 12.63% 13.15%
Return on equity (including MVI) -1.74% -7.53% 3.13% 2.49% 2.49%
Sawlogs (‘000 of cubic metres)
Native forest hardwood sawlogs 665 567 610 593 564
Plantation hardwood sawlogs 65 106 122 151 122
Plantation softwood sawlogs 1 964 1 955 2 071 1 918 2 101
Cypress pine sawlogs 71 58 49 56 59
Other products 57 48 47 161 208
Total 2 822 2 734 2 899 2 879 3 053
Pulp (tonnes)
Native forest hardwood 504 552 500 465 488
Plantation hardwood pulpwood 40 65 77 99 84
Plantation softwood pulpwood 983 1 188 1 169 1 083 1 224
Total 1 527 1 805 1 746 1 647 1 796 1 Exclusive of forest revaluation, asset impairments and superannuation fund interest and significant items.2 Inclusive of forest revaluations, asset impairments and superannuation fund interest.3 Biological assets represent the commercial value of Forests NSW timber resources.4 Australian Equivalents to International Accounting Standards (AEIFRS) was effective from 01/07/04.
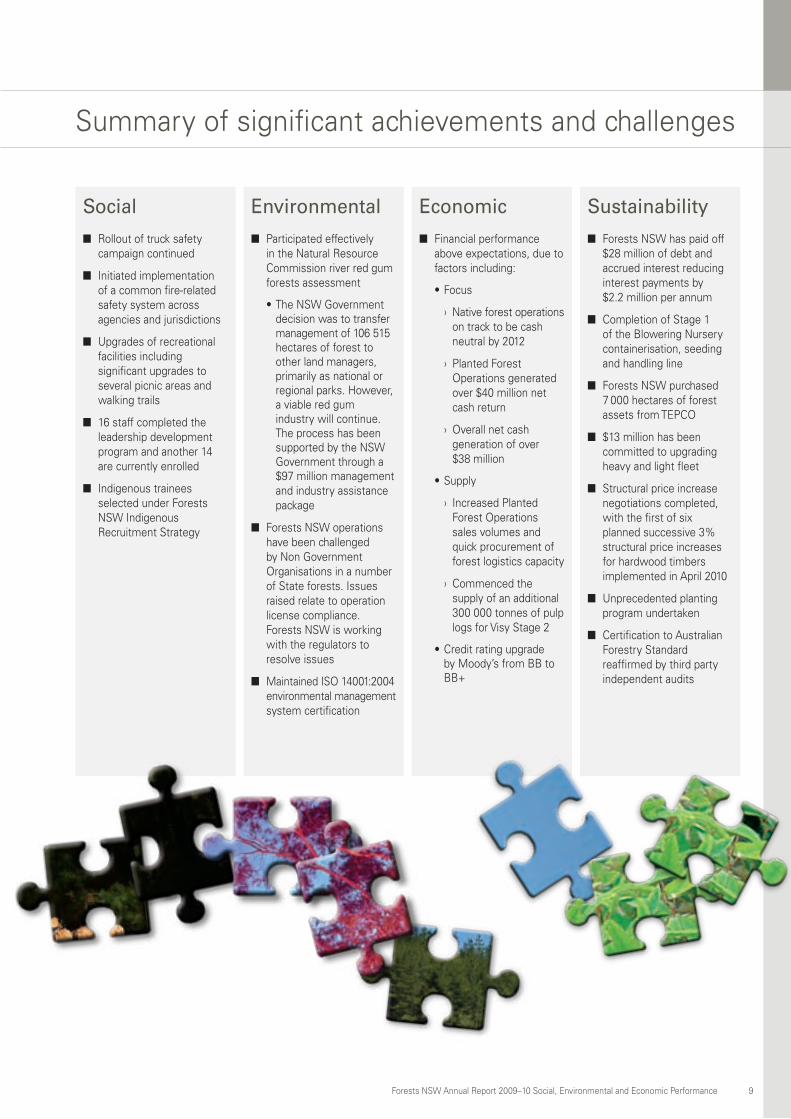
Summary of significant achievements and challenges
Social Rollout of truck safety ■
campaign continued
Initiated implementation ■
of a common fire-related safety system across agencies and jurisdictions
Upgrades of recreational ■
facilities including significant upgrades to several picnic areas and walking trails
16 staff completed the ■
leadership development program and another 14 are currently enrolled
Indigenous trainees ■
selected under Forests NSW Indigenous Recruitment Strategy
Environmental Participated effectively ■
in the Natural Resource Commission river red gum forests assessment
•The NSW Government decision was to transfer management of 106 515 hectares of forest to other land managers, primarily as national or regional parks. However, a viable red gum industry will continue. The process has been supported by the NSW Government through a $97 million management and industry assistance package
Forests NSW operations ■
have been challenged by Non Government Organisations in a number of State forests. Issues raised relate to operation license compliance. Forests NSW is working with the regulators to resolve issues
■ Maintained ISO 14001:2004 environmental management system certification
Economic Financial performance ■
above expectations, due to factors including:
Focus•
Native forest operations ›on track to be cash neutral by 2012
Planted Forest ›Operations generated over $40 million net cash return
Overall net cash ›generation of over $38 million
Supply•
Increased Planted ›Forest Operations sales volumes and quick procurement of forest logistics capacity
Commenced the ›supply of an additional 300 000 tonnes of pulp logs for Visy Stage 2
Credit rating upgrade •by Moody’s from BB to BB+
Sustainability Forests NSW has paid off ■
$28 million of debt and accrued interest reducing interest payments by $2.2 million per annum
Completion of Stage 1 ■
of the Blowering Nursery containerisation, seeding and handling line
Forests NSW purchased ■
7 000 hectares of forest assets from TEPCO
$13 million has been ■
committed to upgrading heavy and light fleet
Structural price increase ■
negotiations completed, with the first of six planned successive 3% structural price increases for hardwood timbers implemented in April 2010
Unprecedented planting ■
program undertaken
Certification to Australian ■
Forestry Standard reaffirmed by third party independent audits
9Forests NSW Annual Report 2009–10 Social, Environmental and Economic Performance

Corporate Business Strategy performance
10 Forests NSW Annual Report 2009–10 Social, Environmental and Economic Performance
Key result area
Performance measure / GoalI&I
NSW KRA
Target 2009–10 Performance
Focu
s
Ongoing improvement in safety results to reach recordable incident rate of less than one
335% actual reduction on June 2009 for recordable injuries
Number of lost time incidents and recordable injuries was 57 compared to 42 for 2008–09. The recordable incident rate was 7.3
Meeting profitability and dividend targets as agreed with Treasury
1As per Statement of Business Intent
Targets exceeded
Maintenance of AFS certification and ISO 14001:2004 accreditation of the EMS
2 Ongoing Certification to AFS and EMS maintained
Meeting or exceeding contractual obligations to customers
1 & 5 Ongoing
The majority of contract obligations have been met. One major customer is in dispute with Forests NSW with regard to performance against their Wood Supply Agreement
Forest burnt by damaging wildfire
2Less than 0.3% of the forest estate
37 610 ha of State forest was burnt by wildfire representing 1.6% of the forest estate
Org
anis
atio
nal e
ffici
ency Implementation of the performance
management system for all staff5 Ongoing
Implemented for all public servants. Has not as yet been extended to cover fieldworkers
Complete the establishment of workshops and timber inspection services as stand-alone business units
1 & 5December 2009
Timber Inspection Services and Workshop Services have been established as responsibility centres in the finance system and they are working under their own separate budgets
Review firefighting methods and resources
2 June 2010 Commenced and on schedule
Reve
nue
grow
th
Implementation of major pricing review recommendations
1 Ongoing
The first of six 3% structural price increases applied from 1 April 2010. The remaining price increases are planned to be implemented at six-monthly intervals until completed
Implementation of the second round of Government approved projects for third party investment in plantation establishment
1 & 2Projects approved and underway by December 2009
Completed
Complete preparations and Expression of Interest (EOI) for at least two extractive resources projects
1 December 2009EOI for one project completed. Second project delayed
Disposal of at least five identified surplus land and buildings 1 June 2010
Two properties have been disposed of. Other properties have been identified for disposal but are pending resolution of title issues and disposal methods
Review and implement new valuation methodology
1 December 2009 Completed

The year ahead
11Forests NSW Annual Report 2009–10 Social, Environmental and Economic Performance
Forests NSW has outlined a number of goals and key projects under the five strategic directions in our Corporate Business Strategy (CBS) for 2010–11. The CBS provides clear focus and direction for staff on the priorities for the year ahead. Some of these include:
Social Reviewing Forests NSW operational work methods, risk ■
assessment processes and focussing on behavioural change management to improve safety performance.
Reviewing incident information from contractors to ■
better understand the issues affecting their health and safety environment and to assist them to improve their safety record.
Completing review of safety documentation. ■
EnvironmentalReaching production capacity at Blowering Nursery. ■
Undertaking review of environmental management ■
systems.
Economic Continuing implementation of strategies to achieve ■
a cash neutral financial outcome for native forest operations by 2012.
Working on two major projects embarked on by ■
Planted Forests Operations to effect substantial and sustainable cost reductions:
Site-specific silviculture: this project focuses on classifying growing sites across the State into sites that require similar silvicultural treatments. This ensures that only those treatments that are necessary to grow trees well on that particular site are applied.
Value recovery: this project involves perfecting the methodology that determines the optimal way to cut the tree into various logs to customer specifications.
Sustainability Completing a review of firefighting methods and ■
resourcing.
Maintenance of certification to the Australian ■
Forestry Standard (AS 4708:2007).
Delivery of these projects not only meets targets for business improvement in the CBS, but also in completing actions from continuous improvement processes identified through independent auditing of performance and results of benchmarking exercises.
Key result area
Performance measure / GoalI&I
NSW KRA
Target 2009–10 Performance
Cos
t red
uctio
n
Implementation of approved recommendations of the 2007 benchmarking study
1 & 5 December 2009 Substantially completed
Implementation of light and heavy fleet recommendations including leasing of light and heavy fleet
1 & 5Approved new arrangements in place by September 2009
Largely achieved. Following further analysis a decision was made to fund fleet acquisitions from cash flows rather than leasing
Continuous evaluation of business and operational practises 1 & 5 Ongoing
An external evaluation of business processes and systems was completed. Outcomes are being assessed for staged implementation
Sim
plifi
catio
n
Establish structure for operational engagement around simplification of AFS certification support systems and the EMS
5 December 2009 Completed
Review and further streamline business support services
5 December 2009A review has been completed. Recommendations from that review are being implemented
Review procurement processes with a view to identifying increased efficiencies
5 September 2009Online purchase order project due to be fully implemented by December 2010
Review and streamline organisational structures to meet business needs 5 December 2009
A number of reviews completed and changes to structures finalised. Consultations are ongoing for Native Forest Operations Branch realignment
Strategic review of information management and ICT requirements
5 June 2010Preliminary work has been completed. Work will continue during 2010–11
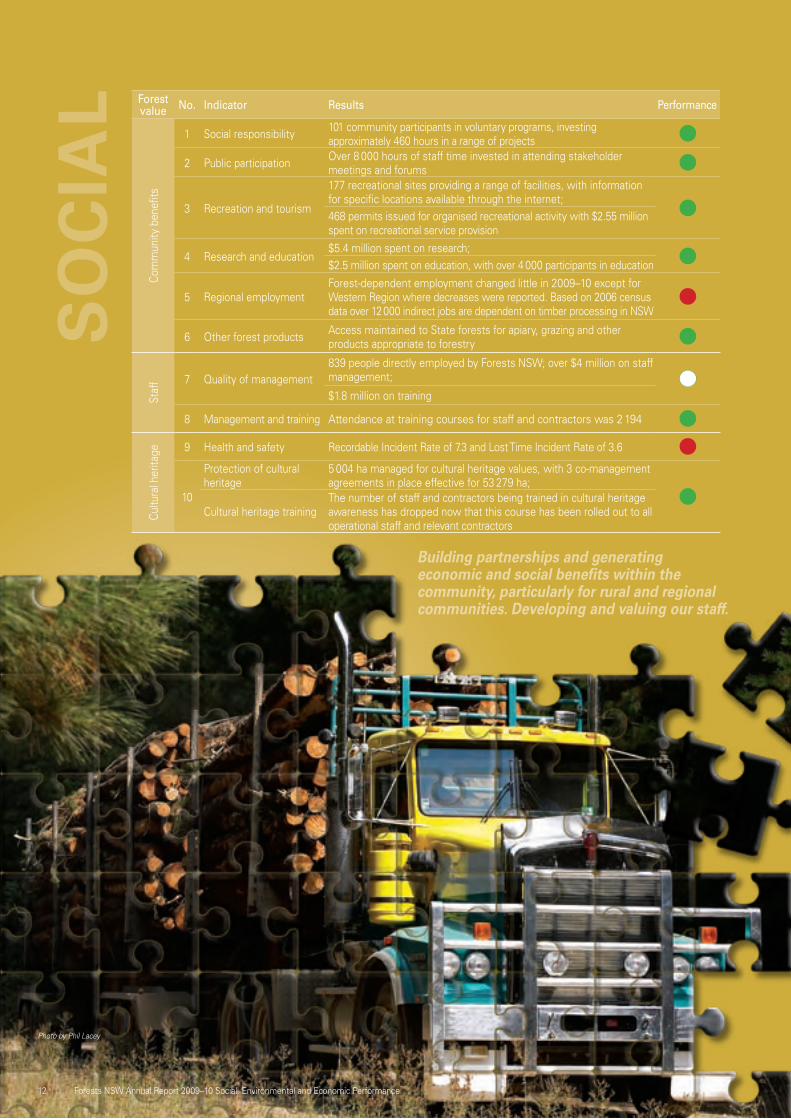
Forest value No. Indicator Results Performance
Com
mun
ity b
enefi
ts
1 Social responsibility 101 community participants in voluntary programs, investing approximately 460 hours in a range of projects
2 Public participation Over 8 000 hours of staff time invested in attending stakeholder meetings and forums
3 Recreation and tourism
177 recreational sites providing a range of facilities, with information for specific locations available through the internet;468 permits issued for organised recreational activity with $2.55 million spent on recreational service provision
4 Research and education$5.4 million spent on research;$2.5 million spent on education, with over 4 000 participants in education
5 Regional employment Forest-dependent employment changed little in 2009–10 except for Western Region where decreases were reported. Based on 2006 census data over 12 000 indirect jobs are dependent on timber processing in NSW
6 Other forest products Access maintained to State forests for apiary, grazing and other products appropriate to forestry
Staf
f 7 Quality of management839 people directly employed by Forests NSW; over $4 million on staff management;
$1.8 million on training
8 Management and training Attendance at training courses for staff and contractors was 2 194
Cultu
ral h
erita
ge 9 Health and safety Recordable Incident Rate of 7.3 and Lost Time Incident Rate of 3.6
10
Protection of cultural heritage
5 004 ha managed for cultural heritage values, with 3 co-management agreements in place effective for 53 279 ha;
Cultural heritage trainingThe number of staff and contractors being trained in cultural heritage awareness has dropped now that this course has been rolled out to all operational staff and relevant contractors
So
cIA
l
12 Forests NSW Annual Report 2009–10 Social, Environmental and Economic Performance
Building partnerships and generating economic and social benefits within the community, particularly for rural and regional communities. Developing and valuing our staff.
Photo by Phil Lacey

Safety – ‘the way we do things around here’
13Forests NSW Annual Report 2009–10 Social, Environmental and Economic Performance
Pillars Safety activity Outcome Further action
Lead
ersh
ip
Define what Safety Leadership behaviours and activities look like
Safety behaviours included in all position descriptions
Discuss safety in all employee performance reviews
Develop and deliver a comprehensive Safety Leadership training program
Completed Reinforce safety leadership in all staff safety sessions
Track leadership actions Actions are integrated into the business unit plans and reported regularly
Monitor and report progress of actions
Continue safety benchmarking for key leaders
Initial exercise completed Identify and program further benchmarking opportunities
Develop ‘first priority’ program Program supported through the strategic and operational H&S plans
Self-assess the effectiveness of plan implementation
Enga
gem
ent
Each employee to commit to 2 safety activities annually
Introduction of Take 2 program Introduce a formal safety observation approach
Employees actively involved in development of Safe Work Procedures
Structured process in place Continue in accordance with Forests NSW consultative arrangements
Introduce benchmarking for OHS committees
Strategy being developed Develop a simple review tool to assist H&S committees reviews
Implement and train for use of Stop Work Authority Cards
Graphic design and printing of Safety Authority is due for completion during 2010
Implementation of Safety Authority will commence in early 2011 as part of the behavioural safety program
Provide standardised resource for Toolbox Talks
Briefs developed and available on the Forests NSW intranet
Develop new briefs as relevant topics are identified
Syst
em
Move to national safety model1 Safety Management System review is ensuring that all elements are aligned with AS 4801.
All Forests NSW Safety Management System documentation to be reviewed against the National Model prior to January 2012
Continue with rewrite of the safety documentation
A full review of all safety standards has been conducted
Other system documentation will be reviewed with a view to simplification and clarity
Refine OHS Committee Chair training Training delivered as required by accredited provider
New committee members are trained as required
Train 4 Level 1 incident investigators and 10 Level 2 investigators
Training undertaken within business units Refresher training will be undertaken following a review of business unit training plans
Commence Safe Work Procedures development on a risk basis
All Safe Work Procedures are under review as part of the Safety Management System
Ensure all Safe Work Procedures indicate both initial and residual risk
1 In January 2009 the Australian Government announced a National Model OHS Act and National Model OHS Regulations.
Our first priorityForests NSW Safety Strategy 2008–11 continues to be the organisation’s overriding guide to safety. The key pillars of the strategy appear under the headings of Leadership, Engagement and System.
Leadership ■ – to create a work environment and culture where employees can show leadership in safety.
Engagement ■ – to engage all staff by providing training, support, recognition and opportunities to participate in working safely every day and heightening knowledge and skills in safety and awareness.
System ■ – to operate a Safety Management System that meets legal requirements while being easy for our staff to use.
The table below shows how Forests NSW has performed against the activities identified in the strategy for 2009–10.
Safety performance Ultimately, the objective of the workplace safety program is that every employee who comes to work returns home uninjured. The main quantitative indicator used to measure safety performance is the ‘recordable injury rate’. The recordable injury rate for 2009–10 was 7.3, which means about 7 in 100 employees suffered a lost time, work related injury that required medical treatment at some time in the year. As noted in the Corporate Business Strategy on pages 10 and 11, a rate of only 1 in 100 is the organisation’s goal. For an example of how this has been achieved see the case story on page 16.
Take 2Forests NSW recognises the importance of instilling an awareness of how routine behaviour patterns directly impact on safety. Based on this principle, one initiative called Take 2, encourages and empowers staff to pause for a minute or two to Stop, Think and Decide on the safest way to proceed before commencing a fresh task.

14 Forests NSW Annual Report 2009–10 Social, Environmental and Economic Performance
Human resource managementForests NSW, like other forest management organisations in Australia, continues to experience difficulty in attracting skilled staff. Inadequate labour market knowledge of the forestry industry as a genuine career option, an unfavourable public perception in some quarters and a shortage of relevant courses at universities are believed to be factors contributing to this.
Forests NSW will continue to focus on retention and development of its employees through: further targeted development; employee engagement; developing occupational health and safety strategies to manage ageing workers; and talent management and development.
Externally, from a human resource management perspective, the aim is to facilitate a match between labour availability and future business needs. The focus is towards targeted recruitment strategies and building strong partnerships with tertiary, secondary and private institutions.
The Forests NSW Leadership Program continued to develop the leadership potential of selected staff. The program was expanded during the year to include a safety management component.
Our partnersForests NSW does not operate in isolation and is inter-dependent with a range of industry partners. Forests NSW commitment to the wider timber industry in NSW was recognised through its leadership in a number of partnership safety initiatives.
Log truck safetyForests NSW has taken a leadership role in logging truck safety in NSW. With more than 600 truck trips per day Forests NSW is the largest single user of contractor logging trucks in the State. A number of initiatives have been introduced or are currently being worked on, including a disincentive scheme for overloading which has seen a decrease in the incidence of overloading by
more than 50 per cent, a series of seminars delivered to truck drivers and contractor principles by an expert on heavy vehicle stability and a hotline for truck driving compliments/complaints. These initiatives are starting to deliver tangible outcomes in the improvement of logging truck safety and the interaction between logging trucks and the public on State roads.
Forests contractor safety outreachIn 2009, Forests NSW entered into an agreement with WorkCover NSW to apply its safety expertise to supporting small contractor businesses within the forestry industry to improve safety outcomes.
The initial efforts of Forests NSW and WorkCover NSW focused on clarifying the expectations and responsibilities of internal and external stakeholders around safety issues. The program included a series of workshops throughout the State and the release of the ‘Forest Industry Safety Toolkit’ for industry consultation. A number of enquiries about the toolkit have already been received from within Australia and overseas.
The importance of this work is highlighted in view of the 76 harvest and haulage contractor Recordable Incidents reported in 2009–10.
Firefighter safety Firefighting and undertaking prescribed burns are significant components of Forests NSW forest management responsibilities. While the risks associated with Bushfire management are widely recognised, up until recently each organisation responsible for providing Bushfire management resources had its own safety systems and procedures. This was recognised as an area of concern, particularly as so many fire management operations rely on a coordinated response from a range of agencies.
Forests NSW has built on its strategic alliances with key State and National fire associations and committees to initiate a broad-ranging discussion on the best ways to achieve national consistency in a framework supporting firefighter safety.
Four aircraft-related incidents occurred on fires in NSW during December 2009 – three helicopter and one fixed wing. Sadly these incidents resulted in a number of injuries and one fatality. One of the three helicopters involved is owned and operated by Forests NSW. The incident was a mid-air contact with another helicopter resulting in the tail stabiliser fin on the Forests NSW helicopter being
damaged. Thankfully both helicopters landed safely and no-one was injured in this incident. The Forests NSW helicopter has been repaired and continues to make an important contribution to Forests NSW prescribed burn and forest health survey programs. Forests NSW has made a claim on the pilot of the other helicopter involved in the incident for damages and related costs.
Forests NSW helicopter takes a knock

15Forests NSW Annual Report 2009–10 Social, Environmental and Economic Performance
Recordable incidents by type of injury 2009–10
Inflammation of joints, tendons or muscles
Laceration
Effect of toxic substances
Bruise/Swelling
Fracture/ Dislocation
Allergies/ Sensitivities
Foreign bodies
Psychological
Superficial injury
Other
Sprains/Strains
18%
37%
3%
3%
3%
3%
3%
5%
7%
9%
9%
Injuries sustained 2009–10
First Aid
Treatment by doctor
Treatment at hospital
Unspecified
No treatment
29%
40%
3%
8%
20%
The Recordable Incident Rate (aka All Frequency Rate) is the measure of all recordable incidents, including Medical Treatment Only Incidents and Lost Time Incidents. A Medical Treatment Only Incident is any incident that requires medical intervention such as stitches, a prescription or a referral. A Lost Time Incident results in time lost from work of one day/shift or more.
The Lost Time Incident Rate is the measure of more serious recordable injuries, which result in time lost from work of one day/shift or more.
Recordable Incident Rate = Total number of Recordable Incidents x 200 000
Hours worked financial year to date
Lost Time Incident Rate = Number Lost Time Incidents x 200 000
Hours worked financial year to date
Photos by Phil Lacey
Lost Time Incident Rate
2.7
3.3
4.5
2.5
2005–06 2006–07 2007–08 2008–09 2009–10
3.6
0
2
4
6
Recordable Incident Rate
0
2
4
6
8
10
12
7.8
8.8
11.3
4.9
7.3
2005–06 2006–07 2007–08 2008–09 2009–10
Forests NSW Central Region meets world best safety record
16 Forests NSW Annual Report 2009–10 Social, Environmental and Economic Performance
Traineeships making a difference
In February, two Grafton men were selected under the Forests NSW Indigenous Recruitment Strategy to undertake a two-year Certificate III Traineeship in Forest Growing and Management.
Dane Walker and Cody Reti were recognised for their talent and potential to gain new and valuable skills over the next two years. The traineeship is based in Grafton and provides experience working in native and plantation forests on a 12-month rotational basis supplemented by TAFE study for the next two years.
The traineeship includes opportunities to undertake a variety of field-based and manual works including
slashing, spraying, firefighting, clearing tracks, pruning, maintenance of facilities and equipment, road construction, fire protection works such as hazard reduction burning, measurement and assessment of trees and general field work in plantations and/or native forest areas.
Forests NSW has partnered with the Aboriginal Employment Service on this project, which has assisted with recruitment and promotion and will be involved as the employer of the trainees, while Forests NSW will be the host employer to provide ongoing mentoring.
Forests NSW Central Region has achieved global best practice in regards to safety standards. Over the 2009–10 financial year Central Region’s overall health and safety performance was outstanding with only one recordable incident for the period. The global best practice for forests industry is an incident rate of one, which is equivalent to 1% of recordable incidents. A recordable incident is an incident that requires some level of medical treatment, such as when a doctor prescribes a drug or uses their medical expertise to insert a stitch or take some other special action.
Forests NSW Central Region extends from Morisset to Kempsey on the North Coast and is responsible for the sustainable management of native forests in the area. The region has an equivalent full-time staff complement of 96 so this represents an incident rate of about 1 percent.
This result indicates that Central Region has now achieved the effective implementation of a good health and safety management system and developed a safety culture with the support of a proactive health and safety committee. Central Region has been showing continual year-on-year improvements, down from seven recordable injuries during 2008–09 and 11 recordable for the year before.
Importantly, Forests NSW and, in this example, Central Region, have demonstrated that workplace injury is preventable and that thorough investigation and actioning of incident reports tend to always identify a fault in the work processes that led up to it. Based on this result, Central Region has now set the standard for all other Forests NSW business units to meet.

17Forests NSW Annual Report 2009–10 Social, Environmental and Economic Performance
Hosted tours offer insights into forest management
Forestry can be a contentious topic in Australia and Forests NSW business attracts interest from local communities and interest groups across the State.
In response to this interest, Forests NSW continues to extend its offer to local communities to visit State forests and learn more about forestry and forest management. During 2009–10 staff hosted two tours of State forests near Eden. The trips focused on issues and operations specific to the NSW south coast, with staff presenting information about the local industry, various types of timber and forest products, and the strategies employed in sustainable forest management.
Hosted by chief executive, Nick Roberts, and southern regional manager, Ian Barnes, the trips were focused on key community representatives. The feedback received was overwhelmingly positive with attendees appreciating the opportunity to talk one on one with staff about the issues and get an up-close look at the processes Forests NSW employs.
For ten years, Forests NSW has also been running teacher education trips to forests – a great opportunity for teachers to see first-hand some of the processes they teach in class.
Over the year groups headed out to State forests near Bathurst and the Southern Highlands. The focus was pine plantations and examining the cycle from establishment through to harvest. The groups were able to see the variety of harvesting methods used in plantations associated with thinning and clearfall, as well as discuss forest management issues like fire and recreation management.
Thinning underway in East Boyd State forest during one of the Eden tours. Thinning removes poorer quality suppressed and sub-dominant trees and provides room for healthier and straighter dominant trees to grow on to produce high quality sawlog timber. Photo by Howard Spencer.

ENV
IRo
NM
ENTA
l
Photo © Forests NSW Image Library
Ecologically sustainable management of native and planted forest to protect and enhance environmental functions and conservation values. Expanding the plantation estate to help meet future market needs.
Forests NSW Annual Report 2009–10 Social, Environmental and Economic Performance18
Forest value No. Indicator Results Performance
Biod
iver
sity
11
Extent of forest type Total forest estate managed 2.4 million hectaresNative forests 1. 9 million hectares of native forest estate1
Planted forests
205 929 hectares of softwood and 45 141 hectares of hardwood plantations;250 229 hectares of future plantations & retained vegetation and infrastructure;
8 079 hectares of softwood and 1 118 of hardwood plantation planted
12 Native forest structure
26% regrowth, 28% mature, 5% high conservation value old growth, 5% rainforest and 36% unassigned
13 Surveyed species50 targeted species found with 1 997 fauna sightings. The drop in sightings compared to last year is associated with fewer targeted bat surveys
Fore
st h
ealth
14 Pests and weeds $1.7 million spent on feral animal and weed control, an increase of $230 000
15 Plantation health Overall maintenance of planted forest health, based on forest health sample surveys undertaken
16 Firefighting and prevention
1.6% of State forests burnt by wildfire; 23.4 % of State forests treated by fuel management strategies; $10.7 million spent on fire prevention and control
Soil
and
wat
er
qual
ity
17 Protection of soil and water
$5.4 million spent on harvesting supervision and environmental compliance in native forests252 826 hectares of State forests primarily managed to protect water catchments
Com
plia
nce
18 Regulatory compliance 5 fines issued; 0 prosecutions
Envi
ronm
enta
l ser
vice
s 19 Carbon sequestration
Over 4.3 million tonnes of CO2-e sequestered by plantations and an estimated net 1.6 million tonnes of CO2-e sequestered by native forests;Estimated 14 128 tonnes of CO2-e emitted, including previously unreported heavy truck and plant
20 Energy consumption
2.5% of electricity sourced from green power;11.3% drop in fleet size over 2008–09 figure;Increase in diesel and petrol fuel associated with improved reporting methodology. Omissions in the previous reporting methodology make comparisons difficult
21 Material consumption and recycling
60% drop in the reported potable water usage compared to 2008–095% increase in the percentage of materials recycled
1Excludes 151 000 hectares of retained forests and vegetation in the planted forests estate
Maintaining and improving values
19Forests NSW Annual Report 2009–10 Social, Environmental and Economic Performance
EstablishWhile foresters are often seen as only cutting trees down, it is in the regeneration or planting of forests that much of our foresters’ skills lay. Without these interventions forests do grow or regrow, but often much slower and with species that are less beneficial for social, environmental and economic values.
Afforestation of historically cleared land has not only been undertaken within our own estate, but also for a number of clients. In April 2010, Forests NSW handed over management responsibility for 80 hectares of spotted gum plantation, which it had successfully established on mining buffer land near Singleton in the Hunter Valley. The plantation demonstrates an alternative use for these buffer lands, which would have originally been forested.
In another project Forests NSW, in partnership with MidCoast Water, has successfully planted 65 hectares of hardwood plantation on the previously ‘bald’ hills in the catchment of Bootawa Dam near Taree. No chemicals were used in site preparations, with 72 000 eucalypt saplings planted in protective sleeves. Management of the plantation by Forests NSW will continue until the trees are well established. The plantation is designed to maximise carbon sequestration over the next 40 years.
MaintainForests NSW harvests native and planted forests according to best silvicultural principles with input from a range of stakeholders. The consultative process culminated in the NSW Forest Agreements for coastal forests and subsequent agreed outcomes for inland areas. Since the NSW Forest Agreements were signed, Forests NSW manages its coastal native forests under Integrated Forestry Operations Approvals. These approvals require Forests NSW to operate within a range of conditions designed to protect forest ecosystems into the future.
Indicator 18 on page 43 reports our compliance against a range of conditions and requirements. Forests NSW undertakes thorough internal compliance checks using a four-tier system ranging from direct supervisor monitoring through to branch and corporate level environmental audits.
While these checks generally confirm compliance, a number of non-compliance incidents are reported from time to time. These incidents are tracked until they are resolved and corrective action has been implemented.
External audits are undertaken to check compliance against legislation, regulation and internationally recognised standards. Forests NSW performance in these audits is reported in Indicators 18 and 30.
Native forests operations was the subject of a range of objections raised by Non-Government Organisations. These included concerns associated with threatened species in a small number of State forests in the north east of the State, koala protection measures within harvesting in three south coast State forests and water supply and quality for the town of Wyndham in planned harvesting in Yurammie State Forest. Forests NSW has worked closely with the NSW Department of Environment Climate Change and Water (DECCW) and the Non-Government Organisations to address these concerns. This enabled the completion of harvesting in some State forests, while other harvest operations have been delayed in order to facilitate further consultation.
Harvesting operations in Yabbra State Forest near Urbenville resulted in DECCW issuing penalty notices for five breaches of the threatened species licence. Following a complaint to Forests NSW it was also found that the harvesting intruded on a neighbouring property. In its review of the conduct of the harvesting, Forests NSW found a number of breaches of the Integrated Forestry Operations Approval and remedial works were put in place.
ImproveSilviculture, the management of forests, is not only about protecting ecosystems, but improving how the forests are used. This is demonstrated in examples such as the Koondrook-Perricoota forests Flood Enhancement Project (see page 21) and in the work undertaken to restore the health of native forests affected by Bell Miner Associated Dieback.
While some improvements are provided through external funding, much of Forests NSW management of State forests is funded through revenue generated from sustainably harvested timber (see the graph on page 27 to compare Forests NSW revenue sources).
As custodian of the forests it is Forests NSW goal to leave the forests in as good or better condition for future generations, while providing sustainable and essential resources for the present.

20 Forests NSW Annual Report 2009–10 Social, Environmental and Economic Performance
1999–00 2000–01 2001–02 2002–03 2003–04 2004–05 2005–06 2006–07 2007–08 2008–09 2009–10
Non
-com
plia
nce
inci
dent
s
Fine
s
0 0
500
1 000
1 500
2 000
2 500
1
2
3
4
5
Regulatory compliance
Non-compliance incidents Fines
River red gum forests
Tenures HectaresTransferred to national/regional parks 75 609Vested in the NSW National Parks and Wildlife Minister 7050
Murrumbidgee Irrigation Area 5889Transferred to Crown Land 3172Transferred to Aboriginal ownership 20 684 Total State forest transferred 106 515 Total area transferred including Murrumbidgee Irrigation Area 112 404
In May 2010, the NSW Government announced that 112 404 hectares of river red gum forests managed by Forests NSW would be transferred to other tenures from 1 July, 2010. Forests NSW will no longer supply the
region’s timber processors from these forests. The NSW Government is providing structural adjustment funding for affected sawmillers. Details can be found at: www.riverredgums.nsw.gov.au
Breakdown of Forests NSW managed lands transferred to other tenures as of 1 July 2010
Photo by David Barnes
Water, light and soil
21Forests NSW Annual Report 2009–10 Social, Environmental and Economic Performance
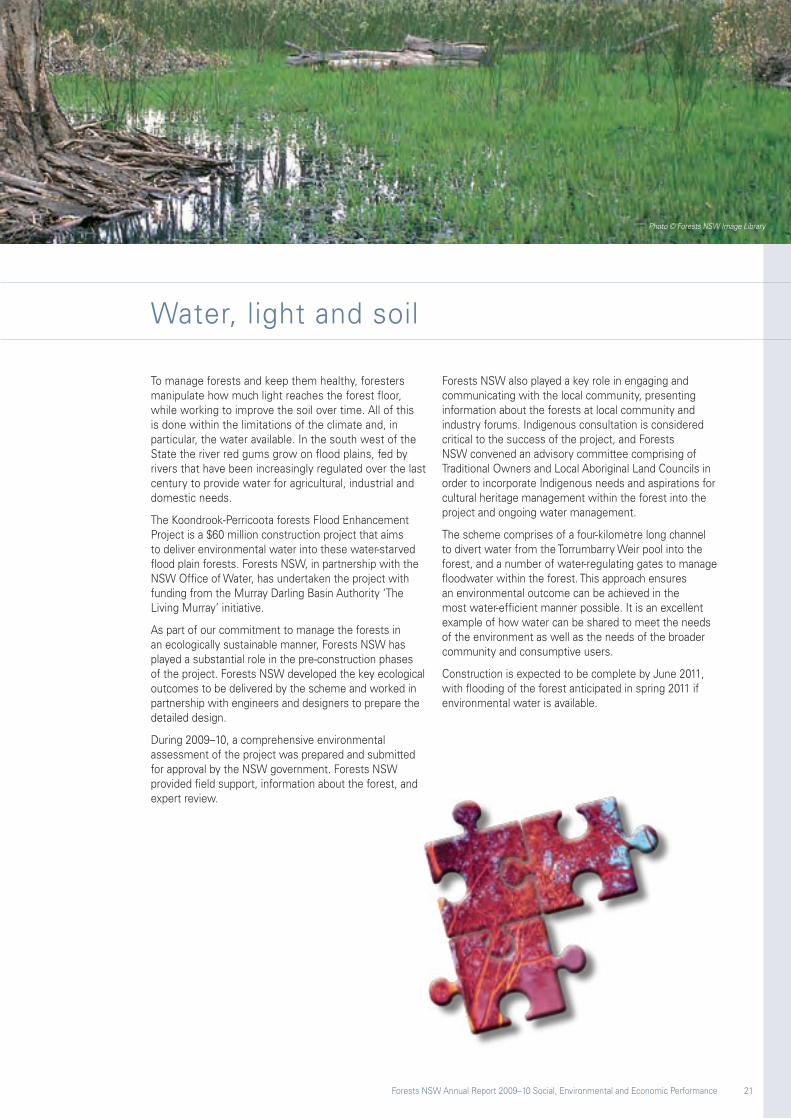
To manage forests and keep them healthy, foresters manipulate how much light reaches the forest floor, while working to improve the soil over time. All of this is done within the limitations of the climate and, in particular, the water available. In the south west of the State the river red gums grow on flood plains, fed by rivers that have been increasingly regulated over the last century to provide water for agricultural, industrial and domestic needs.
The Koondrook-Perricoota forests Flood Enhancement Project is a $60 million construction project that aims to deliver environmental water into these water-starved flood plain forests. Forests NSW, in partnership with the NSW Office of Water, has undertaken the project with funding from the Murray Darling Basin Authority ‘The Living Murray’ initiative.
As part of our commitment to manage the forests in an ecologically sustainable manner, Forests NSW has played a substantial role in the pre-construction phases of the project. Forests NSW developed the key ecological outcomes to be delivered by the scheme and worked in partnership with engineers and designers to prepare the detailed design.
During 2009–10, a comprehensive environmental assessment of the project was prepared and submitted for approval by the NSW government. Forests NSW provided field support, information about the forest, and expert review.
Forests NSW also played a key role in engaging and communicating with the local community, presenting information about the forests at local community and industry forums. Indigenous consultation is considered critical to the success of the project, and Forests NSW convened an advisory committee comprising of Traditional Owners and Local Aboriginal Land Councils in order to incorporate Indigenous needs and aspirations for cultural heritage management within the forest into the project and ongoing water management.
The scheme comprises of a four-kilometre long channel to divert water from the Torrumbarry Weir pool into the forest, and a number of water-regulating gates to manage floodwater within the forest. This approach ensures an environmental outcome can be achieved in the most water-efficient manner possible. It is an excellent example of how water can be shared to meet the needs of the environment as well as the needs of the broader community and consumptive users.
Construction is expected to be complete by June 2011, with flooding of the forest anticipated in spring 2011 if environmental water is available.
Photo © Forests NSW Image Library

Making biodiversity cost-effective
22 Forests NSW Annual Report 2009–10 Social, Environmental and Economic Performance
Small bats (Microchiroptera) are a diverse and threatened component of our forest fauna. Forest surveys use bat detectors to record ultrasonic echolocation calls of bats as they fly and go about their nightly business.
The success of bat call surveys depends on the ability of surveyors to detect and recognise all target species resident in the study area. The automation of bat call identification is an essential development in the efficiency of this survey method and should ultimately improve the ability to distinguish between species and increase the speed of call identification.
Research published during the year by the Forest Science Centre, I&I NSW, describes bat call identification keys to link with new software to automate this process. The system will help Forests NSW save time and money in proposed biodiversity monitoring.
Just as people who live in different regions have different speech patterns, so do bats living in the forests along the east coast of New South Wales. This regional difference in dialects was just one aspect taken into consideration in developing a system to better identify bat calls in NSW.
New technology, such as memory cards, now allows thousands of calls to be recorded in a survey. In the past, individual displays of each call were compared with known call patterns to help identify the species, making identification extremely time-consuming and subjective.
The new research used a reference library of more than 4 000 bat calls and AnaScheme, a software program devised to automate the process of call identification, in conjunction with identification keys for bat calls in different parts of NSW. The software relies on field recordings of bat calls made using a bat detector. The recorder can be left in the field for long periods, automatically recording echolocation calls of bats as they fly by.
Automating the identification process will lead to time and money savings in undertaking the field surveys, increase the accuracy rate and make long-term monitoring of forest bats cost-effective.
This project is being undertaken by a collaborative team of scientists including Dr Brad Law, Maria Adams and Mark Chidel from I&I NSW and software designer, environmental scientist Matthew Gibson from the Centre for Environmental Management, School of Science and Engineering, University of Ballarat, Victoria. Funding for the research was received from the Australian Biological Resources Study.
Photos by Brad Law

23Forests NSW Annual Report 2009–10 Social, Environmental and Economic PerformancePhoto by Brian Tolhurst

24 Forests NSW Annual Report 2009–10 Social, Environmental and Economic Performance 25Forests NSW Annual Report 2009–10 Social, Environmental and Economic Performance
Ecological prescriptions In this harvest area 34 hours of day and night surveys were carried out during harvest area planning to identify the threatened plant and animal species. Yellow bellied gliders, koalas, rare frogs and bats are some examples of what was found. Prescriptions developed by leading experts are applied to ensure the habitat for these threatened species is protected, such as buffers around old mine sites where bats roost.
Each area of the forest is then assessed as the forest is marked for harvest by specialised field officers. At this stage hollows and trees with the potential for hollows are retained. Compartment mark-up and harvest supervision ensure that the ecological values of our forests are not compromised.
Water quality Maintaining a high standard of water quality is critical to achieving sustainable forest management. Streamside reserves, where harvesting is excluded, filter water runoff and protect important habitat. In addition ground disturbance is minimised in the next ten metres adjacent to these reserves. Conditional approval is required to cross drainage features to ensure water quality is not compromised. During harvesting work is carried out to ensure that crossings, extraction tracks and log dumps are stable with no potential for erosion. Roads are a major potential source of water pollution and Forests NSW ensures that roads are designed and maintained to reduce the risk of soil movement into streams.
Harvesting prescriptions During harvest planning identified special values and protected areas are subtracted from the base map giving the net area available to harvest. In this area silviculture – the art and science of growing trees, is carried out to harvest timber, but more importantly ensure that the forest continues to grow healthy and quality trees into the future. Often further values of importance that have not been excluded from harvesting, such as habitat and visual amenity, are maintained through modified harvesting techniques. In the harvest area shown a silvicultural system called Single Tree Selection has been used to provide timber for regional industry and consumer demand for sustainably grown timber whilst ensuring that the forest is maintained.
Base Forests NSW operates mainly on State forests, which are organised into management units (compartments). Precision surveys are carried out to ensure that Forests NSW or contractors do not operate on neighbours land. Where boundaries are difficult to determine Forests NSW survey units can be called on to check them.
Social Safety in the forest is paramount to Forests NSW and for every activity undertaken by the organisation or its contractors a safety plan is developed and hazards identified. Safety meeting points and helicopter landing sites are identified in each operational plan in case of emergencies.
State forests are for everyone and they have a long history of indigenous and non-indigenous use. In this compartment areas of Aboriginal cultural and non-Aboriginal heritage have been protected. Within the harvest area there is a gold mine and an old boiler last used before World War Two. Forests NSW encourages recreational use of State forests and our road network provides access to significant areas of forest.
Research Forests NSW has been carrying out research for nearly 100 years on subjects as diverse as water quality, fauna habitat requirements, genetics and silviculture (forest management). In this area a research trial has been excluded from harvesting. This trial was established after a wildfire in the 1960’s and through many years of study has been used to underpin mathematical models on how blackbutt forests (or stands of blackbutt) grow and respond to different forms of silviculture. ‘Plus Trees’ have been identified throughout this and other State forests because their superior attributes make them best suited as a source of seed used in establishing plantations.
This harvest plan for Orara East State Forest in North East Region has been separated into layers to explain the range and depth of consideration taken in planning and implementing native forest harvest operations.
The map is a critical element of a harvest plan and it is
complemented with detailed instructions and records of actions taken to ensure the harvest operation is carried out to best meet the range of social, environmental and economic goals that are documented in each region’s Ecological Sustainable Forest Management Plan.
Mapping sustainable forestry

Forest value No. Indicator Results Performance
Mar
ketin
g an
d sa
les
22 Volume of timber harvested
Increase in logs harvested from 2.66 to 2.81 million m3
of logs and in pulp harvested from 1.65 to 1.79 million tonnes. This relates to increases in softwood sales
23 Product mix of timber harvested
No survey undertaken, however the proportions of broad product types sold remains stable
24National Greenhouse Abatement Certificates created
100% (27 467 hectares) of eligible plantation accredited for carbon trading
Ec
oN
oM
Ic
26 Forests NSW Annual Report 2009–10 Social, Environmental and Economic Performance Photo by Howard Spencer
Ensuring an adequate return from the marketing of wood products from the State’s native forest and plantations, while also developing innovative commercial products and services to facilitate private investment in new planted forests.
Performing above expectations
27Forests NSW Annual Report 2009–10 Social, Environmental and Economic Performance
Forests NSW recorded a trading profit of $19.7 million before tax, a strong financial performance during a year affected by the global financial crisis.
Furthermore, the sustained focus by Forests NSW on business improvement strategies over the last 12 months, together with higher than anticipated timber sales, has resulted in Forests NSW generating strong cash flows. Forests NSW was able to generate an operating cash surplus of $38.9 million which was used to pay down $28 million of debt including accrued interest, resulting in a net reduction of $24.5 million in total debt and allowed for the investment of $13.3 million in new fleet and other equipment (See page 29 for more details) as well as the purchase of 7 000 hectares of established plantation areas (See page 28 for more details). Ongoing saving in interest costs as a result of lower debt is around $2.2 million a year.
Specific increases in sales volumes included commencement of supply of an additional 300 000 tonnes of pulp logs for Visy Stage 2 and export of 32 500 tonnes of pine sawlog to China (see page 30 for more details).
A positive result of this strong financial performance was that Forests NSW credit rating was upgraded from BB to BB+ by the credit rating agency Moody’s. This demonstrates Forests NSW fiscal discipline over the last year.
After adjustments for movements in the value of the forest, defined benefit superannuation liabilities and the write-off of a large deferred tax deduction as determined by NSW Treasury, Forests NSW recorded an after tax loss of $232.2 million.
Revenue growth
Major log price reviewForests NSW implemented a structural price increase for native forests and plantation hardwood logs from April 2010. This was the first of six planned successive three per cent structural price increases due six monthly until completed. The price increases better recognise the market value for timber grown in State forests and will provide for a stronger return on timber production.
The price increases were applied after two years of extensive negotiations, which included consultation with industry groups and customers. Implementation of the price increases was delayed for six months to allow for the consultation with customers to be completed.
Carbon tradingThis year Forests NSW sold 235 716 NSW Greenhouse Abatement Certificates (NGACs) registered in the NSW Greenhouse Gas Reduction Scheme. Uncertainties around the introduction of the Australian Government’s Carbon Pollution Reduction Scheme, and subsequent scrapping of the Scheme, saw steady sales of NGACs throughout the year.
On 30 June 2010 Forests NSW registered a further 622 567 Greenhouse Abatement Certificates in the NSW Greenhouse Gas Reduction Scheme. This is the sixth consecutive year of successful registration and brings the total number of certificates the organisation has created to 3 277 469.
Strategies improving performanceForests NSW has continued with implementation of recommendations from benchmarking exercises to improve performance. Some of these include:
Finalised the geographic information systems ■
upgrade with an improved structure to deliver forest planning and information across the business. Upgraded systems are now supported by staff located in two major centres, rather than resources in regions throughout the State
■ Completed a review of the Amenity Nurseries Business and actions implemented to improve performance
Continued development and introduction of a ■
number of online systems both internally such as online purchase orders, and externally with permits and licenses.
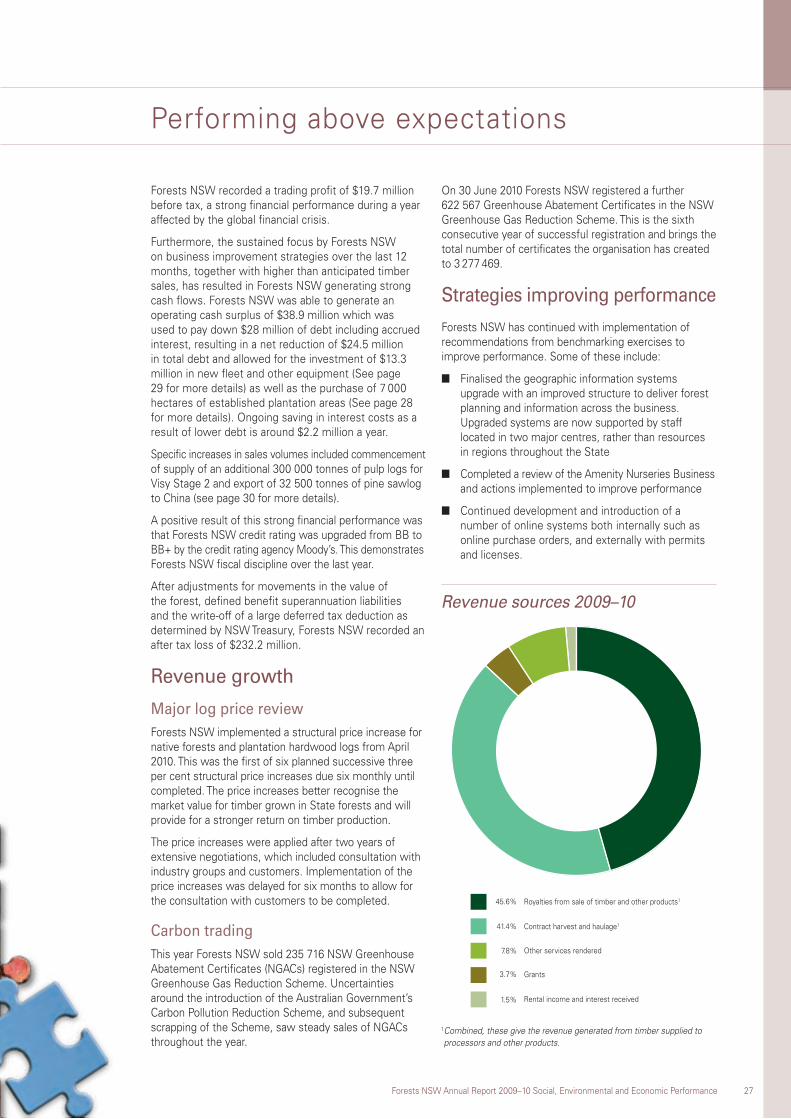
Revenue sources 2009–10
Contract harvest and haulage1
Other services rendered
Grants
Rental income and interest received
Royalties from sale of timber and other products1
41.4%
45.6%
1.5%
3.7%
7.8%
1 Combined, these give the revenue generated from timber supplied to processors and other products.

28 Forests NSW Annual Report 2009–10 Social, Environmental and Economic Performance
Other factors impacting on performance
Managed Investment SchemesDuring 2009–10 Forests NSW continued to provide forest management services to three fund management companies that offer forestry investment products to private investors. Forests NSW established a total of 3 890 hectares for these companies during the reporting period.
Following the appointment of a receiver and manager to one company in April 2010 and another facing financial difficulties as at 30 June 2010 and considering the overall decline in forestry managed investment schemes, Forests NSW will be reviewing its business strategies in this area.
AcquisitionForests NSW purchased 7 000 hectares of plantation forests from TEPCO Forests Australia in March 2010.
The plantation forests purchased are a mix of hardwood and softwood species and are strategically located in three forestry regions.
The age of the forests complements Forests NSW existing planted forest estate, as the timber from the forests will help fill some gaps in future wood supply, and in doing so ensure the continuity of domestic wood supply to the people of NSW.
Managing our growing and harvesting operations
Work has begun on projects involving site-specific silviculture and refining the methodology that determines the best way to cut a tree into logs suitable for various customers. These projects will take a number of years to complete, but it is expected that they will yield savings as they are progressed.
The increased demand for timber brought about by the Visy expansion, as well as the improved timber market, involved the expansion of some current harvesting and transport contractors’ operations and the inclusion of some new contractors into current operations. Forests NSW is looking at better management of forest logistics to ensure we have the right capacity aligned to supply contracts.
Looking aheadThe last two years have been clouded by turbulent conditions, initially by the high interest rates that prevailed in 2008–09, and then by a number of economic factors, including stimulus and low interest rates. Although demand for housing is still strong, lower than anticipated home loan approval rates, indicate continued constraints on lending. Residential construction, including renovations and additions, remains the primary market for Forests NSW customers. This is not expected to change significantly in the year ahead.
1999–001998–99 2000–01 2001–02 2002–03 2003–04 2004–05 2005–06 2006–07 2007–08 2008–09 2009–101
Gig
ajou
les
or C
O2-e
ton
nes
Gig
ajou
les
0
2 000
4 000
6 000
8 000
10 000
12 000
14 000
16 000
18 000
0
20 000
40 000
60 000
80 000
100 000
120 000
140 000
160 000
180 000
Energy and carbon emissions trends
Electricity usage CO2 emissions (tonnes) Total energy (Gigajoules)
1 Note that data for CO2 emission and Total energy include diesel from large trucks and plant that was not reported before. Previously only non-bulk purchase fuel data had been available for reporting.

Fleet upgrade keeping Forests NSW competitive
29Forests NSW Annual Report 2009–10 Social, Environmental and Economic Performance
Managing the State forests of NSW requires a wide range of expertise and resources. Appropriate vehicles and heavy plant are essential resources for day-to-day forest operations. During the year Forests NSW began an extensive upgrade of its heavy and light fleet in order to improve efficiency, productivity and safety.
With over 600 State forests spread throughout the State a reliable vehicle fleet is essential for effective forest management.
During 2009–10 Forests NSW committed over $13 million in new vehicles and plant. This program has seen the replacement of over 120 Ford Rangers in our light vehicle fleet, two large D8T tractors, seven graders and two wheel loaders. As of the end of the financial year there are another five smaller tractors on order, along with nineteen larger trucks in various sizes and configurations.
Investing in new fleet ensures we have the resources to operate effectively and our people are using equipment fit for the purpose and safe for the jobs at hand. It also
helps to ensure fuel usage and ongoing maintenance are kept low – a better outcome for the environment and economic performance.
A large part of forest management is the construction and maintenance of roads for harvesting. Forests NSW maintains approximately 84 000 km of roads and trails to access the forest for harvesting. A large proportion of these roads are also used by the community for local access, recreation and tourism.
Firefighting and asset protection are vital parts of forest management and multi-purpose equipment is pivotal to these operations. In 2009–10 Forests NSW spent over $10.7 million on firefighting and fire prevention. All of the new vehicles we have purchased are multi-purpose; suitable for roadworks or harvesting and can be quickly converted for use in firefighting.
All of Forests NSW fleet are purchased through an open tender process, ensuring the organisation gets the best value for money available.
Photo by Howard Spencer

Opening export market for NSW pine plantation timber
30 Forests NSW Annual Report 2009–10 Social, Environmental and Economic Performance
China has become a new market for pulp logs and sawlogs from Forests NSW Pinus radiata estate and private plantations in the Walcha and Nundle area as part of a contract worth $11.5 million with exporters MTX Australia. The first shipment of 32 500 tonnes of softwood logs left the Port of Newcastle in June.
The two-year contract has also secured more jobs for regional NSW, with the increased demand meaning additional harvesting and haulage crews have been employed with more than 20 full-time positions created in establishing the log export operations.
MTX Australia secured the sale after Forests NSW tendered a parcel of pulp and sawlogs in early 2010.
The new market also means that the harvesting operations produce much less waste, with better utilisation of the full range of products, having a positive effect on the environment and making the re-establishment of plantations after harvesting easier.
Forest productivity
Are
a in
hec
tare
s or
vol
ume
(m3 ) ‘
000
Rev
enue
or
harv
este
d ar
ea in
hec
tare
s (h
a)
2000–01 2001–02 2002–03 2003–04 2004–05 2005–06 2006–07 2007–08 2008–09 2009–10
0
1 000
2 000
3 000
4 000
5 000
6 000
0
20 000
40 000
60 000
80 000
100 000
120 000
140 000
160 000
Revenue from timber royalties
Total volume harvested Forest estate Area actually
harvested
Photo by Howard Spencer

31Forests NSW Annual Report 2009–10 Social, Environmental and Economic PerformancePhoto by Howard Spencer

SU
STA
INA
BIl
ITY Forest
value No. Indicator Results Performance
Prod
uctiv
ity
25 Forest management
1.38 million hectares available for timber production;Over 448 110 hectares in State forest reserves;305 000 hectares of other forest managed for ecological functions
26 Plantation establishment and survival
9 197 hectares of plantations established29% of softwood plantations and 87% of hardwood plantations underwent restocking after 1 year
27 Mean annual growth of planted forest
Mean annual increment for softwood plantations of 16.9 m3/ha/yr and 13.3 m3/ha/yr for hardwood plantations
28 Native forest regeneration
3% of relevant area harvested was surveyed, with 95% of this area successfully regenerated
Mai
ntai
nabi
lity
29 Allowable cut
Actual annual yield of high quality sawlogs as percentage of allowable volume:· 81% from native hardwood forests; · 100% from cypress; · 88% from all softwood plantations
30 Forest certification
Recertification to the Australian Forestry Standard (AS 4708:2007) was successful and certification to ISO 14001:2004 Environmental Management System Standard was maintained
32 Trading profit $23 500 trading profit per employee generated
Managing State forests for the long term and retaining opportunities for future generations to meet their needs and expectations, while providing for the present.
32 Forests NSW Annual Report 2009–10 Social, Environmental and Economic Performance
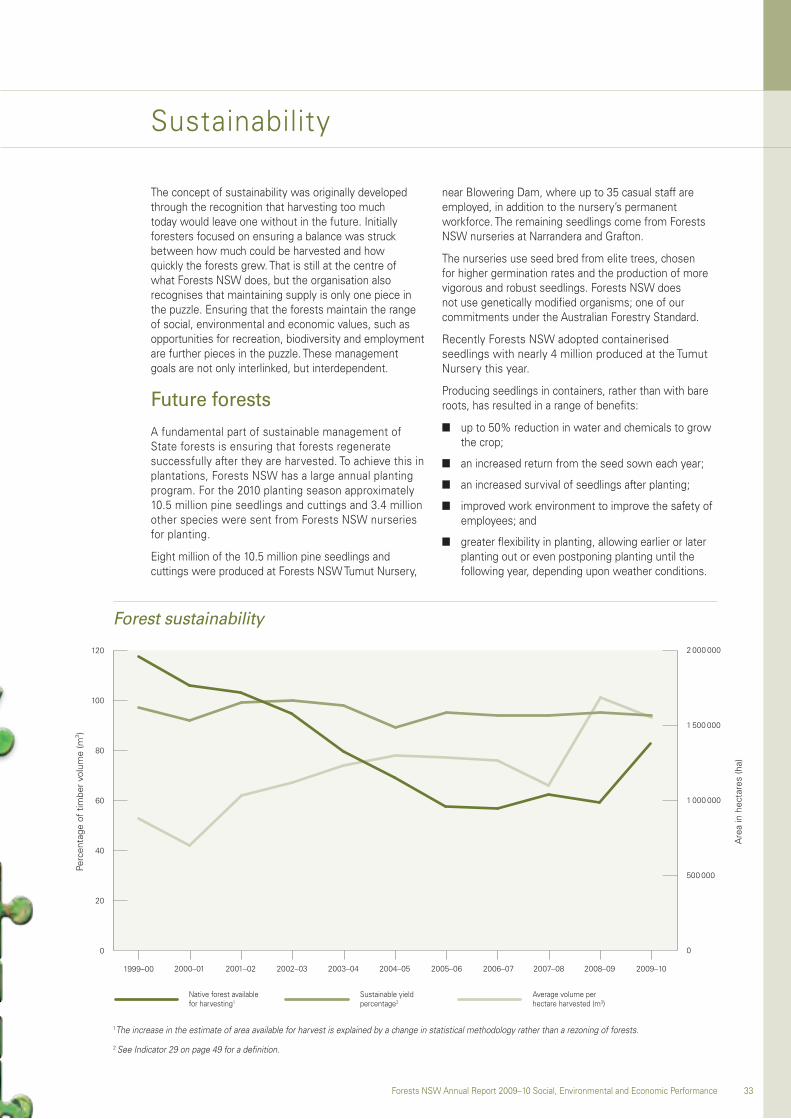
Sustainability
33Forests NSW Annual Report 2009–10 Social, Environmental and Economic Performance
The concept of sustainability was originally developed through the recognition that harvesting too much today would leave one without in the future. Initially foresters focused on ensuring a balance was struck between how much could be harvested and how quickly the forests grew. That is still at the centre of what Forests NSW does, but the organisation also recognises that maintaining supply is only one piece in the puzzle. Ensuring that the forests maintain the range of social, environmental and economic values, such as opportunities for recreation, biodiversity and employment are further pieces in the puzzle. These management goals are not only interlinked, but interdependent.
Future forestsA fundamental part of sustainable management of State forests is ensuring that forests regenerate successfully after they are harvested. To achieve this in plantations, Forests NSW has a large annual planting program. For the 2010 planting season approximately 10.5 million pine seedlings and cuttings and 3.4 million other species were sent from Forests NSW nurseries for planting.
Eight million of the 10.5 million pine seedlings and cuttings were produced at Forests NSW Tumut Nursery,
near Blowering Dam, where up to 35 casual staff are employed, in addition to the nursery’s permanent workforce. The remaining seedlings come from Forests NSW nurseries at Narrandera and Grafton.
The nurseries use seed bred from elite trees, chosen for higher germination rates and the production of more vigorous and robust seedlings. Forests NSW does not use genetically modified organisms; one of our commitments under the Australian Forestry Standard.
Recently Forests NSW adopted containerised seedlings with nearly 4 million produced at the Tumut Nursery this year.
Producing seedlings in containers, rather than with bare roots, has resulted in a range of benefits:
up to 50% reduction in water and chemicals to grow ■
the crop;
an increased return from the seed sown each year; ■
an increased survival of seedlings after planting; ■
improved work environment to improve the safety of ■
employees; and
greater flexibility in planting, allowing earlier or later ■
planting out or even postponing planting until the following year, depending upon weather conditions.
Forest sustainability
1999–00 2000–01 2001–02 2002–03 2003–04 2004–05 2005–06 2006–07 2007–08 2008–09 2009–10
Perc
enta
ge o
f tim
ber
volu
me
(m3 )
Are
a in
hec
tare
s (h
a)
0
20
40
60
80
100
120
0
500 000
1 000 000
1 500 000
2 000 000
Native forest available for harvesting1
Sustainable yield percentage2
Average volume per hectare harvested (m3)
1The increase in the estimate of area available for harvest is explained by a change in statistical methodology rather than a rezoning of forests.
2 See Indicator 29 on page 49 for a definition.

34 Forests NSW Annual Report 2009–10 Social, Environmental and Economic Performance
The bulk of planting this year has been in Forests NSW two main pine growing regions in the South West Slopes and the Central West; Hume and Macquarie regions.
The expansion of Blowering Nursery’s current holding capacity by installing a rolling bench will be completed in late 2010 at a cost of $1.5 million. This will expand the nursery’s capacity from 4 million containerised seedlings per annum to 8 million per annum.
Fire managementFire is both a constructive and destructive element in the management of forests. It is used by Forests NSW to avoid build-up of fuel material in the forests, to encourage a diversity of stand structure and encourage regeneration in native forests. However wildfires can cause significant damage, particularly in plantations, where so much value has been invested in establishing the trees.
Fire management in the 2009–10 year began with a dry winter and strong winds. Hazard reduction in July 2009 was limited by the difficulties of restricting the spread of fire and was abandoned early; by August large areas of the State were affected by wildfire. This was an early start to the fire season, but the temperatures remained mild and damage
to the forests was contained to 1.6 per cent of the forest estate. Numerous fires continued all spring and by December hotter conditions raised concern about the ability of ongoing resourcing to control the fires. Fortunately widespread rains occurred in late December with follow-up rains in January and February that greatly reduced the number and severity of wildfires. The autumn months provided suitable conditions for hazard reduction and much of the backlog of planned burns was achieved.
Total area of the forests affected by fire was 35 069 hectares of prescribed burning and 37 610 hectares of wildfire. The corporate target of restricting damaging wildfire to less than 0.3 per cent was achieved, as damage to planted forests was limited. There were some 15 fires over 690 hectares of plantation areas, half of which were not damaging due to age-class or severity.
Forestry staff were also involved in multiagency fires off State forest tenure, with many hundreds of thousands of hectares of wildfires across the landscape. There were no major significant damaging wildfires on State forests, but of the 201 fires occurring on State forest, 71 were declared as Section 44 emergencies under the NSW Rural Fires Act 1997.
Photo © Forests NSW Image Library
Perc
enta
ge o
f ar
ea
0
1
2
3
4
5
6
7
0
1
2
3
4
5
6
7
1992–93 1993–94 1994–95 1995–96 1996–97 1997–98 1998–99 1999–00 2000–01 2001–02 2002–03 2003–04 2004–05 2005–06 2006–07 2007–08 2008–09 2009–10
Wildfires and prescribed burns trend as percentage of Forests NSW estate
Wildfire as percentage (%) of total area
Linear [Wildfire as percentage (%) of total area]
Prescribed burning as percentage (%) of total area
Linear [Prescribed burning as percentage (%) of total area]

35Forests NSW Annual Report 2009–10 Social, Environmental and Economic Performance
Future supplyAs seen in indicator 29 on page 49 Forests NSW harvested a little less timber than in its agreements with the timber processing industry. At the same time Forests NSW is working to ensure that future timber demand can be met. As part of this, Forests NSW is developing mid-to long-term plans to handle the reduction in supply envisaged by the Regional Forest Agreements, after the current Wood Supply Agreements end in 2023.
These plans rely on modelling undertaken by Forests NSW. During the year this modelling underwent further refinement of its standing timber and yield estimates and wood flow projections. These system refinements improve yield estimates at the regional level for the coastal regions.
In April 2009 the Auditor General completed a Performance Audit Report on Forests NSW entitled Sustaining Native Forest Operations. The audit found that Forests NSW had sufficient supply of timber to meet hardwood supply demands and the report provided a number of recommendations mainly relating to refinements of the estimates and woodflow projections, which Forests NSW has been implementing within an agreed timeframe.
Research and technologyDuring the year Forests NSW joined the national Forestry Cooperative Research Centre forest operations program. Full membership of the CRC has given Forests NSW access to operational research and training in forest harvesting and haulage. Forests NSW has already conducted one trial in forest residues with the Forestry Cooperative Research Centre and planned for another in value recovery. The Forestry Cooperative Research Centre has provided assistance in fleet scheduling software and training in forest operations.
A major investigation into the application of GPS in harvesting with reliance on LiDAR data commenced in Central Region. LiDAR is an optical remote sensing technology using scattered light to collect data, which can be used to determine attributes such as tree species, tree dimensions and the location of streams and roads.
In another project Forests NSW completed a review of the tree and plantation improvement service delivery across the organisation.
For more information on research undertaken by Forests NSW see the I&I NSW Science & Research and Forests NSW Research & Development Annual Report 2009–10.
Photo by Howard Spencer

36 Forests NSW Annual Report 2009–10 Social, Environmental and Economic Performance
Sustainability indicators
Social indicators
Indicator 1 - Social responsibilityObjective: Maintain voluntary activities in non-operational business areas 2006–07 2007–08 2008–09 2009–10Subscriptions, sponsorships and donations $579 846 $728 505 $662 836 $518 672
Community volunteering programs 2006–07 2007–08 2008–09 2009–10Days 493 424 372 464Participants 138 252 175 101Programs 9 10 9 5
Indicator 2 (a) - Public participationObjective: Increase opportunities for stakeholder participation in planning. Actively engage and involve our neighbours in management of the community’s forests
Meeting/Forum subject categories Hours of staff time associated with engagements initiated by others
Hours of staff time associated with engagements initiated by Forests NSW
Business & joint venture partner 67 25Catchment management 1 122 421Bushfire/HRB management 171 26Cultural heritage management 382 154Education 299 40Employment conditions & terms 504 155ESFM planning (Strategic & supplementary plans) 11 11External audit 178 132Flora & fauna management/Conservation/Environmental 299 90Forestry/Forest practices 133 110Local emergency management 719 262Local government 156 35Occupational Health & Safety 77 3Pest animal/Weed/Disease management 10 150Plantation establishment 382 897Recreation/Tourism 302 286Regional planning/Regional Forest Agreement 58 39Research 58 234Supply management (incl. haulage & processes) 35 65Timber harvesting/Road construction/Maintenance 307 2Other 72 311
Note that the figures provided are estimates sourced from each of the eight operational regions and Community Programs at Cumberland State Forest. Stakeholder participation by Branch and Corporate staff has not been included. This indicator has been revised to record hours instead of number of meetings or forums to better indicate performance. This makes comparison with previous years data, which reported numbers, impossible, however anecdotal evidence suggests stakeholder engagement increased.
Indicator 2 (b) - Public participationObjective: Be responsive to neighbours’ and stakeholder concerns and professionally conciliate any issuesCommunity liaison 2006–07 2007–08 2008–09 2009–10Ministerial correspondence handled1 99 129 383 761Registered complaints 25 16 8 17Official complaints n/r n/r n/r 2
1It takes about 3 hours to prepare a written response to a public correspondence through the Minister’s office.
Registered complaints relating to legislation, codes, licences, standards or operational plans are registered in the Forests NSW Non-Conformance and Improvement Reporting system. In addition to complaints the system registers and tracks actions relating to significant legislative breaches and improvement suggestions.
The process for responding to letters of inquiry or complaints addressed to the Chief Executive Officer or the Minister for Primary Industries are recorded in a separate system.
Official complaints are handled through the Industry & Investment NSW Complaint Handling Procedure, which provides a structured mechanism to allow complaints and concerns about Industry & Investment NSW and Forests NSW service delivery to be notified, tracked and managed in a professional manner.

37Forests NSW Annual Report 2009–10 Social, Environmental and Economic Performance
Sustainability indicators
Indicator 3 - Recreation and tourismObjective: Maintain opportunities for events and partnershipsPermits for organised recreational activities 1998–99 2007–08 2008–09 2009–10Bow hunting/archery 60 2 3 2Bushwalking 23 6 5 8Car rallies/go carts 38 36 24 30Eco tourism/4WD tours 54 5 21 7Education/outdoor education schools 27 46 27 11Fossicking n/r 22 116 152Horse, trail & endurance rides 32 25 24 24Motorbike rallies 6 18 8 10Mountain bike rallies 30 46 51 38Orienteering/mountain runs/triathlon 37 29 22 26Other 22 288 181 126Training/exercises 152 17 35 34Area zoned primarily for recreation (ha) n/d 4 749 6 164 6 090Expenditure on recreation (‘000) n/r $2 092 $2 437 $2 547
Note that more information on recreation in NSW State forests is available at www.industry.nsw.gov.au
Objective: Provide safe, professional and efficient forest-based recreation and tourism services for the people of NSWFacilities provided at 177 recreational sites 2009–10Camping area 93Caravan site 16Fireplace/BBQ 84Picnic area 103Rubbish collection 48Toilets 62Water (not for drinking) 87Wheelchair accessible toilets 11
Indicator 4 (a) - Research and educationObjective: Cost-effective research services from I&I NSW and within Forests NSW Research1(million) Education (million)1998–99 $7.2 n/d2005–06 $6.9 $4.22006–07 $7.0 $4.22007–08 $5.2 $2.92008–09 $6.0 $2.62009–10 $5.4 $2.5
1Includes expenditure on community service obligations, water quality monitoring and tree improvement program, but excludes pre-harvest flora and fauna surveys for the last three years. Expenditure of pre-harvest surveys is reported as part of Indicator 13 - Sighting of surveyed species.
The I&I NSW Science & Research and Forests NSW Research & Development Annual Report 2009–10 documents significant projects during the year and can be obtained on the I&I NSW website.
Indicator 4 (b) - Number of people participating in programs and receiving information through Cumberland State ForestObjective: Provide a strategic education programActivity 1998–99 2007–08 2008–09 2009–10School – lower primary 1 197 685 512 539School – upper primary 1 585 2 757 3 168 3 016School – secondary 753 437 376 352School holiday activities 1 008 292 438 404

38 Forests NSW Annual Report 2009–10 Social, Environmental and Economic Performance
Sustainability indicators
Indicator 5 - Regional employmentObjective: Provide opportunities for employment in forest-dependent industriesState forests-dependent sector 1997–98 2008–09 2009–10
Apiary 302 354 No significant change reported, except in Western Region where decreases were reported
Eco-tourism 88 39 No significant change reported, except in Western Region where decreases were reported
Forest management 1 566 888 Decrease of 49 full time equivalent jobs across Forests NSWGrazing 165 489 Only Northern Region reported an increase due to additional areas tenderedHarvesting & haulage 1 132 1 131 Increase in Northern Region due to MTX pine exports. Decrease in Western Region
Other1 136 54 No significant change reported, except in Western Region where decreases were reported
Primary processing2 4 328 4 325Decrease in Western Region. Increases in planted forests due to increased wood flow commitments, especially in Walcha-Nundle area and the opening of an additional production line at the Visy pulp mill in Tumut resulting in 50 additional jobs
Total 7 717 7 280 1Includes plantation establishment contractors, gravel extraction and other forest product removal.2Processing undertaken at a site where the input is raw material supplied by Forests NSW.
The reported figures and trends are based on licences, contracts, volumes of timber harvested and local knowledge. The 2006 Census provides another indicator of forestry sector employment.
Western Region reported a drop in employment in all sectors. This is associated with the transfer of tenure reported on page 20.
NSW forestry employment1 Individuals
Distribution 1 446Forest management & harvesting 5 124Primary processing 5 343Support 831Total 12 744
1Derived from 2006 Census data.
Indicator 6 (a) - Other forest productsObjective: Access maintained to State forests for apiary, grazing and other products appropriate to forestsForest product 1997–98 2006–07 2007–08 2008–09 2009–10Advanced plants sold to public (No.) 5 491 6 505 80 355 168 422 65 980Apiculture (sites) 3 843 3 363 1 310 2 583 3 804Bark (tonnes) 1 109 0 0 17 52Broombush (tonnes) 1 977 4 255 4 225 3 338 3 198Burls (tonnes) 44 1 0 1 1Charcoal (tonnes) 119 1 465 1 417 1 188 1 731Communication sites (permits) 126 135 120 159 171Craft timber (m3) 33 35 12 7 7Film/documentary (permits) 3 4 5 6 8Firewood (tonnes)1 75 615 42 613 88 271 50 902 27 691Forest maps sold to the public2 5 491 6 505 7 489 6 038 5 887Gravel/sand/rock (tonnes) 69 495 88 147 94 665 60 802 51 723Grazing (hectares) 768 946 688 525 645 040 608 193 529 712Misc native plants pieces (No.) 1 219 3 544 454 2 060 1 991Nursery seedlings to public (No.)3 1 148 000 1 647 400 1 178 402 658 131 762 870Other structures (permits) 227 153 188 175 137Powerlines/cables/pipelines (km) 2 886 5 006 4 876 n/r n/rResearch (permits) 215 69 51 81 135Seed (kg) 969 51 102 167 93Wood blocks (No.) 0 3 750 50 79 500Total revenue (‘000) n/r $6 461 $6 315 $6 235 $5 802
1 Additional firewood sales are reported as part of commercial timber sales in Indicator 22.2Includes maps sold via www.shop.nsw.gov.au3Does not include plantation stock sold to external plantation owners.
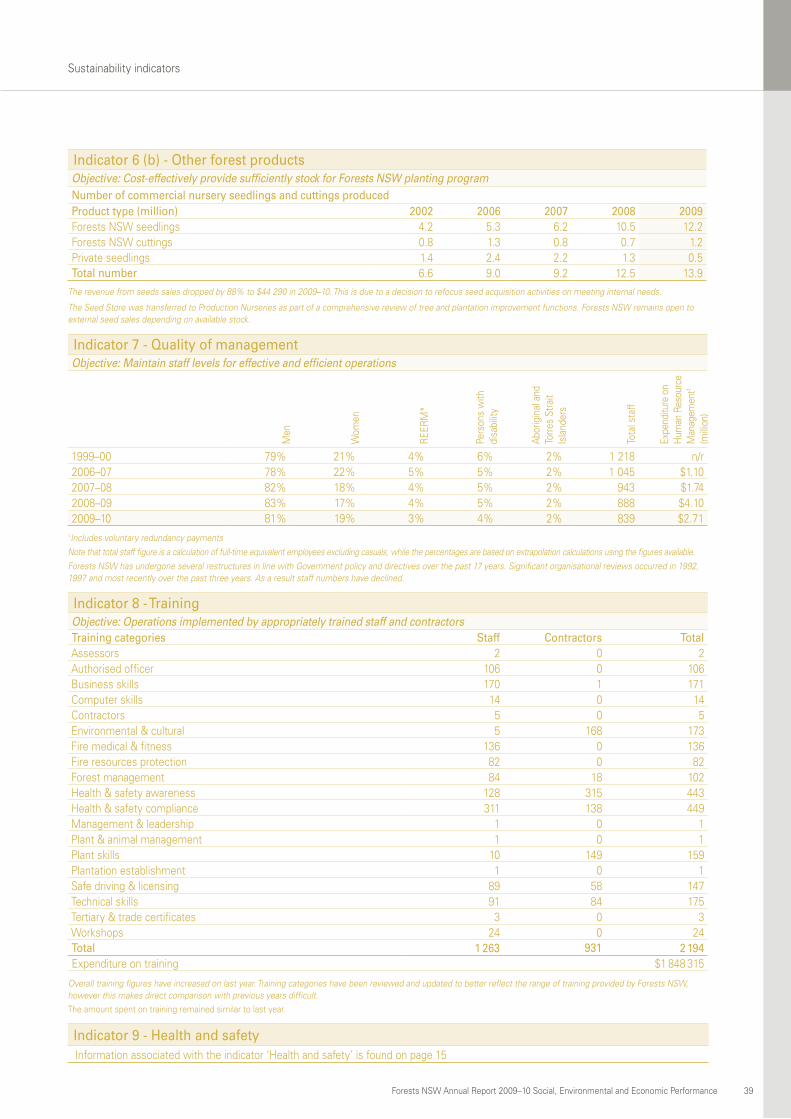
39Forests NSW Annual Report 2009–10 Social, Environmental and Economic Performance
Sustainability indicators
Indicator 6 (b) - Other forest productsObjective: Cost-effectively provide sufficiently stock for Forests NSW planting programNumber of commercial nursery seedlings and cuttings producedProduct type (million) 2002 2006 2007 2008 2009Forests NSW seedlings 4.2 5.3 6.2 10.5 12.2Forests NSW cuttings 0.8 1.3 0.8 0.7 1.2Private seedlings 1.4 2.4 2.2 1.3 0.5Total number 6.6 9.0 9.2 12.5 13.9
The revenue from seeds sales dropped by 88% to $44 290 in 2009–10. This is due to a decision to refocus seed acquisition activities on meeting internal needs.
The Seed Store was transferred to Production Nurseries as part of a comprehensive review of tree and plantation improvement functions. Forests NSW remains open to external seed sales depending on available stock.
Indicator 7 - Quality of managementObjective: Maintain staff levels for effective and efficient operations
Men
Wom
en
REER
M*
Pers
ons
with
di
sabi
lity
Abor
igin
al a
nd
Torre
s St
rait
Isla
nder
s
Tota
l sta
ff
Expe
nditu
re o
n H
uman
Res
ourc
e M
anag
emen
t1 (m
illion
)
1999–00 79% 21% 4% 6% 2% 1 218 n/r2006–07 78% 22% 5% 5% 2% 1 045 $1.102007–08 82% 18% 4% 5% 2% 943 $1.742008–09 83% 17% 4% 5% 2% 888 $4.102009–10 81% 19% 3% 4% 2% 839 $2.71
1Includes voluntary redundancy payments
Note that total staff figure is a calculation of full-time equivalent employees excluding casuals, while the percentages are based on extrapolation calculations using the figures available.
Forests NSW has undergone several restructures in line with Government policy and directives over the past 17 years. Significant organisational reviews occurred in 1992, 1997 and most recently over the past three years. As a result staff numbers have declined.
Indicator 8 - TrainingObjective: Operations implemented by appropriately trained staff and contractorsTraining categories Staff Contractors TotalAssessors 2 0 2Authorised officer 106 0 106Business skills 170 1 171Computer skills 14 0 14Contractors 5 0 5Environmental & cultural 5 168 173Fire medical & fitness 136 0 136Fire resources protection 82 0 82Forest management 84 18 102Health & safety awareness 128 315 443Health & safety compliance 311 138 449Management & leadership 1 0 1Plant & animal management 1 0 1Plant skills 10 149 159Plantation establishment 1 0 1Safe driving & licensing 89 58 147Technical skills 91 84 175Tertiary & trade certificates 3 0 3Workshops 24 0 24Total 1 263 931 2 194Expenditure on training $1 848 315
Overall training figures have increased on last year. Training categories have been reviewed and updated to better reflect the range of training provided by Forests NSW, however this makes direct comparison with previous years difficult.The amount spent on training remained similar to last year.
Indicator 9 - Health and safetyInformation associated with the indicator ‘Health and safety’ is found on page 15
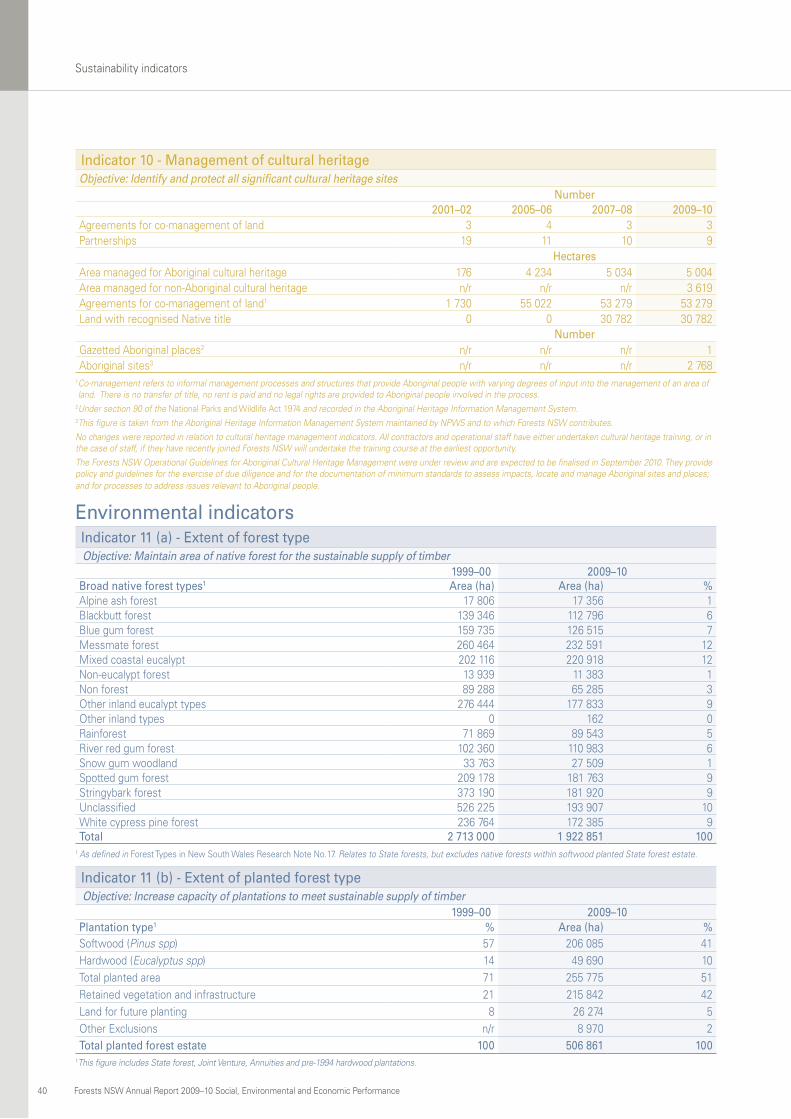
40 Forests NSW Annual Report 2009–10 Social, Environmental and Economic Performance
Sustainability indicators
Indicator 10 - Management of cultural heritageObjective: Identify and protect all significant cultural heritage sites
Number 2001–02 2005–06 2007–08 2009–10Agreements for co-management of land 3 4 3 3Partnerships 19 11 10 9
HectaresArea managed for Aboriginal cultural heritage 176 4 234 5 034 5 004Area managed for non-Aboriginal cultural heritage n/r n/r n/r 3 619Agreements for co-management of land1 1 730 55 022 53 279 53 279Land with recognised Native title 0 0 30 782 30 782 NumberGazetted Aboriginal places2 n/r n/r n/r 1Aboriginal sites3 n/r n/r n/r 2 768
1 Co-management refers to informal management processes and structures that provide Aboriginal people with varying degrees of input into the management of an area of land. There is no transfer of title, no rent is paid and no legal rights are provided to Aboriginal people involved in the process.
2Under section 90 of the National Parks and Wildlife Act 1974 and recorded in the Aboriginal Heritage Information Management System.3This figure is taken from the Aboriginal Heritage Information Management System maintained by NPWS and to which Forests NSW contributes.
No changes were reported in relation to cultural heritage management indicators. All contractors and operational staff have either undertaken cultural heritage training, or in the case of staff, if they have recently joined Forests NSW will undertake the training course at the earliest opportunity.
The Forests NSW Operational Guidelines for Aboriginal Cultural Heritage Management were under review and are expected to be finalised in September 2010. They provide policy and guidelines for the exercise of due diligence and for the documentation of minimum standards to assess impacts, locate and manage Aboriginal sites and places; and for processes to address issues relevant to Aboriginal people.
Environmental indicatorsIndicator 11 (a) - Extent of forest typeObjective: Maintain area of native forest for the sustainable supply of timber 1999–00 2009–10
Broad native forest types1 Area (ha) Area (ha) %Alpine ash forest 17 806 17 356 1Blackbutt forest 139 346 112 796 6Blue gum forest 159 735 126 515 7Messmate forest 260 464 232 591 12Mixed coastal eucalypt 202 116 220 918 12Non-eucalypt forest 13 939 11 383 1Non forest 89 288 65 285 3Other inland eucalypt types 276 444 177 833 9Other inland types 0 162 0Rainforest 71 869 89 543 5River red gum forest 102 360 110 983 6Snow gum woodland 33 763 27 509 1Spotted gum forest 209 178 181 763 9Stringybark forest 373 190 181 920 9Unclassified 526 225 193 907 10White cypress pine forest 236 764 172 385 9Total 2 713 000 1 922 851 100
1 As defined in Forest Types in New South Wales Research Note No.17. Relates to State forests, but excludes native forests within softwood planted State forest estate.
Indicator 11 (b) - Extent of planted forest typeObjective: Increase capacity of plantations to meet sustainable supply of timber
1999–00 2009–10Plantation type1 % Area (ha) %Softwood (Pinus spp) 57 206 085 41Hardwood (Eucalyptus spp) 14 49 690 10Total planted area 71 255 775 51Retained vegetation and infrastructure 21 215 842 42Land for future planting 8 26 274 5Other Exclusions n/r 8 970 2Total planted forest estate 100 506 861 100
1This figure includes State forest, Joint Venture, Annuities and pre-1994 hardwood plantations.

41Forests NSW Annual Report 2009–10 Social, Environmental and Economic Performance
Sustainability indicators
Indicator 13 (a) - Sightings of surveyed speciesObjective: Threatened species at risk from forestry operations identified and adaptive management appliedThreatened fauna species sightings 1997-97 2007–08 2008–09 2009–10Arboreal mammals 268 989 601 361Bats 93 183 1 065 168Frogs 204 324 175 217Ground mammals 195 22 117 186Non-raptor birds 110 402 1 058 1 049Raptor birds 86 133 85 12Reptiles n/r 0 4 4Total 956 2 053 3 105 1 997Threatened flora species reported n/r 8 6 18Threatened fauna species reported n/r n/r n/r 50Number of fauna surveys n/r 2 754 1 591 1884Number of compartment traverses n/r n/r 431 538Fauna sightings per survey n/r 0.75 1.95 1.06Expenditure on surveys (‘000) n/r $621 $1 764 $2 038
In the past 16 years Forests NSW has collected 14% of NSW total threatened species records.
Indicator 13 (b) - Status of surveyed species sightings
Kingdom Species groupStatus
Introduced Protected Vulnerable Endangered
Fauna
Arboreal mammals 0 1 232 361 0Bats 0 918 168 0Frogs 30 1 584 59 158Ground mammals 29 1 415 120 66Non-raptor birds 0 7 644 1 049 0Raptor birds 0 8 12 0Reptiles 0 103 4 0
Flora 539 2 104 2 324 8 033
Note that vulnerable and endangered are refered to as threatened species under the Threatened Species Conservation Act 1995 and are summarised in the above table along with previous years. If these threatened species are sighted, the presence of these species is taken into account and adaptive management applied (see the illustration on pages 24 and 25). Protected refers to all Australian flora and fauna, that are not threatened species. Introduced species are those such as cats, goats, dogs, deer etc.
Indicator 14 - Pest animal and weed controlObjective: Manage weeds and animal pests though active coordinated and cooperative programsYear 1997–98 2007–08 2008–09 2009–10Weeds $1 325 000 $596 874 $898 940 $1 125 258Pest animals $328 000 $546 194 $584 800 $591 459Total $1 653 000 $1 143 068 $1 483 740 $1 716 718
Weed and pest animal management plans are in place for all operational regions and provide a range of details including targeted species, methods employed and estimated costs. Forests NSW continues to be a major contributor to a range of control programs including those targeting foxes, wild dogs, feral goats, feral pigs, blackberries, willow, serrated tussock, horehound, lantana and paterson’s curse.
Number removed by licensed hunters from State forests 2007–08 2008–09 2009–10Feral cats 136 172 219Feral goats 1 037 1 899 2 130Feral pigs 1 081 1 478 1 924Foxes 724 1 072 1 256Hares 242 489 630Rabbits 4 076 5 453 8 335Wild deer 410 562 654Wild dogs 55 72 84
Game Council NSW is the statutory body responsible for implementing the objectives of the Game and Feral Animal Control Act 2002. Game Council NSW provides a licensing system that enables game hunting licence holders to remove game and feral animals from declared State forests in New South Wales.
Removing game and feral animals from public land areas helps to contain existing game animal populations and exert downward pressure on feral animal populations in these locations.

42 Forests NSW Annual Report 2009–10 Social, Environmental and Economic Performance
Indicator 15 - Plantation healthObjective: Monitor and address plantation health issues: minimise impact of health issues on plantations
Hardwood plantation1 Percentage of area sampled2001–02 2007–08 2008–09 2009–10
AgentBell Miner Associated Dieback (BMAD) n/d n/d 0.0 0.0Creiis and Cardiaspina psyllids n/d 3.0 0.7 0.5Frost damage n/d 0.2 0.0 0.0Herbivorous insects 5.8 3.0 1.8 1.0Leaf & shoot fungi 2.4 2.0 0.0 0.0Stem borers 0.1 5.0 11.0 11.0
1 Post-1994 hardwood plantations only. These are hardwood plantation established prior to the commencement of the State Forests Eucalypt Plantation Program in 1994. These plantation are exclusively managed under the Plantations and Reafforestation Act 1999.
Softwood plantationPercentage of area sampled
2000–01 2007–08 2008–09 2009–10AgentDothistroma septosporum (needle blight) 2.0 1.0 1.0 0.8Drought (Diplodia pinea (fungus) & Ips grandicollis (bark beetle)) 0.5 15.0 4.0 4.0Essigella californica (aphid) n/d 47.0 32.0 21.3Possum 0.2 6.0 6.0 0.9Sirex noctilio (woodwasp) 0.0 1.5 0.8 0.1
Overall the impact of health issues has either remained static or decreased in comparison to the previous year. The exception is an increase in the effect of drought in Hume Region, however the state wide impact remains the same.
Indicator 16 - Firefighting and preventionObjective: Managed through integrated and cooperative fire hazard management and wildfire suppression programs, resulting in less than 0.3% of forest estate burnt by damaging wildfireWildfire 2001–02 2007–08 2008–09 2009–10Per cent of total State forest estate 3.50% 0.30% 0.06% 1.60%Expenditure (million) $2.7 $1.8 $1.0 $2.4
Fuel management 2001–02 2007–08 2008–09 2009–10
Hazard reduction (ha)1 58 893 32 474 24 988 35 069Grazing (ha) 644 966 528 933 498 718 529 712Expenditure (million) $6.1 $9.8 $9.6 $8.3
1Includes pre- and post-harvest burning.
Total area of the forests affected by fire was 35 069 ha of prescribed burning and 37 610 ha of wildfire. The Corporate target of restricting damaging wildfire to less than 0.3% was achieved, as damage to planted forests was limited. There were some 15 fires over 690 ha of plantation areas, half of which were not damaging due to age-class or severity.
Forestry staff also were involved in multiagency fires off State forest tenure, with many hundreds of thousands of hectares of wildfires across the landscape. There were no major significant damaging wildfires on State forests, but of the 201 fires occurring on State forest 71 were declared as Section 44 emergencies under the NSW Rural Fires Act 1997.
There were no major injuries, but one noteworthy near-miss incident when the Forests NSW helicopter was struck by another firefighting helicopter in mid-air while water bombing, only receiving damage to the rear tail stabiliser.
Indicator 17 (a) - Soil and water managementObjective: Maintain ecological processes associated with soil and water. Assess all areas to be harvested for risks to soil and water quality 1999–00 2006–07 2007–08 2008–09 2009–10Expenditure on harvesting supervision and environmental compliance in native forests (‘000) n/r $6 219 $5 164 $5 561 $5 454
Expenditure on harvest planning & pre-harvest surveys (‘000) n/r n/r n/r $3 997 $4 755Area of native forest harvest operations (ha) 56 900 45 945 57 631 31 252 38 784Area of softwood plantation harvest & thinning operations (ha) 14 000 12 754 14 659 13 342 13 491Area of hardwood plantation harvest & thinning operations1 (ha) 0 10 127 252 0Total Area harvested2 (ha) 73 000 53 364 64 261 38 305 46 819Percentage harvested of total estate 2.4% 2.4% 2.7% 1.6% 2.0%Soil and water non-compliance incidents self-reported 1 255 395 318 28 143Fines received in relation to soil and water 3 2 2 0 0
1Relates to post-1994 plantations only.2Excludes thinning operations in plantations.
Sustainability indicators
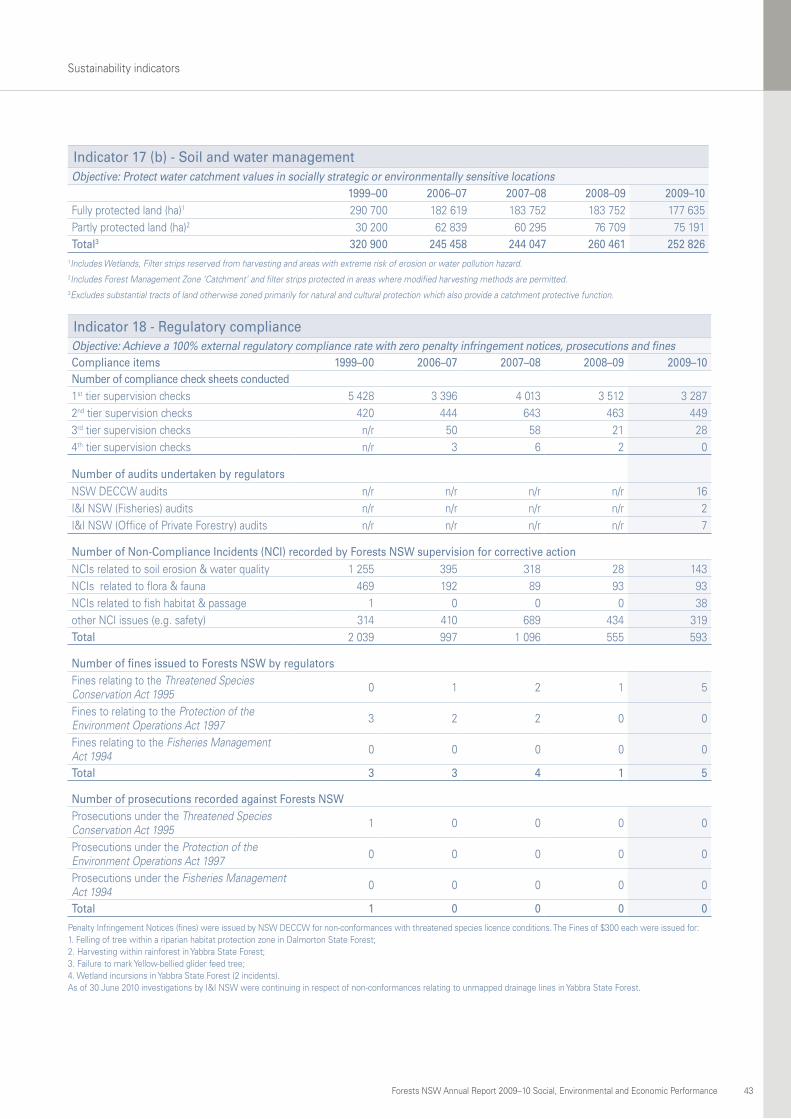
43Forests NSW Annual Report 2009–10 Social, Environmental and Economic Performance
Sustainability indicators
Indicator 17 (b) - Soil and water managementObjective: Protect water catchment values in socially strategic or environmentally sensitive locations 1999–00 2006–07 2007–08 2008–09 2009–10Fully protected land (ha)1 290 700 182 619 183 752 183 752 177 635Partly protected land (ha)2 30 200 62 839 60 295 76 709 75 191Total3 320 900 245 458 244 047 260 461 252 826
1Includes Wetlands, Filter strips reserved from harvesting and areas with extreme risk of erosion or water pollution hazard.2Includes Forest Management Zone ‘Catchment’ and filter strips protected in areas where modified harvesting methods are permitted.3Excludes substantial tracts of land otherwise zoned primarily for natural and cultural protection which also provide a catchment protective function.
Indicator 18 - Regulatory complianceObjective: Achieve a 100% external regulatory compliance rate with zero penalty infringement notices, prosecutions and finesCompliance items 1999–00 2006–07 2007–08 2008–09 2009–10Number of compliance check sheets conducted 1st tier supervision checks 5 428 3 396 4 013 3 512 3 2872nd tier supervision checks 420 444 643 463 4493rd tier supervision checks n/r 50 58 21 284th tier supervision checks n/r 3 6 2 0
Number of audits undertaken by regulators NSW DECCW audits n/r n/r n/r n/r 16I&I NSW (Fisheries) audits n/r n/r n/r n/r 2I&I NSW (Office of Private Forestry) audits n/r n/r n/r n/r 7
Number of Non-Compliance Incidents (NCI) recorded by Forests NSW supervision for corrective action NCIs related to soil erosion & water quality 1 255 395 318 28 143NCIs related to flora & fauna 469 192 89 93 93NCIs related to fish habitat & passage 1 0 0 0 38other NCI issues (e.g. safety) 314 410 689 434 319Total 2 039 997 1 096 555 593
Number of fines issued to Forests NSW by regulatorsFines relating to the Threatened Species Conservation Act 1995 0 1 2 1 5
Fines to relating to the Protection of the Environment Operations Act 1997 3 2 2 0 0
Fines relating to the Fisheries Management Act 1994 0 0 0 0 0
Total 3 3 4 1 5
Number of prosecutions recorded against Forests NSW Prosecutions under the Threatened Species Conservation Act 1995 1 0 0 0 0
Prosecutions under the Protection of the Environment Operations Act 1997 0 0 0 0 0
Prosecutions under the Fisheries Management Act 1994 0 0 0 0 0
Total 1 0 0 0 0
Penalty Infringement Notices (fines) were issued by NSW DECCW for non-conformances with threatened species licence conditions. The Fines of $300 each were issued for: 1. Felling of tree within a riparian habitat protection zone in Dalmorton State Forest; 2. Harvesting within rainforest in Yabbra State Forest; 3. Failure to mark Yellow-bellied glider feed tree; 4. Wetland incursions in Yabbra State Forest (2 incidents). As of 30 June 2010 investigations by I&I NSW were continuing in respect of non-conformances relating to unmapped drainage lines in Yabbra State Forest.

44 Forests NSW Annual Report 2009–10 Social, Environmental and Economic Performance
Sustainability indicators
Indicator 19 - Carbon sequestration in planted forestsObjective: Maintain a positive contribution to Australia’s net emission reduction program for carbon dioxidePlanted forest type 2002–03 2007–08 2008–09 2009–10Softwood (CO2-e megatonnes sequestered) 3.65 3.41 3.56 3.73Hardwood (CO2-e megatonnes sequestered) 0.59 0.62 0.56 0.55
CO2 sequestered (tonnes CO2-e) = net plantation area x MTBI x CP x CCF where:MTBI = SBI + CBI + RBI where:SBI (Stem Biomass Increment) = TSVI x BD where: TSVI (Total Stem Volume Increment) - softwood = 16.9m3/ha/year and hardwood = 13.3m3/ha/yr BD (Basic Density) - softwood = 0.42 t/m3 and hardwood = 0.55t/m3
CBI (Canopy Biomass Increment) = SBI x 0.1765RBI (Root Biomass Increment) = (SBI + CBI) x 0.2CP (Carbon Proportion) = 0.5CCDF (Carbon to Carbon dioxide Factor) = 3.667Net plantation area = Net Stocked Area in State forest and Joint Venture plantations (refer Indicator 27)
Indicator 19 (b) - Carbon balance in native forestsObjective: Maintain a positive contribution to Australia’s net emission reduction program for carbon dioxideNative forest carbon balanceMeasured in millions of tonnes (megatonnes) 2007–08 2008–09 2009–10Total standing volume CO2 911 920 949Annual CO2-e sequestered forest growth 6.53 6.35 6.80Annual CO2-e harvest storage in hardwood products 0.54 0.53 0.47Annual CO2-e harvest emissions 1.37 1.26 1.30Annual CO2-e fire emissions 0.98 0.51 3.43Annual non CO2 fire emissions1 0.05 0.02 0.16
Annual Sequestration (megatonnes) 2007–08 2008–09 2009–10
Net CO2-e 3.63 4.06 1.601These figures have been corrected as they were incorrectly reported as tonnes previously.
The assumptions used in this model are largely based on National Greenhouse Accounts (NGA) Factors and are the best available to date. The model reports the amount of carbon stored in State forests, forest products derived from State forests and emissions associated with harvesting and fire.
Note the large amount of emissions associated with fire in 2006–07. This acknowledges the sensitivity of forest carbon balances to fire. Net carbon emissions from bushfires are reduced through undertaking prescribed burns at intervals, as these burn less intensively.
Assumptions:Model ACO2 sequestered (tonnes CO2-e) = production area x MTBI x CP x CCF where:MTBI = SBI + CBI + RBI where:SBI (Stem Biomass Increment) = TSVI x BD where: TSVI (Total Stem Volume Increment) native forest ave = 5m3/ha/yr BD (Basic Density) = 0.325t/m3 (source AGO 2006)CBI (Canopy Biomass Increment) = SBI x 0.1765RBI (Root Biomass Increment) = (SBI + CBI) x 0.2CP (Carbon Proportion) = 0.5CCF (Carbon to Carbon dioxide factor) = 3.667
Model B Is based on Weighted Average Growth rates in the AGO methodology 2006 (refer table A1) for the estimation of GHG emissions and sinks for the broad
forest types within State forest.Note that both methods were applied and the mean figure used. No adjustment for age-class made.

45Forests NSW Annual Report 2009–10 Social, Environmental and Economic Performance
Sustainability indicators
Indicator 20 (a) - Energy consumptionObjective: Reduce greenhouse gas emissions and increase energy sourced from green power 2009–10 Percentage
change to 2008–091
Energy Use Totals Total Energy GJ CO2-e Emissions (tonnes) Scope 1 Scope 2 Scope 3Auto distillate (diesel) (L) 3 720 323 143 604 10 038 0 761 111%Aviation gasoline (L) 16 633 551 37 0 3 n/rE-10 (L) 21 996 728 46 0 7 47%Electricity (kWh) 2 317 977 8 345 0 2 078 409 -12%Green power (kWh) 56 279 203 0 -50 -10 -15%LPG (kg) 28 665 738 44 0 4 -40%Natural gas (MJ) 419 323 419 22 0 7 51%Petrol (L) 286 137 9 786 681 0 52 31%Total n/a 164 374 10 868 2 027 1 233 n/d
1Increases in diesel and petrol are associated with inclusion of previously unreported bulk purchased fuel.
Scope 1: Direct greenhouse gas emissions; Scope 2: Indirect emissions from the generation of purchased electricity; Scope 3: Indirect emissions from the extraction, production and transport of the specified fuel.
Note that these figures do not include emissions produced by contractors.
Indicator 20 (b)- FleetObjective: Optimising fleet composition to meet business needs in a cost-effective and environmentally responsible mannerFleet Number by fuel type 2000–01 2007–08 2008–09 2009–10
Light vehicles
Diesel 573 342 374 392Petrol 239 73 66 60LPG n/r 1 1 0Hybrid n/r 1 1 0Total number 812 417 442 452
Trucks and light plant
Diesel 139 172 172 92Petrol 11 4 0 0LPG n/r 4 0 0Total number 150 180 172 92
Heavy plantDiesel 86 41 52 47Petrol 0 0 0 0Total number 86 41 52 47
Forests NSW ongoing commitment is to ensure a safe, reliable and practical motor vehicle fleet that further demonstrates the organisation’s economic and environmental management disciplines. During the year the Light Fleet Selection and Accessorisation Policy was implemented, which is aimed at optimising Forests NSW fleet composition such that it meets the business needs of the organisation in a cost-effective and environmentally responsible manner.
This indicator reports the number of fleet in three categories by fuel type:
• Light vehicles owned by Forests NSW (e.g. sedans, wagons, utes) • Trucks and light plant owned by Forests NSW (e.g. trucks, tankers) • Heavy plant owned by Forests NSW (e.g. dozers, graders)
Indicator 21 - Material consumption and recyclingObjective: Reducing the overall waste volume generated and the volume of waste disposed to landfill. Recycle appropriate wastes and use recycled content materialsPercentage recycled or reused 2008–09 (%) 2009–10 (%)Cardboard 76 75Co-mingled containers 30 64Computers 92 98Copy paper 86 81Monitors 98 91Printer cartridges 87 76
Potable water usage 2008–09 (kL) 2009–10 (kL)Nurseries1 85 849 32 558Depots & offices 16 682 8 773
12008–09 figure has been revised downwards as 22 500 kL of non-potable water had been included.
This data is reported in more detail in our Waste Reduction and Purchasing Policy report as part of out commitments under the NSW Sustainability Policy.
While every effort has been made to ensure the accuracy of recycled and reused percentages some records were unavailable and have been estimated.

46 Forests NSW Annual Report 2009–10 Social, Environmental and Economic Performance
Sustainability indicators
Economic indicators
Indicator 22 - Volume of timber harvestedObjective: Meeting contractual obligations to customersProduct 1999–00 2006–07 2007–08 2008–09 2009–10
Sawlogs and veneer logs (m3) Native forest hardwood sawlogs 786 774 566 706 608 961 556 244 524 931Hardwood plantation sawlogs 55 466 105 510 121 452 114 382 109 136Cypress pine sawlogs 101 881 57 578 50 245 55 175 58 785Plantation softwood sawlogs 1 648 790 1 955 399 2 100 251 1 894 454 2 073 461Plantation softwood veneer logs 70 919 32 079 30 569 26 237 27 316Native forest hardwood veneer logs 10 600 8 777 6 679 7 513 8 856Hardwood plantation veneer logs 2 819 7 073 10 510 9 196 6 251Total sawlogs and veneer logs 2 677 249 2 733 122 2 928 668 2 663 202 2 808 736
Poles, piles and girders (m3) Native forest hardwood 28 432 27 387 25 154 28 136 30 015Plantation hardwood 5 479 11 768 14 286 10 116 6 971Total poles, piles and girders 33 911 39 155 39 440 38 252 36 986
Round timber (m3)Preservation plantation softwood 56 422 68 472 87 859 87 054 98 458
Pulpwood (tonne) Native forest hardwood pulpwood 503 546 551 955 531 089 427 871 488 353Plantation hardwood pulpwood 82 660 64 431 75 067 83 777 83 553Plantation softwood pulpwood 636 058 1 188 478 1 164 137 1 081 236 1 223 691Total Pulpwood 1 222 264 1 804 864 1 770 293 1 592 884 1 795 597
Other Fencing/Landscape/Sleepers/Firewood (m3) 7 575 50 419 25 116 73 010 109 213
Indicator 23 - Product mix of timber harvestedObjective: Increase the percentage of wood harvested going to high value productsSawlog product mix from hardwood forests (native and plantation)Product 1995–96 (%) 2008–09 (%)Dry structural 21 7Floorboards 22 48Joinery/Furniture 1 6Decking & panelling 4 6House framing 30 14Pallets 12 9High strength structural 2 2Fencing/Landscape 8 8
Sawlog product mix from softwood plantationProduct 1995–96 (%) 2008–09 (%)House framing 71 73Joinery/Furniture 2 1Decking/Panelling 1 6Floorboards/Bearers/Joists 3 3Fencing/Landscape 7 6Other preservation 1 4Unseasoned 14 7
Since the Timber Market Survey was outsourced to URS Forestry, this component of the survey is no longer available. These figures still provide insight into the changes in the sawlog product mix over 13 years, up to 2008–09.

47Forests NSW Annual Report 2009–10 Social, Environmental and Economic Performance
Sustainability indicators
Indicator 24 - Carbon accounting1
Objective: Create maximum number of National Greenhouse Abatement Certificates from compliant plantations 2004–05 2006–07 2007–08 2008–09 2009–10
Number of certificates created2 166 005 538 471 694 935 660 382 622 567Area of plantation accredited for carbon trading n/r 23 515 26 864 26 756 27 467
1Note this indicator is not related to Indicator 19, which reports net atmospheric carbon sequestration.2Each certificate accredited represents one tonne of carbon dioxide removed from the atmosphere.
Sustainability indicatorsIndicator 25 - Forest management intentObjective: Maintain net area available for timber production, while conserving large areas for significant values and managing ecological functions
Land not available for harvesting (ha) Land available for harvesting (ha)Forest management intent 1999–00 2008–09 2009–10 1999–00 2008–09 2009–10FMZ 1 Dedicated reserve 33 500 24 398 24 398 0 0 0FMZ 2 Informal reserve – Special management 322 500 152 295 151 214 0 0 0FMZ 3a Informal reserve – Harvest exclusion 199 000 274 182 272 498 0 0 0FMZ 3b Special prescription 54 500 23 302 3 349 13 500 77 055 98 520FMZ 4 General management native forest 387 500 436 275 84 978 1 368 000 805 573 1 156 781FMZ 5 Hardwood planted forest1 0 46 099 45 132 46 000 52 889 63 195FMZ 6 Softwood planted forest1 102 600 165 760 168 467 201 720 234 496 230 068FMZ 7 Non-forestry use 8 000 4 421 4 429 0 0 0FMZ 8 Land for further assessment 0 0 0 326 500 110 597 126 684Total forest estate 1 107 600 1 126 731 754 465 1 965 720 1 280 610 1 675 248
1Includes State forest (including pre-1994 hardwood plantations), joint venture and annuities. Changes other than the the 800 ha revoked and 46 ha dedicated as State forests relate to acquisitions or corrections in operational GIS data. This year an improved process was used to estimate harvestable and non-harvestable area. Utilising a new corporate Geo-Database, a standardised methodology was able to be applied across all regional zones in the state. The process used excluded all identified non-harvestable areas held on the corporate Geo-Database. For coastal regions, a further percentage was then removed from the harvestable area based on the net harvest modifier models. These modifiers have been developed from intensive harvesting studies that determined the relationship between mapped exclusions and actual exclusions identified in harvesting operations.
Indicator 26 - Plantation harvesting, establishment and survivalObjective: Plantations, which maintain the timber supply strategy, effectively established
Afforestation area of age-class (ha)
Reforestation area of age-class (ha)
Cost of establishment1 (‘000)
Per cent requiring restocking after one year
Year Softwood Hardwood Softwood Hardwood Softwood Hardwood Softwood Hardwood1995 2 548 770 4 279 824 n/r n/r n/r n/r2006 1 064 286 6 159 345 $13 282 n/r 63% n/r2007 249 121 5 541 255 $12 283 n/r 34% n/r2008 1 513 83 7 865 1 036 $16 838 n/r 24% n/r2009 472 0 8 630 2 160 $17 052 $3 193 17% 87%
Note third party investor plantings and joint ventures areas included. The table shows areas of pre-1994 plantations re-established, however pre-1994 plantations harvested areas are included in the native forest figures (indicator 28).1Cost associated with site preperation, planting, post planting fertilising and competition control. For hardwood plantations a corporate wide chart of accounts for establishment operations was not maintained prior to the 2009 age-class.The area requiring restocking after one year means that too many seedlings (>20% for softwood and >10% for hardwood) have not survived and replanting is undertaken to ensure the plantation is sufficiently stocked.While the area requiring refill was high for hardwood plantations the number of seedlings required for refilling was only 12% of the 3 666 121 hardwood seedlings originally planted.
Silvicultural treatment Species/Hybrid Area (ha)
Harvested
F1 Southern pine hybrid 9Araucaria cunninghamii 68Pinus elliottii 51Pinus laricio 39Pinus radiata 7 838Other 30
Total 8 035
Silvicultural treatment Species/Hybrid Area (ha)
Thinned
F1 Southern pine hybrid 38F2 Southern pine hybrid 31Pinus caribaea 15Pinus elliottii 339Pinus radiata 4 797Pinus taeda 235
Total 5 456Note this relates to softwoods and post-1994 hardwood plantation only (no harvesting or thinning was undertaken in post-1994 hardwood plantations).
Planted forests harvested

48 Forests NSW Annual Report 2009–10 Social, Environmental and Economic Performance
Sustainability indicators
Indicator 27 - Mean annual growth in planted forestsObjective: Plantation growth rates are at acceptable levels to achieve future productivitySoftwood plantation 2000–01 2007–08 2008–09 2009–10
Annual Increment1 (m3) 3 465 000 3 419 171 3 686 903 3 480 198
Net Stocked Area2 (ha) 205 007 209 252 204 828 205 929
Mean Annual Increment4 (m3/ha/yr) 16.9 16.3 18.0 16.9
Hardwood plantation5 2000–01 2007–08 2008–09 2009–10
Annual Increment1 (m3) n/d 357 479 263 738 345 621
Net Stocked Area2 (ha) n/d 26 227 26 374 25 813
Mean Annual Increment4 (m3/ha/yr) n/d 13.6 10.0 13.31 Annual Increment (AI) is the change in volume of the plantation Net Stocked Area in one year (AI=NSAxMAI).2 Net Stocked Area (NSA) is the area of the estate where trees are planted (i.e. does not include roads, environmental exclusion areas, area awaiting regeneration etc) as at the end of the financial year.4 Mean annual increment (MAI) is an indication of the productive potential of an average hectare within the estate. The hardwood figure was calculated as part of the discounted cash flow valuation process. Both figures relate to total standing volume.5 Relates to post-1994 hardwood plantations only. All post-1994 hardwood plantations are managed under the Plantations & Reafforestation Act 1999. For pre-1994 hardwood plantations the relevant native forests licence conditions are usually applied.
Net Stocked Area by age-class groups as at June 30 2010
SpeciesAge-class groups (years)
1-10 11-20 21-30 31-40+Pinus radiata 29% 21% 34% 16%Other softwood 28% 22% 25% 24%Corymbia maculata (spotted gum) 47% 53% 0% 0%Eucalyptus grandis (flooded gum) 43% 57% 0% 0%Eucalyptus pilularis (blackbutt) 54% 44% 1% 1%Other hardwood 62% 37% 0% 1%Total 31% 25% 30% 14%
Includes joint ventures, subsidiaries and annuities and relates to post-1994 hardwood plantations only.
Standing volumes by major species as at June 30 2010
Category Species m3 (million)
Softwood plantationsPinus radiata 46.0Southern pine 1.4Other softwood plantation species 2.0
Post-1994 hardwood plantation
Eucalyptus dunnii (dunn’s white gum) 1.2Corymbia maculata (spotted gum) 0.8Eucalyptus pilularis (blackbutt) 0.8Other hardwood plantation species 0.7
Includes joint ventures, subsidiaries and annuities.

49Forests NSW Annual Report 2009–10 Social, Environmental and Economic Performance
Sustainability indicators
Indicator 28 - Native forest harvested and regeneratedObjective: 100% of surveyed native forests harvest area effectively regenerated
Native forest harvested and effective regeneration
2007–08 2008–09 2009–10Estimated area Estimated area Estimated area Area surveyed Regenerated1
(ha) (ha) (ha) (ha) (%)Alternate coupe 1 366 1 162 1 118 0 n/aCommercial thinning 7 719 8 861 4 772 n/a n/aCypress release 15 000 1 800 7 650 n/a n/aGroup selection 4 437 2 207 1 226 182 96Single tree selection 24 438 13 922 23 733 673 95Total 52 960 27 952 38 499 855 n/aNon-commercial thinning 4 671 3 300 285 n/a n/aRegeneration1 (%) 64 94 n/a n/a 95Expenditure on silviculture and inventory (‘000) $ 4 342 $ 4 321 n/a n/a $ 4 249
1Proportion effectively regenerated with commercial species.
While natural regeneration of commercial species is usually achieved, in those cases where not enough commercial species regenerate supplementary planting may be undertaken as was reported for some areas in North East Region.
In addition 10 hectares in Wang Wauk State Forest, near Forster, was regenerated by distributing flooded gum seed rather than planting, while in the north east of the State planting was undertaken as part of rehabilitation of Bell Miner Associated Dieback affected forests.
Indicator 29 - Sustainable yield1
Objective: Harvesting of wood products is within allowable levelsForest type 1999–00 (%) 2006–07 (%) 2007–08 (%) 2008–09 (%) 2009–10 (%)Hardwood native and planted forest 95 93 93 80 81Hardwood native and plantation pulpwood 100 93 93 112 113Native cypress forest 97 96 96 93 100Softwood planted forest 95 98 98 73 88Softwood planted pulpwood 104 87 85 77 80
1This indicator takes the ‘allowable cut’ and compares it to actual harvested amounts. Allowable cut is used as a substitute for predicted sustainable yield. Allowable cuts are based on predicted sustainable yield models, but take into consideration the operational implementation requirements of government and industry.
Note that Forests Agreements permit allowable cut to vary by +/- 25% within any 1 year and +/- 5% over a 5 year agreement period. This applies for differing timber products depending on the Forest Agreement.
Indicator 30 - Forest certificationObjective: Maintain ISO 14001:2004 & Australian Forestry Standard
Two external audits were undertaken during 2009–10. The first was a recertification audit undertaken in September, which applied to the Australian Forestry Standard (AS 4708 :2007) and the Environmental Management Systems Standard (ISO 14001:2004). During this audit the external auditors visited Western, Northern, North East, Southern and Hume Regions.The auditor reported that Forests NSW was continuing to comply with both standards, while systematically implementing recommendations of previous audits.In March 2010 a surveillance audit to both standards was undertaken in Native Forests Branch Central & Planted Forests Branch Monaro Regions. Forests NSW also passed this audit and continues to act on recommendations included in the audit reports. During the year Forests NSW published details of the Forests NSW defined forest area for AFS on the organisation’s website (www.industry.nsw.gov.au).
Indicator 31 - Trading profit (before tax)Objective: Meeting profitability and dividend targets as agreed with NSW Treasury and increasing management efficiencyYear 1999–00 2006–07 2007–08 2008–09 2009–10
Value (‘000)1 $29 541 $28 037 $14 499 -$16 389 $19 738$’000 per employee $24.25 $25.60 $8.30 -$18.50 $23.52
1Exclusive of forest revaluation, asset impairments, superannuation fund interest and significant items.

Places of business Business hours 8.30 am – 4.30 pm (Mon-Fri)
50 Forests NSW Annual Report 2009–10 Social, Environmental and Economic Performance
Corporate OfficePO Box 100, Beecroft 2119121-131 Oratava AveWest Pennant Hills 2125(02) 9872 0111 Fax (02) 9871 5341DX 4713 P/HILLS
Planted Forests Divisional OfficePO Box 100, Beecroft 2119121-131 Oratava AveWest Pennant Hills 2125(02) 9872 0111 Fax (02) 9871 5341DX 4713 P/HILLS
Native Forests Divisional OfficePO Box 4019Coffs Harbour Jetty 2450357 Harbour DriveCoffs Harbour Jetty(02) 6656 8800 Fax (02) 6651 2909
Hume RegionPO Box 291, Tumut 2720Riverina Highlands Building76 Capper Street, Tumut(02) 6947 3911 Fax (02) 6947 2865
Central RegionPO Box 168, Wauchope 2446Maher Street, Wauchope(02) 6585 3744 Fax (02) 6585 2392
Macquarie RegionPO Box 143, Bathurst 2795Cnr Browning & William StreetsBathurst(02) 6331 2044 Fax (02) 6331 5528
North East RegionPO Box 535, Coffs Harbour 2450130 West High Street Coffs Harbour(02) 6652 0111 Fax (02) 6651 9891
Monaro RegionPO Box 83, Bombala 2632Jonas Street, Bombala(02) 6458 3177 Fax (02) 6458 3624
Northern RegionGrafton Forest Technology CentrePMB 4, Grafton 2460Trenayr Road, Junction Hill (Grafton)(02) 6640 1660 Fax (02) 6640 1650
Southern RegionPO Box 42, Batemans Bay 2536Crown Street, Batemans Bay1300 880 568 Fax (02) 4472 6557
Western RegionPO Box 865, Dubbo 2830Cnr Monash & Chelmsford Streets, Dubbo(02) 6841 4288 Fax (02) 6841 4771
Divisional and corporate offices
Regions
Cumberland State ForestPO Box 100 Beecroft 211995 Castle Hill Road, West Pennant Hills 2125(02) 9871 3222 Fax (02) 9872 7590
Dubbo PO Box 2047 Dubbo 2830Wellington RoadDubbo 2830(02) 6884 5319 Fax (02) 6884 7487
Gunnedah PO Box 542 Gunnedah 2380Cnr Martin & Mullaley Roads, Gunnedah 2380(02) 6742 3126 Fax (02) 6742 0618
Muswellbrook PO Box 219 Muswellbrook 2333New England HighwayMuswellbrook 2333(02) 6543 2622 Fax (02) 6543 1154
Narrandera PO Box 33 Narrandera 2700Lake Drive, Narrandera 2700(02) 6959 1223 Fax (02) 6959 2460
Wagga Wagga PO Box 5336 Wagga Wagga 2650Olympic WayWagga Wagga 2650(02) 6931 2600 Fax (02) 6931 3201
Retail nurseries
Commercial production nurseries (no public enquiries)
GraftonGrafton Forest Technology CentrePMB 4, Grafton 2460Trenayr Rd, Junction Hill (Grafton) 2460(02) 6644 7001 Fax (02) 6644 7041
TumutPO Box 347 Tumut 2720Blowering NurseryBlowering Road, Tumut 2720(02) 6947 6210 Fax (02) 6947 4890

This document is part of a larger publication and is subject to the disclaimers and copyright of the full version from which it was extracted.
The remaining parts and full version of the publication, as well as updates and copyright and other legal information can be found at:
http://www.dpi.nsw.gov.au/aboutus/resources/corporate-publications/forests-nsw-annual-report-2009-10