for the period july 1, 2011 through june 30, 2012€¦ · simplified cost savings and cost...
TRANSCRIPT

For the period July 1, 2011 through June 30, 2012

Scott Schlotthauer State Purchasing Director
Preston L. Doerflinger Director and Secretary
of Finance and Revenue
May 2, 2013
To the Honorable Mary Fallin, Governor, The Honorable Brian Bingman, President Pro Tempore of the Oklahoma Senate, The Honorable T.W. Shannon, Speaker of the Oklahoma House of Representatives, and the citizens of the State of Oklahoma:
The Office of Management and Enterprise Services is pleased to present the FY 2012 Procurement Savings Report for the State of Oklahoma. Once again, taxpayers are benefiting from state purchasing improvements that have allowed agencies to spend less for necessary supplies and services.
In FY 12, the OMES Central Purchasing Department helped political subdivisions, state agencies and higher education institutions reduce managed procurement contract spending by $17 million, an 11 percent reduction from FY 11. In addition, the OMES Information Services Division helped state agencies achieve procurement contract cost avoidance of $18.7 million, an 18.6 percent reduction from FY 11.
OMES was able to help produce these savings by successfully implementing into practice various strategic purchasing reforms developed by the Legislature in recent years. We take tremendous pride in reporting that good government can and does occur, starting right here in Oklahoma. The state’s purchasing reforms are working.
The attached report provides high-level detail on the cost reductions generated through Central Purchasing-managed procurement contracts in FY 12, as well as cost avoidance generated through ISD-managed procurement contracts in FY 12.
As always, OMES is happy to answer any additional questions you may have on this matter or any other.
2300 N. Lincoln Blvd. Room 122 ● Oklahoma City, OK 73105 (405) 521-2141● OMES.OK.gov
Central Purchasing Division Executive Summary Page 4 Cost Savings by Contract Page 7 Savings Detail by Agency Page 34 Central Purchasing Agency Savings Page 39 Agency Reported Savings Page 46
Information Services Division (ISD) Executive Summary Page 50 IT Statewide Contract FY12 Detail Page 53
2 www.omes.ok.gov

3

4
Through Central Purchasing managed contracts, the State of Oklahoma realized savings in excess of $17 million for fiscal year 2012. The spending and savings are summarized below:
Spending Savings Percent Savings
Total $ 151,441,228.29 $ 17,322,265.36 11.44%
Political Sub-Divisions $ 45,396,504.79 $ 7,976,131.22 17.57%
Higher Education $ 38,343,902.57 $ 937,498.56 2.44%
State of Oklahoma $ 67,700,820.93 $ 8,408,635.58 12.42%

Notes regarding Cost Savings Calculations
▶ Simplified cost savings and cost avoidance formulas were used to calculate savings percentage
(Historical Price - New Price) / (Historical Price) (Average of Responsive Bids – Awarded Bid) / (Average of
Responsive Bids)
▶ Savings calculations are conservative and represent only savings which can be easily quantified.
5

▶ Several issues led Central Purchasing to take a very conservative approach to calculating savings. Those issues include: Incomplete usage data as reported by vendors for each
contract Multiple discount percentages across a specific contract
in which Central Purchasing would have taken the discount with the least percentage off of list prices
Unavailable historical prices or inaccessible responsive, non-awarded prices
6

7

Contracting Officer: Laura Bybee
▶ Background:
MN-led contract (MMCAP) OK is participating along with 47 other states 1.8 billion dollar spend with over 21,000 items used
by Oklahoma
▶ Savings percentage approximately 1% ▶ Best practices used:
Commodity Council RFP development with MN
8

I. Overall
Category Current Spending Savings
State of Oklahoma $ 7,349,416.40 $ 71,142.35
Higher Education $ 34,298,657.74 $ 332,011.01
Political Sub-Divisions $ 688,763.09 $ 6,667.23
Total $ 42,336,837.23 $ 409,820.59
II. State Agencies
Agency Current Spending Savings
Dept. of Mental Health $ 4,754,209.63 $ 46,020.75
Dept. of Health $ 1,629,875.76 $ 15,777.20
Dept. of Human Services $ 958,212.69 $ 9,275.50
Office of Juvenile Affairs $ 5,335.53 $ 51.65
Dept. of Rehabilitation Services $ 1,782.78 $ 17.26
9

Contracting Officer: Theresa Johnson
▶ Background:
Comprehensive, strategically sourced project
▶ Savings percentage 21% ▶ Best Practices used:
Spend data from various sources GSA Direct negotiation with manufacturers
10

I. Overall
Category Current Spending Savings
State of Oklahoma $1,819,375.23 $ 382,068.80
Higher Education $ 158,492.88 $ 33,283.50
Political Sub-Divisions $6,305,593.20 $1,324,174.57
Total $ 8,283,461.31 $1,739,526.87
II. State Agencies
Agency Current Spending Savings
Dept. of Public Safety $ 850,747.35 $ 178,656.94
Dept. of Transportation $ 708,213.60 $ 148,724.86
Dept. of Central Services $ 61,608.37 $ 12,937.76
Wildlife Conservation $ 34,784.10 $ 7,304.66
Other State Agencies $ 164,021.81 $ 34,444.58
11

Contracting Officer: Lisa Bradley
▶ Background:
First statewide light bulb contract with tiered pricing
Added ballast products to contract
▶ Savings percentage 30.8% ▶ Best practices used:
Contract was made mandatory to drive spend Pricing transparency Used the Performance Information Procurement
System (PIPS) methodology Detailed vendor reports with performance data
12

I. Overall
Category Current Spending Savings
State of Oklahoma $ 389,162.25 $ 119,861.97
Higher Education $ 47,625.22 $ 14,668.57
Political Sub-Divisions $ 107,523.02 $ 33,117.09
Total $ 544,310.49 $ 167,647.63
II. State Agencies
Agency Current Spending Savings
Dept. of Corrections $ 162,013.81 $ 49,900.25
Dept. of Human Services $ 38,814.62 $ 11,954.90
Military Department $ 32,639.94 $ 10,053.10
Dept. of Veterans Affairs $ 27,296.88 $ 8,407.44
Other State Agencies $ 128,397.00 $ 39,546.28
13

Contracting Officer: Laura Bybee
▶ Background:
Comprehensive, strategically sourced project Research-driven, analytical approach to
sourcing
▶ Savings percentage 5% ▶ Best practices used:
Pricing transparency Commodity Council Target pricing utilized
14
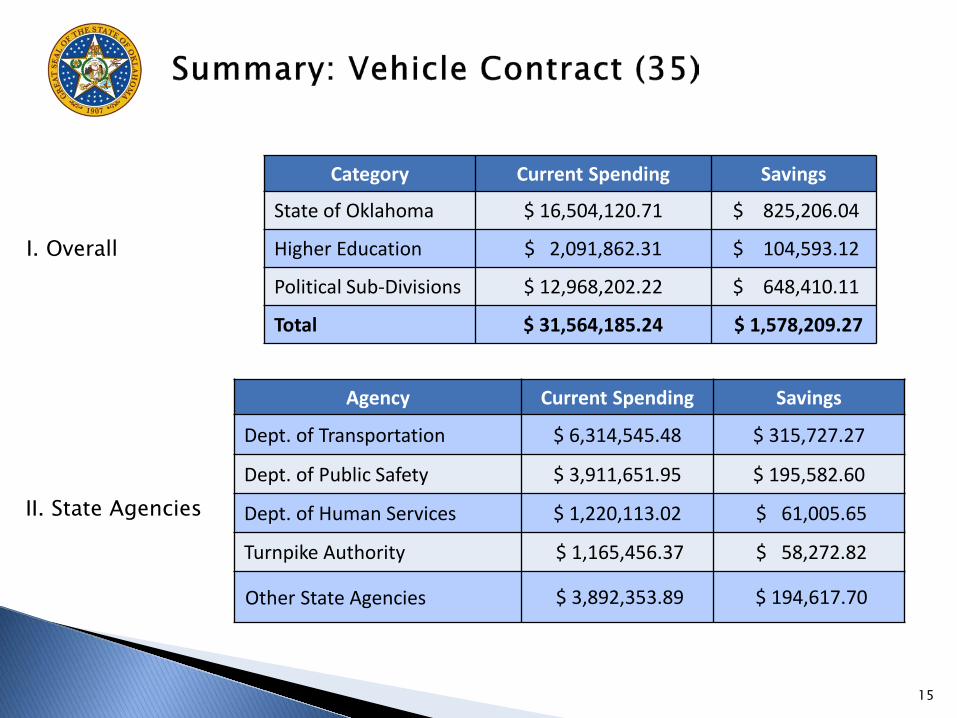
I. Overall
Category Current Spending Savings
State of Oklahoma $ 16,504,120.71 $ 825,206.04
Higher Education $ 2,091,862.31 $ 104,593.12
Political Sub-Divisions $ 12,968,202.22 $ 648,410.11
Total $ 31,564,185.24 $ 1,578,209.27
II. State Agencies
Agency Current Spending Savings
Dept. of Transportation $ 6,314,545.48 $ 315,727.27
Dept. of Public Safety $ 3,911,651.95 $ 195,582.60
Dept. of Human Services $ 1,220,113.02 $ 61,005.65
Turnpike Authority $ 1,165,456.37 $ 58,272.82
Other State Agencies $ 3,892,353.89 $ 194,617.70
15
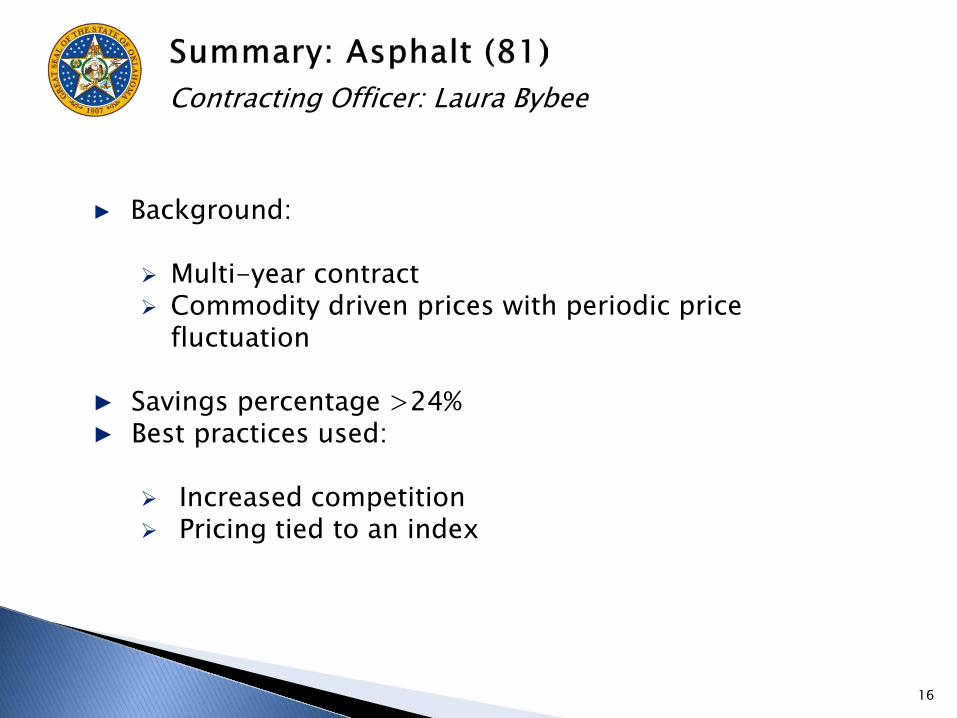
Contracting Officer: Laura Bybee
▶ Background:
Multi-year contract Commodity driven prices with periodic price
fluctuation ▶ Savings percentage >24% ▶ Best practices used:
Increased competition Pricing tied to an index
16

I. Overall
Category Current Spending Savings
State of Oklahoma $ 10,092,338.04 $ 2,522,983.59
Higher Education $ 0.00 $ 0.00
Political Sub-Divisions $ 5,555,772.96 $ 1,388,887.68
Total $ 15,648,111.00 $ 3,911,871.27
II. State Agencies
Agency Current Spending Savings
Dept. of Transportation $ 9,951,776.04 $ 2,487,844.49
Dept. of Corrections $ 140,562.00 $ 35,139.09
17
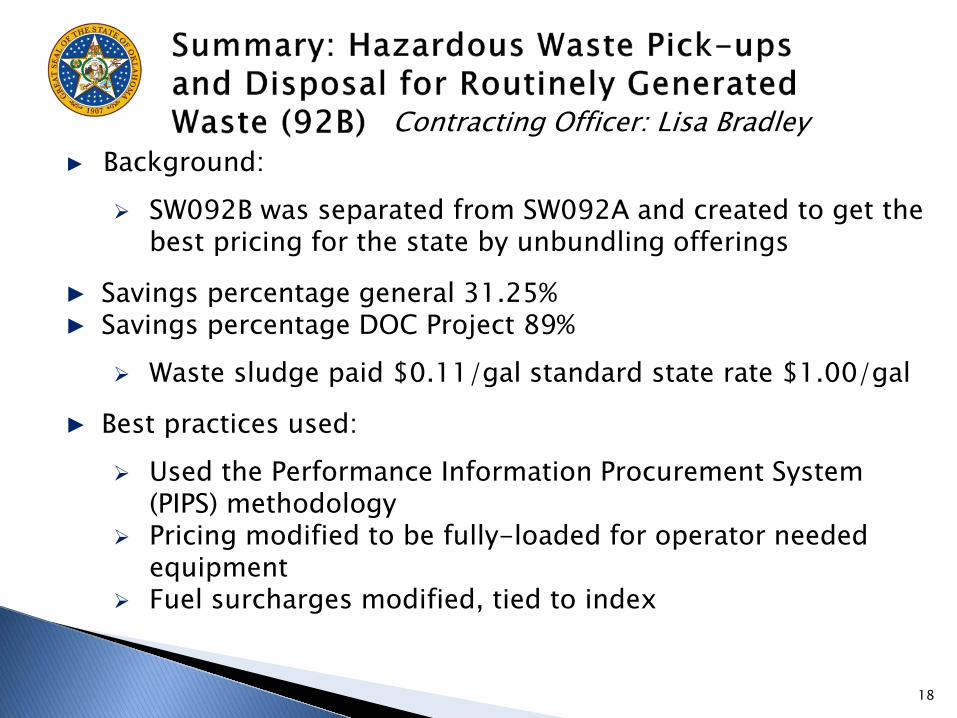
Contracting Officer: Lisa Bradley ▶ Background:
SW092B was separated from SW092A and created to get the best pricing for the state by unbundling offerings
▶ Savings percentage general 31.25% ▶ Savings percentage DOC Project 89%
Waste sludge paid $0.11/gal standard state rate $1.00/gal
▶ Best practices used:
Used the Performance Information Procurement System (PIPS) methodology
Pricing modified to be fully-loaded for operator needed equipment
Fuel surcharges modified, tied to index
18
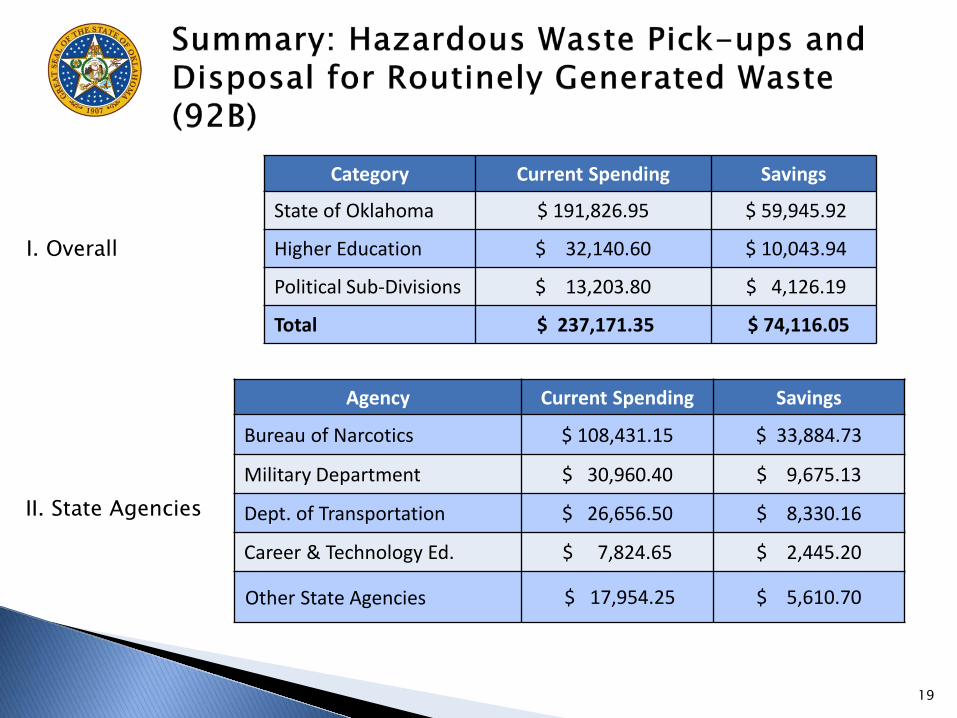
I. Overall
Category Current Spending Savings
State of Oklahoma $ 191,826.95 $ 59,945.92
Higher Education $ 32,140.60 $ 10,043.94
Political Sub-Divisions $ 13,203.80 $ 4,126.19
Total $ 237,171.35 $ 74,116.05
II. State Agencies
Agency Current Spending Savings
Bureau of Narcotics $ 108,431.15 $ 33,884.73
Military Department $ 30,960.40 $ 9,675.13
Dept. of Transportation $ 26,656.50 $ 8,330.16
Career & Technology Ed. $ 7,824.65 $ 2,445.20
Other State Agencies $ 17,954.25 $ 5,610.70
19
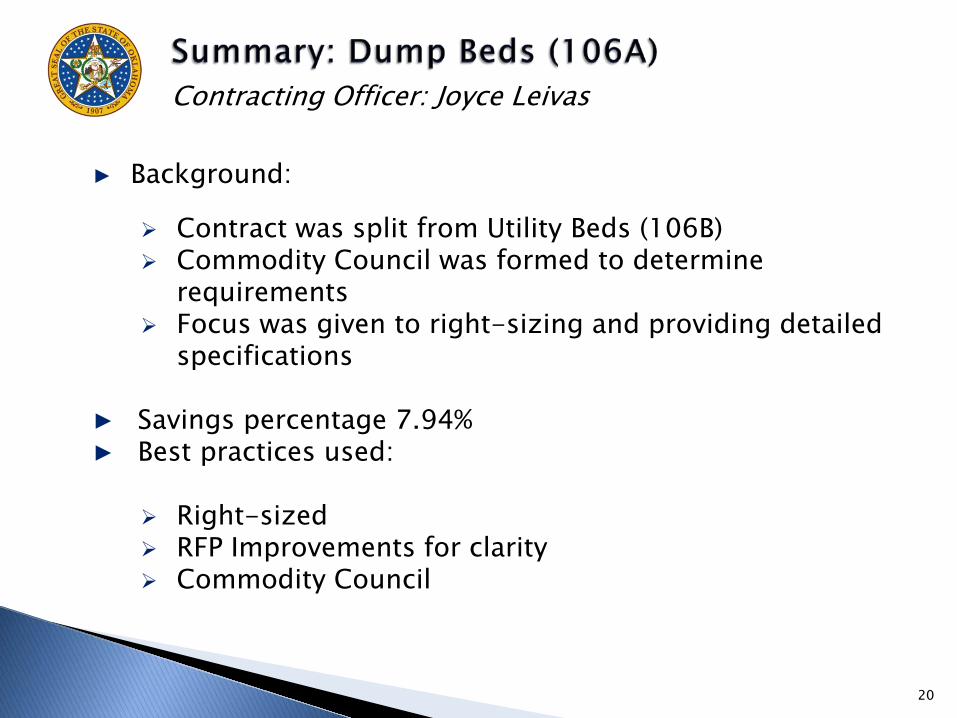
Contracting Officer: Joyce Leivas
▶ Background:
Contract was split from Utility Beds (106B) Commodity Council was formed to determine
requirements Focus was given to right-sizing and providing detailed
specifications
▶ Savings percentage 7.94% ▶ Best practices used:
Right-sized RFP Improvements for clarity Commodity Council
20

I. Overall
Category Current Spending Savings
State of Oklahoma $ 1,721,480.26 $ 136,685.53
Higher Education $ 0.00 $ 0.00
Political Sub-Divisions $ 593,859.00 $ 47,152.40
Total $ 2,315,339.26 $ 183,837.93
II. State Agencies
Agency Current Spending Savings
Dept. of Transportation $ 1,676,448.26 $ 133,109.99
Turnpike Authority $ 45,032.00 $ 3,575.54
21
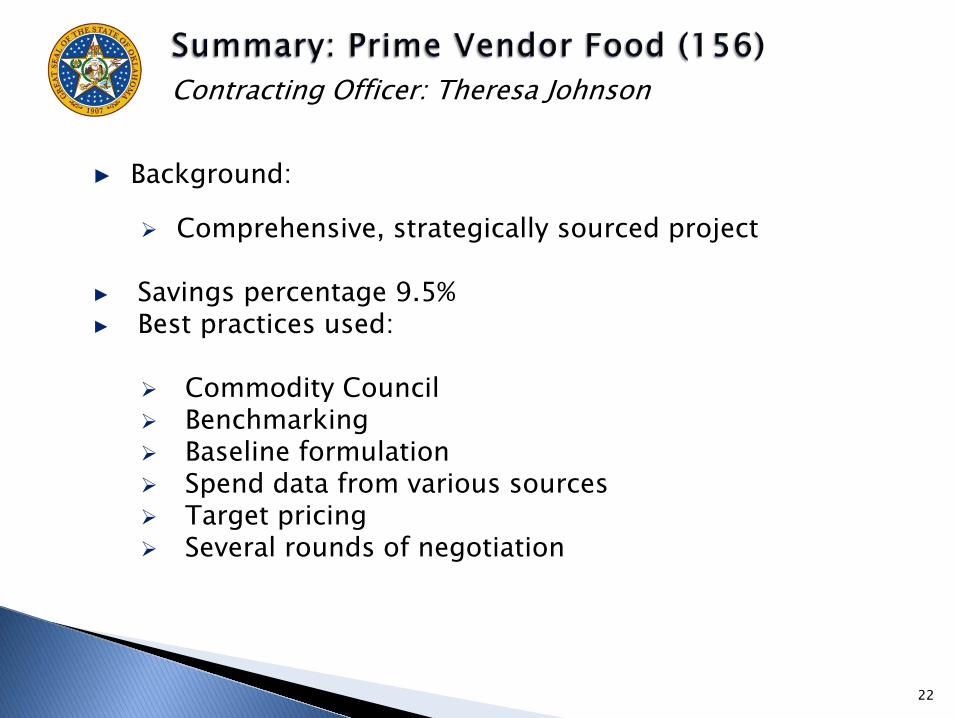
Contracting Officer: Theresa Johnson
▶ Background:
Comprehensive, strategically sourced project
▶ Savings percentage 9.5% ▶ Best practices used:
Commodity Council Benchmarking Baseline formulation Spend data from various sources Target pricing Several rounds of negotiation
22

I. Overall
Category Current Spending Savings
State of Oklahoma $ 16,905,703.80 $ 1,606,041.86
Higher Education $ 33,636.53 $ 3,195.47
Political Sub-Divisions $ 3,544,996.86 $ 336,774.70
Total $ 20,484,337.19 $ 1,946,012.03
II. State Agencies
Agency Current Spending Savings
Dept. of Corrections $ 13,498,673.23 $ 1,282,373.96
Dept. of Human Services $ 1,115,358.21 $ 105,959.03
Dept. of Tourism & Recreation $ 844,640.53 $ 80,240.85
Other State Agencies $ 1,447,031.83 $ 137,468.02
23
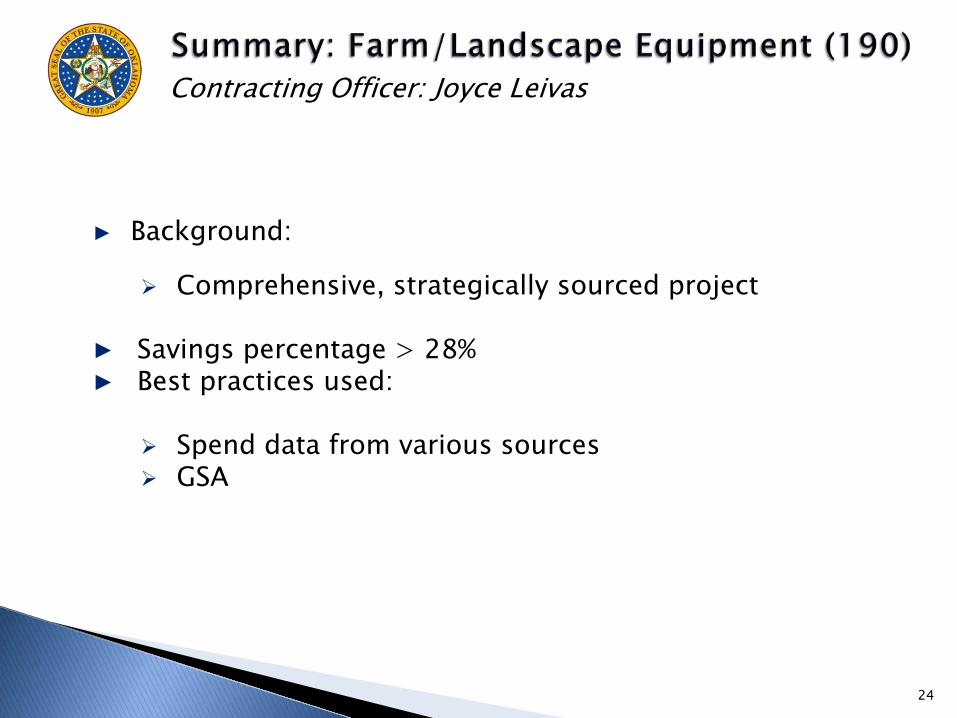
Contracting Officer: Joyce Leivas
▶ Background:
Comprehensive, strategically sourced project
▶ Savings percentage > 28% ▶ Best practices used:
Spend data from various sources GSA
24

I. Overall
Category Current Spending Savings
State of Oklahoma $ 3,644,424.27 $ 1,054,331.94
Higher Education $ 1,319,914.78 $ 381,851.35
Political Sub-Divisions $ 12,984,437.57 $ 3,756,397.79
Total $ 17,948,776.62 $ 5,192,581.08
II. State Agencies
Agency Current Spending Savings
Dept. of Transportation $ 2,040,268.13 $ 590,249.57
Dept. of Tourism & Recreation $ 614,275.54 $ 175,107.66
Wildlife Conservation $ 373,697.73 $ 108,110.75
Other State Agencies $ 625,177.87 $ 180,863.96
25

Contracting Officer: Joyce Leivas
▶ Background:
New bid / multi-year contract Commodity driven prices with periodic price fluctuation
▶ Savings percentage 30.21% ▶ Best Practices used:
Increased competition
26

I. Overall
Category Current Spending Savings
State of Oklahoma $ 648,010.50 $ 195,763.97
Higher Education $ 0.00 $ 0.00
Political Sub-Divisions $ 63,047.00 $ 19,046.50
Total $ 711,057.50 $ 214,810.47
II. State Agencies
Agency Current Spending Savings
Dept. of Transportation $ 506,974.25 $ 153,156.92
Turnpike Authority $ 45,032.00 $ 42,607.05
27
Contracting Officer: Theresa Johnson
▶ Background:
Multi-year, statewide contract which was previously bid as an annual open market contract
▶ Savings percentage 10.08% ▶ Best Practices used:
Commodity Council Expanded contract period to protect against price
fluctuations Streamlined the solicitation process, affording vendors
the opportunity to respond electronically
28
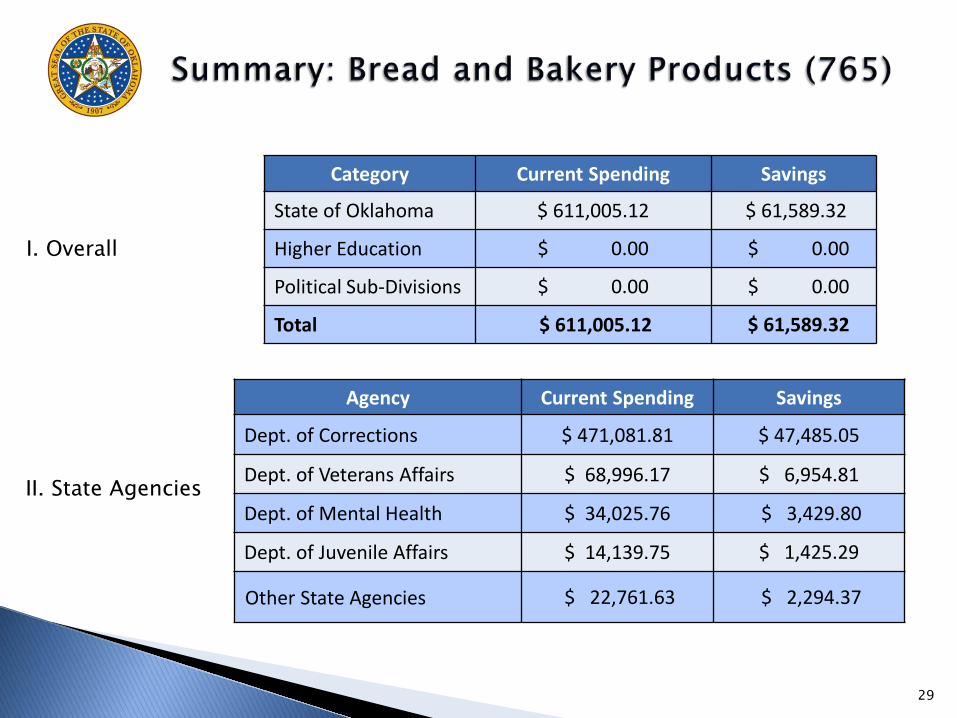
I. Overall
Category Current Spending Savings
State of Oklahoma $ 611,005.12 $ 61,589.32
Higher Education $ 0.00 $ 0.00
Political Sub-Divisions $ 0.00 $ 0.00
Total $ 611,005.12 $ 61,589.32
II. State Agencies
Agency Current Spending Savings
Dept. of Corrections $ 471,081.81 $ 47,485.05
Dept. of Veterans Affairs $ 68,996.17 $ 6,954.81
Dept. of Mental Health $ 34,025.76 $ 3,429.80
Dept. of Juvenile Affairs $ 14,139.75 $ 1,425.29
Other State Agencies $ 22,761.63 $ 2,294.37
29

Contracting Officer: Laura Bybee
▶ Background:
New statewide contract Purpose was to allow Fleet Management to monitor
and better utilize fleet vehicles
▶ Savings percentage 39.77% ▶ Best Practices used:
Commodity Council Benchmarking Right-sized, right-spec’d
30

I. Overall
Category Current Spending Savings
State of Oklahoma $ 509,806.95 $ 202,750.22
Higher Education $ 0.00 $ 0.00
Political Sub-Divisions $ 0.00 $ 0.00
Total $ 509,806.95 $202,750.22
II. State Agencies Agency Current Spending Savings
Dept. of Central Services $ 509,806.95 $ 202,750.22
31
Contracting Officer: Lisa Bradley
▶ Background:
Comprehensive, strategically sourced project
▶ Savings percentage16% ▶ Best Practices used:
Benchmarking Right sized, right-spec’d Target pricing Increased competition Negotiation (3 rounds)
32

I. Overall
Category Current Spending Savings
State of Oklahoma $ 7,314,055.34 $ 1,170,248.85
Higher Education $ 361,572.50 $ 57,851.60
Political Sub-Divisions $ 2,571,106.07 $ 411,376.97
Total $ 10,246,733.91 $ 1,639,477.42
II. State Agencies
Agency Current Spending Savings
Dept. of Corrections $ 2,387,640.54 $ 382,022.49
Dept. of Transportation $ 917,319.27 $ 146,771.08
Military Department $ 626,582.40 $ 100,253.18
Dept. of Tourism $ 591,834.76 $ 94,693.56
Other State Agencies $ 2,790,678.37 $ 446,508.54
33

34
35
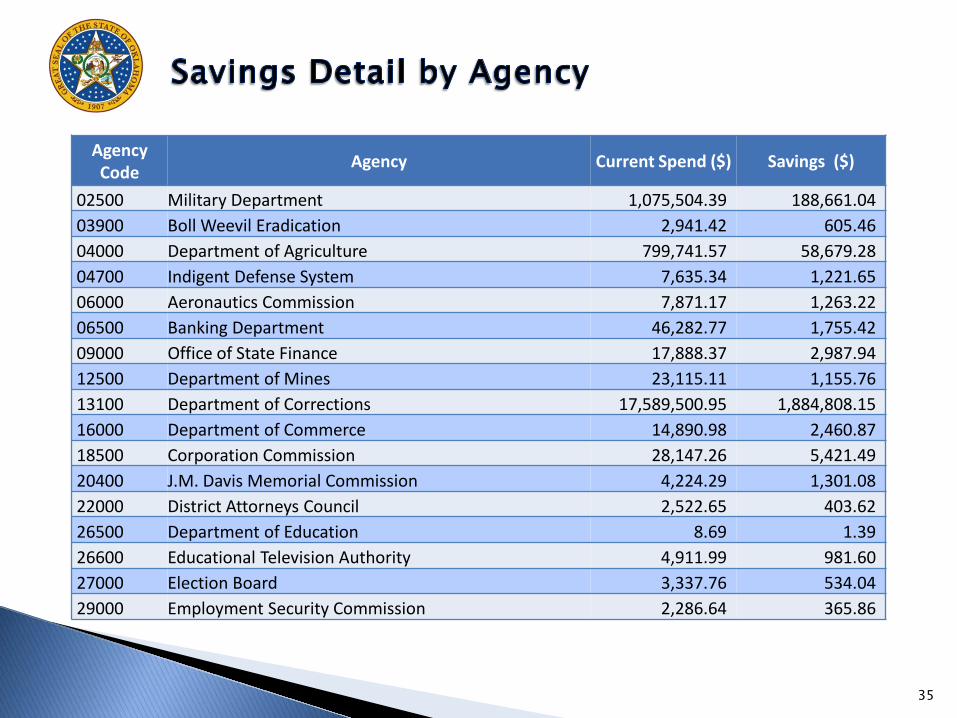
Agency Code Agency Current Spend ($) Savings ($)
02500 Military Department 1,075,504.39 188,661.04 03900 Boll Weevil Eradication 2,941.42 605.46 04000 Department of Agriculture 799,741.57 58,679.28 04700 Indigent Defense System 7,635.34 1,221.65 06000 Aeronautics Commission 7,871.17 1,263.22 06500 Banking Department 46,282.77 1,755.42 09000 Office of State Finance 17,888.37 2,987.94 12500 Department of Mines 23,115.11 1,155.76 13100 Department of Corrections 17,589,500.95 1,884,808.15 16000 Department of Commerce 14,890.98 2,460.87 18500 Corporation Commission 28,147.26 5,421.49 20400 J.M. Davis Memorial Commission 4,224.29 1,301.08 22000 District Attorneys Council 2,522.65 403.62 26500 Department of Education 8.69 1.39 26600 Educational Television Authority 4,911.99 981.60 27000 Election Board 3,337.76 534.04 29000 Employment Security Commission 2,286.64 365.86
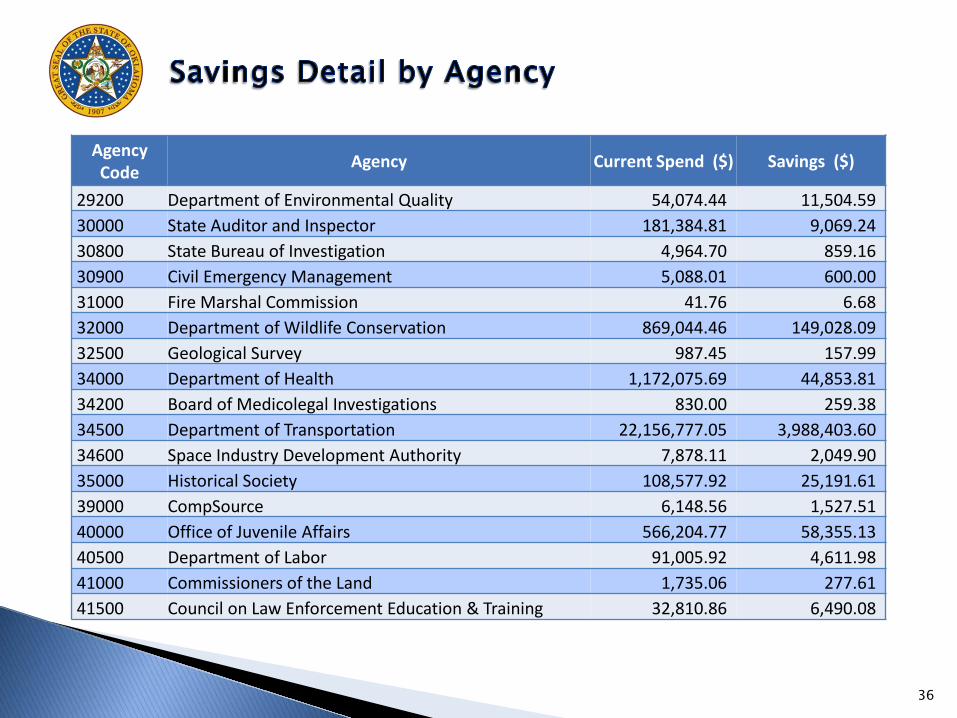
Agency Code Agency Current Spend ($) Savings ($)
29200 Department of Environmental Quality 54,074.44 11,504.59 30000 State Auditor and Inspector 181,384.81 9,069.24 30800 State Bureau of Investigation 4,964.70 859.16 30900 Civil Emergency Management 5,088.01 600.00 31000 Fire Marshal Commission 41.76 6.68 32000 Department of Wildlife Conservation 869,044.46 149,028.09 32500 Geological Survey 987.45 157.99 34000 Department of Health 1,172,075.69 44,853.81 34200 Board of Medicolegal Investigations 830.00 259.38 34500 Department of Transportation 22,156,777.05 3,988,403.60 34600 Space Industry Development Authority 7,878.11 2,049.90 35000 Historical Society 108,577.92 25,191.61 39000 CompSource 6,148.56 1,527.51 40000 Office of Juvenile Affairs 566,204.77 58,355.13 40500 Department of Labor 91,005.92 4,611.98 41000 Commissioners of the Land 1,735.06 277.61 41500 Council on Law Enforcement Education & Training 32,810.86 6,490.08
36

Agency Code Agency Current Spend ($) Savings ($)
42100 State Senate 138.72 22.20 42200 House of Representatives 31.32 5.01 43000 Department of Libraries 3,825.82 612.13 45200 Department of Mental Health & Substance Abuse 5,843,763.83 159,944.41 47700 Bureau of Narcotics & Dangerous Drugs 281,153.92 42,818.89 56600 Tourism & Recreation Department 2,075,280.62 358,423.47 56800 Scenic Rivers Commission 969.10 155.06 58000 Department of Central Services 1,567,746.26 299,274.73 58500 Department of Public Safety 4,846,018.17 387,994.86 60500 Regents for Higher Education 11,427.97 1,828.48 62500 Secretary of State 296.53 47.44 62900 School of Science & Math 2,136.54 527.54 64500 Conservation Commission 783.56 125.37 65000 Department of Veterans Affairs 334,721.24 53,995.83 67000 J.D. McCarty Center 64,802.77 13,192.06 67700 Supreme Court 1,168.93 190.50 69500 Tax Commission 6,907.69 1,249.28
37

Agency Code Agency Current Spend ($) Savings ($)
80000 Career & Technology Education 432,118.59 72,023.39 80500 Department of Rehabilitation Services 279,589.82 29,085.45 80700 Health Care Authority 456.29 73.01 83000 Department of Human Services 4,561,379.19 283,670.45 83500 Water Resources Board 2,630.51 420.88 92200 Housing Finance Agency 46,967.83 2,431.89 97800 Turnpike Authority 1,448,171.66 128,521.13 98000 Grand River Dam Authority 997,893.13 116,147.87 99999 Political Sub-Divisions 45,396,504.79 7,976,131.23 HE001 Higher Education 38,343,902.56 937,498.56 Grand Total 151,441,228.29 17,322,265.36
38

39
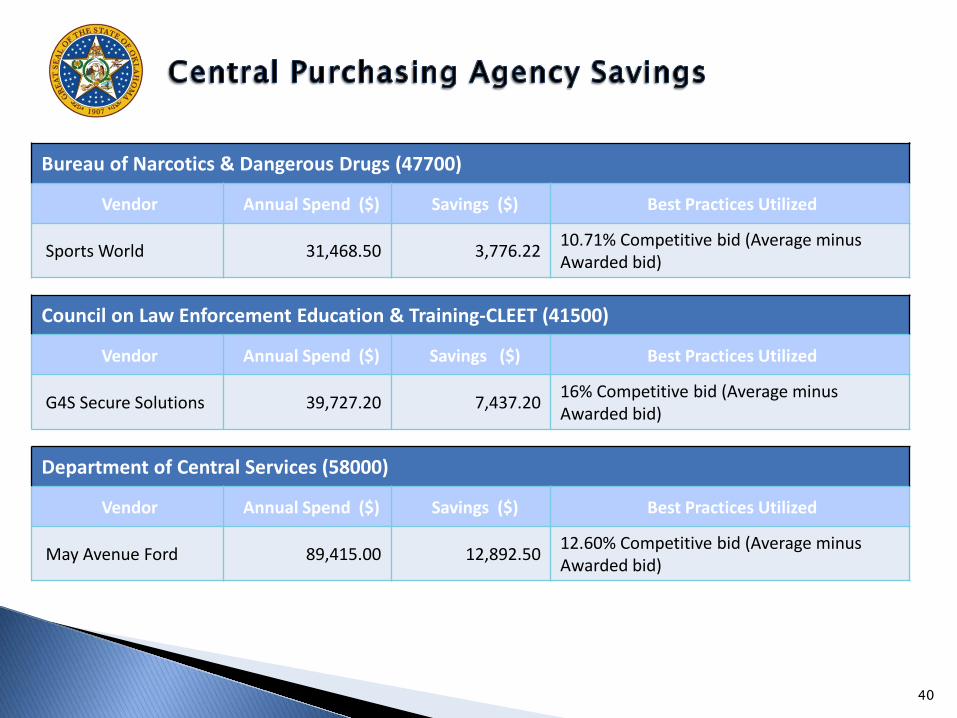
Bureau of Narcotics & Dangerous Drugs (47700)
Vendor Annual Spend ($) Savings ($) Best Practices Utilized
Sports World 31,468.50 3,776.22 10.71% Competitive bid (Average minus Awarded bid)
Council on Law Enforcement Education & Training-CLEET (41500)
Vendor Annual Spend ($) Savings ($) Best Practices Utilized
G4S Secure Solutions 39,727.20 7,437.20 16% Competitive bid (Average minus Awarded bid)
Department of Central Services (58000)
Vendor Annual Spend ($) Savings ($) Best Practices Utilized
May Avenue Ford 89,415.00 12,892.50 12.60% Competitive bid (Average minus Awarded bid)
40

Department of Corrections (13100)
Vendor Annual Spend ($) Savings ($) Best Practices Utilized
Multiple Vendors 545,134.90 852,957.88 61.01% Competitive bid for kitchen equipment (Average minus Awarded bid)
Multiple Vendors 841,246.93 125,049.81 12.94% Competitive bid for laundry equipment (Average minus Awarded bid)
Department of Education (26500)
Vendor Annual Spend ($) Savings ($) Best Practices Utilized
The College Board 64,000.00 8,097.96 11.23% Competitive bid (Daily rates x Estimated Usage)
41

Department of Human Services – OKDHS (83000)
Vendor Annual Spend ($) Savings ($) Best Practices Utilized
Armstrong Relocation 146,780.00 63,730.50 30% Competitive bid (Average minus Awarded bid)
Neher & Associates 21,000.00 1,500.00 Negotiated additional services, terms, lower costs.
Department of Mental Health & Substance Abuse Services (45200)
Vendor Annual Spend ($) Savings ($) Best Practices Utilized
Superior Linen 173,226.00 16,775.06 8.83% Competitive bid (Average minus Awarded bid)
Aramark 5,798.67 2,800.77 32.57% Competitive bid (Average minus Awarded bid)
42

Department of Public Safety (58500)
Vendor Annual Spend ($) Savings ($) Best Practices Utilized
Safe Boats International 556,125.69 30,896.89 GSA Contract
Department of Transportation 34500)
Vendor Annual Spend ($) Savings ($) Best Practices Utilized
Armstrong Relocation 6,253.47 325.71 5% Savings (Budget minus Awarded bid)
Various Vendors 850,947.50 16,201.95 2.42% Competitive bid (Average minus Awarded bid)
Department of Veterans Affairs (65000)
Vendor Annual Spend ($) Savings ($) Best Practices Utilized
Various Vendors 71,460.81 7,284.45 9% Competitive bid (Average minus Awarded bid)
43

Department of Wildlife Conservation (32000)
Vendor Annual Spend ($) Savings ($) Best Practices Utilized
Various Vendors 141,784.09 8,215.38 5.5% Competitive bid (Average minus Awarded bid)
Historical Society (35000)
Vendor Annual Spend ($) Savings ($) Best Practices Utilized
Get Imaging 223,223.50 6,511.00 2.83% Savings (Budget minus Awarded bid)
School of Science and Math (62900)
Vendor Annual Spend ($) Savings ($) Best Practices Utilized
G4S 140,000.00 3,191.16 2.23% Competitive bid (Average minus Awarded bid)
44

Central Purchasing Agency Savings Total Annual Spend ($) Total Savings ($) Total Percent Saved
5,259,638.51 1,380,078.19 26.24%
Supreme Court (67700)
Vendor Annual Spend ($) Savings ($) Best Practices Utilized
Cherwell 99,187.25 5,132.75 Negotiated terms, lower costs, additional training
Courthouse Technician 1,212,859.00 207,301.00 Negotiated terms, lower costs, additional training
45
46
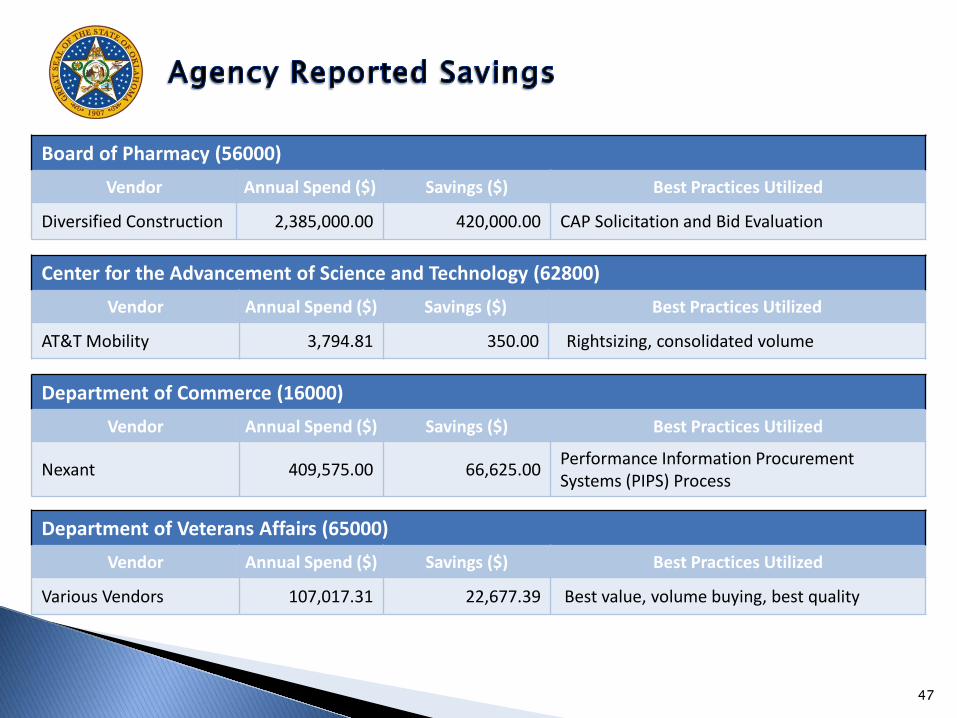
Center for the Advancement of Science and Technology (62800) Vendor Annual Spend ($) Savings ($) Best Practices Utilized
AT&T Mobility 3,794.81 350.00 Rightsizing, consolidated volume
Board of Pharmacy (56000) Vendor Annual Spend ($) Savings ($) Best Practices Utilized
Diversified Construction 2,385,000.00 420,000.00 CAP Solicitation and Bid Evaluation
Department of Commerce (16000) Vendor Annual Spend ($) Savings ($) Best Practices Utilized
Nexant 409,575.00 66,625.00 Performance Information Procurement Systems (PIPS) Process
Department of Veterans Affairs (65000) Vendor Annual Spend ($) Savings ($) Best Practices Utilized
Various Vendors 107,017.31 22,677.39 Best value, volume buying, best quality
47
48
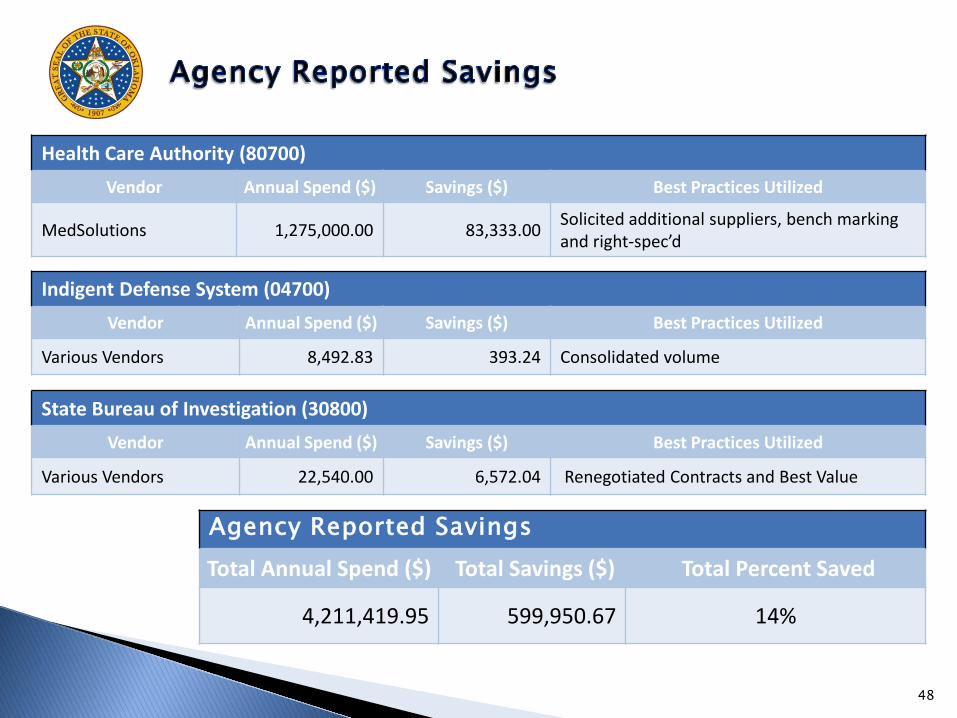
Health Care Authority (80700) Vendor Annual Spend ($) Savings ($) Best Practices Utilized
MedSolutions 1,275,000.00 83,333.00 Solicited additional suppliers, bench marking and right-spec’d
Indigent Defense System (04700) Vendor Annual Spend ($) Savings ($) Best Practices Utilized
Various Vendors 8,492.83 393.24 Consolidated volume
State Bureau of Investigation (30800) Vendor Annual Spend ($) Savings ($) Best Practices Utilized
Various Vendors 22,540.00 6,572.04 Renegotiated Contracts and Best Value
Agency Reported Savings Total Annual Spend ($) Total Savings ($) Total Percent Saved
4,211,419.95 599,950.67 14%

49
50
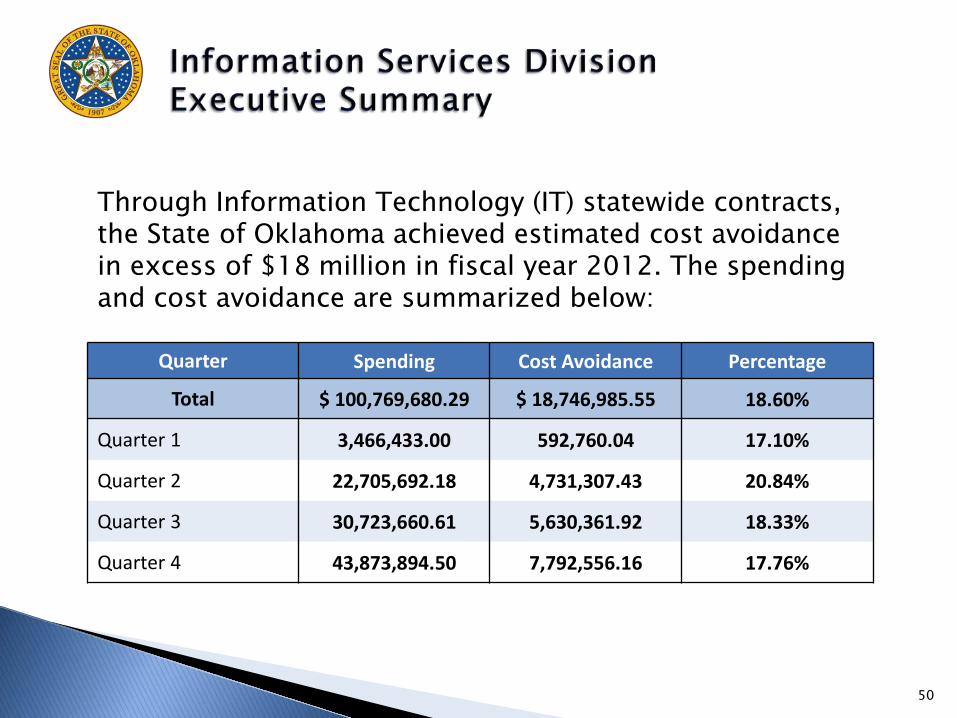
Through Information Technology (IT) statewide contracts, the State of Oklahoma achieved estimated cost avoidance in excess of $18 million in fiscal year 2012. The spending and cost avoidance are summarized below:
Quarter Spending Cost Avoidance Percentage
Total $ 100,769,680.29 $ 18,746,985.55 18.60%
Quarter 1 3,466,433.00 592,760.04 17.10%
Quarter 2 22,705,692.18 4,731,307.43 20.84%
Quarter 3 30,723,660.61 5,630,361.92 18.33%
Quarter 4 43,873,894.50 7,792,556.16 17.76%

Notes regarding Cost Avoidance Calculations
▶ Cost avoidance and percentages were based on the State discount price off of MSRP. An average discount was used if varying discounts were given on items in the contract.
Discount off MSRP was used because historical pricing and the average of responsive bids information was not readily available due to the transition of IT contracts from Central Purchasing to ISD. The information could not be gathered by the due date of this report.
IT Consulting contracts do not have a MSRP value so no cost avoidance was claimed on these agreements since the averages of responsive bids were not available for calculation.
Spend and cost avoidance for the first and second quarters are not comprehensive due to the above mentioned contract transition not finalizing until February 2012.
51
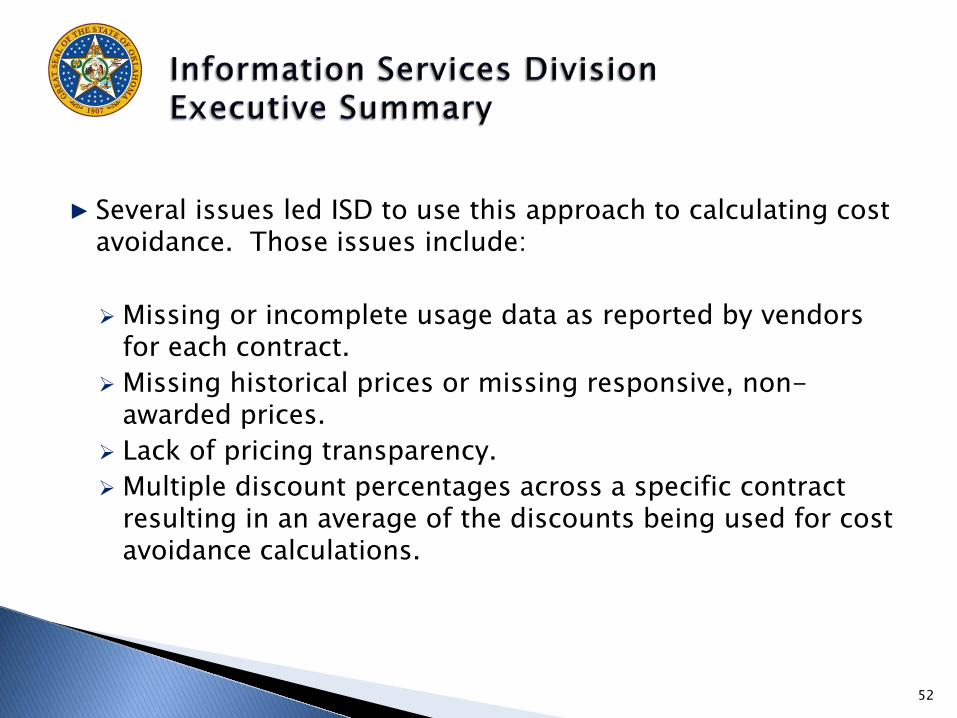
▶ Several issues led ISD to use this approach to calculating cost avoidance. Those issues include:
Missing or incomplete usage data as reported by vendors for each contract.
Missing historical prices or missing responsive, non-awarded prices.
Lack of pricing transparency. Multiple discount percentages across a specific contract
resulting in an average of the discounts being used for cost avoidance calculations.
52

53

SW Contract # Total Sales ($) % off MSRP Total Avoidance ($)
ITSW1001 Virus Protection 0.00 52% 0.00 ITSW1002 Desktop Management 4,229.00 43% 1,818.47 ITSW1006 Network Products & Services 22,959.00 38% 8,724.42 ITSW1007 EPPM 98,453.00 30% 29,535.90 ITSW1008 Mailroom Equipment (Pitney Bowes) 41,440.01 48% 19,891.20 ITSW1008 Mailroom Equipment (Neopost) 76,022.00 35% 26,607.70 ITSW1011 Oracle DB 1,997,141.14 45% 898,713.51 ITSW105 Wireless (AT&T) 1,871,665.63 25% 467,916.41 ITSW105 Wireless (Verizon) 492,627.52 23% 113,304.33 ITSW105 Wireless (Sprint) 2,514,233.87 25% 628,558.47 ITSW105 Wireless (US Cellular) 347,532.01 22% 76,457.04 ITSW105 Wireless (Pioneer) 175,987.49 0% 0.00 ITSW120 Microsoft LAR 14,764,116.86 17.1% 2,524,663.98 ITSW171 Copiers (Xerox) 2,032,583.15 21% 426,842.46 ITSW171 Copiers (Standley) 3,440,244.01 21% 722,451.24 ITSW206WSCA (HP) 4,113,667.19 15% 617,050.08 ITSW206WSCA (Dell) 23,636,386.98 15% 3,545,458.05
54

SW Contract Total Sales ($) % off MSRP Total Avoidance ($)
ITSW206WSCA (IBM) 423,123.29 15% 63,468.49 ITSW206WSCA (EMC) 1,138,871.00 40% 455,548.40 ITSW206WSCA (Panasonic/CDW) 5,752.15 20% 1,150.43 ITSW207 PC Standard 5,324,786.13 54% 2,875,384.51 SW221 Cisco (AT&T) 31,935.79 38% 12,135.60 SW221 Cisco (Presidio) 3,104,376.90 38% 1,179,663.22 SW221 Cisco (DTS) 6,886.00 38% 2,616.68 SW221 Extreme/Juniper (Peak) 447,069.69 35% 156,474.39 SW221 Extreme (Smart) 184,751.91 45% 83,138.36 SW221 Juniper (Presidio) 191,429.50 45% 86,143.28 ITSW0402 Public Safety 149,386.00 20% 29,877.20 ITSW0450 Telecom (AT&T) 17,149,222.00 12% 2,057,906.64 ITSW0450 Telecom (Cox) 12,197,745.76 10% 1,219,774.58 ITSW0450 Telecom (Presidio) 975,652.31 20% 195,130.46 ITSW0715 IT Consulting (Advancia) 1,002,358.82 0% 0.00 ITSW0715 IT Consulting (LSG) 16,257.00 0% 0.00 ITSW0715 IT Consulting (MY) 723,836.00 0% 0.00
55

SW Contract # Total Sales ($) % off MSRP Total Avoidance ($)
ITSW0715 IT Consulting (Rattan) 553,113.61 0% 0.00 ITSW0715 IT Consulting (LCI) 70,119.00 0% 0.00 ITSW0718 Printer Maint. 129,026.00 0% 0.00 ITSW0782 Imaging (BIS) 798,805.83 25% 199,701.46 ITSW0782 Imaging (BMI ImageNet) 13,868.34 25% 3,467.09 ITSW0782 Imaging (Get Imaging) 69,646.00 25% 17,411.50 ITSW790 Satellite Phones 2,990.45 0% 0.00 ITSW0804A Online Legal (West Group) 415,261.95 0% 0.00 ITSW0804A Online Legal (LexisNexis) 1,495.00 0% 0.00 ITSW0895 IT Advisory Services 12,625.00 0% 0.00 TOTALS 100,769,680.29 18.60% 18,746,985.55
56