tax avoidance and asymmetric cost behavior · asymmetric cost behavior (e.g., chen et al. 2012;...
TRANSCRIPT

Tax Avoidance and Asymmetric Cost Behavior
Shawn Xu
University of Wyoming
United States
Department of Accounting
Dept. 3275, 1000 E. University Ave.
Laramie, WY 82071-2000
United States
Phone: (307) 766-3919
Fax: (307) 766-4028
Kenneth Zheng
University of Wyoming
Department of Accounting
Dept. 3275, 1000 E. University Ave.
Laramie, WY 82071-2000
United States
Phone: (307) 766-3822
Fax: (307) 766-4028
June 2016
* We thank the research support provided by University of Wyoming College of Business.

Tax Avoidance and Asymmetric Cost Behavior
Abstract
This study examines the relationship between tax avoidance and asymmetric cost behavior. This
relationship arises due to direct economic benefits of cash savings from tax avoidance. On the one
hand, cash savings from tax avoidance may prompt managers to retain excess resources when
activity goes down. On the other hand, the cash savings may alleviate managers’ concerns about
adjustment costs due to expediting cost cuts in sales downturns. Using a large sample spanning the
1990-2013 period, we document a significantly negative relationship between tax avoidance,
proxied by cash effective tax rate, and sticky costs, suggesting tax avoidance is associated with
managers accelerating cost reductions in periods of declining activity. We also find that business
strategy plays a role in the relationship between tax avoidance and asymmetric cost behavior.
Specifically, relative to defenders, prospectors exhibit a more pronounced negative relation
between tax avoidance and cost stickiness. Further, we find that the negative relationship between
tax avoidance and asymmetric cost behavior is more pronounced for firms with more volatile cash
flows, consistent with cash savings from tax avoidance playing a more important role in managers’
cost reduction decisions for firms with more unpredictable cash flows. Our results are robust to
alternative tax avoidance measures, i.e., book-tax difference and permanent book-tax difference,
change in tax avoidance measures, or inclusion of main effects in the model. This study advances
the understanding of accounting researchers on the relationship between tax avoidance and
managers’ resource adjustment decisions.
Keywords: Tax avoidance, Asymmetric cost behavior, Resource adjustments, Business strategy.
1
Tax Avoidance and the Asymmetric Cost Behavior
1. Introduction
We examine the relation between tax avoidance and managers’ cost adjustment decisions.
Tax avoidance has a number of potential consequences. Extant studies have examined the relation
between tax avoidance and shareholder wealth (e.g., Desai and Dharmapala 2009; Kim et al. 2011).
Other studies have documented the impacts of a firm’s tax planning strategy and its related risk on
firm’s capital structure (e.g., Graham and Tucker 2006), cost of capital (e.g., Cook et al. 2015),
and cost of debt (e.g., Shevlin et al. 2013). Recent studies also find that aggressive tax planning
affects the transparency of a firm’s information environment (Balakrishnan et al. 2014) and is
related to aggressive financial reporting (Frank et al. 2009). While extant literature has primarily
focused on the impacts of tax avoidance on investors and creditors, this paper investigates whether
tax avoidance is associated with the firm’s resource allocation decisions, namely, asymmetric cost
behavior or “sticky costs.”
In their seminal work on cost behavior, Anderson, Banker and Janakiraman (2003)
(hereafter ABJ) find that on average costs increase more when activity rises than they decrease
when activity falls by an equivalent amount. They term this asymmetric cost behavior as “cost
stickiness,” which proposes an alternative view of cost behavior in contrast to the traditional
symmetric model where costs respond similarly to sales increases and sales decreases. The key to
understanding cost behavior resides in the fundamentals of cost behavior – resource adjustment
costs and deliberate managerial decisions (Banker and Byzalov 2014). When sales decrease,
managers must weigh the benefits from cutting unused resources against both current and future
resource adjustment costs, such as severance payments, disposal costs of capital equipment, and

2
subsequent hiring and training costs of new labor. Such adjustment costs will be particularly high
if the current sales downturn is temporary. Therefore, managers are less likely to cut unused
resources when the adjustment costs are high, giving rise to sticky costs.
ABJ and following studies have documented a variety of factors that affect asymmetric
cost behavior. For example, ABJ find that asset- and employee-intensive firms have a higher
degree of cost stickiness because these firms require more assets and employees to support their
operations. Recent studies have also documented that certain managerial incentives may influence
asymmetric cost behavior (e.g., Chen et al. 2012; Kama and Weiss 2013).
In this paper, we propose that tax avoidance is related to asymmetric cost behavior because
tax avoidance reduces a firm’s tax liability and improve its overall cash flow. On the one hand,
cash savings from tax avoidance may prompt managers to retain excess resources when activity
falls, leading to a higher degree of cost stickiness. On the other hand, the cash savings may alleviate
managers’ concerns about adjustment costs due to expediting cost cuts in sales downturns.
Consequently, managers may be more willing to bear the current and potential adjustment costs as
a result of cutting excess resources when activity falls, exhibiting a lower degree of cost stickiness.
To test our prediction, we follow prior literature (e.g., Frank et al. 2009; Cook et al. 2015)
and use cash effective tax rate (CETR) as our primary measure of tax avoidance. We adopt the
ABJ framework of asymmetric cost behavior and use SG&A costs to examine the cost behavior.
Controlling for known economic factors that affect cost stickiness, we find that when sales fall,
managers cut costs more aggressively if the firm engages in a higher level of tax avoidance. In
other words, tax avoidance reduces cost asymmetry.
We extend our analyses to investigate potential underlying factors that affect the negative
relation between tax avoidance and asymmetric cost behavior. First, we examine the role of a

3
firm’s business strategy in moderating the negative relation between tax avoidance and asymmetric
cost behavior. Recent literature has found that a firm’s strategic position plays a significant role in
determining both its tax avoidance strategy and its cost behavior. Higgins et al. (2015) document
that firms following an innovation strategy (i.e., prospectors) have higher levels of tax avoidance
than firms focusing on a cost leadership strategy (i.e., defenders) because relative to defenders,
prospectors possess more tax avoidance opportunities and are also more willing to tolerate the
risks associated with tax avoidance activities. Meanwhile, Banker, Flasher, and Zhang (2013) find
that prospectors exhibit a higher degree of cost stickiness because prospectors face higher
adjustment costs than defenders due to prospectors’ significant investments tailored to their
strategic needs. We find that the negative relation between tax avoidance and cost stickiness is
more pronounced for prospectors than for defenders, suggesting prospectors rely more heavily on
cash savings from tax avoidance in their resource reduction decisions.1
Second, we examine whether cash flow volatility influences the negative relationship
between tax avoidance and cost stickiness. The effect of cash savings from tax avoidance on
managers’ cost reduction decisions is likely more pronounced for firms with more unpredictable
cash flows from operations. For such firms, because operating cash flow is less reliable, managers
are likely to rely more on cash saving from tax avoidance to make resource allocation decisions.
Thus, tax savings from tax avoidance can better help managers achieve resource adjustment goals.
Therefore, we expect the relationship between tax avoidance and cost stickiness to be more
pronounced for firms with higher levels of cash flow volatility. We find that firms with higher cash
flow volatility exhibit a more negative relationship between tax avoidance and cost asymmetry.
1 Although seemingly different from the Banker, Flasher, and Zhang (2013) finding of generally stickier cost
behavior for prospector firms, our analysis and finding focus on the relationship between tax avoidance and cost
adjustment decisions and how business strategy affects this relation.

4
Further, we investigate two alternative explanations to our main finding. First, we examine
whether the negative relationship between CETR and cost stickiness is driven by managerial
financial reporting incentives. Prior studies find that when managers are faced with incentives to
avoid losses or earnings decreases, they will expedite resource cuts in order to increase earnings,
which diminishes sticky costs (Kama and Weiss 2013; Dierynck et al. 2012). In order to test
whether the negative relationship between tax avoidance (i.e., low levels of CETR) and cost
stickiness in our study is driven by firms meeting these earnings benchmarks, we partition our
sample based on whether incentives to avoid losses or earnings decreases exist. Results show that
our results are not concentrated in the subsample of firms with earnings targets incentives.
Next, we investigate whether the magnitude of the negative relationship between tax
avoidance and cost stickiness is affected by the severity of tax avoidance. We find that this negative
relationship becomes more significant as CETR increases. This evidence suggests that as tax
avoidance increases, financial uncertainty with future cash flows increases. Therefore, firms are
more likely to decrease sticky costs in order to improve their operational flexibility.
In robustness tests, we use book-tax difference (BTD) and permanent book-tax difference
(PERMDIFF) as alternative measures of tax avoidance. Results are qualitatively similar to those
in our main finding. Also, to alleviate endogeneity concerns, we replace tax avoidance level
measures with corresponding change measures and continue to find a negative relation between
change in tax avoidance and cost stickiness. Finally, our results are not sensitive to including main
effects of all interaction variables in the model to mitigate potential correlated omitted variables
problem.
This study makes several contributions to the literature. First, we provide direct evidence
of the role tax avoidance plays in shaping a real corporate decision, namely, asymmetric cost
5
behavior. Hanlon and Heitzman (2010) call for more research on the interactive effects of taxes
and financial accounting or managerial accounting on real corporate decisions. To our knowledge,
this is the first study to directly associate tax avoidance and corporate cost allocation decisions.
Our findings enrich the understanding of accounting researchers on how tax avoidance influences
firms’ cost allocation decisions.
Second, we add to the asymmetric cost behavior literature by documenting that tax
avoidance is negatively associated with cost stickiness. Prior literature has mainly focused on
explaining asymmetric cost behavior in the framework of adjustment costs or managerial
incentives (e.g., ABJ 2003; Banker, Byzalov, and Chen 2013; Chen et al. 2012; Dierynck et al.
2012; Kama and Weiss 2013). Our study extends this line of literature by demonstrating that
corporate tax avoidance may also play a significant role in shaping the firm’s cost behavior due to
cash savings generated through tax avoidance.
Finally, this study contributes to an emerging stream of research papers that integrates
research topics from different disciplines (e.g., Chen et al. 2012; Kama and Weiss 2013; Banker
et al. 2015; Chen et al. 2015; Higgins et al. 2015). Our findings advance our understanding on the
effect of tax avoidance on firms’ resource adjustment decisions.
The reminder of this paper is organized as follows. Section 2 reviews literature and
develops hypotheses. Section 3 describes our research design. Section 4 discusses our sample and
descriptive statistics. Section 5 presents empirical results and section 6 concludes.
2. Literature Review and Hypotheses Development
2.1 Consequences of tax avoidance
Following Hanlon and Heitzman (2010), we define tax avoidance broadly as “the reduction
of explicit taxes” (Hanlon and Heitzman 2010, p. 137). With respect to consequences of tax

6
avoidance, the literature has largely focused on its impacts on investors and creditors. Below, we
provide a brief review of this literature.
Traditionally, it is assumed that managers undertake tax avoidance activities to reduce
corporate tax obligations. Thus, from the investors’ perspective, tax avoidance is value enhancing,
and managers should be motivated to engage in such activities. In contrast, recent studies propose
alternative views suggesting that investors might perceive aggressive tax practices as value
decreasing due to the impact of tax aggressiveness on regulatory costs (Hanlon and Slemord 2009;
Cook et al. 2015; Goh et al. 2016), corporate transparency (e.g., Balakrishnan et al. 2014), and
agency conflicts (e.g., Desai and Dharmapala 2008). The two alternative perspectives on tax
avoidance have prompted several recent studies to investigate the stock market consequences of
tax avoidance activities. However, empirical findings so far are inconclusive (e.g., Desai and
Dharmapala 2009; Frank et al. 2009; Minnick et al. 2010; Koester 2011; Kim et al. 2011)
In addition, an emerging body of studies investigates the relation between tax avoidance
and cost of capital. Goh et al. (2013) find that less risky forms of tax avoidance are associated with
a lower cost of equity capital, consistent with their expectations that cash savings from tax
avoidance exceed the costs associated with increased information uncertainties. However, Cook
et al. (2015) document a nonlinear relation between tax avoidance and cost of capital. They find
that the relation becomes positive at higher levels of tax avoidance, implying an increased
uncertainty with the tax savings. Consistent with this argument, Hutchens and Rego (2012) find a
positive association between tax reserves, a riskier form of tax avoidance, and cost of equity capital.
This finding provides further evidence consistent with the notion that aggressive tax avoidance
increases a firm’s tax risk.

7
With respect to the impact of tax avoidance on firms’ capital structure and creditors, recent
studies have provided evidence in support of the traditional argument that tax avoidance and tax
sheltering are a substitute for interest deductions from debt financing (e.g., Graham and Tucker
2006; Richardson et al. 2014). Moreover, Shevlin et al. (2013) document that tax avoidance is
associated with higher bond offering yields due to the uncertainty of future cash flow and more
opaque reporting associated with higher levels of tax avoidance. Their argument regarding the
negative effect of tax avoidance is in line with Cook et al. (2015).
In addition to the literature on tax avoidance, another line of literature examines the effects
of taxes on various corporate decisions. Hanlon and Heitzman (2010) summarize three main areas
in their review of the literature – investment, capital structure, and organizational form. However,
few studies investigate the effects of taxes on corporate decisions other than those discussed above.
Hanlon and Heitzman (2010) call for more research to investigate the interactive effects of taxes
and financial accounting or managerial accounting on real corporate decisions. Our study fills the
gap by examining the impact of tax avoidance on corporate cost decisions.
2.2 Asymmetric cost behavior
Noreen and Soderstrom (1997) use data from hospitals located in the state of Washington
to investigate asymmetric cost behavior. Specifically, they find that costs respond to increases in
activity more rapidly than to decreases in activity. Using a large data set consisting of 7,629 firms
over 20 years, Anderson et al. (2003) document that on average selling, general, and administrative
(SG&A) costs increase by 0.55% for a 1% increase in sales but decrease by only 0.35% for a 1%
decrease in sales. They term this phenomenon “cost stickiness.” They argue that managers exercise
discretion and make deliberate cost adjustment decisions as to whether certain costs should be
retained or eliminated when demand falls.

8
ABJ’s cost stickiness is built on the rationale that firms must incur adjustments costs to
reduce committed resources during sales downturns and subsequently replace those resources
when demand is later restored. These adjustment costs include, but are not limited to, severance
pay for terminated employees, search and training costs for hiring employees in a later period, and
decreased employee morale. Cutting slack resources too rapidly when sales fall is likely to result
in higher adjustment costs if the decrease in demand is temporary. If these adjustment costs exceed
the costs of maintaining excess resources, then managers will likely keep the excess resources
instead of cutting them in periods of sales decreases.
Subsequent research extends this line of literature by building on ABJ’s fundamental
insight on asymmetric cost behavior. Studies have investigated cost asymmetry from the
adjustment cost perspective (Banker, Byzalov, and Chen 2013; Balakrishnan, Petersen, and
Soderstrom 2004), managerial expectations perspective (Banker, Byzalov, Ciftci, and Mashruwala
2014; Chen, Kama, and Lehavy 2015), agency problem perspective (Chen, Lu, and Sougiannis
2012), and economic incentives perspective (Kama and Weiss 2013; Dierynck, Landsman, and
Renders 2012). For example, Banker, Byzalov, and Chen (2013) use employment protection
legislation in different countries as a proxy for labor adjustment costs and find that the degree of
cost stickiness varies with the strictness of the country-level employment protection legislation
provisions.
Chen, Lu, and Sougiannia (2012) document that cost asymmetry increases in managers’
empire building incentives. Kama and Weiss (2013) find that managers expedite resource cuts in
periods of sales decreases in the presence of earnings targets in order to achieve cost reductions.
Similarly, Dierynck, Landman, and Renders (2012) document that managers of firms that report a
small profit conduct earnings management by firing employees who are relatively low cost to fire.

9
Because cost is a direct determinant of earnings, Banker and Byzalov (2014) call for research that
examines the implications of asymmetric cost behavior for topics at the intersection of both cost
and financial accounting.
2.3 Tax avoidance and asymmetric cost behavior
We propose that tax avoidance may play a significant role in asymmetric cost behavior due
to cash savings from tax avoidance. There is a countervailing effect of tax avoidance on firms’
cost allocation decisions. On the one hand, cash savings from tax avoidance may prompt managers
to retain excess resources when activity falls. ABJ find that on average firms tend to retain some
levels of excess resources in periods of sales decreases. In this scenario, cash savings from tax
avoidance will help the firm cover part of the costs of maintaining excess resources. If this is the
case, then we should observe a positive relationship between tax avoidance and cost stickiness.
On the other hand, cash savings from tax avoidance may alleviate managers’ concerns
about adjustment costs if they decide to cut unused resources when activity decreases. In this case,
the cash savings will help the firm cover part of the adjustment costs when demand is subsequently
restored. Thus, when activity falls, managers may choose to cut unutilized resources more rapidly
because of the financial flexibility resulting from tax avoidance, exhibiting in a negative relation
between tax avoidance and asymmetric cost behavior. Therefore, it is an empirical question as to
the direction of the relationship between tax avoidance and asymmetric cost behavior.2
Based on the above discussion, we state our main hypothesis in the null form:
H1: Tax avoidance is not related to asymmetric cost behavior.
2 We examine the association between tax avoidance and asymmetric cost behavior. We acknowledge that firms’
cost adjustment decisions may have an impact on the level of tax avoidance using CETR. Specifically, higher levels
of cost stickiness produce higher costs and lower operating income, potentially leading to lower income taxes (i.e.,
higher levels of tax avoidance). Thus, there is a mechanically positive association between cost stickiness and tax
avoidance.

10
H1 is built on the notion that both resource adjustment costs and economic benefits from
tax avoidance are significant. To support this argument, it is plausible to examine the effect of
resource adjustment costs and economic benefits from tax avoidance on the relationship between
tax avoidance and asymmetric cost behavior. If the adjustment cost concern is valid, then we
expect to find the magnitude of the association between tax avoidance and asymmetric cost
behavior to be different among firms faced with different levels of adjustment costs. If the
economic benefits from tax avoidance is valid, then we expect firms reaping more economic
benefits from tax avoidance to exhibit a more pronounced relationship between tax avoidance and
cost asymmetry. In order to further explore the effects of resource adjustment costs and economic
benefits from tax avoidance, we first look into a firm’s strategic environment. We then turn to the
impact of operating uncertainty on the main relationship.
2.3.1 Impact of business strategy on the relation between tax avoidance and sticky costs
A firm’s strategic position influences a broad range of its corporate decision making.
Recent literature has documented the impacts of business strategy on both tax avoidance and cost
behavior. Specifically, Higgins et al. (2015) find that firms following a cost leadership strategy
(i.e., defenders) exhibit lower level of tax avoidance than firms following an innovation strategy
(i.e., prospectors). They argue that prospectors have more tax-planning opportunities due to their
aggressive pursuit of new products and geographic markets. Moreover, the evidence is also
consistent with prospectors’ preference for risky projects relative to defenders as higher levels of
tax avoidance increase the uncertainty of future cash flow. Meanwhile, Banker, Flasher, and Zhang
(2013) argue that due to their pursuit of new products and technologies, prospectors3 invest heavily
in specialized resources, making it difficult to cut them when sales decrease (i.e., high potential
3 Banker, Flasher, and Zhang (2013) use “differentiator” for prospector and “cost leader” for defender. However, the
measurements are the same as those in Higgins et al. (2015).

11
adjustment costs). However, because defenders focus on operational excellence through efficient
operations, they are more flexible in cutting resources during downturns. Banker, Flasher, and
Zhang (2013) provide confirming evidence that prospectors exhibit greater cost stickiness than
defenders.
At first glance, the two studies cited above imply a positive relation between tax avoidance
and sticky costs for firms following an innovation strategy. However, to the extent that resource
adjustment costs play a role in determining cost stickiness for prospectors, engaging in high levels
of tax avoidance provides prospectors the financial leeway to adjust slack resources to a greater
extent. Further, prospectors likely operate with many specialized assets and have less flexibility to
adjust resources due to their operational structure. Thus, the adjustment cost concerns are likely
greater for prospectors. Consequently, if tax avoidance alleviates managers’ concerns about
adjustment costs, this effect will be more pronounced for prospectors. Accordingly, we propose
the following hypothesis:
H1a: The relation between tax avoidance and asymmetric cost behavior is more
pronounced for prospectors than for defenders.
2.3.2 Impact of cash flow uncertainty on the relation between tax avoidance and sticky costs
The other underlying assumption about the relationship between tax avoidance and sticky
costs is that the economic benefits of cash savings from tax avoidance are significant. For cash
savings from tax avoidance to play a more important role in managers’ cost adjustment decisions,
the company should have few other sources of cash to rely on. Therefore, we predict that cash
savings from tax avoidance becomes more significant in supporting managers’ resource cutting or
retention decisions if a firm faces more volatile cash flows from other sources. We propose the
following hypothesis:

12
H1b: The relation between tax avoidance and the asymmetric cost behavior is more
pronounced for firms with more volatile cash flows.
3. Research Design
3.1 Measures of tax avoidance
Our primary measure of tax avoidance is cash effective tax rate (CETR). Prior studies
indicate that CETR captures all tax activities that reduce cash tax paid during year (e.g., Dyreng et
al. 2008; Higgins et al. 2015). CETR is calculated as:
CETR = -1 × TXPD / (PI – SPI) (1)
where TXPD is cash tax paid; SPI is special items. We multiply the original rate by -1 so that tax
avoidance increases as the measure increases. We eliminate all observations with negative book
income and also restrict the value of this variable to fall between 0 and -1 (e.g., Higgins et al. 2015;
Cook et al. 2015).
3.2 Asymmetric cost behavior model
We extend the ABJ cost stickiness framework and investigate the impact of tax avoidance
on asymmetric cost behavior. A number of studies (Anderson et al. 2003; Chen et al. 2012; Banker
et al. 2014) examine cost asymmetry using a regression model with log change of SG&A costs as
the dependent variable and log change of sales as well as log change of sales multiplied by a
dummy variable for sales decrease as independent variables. Specifically, the estimated base
regression model in ABJ is
ΔlnSG&Ait = β0 + β1ΔlnSALEit + β2DECit × ΔlnSALEit + uit (2)
where ΔlnSG&Ait is the log change in SG&A costs, computed as log(SG&Ai,t/SG&Ai,t-1),
ΔlnSALEit is the log change in sales revenues, defined as log(SALEi,t/SALEi,t-1), and DECit is a
dummy variable which equals one if the firm experiences a sales decrease in year t and zero

13
otherwise. uit is an error term that has a zero mean and is independent of the explanatory variables.
In the base ABJ model (2), the coefficient β1 measures the percentage change in SG&A costs for
a 1% increase in sales, β2 measures the differential cost response to sales decrease relative to sales
increase, and the sum of β1 and β2 measures the percentage change in SG&A costs for a 1%
decrease in sales. A positive β1 and a negative β2 suggest that the decrease in SG&A costs in
response to sales decreases is less pronounced than the increase in SG&A costs in response to sales
increases, i.e., SG&A costs are sticky. Extant literature has focused on the sign of β2 to infer how
“sticky” or “anti-sticky” the cost is.
Following Banker, Byzalov, and Chen (2013), we augment the base ABJ model (2) by
using a hierarchical linear model in which the cost behavior derived from a level-1 model is defined
as a function of level-2 explanatory and control variables. Accordingly, we specify the slope
coefficients β1 and β2 in model (2) as
β1 = γ1 + γ2TAXAVOIDit + γ3ARETit + γ4EMPINTit + γ5ASINTit + ν1,i,t (2a)
β2 = γ6 + γ7TAXAVOIDit + γ8ARETit + γ9EMPINTit + γ10ASINTit + γ11SUC_DECit + ν2,i,t (2b)
where TAXAVOID is measured by CETR with a value between -1 and 0. ARET is the raw buy and
hold stock return in the year prior to the fiscal year end date. The effect of annual return ARET on
cost asymmetry is unclear. On the one hand, good stock performance may indicate that a decline
in demand is only temporary, thereby increasing managers’ expectation about future demand and
resulting in higher cost stickiness. On the other hand, firms with good stock performance may
expedite cost cuts in periods of sales decreases because they may be under greater pressure to
maintain the stock price run-up, hence reducing cost stickiness. EMPINT is computed as the
logarithm of the ratio of number of employees to sales revenue, ASINT is calculated as the
logarithm of the ratio of total assets to sales revenue, and SUC_DEC is a dummy variable that
14
captures whether there was a decrease in sales revenue in the previous year and takes the value of
one if revenue in year t-1 was less than that in year t-2, and zero otherwise. ν1,i,t and ν2,i,t are firm-
level random effects. The firm-level random effects capture the differences in cost behavior across
firms that are not accounted for by the explanatory variables in the model. By construction, ν1,i,t
and ν2,i,t have mean zero and are independent of the explanatory variables.
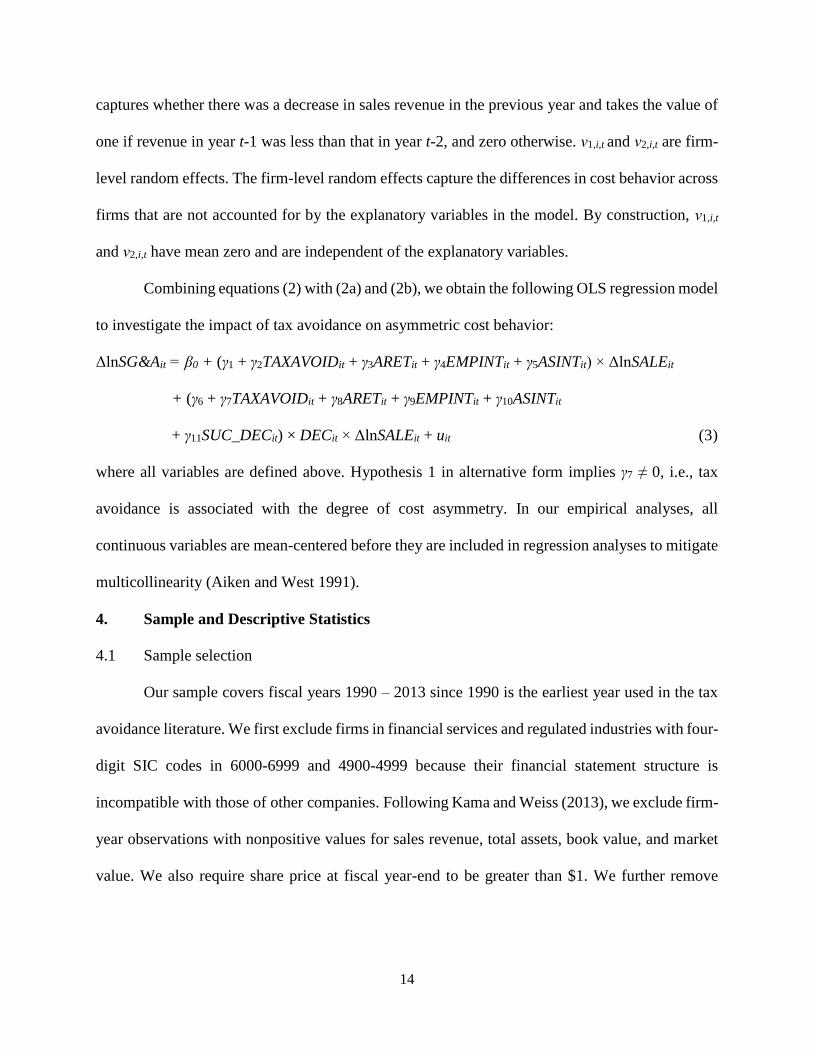
Combining equations (2) with (2a) and (2b), we obtain the following OLS regression model
to investigate the impact of tax avoidance on asymmetric cost behavior:
ΔlnSG&Ait = β0 + (γ1 + γ2TAXAVOIDit + γ3ARETit + γ4EMPINTit + γ5ASINTit) × ΔlnSALEit
+ (γ6 + γ7TAXAVOIDit + γ8ARETit + γ9EMPINTit + γ10ASINTit
+ γ11SUC_DECit) × DECit × ΔlnSALEit + uit (3)
where all variables are defined above. Hypothesis 1 in alternative form implies γ7 ≠ 0, i.e., tax
avoidance is associated with the degree of cost asymmetry. In our empirical analyses, all
continuous variables are mean-centered before they are included in regression analyses to mitigate
multicollinearity (Aiken and West 1991).
4. Sample and Descriptive Statistics
4.1 Sample selection
Our sample covers fiscal years 1990 – 2013 since 1990 is the earliest year used in the tax
avoidance literature. We first exclude firms in financial services and regulated industries with four-
digit SIC codes in 6000-6999 and 4900-4999 because their financial statement structure is
incompatible with those of other companies. Following Kama and Weiss (2013), we exclude firm-
year observations with nonpositive values for sales revenue, total assets, book value, and market
value. We also require share price at fiscal year-end to be greater than $1. We further remove

15
observations where sales revenue is smaller than SG&A costs or where requisite data for two
preceding years are missing.
Next, we obtain daily stock return data from CRSP and compute buy and hold annual stock
return with the daily return data over the 365 days preceding the fiscal year end date. We require
the number of trading days to be at least 250 in this 365-day period. Similar to other studies in the
asymmetric cost behavior literature, we trim all continuous variables at the 0.5% and 99.5%
percentiles to mitigate the effect of outliers. The sample size varies for each analysis due to the
specific measures used in each test.
4.2 Descriptive statistics
Table 1 displays the summary statistics of the main variables of interest for our sample.
Specifically, CETR has a mean (median) of -0.276 (-0.262) and a standard deviation of 0.215. The
firms in the sample has mean (median) annual sales of $2,289 million ($336 million) and mean
(median) SG&A costs of $449 million (66 million). A firm experiences a sales decrease in 20%
of all instances. The mean annual buy and hold return of the stocks in the sample is 22% percent
and the median firm achieves an annual return of 11%. Overall, the summary statistics in this study
are largely consistent with those documented in previous literature.
[Insert Table 1 about here]
5. Empirical Results
5.1 Effect of tax avoidance on asymmetric cost behavior
We estimate equation (3) to test the impact of tax avoidance on asymmetric cost behavior.
Table 2 presents the results. The coefficient on DECit×ΔlnSALEit×CETRit is 0.466 (t = 9.42),
suggesting all else equal, as the degree of tax avoidance increases, SG&A costs decrease more
rapidly relative to firms that engage in less tax avoidance. This result is consistent with the notion

16
that as a firm increases its tax avoidance activities, the increased cash savings from tax avoidance
reduces managers’ concerns regarding resources adjustment costs, allowing the firm to cut
unutilized resources more quickly in response to a sales decrease.
[Insert Table 2 about here]
The coefficients on control variables are largely consistent with those in prior studies (e.g.,
Chen et al. 2012). For instance, examining the coefficients on three-way interaction variables, the
coefficient on the interaction variable with ARET is positive, that on the interaction variable with
EMPINT is positive, and that on the interaction variable with ASINT is negative. The three-way
interaction variable with SUC_DEC is positive, consistent with the notion in ABJ that if a firm
experiences sales decreases in two years consecutively, then managers are more likely to expedite
the resource cost cuts because they are more likely to deem the decrease in demand permanent.
5.2 Effect of business strategy on the relation between tax avoidance and asymmetric cost
behavior
H1a predicts that the relation between tax avoidance and asymmetric cost behavior is more
pronounced for prospectors than for defenders. Following Miles and Snow (1978, 2003) and
Higgins et al. (2015), we categorize firms into three groups – defenders, analyzers, and prospectors
– based on a discrete STRATEGY composite measure computed using the following variables: (i)
the ratio of research and development to sales, (ii) the ratio of employees to sales, (iii) a historical
growth measure using one-year percentage change in sales, (iv) the ratio of marketing (SG&A) to
sales, (v) employee fluctuations (standard deviation of total employees), and (vi) capital intensity
calculated as net PP&E scaled by total assets. Each of the six measures is intended to capture
different elements of a firm’s business strategy.
17
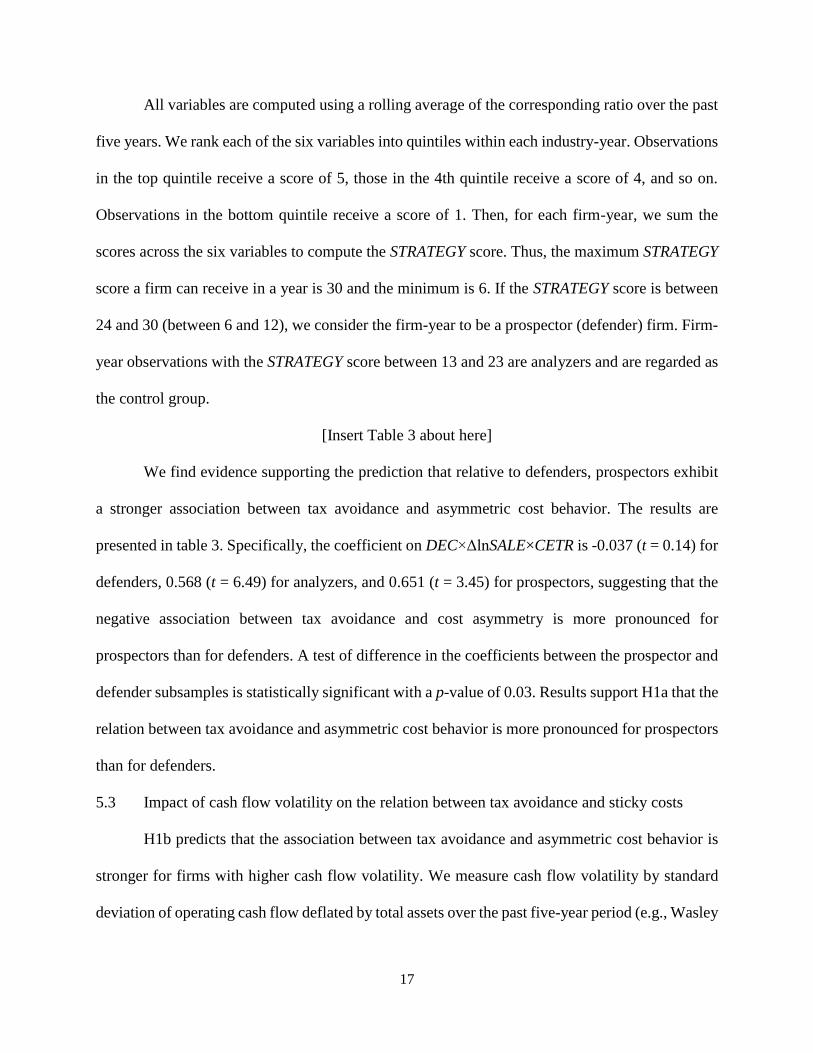
All variables are computed using a rolling average of the corresponding ratio over the past
five years. We rank each of the six variables into quintiles within each industry-year. Observations
in the top quintile receive a score of 5, those in the 4th quintile receive a score of 4, and so on.
Observations in the bottom quintile receive a score of 1. Then, for each firm-year, we sum the
scores across the six variables to compute the STRATEGY score. Thus, the maximum STRATEGY
score a firm can receive in a year is 30 and the minimum is 6. If the STRATEGY score is between
24 and 30 (between 6 and 12), we consider the firm-year to be a prospector (defender) firm. Firm-
year observations with the STRATEGY score between 13 and 23 are analyzers and are regarded as
the control group.
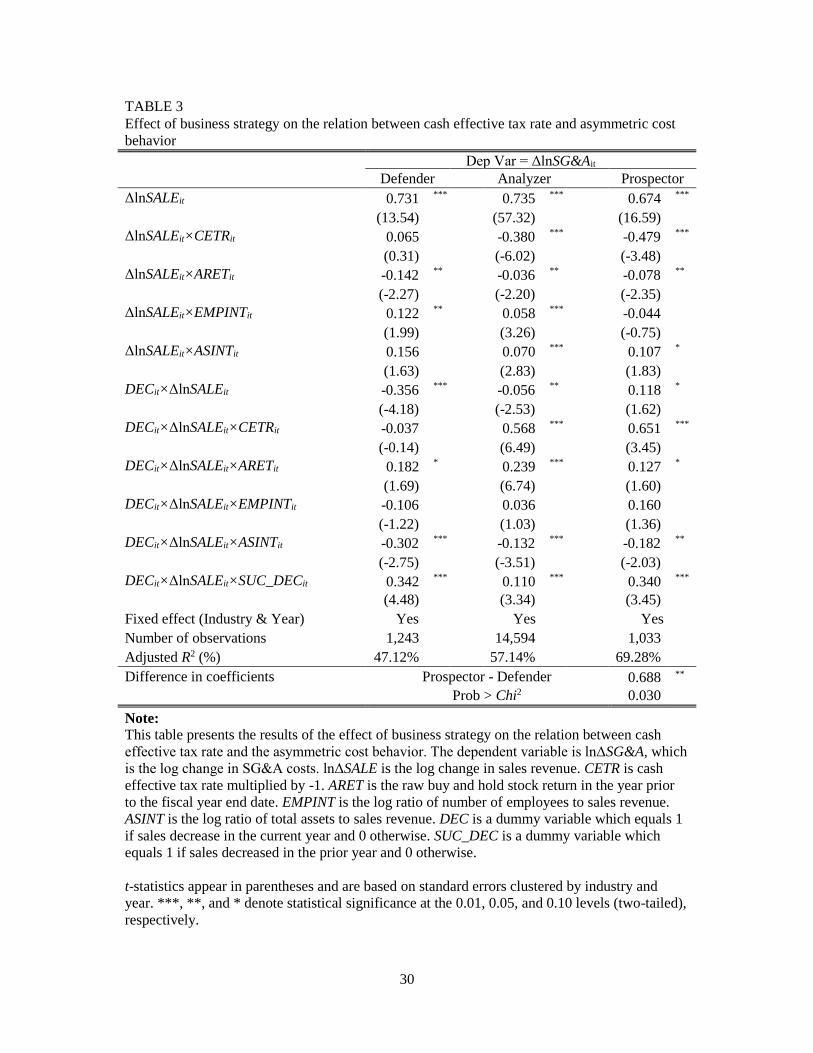
[Insert Table 3 about here]
We find evidence supporting the prediction that relative to defenders, prospectors exhibit
a stronger association between tax avoidance and asymmetric cost behavior. The results are
presented in table 3. Specifically, the coefficient on DEC×ΔlnSALE×CETR is -0.037 (t = 0.14) for
defenders, 0.568 (t = 6.49) for analyzers, and 0.651 (t = 3.45) for prospectors, suggesting that the
negative association between tax avoidance and cost asymmetry is more pronounced for
prospectors than for defenders. A test of difference in the coefficients between the prospector and
defender subsamples is statistically significant with a p-value of 0.03. Results support H1a that the
relation between tax avoidance and asymmetric cost behavior is more pronounced for prospectors
than for defenders.
5.3 Impact of cash flow volatility on the relation between tax avoidance and sticky costs
H1b predicts that the association between tax avoidance and asymmetric cost behavior is
stronger for firms with higher cash flow volatility. We measure cash flow volatility by standard
deviation of operating cash flow deflated by total assets over the past five-year period (e.g., Wasley

18
and Wu 2006). We then partition the sample into three groups and correspondingly name them as
based on the standard deviation measure.
[Insert Table 4 about here]
Table 4 presents the results. Comparing the low cash flow volatility group (low tercile)
with the high volatility group (high tercile), we find that the coefficient on DEC×ΔlnSALE×CETR
increases from 0.321 (t = 2.79) in the low volatility group to 0.735 (t = 9.53) in the high volatility
group. A test of difference in coefficients of this three-way interaction variable between the high
tercile and low tercile groups is significant at less than 1% level. This result is consistent with the
expectation that compared to firms with low cash flow volatility, firms with high cash flow
volatility exhibit a more pronounced relationship between tax avoidance and asymmetric cost
behavior, presumably because firms with high cash flow volatility rely more on cash savings from
tax avoidance in resource adjustments.
5.4 Additional analyses
5.4.1 Effect of incentives to avoid losses or earnings decreases on the relationship between tax
avoidance and asymmetric cost behavior
Recent studies have documented that managerial incentives to avoid losses or earnings
decreases diminishes cost stickiness (e.g., Dierynck, Landman, and Renders 2012; Kama and
Weiss 2013). For example, Kama and Weiss (2013) find that when managers face reporting
incentives to avoid losses or earnings decreases, they accelerate the downward adjustment of
unused resources when sales decrease in order to report higher income, resulting in a lower degree
of sticky costs. Because the raw CETR (i.e., before it is multiplied by -1) is a ratio of cash paid for
taxes to same-period pre-tax financial statement income, variations in the ratio can reflect either
tax avoidance activities through the numerator, or earnings management activities through the

19
denominator (Guenther, Krull and Williams 2014; Lev and Nissim 2004). In other words, a lower
level of the raw CETR (i.e., a higher level of tax avoidance) can be a result of more tax avoidance,
or a result of earnings inflation, or both. In fact, Guenther, Krull and Williams (2014) find that
CETRs are associated with both tax avoidance and earnings quality.
The above discussion suggests there exists a negative relation between tax avoidance and
cost stickiness due to managerial financial reporting incentives. On the one hand, managers reduce
costs aggressively as sales decrease to inflate earnings. On the other hand, the inflated earnings
drives down the raw CETR ratio (i.e., higher tax avoidance) even though the firm may not change
its tax avoidance activities at all. To the extent that firms that avoid losses or decreasing earnings
may manifest low CETRs, we test whether incentives to meet earnings targets drive our results.
Following Kama and Weiss (2012), we first partition our sample into two groups. The
“avoid loss” group contains all firms having annual earnings deflated by market value of equity at
prior year end being in the interval (0, 0.01). All other firms belong to the other group. We then
compare the coefficients on our interaction variable of interest between the two groups. If the
negative association between tax avoidance and asymmetric cost behavior in our study is driven
by managerial incentives to avoid losses, then we would observe the coefficient on
DEC×ΔlnSALE×CETR for the “avoid loss” group to be significantly higher in magnitude than the
coefficient for the benchmark group. Results presented in the first two columns of table 5 show
that the coefficient is 0.438 (0.474) for the “avoid loss” group (benchmark group), significant at
the 1% level. However, a test of difference between the two coefficient is not significant,
suggesting that the negative relationship between tax avoidance and asymmetric cost behavior is
not concentrated in the “avoid loss” group.
[Insert Table 5 about here]

20
Similarly, we test whether managers’ incentives to avoid earnings decreases drive out
results. Specifically, we classify a firm as having an incentive to avoid earnings decreases if the
change in annual earnings deflated by market value of equity at prior year end is in the interval (0,
0.01). We classify these firms in the “avoid earnings decrease” group and include all other firms
in the benchmark group. Results are shown in the last two columns of table 5. We find that the
coefficient on DEC×ΔlnSALE×CETR for the “avoid earnings decrease” group is negative and
insignificant, suggesting firms that have incentives to avoid earnings decreases exhibit no
association between tax avoidance and asymmetric cost behavior. In contrast, firms that do not
have incentives to avoid earnings decreases show a significantly positive coefficient on
DEC×ΔlnSALE×CETR. A test of difference in coefficients between the “avoid earnings decrease”
group and benchmark group is statistically significant, but in the wrong direction. Overall, the
empirical evidence does not support the possibility that the negative relationship between tax
avoidance and cost stickiness in our study is driven by managerial financial reporting incentives.
5.4.2 Tax avoidance, uncertainty, and asymmetric cost behavior
Cook et al. (2015) argue that investors’ perceptions of tax avoidance depend on the distance
between the observed level and the expected level of avoidance. As tax avoidance increases,
approaching the investors’ expected level, the cost of capital will decrease. However, incremental
tax avoidance beyond the optimal level may increase the uncertainty regarding future cash tax
savings due to the increased likelihood of a tax audit. Investors thus will perceive this uncertainty
unfavorable, increasing cost of capital. Accordingly, the authors find that tax avoidance decreases
cost of capital for low tax-avoidance firms. However, for firms with high levels of tax avoidance,
increasing tax avoidance increases cost of capital. Meanwhile, recent literature on cost structure
proposes that financial risk is a major factor that influences a firm’s cost structure choices. In

21
particular, Holzhacker et al. (2015) argue that firms with less elastic cost structures require higher
levels of sales to break even. Lower cost elasticity increases the likelihood of incurring losses.
Thus, it is more difficult for firms with lower cost elasticity to generate enough operating cash
flow to meet financial obligations. Higher financial risk (i.e., potential inability of the firm to meet
financial obligations) can intensify the situation due to its direct consequences, such as higher cost
of capital, and indirect consequences, such as loss of suppliers and customers. Therefore, firms
facing financial risk are more likely to explore options to increase the elasticity of their cost
structure.
The above discussion implies that as tax avoidance increases, financial uncertainty with
future cash flows increases. Therefore, firms are more likely to decrease sticky cost behavior in
order to improve their operational flexibility and increase the elasticity of their cost structure. To
explore this possibility, we first partition our sample into terciles according to our tax avoidance
measure. If the financial risk argument of tax avoidance is indeed valid, we would expect to
observe a stronger negative relation between tax avoidance and sticky costs as tax avoidance
increases.
[Insert Table 6 about here]
Table 6 shows that the negative impact of tax avoidance on cost stickiness becomes
stronger as the severity of tax avoidance increases. Specifically, from the lowest avoidance group
to the highest avoidance group, the coefficient increases from 0.328 (t = 3.80) for the low tax
avoidance tercile to 1.155 (t = 4.82) for the high tax avoidance tercile. The difference in
coefficients on the variable of interest is 0.827, significant at the 1% level. This result is consistent
with the above discussion that financial uncertainty associated with high levels of tax avoidance

22
makes firms more likely to decrease sticky cost behavior in order to improve their operational
flexibility and increase the elasticity of their cost structure.
5.5 Robustness tests
We conduct robustness tests to verify whether our results are sensitive to alternative
measures of tax avoidance, change in tax avoidance, or including main effects in an expanded
model. We run these robustness tests to ensure our results are not dependent on the choice of the
tax avoidance measure as well as to mitigate endogeneity issue and correlated omitted variables
problem.
First, we use two other measures of tax avoidance as proposed in the related literature (e.g.,
Desai and Dharmapala 2008; Frank et al. 2009; Goh et al. 2013) to test our main hypothesis. The
measures we adopt are book-tax difference (BTD) and permanent book-tax difference
(PERMDIFF). BTD is defined as the total difference between book and taxable income. It is
calculated as BTD = PI – (TXFED + TXFO)/STR, where PI is pretax income, TXFED is current
federal tax expense, TXFO is current foreign tax expense, and STR is the statutory tax rate.
Following Frank et al. (2009), PERMDIFF is defined as total book-tax differences less temporary
book-tax differences. As discussed in Frank et al. (2009), total book-tax differences contain
temporary book tax differences which may reflect earnings management through pre-tax accruals.
High levels of BTD may be driven by earnings management, rather than tax avoidance activities.
Therefore, permanent book-tax differences are better in capturing tax avoidance activities.
PERMDIFF is calculated as PERMDIFF = BTD – (TXDI/STR), where TXDI is total deferred tax
expense. Both the raw values of BTD and PERMDIFF are scaled by beginning-of-year total assets.
[Insert Table 7 about here]

23
Regression results using these alternative measures of tax avoidance are presented in table
7. We find that the coefficients on DEC×ΔlnSALE×TAXAVOID remain significantly positive when
the tax avoidance measure is BTD or PERMDIFF, suggesting our results are robust to the choice
of tax avoidance measure.
To the extent that a firm’s tax avoidance strategies and SG&A cost decisions may be
adopted by a firm endogenously, we repeat our analyses using change in the three tax avoidance
measures in place of the level measures. Results are presented in table 8. The coefficient on
DEC×ΔlnSALE×ΔTAXAVOID is positive and significant for all three change measures. To some
degree, these results mitigate the concern of endogeneity in our main findings.
[Insert Table 8 about here]
Finally, we include the main effects and two-way interactions with sales decrease dummy
in our main regression. To the extent that there may be a correlated omitted variables problem, the
model may be misspecified. The regression output, reported in table 9, still shows a significant
and positive coefficient on DEC×ΔlnSALE×CETR after the main effects and other two-way
interaction variables are included in the model. Overall, our findings are not sensitive to these
robustness tests.
[Insert Table 9 about here]
6. Conclusion
The study examines the association between tax avoidance and asymmetric cost behavior.
Prior studies (e.g., ABJ; Banker and Byzalov 2014) demonstrate that asymmetric cost behavior is
a phenomenon resulting from the deliberate managerial decision to retain unused resources when
there is a sales decrease, and this decision is influenced by resource adjustment costs associated

24
with downsizing. We propose that cash savings from tax avoidance may affect managers’ resource
adjustment decisions.
Using cash effective tax rate as our main measure of tax avoidance and adopting the ABJ
framework on asymmetric cost behavior, we document a significantly negative relationship
between tax avoidance and sticky costs. This result suggests that cash savings from tax avoidance
helps to alleviate mangers’ resource adjustment cost concerns in periods of sales decreases. Further
analyses reveal that a firm’s strategic position and operating cash flow volatility have a significant
influence on this main relationship. We do not find that managerial incentives to avoid losses or
earnings decreases drive the negative relationship between CETR and cost stickiness. However,
we do find evidence supporting the argument that the uncertainty of future cash flows associated
with more severe tax avoidance may exacerbate the negative relation between tax avoidance and
asymmetric cost behavior.
This study contributes to both the tax avoidance and sticky cost literatures. First, with
respect to the consequences of tax avoidance, the literature has largely focused on the impact of
tax avoidance on investors and creditors (Desai and Dharmapala 2009; Kim et al. 2011; Shevlin et
al. 2013; Cook et al. 2015). Second, our paper extends the literature on cost stickiness. This
literature has documented that certain economic factors and managerial characteristics can drive
asymmetric cost behavior. To our knowledge, this is the first study to examine the association
between a firm’s tax strategy and cost management – a real corporate decision. Finally, this paper
is among a handful of studies that endeavor to bring together research topics from different
disciplines (e.g., Chen et al. 2012; Kama and Weiss 2013).

25
References
Aiken, L. S., and West, S. G. 1991. Multiple regression: Testing and interpreting interactions.
Newbury Park, CA: Sage.
Anderson, M., Banker, R., and Janakiraman, S. 2003. Are selling, general, and administrative costs
“sticky”? Journal of Accounting Research 41(1): 47–63.
Balakrishnan, K., Blouin, J., and Guay, W. 2014. Does Tax Aggressiveness Reduce Corporate
Transparency? Working paper, University of Pennsylvania.
Balakrishnan, R., Petersen, M., and Soderstrom, N. 2004. Does capacity utilization affect the
“stickiness” of cost? Journal of Accounting, Auditing, and Finance 19(3): 283–299.
Banker, R., and Byzalov, D. 2014. Asymmetric cost behavior. Journal of Management Accounting
Research 26(2): 43–79.
Banker, R., Byzalov, D., and Chen, L. 2013. Employment protection legislation, adjustment costs
and cross-country differences in cost behavior. Journal of Accounting and Economics 55:
111–127.
Banker, R., Byzalov, D., Ciftci, M., and Mashruwala, R. 2014. The moderating effect of prior sales
changes on asymmetric cost behavior. Journal of Management Accounting Research 26(2):
221–242.
Banker, R., Flasher, R., and Zhang, D. 2013. Strategic positioning and asymmetric cost behavior.
Working Paper, Temple University, Pennsylvania State University, and Temple University.
Chen, J., Kama, I., and Lehavy, R. 2015. Management expectations and asymmetric cost behavior.
Working Paper, University of Illinois at Chicago, Tel Aviv University, and University of
Michigan.
Chen, C., Lu, H., and Sougiannis, T. 2012. The agency problem, corporate governance, and the
asymmetric behavior of selling, general, and administrative costs. Contemporary
Accounting Research 29(1): 252–282.
Cook, K. A., Moser, W. J., and Omer, T. 2015. Tax avoidance and ex ante cost of capital. Working
paper, Miami University of Ohio.
Demerjian, P., Lev, B., and McVay, S. 2012. Quantifying managerial ability: A new measure and
validity tests. Management Science 58(7): 1229–1248.
Demerjian, P., Lev, B., Lewis, M., and McVay, S. 2013. Managerial ability and Earnings Quality.
The Accounting Review 88(2): 463–498.
Desai, M. A., and Dharmapala, D. 2008. Tax and corporate governance: An economic approach.
MPI Studies on Intellectual Property, Competition and Tax Law 3: 13–30.

26
Desai, M. A., and Dharmapala, D. 2009. Corporate tax avoidance and firm value. Review of
Economics and Statistics 9(3): 537–546.
Dierynck, B., Landsman, W., and Renders, A. 2012. Do managerial incentives drive cost behavior?
Evidence about the role of zero earnings benchmarks for labor cost behavior in private
Belgian firm. The Accounting Review 87(4): 1219–1246.
Francis, B., Sun, X., and Wu, Q. 2013. Managerial ability and tax avoidance. Working paper,
Rensselaer Polytechnic Institute.
Frank, M., Lynch, L., and Rego, S. 2009. Tax reporting aggressiveness and its relation to
aggressive financial reporting. The Accounting Review 84: 467– 496.
Frank, M. M., Lynch, L., Rego, S., and Zhao, R. 2011. Are aggressive reporting practices
indicative of an aggressive corporate culture? Working paper, Indiana University.
Goh, B. W., Lee, J., Lim, C. Y., and Shevlin, T. 2013. The effect of corporate tax avoidance on
the cost of equity. Working paper, Singapore Management University.
Graham, J., and Tucker A. 2006. Tax shelters and corporate debt policy. Journal of Financial
Economics 81: 563–594.
Guenther, D., Krull, L., and Williams, B. 2014. Are “tax aggressive” firms just inflating earnings?
Working paper, University of Oregon.
Hanlon, M., and Slemrod, J. 2009. What does tax aggressiveness signal? Evidence from stock
price reactions to news about tax shelter involvement. Journal of Public Economics 93:
126–41.
Hanlon, M., Heitzman, S. 2010. A review of tax research. Journal of Accounting and Economics
50: 127–178.
Higgins, D., Omer, T., and Phillips, J. 2015. The influence of a firm’s business strategy on its tax
aggressiveness. Contemporary Accounting Research 32(2): 674–702.
Holzhacker, M., Krishnan, R., and Mahlendorf, M. 2015. The impact of changes in regulation on
cost behavior. Contemporary Accounting Research, forthcoming.
Hutchen, M. and Rego, S. 2015. Does greater tax risk lead to increased firm risk. Working paper,
Indiana University.
Kama, I., and Weiss, D. 2013. Do earnings targets and managerial incentives affect sticky costs?
Journal of Accounting Research 51(1): 201–224.
Kim, J. B., Li, Y., and Zhang, L. 2011. Corporate tax avoidance and stock price crash risk: Firm-
level analysis. Journal of Financial Economics 100: 639–662.

27
Koester, A. 2011. Investor value of tax avoidance through uncertain tax positions. Working paper,
Georgetown University.
Lev, B., Nissim, D. 2004. Taxable income, future earnings, and equity values. The Accounting
Review 79, 1039-1074.
Miles, R., and Snow, C. 1978. Organizational strategy, structure and process. New York:
McGraw-Hill.
Miles, R., and Snow, C. 2003. Organizational strategy, structure, and process. Stanford, CA:
Stanford University Press.
Minnick, K., and Noga, T. 2010. Do corporate governance characteristics influence tax
management? Journal of Corporate Finance 16: 703–718.
Noreen, E., and Soderstrom, N. 1997. The accuracy of proportional cost models: Evidence from
hospital service departments. Review of Accounting Studies 2: 89–114.
Rego, S., and Wilson R. 2012. Equity risk incentives and corporate tax aggressiveness. Journal of
Accounting Research 50(3): 775–810.
Richardson, G., Lanis, R., and Leung, S. 2014. Corporate tax aggressiveness, outside directors,
and debt policy: An empirical analysis. Journal of Corporate Finance 25: 107–121.
Shevlin, T., Urcan, O., and Vasvari, F. 2013. Corporate tax avoidance and public debt costs.
Working paper, University of California.
Wasley, C. E., and Wu J. S. 2006. Why do managers voluntarily issue cash flow forecasts? Journal
of Accounting Research 44(2): 389–429.
Wilson, R. 2009. An examination of corporate tax shelter participants. The Accounting Review 84:
969–999.

28
TABLE 1
Descriptive statistics
Mean Median Std. dev.
CETR -0.276 -0.262 0.215
SALE ($ million) 2289 336 9781
SG&A ($ million) 449 66 1886
DEC 0.20 0.00 0.40
ARET 0.22 0.11 0.63
EMPINT -5.26 -5.21 0.79
ASINT -0.13 -0.16 0.56
SUC_DEC 0.22 0.00 0.42
Note: This table presents the mean, median, and standard deviation of the main
variables used in the empirical analyses. CETR is cash effective tax rate
multiplied by -1. SALE is sales revenue. SG&A is selling, general, and
administrative costs. DEC is a dummy variable that equals 1 if sales
revenue in year t is smaller than that in year t–1 and 0 otherwise. ARET is
annual buy and hold return. EMPINT is the logarithm of the ratio of
number of employees to sales revenue. ASINT is the logarithm of the ratio
of total assets to sales revenue. Finally, SUC_DEC is a dummy variable
that equals 1 if sales revenue in year t–1 is less than that in year t–2 and 0
otherwise.

29
TABLE 2
Effect of cash effective tax rate on asymmetric cost behavior
Dep Var = ΔlnSG&Ait
ΔlnSALEit 0.763 ***
(95.03)
ΔlnSALEit×CETRit -0.282 ***
(-7.29)
ΔlnSALEit×ARETit -0.045 ***
(-5.10)
ΔlnSALEit×EMPINTit 0.052 ***
(5.19)
ΔlnSALEit×ASINTit -0.004
(-0.25)
DECit×ΔlnSALEit -0.109 ***
(-7.85)
DECit×ΔlnSALEit×CETRit 0.466 ***
(9.42)
DECit×ΔlnSALEit×ARETit 0.174 ***
(8.92)
DECit×ΔlnSALEit×EMPINTit 0.052 ***
(3.14)
DECit×ΔlnSALEit×ASINTit -0.127 ***
(-5.97)
DECit×ΔlnSALEit×SUC_DECit 0.142 ***
(7.82)
Fixed effect (Industry & Year) Yes
Number of observations 34,977
Adjusted R2 (%) 55.01%
Note:
This table presents the results of the effect of cash effective tax rate on cost stickiness. The
dependent variable is lnΔSG&A, which is the log change in SG&A costs. lnΔSALE is the log
change in sales revenue. CETR is cash effective tax rate multiplied by -1. ARET is the raw buy
and hold stock return in the year prior to the fiscal year end date. EMPINT is the log ratio of
number of employees to sales revenue. ASINT is the log ratio of total assets to sales revenue.
DEC is a dummy variable which equals 1 if sales decrease in the current year and 0 otherwise.
SUC_DEC is a dummy variable which equals 1 if sales decreased in the prior year and 0
otherwise.
t-statistics appear in parentheses and are based on standard errors clustered by industry and year.
***, **, and * denote statistical significance at the 0.01, 0.05, and 0.10 levels (two-tailed),
respectively.
30
TABLE 3
Effect of business strategy on the relation between cash effective tax rate and asymmetric cost
behavior
Dep Var = ΔlnSG&Ait
Defender Analyzer Prospector
ΔlnSALEit 0.731 *** 0.735 *** 0.674 ***
(13.54) (57.32) (16.59)
ΔlnSALEit×CETRit 0.065 -0.380 *** -0.479 ***
(0.31) (-6.02) (-3.48)
ΔlnSALEit×ARETit -0.142 ** -0.036 ** -0.078 **
(-2.27) (-2.20) (-2.35)
ΔlnSALEit×EMPINTit 0.122 ** 0.058 *** -0.044
(1.99) (3.26) (-0.75)
ΔlnSALEit×ASINTit 0.156 0.070 *** 0.107 *
(1.63) (2.83) (1.83)
DECit×ΔlnSALEit -0.356 *** -0.056 ** 0.118 *
(-4.18) (-2.53) (1.62)
DECit×ΔlnSALEit×CETRit -0.037 0.568 *** 0.651 ***
(-0.14) (6.49) (3.45)
DECit×ΔlnSALEit×ARETit 0.182 * 0.239 *** 0.127 *
(1.69) (6.74) (1.60)
DECit×ΔlnSALEit×EMPINTit -0.106 0.036 0.160
(-1.22) (1.03) (1.36)
DECit×ΔlnSALEit×ASINTit -0.302 *** -0.132 *** -0.182 **
(-2.75) (-3.51) (-2.03)
DECit×ΔlnSALEit×SUC_DECit 0.342 *** 0.110 *** 0.340 ***
(4.48) (3.34) (3.45)
Fixed effect (Industry & Year) Yes Yes Yes
Number of observations 1,243 14,594 1,033
Adjusted R2 (%) 47.12% 57.14% 69.28%
Difference in coefficients Prospector - Defender 0.688 **
Prob > Chi2 0.030
Note:
This table presents the results of the effect of business strategy on the relation between cash
effective tax rate and the asymmetric cost behavior. The dependent variable is lnΔSG&A, which
is the log change in SG&A costs. lnΔSALE is the log change in sales revenue. CETR is cash
effective tax rate multiplied by -1. ARET is the raw buy and hold stock return in the year prior
to the fiscal year end date. EMPINT is the log ratio of number of employees to sales revenue.
ASINT is the log ratio of total assets to sales revenue. DEC is a dummy variable which equals 1
if sales decrease in the current year and 0 otherwise. SUC_DEC is a dummy variable which
equals 1 if sales decreased in the prior year and 0 otherwise.
t-statistics appear in parentheses and are based on standard errors clustered by industry and
year. ***, **, and * denote statistical significance at the 0.01, 0.05, and 0.10 levels (two-tailed),
respectively.

31
TABLE 4
Effect of cash flow volitility on the relation between cash effective tax rate and asymmetric
cost behavior
Dep Var = ΔlnSG&Ait
Low Tercile Middle
Tercile High Tercile
ΔlnSALEit 0.778 *** 0.746 *** 0.699 ***
(52.28) (46.41) (44.58)
ΔlnSALEit×CETRit -0.149 * -0.196 ** -0.470 ***
(-1.68) (-2.36) (-7.79)
ΔlnSALEit×ARETit -0.063 ** -0.043 ** -0.068 ***
(-2.53) (-2.32) (-4.97)
ΔlnSALEit×EMPINTit 0.100 *** 0.067 *** 0.035 **
(4.77) (3.68) (2.13)
ΔlnSALEit×ASINTit -0.006 -0.060 ** 0.057 **
(-0.20) (-2.06) (2.39)
DECit×ΔlnSALEit -0.042 -0.099 *** -0.137 ***
(-1.37) (-3.58) (-4.84)
DECit×ΔlnSALEit×CETRit 0.321 *** 0.285 ** 0.735 ***
(2.79) (2.54) (9.53)
DECit×ΔlnSALEit×ARETit 0.163 *** 0.297 *** 0.181 ***
(2.91) (6.76) (5.62)
DECit×ΔlnSALEit×EMPINTit 0.016 0.071 ** 0.074 ***
(0.43) (2.06) (2.64)
DECit×ΔlnSALEit×ASINTit -0.101 ** -0.015 -0.197 ***
(-2.08) (-0.33) (-5.32)
DECit×ΔlnSALEit×SUC_DECit 0.066 * 0.102 ** 0.218 ***
(1.75) (2.53) (6.47)
Fixed effect (Industry & Year) Yes Yes Yes
Number of observations 8,552 9,369 9,567
Adjusted R2 (%) 57.04% 51.66% 50.76%
Difference in coefficients High Tercile - Low Tercile 0.414 ***
Prob > Chi2 0.002
Note:
This table presents the results of the effect of cash flow volatility on the relation between cash
effective tax rate and asymmetric cost behavior. The dependent variable is lnΔSG&A, which
is the log change in SG&A costs. lnΔSALE is the log change in sales revenue. CETR is cash
effective tax rate multiplied by -1. ARET is the raw buy and hold stock return in the year prior
to the fiscal year end date. EMPINT is the log ratio of number of employees to sales revenue.
ASINT is the log ratio of total assets to sales revenue. DEC is a dummy variable which equals
1 if sales decrease in the current year and 0 otherwise. SUC_DEC is a dummy variable which
equals 1 if sales decreased in the prior year and 0 otherwise.
t-statistics appear in parentheses and are based on standard errors clustered by industry and
year. ***, **, and * denote statistical significance at the 0.01, 0.05, and 0.10 levels (two-
tailed), respectively.

32
TABLE 5
Effect of incentives to meet earnings targets on the relation between cash effective tax rate and
asymmetric cost behavior
Dep Var = ΔlnSG&Ait
Avoid Loss Avoid Earnings Decrease
Yes No Yes No
ΔlnSALEit 0.701 *** 0.767 *** 0.846 *** 0.756 ***
(14.82) (95.63) (45.47) (88.56)
ΔlnSALEit×CETRit -0.129 -0.315 *** 0.186 -0.327 ***
(-1.43) (-7.72) (1.57) (-8.20)
ΔlnSALEit×ARETit 0.020 -0.056 *** -0.041 -0.038 ***
(0.65) (-5.66) (-1.21) (-4.17)
ΔlnSALEit×EMPINTit 0.092 * 0.048 *** 0.035 0.052 ***
(1.90) (4.82) (1.56) (4.99)
ΔlnSALEit×ASINTit 0.066 -0.011 0.012 -0.011
(1.23) (-0.73) (0.33) (-0.73)
DECit×ΔlnSALEit -0.029 -0.112 *** -0.108 ** -0.111 ***
(-0.38) (-7.94) (-2.16) (-7.54)
DECit×ΔlnSALEit×CETRit 0.438 *** 0.474 *** -0.300 0.520 ***
(3.30) (9.18) (-1.17) (10.33)
DECit×ΔlnSALEit×ARETit 0.089 0.189 *** 0.309 ** 0.163 ***
(1.31) (9.14) (2.13) (8.31)
DECit×ΔlnSALEit×EMPINTit -0.178 ** 0.063 *** 0.060 0.050 ***
(-2.02) (3.68) (0.69) (2.95)
DECit×ΔlnSALEit×ASINTit -0.314 *** -0.115 *** -0.138 -0.121 ***
(-3.79) (-5.16) (-1.25) (-5.47)
DECit×ΔlnSALEit×SUC_DECit 0.056 0.146 *** 0.068 0.147 ***
(0.73) (7.83) (0.81) (7.88)
Fixed effect (Industry & Year) Yes Yes Yes Yes
Number of observations 1,389 33,588 5,503 29,474
Adjusted R2 (%) 56.68% 55.20% 62.68% 54.54%
Difference in coefficients
Avoid - Not Avoid -0.036 -0.820 ***
Prob > Chi2 0.796 0.002
Note:
This table presents the results of an additional test that examines whether the relation between cash
effective tax rate and cost stickiness is driven by managerial incentives to meet earnings earnings targets.
The dependent variable is lnΔSG&A, which is the log change in SG&A costs. lnΔSALE is the log change
in sales revenue. CETR is cash effective tax rate multiplied by -1. ARET is the raw buy and hold stock
return in the year prior to the fiscal year end date. EMPINT is the log ratio of number of employees to
sales revenue. ASINT is the log ratio of total assets to sales revenue. DEC is a dummy variable which
equals 1 if sales decrease in the current year and 0 otherwise. SUC_DEC is a dummy variable which
equals 1 if sales decreased in the prior year and 0 otherwise.
t-statistics appear in parentheses and are based on standard errors clustered by industry and year. ***, **,
and * denote statistical significance at the 0.01, 0.05, and 0.10 levels (two-tailed), respectively.

33
TABLE 6
Effect of tax avoidance severity on the relation between cash effective tax rate and asymmetric
cost behavior
Dep Var = ΔlnSG&Ait
Low Tercile Middle Tercile High Tercile
ΔlnSALEit 0.746 *** 0.805 *** 0.899 ***
(39.38) (62.59) (28.04)
ΔlnSALEit×CETRit -0.165 ** -0.907 *** -0.864 ***
(-2.49) (-5.77) (-5.31)
ΔlnSALEit×ARETit -0.050 *** -0.039 ** -0.041 ***
(-2.63) (-2.19) (-3.41)
ΔlnSALEit×EMPINTit 0.069 *** 0.045 *** 0.044 ***
(3.74) (3.04) (2.61)
ΔlnSALEit×ASINTit -0.020 0.008 0.037
(-0.80) (0.32) (1.61)
DECit×ΔlnSALEit -0.050 -0.184 *** -0.291 ***
(-1.61) (-7.04) (-5.68)
DECit×ΔlnSALEit×CETRit 0.328 *** 0.515 ** 1.155 ***
(3.80) (2.27) (4.82)
DECit×ΔlnSALEit×ARETit 0.214 *** 0.157 *** 0.150 ***
(5.82) (3.49) (5.49)
DECit×ΔlnSALEit×EMPINTit 0.040 0.071 ** 0.040
(1.40) (2.36) (1.39)
DECit×ΔlnSALEit×ASINTit -0.112 *** -0.099 *** -0.175 ***
(-3.14) (-2.58) (-4.54)
DECit×ΔlnSALEit×SUC_DECit 0.122 *** 0.161 *** 0.132 ***
(4.04) (4.45) (4.30)
Fixed effect (Industry & Year) Yes Yes Yes
Number of observations 11,241 12,127 11,609
Adjusted R2 (%) 57.19% 56.96% 53.84%
Difference in coefficients High Tercile - Low Tercile 0.827 ***
Prob > Chi2 0.001
Note:
This table presents the results of the effect of cash flow volatility on the relation between cash effective
tax rate and asymmetric cost behavior. The dependent variable is lnΔSG&A, which is the log change in
SG&A costs. lnΔSALE is the log change in sales revenue. CETR is cash effective tax rate multiplied by -
1. ARET is the raw buy and hold stock return in the year prior to the fiscal year end date. EMPINT is the
log ratio of number of employees to sales revenue. ASINT is the log ratio of total assets to sales revenue.
DEC is a dummy variable which equals 1 if sales decrease in the current year and 0 otherwise.
SUC_DEC is a dummy variable which equals 1 if sales decreased in the prior year and 0 otherwise.
t-statistics appear in parentheses and are based on standard errors clustered by industry and year. ***,
**, and * denote statistical significance at the 0.01, 0.05, and 0.10 levels (two-tailed), respectively.

34
TABLE 7
Effect of tax avoidance on asymmetric cost behavior: Robustness test with alternative tax
avoidance measures
Dep Var = ΔlnSG&Ait
BTD PERMDIFF
ΔlnSALEit 0.733 *** 0.736 ***
(87.04) (86.90)
ΔlnSALEit×TAXAVOIDit -0.442 *** -0.288 ***
(-7.00) (-4.12)
ΔlnSALEit×ARETit -0.047 *** -0.047 ***
(-5.83) (-5.78)
ΔlnSALEit×EMPINTit 0.038 *** 0.042 ***
(3.82) (4.23)
ΔlnSALEit×ASINTit -0.026 ** -0.024 **
(-2.19) (-1.96)
DECit×ΔlnSALEit -0.180 *** -0.196 ***
(-12.73) (-13.89)
DECit×ΔlnSALEit×TAXAVOIDit 1.065 *** 0.761 ***
(11.57) (7.68)
DECit×ΔlnSALEit×ARETit 0.148 *** 0.150 ***
(9.23) (9.08)
DECit×ΔlnSALEit×EMPINTit 0.023 0.016
(1.56) (1.11)
DECit×ΔlnSALEit×ASINTit -0.163 *** -0.168 ***
(-9.50) (-9.68)
DECit×ΔlnSALEit×SUC_DECit 0.162 *** 0.164 ***
(10.72) (10.75)
Fixed effect (Industry & Year) Yes Yes
Number of observations 43,805 43,478
Adjusted R2 (%) 50.14% 49.98%
Note:
This table presents the results of the effect of tax avoidance on cost stickiness using alternative tax
avoidance measures. The dependent variable is lnΔSG&A, which is the log change in SG&A costs.
lnΔSALE is the log change in sales revenue. TAXAVOID is BTD or PERMDIFF, respectively. ARET is the
raw buy and hold stock return in the year prior to the fiscal year end date. EMPINT is the log ratio of
number of employees to sales revenue. ASINT is the log ratio of total assets to sales revenue. DEC is a
dummy variable which equals 1 if sales decrease in the current year and 0 otherwise. SUC_DEC is a
dummy variable which equals 1 if sales decreased in the prior year and 0 otherwise.
t-statistics appear in parentheses and are based on standard errors clustered by industry and year. ***, **,
and * denote statistical significance at the 0.01, 0.05, and 0.10 levels (two-tailed), respectively.

35
TABLE 8
Effect of tax avoidance on asymmetric cost behavior: Robustness test with change in tax
avoidance
Dep Var = ΔlnSG&Ait
ΔCETR ΔBTD ΔPERMDIFF
ΔlnSALEit 0.766 *** 0.741 *** 0.744 ***
(92.87) (89.77) (90.41)
ΔlnSALEit×ΔTAXAVOIDit -0.198 *** -0.766 *** -0.769 ***
(-5.57) (-12.59) (-13.11)
ΔlnSALEit×ARETit -0.053 *** -0.033 *** -0.035 ***
(-5.32) (-4.06) (-4.19)
ΔlnSALEit×EMPINTit 0.052 *** 0.025 ** 0.029 ***
(5.19) (2.55) (3.06)
ΔlnSALEit×ASINTit -0.008 -0.018 -0.019
(-0.56) (-1.55) (-1.61)
DECit×ΔlnSALEit -0.117 *** -0.194 *** -0.214 ***
(-8.06) (-13.66) (-15.02)
DECit×ΔlnSALEit×ΔTAXAVOIDit 0.402 *** 1.781 *** 1.570 ***
(8.72) (20.36) (17.50)
DECit×ΔlnSALEit×ARETit 0.182 *** 0.103 *** 0.107 ***
(8.02) (6.32) (6.30)
DECit×ΔlnSALEit×EMPINTit 0.048 *** 0.040 *** 0.032 **
(2.82) (2.75) (2.22)
DECit×ΔlnSALEit×ASINTit -0.098 *** -0.166 *** -0.168 ***
(-4.46) (-9.40) (-9.44)
DECit×ΔlnSALEit×SUC_DECit 0.127 *** 0.126 *** 0.141 ***
(6.61) (8.21) (9.10)
Fixed effect (Industry & Year) Yes Yes Yes
Number of observations 32,439 41,138 40,761
Adjusted R2 (%) 55.99% 51.83% 51.41%
Note:
This table presents the results of the effect of tax avoidance on cost stickiness. The dependent variable is
lnΔSG&A, which is the log change in SG&A costs. lnΔSALE is the log change in sales revenue.
ΔTAXAVOID is ΔCETR, ΔBTD, ΔPERMDIFF, or, respectively. ARET is the raw buy and hold stock
return in the year prior to the fiscal year end date. EMPINT is the log ratio of number of employees to sales
revenue. ASINT is the log ratio of total assets to sales revenue. DEC is a dummy variable which equals 1 if
sales decrease in the current year and 0 otherwise. SUC_DEC is a dummy variable which equals 1 if sales
decreased in the prior year and 0 otherwise.
t-statistics appear in parentheses and are based on standard errors clustered by industry and year. ***, **,
and * denote statistical significance at the 0.01, 0.05, and 0.10 levels (two-tailed), respectively.

36
TABLE 9
Effect of cash effective tax rate on asymmetric cost behavior - expanded model
with main effects
Dep Var = ΔlnSG&Ait
ΔlnSALEit 0.809 ***
(98.72)
ΔlnSALEit×CETRit -0.154 ***
(-4.20)
ΔlnSALEit×ARETit 0.006
(0.61)
ΔlnSALEit×EMPINTit 0.048 ***
(4.82)
ΔlnSALEit×ASINTit -0.030 **
(-2.19)
ΔlnSALEit×SUC_DECit -0.243 ***
(-12.09)
DECit×ΔlnSALEit -0.150 ***
(-6.32)
DECit×ΔlnSALEit×CETRit 0.247 ***
(3.27)
DECit×ΔlnSALEit×ARETit 0.081 **
(2.41)
DECit×ΔlnSALEit×EMPINTit 0.097 ***
(3.46)
DECit×ΔlnSALEit×ASINTit -0.066 *
(-1.85)
DECit×ΔlnSALEit×SUC_DECit 0.315 ***
(7.13)
DECit×CETRit 0.030 *
(1.95)
DECit×ARETit 0.009
(1.24)
DECit×EMPINTit 0.012 **
(2.33)
DECit×ASINTit -0.003
(-0.45)
DECit×SUC_DECit 0.015 **
(2.01)
DECit -0.005
(-0.97)
CETRit -0.059 ***
(-14.72)
ARETit -0.021 ***
(-12.72)

37
EMPINTit 0.000
(-0.22)
ASINTit 0.015 ***
(8.37)
SUC_DECit -0.036 ***
(-18.20)
Fixed effect (Industry & Year) Yes
Number of observations 34,977
Adjusted R2 (%) 57.13%
Note:
This table presents the results of the robustness test on the effect of tax
avoidance on cost stickiness by including in the model the main effects as well
as all two-way interactions. The dependent variable is lnΔSG&A, which is the
log change in SG&A costs. lnΔSALE is the log change in sales revenue. CETR
is cash effective tax rate multiplied by -1. ARET is the raw buy and hold stock
return in the year prior to the fiscal year end date. EMPINT is the log ratio of
number of employees to sales revenue. ASINT is the log ratio of total assets to
sales revenue. DEC is a dummy variable which equals 1 if sales decrease in the
current year and 0 otherwise. SUC_DEC is a dummy variable which equals 1 if
sales decreased in the prior year and 0 otherwise.
t-statistics appear in parentheses and are based on standard errors clustered by
industry and year. ***, **, and * denote statistical significance at the 0.01,
0.05, and 0.10 levels (two-tailed), respectively.