for release 31 january 2017 correction appendix 5b ...2017/02/01 · kuning, the re-logging and...
TRANSCRIPT

Finders Resources Limited | Level 1 | 5 Ord Street | Perth | West Perth 6005 | Australia
Tel: +61 8 6555 3996 | Fax: +61 8 6555 3998 | PO Box 597 | West Perth 6872 | [email protected]
www.findersresources.com
For Release 31 January 2017
CORRECTION – APPENDIX 5B AND QUARTERLY ACTIVITIES REPORT
Finders Resources Limited (“FND”) advises that the Appendix 5B released earlier today contained a number of errors. An amended version has been attached. In addition the Quarterly Activities Report has been amended to include a clarification that the cash balance includes restricted cash and to correct a typographical error on page 9 where a reference to March 2016 Quarter should have read March 2017 Quarter. An amended version is also attached.
-ends-
For
per
sona
l use
onl
y

Contacts:Mr Gary Comb
Non-Executive ChairmanMr Barry Cahill
Managing DirectorMr James WentworthChief Financial Officer
Phil RetterInvestor Relations
T: +61 407 440 882
Perth Office:Level 1, 5 Ord StreetWest Perth WA 6005
T: +61 8 6555 3996F: +61 8 6555 3998
E: [email protected] Code: FND
www.findersresources.com
For ASX Market Release: 31 January 2017
Quarterly Activities Report – December 2016
HIGHLIGHTS
Wetar Copper Project
Copper cathode produced for the quarter was 6,159 tonnes withsales of 4,888 tonnes at an average price of US$2.32/lb
December quarter C1 cash cost of US$1.08/lb EBITDA for the quarter of US$10.9 million 12 month rolling LTIFR and Injury Severity rates remain at zero
Corporate
Total project debt reduced to US$91.4 million from the initialUS$162 million facility at project commencement
Debt restructure completed Project ownership increased to 73.5% from 72.0% Hedge book (copper and diesel fuel) out of the money by US$12.4
million at 31 December 2016 Cash on hand at quarter end of AU$6.0 million (includes restricted
cash)
Managing Director Barry Cahill commented: “This landmark quarter saw our new 25,000t.p.a. copper cathode SX-EW plant achieve nameplate production capacity and our debtposition significantly reduced. We are now well positioned to reward shareholders withincreased news flow during 2017 on our resource expansion initiatives along with furtherreductions in debt off the back of an improving copper price.”
For
per
sona
l use
onl
y

Quarterly Activities Report December 2016
2
Finders Resources Limited, Level 1, 5 Ord Street, West Perth WA 6005
WETAR COPPER PROJECT (FINDERS 72% increasing to 73.5%)
3,000 t.p.a. and 25,000 t.p.a. SX-EW Plant Production Report
While the 3,000 t.p.a. plant operated below expectations, the 25,000 t.p.a. plant continued to ramp up coppercathode production and finished the quarter at nameplate capacity as summarised in the following table:
Table 1: Wetar Quarterly Copper Production
March 16Quarter
June 16Quarter
September 16Quarter
December 16Quarter
Ore stacked t 178,556 346,879 677,5101 949,6291
Grade % Cu 2.43 2.33 2.33 2.01
Metal stacked t Cu 4,342 8,085 15,763 19,057
Copper stripped t Cu 569 1,067 3,987 6,159
Copper sold t Cu 815 612 2,587 4,888
Copper sale price US$/lb Cu 2.10 2.22 2.18 2.32
Note 1: includes ore stacked to heap and stockpile leach pads.
Ore mining continued in the Kali Kuning open pit with the initial ore movement required to achieve steady statesolution inventory completed by quarter end. Future ore movement will be focussed on maintaining inventory.
Image 1 – Excavating blasted material in Kali Kuning pit
Waste mining focussed on bringing down the pit floor in sequence with the required ore movement and stabilisingthe northern pit wall as reported in the September quarter.
Excess equipment from the mining fleet will be demobilised during the forthcoming quarter in line with reducedearthmoving volumes.
Ore stacking continued on the Gold Pit Leach Pad (GPLP) and the Kali Kuning Valley (KKV) heap leach pads.Construction of the new DP07 leach pad was completed and stacking has commenced early in 2017.
For
per
sona
l use
onl
y

Quarterly Activities Report December 2016
3
Finders Resources Limited, Level 1, 5 Ord Street, West Perth WA 6005
The 3,000 t.p.a. SX-EW plant performed below expectations and will be shut down for a short time during the Marchquarter for minor refurbishment work to restore the plant to normal operating capacity.
The 25,000 t.p.a. SX-EW plant continued to perform well with steady state nameplate production achieved duringthe December quarter. Production from this plant is expected to increase incrementally as efficiency improvementsare implemented and site staff gain more experience in the operation of the plant.
Image 2 – Stacked tonnes on the Gold Pit Heap Leach Pad
The neutralisation plant operated as planned during the quarter. Demobilisation of construction personnel andequipment continued as final work was completed to all construction activities.
The copper cathode from the 25kt SX-EW plant continued to produce some minor visual quality and specificationissues during ramp up. More than 90% of the copper cathode currently being produced is LME Grade A and has beensold at a premium to the LME price with the balance sold at or about the LME price.
The C1 cash cost for the quarter was US$1.08 per pound of copper produced which is slightly (3%) above forecast lifeof mine cost estimates. The C1 cost is expected to be in line with forecast during the March quarter.
Project EBITDA for the quarter was US$10.9 million which is in line with expectations for the first full quarter ofproduction.
Image 3 – Stacked tonnes on KKV Leach PadFor
per
sona
l use
onl
y
Quarterly Activities Report December 2016
4
Finders Resources Limited, Level 1, 5 Ord Street, West Perth WA 6005
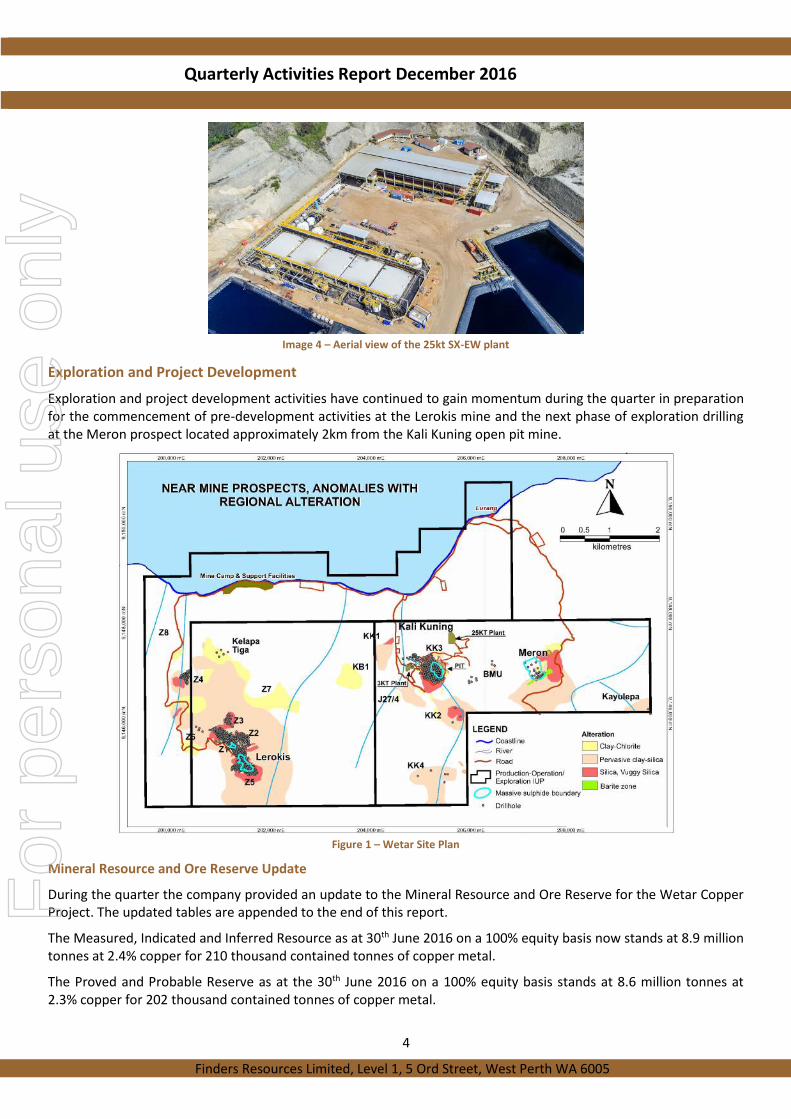
Image 4 – Aerial view of the 25kt SX-EW plant
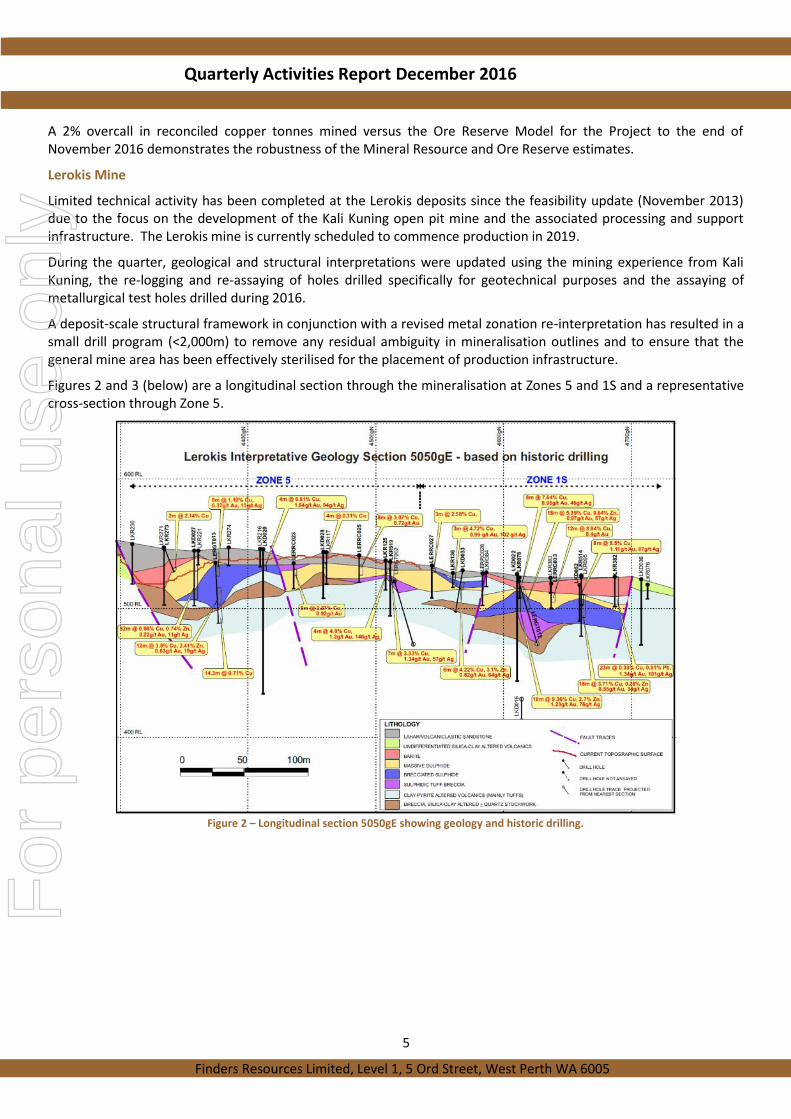
Exploration and Project DevelopmentExploration and project development activities have continued to gain momentum during the quarter in preparationfor the commencement of pre-development activities at the Lerokis mine and the next phase of exploration drillingat the Meron prospect located approximately 2km from the Kali Kuning open pit mine.
Figure 1 – Wetar Site Plan
Mineral Resource and Ore Reserve Update
During the quarter the company provided an update to the Mineral Resource and Ore Reserve for the Wetar CopperProject. The updated tables are appended to the end of this report.
The Measured, Indicated and Inferred Resource as at 30th June 2016 on a 100% equity basis now stands at 8.9 milliontonnes at 2.4% copper for 210 thousand contained tonnes of copper metal.
The Proved and Probable Reserve as at the 30th June 2016 on a 100% equity basis stands at 8.6 million tonnes at2.3% copper for 202 thousand contained tonnes of copper metal.
For
per
sona
l use
onl
y
Quarterly Activities Report December 2016
5
Finders Resources Limited, Level 1, 5 Ord Street, West Perth WA 6005
A 2% overcall in reconciled copper tonnes mined versus the Ore Reserve Model for the Project to the end ofNovember 2016 demonstrates the robustness of the Mineral Resource and Ore Reserve estimates.
Lerokis Mine
Limited technical activity has been completed at the Lerokis deposits since the feasibility update (November 2013)due to the focus on the development of the Kali Kuning open pit mine and the associated processing and supportinfrastructure. The Lerokis mine is currently scheduled to commence production in 2019.
During the quarter, geological and structural interpretations were updated using the mining experience from KaliKuning, the re-logging and re-assaying of holes drilled specifically for geotechnical purposes and the assaying ofmetallurgical test holes drilled during 2016.
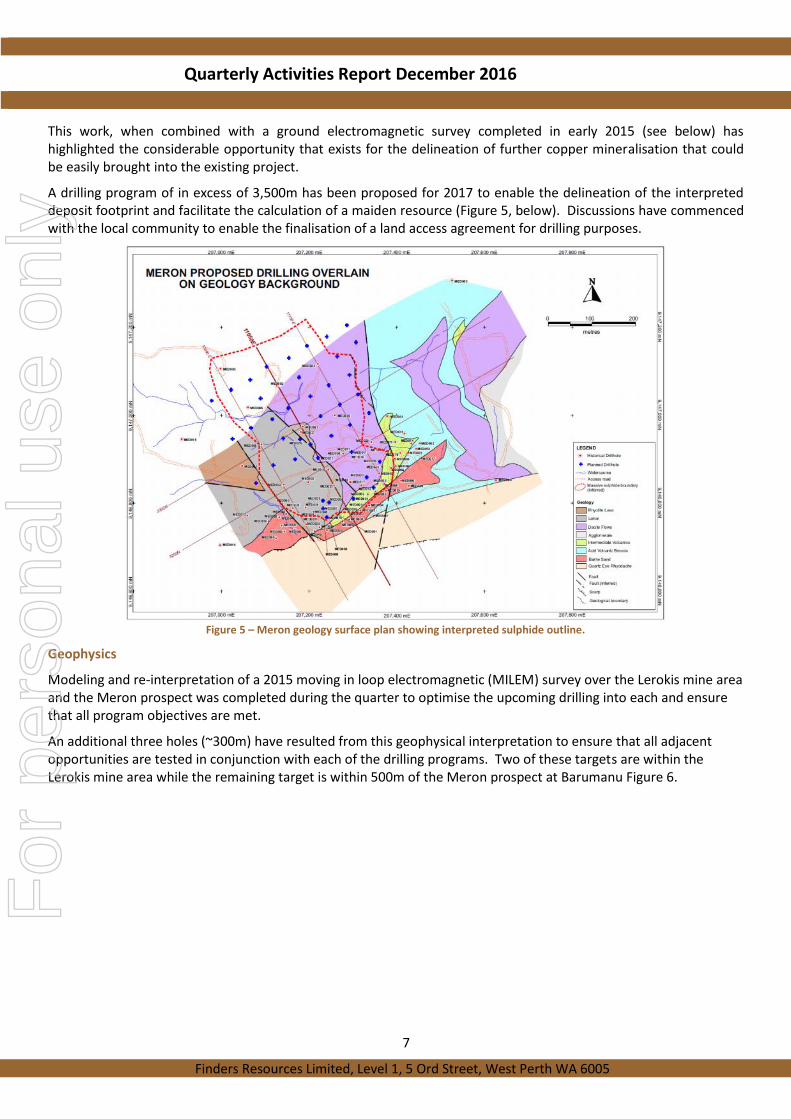
A deposit-scale structural framework in conjunction with a revised metal zonation re-interpretation has resulted in asmall drill program (<2,000m) to remove any residual ambiguity in mineralisation outlines and to ensure that thegeneral mine area has been effectively sterilised for the placement of production infrastructure.
Figures 2 and 3 (below) are a longitudinal section through the mineralisation at Zones 5 and 1S and a representativecross-section through Zone 5.
Figure 2 – Longitudinal section 5050gE showing geology and historic drilling.
For
per
sona
l use
onl
y

Quarterly Activities Report December 2016
6
Finders Resources Limited, Level 1, 5 Ord Street, West Perth WA 6005
Figure 3 – Zone 5 geological cross section 4350gN showing historic drilling.
Meron Prospect
Work during the quarter focussed on data collation and geological re-interpretation of earlier historical field datawhere exploratory drilling intersected a “blind” sulphide body with associated anomalous copper mineralisation(Figure 4).
Figure 4 – Meron geological cross section 11050 showing historic drilling and the interpreted sulphide outline.
For
per
sona
l use
onl
y
Quarterly Activities Report December 2016
7
Finders Resources Limited, Level 1, 5 Ord Street, West Perth WA 6005
This work, when combined with a ground electromagnetic survey completed in early 2015 (see below) hashighlighted the considerable opportunity that exists for the delineation of further copper mineralisation that couldbe easily brought into the existing project.
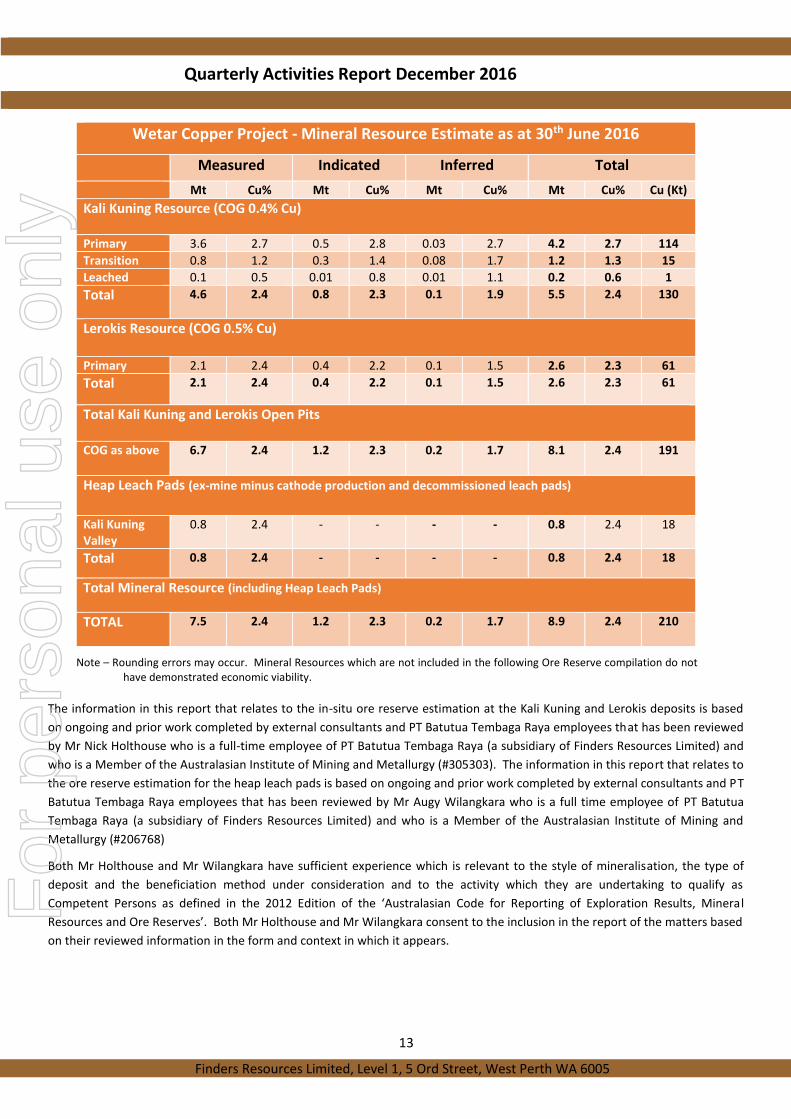
A drilling program of in excess of 3,500m has been proposed for 2017 to enable the delineation of the interpreteddeposit footprint and facilitate the calculation of a maiden resource (Figure 5, below). Discussions have commencedwith the local community to enable the finalisation of a land access agreement for drilling purposes.
Figure 5 – Meron geology surface plan showing interpreted sulphide outline.
Geophysics
Modeling and re-interpretation of a 2015 moving in loop electromagnetic (MILEM) survey over the Lerokis mine areaand the Meron prospect was completed during the quarter to optimise the upcoming drilling into each and ensurethat all program objectives are met.
An additional three holes (~300m) have resulted from this geophysical interpretation to ensure that all adjacentopportunities are tested in conjunction with each of the drilling programs. Two of these targets are within theLerokis mine area while the remaining target is within 500m of the Meron prospect at Barumanu Figure 6.
For
per
sona
l use
onl
y

Quarterly Activities Report December 2016
8
Finders Resources Limited, Level 1, 5 Ord Street, West Perth WA 6005
Figure 6 – Kali Kuning to Meron region EM image showing the Barumanu target location.
OH&S
There were no serious injuries recorded during the quarter, with the Lost Time Injury Frequency Rate (LTIFR)remaining at zero. The 12 month rolling LTIFR is 0.00 and the Injury Severity Rate is 0.00. The Total Recordable InjuryFrequency rate for the project is 4.5 this is the total rate of medically treated and lost time injuries recorded whichwas an increase from last quarter. Management are focussed on reducing this lag indicator, particularly the rate ofmedically treated injuries.
Image 5 – Aerial view of the coastal facilities at Lerokis Port
Wetar Community DevelopmentCommunity development programs, which assist with health and economic development, continued during thequarter and included;
Agricultural initiatives, including vegetable growing and chicken farming, to supplement the requirements ofthe Wetar Project.
Local community employment initiative, inclusive of island villages further afield of the operation, whichaccounted for 48% of company’s employees at the Wetar Project at the end of the quarter.
For
per
sona
l use
onl
y

Quarterly Activities Report December 2016
9
Finders Resources Limited, Level 1, 5 Ord Street, West Perth WA 6005
Maintaining staffing levels at the local health centre and two medical posts to reduce the dependency on theSite Clinic. During the quarter over 600 visits were dealt with. Any serious conditions were elevated to theSite Clinic of which there were over 40 visits during the quarter.
The maintenance of the emergency airstrip for medical evacuation of both employees and local residents.
Allocation of 10% of the available passenger seats on marine vessels servicing the Wetar Project to the localcommunity.
Stakeholder engagement continued and included information meetings and site visits with various Governmentofficials, community leaders, elders and landowners.
Wetar Environmental Management
Environmental monitoring activities and reporting to the relevant Indonesian authorities in accordance with theProject’s environmental permit was ongoing and no non-compliance occurrences were reported.
March 2017 Quarter
Planned activities for the March 2017 quarter include:
Continued stacking of ore to the KKV leach pad and DP07;
Refurbishment of the 3,000 t.p.a. SX-EW plant;
Attaining and maintaining the production profile of the project at the nameplate capacity of 28,000 t.p.a.copper cathode at a C1 cash cost of US$1.05 /lb copper cathode; and
Commencement of development drilling at the Lerokis project
CORPORATE
Cash and Project Finance FacilityFinders through its Indonesian subsidiary PT Batutua Tembaga Raya (“BTR”) previously entered into a SeniorFacilities Agreement with BNP Paribas, Commonwealth Bank of Australia, Hong Kong and Shanghai BankingCorporation (HSBC) and Societe Generale (“the Senior Lenders”) which provided for a US$162 million commitmentfrom the Senior Lenders consisting of:
• US$127 million Term Loan Facility;• US$20 million Cost Overrun Facility; and• US$15 million VAT Working Capital Facility.
During the quarter BTR made further repayments of US$6.5 million on the Term Loan Facility and US$3.2 million onthe VAT facility. Total amount drawn under the Senior Facilities Agreement as at the end of the quarter was US$91.4million.
As announced on 20 January 2017, BTR successfully completed a restructure of the Senior Facilities Agreement. Thechanges included a reduction in the minimum hedge requirements under the bank facilities, additional discretionaryhedging line and amendments to the repayment profile.F
or p
erso
nal u
se o
nly

Quarterly Activities Report December 2016
10
Finders Resources Limited, Level 1, 5 Ord Street, West Perth WA 6005
The book value of the hedges entered into by BTR as at 31 December 2016 is summarised in the following table (US$million):
Copper hedging (11.8)
Fuel hedging (0.6)
Total (12.4)
As at 31 December 2016, Finders and BTR had cash of AU$6.0 million (includes restricted cash).
CorporateOn 10 November 2016, Finders announced the completion of a placement of 100,000,000 shares at 12 cents toexisting and new institutional and sophisticated investors to raise A$12 million. The proceeds will enable targetedinvestment to increase mine life and project value.
On 20 December 2016, Finders announced the cancellation of 1,000,000 shares issued under its Employee ShareOwnership Scheme.
On 20 January 2017, Finders announced that its equity ownership in the Wetar Copper Project had increased from72.0% to 73.5% following the dilution of joint venture partner, Posco Daewoo Corporation.
Capital Structure
Type of Security Number on Issue
Fully Paid Ordinary Shares (“Shares”) - Quoted on ASX
Shares on issue at 31 December 2016 – Quoted on ASX 761,267,245
Unlisted Employee Shares No. of Shares
Employee shares issued under the Finders Employee Share Ownership Plan at issue prices of19c to 35c funded by loans from the company
900,000
Unvested directors incentive Shares issued at issue prices from 20.08 cents to 30.08 centsfunded by loans from the company and subject to performance and time based vestingconditions
10,500,000
Unlisted Employee Shares on issue at 31 December 2016 11,400,000
Unlisted Options Exercise Price Expiry Date No.
A$0.35 06 Jun 2017 22,857,144
A$0.2556 22 Oct 2017 31,298,904
Unlisted Options on issue at 31 December 2016 54,156,048
Unlisted Converting Notes Conversion Price Maturity Date No. of Shares
US$5,500,000 A$0.427 16 Mar 2018 12,248,538
The mining exploration entity quarterly report (Appendix 5B) is appended.
Barry Cahill
Managing Director
For
per
sona
l use
onl
y

Quarterly Activities Report December 2016
11
Finders Resources Limited, Level 1, 5 Ord Street, West Perth WA 6005
Background Information on Finders
Finders is the operator of the Wetar Copper Project (73.5% interest) located on Wetar Island in eastern Indonesia.
The Wetar Copper Project comprises the development, open pit mining and processing of the high-grade sulphidedeposits at Kali Kuning and Lerokis located within 3 kilometres of the coast on Wetar Island. The project benefitsfrom having existing infrastructure in place, particularly a wharf, camp and roads and partially exposed copper orebodies from a prior gold mining era.
Finders currently operates a 25,000 tonne per annum (“t.p.a”) copper cathode solvent extraction-electrowinning(“SX-EW”) plant, commissioned in May 2016, and a 3,000 t.p.a SX-EW plant for annual production capacity of 28,000tonnes copper cathode. To date, the plants have produced over 15,000 tonnes of copper cathode, of which 90% wassold at a premium to the LME price and without specification issues.
The project has a total debt of US$91.4M (including a VAT facility) repayable over the period to March 2019 and hasa projected cash operating cost of US$1.05/lb Cu over the life of mine.
Opportunities for extending the mine life past the current 7 years are strongly founded on exploration upside,focussing initially on the nearby satellite Meron deposit and other identified VMS copper and gold targets on WetarIsland including Karkopang.
Tenement/Mineral Permit Schedule
IUP Decision No. Type Mineral Expiry Date Area (ha) Term Holder1
Wetar Copper Project1
543 ‐ 124 Tahun 2011 IUP Exploitation Copper 09 Jun 2031 2,733 20 years BKP
540 – 317.a Tahun 2012 IUP Exploitation Sand, gravel & stone 01 Nov 2017 80.55 5 years BKP
540 – 317.b Tahun 2012 IUP Exploitation Limestone 01 Nov 2017 1,425 5 years BKP
540 – 28.b Tahun 2010 IUP Exploitation Barite 01 Nov 2016 515 6 years BBW
Wetar South Coast Exploration
540 – 28.a Tahun 2010 IUP Exploration Gold 01 Mar 2016 2,636 6 years BKP
540 – 28.c Tahun 2010 IUP Exploration Gold 01 Mar 2016 1,418 6 years BKP
540 – 28.d Tahun 2010 IUP Exploration Gold 01 Mar 2016 1,021 6 years BBW
540 – 28.e Tahun 2010 IUP Exploration Gold 01 Mar 2016 1,106 6 years BBW
540 – 28.f Tahun 2010 IUP Exploration Gold 01 Mar 2016 1,148 6 years BBW
1. Finders’ interest in the Wetar Copper Project (73.5%) is held through Indonesian subsidiaries, PT Batutua Tembaga Raya(“BTR”) and PT Batutua Kharisma Permai (“BKP”). BBW has merged with BKP and tenements previously held by BBWare in the process of being transferred to BKP.
For
per
sona
l use
onl
y

Quarterly Activities Report December 2016
12
Finders Resources Limited, Level 1, 5 Ord Street, West Perth WA 6005
Wetar Copper Project Resources & Reserves
Wetar Copper Project – Ore Reserve Estimate as at 30th June 2016Proved Probable Total
Mt Cu% Mt Cu% Mt Cu% Cu (Kt)Kali Kuning Open Pit (COG 0.4% Cu)
Primary 3.6 2.7 0.5 2.7 4.1 2.7 111Transition 0.8 1.2 0.3 1.3 1.1 1.2 13Leached 0.1 0.5 0.01 0.8 0.1 0.6 1Total 4.6 2.4 0.7 2.2 5.3 2.4 126
Waste 3.9Stripping Ratio 0.7
Lerokis Open Pit (COG 0.5% Cu)
Primary 2.1 2.3 0.4 2.0 2.5 2.3 59Total 2.1 2.3 0.4 2.0 2.5 2.3 59
Waste 1.9Stripping Ratio 0.8
Total Kali Kuning and Lerokis Open Pits
COG as above 6.7 2.4 1.2 2.2 7.8 2.3 184
Heap Leach Pads (ex-mine minus cathode production and decommissioned leach pads)
Kali Kuning 0.8 2.4 - - 0.8 2.4 18Total 0.8 2.4 - - 0.8 2.4 18
Total Ore Reserve (including Heap Leach Pads)
COGs as above 7.4 2.4 1.2 2.2 8.6 2.3 202
Notes – The Ore Reserve Estimate for the open pit mines is derived from the Mineral Resource block models for the Kali Kuningand Lerokis deposits. The tonnes and grades are stated to a number of significant digits reflecting the confidence of theestimate. Since each number and total is rounded individually the columns and rows in the above table may not showexact sums or weighted averages of the reported tonnes and grades. “Stripping Ratio” refers to the ratio of the wasteto the ore tonnage.
For
per
sona
l use
onl
y
Quarterly Activities Report December 2016
13
Finders Resources Limited, Level 1, 5 Ord Street, West Perth WA 6005
Wetar Copper Project - Mineral Resource Estimate as at 30th June 2016
Measured Indicated Inferred TotalMt Cu% Mt Cu% Mt Cu% Mt Cu% Cu (Kt)
Kali Kuning Resource (COG 0.4% Cu)
Primary 3.6 2.7 0.5 2.8 0.03 2.7 4.2 2.7 114Transition 0.8 1.2 0.3 1.4 0.08 1.7 1.2 1.3 15Leached 0.1 0.5 0.01 0.8 0.01 1.1 0.2 0.6 1Total 4.6 2.4 0.8 2.3 0.1 1.9 5.5 2.4 130
Lerokis Resource (COG 0.5% Cu)
Primary 2.1 2.4 0.4 2.2 0.1 1.5 2.6 2.3 61Total 2.1 2.4 0.4 2.2 0.1 1.5 2.6 2.3 61
Total Kali Kuning and Lerokis Open Pits
COG as above 6.7 2.4 1.2 2.3 0.2 1.7 8.1 2.4 191
Heap Leach Pads (ex-mine minus cathode production and decommissioned leach pads)
Kali KuningValley
0.8 2.4 - - - - 0.8 2.4 18
Total 0.8 2.4 - - - - 0.8 2.4 18
Total Mineral Resource (including Heap Leach Pads)
TOTAL 7.5 2.4 1.2 2.3 0.2 1.7 8.9 2.4 210
Note – Rounding errors may occur. Mineral Resources which are not included in the following Ore Reserve compilation do nothave demonstrated economic viability.
The information in this report that relates to the in-situ ore reserve estimation at the Kali Kuning and Lerokis deposits is basedon ongoing and prior work completed by external consultants and PT Batutua Tembaga Raya employees that has been reviewedby Mr Nick Holthouse who is a full-time employee of PT Batutua Tembaga Raya (a subsidiary of Finders Resources Limited) andwho is a Member of the Australasian Institute of Mining and Metallurgy (#305303). The information in this report that relates tothe ore reserve estimation for the heap leach pads is based on ongoing and prior work completed by external consultants and PTBatutua Tembaga Raya employees that has been reviewed by Mr Augy Wilangkara who is a full time employee of PT BatutuaTembaga Raya (a subsidiary of Finders Resources Limited) and who is a Member of the Australasian Institute of Mining andMetallurgy (#206768)
Both Mr Holthouse and Mr Wilangkara have sufficient experience which is relevant to the style of mineralisation, the type ofdeposit and the beneficiation method under consideration and to the activity which they are undertaking to qualify asCompetent Persons as defined in the 2012 Edition of the ‘Australasian Code for Reporting of Exploration Results, MineralResources and Ore Reserves’. Both Mr Holthouse and Mr Wilangkara consent to the inclusion in the report of the matters basedon their reviewed information in the form and context in which it appears.
For
per
sona
l use
onl
y
Quarterly Activities Report December 2016
14
Finders Resources Limited, Level 1, 5 Ord Street, West Perth WA 6005
The information in this report that relates to mineral resource estimation for the Kali Kuning and Lerokis deposits is based onprior work completed by external consultants that has been reviewed by Mr Terry Burns who is a Fellow and CharteredProfessional of the Australasian Institute of Mining and Metallurgy (#107527).
Mr Burns has sufficient experience which is relevant to the style of mineralisation and type of deposit under consideration andto the activity which he is undertaking to qualify as a Competent Person as defined in the 2012 Edition of the ‘Australasian Codefor Reporting of Exploration Results, Mineral Resources and Ore Reserves’. Mr Burns is contracted by Banda Minerals Pty Ltd, a100% owned subsidiary of Finders Resources Limited, and consents to the inclusion in the reports of the matters based on hisinformation in the form and context in which it appears.
Disclaimer
This announcement may or may not contain certain “forward-looking statements”. All statements, other than statements ofhistorical fact, which address activities, events or developments that Finders believes, expects or anticipates will or may occur inthe future, are forward-looking statements. Forward-looking statements are often, but not always, identified by the use ofwords such as “seek”, “anticipate”, “believe”, “plan”, “estimate”, “targeting”, “expect”, and “intend” and statements that anevent or result “may”, “will”, “can”, “should”, “could”, or “might” occur or be achieved and other similar expressions. Theseforward-looking statements, including those with respect to permitting and development timetables, mineral grades,metallurgical recoveries, potential production reflect the current internal projections, expectations or beliefs of Finders based oninformation currently available to Finders. Statements in this document that are forward-looking and involve numerous risks anduncertainties that could cause actual results to differ materially from expected results are based on the Company’s currentbeliefs and assumptions regarding a large number of factors affecting its business. Actual results may differ materially fromexpected results. There can be no assurance that (i) the Company has correctly measured or identified all of the factors affectingits business or the extent of their likely impact, (ii) the publicly available information with respect to these factors on which theCompany’s analysis is based is complete or accurate, (iii) the Company’s analysis is correct or (iv) the Company’s strategy, whichis based in part on this analysis, will be successful. Finders expressly disclaims any obligation to update or revise any suchforward-looking statements.
No Representation, Warranty or Liability
Whilst it is provided in good faith, no representation or warranty is made by Finders or any of its advisers, agents or employeesas to the accuracy, completeness, currency or reasonableness of the information in this announcement or provided inconnection with it, including the accuracy or attainability of any Forward Looking Statements set out in this announcement.Finders does not accept any responsibility to inform you of any matter arising or coming to Finders’ notice after the date of thisannouncement which may affect any matter referred to in this announcement. Any liability of Finders, its advisers, agents andemployees to you or to any other person or entity arising out of this announcement including pursuant to common law, theCorporations Act 2001 and the Trade Practices Act 1974 or any other applicable law is, to the maximum extent permitted by law,expressly disclaimed and excluded.
Distribution Restrictions
The distribution of this announcement may be restricted by law in certain jurisdictions. Recipients and any other persons whocome into possession of this announcement must inform themselves about, and observe any such restrictions.
For
per
sona
l use
onl
y

Appendix 5BMining exploration entity and oil and gas exploration entity quarterly report
+ See chapter 19 for defined terms1 September 2016 Page 1
+Rule 5.5
Appendix 5B
Mining exploration entity and oil and gas exploration entityquarterly report
Introduced 01/07/96 Origin Appendix 8 Amended 01/07/97, 01/07/98, 30/09/01, 01/06/10, 17/12/10, 01/05/13, 01/09/16
Name of entity
Finders Resources Limited
ABN Quarter ended (“current quarter”)
82 108 547 413 31 December 2016
Consolidated statement of cash flows Current quarter$A’000
Year to date (12months)$A’000
1. Cash flows from operating activities35,138 58,2961.1 Receipts from customers
1.2 Payments for
- -(a) exploration & evaluation
(b) development (5,396) (68,731)
(c) production (14,360) (43,671)
(d) staff costs (4,163) (21,466)
(e) administration and corporate costs (330) (1,126)
1.3 Dividends received (see note 3) - -
1.4 Interest received - 23
1.5 Interest and other costs of finance paid (3,299) (10,203)
1.6 Income taxes paid - -
1.7 Research and development refunds - -
1.8 Other (provide details if material) - -
Taxes and value added tax refund (paid) (2,078) (6,199)
1.9 Net cash from / (used in) operatingactivities
5,512 (93,077)
2. Cash flows from investing activities
(2,475) (4,401)
2.1 Payments to acquire:
(a) property, plant and equipment
(b) tenements (see item 10) - -
(c) investments - -
For
per
sona
l use
onl
y

Appendix 5BMining exploration entity and oil and gas exploration entity quarterly report
+ See chapter 19 for defined terms1 September 2016 Page 2
Consolidated statement of cash flows Current quarter$A’000
Year to date (12months)$A’000
(d) other non-current assets
2.2 Proceeds from the disposal of:
- -(a) property, plant and equipment
(b) tenements (see item 10) - -
(c) investments - -
(d) other non-current assets - -
2.3 Cash flows from loans to other entities - -
2.4 Dividends received (see note 3) - -
2.5 Other (provide details if material) - 41
2.6 Net cash from / (used in) investingactivities
(2,475) (4,360)
3. Cash flows from financing activities12,000 12,0003.1 Proceeds from issues of shares
3.2 Proceeds from issue of convertible notes - -
3.3 Proceeds from exercise of share options - -
3.4 Transaction costs related to issues ofshares, convertible notes or options
(627) (627)
3.5 Proceeds from borrowings - 72,106
3.6 Repayment of borrowings (18,053) (75,495)
3.7 Transaction costs related to loans andborrowings
(956) (1,613)
3.8 Dividends paid
3.9 Other (provide details if material)
Net hedge receipts / (payments) - 61,824
3.10 Net cash from / (used in) financingactivities
(7,636) 68,195
4. Net increase / (decrease) in cash andcash equivalents for the period
7,888 33,7284.1 Cash and cash equivalents at beginning of
period
4.2 Net cash from / (used in) operatingactivities (item 1.9 above)
5,512 (93,077)
4.3 Net cash from / (used in) investing activities(item 2.6 above)
(2,475) (4,360)
4.4 Net cash from / (used in) financing activities(item 3.10 above)
(7,636) 68,195
For
per
sona
l use
onl
y

Appendix 5BMining exploration entity and oil and gas exploration entity quarterly report
+ See chapter 19 for defined terms1 September 2016 Page 3
Consolidated statement of cash flows Current quarter$A’000
Year to date (12months)$A’000
4.5 Effect of movement in exchange rates oncash held
1,590 393
4.6 Cash and cash equivalents at end ofperiod
4,879 4,879
5. Reconciliation of cash and cashequivalentsat the end of the quarter (as shown in theconsolidated statement of cash flows) to therelated items in the accounts
Current quarter$A’000
Previous quarter$A’000
5.1 Bank balances 4,879 7,888
5.2 Call deposits -
5.3 Bank overdrafts -
5.4 Other (provide details) -
5.5 Cash and cash equivalents at end ofquarter (should equal item 4.6 above)
4,879 7,888
6. Payments to directors of the entity and their associates Current quarter$A'000
6.1 Aggregate amount of payments to these parties included in item 1.2 138
6.2 Aggregate amount of cash flow from loans to these parties includedin item 2.3
-
6.3 Include below any explanation necessary to understand the transactions included initems 6.1 and 6.2
7. Payments to related entities of the entity and theirassociates
Current quarter$A'000
7.1 Aggregate amount of payments to these parties included in item 1.2 -
7.2 Aggregate amount of cash flow from loans to these parties includedin item 2.3
-
7.3 Include below any explanation necessary to understand the transactions included initems 7.1 and 7.2F
or p
erso
nal u
se o
nly

Appendix 5BMining exploration entity and oil and gas exploration entity quarterly report
+ See chapter 19 for defined terms1 September 2016 Page 4
8. Financing facilities availableAdd notes as necessary for anunderstanding of the position
Total facility amountat quarter end
$A’000
Amount drawn atquarter end
$A’000
8.1 Loan facilities 126,197 126,197
8.2 Credit standby arrangements - -
8.3 Other (please specify) - -
8.4 Include below a description of each facility above, including the lender, interest rate andwhether it is secured or unsecured. If any additional facilities have been entered into or areproposed to be entered into after quarter end, include details of those facilities as well.
8.1 The Group has signed a Senior Secured Project Finance Facility Agreement with asyndicate of banks. Under the agreement, the banking syndicate agreed to provideloan facilities totalling US$162 million. This has been paid down to US$85 million
9. Estimated cash outflows for next quarter $A’000
9.1 Exploration and evaluation -
9.2 Development 3,000
9.3 Production 14,000
9.4 Staff costs 6,000
9.5 Administration and corporate costs 300
9.6 Other (provide details if material) – interest payable 1,500
9.7 Total estimated cash outflows 24,800
10. Changes intenements(items 2.1(b) and2.2(b) above)
Tenementreferenceandlocation
Nature of interest Interest atbeginningof quarter
Interestat end ofquarter
10.1 Interests in miningtenements andpetroleum tenementslapsed, relinquishedor reduced
10.2 Interests in miningtenements andpetroleum tenementsacquired or increased
For
per
sona
l use
onl
y

Appendix 5B Mining exploration entity and oil and gas exploration entity quarterly report
+ See chapter 19 for defined terms 1 September 2016 Page 5
Compliance statement
1 This statement has been prepared in accordance with accounting standards and policies which
comply with Listing Rule 19.11A.
2 This statement gives a true and fair view of the matters disclosed.
Sign here: ............................................................ Date: ….31 January 2017............... (Director/Company secretary)
Print name: ...James Wentworth.........................
Notes
1. The quarterly report provides a basis for informing the market how the entity’s activities have been financed for the past quarter and the effect on its cash position. An entity that wishes to disclose additional information is encouraged to do so, in a note or notes included in or attached to this report.
2. If this quarterly report has been prepared in accordance with Australian Accounting Standards, the definitions in, and provisions of, AASB 6: Exploration for and Evaluation of Mineral Resources and AASB 107: Statement of Cash Flows apply to this report. If this quarterly report has been prepared in accordance with other accounting standards agreed by ASX pursuant to Listing Rule 19.11A, the corresponding equivalent standards apply to this report.
3. Dividends received may be classified either as cash flows from operating activities or cash flows from investing activities, depending on the accounting policy of the entity.
For
per
sona
l use
onl
y