for personal use only - asx · $40bn global market size *3 purepro!le lies at the heart of where...
TRANSCRIPT

1H FY16 Results Presentation
A big data insights and programmatic media company
1
For
per
sona
l use
onl
y

2
Agenda
1H FY16 Results Presentation
Business Overview
Financial Performance
What we do
- Data & Insights
- Programmatic Media
Strategy & Operations
Outlook & Objectives
Page(s)
3-5
6-12
13-15
16-18
19-22
23-26
27-28
For
per
sona
l use
onl
y

• Experts in generating valuable consumer data and insights
• Strongly positioned to capitalise on convergence of data technology and programmatic media
• Accelerating growth in a rapidly-expanding global market
Pureprofile key attributes
1H FY16 Results Presentation 3
For
per
sona
l use
onl
y

Solid organic growth and improvements in financial metrics
+62%
$9.3m to $14.9m
52%(+11% YoY
margin improvement)
Constantly improving operational capabilities and investment in new technology
$1.0m(+251% YoY growth)
• Solid growth across all key businesses
• Sparc Media acquisitiondelivering strategic growth
Balancing investment in new technology with profitable growth
YoY revenueincrease
Gross margin
Operating EBITDA
1H FY16 Results Presentation 4
For
per
sona
l use
onl
y

Our expanding global footprint
New York London Krakow
Thessaloniki
Mumbai
Sydney
AucklandMelbourne
120Employees prior to
IPO July 2015
172Employees February 2016
1H FY16 Results Presentation 5
For
per
sona
l use
onl
y

Financial performance
1H FY16 Results Presentation 6
For
per
sona
l use
onl
y

Financial performance
Pro-forma revenue: 62% increase pcp
0
5
10
15
1H FY15 1H FY16
$9.3m
$14.9m62%
Operating EBITDA: 251% increase pcp
-1.0
-0.7
-0.3
0.0
0.3
0.7
1.0
1H FY15 1H FY16
($0.8m)
$1.0m251%
($0.7m)
1H FY16 Results Presentation 7
For
per
sona
l use
onl
y

Strong revenue growth across core businesses
0
2
4
6
1H FY15 1H FY160
3
7
10
1H FY15 1H FY16
Data & Insights: 44% increase pcp Programmatic Media: 73% increase pcp
$3.8m
$5.4m
$5.5m
$9.5m44% 73%
1H FY16 Results Presentation 8
For
per
sona
l use
onl
y

Half year ending 31 Dec1HFY15 Actual
1HFY16 Actual
%
Data & Insights 3.8 5.4 44%
Programmatic Media 5.5 9.5 73%
Total revenue 9.3 14.9 62%
Cost of sales 5.3 7.1 34%
Gross profit 3.9 7.8 98%
Pro forma operating EBITDA (0.7) 1.0 251%
Underlying NPAT (0.8) 0.6 169%
Double digit revenue growth across each product categoryGross profit margin increased to 52% (pcp 42%)Pro forma operating EBITDA of $1.0 million (+ $1.7m pcp)
A $’M
(2)
Notes:(1) Operating EBITDA excludes interest, tax, depreciation, amortisation, and one-off non-operating transaction costs associated with the share based payments, IPO and Sparc Media acquisition and integration and one-off, non-operating costs, which are not representative of the Group’s ongoing operations.
(2) Underlying Net profit ( Loss) after Tax excludes one-off non recurring transaction costs associated with the IPO and Sparc Media acquisition.
(1)
Pro forma financial performance
(1)
1H FY16 Results Presentation 9
For
per
sona
l use
onl
y

Half Year ending 31 Dec HY15 HY16
Operating EBITDA (0.7) 1.0Change in working capital (0.9) (2.0)Operating cashflow (1.6) (1.0)Capex - PP&E - (0.2)Development costs - capitalised (0.7) (1.2)Free Cash Flow (2.3) (2.4)Net proceeds from IPO (after costs) - 7.6Sparc acquisition - (2.9)Net cashflow (2.3) 2.3
A $’M
Cashflow & working capital
(1)
1H FY16 Results Presentation 10
Increased working capital
requirements in H1 from robust
programmatic media revenues (1)
Note:
(1) Timing differences in programmatic media business between receipts and payments
For
per
sona
l use
onl
y
Working capital unlocked
Programmatic Media business growth of 73% pcp,
increasing the working capital requirement
As solution to working capital requirement, new receivables
financing facility established in February 2016
Up to 80% of accounts receivable available for
draw-down as required
1H FY16 Results Presentation 1111
For
per
sona
l use
onl
y

Balance sheet
30 Jun 15 Actual
31 Dec 15 Actual
Net cash 0.3 2.1Net working capital (0.9) 1.6Investments 0.2 5.8Platform development 2.4 4.0PP&E 0.1 0.2TOTAL ASSETS 2.1 13.7Sparc Media consideration (escrow) - (1.5)Other (net) liabilities (1.0) (0.2)NET ASSETS 1.1 12.0
A $’M
Sparc Media escrowed consideration of
$1.5m payable in July 2016 of $0.3m cash
deposit and $1.2m shares
1H FY16 Results Presentation
1212
Net cash comprised of $2.4m cash and $0.3m debt
For
per
sona
l use
onl
y

What we do
1H FY16 Results Presentation 13
For
per
sona
l use
onl
y
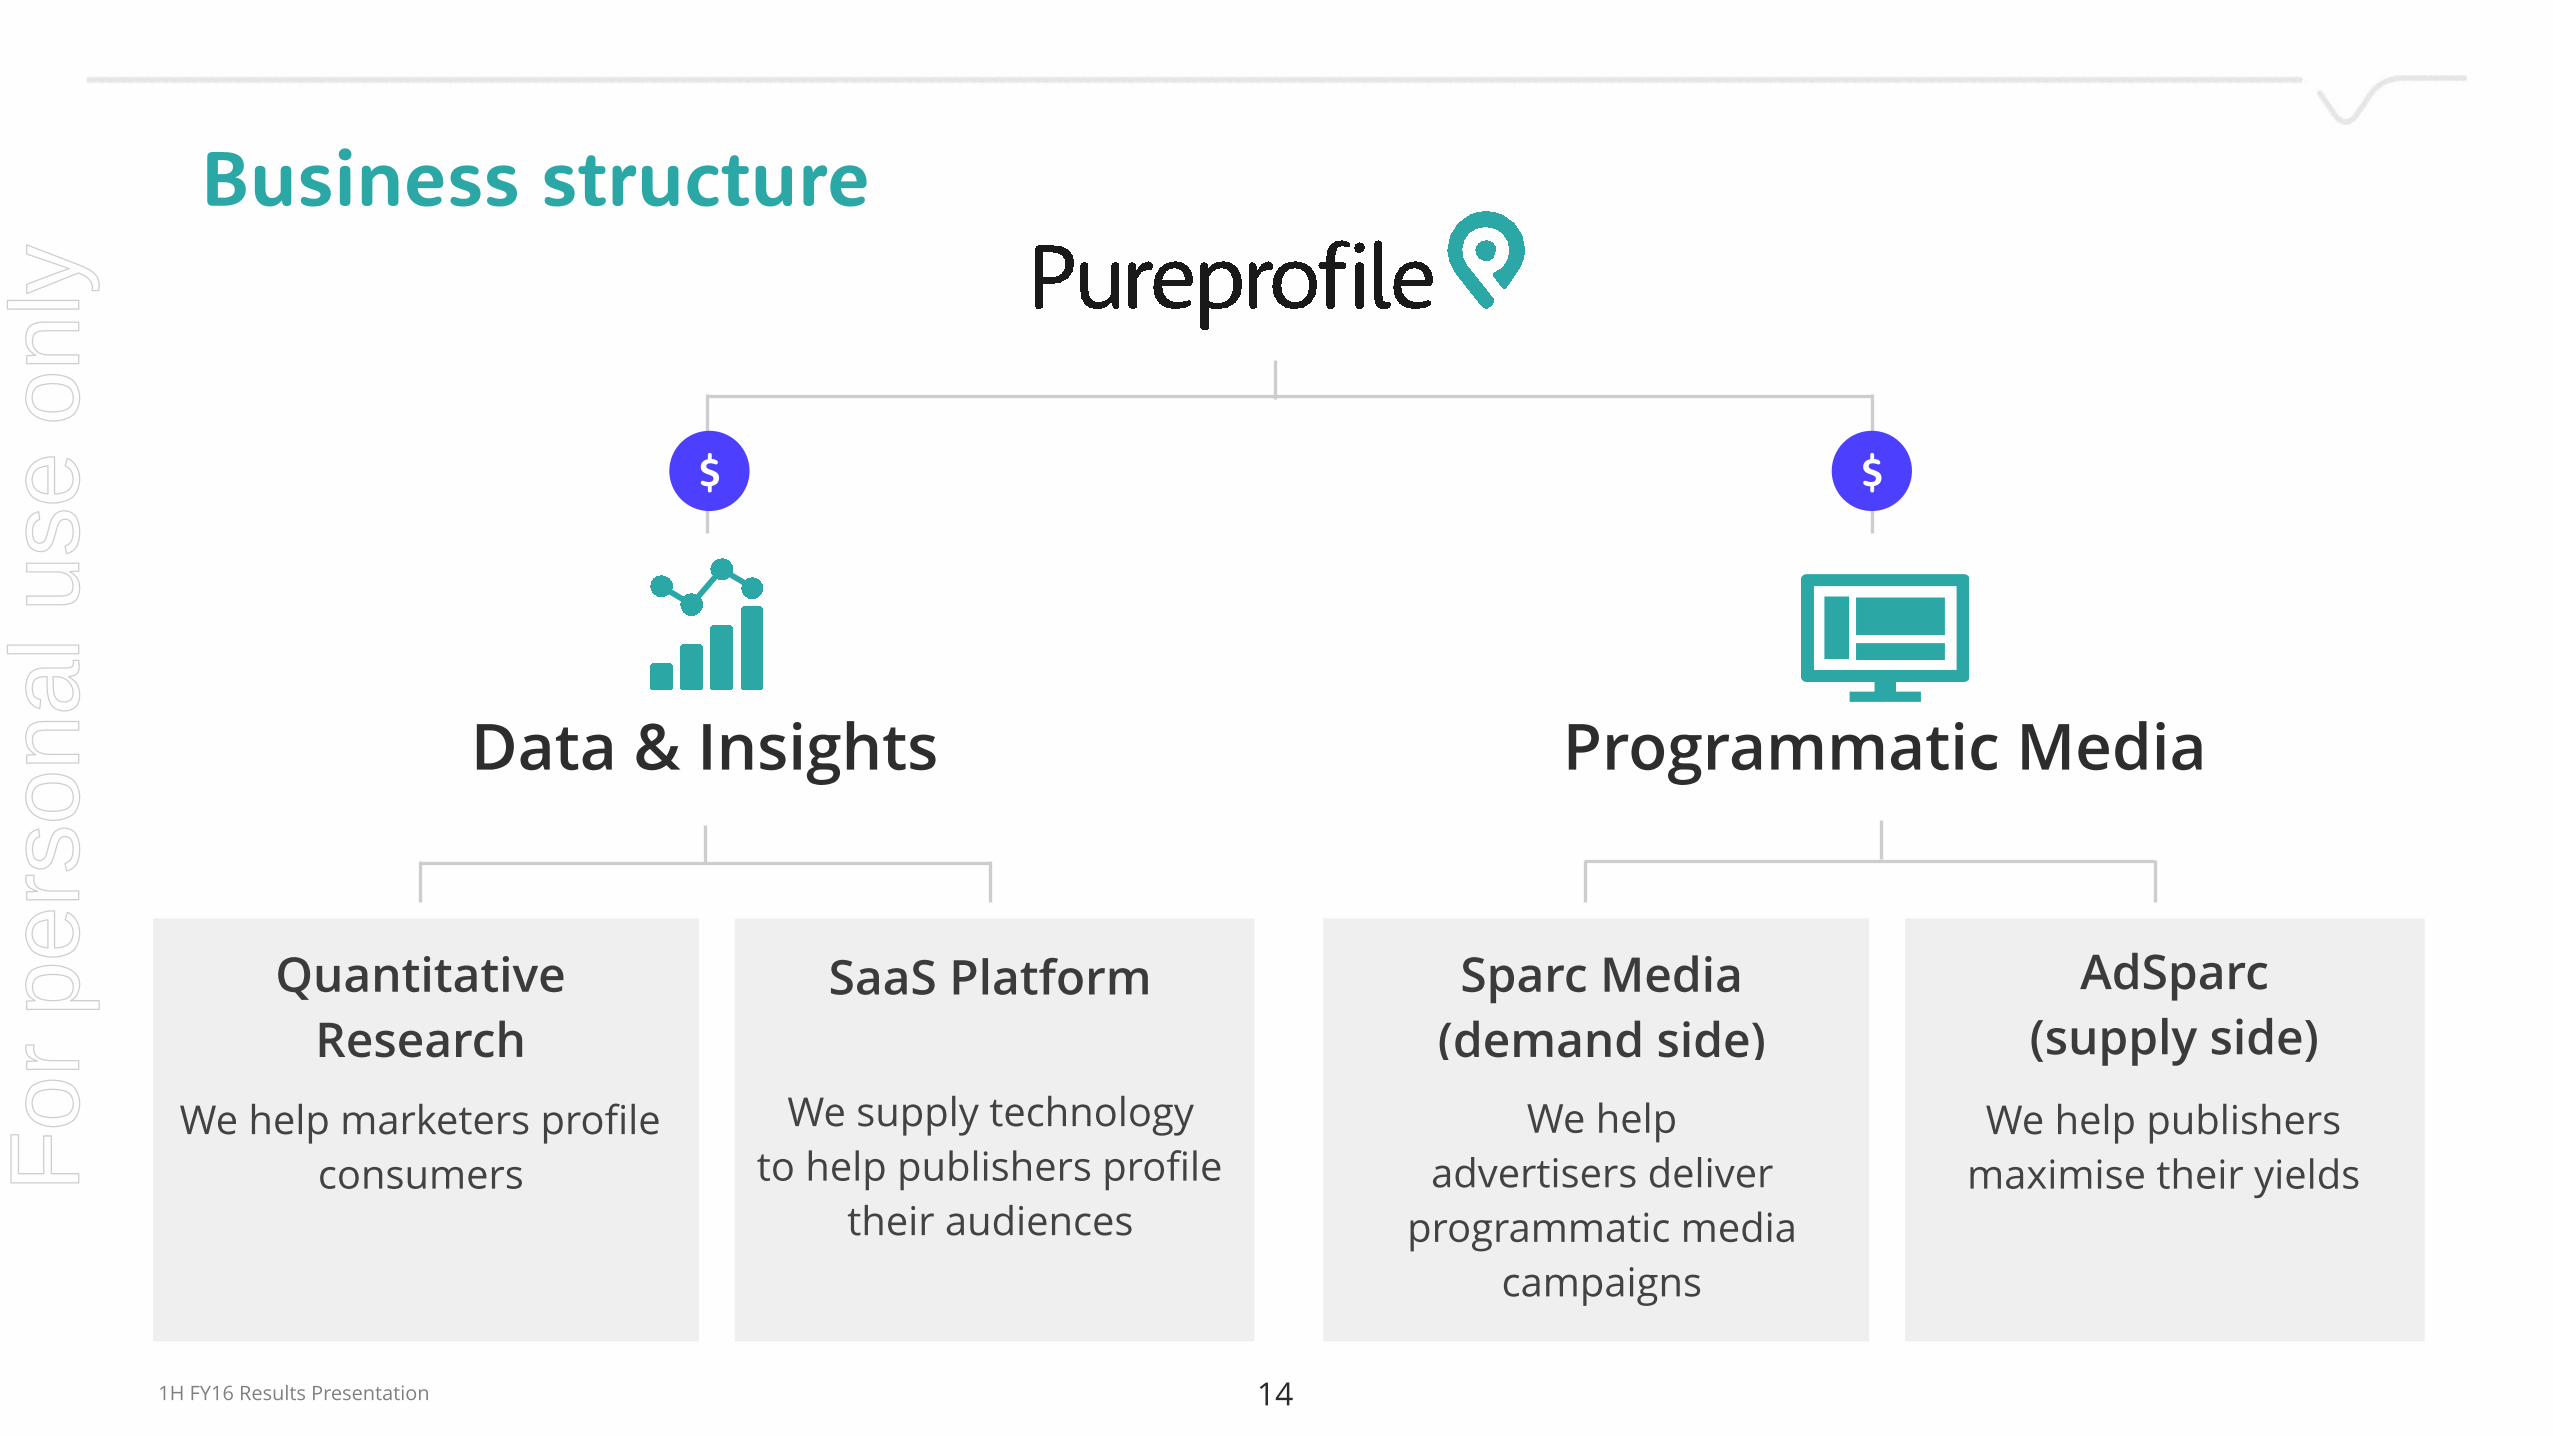
Business structure
Quantitative Research
SaaS Platform
We supply technology to help publishers profile
their audiences
We help advertisers deliver
programmatic media campaigns
We help marketers profile consumers
Sparc Media (demand side)
We help publishers maximise their yields
AdSparc (supply side)
Programmatic MediaData & Insights
$$
1H FY16 Results Presentation 1414
For
per
sona
l use
onl
y

33%
33%
33%Big data Digital data
creation doubling every
2 years *2
Programmatic 50% annual
global growth rate
2015 *1
Research $40bn global market size *3
Pureprofile lies at the heart of where programmatic media, big data and quantitative research converge
Sources
*1: Magna Global 2015 Programmatic Roadmap For Growth *2: EMC/IDC Digital Universe of Opportunities Report 2014 *3: ESOMAR Global Market Research Report 2014
1H FY16 Results Presentation 1515
For
per
sona
l use
onl
y

Data & Insights
1H FY16 Results Presentation 16
For
per
sona
l use
onl
y

Presentation name - April 2015
The $40bn*1 global market research industry is structurally changing and presents opportunities for Pureprofile via digital disruption
The data and insights opportunity
1H FY16 Results Presentation 17
Source *1: ESOMAR Global Market Research Report 2014
For
per
sona
l use
onl
y

How we generate data and insights
We engage with thousands of consumers every day to generate deep data insights for brands, researchers and publishers
1H FY16 Results Presentation 1818
For
per
sona
l use
onl
y

Programmatic Media
1H FY16 Results Presentation 19
For
per
sona
l use
onl
y

The programmatic media opportunity
Global banner and video ad spend (US $bn) (1)
0
12
23
35
47
58
70
2014 2015 2016F 2017F 2018F
$10bn$15bn
$20bn$25bn
$31bn
Sources:
*2: Magna Global 2015 Programmatic Roadmap For Growth *3 PwC Global Entertainment and Media Outlook 2015-2019 *4: eMarketer Media Ad Spending Worldwide 2014-2019 (Sept 2015)
Programmatic penetration
25% 33% 38% 42% 48%
Programmatic growth
67% 50% 33% 25% 24%
Non programmatic *2
Digital to become biggest ad category globally by 2019 *3
Total programmatic *2
Global programmatic spend expected to double by FY18 *4
1H FY16 Results Presentation 2020
$30bn$31bn
$32bn$34bn
$34bn$40bn
$46bn$52bn
$59bn$65bn
(1) Global banner and video ad spend excludes search and social
Note:For
per
sona
l use
onl
y

We deliver programmatic media campaigns
We use programmatic advertising technology to deliver targeted advertising campaigns
Potentially buying luxury car
Potentially selling home
Potentially buying fridge
1H FY16 Results Presentation 2121
For
per
sona
l use
onl
y

What we do for publishers
Our SaaS technology platform enables publishers to profile their audience and deliver more relevant
content and advertising experiences
1H FY16 Results Presentation 2222
For
per
sona
l use
onl
y

Strategy & operations
1H FY16 Results Presentation 23
For
per
sona
l use
onl
y

Past
$10m
$12m
$14m
$16m
$18m
$20m
$22m
$24m
$26m
$28m
$30m
FY14A FY15A FY16F
Data & Insights
Accelerate expansion into US and UK markets
Programmatic Media
Remain exposed to the strong growth in the programmatic media market
Technology
Invest in the development of our data and technology products
Acquisitions
Pursue pipeline of targets in line with our M&A strategy
Present
Strategic growth drivers
Future
1H FY16 Results Presentation 2424
For
per
sona
l use
onl
y

Data & Insights Accelerate data and insights footprint by acquiring and upgrading 1st generation online research panels operating in target markets
Programmatic Media Acquire companies similar to Sparc Media who have an established client base and proven programmatic expertise
Platform technology Acquire companies or assets with key pieces of technology and expertise that will complement our platform (such as Effective Measure)
M&A strategy
Europe USA
Australia & NZ
Target growth markets
1H FY16 Results Presentation 2525
For
per
sona
l use
onl
y

Note: Effective Measure is a leading global provider of audience measurement, advertising effectiveness and targeting solutions. PPL has acquired its assets across the Australia and New Zealand region.
Acquisition offers very organic revenue growth and platform technologies for minimal cash outlay
Effective Measure acquisition accelerates proprietary big data and technology
Premium publisher contracts
PPL acquires behavioural data from 100 online publishers across ANZ
Online panel members & data solutions
PPL will deliver audience measurement & enhanced insights to EM’s established clients
and invest in further client development
Enhanced data capture & programmatic targeting
Opportunity to significantly enhance publisher solutions and extend
programmatic media offering
1H FY16 Results Presentation 2626
For
per
sona
l use
onl
y

Outlook & objectives
1H FY16 Results Presentation 27
For
per
sona
l use
onl
y

Objectives & outlook
On target to exceed $28.1m FY16 prospectus revenue forecast
Operating EBITDA in line with prospectus forecasts
Focus on continued organic growth and international expansion
Exciting pipeline of tech innovation
1H FY16 Results Presentation 2828
For
per
sona
l use
onl
y

The information contained in this Presentation or subsequently provided to the recipient whether orally or in writing by, or on behalf of Pureprofile Ltd. (Pureprofile) or any of its directors, officers, employees, agents, representatives and advisers (the Parties) is provided to the recipient on the terms and conditions set out in this notice.
The information contained in this Presentation has been furnished by the Parties and other sources deemed reliable but no assurance can be given by the Parties as to the accuracy or completeness of this information.
To the full extent permitted by law:
(a) no representation or warranty (express or implied) is given; and
(b) no responsibility or liability (including in negligence) is accepted,
by the Parties as to the truth, accuracy or completeness of any statement, opinion, forecast, information or other matter (whether express or implied) contained in this Presentation or as to any other matter concerning them.
To the full extent permitted by law, no responsibility or liability (including in negligence) is accepted by the Parties:
(a) for or in connection with any act or omission, directly or indirectly in reliance upon; and
(b) for any cost, expense, loss or other liability, directly or indirectly, arising from, or in connection with, any omission from or defects in, or any failure to correct any information,
in this Presentation or any other communication (oral or written) about or concerning them.
The delivery of this Presentation does not under any circumstances imply that the affairs or prospects of Pureprofile or any information have been fully or correctly stated in this Presentation or have not changed since the date at which the information is expressed to be applicable. Except as required by law and the ASX listing rules, no responsibility or liability (including in negligence) is assumed by the Parties for updating any such information or to inform the recipient of any new information of which the Parties may become aware.
Notwithstanding the above, no condition, warranty or right is excluded if its exclusion would contravene the Competition and Consumer Act 2010 or any other applicable law or cause an exclusion to be void.
The provision of this Presentation is not and should not be considered as a recommendation in relation to an investment in Pureprofile or that an investment in Pureprofile is a suitable investment for the recipient.
References to ‘underlying’ information is to non-IFRS financial information prepared in accordance with ASIC Regulatory Guide 230 (Disclosing non-IFRS financial information) issued in December 2011.
Non-IFRS financial information has not been subject to audit or review.
This presentation is for information purposes only and does not constitute or form part of any offer or invitation to acquire, sell or otherwise dispose of, or issue, or any solicitation of any offer to sell or otherwise dispose of, purchase or subscribe for, any securities, nor does it constitute investment advice, nor shall it or any part of it nor the fact of its distribution form the basis of, or be relied on in connection with, any or contract or investment decision.
Disclaimer
291H FY16 Results Presentation
For
per
sona
l use
onl
y

Thank you
1H FY16 Results Presentation
For
per
sona
l use
onl
y