food security resulting from climate change
TRANSCRIPT
Household Vulnerability to Food Security Resulting from Climate Change in the Philippines
Food and Nutrition Research InstituteDepartment of Science and Technology

Background
Food and Nutrition Research InstituteDepartment of Science and Technology

As defined in the World Food Summit, food security is existing“when all people at all times have access to sufficient, safe, andnutritious food to maintain a healthy and active life”.
WHO, 1996
Food Security
Food and Nutrition Research InstituteDepartment of Science and Technology

Food Security
Food Security
ProductionProduction
ConsumptionConsumption
DistributionDistribution
Food Security Concept
Food and Nutrition Research InstituteDepartment of Science and Technology
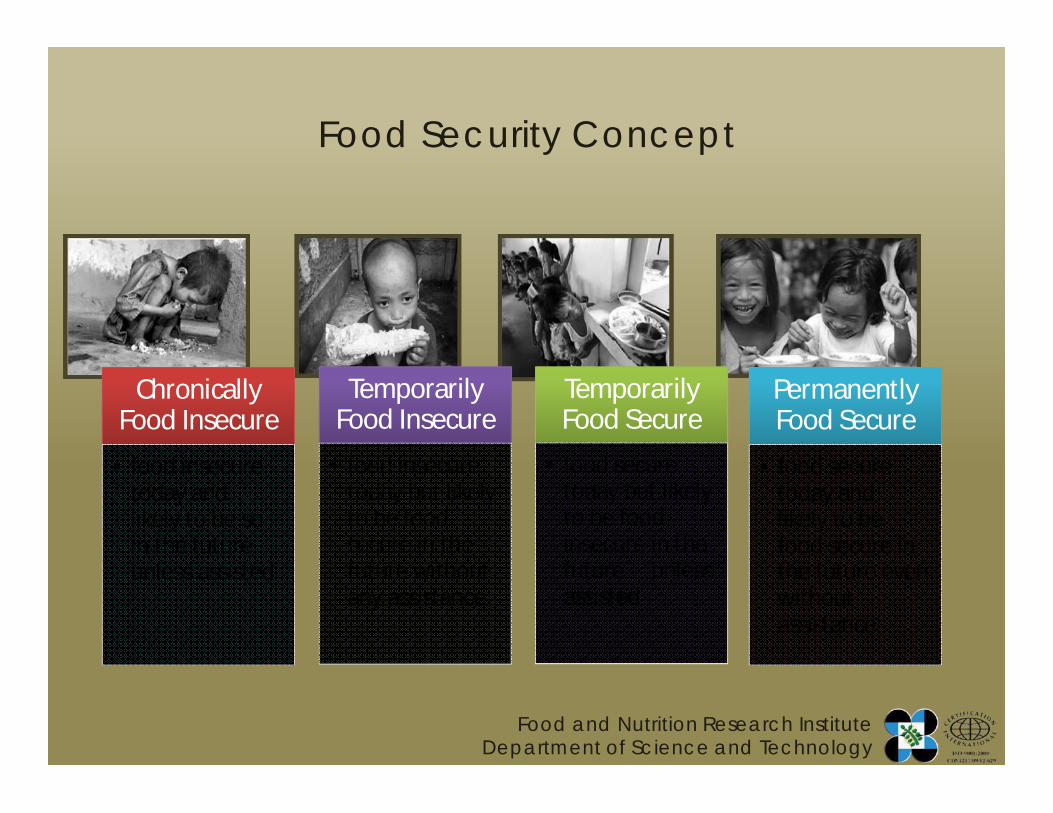
Chronically Food Insecure
• food insecure today and likely to be so in the future unless assisted
Temporarily Food Secure
• food secure today but likely to be food insecure in the future unless assisted
Temporarily Food Insecure
• food insecure today but likely to be food secure in the future without any assistance
Permanently Food Secure
• food secure today and likely to be food secure in the future even without assistance
Food Security Concept
Food and Nutrition Research InstituteDepartment of Science and Technology

What is vulnerability?
Vulnerability = sensitivity + exposure - adaptability
HazardHazard
ExposureExposure
ImpactImpact
SensitivitySensitivity
Adaptive CapacityAdaptive Capacity
Vulnerability to Climate ChangeVulnerability to Climate Change
Outcome VulnerabilityOutcome Vulnerability Contextual VulnerabilityContextual Vulnerability
income
gender
occupation
Food and Nutrition Research InstituteDepartment of Science and Technology

What is vulnerability to climate change?
Food and Nutrition Research InstituteDepartment of Science and Technology

Why assess vulnerability?
Priority Setting
Developing policies and adaptation strategies
Fostering collaboration
Food and Nutrition Research InstituteDepartment of Science and Technology
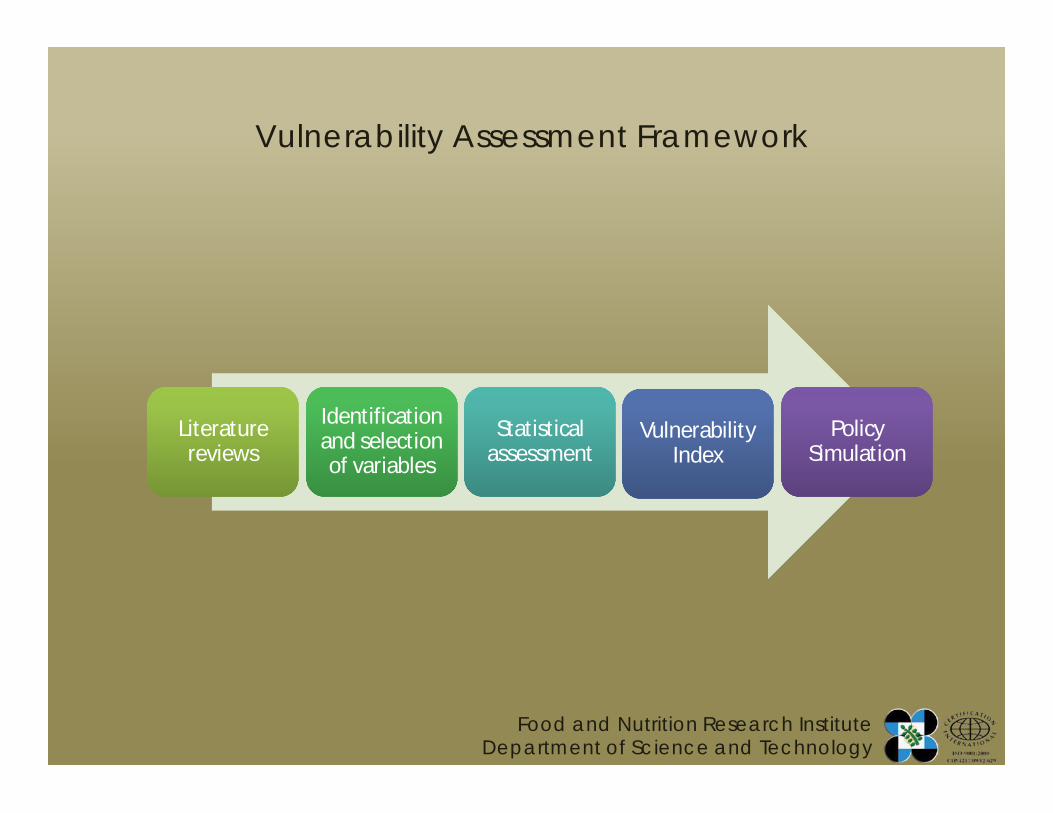
Literature reviews
Literature reviews
Identification and selection of variables
Identification and selection of variables
Statistical assessment Statistical
assessment Vulnerability
IndexVulnerability
IndexPolicy
SimulationPolicy
Simulation
Vulnerability Assessment Framework
Food and Nutrition Research InstituteDepartment of Science and Technology
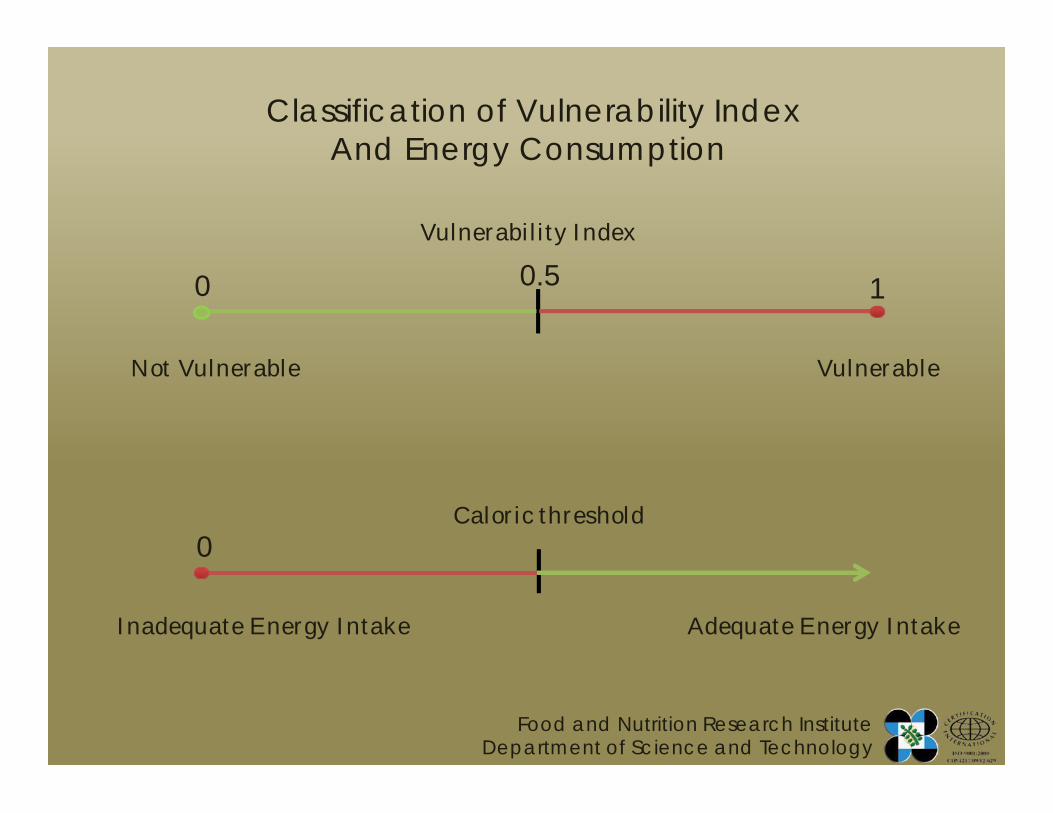
Classification of Vulnerability Index And Energy Consumption
Not Vulnerable Vulnerable
0.5 10
Vulnerability Index
Caloric threshold
Inadequate Energy Intake Adequate Energy Intake
0
Food and Nutrition Research InstituteDepartment of Science and Technology
Objectives of the Study
• identify and map the location of vulnerable groups
• determine the degree of vulnerability
• formulate policies that help a community or a particular household adapt to climate shocks
• determine the association of policy-related actions with small adverse effects of climate change
Food and Nutrition Research InstituteDepartment of Science and Technology
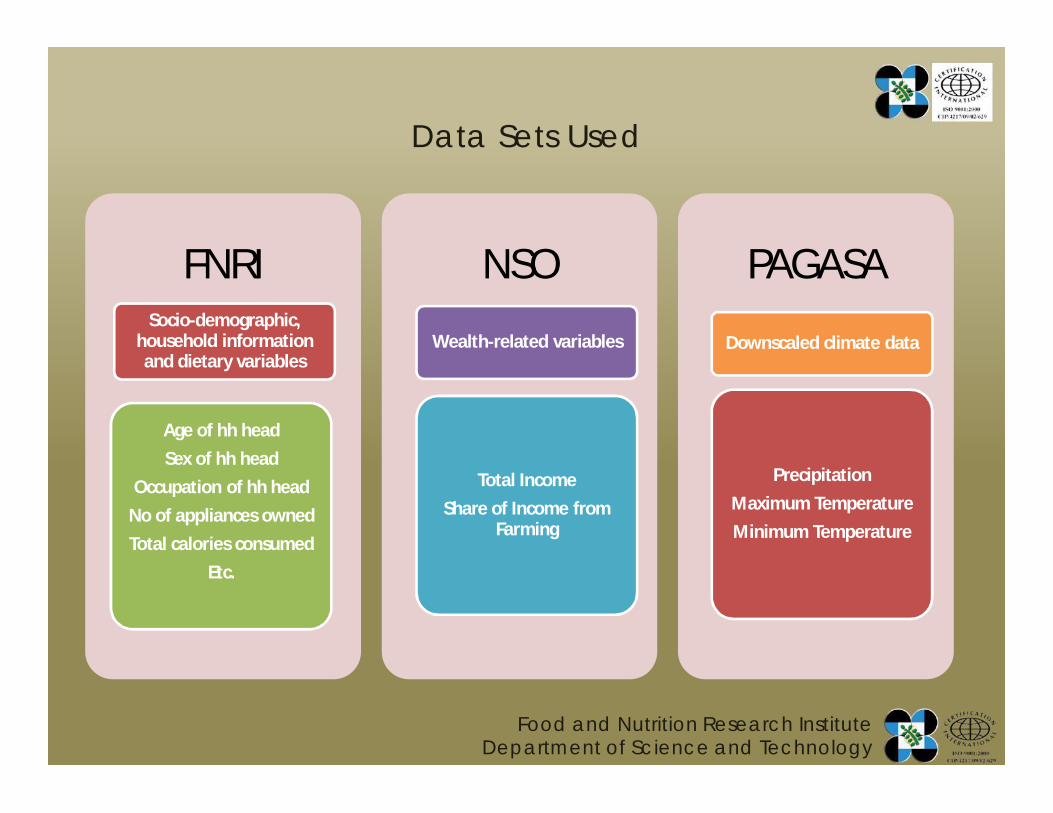
Data Sets Used
FNRISocio-demographic,
household information and dietary variables
Age of hh headSex of hh head
Occupation of hh headNo of appliances ownedTotal calories consumed
Etc.
NSO
Wealth-related variables
Total IncomeShare of Income from
Farming
PAGASA
Downscaled climate data
PrecipitationMaximum TemperatureMinimum Temperature
Food and Nutrition Research InstituteDepartment of Science and Technology
Results
Food and Nutrition Research InstituteDepartment of Science and Technology

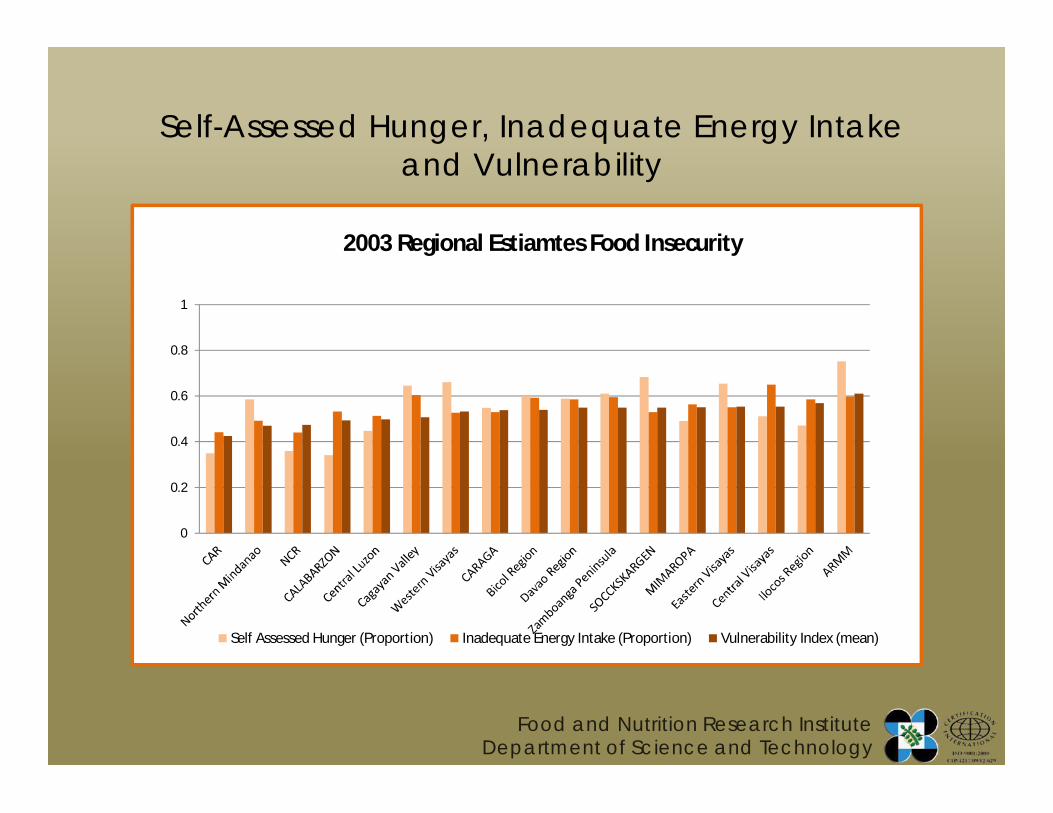
Self-Assessed Hunger, Inadequate Energy Intakeand Vulnerability
0 0.1 0.2 0.3 0.4 0.5 0.6
Vulnerable
InadequateEnergy Intake
Self-AssessedHunger
Proportion
2003 National Estimates of Food Insecurity
Food and Nutrition Research InstituteDepartment of Science and Technology
Self-Assessed Hunger, Inadequate Energy Intakeand Vulnerability
0
0.2
0.4
0.6
0.8
1
2003 Regional Estiamtes Food Insecurity
Self Assessed Hunger (Proportion) Inadequate Energy Intake (Proportion) Vulnerability Index (mean)
Food and Nutrition Research InstituteDepartment of Science and Technology

0%
20%
40%
60%
80%
100%
1-4 5-8 9-12 13 upHousehold Size
Inadequate Energy Intake (proportion) Vulnerability Index (mean)
2003 Estimates of Vulnerability across Household Size
Food and Nutrition Research InstituteDepartment of Science and Technology

2003 Estimates of Vulnerability across Educational Attainment of Household Head
0%
20%
40%
60%
80%
100%
At most 3rd Grade 3rd Grade - 4th YearHigh School
1st year College - 3rdYear College
College Graduate andAbove
Educational Attainment
Inadequate Energy Intake (proportion) Vulnerability Index (mean)
Food and Nutrition Research InstituteDepartment of Science and Technology

2003 Estimates of Vulnerability and Fraction of Calorie Consumed Relative to Expected Calorie Consumption
Calorie Consumed Over Expected Calorie Consumption
Vuln
erab
ility
Inde
x
10
20
0.4
0
.6
0.
8
1.0
0.0 0.2 0.4 0.6 0.8 1.0
Food and Nutrition Research InstituteDepartment of Science and Technology

2003 Estimates of Vulnerability and Precipitation(Agricultural Households)
2003 Rainfall (mm)
Vuln
erab
ility
Inde
x
0.0
0.
2
0.4
0.6
0
.8
1.0
1500 2000 2500 3000 3500
Lowess smoother
Food and Nutrition Research InstituteDepartment of Science and Technology
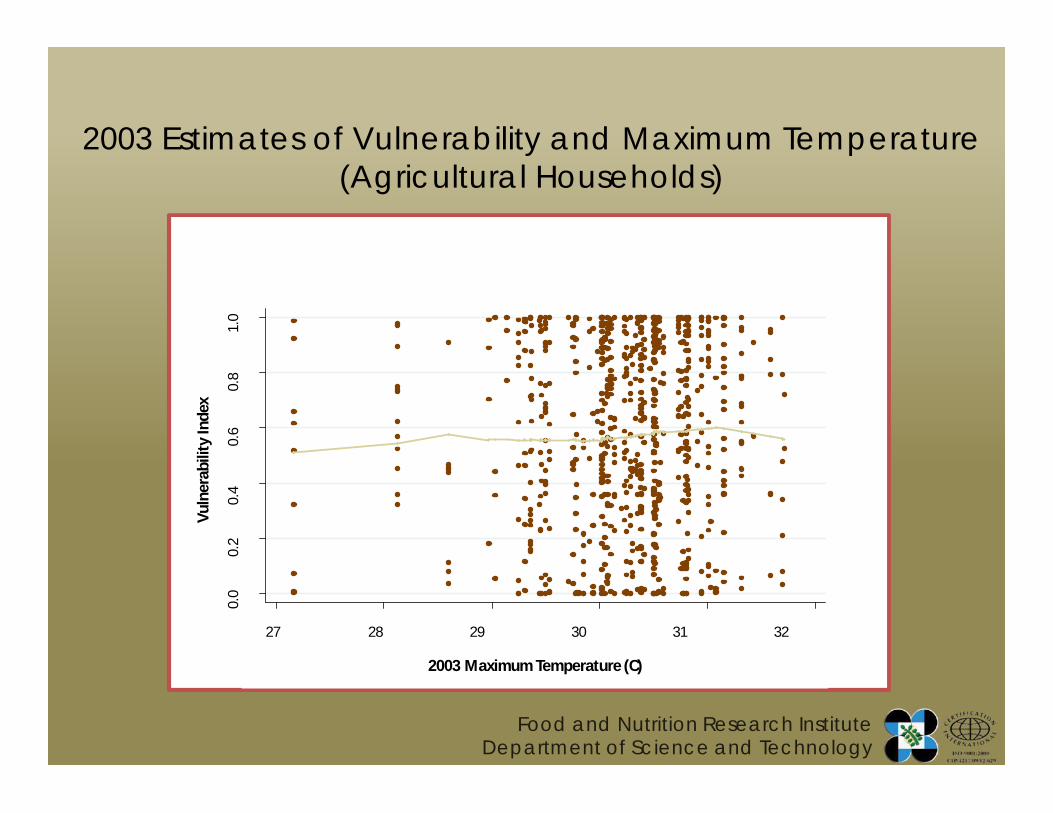
2003 Maximum Temperature (C)
Vuln
erab
ility
Inde
x
0.0
0.
2
0.4
0
.6
0.8
1.0
27 28 29 30 31 32
0.2
.4.6
.81
2003 Estimates of Vulnerability and Maximum Temperature(Agricultural Households)
Food and Nutrition Research InstituteDepartment of Science and Technology

2003 Minimum Temperature (C)
Vuln
erab
ility
Inde
x
0.0
0
.2
0.
4
0.6
0
.8
1.
0
14 16 18 20 22 24 14 16 18 20 22 24
2003 Estimates of Vulnerability and Minimum Temperature(Agricultural Households)
Food and Nutrition Research InstituteDepartment of Science and Technology

VulnerableTotalInadequate Energy
Intake No Yes
No 40.99% [0.2057] 4.23% [0.6650] 45.22 [0.2487]
Yes 5.91% [0.3257] 48.87% [0.8051] 54.78 [0.7534]
Total 46.90% [0.2209] 53.10% [0.7940] 100.00 [0.5252]
Inadequate energy intake and Vulnerability in the Philippines, 2003(population shares in % and mean vulnerability probability in parenthesis)
Vulnerability and Inadequate Energy Intake
Food and Nutrition Research InstituteDepartment of Science and Technology
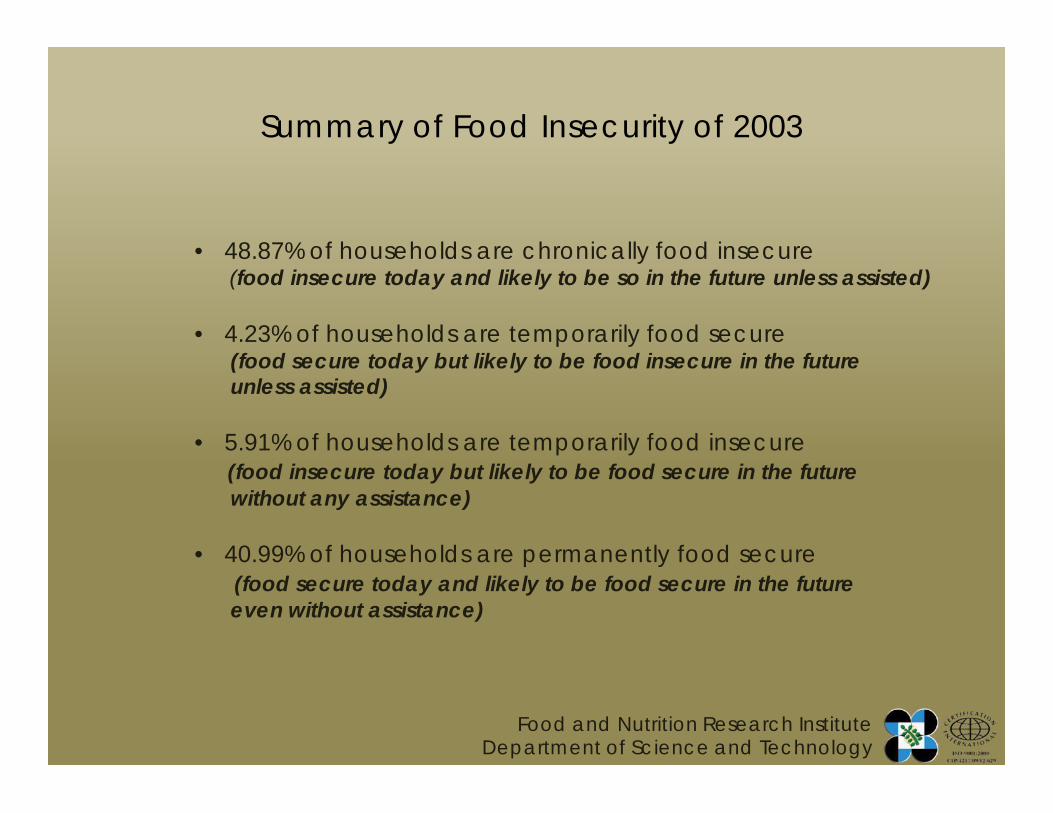
• 48.87% of households are chronically food insecure (food insecure today and likely to be so in the future unless assisted)
• 4.23% of households are temporarily food secure (food secure today but likely to be food insecure in the future unless assisted)
• 5.91% of households are temporarily food insecure (food insecure today but likely to be food secure in the future without any assistance)
• 40.99% of households are permanently food secure (food secure today and likely to be food secure in the future even without assistance)
Summary of Food Insecurity of 2003
Food and Nutrition Research InstituteDepartment of Science and Technology

Simulation
Food and Nutrition Research InstituteDepartment of Science and Technology

Simulation: Maximum Temperature and Vulnerability
0%
20%
40%
60%
80%
100%
actual 5% increase in maximumtemperature
10% increase in maximumtemperature
Mea
n Vu
lner
abili
ty
2003 2008
Food and Nutrition Research InstituteDepartment of Science and Technology

Maximum Temperature in the Philippines (1979-2050)
Food and Nutrition Research InstituteDepartment of Science and Technology

Simulation: Minimum Temperature and Vulnerability
0%
20%
40%
60%
80%
100%
actual 5% increase in minimumtemperature
10%increase in minimumtemperature
Mea
n Vu
lner
abili
ty
2003 2008
Food and Nutrition Research InstituteDepartment of Science and Technology

Minimum Temperature in the Philippines (1979-2050)
Food and Nutrition Research InstituteDepartment of Science and Technology

Simulation: Educational Attainment and Vulnerability
0
0.1
0.2
0.3
0.4
0.5
0.6
actual mimimum ofelementary level
minimum of highschool level
at least college
Mea
n Vu
lner
abili
ty
2003 2008
Food and Nutrition Research InstituteDepartment of Science and Technology

Thank You.We do not own/claim any of the pictures
included in this presentation.

Characteristics Of Household Head
• Age• Education• Civil Status• Sex
• Occupation• Place of Work• Physiological Status
Variables Used in the Study
Variables Used in the Study
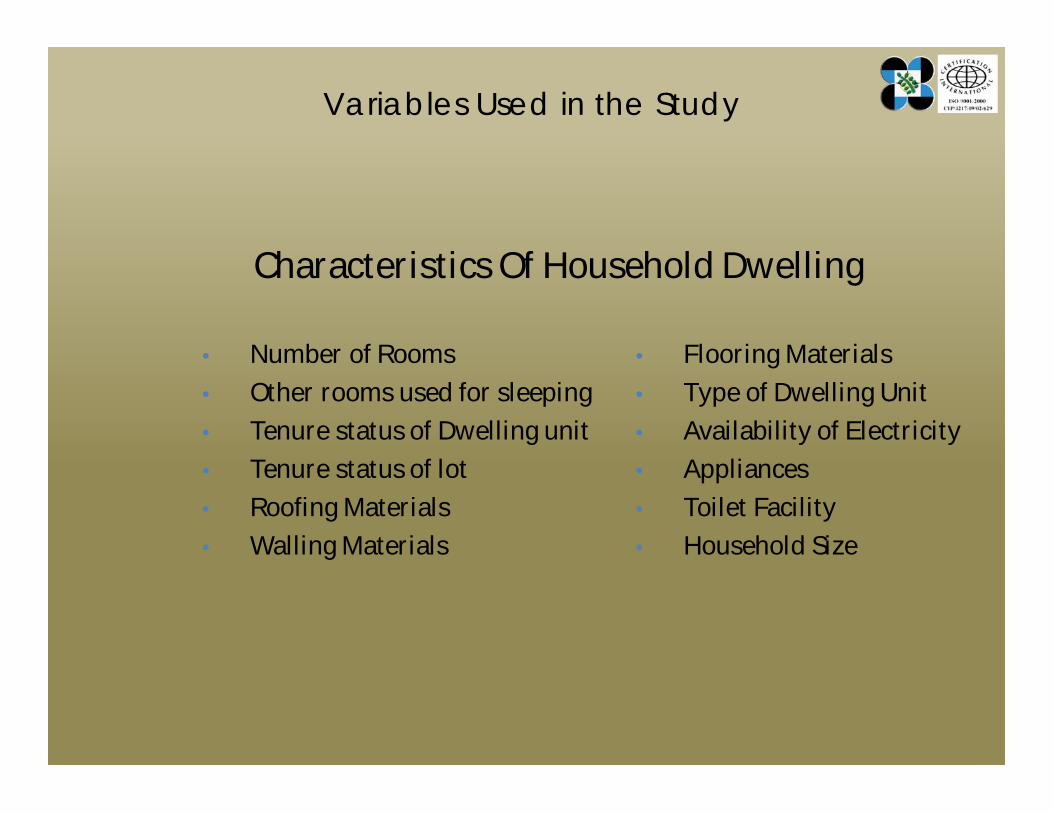
Characteristics Of Household Dwelling
• Number of Rooms• Other rooms used for sleeping • Tenure status of Dwelling unit• Tenure status of lot• Roofing Materials• Walling Materials
• Flooring Materials• Type of Dwelling Unit• Availability of Electricity• Appliances• Toilet Facility• Household Size

Variables Used in the Study
Communication Infrastructure
• Telephone/Cellphone
Household Transportation
• Car• Motorcycle/Tricycle

Variables Used in the Study
Climate Variables
• Level change of Rainfall relative to past 20 year average• Level change of Maximum and Minimum Temperature
relative to past 20 year average• Climate type
Wealth Index
• Total Income• Share of Agricultural Income
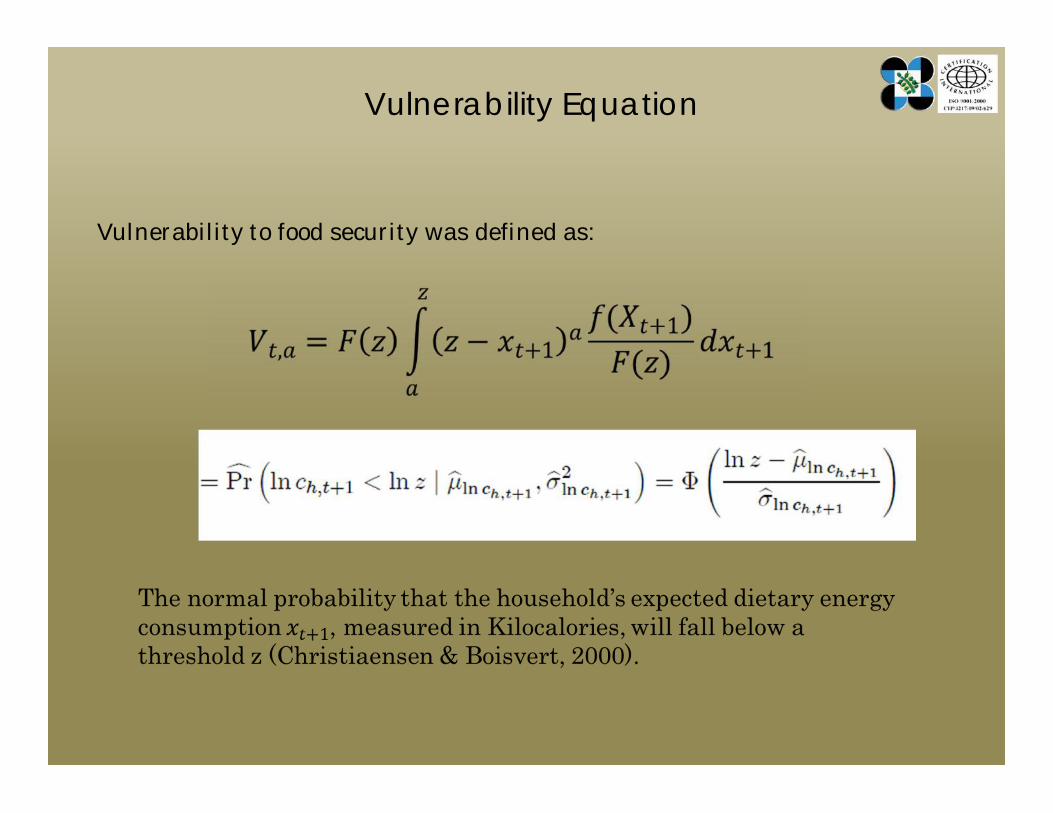
Vulnerability Equation
Vulnerability to food security was defined as:

AFRIS. AsianFoodRegulationInformationService.
We have the largest database of Asian food regulations in the world and it’s FREE to use.
We publish a range of communication services, list a very large number of food events and online educational webinars and continue to grow our Digital
Library.
We look forward to hearing from you soon!