flow-driven soil erosion processes and the size selectivity of sediment
TRANSCRIPT

Journal of Hydrology 406 (2011) 73–81
Contents lists available at ScienceDirect
Journal of Hydrology
journal homepage: www.elsevier .com/ locate / jhydrol
Flow-driven soil erosion processes and the size selectivity of sediment
H. Asadi a,⇑, A. Moussavi a, H. Ghadiri b, C.W. Rose b
a Faculty of Agricultural Sciences, University of Guilan, Rasht 41635-1314, Iranb Faculty of Environmental Sciences, Environmental Future Centre, Griffith University, Nathan, Queensland 4111, Australia
a r t i c l e i n f o
Article history:Received 30 September 2010Received in revised form 12 April 2011Accepted 2 June 2011Available online 25 June 2011
This manuscript was handled by A.Bardossy, Editor-in-Chief, with theassistance of Sheng Yue, Associate Editor
Keywords:Suspension–saltationRollingStreampowerDensityAggregate
0022-1694/$ - see front matter � 2011 Elsevier B.V. Adoi:10.1016/j.jhydrol.2011.06.010
⇑ Corresponding author. Address: Soil Science DeparSciences, University of Guilan, Rasht, P.O. Box 41636690388; fax: +98 131 6690281.
E-mail address: [email protected] (H. Asadi).
s u m m a r y
The processes and mechanisms of entrainment and transportation of soil particles by surface runoff wasinvestigated in the laboratory by a 0.05 � 0.2 � 3 m flume for two contrasting soil samples. The resultsshow that there are at least two different mechanisms affecting particle transport by flow, with their rel-ative importance relating to hydraulic condition, especially flow streampower. Different particle sizeclasses are transported mainly by one mechanism. Suspension/saltation was observed to be the onlymechanism at low streampowers (<0.1 W m�2). Bed load transport, probably involving rolling was shownto be activated at the streampowers greater than a specific threshold of about 0.1–0.15 W m�2, becomingthe dominant transport mechanism at these modest streampowers. The relative importance of the twotransport mechanisms was also related to soil types. Particle density seemed to have a main role in thiscontext. Comparison with theoretical prediction of sediment concentration provided some support forthe increasing dominance of bed load transport mechanisms with increasing streampower in theseexperiments.
� 2011 Elsevier B.V. All rights reserved.
1. Introduction
Previous studies have shown that in soil erosion due to steadyoverland flow there are dynamic changes in sediment characteris-tics, especially its size distribution (e.g. Asadi et al., 2007b;Baigorria and Romero, 2007; Rose et al., 2007). Related changesalso occur under rainfall erosion (e.g. Hairsine et al., 1999; Hogarthet al., 2004). A better understanding of the dynamics of thesediment size distribution will improve understanding of erosionand sedimentation processes, and consequently improve erosionmodeling. It can also provide the basis for understanding of thetransfer of nutrients and pollutants from agricultural and rangelands to waterways, and the ability to better model these fluxes(Tromp-van Meerveld et al., 2008).
It has been reported that interrill soil erosion processes are size-selective (Asadi et al., 2007a,b; Gabriels and Moldenhauer, 1978;Hairsine et al., 1999; Hogarth et al., 2004; Loch and Donnollan,1982; Malam Issa et al., 2006; Meyer et al., 1980; Miller andBaharuddin, 1987; Mitchell et al., 1980; Proffitt et al., 1991;Romero et al., 2007; Slattery and Burt, 1997; Sutherland et al.,1996; Wan and El-Swaify, 1998). The general agreement is thateroding sediment is enriched in clay and silt-sized particles rela-
ll rights reserved.
tment, Faculty of Agricultural5-1314, Iran. Tel.: +98 131
tive to the original soil in the commencement of the erosion eventand gradually becomes coarser, becoming very similar to that ofthe original soil at final steady state condition. However, in somecases it has been observed that the sediment size distribution is bi-modal during the erosion event, especially for flow-driven erosion(Asadi et al., 2007b).
Under flow-driven erosion at low streampowers, Asadi et al.(2007b) found that the size of sediment is distributed as a bimodaltype of mass fraction. They concluded that this characteristicbehavior did not result from the size distribution of the originalsoil, nor is it all likely to have been the result of aggregate break-down during erosion. It was concluded that the bimodal distribu-tion of the sediment resulted from two different transportmechanisms of suspension/saltation and rolling, acting dominantlyon particles of different size classes (Asadi et al., 2007b).
Approximate (Rose et al., 2007) and analytic (Tromp-van Meer-veld et al., 2008) solutions to Hairsine–Rose theory (Hairsine andRose, 1991, 1992a,b) for flow and rainfall erosion respectively,have shown some differences between the observed and predictedsize distribution of sediment. The presence of rolling in conjunc-tion with or parallel to saltation, the only mechanism assumed inthe theory, was mentioned as a possible reason for such differences(Rose et al., 2007).
A hypothesis to explain previous experimental results whichshowed a bimodal distribution for sediment size (Asadi et al.,2007b) was that there may be some threshold in streampowerwhich needs to be exceeded for rolling transport to occur for

0
20
40
60
80
100
120
0.01 0.1 1 10
Cum
mul
ativ
e m
ass
perc
ent
le
ss th
an
Sieve size (mm)
Fluvial Sand
Forest Soil
Fig. 1. Secondary particle (aggregate) size distribution of the soil used in the study.
74 H. Asadi et al. / Journal of Hydrology 406 (2011) 73–81
medium to larger sized sediment particles or aggregates. In thereported experiments the experimental conditions investigatedby Asadi et al. (2007b) have been extended to somewhat higherstreampowers, and furthermore the effect of particle density ontransport mechanisms has been investigated.
2. Materials and methods
Two contrasting soil materials were used in the study to pro-vide particles with different densities. The first soil was a well-aggregated forest soil with mean weight diameter of aggregates(<4 mm) of 1.69 mm, and the second was a non-cohesive fluvialsand. The forest soil has a clayey texture containing 5.25% and2.75% organic matter and equivalent calcium carbonate, respec-tively. Though particle density was assumed to be 2650 kg m�3
for fluvial sand particles, it was 1760 kg m�3 on average for forestsoil particles (aggregates) measured by the method of Chepil(1950). Secondary particle (aggregate) size distribution (denotedPSD) of the two samples as measured by wet sieving was almostsimilar (Fig. 1). The main difference of particle size distribution(PSD) between the two samples is related to the maximum sizewhich was chosen arbitrarily. While the forest soil was passedthrough a 4 mm sieve, the fluvial sand was passed through a
3.5 m
20 cm
20 cm
Soil Supporting Board
(a)
Fig. 2. The flume used in the study (a), and fin
2.36 mm sieve. A pre-test experiment showed no particlemovement under shallow flows used in this study for fluvial sandwhich had passed through a 4 mm sieve.
A solid base tilting flume with runon facility was used to carryout the experiments (Fig. 2a). In all the reported experiments, flowwas provided at the top of the flume at a constant rate. After a setof pre-test experiments, to carry out experiments in a wider rangeof hydraulic conditions the width of the flume was reduced to 5 cm(Fig. 2b) to avoid rilling and maintain an uniform flow during theexperiment. A uniform bed with 5 cm depth of each sample wasformed before being saturated for one night with tap water. Thestudy was performed during 2009 at the soil erosion research lab-oratory of Guilan University.
Seven experiments were carried out on the forest soil and eighton the fluvial sand. Flow streampower ranged from 0.05 to 0.47and 0.08 to 0.49 W m�2 for forest soil and sand, respectively. Also,the range of flow depth was 4–14 and 4–24 mm for forest soil andsand, respectively. Hereafter the experiments on the forest soil willbe denoted by F1–F7 and those on the sand by S1–S8. The details ofthe experiments including slope steepness and flow rates are givenin Table 1. Experiment duration was 20 min.
Flow streampower (O) was calculated by:
X ¼ qgSq ðW m�2Þ ð1Þ
where q is the density of the fluid, g is gravitational acceleration, Sis slope angle of flume bed, and q is the volumetric flux per unitwidth.
Runoff was periodically sampled to yield measurement ofsediment concentration and the aggregate size distribution oferoded sediment leaving the flume during the experiments. Eight200–400 mL samples were collected for determining sedimentconcentration and four 2–5 l samples were taken at 1, 5, 10 and20 min from the commencement of the experiment for PSD analy-sis. The nest of sieves used in wet sieving were of size 2.0, 1.0, 0.5,0.25, 0.125, 0.075 and 0.044 mm. Wet sieving was commencedwith fast wetting (immersion wetting) for original soil samples,and within 48 h of the experiment for sediment samples. The dura-tion of sieving for every sample was 10 min at a frequency of40 RPM.
Using the wet sieving data, each of the original un-erodedmaterials, [i.e. forest soil (<4 mm) and fluvial sand (<2.36 mm)],
(b)
al bed dimension in the experiments (b).
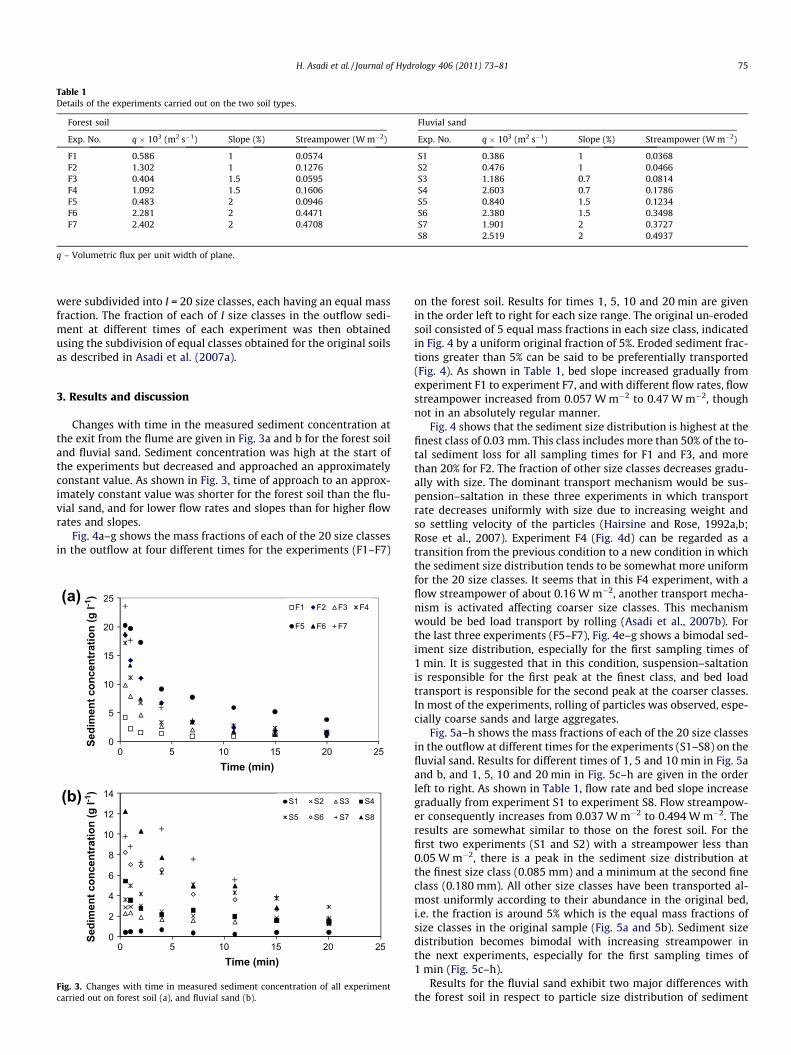
Table 1Details of the experiments carried out on the two soil types.
Forest soil Fluvial sand
Exp. No. q � 103 (m2 s�1) Slope (%) Streampower (W m�2) Exp. No. q � 103 (m2 s�1) Slope (%) Streampower (W m�2)
F1 0.586 1 0.0574 S1 0.386 1 0.0368F2 1.302 1 0.1276 S2 0.476 1 0.0466F3 0.404 1.5 0.0595 S3 1.186 0.7 0.0814F4 1.092 1.5 0.1606 S4 2.603 0.7 0.1786F5 0.483 2 0.0946 S5 0.840 1.5 0.1234F6 2.281 2 0.4471 S6 2.380 1.5 0.3498F7 2.402 2 0.4708 S7 1.901 2 0.3727
S8 2.519 2 0.4937
q – Volumetric flux per unit width of plane.
H. Asadi et al. / Journal of Hydrology 406 (2011) 73–81 75
were subdivided into I = 20 size classes, each having an equal massfraction. The fraction of each of I size classes in the outflow sedi-ment at different times of each experiment was then obtainedusing the subdivision of equal classes obtained for the original soilsas described in Asadi et al. (2007a).
3. Results and discussion
Changes with time in the measured sediment concentration atthe exit from the flume are given in Fig. 3a and b for the forest soiland fluvial sand. Sediment concentration was high at the start ofthe experiments but decreased and approached an approximatelyconstant value. As shown in Fig. 3, time of approach to an approx-imately constant value was shorter for the forest soil than the flu-vial sand, and for lower flow rates and slopes than for higher flowrates and slopes.
Fig. 4a–g shows the mass fractions of each of the 20 size classesin the outflow at four different times for the experiments (F1–F7)
0
5
10
15
20
25
Sedi
men
t con
cent
ratio
n (g
l-1)
Time (min)
F1 F2 F3 F4
F5 F6 F7
0
2
4
6
8
10
12
14
0 5 10 15 20 25
0 5 10 15 20 25
Sedi
men
t con
cent
ratio
n (g
l-1)
Time (min)
S1 S2 S3 S4
S5 S6 S7 S8
(a)
(b)
Fig. 3. Changes with time in measured sediment concentration of all experimentcarried out on forest soil (a), and fluvial sand (b).
on the forest soil. Results for times 1, 5, 10 and 20 min are givenin the order left to right for each size range. The original un-erodedsoil consisted of 5 equal mass fractions in each size class, indicatedin Fig. 4 by a uniform original fraction of 5%. Eroded sediment frac-tions greater than 5% can be said to be preferentially transported(Fig. 4). As shown in Table 1, bed slope increased gradually fromexperiment F1 to experiment F7, and with different flow rates, flowstreampower increased from 0.057 W m�2 to 0.47 W m�2, thoughnot in an absolutely regular manner.
Fig. 4 shows that the sediment size distribution is highest at thefinest class of 0.03 mm. This class includes more than 50% of the to-tal sediment loss for all sampling times for F1 and F3, and morethan 20% for F2. The fraction of other size classes decreases gradu-ally with size. The dominant transport mechanism would be sus-pension–saltation in these three experiments in which transportrate decreases uniformly with size due to increasing weight andso settling velocity of the particles (Hairsine and Rose, 1992a,b;Rose et al., 2007). Experiment F4 (Fig. 4d) can be regarded as atransition from the previous condition to a new condition in whichthe sediment size distribution tends to be somewhat more uniformfor the 20 size classes. It seems that in this F4 experiment, with aflow streampower of about 0.16 W m�2, another transport mecha-nism is activated affecting coarser size classes. This mechanismwould be bed load transport by rolling (Asadi et al., 2007b). Forthe last three experiments (F5–F7), Fig. 4e–g shows a bimodal sed-iment size distribution, especially for the first sampling times of1 min. It is suggested that in this condition, suspension–saltationis responsible for the first peak at the finest class, and bed loadtransport is responsible for the second peak at the coarser classes.In most of the experiments, rolling of particles was observed, espe-cially coarse sands and large aggregates.
Fig. 5a–h shows the mass fractions of each of the 20 size classesin the outflow at different times for the experiments (S1–S8) on thefluvial sand. Results for different times of 1, 5 and 10 min in Fig. 5aand b, and 1, 5, 10 and 20 min in Fig. 5c–h are given in the orderleft to right. As shown in Table 1, flow rate and bed slope increasegradually from experiment S1 to experiment S8. Flow streampow-er consequently increases from 0.037 W m�2 to 0.494 W m�2. Theresults are somewhat similar to those on the forest soil. For thefirst two experiments (S1 and S2) with a streampower less than0.05 W m�2, there is a peak in the sediment size distribution atthe finest size class (0.085 mm) and a minimum at the second fineclass (0.180 mm). All other size classes have been transported al-most uniformly according to their abundance in the original bed,i.e. the fraction is around 5% which is the equal mass fractions ofsize classes in the original sample (Fig. 5a and 5b). Sediment sizedistribution becomes bimodal with increasing streampower inthe next experiments, especially for the first sampling times of1 min (Fig. 5c–h).
Results for the fluvial sand exhibit two major differences withthe forest soil in respect to particle size distribution of sediment

0102030405060708090
1000.
030
0.12
00.
245
0.37
50.
480
0.59
00.
715
0.85
00.
985
1.13
01.
280
1.45
01.
630
1.81
02.
010
2.21
02.
405
2.60
02.
800
3.00
0
Size class (mm)
Frac
tion
in s
edim
ent (
%) Minute 1
Minute 5
Minute 10
Minute 20
(a)
0
10
20
30
40
50
60
70
80
0.03
00.
120
0.24
50.
375
0.48
00.
590
0.71
50.
850
0.98
51.
130
1.28
01.
450
1.63
01.
810
2.01
02.
210
2.40
52.
600
2.80
03.
000
Size class (mm)
Frac
tion
in s
edim
ent (
%) Minute 1
Minute 5
Minute 10
Minute 20
(b)
0
10
20
30
40
50
60
70
0.03
00.
120
0.24
50.
375
0.48
00.
590
0.71
50.
850
0.98
51.
130
1.28
01.
450
1.63
01.
810
2.01
02.
210
2.40
52.
600
2.80
03.
000
Size class (mm)
Frac
tion
in s
edim
ent (
%) Minute 1
Minute 5
Minute 10
Minute 20
(c)
0
5
10
15
20
25
30
0.03
00.
120
0.24
50.
375
0.48
00.
590
0.71
50.
850
0.98
51.
130
1.28
01.
450
1.63
01.
810
2.01
02.
210
2.40
52.
600
2.80
03.
000
Size class (mm)
Frac
tion
in s
edim
ent (
%) Minute 1
Minute 5
Minute 10
Minute 20
(d)
0
5
10
15
20
25
0.03
00.
120
0.24
50.
375
0.48
00.
590
0.71
50.
850
0.98
51.
130
1.28
01.
450
1.63
01.
810
2.01
02.
210
2.40
52.
600
2.80
03.
000
Size class (mm)
Frac
tion
in s
edim
ent (
%) Minute 1
Minute 5
Minute 10
Minute 20
(e)
0
5
10
15
20
25
30
35
0.03
00.
120
0.24
50.
375
0.48
00.
590
0.71
50.
850
0.98
51.
130
1.28
01.
450
1.63
01.
810
2.01
02.
210
2.40
52.
600
2.80
03.
000
Size class (mm)
Frac
tion
in s
edim
ent (
%) Minute 1
Minute 5
Minute 10
Minute 20
(f)
0
5
10
15
20
25
30
0.03
00.
120
0.24
50.
375
0.48
00.
590
0.71
50.
850
0.98
51.
130
1.28
01.
450
1.63
01.
810
2.01
02.
210
2.40
52.
600
2.80
03.
000
Size class (mm)
Frac
tion
in s
edim
ent (
%) Minute 1
Minute 5
Minute 10
Minute 20
(g)
Fig. 4. Mass fractions of the 20 size classes in outflow sediment at four different times for the experiments carried out on the forest soil: (a) F1, (b) F2, (c) F3, (d) F4, (e) F5, (f)F6, and (g) F7. Results for sampling times of 1, 5, 10 and 20 min are given in the order left to right for this size range.
76 H. Asadi et al. / Journal of Hydrology 406 (2011) 73–81
(Figs. 4 and 5). The first difference refers to the sizes of finest andcoarsest size classes which are 0.085 and 2.18 mm, respectively forfluvial sand against 0.03 and 3.00 mm, respectively for forest soil.
The second difference relates to particle density, while all particlesof fluvial sand have a particle density of about 2650 kg m�3, parti-cle density was 1760 kg m�3 on average for forest soil particles

0
5
10
15
20
25
0.08
50.
180
0.25
70.
325
0.38
80.
448
0.50
70.
565
0.62
50.
686
0.75
00.
822
0.90
00.
984
1.07
51.
175
1.29
01.
428
1.60
52.
180
Size class (mm)
Frac
tion
in s
edim
ent (
%)
Minute 1.5
Minute 5
Minute 10
(a)
0
5
10
15
20
25
0.08
50.
180
0.25
70.
325
0.38
80.
448
0.50
70.
565
0.62
50.
686
0.75
00.
822
0.90
00.
984
1.07
51.
175
1.29
01.
428
1.60
52.
180
Size class (mm)
Frac
tion
in s
edim
ent (
%)
Minute 1
Minute 5
Minute 10
(b)
0
5
10
15
20
0.08
50.
180
0.25
70.
325
0.38
80.
448
0.50
70.
565
0.62
50.
686
0.75
00.
822
0.90
00.
984
1.07
51.
175
1.29
01.
428
1.60
52.
180
Size class (mm)
Frac
tion
in s
edim
ent (
%) Minute 1
Minute 5
Minute 10
Minute 20
(c)
0
5
10
15
20
0.08
50.
180
0.25
70.
325
0.38
80.
448
0.50
70.
565
0.62
50.
686
0.75
00.
822
0.90
00.
984
1.07
51.
175
1.29
01.
428
1.60
52.
180
Size class (mm)
Frac
tion
in s
edim
ent (
%) Minute 1
Minute 5
Minute 10
Minute 20
(d)
0
5
10
15
20
0.08
50.
180
0.25
70.
325
0.38
80.
448
0.50
70.
565
0.62
50.
686
0.75
00.
822
0.90
00.
984
1.07
51.
175
1.29
01.
428
1.60
52.
180
Size class (mm)
Frac
tion
in s
edim
ent (
%) Minute 1
Minute 5
Minute 10
Minute 20
(e)
0
5
10
15
20
0.08
50.
180
0.25
70.
325
0.38
80.
448
0.50
70.
565
0.62
50.
686
0.75
00.
822
0.90
00.
984
1.07
51.
175
1.29
01.
428
1.60
52.
180
Size class (mm)
Frac
tion
in s
edim
ent (
%) Minute 1
Minute 5
Minute 10
Minute 20
(f)
0
5
10
15
20
25
0.08
50.
180
0.25
70.
325
0.38
80.
448
0.50
70.
565
0.62
50.
686
0.75
00.
822
0.90
00.
984
1.07
51.
175
1.29
01.
428
1.60
52.
180
Size class (mm)
Frac
tion
in s
edim
ent (
%) Minute 1
Minute 5
Minute 10
Minute 20
(g)
0
5
10
15
20
25
0.08
50.
180
0.25
70.
325
0.38
80.
448
0.50
70.
565
0.62
50.
686
0.75
00.
822
0.90
00.
984
1.07
51.
175
1.29
01.
428
1.60
52.
180
Size class (mm)
Frac
tion
in s
edim
ent (
%) Minute 1
Minute 5
Minute 10
Minute 20
(h)
Fig. 5. Mass fractions of the 20 size classes in outflow sediment at the different times for the experiments carried out on the fluvial sand: (a) S1, (b) S2, (c) S3, (d) S4, (e) S5, (f)S6, (g) F7, and (h) S8. Results for different sampling times are given in the order left to right.
H. Asadi et al. / Journal of Hydrology 406 (2011) 73–81 77
(aggregates) as mentioned in the Section 2. These differences havecaused: (i) transport percentage of the finest size class, i.e. firstpeak to be lower for the fluvial sand than the forest soil, (ii) trans-
port percentage of the coarser size classes, shown in the secondpeak to be higher for the fluvial sand than the forest soil, and(iii) the lowest sediment concentration to be for size classes

78 H. Asadi et al. / Journal of Hydrology 406 (2011) 73–81
between 0.18–0.38 mm in fluvial sand, while it occurred for0.5–1.0 mm size classes in the case of forest soil. It is hypothesizedthat this size class with lowest sediment concentration may beconsidered as a border between dominance by the two transportmechanisms, with saltation dominating the smaller size ranges.
There are dynamic changes in sediment PSD during any givenexperiment for both soils (Figs. 4 and 5). Both the fractional sedi-ment concentration of each size class, and the size classes withminimum and maximum transport change with time. Probablythe main reason for such changes is that the particle size distribu-tion of the eroding bed is changing continuously with time. Inapparent contrast with theories (Rose et al., 2007; Hairsine andRose, 1992a,b) and previous observation (Beuselinck et al., 1999;Hogarth et al., 2004; Proffitt and Rose, 1991), sediment size distri-bution did not become the same as that of the original soil at theend of the experiment. However, as shown in Fig. 3, change wasstill occurring at this time (20 min) for some of the experiments(especially on fluvial sand), so equilibrium may not have beenreached for those experiments. The theory of Hairsine and Rose(1992a) also implies that change in settling velocity distributioncan persist for substantial times.
The PSD of the eroding bed is shown to change continuouslywith time from the initial situation of equality in mass fractionof the size classes (Asadi et al., 2007b). Accordingly discussion isfocused on the first sampling time of 1 min, and the cumulativeparticle size distributions of outflow sediment at this samplingtime are presented in Fig. 6 for both soil types. Outflow sedimenthas a very fine distribution for the experiments with low stream-power on forest soil (Fig. 6a), with more than 80% of the sedimentin F1 consisting of particles finer than 0.044 mm. Sediment size
0
20
40
60
80
100
120
1010.10.01
Cum
ulat
ive
mas
s pe
rcen
t les
s th
an
Sieve size (mm)
F1 (0.0574)F3 (0.0595)F5 (0.0946)F2 (0.1276)F4 (0.1606)F6 (0.4472)F7 (0.4708)Original Soil
(a)
0
20
40
60
80
100
120
1010.10.01
Cum
ulat
ive
mas
s pe
rcen
t les
s th
an
Sieve size (mm)
S1 (0.0368)S2 (0.0466)S3 (0.0814)S5 (0.1235)S4 (0.1786)S6 (0.3498)S7 (0.3727)S8 (0.4937)Original Soil
(b)
Fig. 6. Particle size distribution of outflow sediment at the time 1 min for theexperiments carried out on the forest soil (a) and fluvial sand (b). Values in theparenthesis followed experiment number shows flow streampower.
distribution becomes coarser with increasing flow streampower, fi-nally becoming similar to or even coarser than that of the originalsoil. In the case of fluvial sand (Fig. 6b), while sediment PSD is finerthan the original soil under low streampowers, it clearly becomescoarser than the original soil as streampower increases. The differ-ences in behavior between the two soils may be due to the differ-ences in size, density and shape of particles.
To clarify understanding of processes, the individual mass frac-tions of each of the 20 size classes in the outflow at sampling timeof 1 min for four selected experiments (F1, F4, F5 and F6) have beenredrawn for forest soil (Fig. 7), and for four selected experiments(S2, S4, S6, and S7) with fluvial sand (Fig. 8). For both soils thesefigures present data in order of increasing streampower.
Fig. 7 shows that for forest soil, the finest size class forms a con-siderable fraction of outflow sediment in the experiment with low-est streampower (F1, Fig 7a) and the fractional sediment decreaseswith size for next three size classes, and remains very low andsomewhat uniform for larger size classes. Sediment size distribu-tion becomes initially bimodal (Fig. 7b), then tends toward uniform(Fig. 7c), and finally again becomes more clearly bimodal (Fig. 7d)with increasing streampower. While the finest size class of0.03 mm is always high, the size classes with the lowest concentra-tion and the higher secondary peak in concentration differ depend-ing on the hydraulic condition of the experiment (i.e. on flow rateand slope). Both the minimum and second maximum concentra-tions of sediment in the PSD move to coarser size classes withincreasing streampower. For fluvial sand, Fig. 8 also shows thathow the minimum and second peak fractions in the sedimentPSD change with flow streampower for the selected experimentsof S2, S4, S6, and S7.
Table 2 summarizes the information on the changing size clas-ses with lowest sediment transport and second peak for selectedexperiments on both samples at a time of 1 min. It is hypothesizedthat the size classes with lowest transport rate provide a borderbetween the two transport mechanisms (suspension–saltationand rolling), with this border increasing in sediment size withincreasing streampower. If so, this implies that the upper size limitof particles transported by suspension–saltation increases withstreampower.
Based on the hypothesis that size class with minimum transportrate is an approximate border between suspension–saltation andbed load transport, the relative importance of each mechanism insediment loss can be calculated. Table 3 presents the relativeimportance of suspension–saltation and bed load transport at sam-pling time of 1 min for all experiments carried out on both sam-ples, based on the minimum in transport hypothesis. Table 3shows that for the forest soil, suspension–saltation mechanismhas an important role in particle transport, but a lower importancein the case of fluvial sand is indicated, especially at higher stream-powers when bed load transport by rolling becomes dominant.
Table 3 shows that for forest soil about 80% of soil particles hasbeen transported by suspension–saltation in experiments with lowflow rate, slope and consequently low streampower (i.e. F1 and F3),however the importance of this mechanism decreases to about 40%in the experiments with high flow rate and slope (i.e. F6 and F7).There is a strong relationship (Fig. 9a) between the relative effectof suspension–saltation in sediment transport and streampowerif the data for experiment F5 is ignored. In the case of fluvial sand(Fig. 9b), though the importance of suspension–saltation reduceswith streampower (the exception being S6), sediment transportby this mechanism is generally lower than 30%, and remains be-tween 5% and 10% when streampower exceeds about 0.1 W m�2
(Table 1, Fig 9b). The main reason for this difference between thetwo samples may be due to different particle densities and so set-tling velocities. No explanation is available on why data for exper-iments F5 and S6 seem to be outliers in Fig. 9.

(a)
05
101520253035404550556065
0.03
00.
120
0.24
50.
375
0.48
00.
590
0.71
50.
850
0.98
51.
130
1.28
01.
450
1.63
01.
810
2.01
02.
210
2.40
52.
600
2.80
03.
000
Size class (mm)
Frac
tion
in s
edim
ent (
%)
Fraction in original soil
(b)
0
5
10
15
20
0.03
00.
120
0.24
50.
375
0.48
00.
590
0.71
50.
850
0.98
51.
130
1.28
01.
450
1.63
01.
810
2.01
02.
210
2.40
52.
600
2.80
03.
000
Size class (mm)
Frac
tion
in s
edim
ent (
%)
Fraction in original soil
(c)
0
5
10
15
20
0.03
00.
120
0.24
50.
375
0.48
00.
590
0.71
50.
850
0.98
51.
130
1.28
01.
450
1.63
01.
810
2.01
02.
210
2.40
52.
600
2.80
03.
000
Size class (mm)
Frac
tion
in s
edim
ent (
%)
Fraction in original soil
(d)
0
5
10
15
20
0.03
00.
120
0.24
50.
375
0.48
00.
590
0.71
50.
850
0.98
51.
130
1.28
01.
450
1.63
01.
810
2.01
02.
210
2.40
52.
600
2.80
03.
000
Size class (mm)
Frac
tion
in s
edim
ent (
%)
Fraction in original soil
Fig. 7. Mass fractions of the 20 size classes in outflow sediment at the time 1 min for selected experiments carried out on the forest soil: (a) F1, (b) F5, (c) F4, and (d) F6.Figures are listed in order of increasing streampower.
0
5
10
15
20
0.08
50.
180
0.25
70.
325
0.38
80.
448
0.50
70.
565
0.62
50.
686
0.75
00.
822
0.90
00.
984
1.07
51.
175
1.29
01.
428
1.60
52.
180
Frac
tion
in s
edim
ent (
%)
Size class (mm)
(a)
0
5
10
15
20
0.08
50.
180
0.25
70.
325
0.38
80.
448
0.50
70.
565
0.62
50.
686
0.75
00.
822
0.90
00.
984
1.07
51.
175
1.29
01.
428
1.60
52.
180
Frac
tion
in s
edim
ent (
%)
Size class (mm)
(b)
0
5
10
15
20
0.08
50.
180
0.25
70.
325
0.38
80.
448
0.50
70.
565
0.62
50.
686
0.75
00.
822
0.90
00.
984
1.07
51.
175
1.29
01.
428
1.60
52.
180
Frac
tion
in s
edim
ent (
%)
Size class (mm)
(c)
0
5
10
15
20
25
0.08
50.
180
0.25
70.
325
0.38
80.
448
0.50
70.
565
0.62
50.
686
0.75
00.
822
0.90
00.
984
1.07
51.
175
1.29
01.
428
1.60
52.
180
Frac
tion
in s
edim
ent (
%)
Size class (mm)
(d)
Fig. 8. Mass fractions of the 20 size classes in outflow sediment at the time 1 min for selected experiments carried out on the fluvial sand: (a) S2, (b) S4, (c) S6, and (d) S7.
H. Asadi et al. / Journal of Hydrology 406 (2011) 73–81 79

Table 2The size classes (mm) with lowest sediment transport (LST) and second peak (SP) for selected experiments on both soils at a time of 1 min. Experiments are listed in order ofincreasing streampower.
Forest soil Fluvial sand
Exp. No. O (W m�2) L.S.T. S.P. Exp. No. O (W m�2) L.S.T. S.P.
F1 0.057 >0.375 – S2 0.047 0.180 –F5 0.095 0.850–1.130 2.405 S4 0.179 0.180 1.605F4 0.160 0.985–1.280 – S6 0.350 0.388 1.605F6 0.447 1.130–1.450 3.000 S7 0.373 0.448 2.180
O – Flow streampower.
Table 3Relative importance (%) of suspension–saltation (SS) and bed load (BL) in sediment ata time of 1 min.
Forest soil Fluvial sand
Exp. No. S.S. B.L. Exp. No. S.S. B.L.
F1 80 20 S1 27 63F2 62 38 S2 20 80F3 83 17 S3 6 94F4 56 44 S4 9 91F5 34 66 S5 5 95F6 47 53 S6 16 84F7 42 58 S7 7 93
S8 5 95
Streampower (W m-2)
*
(a)
Rel
ativ
e ef
fect
of
susp
ensi
on-s
alta
tion
(%)
Rel
ativ
e ef
fect
of
susp
ensi
on-s
alta
tion
(%)
Streampower (W m-2)
*
(b)
Fig. 9. Relationship between streampower and relative effect of suspension–saltation in sediment transport for the forest soil (a) and fluvial sand (b) at thesampling time of 1 min from the commencement of the experiment. The outlierdata in both soils (shown by a square) have been discarded from regressionanalysis.
0
2
4
6
8
10
12
0
2
4
6
8
10
12
Pre
dict
ed C
(kg
m-3
)
Measured C (kg m-3)
(a)
0 2 4 6 8 10 12
0 2 4 6 8 10 12
Pre
dict
ed C
(kg
m-3
)
Measured C (kg m-3)
(b)
Fig. 10. Comparison of measured sediment concentration with that predicted usingEq. (1) for the forest soil (a) and fluvial sand (b).
80 H. Asadi et al. / Journal of Hydrology 406 (2011) 73–81
4. Comparison of measured sediment concentration withtheory
The theory developed by Hairsine and Rose (1992a) forflow-driven erosion assumes saltation transport to be dominant.
However earlier considerations in this paper indicate that somemechanism other than saltation (such as rolling) tends to becomeincreasingly important or dominant with increase in streampowerof the flow. This indication was further tested by calculating theequilibrium (or steady-state) sediment concentration at the trans-port limit (ct), on the assumption that soil strength in the reportedexperiments was negligibly small. From Hairsine and Rose(1992a):
ct ¼FðX�X0Þ
vavgDr
r� q
� �ðkg m�3Þ ð2Þ
where the value of F has been generally found to be approximately0.1, r is wet sediment density, q is the density of the fluid (assumedequal to that of water at the modest sediment concentrations expe-rienced), X is streampower with threshold value Xo, g = 9.8 m s�2,and vav is the average settling velocity of the sediment.

H. Asadi et al. / Journal of Hydrology 406 (2011) 73–81 81
Neglecting Xo, Figs. 10a and b compares value of ct predictedusing Eq. (2) with measured sediment concentrations at approxi-mate steady state condition.
For both soils, Fig. 10 shows good agreement between mea-sured and predicted sediment concentrations when these are low-er, but increasing divergence from the 1:1 relation as sedimentconcentration increases. As shown by Fig. 3 and Table 1, increasedsediment concentration does not always correspond to an increasein streampower, so the increased divergence shown in Fig. 10 doesnot always correspond to increased streampowers.
Saltation/suspension would be expected to be a more efficienttransport mechanism than bed load transport mechanisms suchas rolling or mass movement. Thus if, as indicated by Table 3,bed load transport becomes a more important mechanism at high-er streampowers, then a corresponding increased overprediction ofsediment concentration by Eq. (2) would be expected, as has beenshown to occur (Fig. 10). Despite uncertainty in the experimentalrelationship between sediment concentration and streampower,the general nature of the divergence from the 1:1 relationshipshown in both Figs. 10a and 10b does provide some support forthe hypothesis presented in interpreting the experimental data ofFigs. 4, 5, 7 and 8.
5. Conclusion
Dynamic changes in sediment size distribution were measuredfor two contrasting soil samples under flow-driven erosion at arange of low to modest streampowers. The results suggest that sus-pension/saltation is the only erosion mechanism at work for bothsamples at very low streampower, affecting mainly very fine to fineparticles. However, with increasing streampower the observedsediment PSD’s indicate that some mechanism in addition tosuspension/saltation is gradually activated, enhancing the transportof medium to larger sized sediment particles or aggregates. Suchenhancement requires a threshold streampower to be exceeded,when bed load transport by rolling was observed to occur. Therelative importance of the two types of sediment transport mecha-nisms was related to streampower and soil type. While the relativeimportance of suspension/saltation reduced with increasingstreampower for both soil types, rolling became more important atmodest streampowers for the forest soil. In the case of fluvial sand,suspension/saltation was always less importance, being less than30%, and becomes less important with increasing streampower.
Sediment concentration predicted using theory which assumedthe dominance of saltation/suspension was compared with mea-sured concentration. This comparison provided some support forthe hypothesis of increase in bed load transport with streampowersuggested by the reported experiments.
Acknowledgment
Funding for this research from the University of Guilan isgratefully acknowledged.
References
Asadi, H., Ghadiri, H., Rose, C.W., Rouhipour, H., 2007a. Interrill soil erosionprocesses and their interaction on low slopes. Earth Surf. Process. Landforms 32,711–724. doi:10.1002/esp. 1426.
Asadi, H., Ghadiri, H., Rose, C.W., Yu, B., Hussein, J., 2007b. An investigation of flow-driven soil erosion processes at low stream powers. J. Hydrol. 342, 134–142.
Baigorria, G.A., Romero, C.C., 2007. Assessment of erosion hotspot in a watershed:integrating the WEPP model and GIS in a case study in the Peruvian Andes.Environ. Model. Soft. 22, 1175–1183. doi:10.1016/j.envsoft.2006.06.012.
Beuselinck, L., Govers, G., Steegen, A., Quine, T.A., 1999. Sediment transport byoverland flow over an area of net deposition. Hydrol. Process. 13 (17), 2769–2782.
Chepil, W.S., 1950. Methods of estimating apparent density of discrete soil grainsand aggregates. Soil Sci. 70, 351–362.
Gabriels, D., Moldenhauer, W.C., 1978. Size distribution of eroded material fromsimulated rainfall: effect over a range of texture. Soil Sci. Soc. Am. J. 42, 954–958.
Hairsine, P.B., Rose, C.W., 1991. Rainfall detachment and deposition: sedimenttransport in the absence of flow-driven processes. Soil Sci. Soc. Am. J. 55, 320–324.
Hairsine, P.B., Rose, C.W., 1992a. Modeling water erosion due to overland flow usingphysical principles, I. Sheet flow. Water Resour. Res. 28 (1), 237–243.
Hairsine, P.B., Rose, C.W., 1992b. Modeling water erosion due to overland flow usingphysical principles: II. Rill flow. Water Resour. Res. 28 (1), 245–250.
Hairsine, P.B., Sander, G.C., Rose, C.W., Parlange, J.Y., Hogarth, W.L., Lisle, I.,Rouhipour, H., 1999. Unsteady soil erosion due to rainfall impact: a model ofsediment sorting on the hillslope. J. Hydrol. 199, 115–128.
Hogarth, W.L., Rose, C.W., Parlange, J.Y., Sander, G.C., Carey, G., 2004. Soil erosiondue to rainfall impact with no inflow: a numerical solution with spatial andtemporal effects of sediment settling velocity characteristics. J. Hydrol. 294,229–240.
Loch, R.J., Donnollan, T.E., 1982. Field rainfall simulator studies on two clay soils ofthe Darling downs, Queensland. II. Aggregate breakdown, sediment propertiesand soil erodibility. Aust. J. Soil Res. 21, 47–58.
Malam Issa, O., Bissonnais, Y.L., Planchon, O., Favis-Mortlock, D., Silvera, N.,Wainwright, J., 2006. Soil detachment and transport on field- and laboratory-scale interrill areas: erosion processes and the size-selectivity of erodedsediment. Earth Surf. Process. Landforms 31, 929–939. doi:10.1002/esp. 1303.
Meyer, L.D., Harmon, W.C., McDowell, L.L., 1980. Sediment size eroded from croprow sideslopes. Trans. ASAE 23, 891–898.
Miller, W.P., Baharuddin, M.K., 1987. Particle size of inter-rill-eroded sedimentsfrom highly weathered soils. Soil Sci. Soc. Am. J. 51, 1610–1615.
Mitchell, J.K., Mostaghimi, S., Pound, M., 1980. Primary particle and aggregate sizedistribution of eroded soil from sequenced rainfall events. Trans. ASAE 26,1771–1777.
Proffitt, A.P.B., Rose, C.W., 1991. Soil erosion processes: II. Settling velocitycharacteristics of eroded sediment. Aust. J. Soil Res. 29, 685–695.
Proffitt, A.P.B., Rose, C.W., Hairsine, P.B., 1991. Rainfall detachment and deposition:experiments with low slopes and significant water depths. Soil Sci. Soc. Am. J.55, 325–332.
Romero, C.C., Stroosnijder, L., Baigorria, G.A., 2007. Interrill and rill erodibility in thenorthern Andean Highlands. Catena 70, 105–113. doi:10.1016/j.catena.2006.07.005.
Rose, C.W., Yu, B., Ghadiri, H., Asadi, H., Parlange, J.Y., Hogarth, W.L., Hussein, J.,2007. Dynamic erosion of soil in steady sheet flow. J. Hydrol. 333, 449–458.
Slattery, M.C., Burt, T.P., 1997. Particle size characteristics of suspended sediment inhillslope runoff and stream flow. Earth Surf. Process. Landforms 22, 705–719.
Sutherland, R.A., Wan, Y., Ziegler, A.D., Lee, C.T., El-Swaify, S.A., 1996. Splash andwash dynamics: an experimental investigation using an Oxisol. Geoderma 69,85–103. doi:10.1016/0016-7061(95)00053-4.
Tromp-van Meerveld, H.J., Parlange, J.Y., Barry, D.A., Tromp, M.F., Sander, G.C.,Walter, M.T., Parlange, M.B., 2008. Influence of sediment settling velocity onmechanistic soil erosion modeling. Water Resour. Res. 44, W06401.doi:10.1029/2007WR006361.
Wan, Y., El-Swaify, S.A., 1998. Characterizing interrill sediment size by partitioningsplash and wash processes. Soil Sci. Soc. Am. J. 62, 430–437.