florida southeast connection project
TRANSCRIPT
FLORIDA SOUTHEAST CONNECTION
PROJECT
RESOURCE REPORT 9
Air and Noise Quality
FERC Docket No. PF14-2-000
Pre-Filing Draft
March 2014
Draft Resource Report 9 – Air and Noise Quality i FLORIDA SOUTHEAST CONNECTION PROJECT
TABLE OF CONTENTS
9.0 RESOURCE REPORT 9 – AIR AND NOISE QUALITY ............................................................... 9-1
9.1 INTRODUCTION ............................................................................................................................. 9-1
9.2 AIR QUALITY ................................................................................................................................ 9-1
9.2.1 Existing Conditions ............................................................................................................. 9-1
9.2.1.1 Climate ........................................................................................................................................ 9-1
9.2.1.2 National Ambient Air Quality Standards ...................................................................................... 9-1
9.2.1.3 Attainment Status ........................................................................................................................ 9-2
9.2.1.4 General Conformity ..................................................................................................................... 9-2
9.2.1.5 Existing Ambient Air Quality ........................................................................................................ 9-3
9.2.2 Air Pollutant Emissions ...................................................................................................... 9-3
9.2.2.1 Operating Emissions ................................................................................................................... 9-3
9.2.2.2 Construction Emissions ............................................................................................................... 9-3
9.3 NOISE QUALITY ............................................................................................................................ 9-4
9.3.1 Applicable Noise Regulations ............................................................................................ 9-4
9.3.1.1 Federal Energy Regulatory Commission ..................................................................................... 9-4
9.3.1.2 State and Local Noise Regulations .............................................................................................. 9-5
9.3.2 Pipeline Construction ......................................................................................................... 9-5
9.3.2.1 Pipeline Construction Noise Mitigation Measures ........................................................................ 9-5
9.3.3 Horizontal Direction Drilling ................................................................................................ 9-6
9.3.3.1 Existing Ambient Conditions ........................................................................................................ 9-6
9.3.3.2 HDD Noise Levels ....................................................................................................................... 9-6
9.4 REFERENCES ............................................................................................................................... 9-8
LIST OF Tables
Table 9.2-1 Regional Climate Data for Okeechobee County, Florida
Table 9.2-2 National Ambient Air Quality Standards
Table 9.2-3 Attainment Status of FSC Project Area
Table 9.2-4 Existing Ambient Air Quality Estimated for the FSC Project Area
Table 9.2-5 Estimated Construction Emissions
Table 9.3-1 Construction Phase Noise Levels for Pipeline Installation
Table 9.3-2 Noise Levels of Major Construction Equipment (dBA)
Table 9.3-3 Land Use Categories for Estimating Ambient Noise Levels
Table 9.3-4 HDD Leq Site Noise Analysis – No Noise Mitigation
Table 9.3-5 HDD Ldn Site Noise Analysis – No Noise Mitigation
Draft Resource Report 9 – Air and Noise Quality ii FLORIDA SOUTHEAST CONNECTION PROJECT
LIST OF FIGURES
Figure 9.3-1 Noise Sensitive Areas - Route 710 Crossing
Figure 9.3-2 Noise Sensitive Areas - Kissimmee River Crossing
LIST OF APPENDICES
APPENDIX 9A Construction Emission Calculations
Draft Resource Report 9 – Air and Noise Quality iii FLORIDA SOUTHEAST CONNECTION PROJECT
RESOURCE REPORT 9 – AIR AND NOISE QUALITY
Filing Requirement Location in
Environmental Report
Describe existing air quality in the vicinity of the project. 9.2.1 Quantify the existing noise levels (day-night sound level (Ldn) and other
applicable noise parameters) at the noise sensitive area and at other locations required by state and local noise ordinances.
9.3
Quantify existing and proposed emissions of compressor equipment, plus, construction emissions, including nitrogen oxides (NOx) and
carbon monoxide (CO), and the basis for these calculations. Summarize anticipated air quality impacts for the project.
9.2.2
Describe the existing and proposed compressor units at each station where new, additional, or modified compression units are proposed, including the manufacturer, model number, and horsepower of the compressor units.
Not applicable
Identify any nearby NSA by distance and direction from the proposed compressor unit building/enclosure.
Not applicable
Identify any applicable state or local noise regulations. 9.3.1.2 Calculate the noise impact of the proposed compressor unit
modifications or additions, specifying how the impact was calculated including manufacturer’s data and proposed noise control equipment.
Not applicable
Draft Resource Report 9 – Air and Noise Quality iv FLORIDA SOUTHEAST CONNECTION PROJECT
ACRONYMS AND ABBREVIATIONS
a.m. ante meridiem AQCR air quality control region A-wt. A weighting CAA Clean Air Act CERCLA Comprehensive Environmental Response, Compensation, and Liability
Act CFR Code of Federal Regulations CH4 methane CO carbon monoxide CO2 carbon dioxide CO2e carbon dioxide equivalents dB decibels dBA A-weighted decibels F degree(s) Fahrenheit FERC Federal Energy Regulatory Commission FPL Florida Power & Light Company g/VMT grams per vehicle mile traveled GHG greenhouse gas H&K Hoover and Keith, Inc. H2H high second high in inch(s) km kilometer(s) LAeq A-weighted Leq in decibels Ld day sound level in decibels Ldn day-night sound level in decibels Leq equivalent sound level in decibels Ln night sound level in decibels M&R metering and regulating μg/m3 microgram per cubic meter MOVES Mobile Vehicle Emissions Simulator MP milepost NAAQS National Ambient Air Quality Standards NGA Natural Gas Act NO2 nitrogen dioxide NOx nitrogen oxides NONROAD USEPA’s NONROAD model, version NONROAD2008a NSAs noise sensitive areas N2O nitrous oxide O.B. octave band O3 ozone Pb lead PM10 particulate matter with a diameter ≤ 10 microns PM2.5 particulate matter with a diameter ≤ 2.5 microns ppm parts per million ROW right-of-way Sabal Trail Sabal Trail Transmission Pipeline Project Secretary Secretary of the Commission SIP State Implementation Plan
Draft Resource Report 9 – Air and Noise Quality v FLORIDA SOUTHEAST CONNECTION PROJECT
SO2 sulfur dioxide SOTA state-of-the-art SPL sound pressure level SR State Road tpy ton per year USEPA U.S. Environmental Protection Agency VOC volatile organic compound(s) WRAP Western Regional Air Partnership
Draft Resource Report 9 – Air and Noise Quality 9-1 FLORIDA SOUTHEAST CONNECTION PROJECT
9.0 RESOURCE REPORT 9 – AIR AND NOISE QUALITY
9.1 Introduction
Florida Southeast Connection, LLC (“FSC”), a subsidiary of NextEra Energy, Inc., is seeking a Certificate of Public Convenience and Necessity (“Certificate”) from the Federal Energy Regulatory Commission (“FERC”) pursuant to Section 7(c) of the Natural Gas Act (“NGA”) authorizing the construction and operation of an approximately 127 mile natural gas pipeline known as the Florida Southeast Connection Project (“FSC Project”). The FSC Project is designed to meet the growing demand for natural gas by the electric generation, distribution, and end use markets in Florida. The FSC Project will also provide additional natural gas supply diversity through a connection to the new Sabal Trail Transmission Pipeline Project (“Sabal Trail”) via a new interconnection hub in central Florida (“Central Florida Hub”). The Sabal Trail Project is the subject of a separate, but related, certificate filing to the FERC.
The FSC Project will increase natural gas transportation capacity and availability to southern Florida by adding a new third pipeline in central and southern Florida. Upon the anticipated in-service date of May 2017, the FSC Project will be capable of providing a minimum of 600 million cubic feet per day (“MMcf/d”) of natural gas to an existing gas yard at Florida Power & Light Company’s (“FPL”) Martin Clean Energy Center.
The FSC Project involves the construction and operation of approximately 127 miles of up to 36 -inch-diameter pipeline and the construction and operation of one meter station (known as the Martin Meter Station). The FSC Project pipeline will start in Osceola County, Florida at the interconnection with Sabal Trail within the Central Florida Hub. The pipeline will traverse Polk, Osceola, Okeechobee, St. Lucie, and Martin Counties, terminating at the Martin Meter Station located at the Martin Clean Energy Center in Martin County, Florida. In addition, FSC will install a pig launcher at the start of the FSC Project and a pig receiver at the end of the FSC Project. Resource Report 1 provides a complete summary of the FSC Project facilities (Table 1.2-1) and a location map of the FSC Project facilities (Figure 1.2-1).
This Resource Report addresses air quality (Section 9.2) and noise impacts (Section 9.3) related to the construction and operation of the proposed FSC Project facilities. A checklist showing the status of the FERC filing requirements for Resource Report 9 is included in the table of contents.
9.2 Air Quality
9.2.1 Existing Conditions
9.2.1.1 Climate
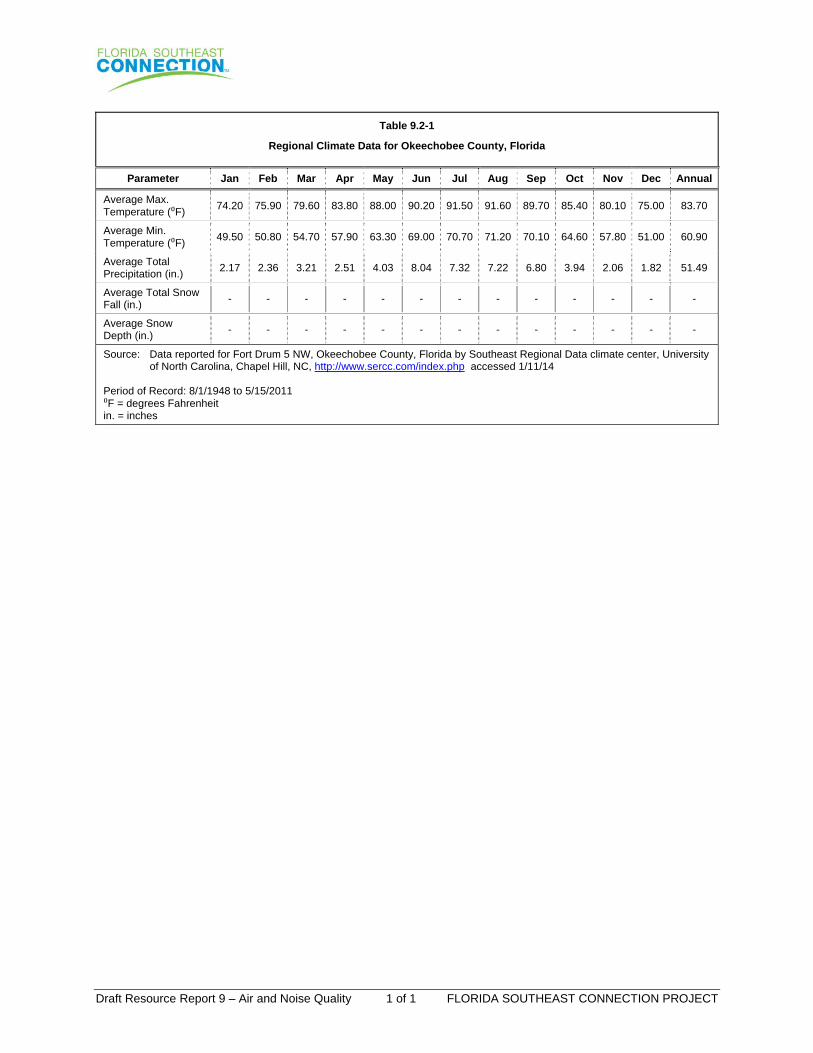
The FSC Project is located in central Florida. The climate type is humid sub-tropical, characterized by hot humid summers, short mild winters, and no dry season. The regional climate can be represented by Southeast Regional Data climate center data for Fort Drum 5 NW, Okeechobee County, Florida. Table 9.2-1 provides climate data for this location.
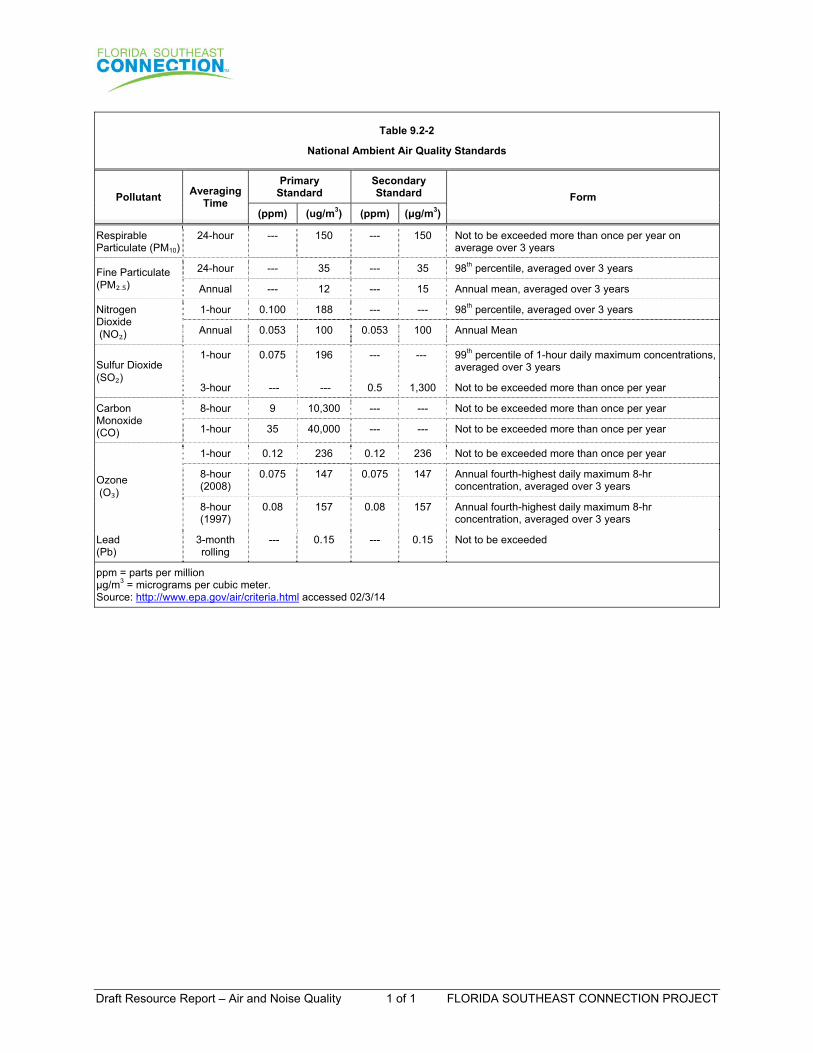
9.2.1.2 National Ambient Air Quality Standards
The United States Environmental Protection Agency (“USEPA”) has promulgated National Ambient Air Quality Standards (“NAAQS”). The NAAQS include primary standards, which are designed to protect human health, including the health of sensitive subpopulations such as children and those with chronic respiratory problems, and secondary standards, which are designed to protect public welfare, including economic interests, visibility, vegetation, animal species, and other concerns. NAAQS currently apply to the following criteria pollutants:
Draft Resource Report 9 – Air and Noise Quality 9-2 FLORIDA SOUTHEAST CONNECTION PROJECT
Particulate matter with a diameter ≤ 10 microns (“PM10”)
Particulate matter with a diameter ≤ 2.5 microns (“PM2.5”)
Nitrogen dioxide (“NO2”)
Sulfur dioxide (“SO2”)
Carbon monoxide (“CO”)
Ozone (“O3”)
Lead (“Pb”)
Each NAAQS is expressed in terms of a pollutant concentration level and an associated averaging period. The current NAAQS are summarized in Table 9.2-2. The NAAQS apply in all FSC Project areas. Notes to Table 9.2-2 list the form of the statistic used to assess compliance with each NAAQS.
States may adopt standards that are more stringent than the NAAQS. Florida repealed its State-specific ambient air quality standards, and adopted the federal NAAQS.
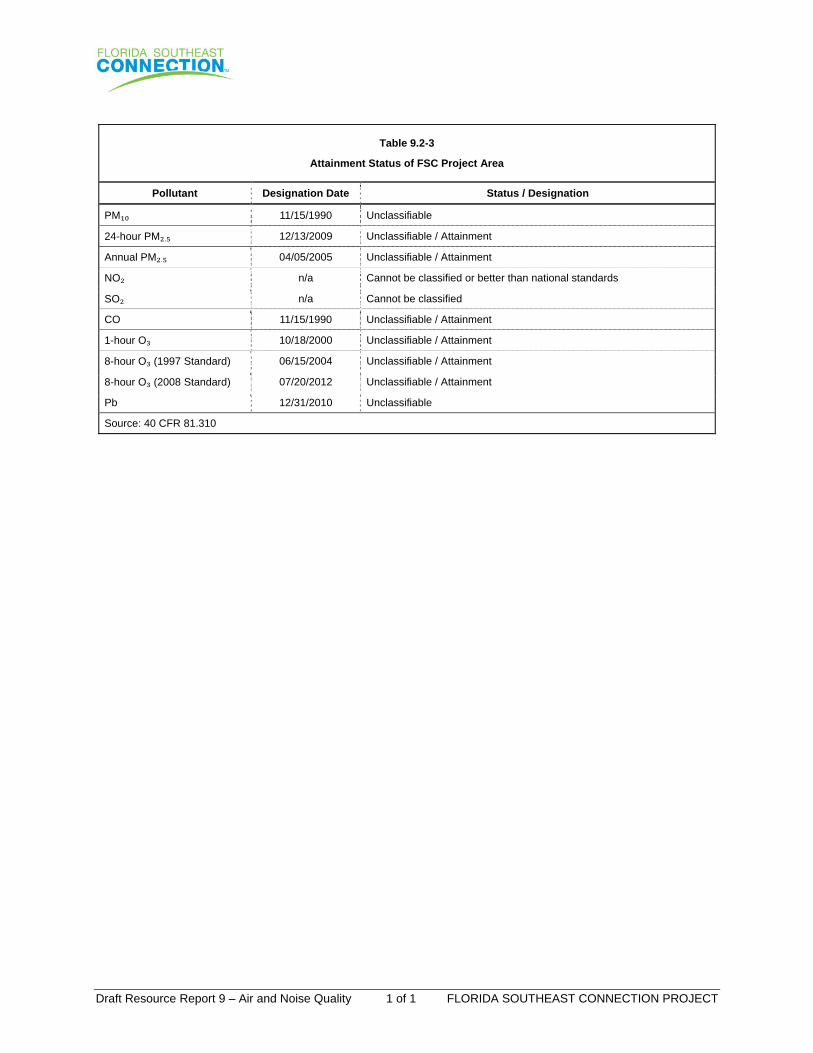
9.2.1.3 Attainment Status
Section 107 of the Clean Air Act (“CAA”) defines an air quality control region (“AQCR”) as a federally-designated area in which NAAQS must be met. An implementation plan is developed for each AQCR describing how ambient air quality standards will be achieved and/or maintained. For each applicable pollutant and averaging period, USEPA designates an area’s attainment status based on monitoring data from the region. Areas that meet the NAAQS are termed “attainment areas.” Areas that do not meet the NAAQS are termed “nonattainment areas.” Areas for which insufficient data are available to determine attainment status are termed “unclassifiable areas.” Areas formerly designated as nonattainment areas that subsequently reached attainment are termed “maintenance areas.” The attainment status designations appear in Title 40 of the Code of Federal Regulations (“CFR”) Part 81.
The FSC Project is located in the following AQCRs:
Southeast Florida Intrastate AQCR (Okeechobee, St. Lucie, and Martin Counties),
Central Florida Intrastate AQCR (Osceola County), and
West Central Florida Intrastate AQCR (Polk County).
Table 9.2-3 shows that, for each pollutant and averaging period, the FSC Project area’s status is attainment or the equivalent.
9.2.1.4 General Conformity
Section 176(c) of the CAA prohibits federal agencies from taking actions in nonattainment or maintenance areas which do not conform to the State Implementation Plan (“SIP”) for the attainment and maintenance of the NAAQS. The purposes of conformity are to (1) ensure federal activities do not interfere with the budgets in the SIPs, (2) ensure actions do not cause or contribute to new violations, and (3) ensure attainment and maintenance of the NAAQS. General Conformity applies only in areas that are designated as NAAQS nonattainment areas or maintenance areas. The FSC Project will be located in attainment areas or the equivalents for all criteria pollutants, and General Conformity does not apply.
Draft Resource Report 9 – Air and Noise Quality 9-3 FLORIDA SOUTHEAST CONNECTION PROJECT
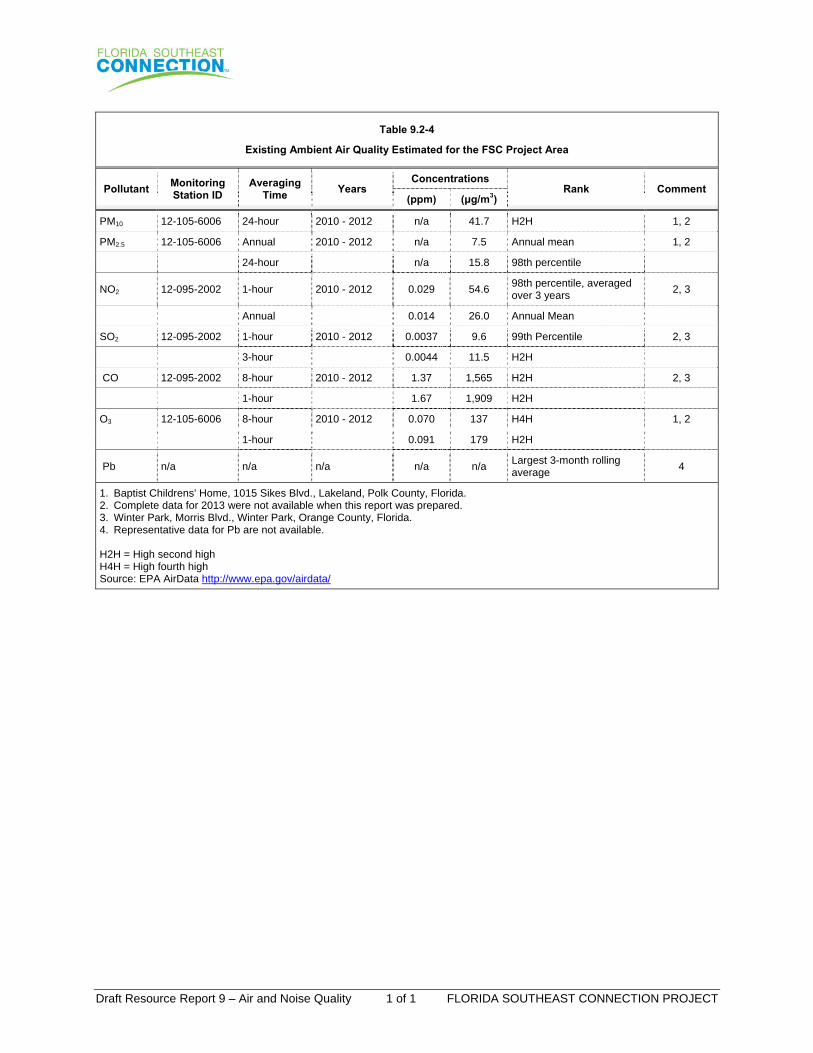
9.2.1.5 Existing Ambient Air Quality
Ambient air quality data were obtained from the USEPA AIRDATA database. Monitoring data for 2010 through 2012 are summarized in Table 9.2-4 for the monitors that are nearest or most representative of the FSC Project’s areas. For each pollutant and averaging period shown in Tables 9.1-3, the rank generally corresponds to the form of the statistic.
While the data in Table 9.2-4 are the best available, they are not necessarily representative of actual present air quality in the immediate vicinity of the FSC Project.
9.2.2 Air Pollutant Emissions
9.2.2.1 Operating Emissions
There will be no combustion equipment or stationary sources of air pollutant emissions associated with the operation of the FSC Project.
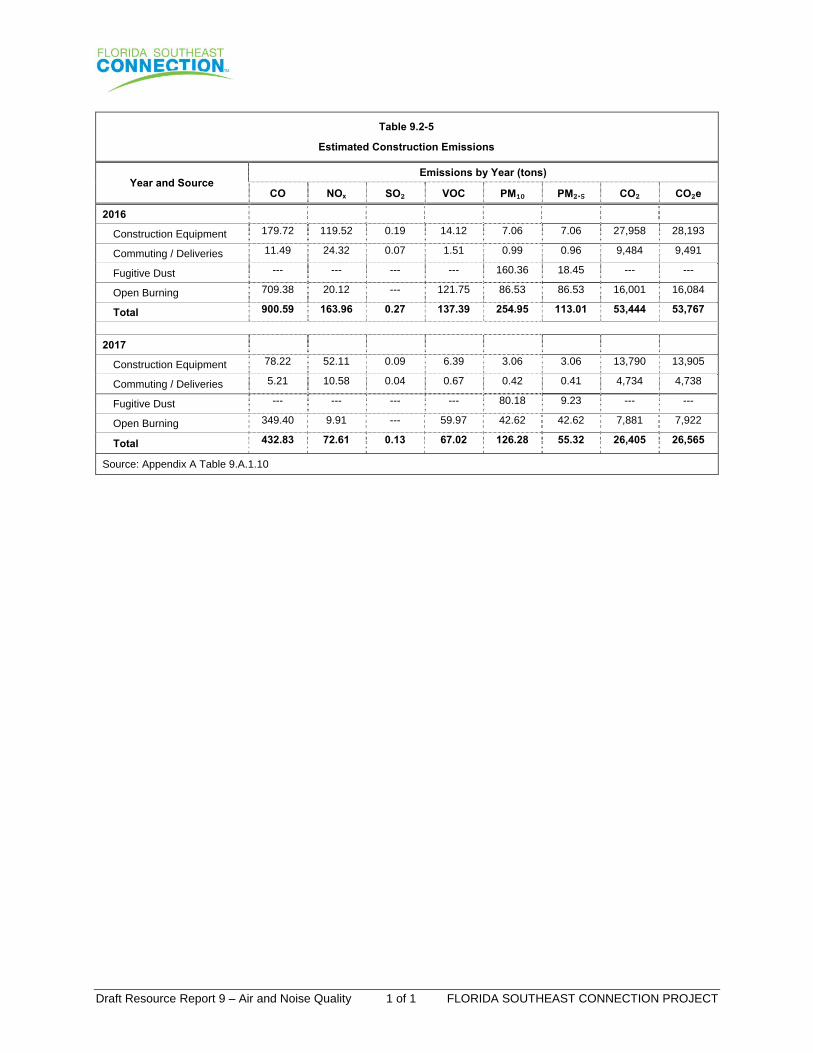
9.2.2.2 Construction Emissions
Table 9.2-5 summarizes the estimated air emissions that will occur as a result of construction of the FSC Project. Appendix 9A provides detailed emissions calculations. Construction emissions will include the following:
Tailpipe emissions from on-road and off-road construction equipment and vehicles,
Emissions from construction worker vehicles used for commuting, and vehicles used to deliver equipment and materials to the site,
Fugitive dust from construction activities and wind erosion of disturbed areas prior to revegetation, and
Open burning of vegetation.
The following methodologies were used to estimate construction emissions:
Annual average emission factors for Florida in 2016 and 2017 [grams per horsepower hour (“g/hp-hr”)] for NOx, CO, PM, SO2, VOC1, and CO2 for non-road equipment engines were obtained using the most recent version of the USEPA’s NONROAD model (NONROAD, 2008a). Non-road equipment emission factors (grams per gallon of fuel) for CH4 and N2O were obtained from the “2014 Climate Registry Default Emission Factors” (2014), and apportioned based on CO2 emissions.
Emissions factors [grams per vehicle mile traveled (“g/VMT”)] for on-road vehicles were obtained from the USEPA Mobile Vehicle Emissions Simulator (“MOVES”) version MOVES, 2010b. Emission factors were obtained for NOx, CO, PM10, PM2.5, SO2, VOC, and CO2, and CO2e for road types in Florida for 2016 and 2017.
Fugitive dust emissions were estimated using the methodology described in Section 3.4 of the Western Regional Air Partnership (“WRAP”) Fugitive Dust Handbook (2006). Use of this methodology is conservative, as the climates typical of most Western states are more arid than in the FSC Project area.
Open burning emissions were estimated using the methodology described in AP 42, Fifth Edition, Volume I, Section 13.1, “Wildfires and Prescribed Burning”. Emission
1 NONROAD does not provide emissions factors for VOC. The emission factor for total hydrocarbons was
used as a surrogate for VOC.
Draft Resource Report 9 – Air and Noise Quality 9-4 FLORIDA SOUTHEAST CONNECTION PROJECT
factors for CO2, CH4 and N2O were obtained from the “2014 Climate Registry Default Emission Factors”.
The impacts of these emissions on air quality are expected to be minor. Construction emissions will be intermittent, temporary, and spread over a large area. Mitigation measures will include the following:
The construction equipment will be properly maintained and comply with all applicable Federal regulations. Equipment will be operated on an as-needed basis, primarily during daylight hours2.
To the extent practicable, busses or vans will be used to transport construction workers to the work site.
Fugitive dust emissions will be mitigated by minimizing the extent of the areas disturbed, application of dust suppressants, rinsing construction vehicles before they leave the work site, and avoiding excessive vehicle speeds on unpaved roads. Disturbed areas will be re-vegetated as appropriate. Additionally, all areas disturbed by construction will be stabilized in accordance with FERC’s Plan and Procedures.
Open burning of vegetation will be conducted in accordance with the permit issued by the Florida Forest Service and in accordance with State and local regulations and ordinances.
9.3 Noise Quality
This section of the Resource Report provides an overview of applicable noise regulations and an assessment of noise impacts associated with the FSC Project.
9.3.1 Applicable Noise Regulations
The unit of noise measurement is the decibel (“dB”), which measures the energy of the noise. Because the human ear is not uniformly sensitive to all noise frequencies, the A-weighted frequency scale (denoted as “A-wt” sound level or “dBA”) was devised to correspond with the ear’s sensitivity.
9.3.1.1 Federal Energy Regulatory Commission
FERC guidelines and typical certificate conditions require that the sound attributable to a compressor station or other operational facilitates not exceed a day-night average sound level (i.e., Ldn) of 55 dBA at any nearby noise sensitive area (“NSA”), unless such NSAs are established after facility construction. In this case, operation of the FSC Project will not produce noise: Compressor facilities are not proposed as part of the FSC Project and the FSC Project’s meter station and launcher and receiver sites are not considered noise sources.
Construction of the FSC Project will produce noise associated with horizontal directional drilling (HDD), and FERC typically requires that the sound attributable to 24-hour HDD operations should not exceed 55 dBA (Ldn) at the NSAs or be 10 dBA over the background (ambient) noise level if the ambient levels are above 55 dBA (Ldn). If it is projected that the sound criteria/guidelines could be exceeded at any nearby NSA, it will be necessary to describe noise mitigation measures which would be implemented during drilling activity to reduce the noise impacts of the drilling operations and achieve the sound criteria/guidelines.
2 The atmospheric stability conditions during daytime typically promote more rapid dispersion of pollutants
than during nighttime.
Draft Resource Report 9 – Air and Noise Quality 9-5 FLORIDA SOUTHEAST CONNECTION PROJECT
9.3.1.2 State and Local Noise Regulations
The State of Florida does not have a noise standard. Of the proposed HDDs only the one in Martin County and the proposed alternate northern crossing of the Kissimmee River will be within 0.5 miles of an NSA. Martin County has a noise ordinance, Section 824 of the County Code, which prohibits construction on projects within the county between the hours of 9:00 p.m. to 7:00 a.m. In addition, the ordinance limits noise in residential areas (the applicable land use for the HDD site work at the SR 710 crossing) to 60 dBA from 7:00 a.m. to 9:00 p.m. and 55 dBA from 9:00 p.m. to 7:00 a.m. but construction related noise levels are exempt from the limits provided construction occurs during allowable hours. The ordinance further requires the use of mufflers on any internal combustion engine used in construction.
The Kissimmee River HDD crossing traverses Polk and Osceola Counties. Polk County has a noise ordinance (Ordinance 04-33) that limits construction to the hours of 6 a.m. to 9 p.m. Osceola County has a noise ordinance (Article IV of the County Code of Ordinances) that limits construction to the hours of 7 a.m. to sunset.
9.3.2 Pipeline Construction
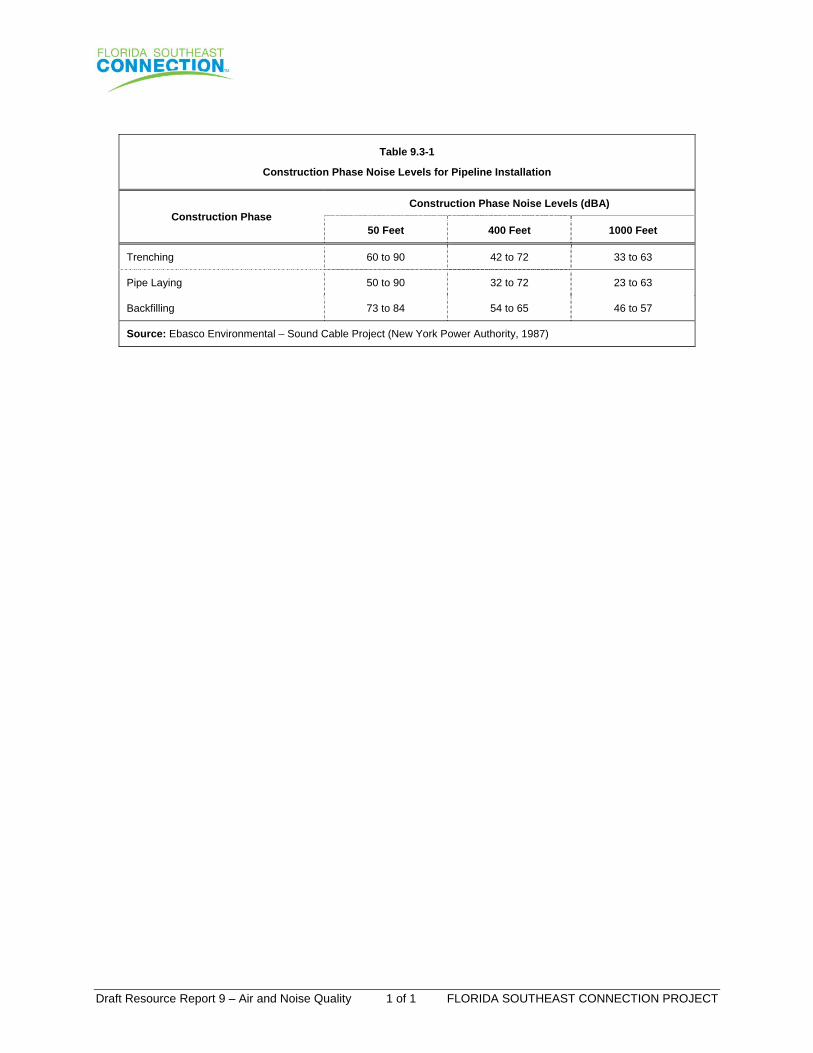
FSC plans to begin construction in 2016 and initiate service in May 2017. The majority of construction of the proposed FSC Project would occur from March 2016 through May 2017 using one or more construction spreads. Construction at any single point along the proposed FSC Project, from initial surveying and clearing to backfilling and finish grading, is expected to last approximately two to four months. Any potential construction noise impacts will therefore be temporary. Construction will typically include the following activities, which would be performed in phases and would result in noise ranges of between 50 to 90 dBA at 50 feet, depending on the activity, and reduced noise levels further away (see Table 9.3-1):
Trenching and pipe laying;
Horizontal boring/jacking (if required);
Backfilling and right of way restoration;
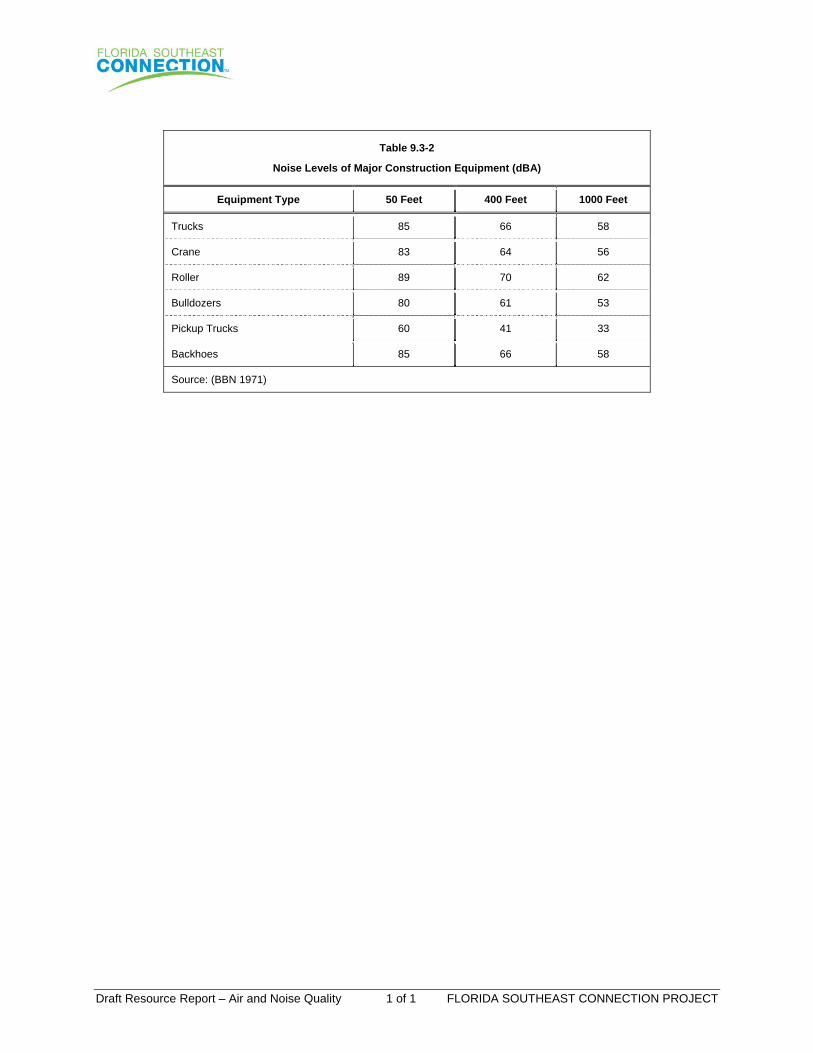
Construction equipment utilized will differ from phase to phase, but will typically include bulldozers, cranes, dump trucks, sidebooms, and loaders. Noise is generated during construction primarily from diesel engines which power the equipment. Exhaust noise usually is the predominant source of diesel engine noise. All equipment will be required to maintain functional mufflers during construction of the facilities. Noise levels of construction equipment typically utilized for this type of project are presented in Table 9.3-2.
The noise levels presented in Tables 9.3-1 and 9.3-2 are those that would be experienced by people outdoors. A building will provide significant attenuation of associated construction noise impacts. For instance, sound levels can be expected to be up to 27 dBA lower indoors with windows closed. Even in homes with windows open, indoor sound levels can be reduced by up to 17 dBA (USEPA, 1978).
9.3.2.1 Pipeline Construction Noise Mitigation Measures
An important factor mitigating noise impact from pipeline construction is that such noise will be of short duration and limited to a relatively small distance: 50-400 foot stretches. Work in the these areas will generally last no more than a few days to one week, as typical construction activities move along the corridor. However, as previously stated, construction from initial surveying and clearing to backfilling and finish grading at any one point would last approximately two to four months. Therefore, no single receptor will be exposed to significant noise levels for an extended period. Additionally, because construction equipment does not
Draft Resource Report 9 – Air and Noise Quality 9-6 FLORIDA SOUTHEAST CONNECTION PROJECT
operate continually, construction noise is expected to be intermittent. The construction equipment to be used is similar to that used during typical public works projects (e.g., road resurfacing, storm sewer installation, etc.), and will not result in significantly higher noise sources than experienced by the public on such construction projects. As a general construction practice, functional mufflers will be maintained on all equipment to maintain noise levels as low as reasonably achievable.
9.3.3 Horizontal Direction Drilling
HDD techniques are currently proposed to be utilized at three locations along the pipeline route. In accordance with the FERC requirements, FSC assessed impacts from HDD noise on NSA’s within 0.5 miles of the HDD entry and exit points. The planned HDD crossings of State Road (“SR”) 710 and of the Kissimmee River have NSAs located within 0.5 miles of both the entry and exit points, while the HDD crossing of existing infrastructure between MP 115 and 116 does not have NSAs located within 0.5 miles of either the entry or exit point.
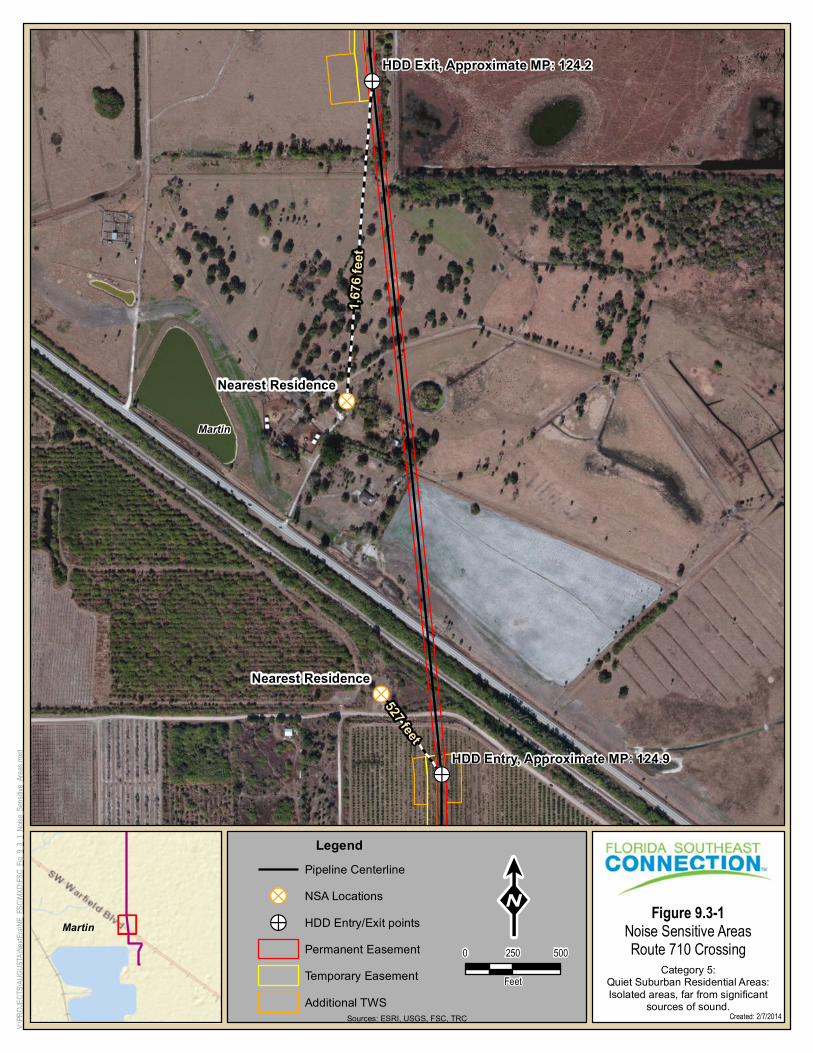
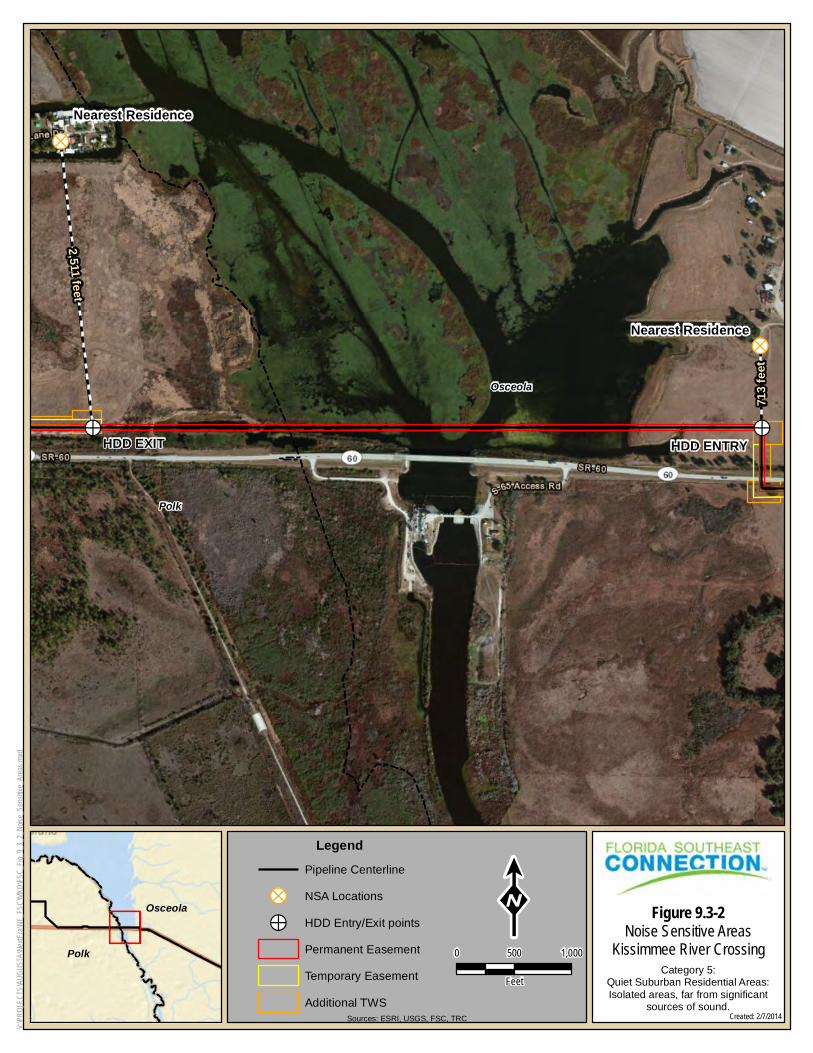
The NSAs were identified through detailed review of aerial photography at each proposed HDD location and confirmed during a site visit. The HDD entry and exit points and the nearest NSA within a 0.5 mile radius of the SR 710 crossing and Kissimmee River crossing are presented in Figures 9.3-1 and 9.3-2, respectively. HDD is currently only planned for daytime hours. As such, this analysis presents the calculated HDD equivalent sound levels (Leq). An additional level of analysis was nonetheless conducted utilizing the Ldn in the event that nighttime HDD is required.
9.3.3.1 Existing Ambient Conditions
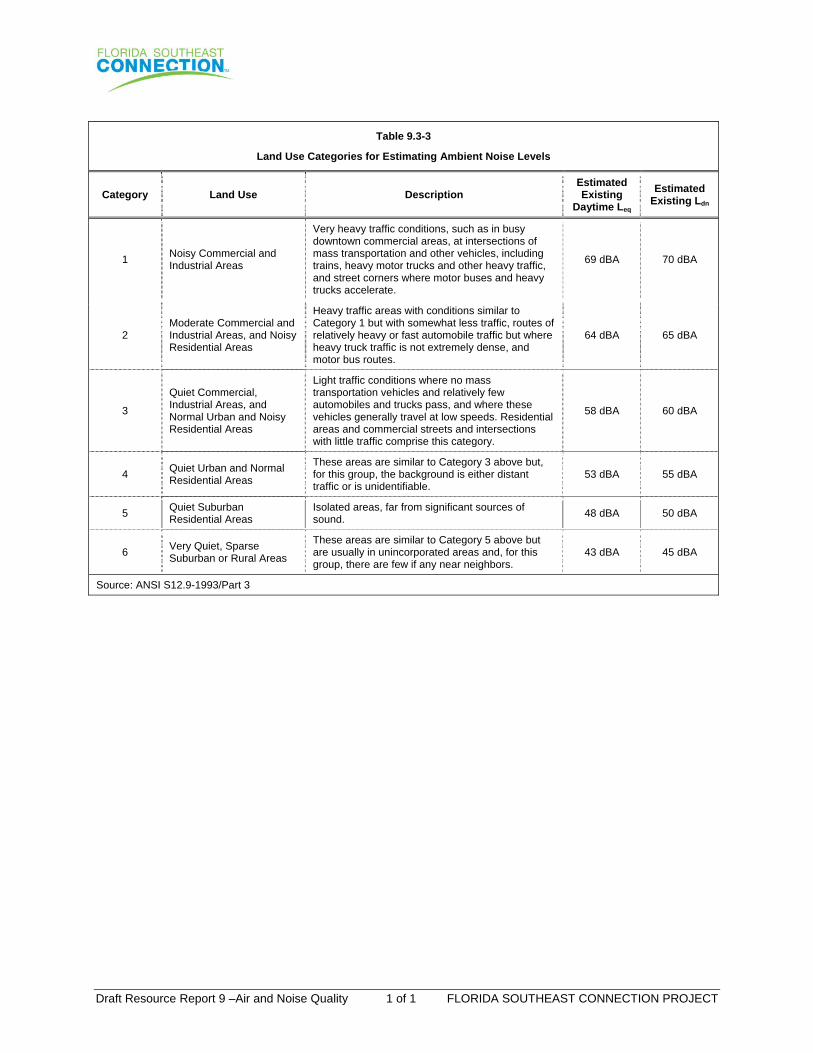
The land use in the vicinity of the SR710 HDD crossing consists of undeveloped land and low density residential uses, although the FPL Martin Clean Energy Center is located less than two miles to the south of the SR710 HDD crossing. The land use at the Kissimmee River crossing consists of undeveloped land and low density suburban residential. Existing ambient noise levels in the area of both HDD drill sites were estimated by determining the land uses in the areas through a review of aerial photography. General ambient noise levels by land use have been estimated by the USEPA (USEPA, 1978). However, a more detailed estimate is provided in the American National Standards Institute (ANSI) standard 12.9-1993/Part 3. The standard provides estimates of existing Leq and Ldn levels based on detailed descriptions of land use categories. The levels are in general agreement with those published by USEPA. The ANSI standard noise estimation divides land uses into six distinct categories. These categories, their descriptions and the estimated existing Leq and Ldn levels are provided in Table 9.3-3.
Utilizing the ANSI standard, existing ambient noise levels at the nearest NSA to the entry and exit point for the SR710 HDD crossing were estimated and determined to be in land use category 4 (Quiet Urban and Normal Residential Areas). The estimated ambient noise levels in the area of the Kissimmee River HDD crossing were determined to be in category 5 (Quiet Suburban Residential Areas).
9.3.3.2 HDD Noise Levels
HDD utilizes a number of pieces of equipment that include power generation, control rooms, an excavator, and storage trailers. Of these sources, the diesel engine power generation units are the most significant noise generating sources. Noise level data measured at a typical HDD site where a 600 hp drive drill engine was in use were utilized for this analysis. These data indicate that HDD entry generates a sound level, with equipment at full load, of approximately 85 dBA at 50 feet. Noise levels on the exit side of the HDD, where less equipment is needed, are approximately 79 dBA at 50 feet. Estimated HDD noise levels as Leq levels at each NSA location for this Project were calculated assuming daytime drilling only.
Draft Resource Report 9 – Air and Noise Quality 9-7 FLORIDA SOUTHEAST CONNECTION PROJECT
The results of the analysis, including the HDD locations, the distance and direction to the nearest NSA, estimated existing ambient levels, calculated HDD noise levels and projected increases above existing ambient levels, are provided in Table 9.3-4 for an unmitigated case. A calculated noise level of 61.5 dBA is projected at the nearest NSA to the SR710 HDD entry point, with a corresponding increase above ambient of 9.1 dBA. At the nearest NSA to the Kissimmee River HDD entry point, a calculated noise level of 60.8 dBA is projected, with a corresponding increase above ambient of 12.8 dBA. Current plans are for daytime only HDD.
In the event that the residents indicate that the HDD activities either are or will be a disruption to them, FSC is prepared to utilize mitigative measures at the HDD entry site or provide compensation to the landowners for temporary housing at a commercial hotel or motel in the general area during HDD-related construction activities. The nearby NSA will be notified several days prior to beginning work to advise them of the onset and duration of construction.
If additional noise mitigation is required, an onsite evaluation of equipment noise will be completed to further identify the predominant noise sources. Based on this evaluation, additional noise mitigation measures will be recommended which may include:
Reconfiguring equipment locations to take advantage of natural and artificial noise barriers (e.g., hay bales);
Installing a partial noise barrier around the hydraulic power unit, including the engine & associated engine jacket-water cooler. For example, cover two sides of power unit with a plywood barrier system or other type of effective noise barrier system;
Using residential grade silencers or mufflers on engines;
Using gear box noise blankets and other mechanical noise dampening blankets, acoustical tents, acoustical barriers; and
Employing “low noise” generators.
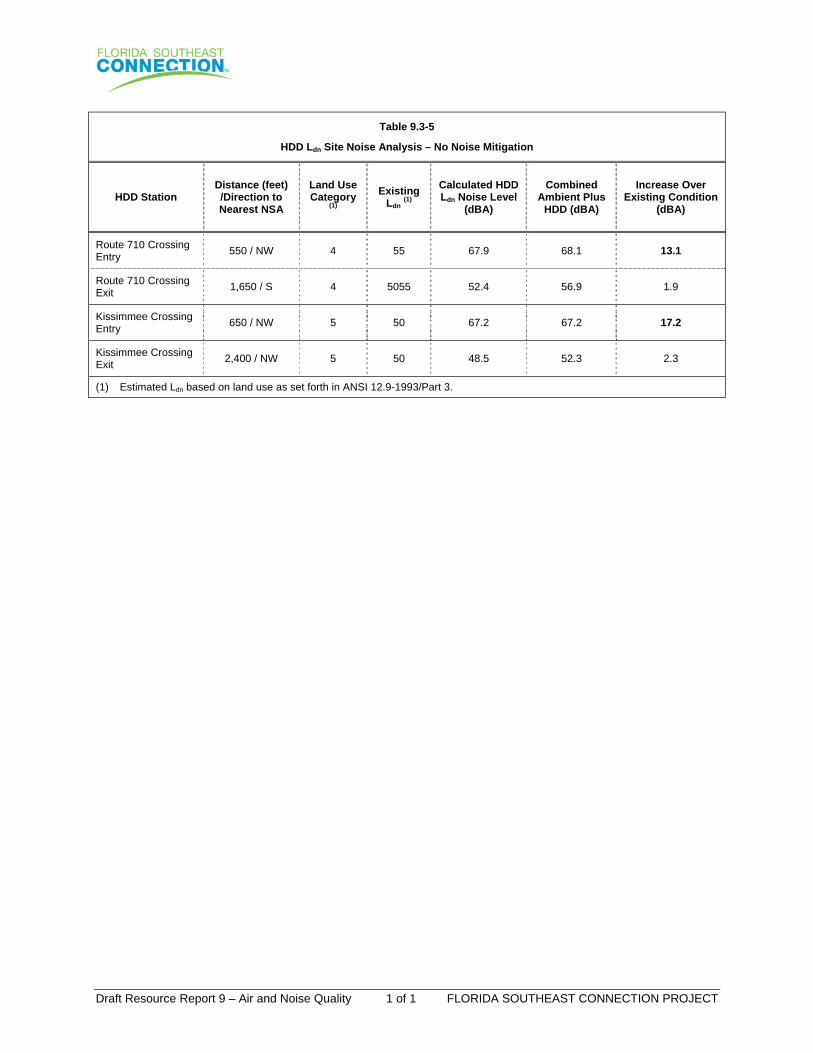
Notwithstanding that only daytime HDD activities are currently planned, FSC evaluated potential noise levels in the event that nighttime (24-hour) HDD is required. This additional analysis evaluated Ldn noise levels to incorporate the additional potential for noise impacts during nighttime hours. The results of this analysis are provided in Table 9.3-5.
The noise level increases predicted in the analyses described above for 24-hour HDD construction activities are based on unmitigated noise produced by HDD drilling equipment and are therefore considered worst-case. The calculated HDD noise level exceeds FERC’s criteria of 55 dBA Ldn and is greater than 10 dBA above the estimated existing Ldn level at both HDD entry point NSAs. The noise levels produced by drilling equipment may be reduced by up to 10 to 15 dBA through mitigative actions described previously.
Residents of nearby NSAs will also be notified in advance of any planned overnight HDD-related construction activities to advise them that noise-generating equipment may be operated during night-time hours. Should any HDD require overnight operations, noise surveys will be conducted to determine whether HDD noise levels satisfy the 55 dBA target and the 10 dBA increase criteria. If noise levels cannot be reduced to target levels, then temporary housing will be offered to the occupants of affected NSAs at a commercial hotel or motel in the Project area until nighttime HDD-related construction activities are completed.
Draft Resource Report 9 – Air and Noise Quality 9-8 FLORIDA SOUTHEAST CONNECTION PROJECT
9.4 References
American National Standards Institute. 1993. ANSI S12.9-1993/Part 3. Quantities and Procedures for Description and Measurement of Environmental Sound. Part 3: Short-Term Measurements with an Observer Present.BBN. 1971.
Bolt, Beranek and Newman, Inc. 1971. Noise from Construction Equipment and Operations, Building Equipment, and Home Appliances.
Climate Registry Default Emission Factors, 2014. http://www.theclimateregistry.org/resources/ protocols/general-reporting-protocol/#jump2. Accessed 02/03/2014.
Ebasco Environmental. 1987. New York Power Authority Sound Cable Project Article VII Application.
Southeast Regional Data Climate Center. University of North Carolina, Chapel Hill, NC. National Climatic Data Center. http://www.sercc.com/index.php. Accessed 1/11/14.
USEPA. 2013. Motor Vehicle Emission Simulator (MOVES) - User Guide for MOVES2010b2010. Mobile Vehicle Emissions Simulator.
USEPA. 1978. Protective Noise Levels. Office of Noise Abatement & Control. Report Number EPA 550/9-79-100. Washington, D. C. 20460.
USEAP. 1996. AP-42 Compilation of Air Pollutant Emission Factors, Fifth Edition, Volume I, Section 13.1, “Wildfires and Prescribed Burning”.
USEPA. 2005. User’s Guide for the Final NONROAD2005, EPA420-R-05-013.
Western Regional Air Partnership. 2006. Fugitive Dust Handbook, Countess Environmental, Section 3.4.1.
Draft Resource Report 9 – Air and Noise Quality FLORIDA SOUTHEAST CONNECTION PROJECT
TABLES
Draft Resource Report 9 – Air and Noise Quality 1 of 1 FLORIDA SOUTHEAST CONNECTION PROJECT
Table 9.2-1
Regional Climate Data for Okeechobee County, Florida
Parameter Jan Feb Mar Apr May Jun Jul Aug Sep Oct Nov Dec Annual
Average Max. Temperature (⁰F)
74.20 75.90 79.60 83.80 88.00 90.20 91.50 91.60 89.70 85.40 80.10 75.00 83.70
Average Min. Temperature (⁰F)
49.50 50.80 54.70 57.90 63.30 69.00 70.70 71.20 70.10 64.60 57.80 51.00 60.90
Average Total Precipitation (in.)
2.17 2.36 3.21 2.51 4.03 8.04 7.32 7.22 6.80 3.94 2.06 1.82 51.49
Average Total Snow Fall (in.)
- - - - - - - - - - - - -
Average Snow Depth (in.)
- - - - - - - - - - - - -
Source: Data reported for Fort Drum 5 NW, Okeechobee County, Florida by Southeast Regional Data climate center, University of North Carolina, Chapel Hill, NC, http://www.sercc.com/index.php accessed 1/11/14
Period of Record: 8/1/1948 to 5/15/2011 ⁰F = degrees Fahrenheit in. = inches
Draft Resource Report – Air and Noise Quality 1 of 1 FLORIDA SOUTHEAST CONNECTION PROJECT
Table 9.2-2
National Ambient Air Quality Standards
Pollutant Averaging
Time
Primary Standard
Secondary Standard Form
(ppm) (ug/m3) (ppm) (μg/m3)
Respirable Particulate (PM10)
24-hour --- 150 --- 150 Not to be exceeded more than once per year on average over 3 years
Fine Particulate (PM₂.₅)
24-hour --- 35 --- 35 98th percentile, averaged over 3 years
Annual --- 12 --- 15 Annual mean, averaged over 3 years
Nitrogen Dioxide (NO₂)
1-hour 0.100 188 --- --- 98th percentile, averaged over 3 years
Annual 0.053 100 0.053 100 Annual Mean
Sulfur Dioxide (SO₂)
1-hour 0.075 196 --- --- 99th percentile of 1-hour daily maximum concentrations, averaged over 3 years
3-hour --- --- 0.5 1,300 Not to be exceeded more than once per year
Carbon Monoxide (CO)
8-hour 9 10,300 --- --- Not to be exceeded more than once per year
1-hour 35 40,000 --- --- Not to be exceeded more than once per year
Ozone (O₃)
1-hour 0.12 236 0.12 236 Not to be exceeded more than once per year
8-hour (2008)
0.075 147 0.075 147 Annual fourth-highest daily maximum 8-hr concentration, averaged over 3 years
8-hour (1997)
0.08 157 0.08 157 Annual fourth-highest daily maximum 8-hr concentration, averaged over 3 years
Lead (Pb)
3-month rolling
--- 0.15 --- 0.15 Not to be exceeded
ppm = parts per million μg/m3 = micrograms per cubic meter. Source: http://www.epa.gov/air/criteria.html accessed 02/3/14
Draft Resource Report 9 – Air and Noise Quality 1 of 1 FLORIDA SOUTHEAST CONNECTION PROJECT
Table 9.2-3
Attainment Status of FSC Project Area
Pollutant Designation Date Status / Designation
PM₁₀ 11/15/1990 Unclassifiable
24-hour PM₂.₅ 12/13/2009 Unclassifiable / Attainment
Annual PM₂.₅ 04/05/2005 Unclassifiable / Attainment
NO₂ n/a Cannot be classified or better than national standards
SO₂ n/a Cannot be classified
CO 11/15/1990 Unclassifiable / Attainment
1-hour O₃ 10/18/2000 Unclassifiable / Attainment
8-hour O₃ (1997 Standard) 06/15/2004 Unclassifiable / Attainment
8-hour O₃ (2008 Standard) 07/20/2012 Unclassifiable / Attainment
Pb 12/31/2010 Unclassifiable
Source: 40 CFR 81.310
Draft Resource Report 9 – Air and Noise Quality 1 of 1 FLORIDA SOUTHEAST CONNECTION PROJECT
Table 9.2-4
Existing Ambient Air Quality Estimated for the FSC Project Area
Pollutant Monitoring Station ID
Averaging Time
Years Concentrations
Rank Comment (ppm) (μg/m3)
PM10 12-105-6006 24-hour 2010 - 2012 n/a 41.7 H2H 1, 2
PM2.5 12-105-6006 Annual 2010 - 2012 n/a 7.5 Annual mean 1, 2
24-hour n/a 15.8 98th percentile
NO2 12-095-2002 1-hour 2010 - 2012 0.029 54.6 98th percentile, averaged over 3 years
2, 3
Annual 0.014 26.0 Annual Mean
SO2 12-095-2002 1-hour 2010 - 2012 0.0037 9.6 99th Percentile 2, 3
3-hour 0.0044 11.5 H2H
CO 12-095-2002 8-hour 2010 - 2012 1.37 1,565 H2H 2, 3
1-hour 1.67 1,909 H2H
O3 12-105-6006 8-hour 2010 - 2012 0.070 137 H4H 1, 2
1-hour 0.091 179 H2H
Pb n/a n/a n/a n/a n/a Largest 3-month rolling average
4
1. Baptist Childrens' Home, 1015 Sikes Blvd., Lakeland, Polk County, Florida. 2. Complete data for 2013 were not available when this report was prepared. 3. Winter Park, Morris Blvd., Winter Park, Orange County, Florida. 4. Representative data for Pb are not available. H2H = High second high H4H = High fourth high Source: EPA AirData http://www.epa.gov/airdata/
Draft Resource Report 9 – Air and Noise Quality 1 of 1 FLORIDA SOUTHEAST CONNECTION PROJECT
Table 9.2-5
Estimated Construction Emissions
Year and Source Emissions by Year (tons)
CO NOх SO₂ VOC PM₁₀ PM₂.₅ CO₂ CO₂e
2016
Construction Equipment 179.72 119.52 0.19 14.12 7.06 7.06 27,958 28,193
Commuting / Deliveries 11.49 24.32 0.07 1.51 0.99 0.96 9,484 9,491
Fugitive Dust --- --- --- --- 160.36 18.45 --- ---
Open Burning 709.38 20.12 --- 121.75 86.53 86.53 16,001 16,084
Total 900.59 163.96 0.27 137.39 254.95 113.01 53,444 53,767
2017
Construction Equipment 78.22 52.11 0.09 6.39 3.06 3.06 13,790 13,905
Commuting / Deliveries 5.21 10.58 0.04 0.67 0.42 0.41 4,734 4,738
Fugitive Dust --- --- --- --- 80.18 9.23 --- ---
Open Burning 349.40 9.91 --- 59.97 42.62 42.62 7,881 7,922
Total 432.83 72.61 0.13 67.02 126.28 55.32 26,405 26,565
Source: Appendix A Table 9.A.1.10
Draft Resource Report 9 – Air and Noise Quality 1 of 1 FLORIDA SOUTHEAST CONNECTION PROJECT
Table 9.3-1
Construction Phase Noise Levels for Pipeline Installation
Construction Phase Construction Phase Noise Levels (dBA)
50 Feet 400 Feet 1000 Feet
Trenching 60 to 90 42 to 72 33 to 63
Pipe Laying 50 to 90 32 to 72 23 to 63
Backfilling 73 to 84 54 to 65 46 to 57
Source: Ebasco Environmental – Sound Cable Project (New York Power Authority, 1987)
Draft Resource Report – Air and Noise Quality 1 of 1 FLORIDA SOUTHEAST CONNECTION PROJECT
Table 9.3-2
Noise Levels of Major Construction Equipment (dBA)
Equipment Type 50 Feet 400 Feet 1000 Feet
Trucks 85 66 58
Crane 83 64 56
Roller 89 70 62
Bulldozers 80 61 53
Pickup Trucks 60 41 33
Backhoes 85 66 58
Source: (BBN 1971)
Draft Resource Report 9 –Air and Noise Quality 1 of 1 FLORIDA SOUTHEAST CONNECTION PROJECT
Table 9.3-3
Land Use Categories for Estimating Ambient Noise Levels
Category Land Use Description Estimated Existing
Daytime Leq
Estimated Existing Ldn
1 Noisy Commercial and Industrial Areas
Very heavy traffic conditions, such as in busy downtown commercial areas, at intersections of mass transportation and other vehicles, including trains, heavy motor trucks and other heavy traffic, and street corners where motor buses and heavy trucks accelerate.
69 dBA 70 dBA
2 Moderate Commercial and Industrial Areas, and Noisy Residential Areas
Heavy traffic areas with conditions similar to Category 1 but with somewhat less traffic, routes of relatively heavy or fast automobile traffic but where heavy truck traffic is not extremely dense, and motor bus routes.
64 dBA 65 dBA
3
Quiet Commercial, Industrial Areas, and Normal Urban and Noisy Residential Areas
Light traffic conditions where no mass transportation vehicles and relatively few automobiles and trucks pass, and where these vehicles generally travel at low speeds. Residential areas and commercial streets and intersections with little traffic comprise this category.
58 dBA 60 dBA
4 Quiet Urban and Normal Residential Areas
These areas are similar to Category 3 above but, for this group, the background is either distant traffic or is unidentifiable.
53 dBA 55 dBA
5 Quiet Suburban Residential Areas
Isolated areas, far from significant sources of sound.
48 dBA 50 dBA
6 Very Quiet, Sparse Suburban or Rural Areas
These areas are similar to Category 5 above but are usually in unincorporated areas and, for this group, there are few if any near neighbors.
43 dBA 45 dBA
Source: ANSI S12.9-1993/Part 3

Draft Resource Report 9 – Air and Noise Quality 1 of 1 FLORIDA SOUTHEAST CONNECTION PROJECT
Table 9.3-4
HDD Leq Site Noise Analysis – No Noise Mitigation
HDD Station Distance (feet) /Direction to Nearest NSA
Land Use Category
(1)
Existing Daytime
Leq (1)
Calculated HDD Leq Noise Level
(dBA)
Combined Ambient Plus
HDD (dBA)
Increase Over Existing Condition
(dBA)
SR 710 Crossing Entry
550 / NW 4 53 61.5 62.1 9.1
SR 710 Crossing Exit
1,650 / S 4 53 46.0 53.8 0.8
Kissimmee Crossing Entry
650 / NW 5 48 60.8 60.8 12.8
Kissimmee Crossing Exit
2,400 / NW 5 48 42.1 49.0 1.0
(1) Estimated Leq based on land use as set forth in ANSI 12.9-1993/Part 3.
Draft Resource Report 9 – Air and Noise Quality 1 of 1 FLORIDA SOUTHEAST CONNECTION PROJECT
Table 9.3-5
HDD Ldn Site Noise Analysis – No Noise Mitigation
HDD Station Distance (feet) /Direction to Nearest NSA
Land Use Category
(1)
Existing Ldn
(1)
Calculated HDD Ldn Noise Level
(dBA)
Combined Ambient Plus
HDD (dBA)
Increase Over Existing Condition
(dBA)
Route 710 Crossing Entry
550 / NW 4 55 67.9 68.1 13.1
Route 710 Crossing Exit
1,650 / S 4 5055 52.4 56.9 1.9
Kissimmee Crossing Entry
650 / NW 5 50 67.2 67.2 17.2
Kissimmee Crossing Exit
2,400 / NW 5 50 48.5 52.3 2.3
(1) Estimated Ldn based on land use as set forth in ANSI 12.9-1993/Part 3.
Draft Resource Report 9 – Air and Noise Quality FLORIDA SOUTHEAST CONNECTION PROJECT
FIGURES
Sources: ESRI, USGS, FSC, TRC
Figure 9.3-1Noise Sensitive AreasRoute 710 Crossing
V:\PRO
JECTS
\AUGU
STA\Ne
xtEra\N
E_FS
C\MXD
\FSC_
Fig_9_
3_1_N
oise_S
ensitiv
e_Area
s.mxd
!>
!>
!?
!?
1,676
feet
527 feet
Nearest Residence
Nearest Residence
Martin
HDD Exit, Approximate MP: 124.2
HDD Entry, Approximate MP: 124.9
Martin
Created: 2/7/2014
LegendPipeline Centerline
!? NSA Locations
!> HDD Entry/Exit pointsPermanent EasementTemporary EasementAdditional TWS
Category 5:Quiet Suburban Residential Areas:Isolated areas, far from significant
sources of sound.
K0 250 500
Feet
Sources: ESRI, USGS, FSC, TRC
Figure 9.3-2Noise Sensitive Areas
Kissimmee River Crossing
V:\PRO
JECTS
\AUGU
STA\Ne
xtEra\N
E_FS
C\MXD
\FSC_
Fig_9_
3_2_N
oise_S
ensitiv
e_Area
s.mxd
!>!>
!?
!?
Nearest Residence
Nearest Residence
HDD EXIT HDD ENTRY
2,511 feet71
3 fee
t
Osceola
Polk
Polk
Osceola
Created: 2/7/2014
LegendPipeline Centerline
!? NSA Locations
!> HDD Entry/Exit points
Permanent Easement
Temporary Easement
Additional TWS
Category 5:Quiet Suburban Residential Areas:Isolated areas, far from significant
sources of sound.
K0 500 1,000
Feet
Draft Resource Report 9 – Air and Noise Quality FLORIDA SOUTHEAST CONNECTION PROJECT
APPENDICES
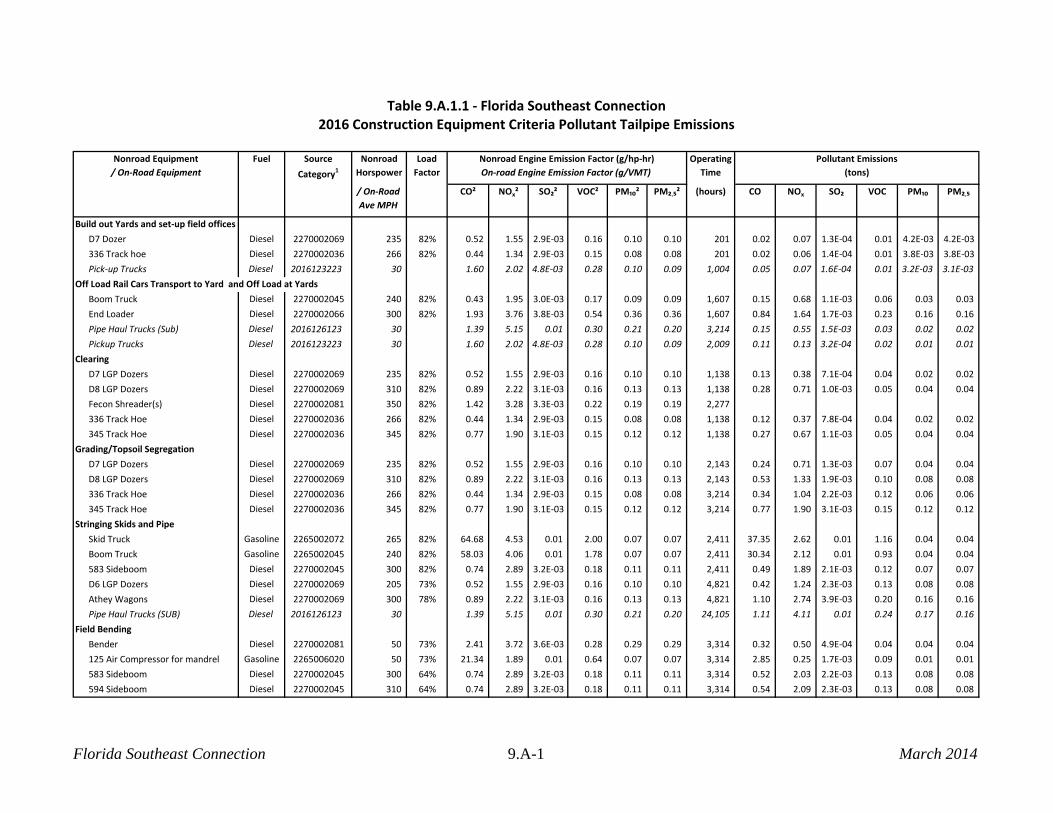
Table 9.A.1.1 - Florida Southeast Connection Table 9.A.1.2 - Florida Southeast Connection2016 Construction Equipment Criteria Pollutant Tailpipe Emissions 2016 Construction Equipment Greenhouse Gas Tailpipe Emissions
(Continued)Fuel Source
Category1
Nonroad
Horspower
Load
Factor
Operating
Time
/ On-Road
Ave MPH
CO² NOx² SO₂² VOC² PM₁₀² PM₂.₅² (hours) CO NOx SO₂ VOC PM₁₀ PM₂.₅
Build out Yards and set-up field offices
D7 Dozer Diesel 2270002069 235 82% 0.52 1.55 2.9E-03 0.16 0.10 0.10 201 0.02 0.07 1.3E-04 0.01 4.2E-03 4.2E-03
336 Track hoe Diesel 2270002036 266 82% 0.44 1.34 2.9E-03 0.15 0.08 0.08 201 0.02 0.06 1.4E-04 0.01 3.8E-03 3.8E-03
Pick-up Trucks Diesel 2016123223 30 100% 1.60 2.02 4.8E-03 0.28 0.10 0.09 1,004 0.05 0.07 1.6E-04 0.01 3.2E-03 3.1E-03
Off Load Rail Cars Transport to Yard and Off Load at Yards
Boom Truck Diesel 2270002045 240 82% 0.43 1.95 3.0E-03 0.17 0.09 0.09 1,607 0.15 0.68 1.1E-03 0.06 0.03 0.03
End Loader Diesel 2270002066 300 82% 1.93 3.76 3.8E-03 0.54 0.36 0.36 1,607 0.84 1.64 1.7E-03 0.23 0.16 0.16
Pipe Haul Trucks (Sub) Diesel 2016126123 30 100% 1.39 5.15 0.01 0.30 0.21 0.20 3,214 0.15 0.55 1.5E-03 0.03 0.02 0.02
Pickup Trucks Diesel 2016123223 30 100% 1.60 2.02 4.8E-03 0.28 0.10 0.09 2,009 0.11 0.13 3.2E-04 0.02 0.01 0.01
Clearing
D7 LGP Dozers Diesel 2270002069 235 82% 0.52 1.55 2.9E-03 0.16 0.10 0.10 1,138 0.13 0.38 7.1E-04 0.04 0.02 0.02
D8 LGP Dozers Diesel 2270002069 310 82% 0.89 2.22 3.1E-03 0.16 0.13 0.13 1,138 0.28 0.71 1.0E-03 0.05 0.04 0.04
Fecon Shreader(s) Diesel 2270002081 350 82% 1.42 3.28 3.3E-03 0.22 0.19 0.19 2,277
336 Track Hoe Diesel 2270002036 266 82% 0.44 1.34 2.9E-03 0.15 0.08 0.08 1,138 0.12 0.37 7.8E-04 0.04 0.02 0.02
345 Track Hoe Diesel 2270002036 345 82% 0.77 1.90 3.1E-03 0.15 0.12 0.12 1,138 0.27 0.67 1.1E-03 0.05 0.04 0.04
Grading/Topsoil Segregation
D7 LGP Dozers Diesel 2270002069 235 82% 0.52 1.55 2.9E-03 0.16 0.10 0.10 2,143 0.24 0.71 1.3E-03 0.07 0.04 0.04
D8 LGP Dozers Diesel 2270002069 310 82% 0.89 2.22 3.1E-03 0.16 0.13 0.13 2,143 0.53 1.33 1.9E-03 0.10 0.08 0.08
336 Track Hoe Diesel 2270002036 266 82% 0.44 1.34 2.9E-03 0.15 0.08 0.08 3,214 0.34 1.04 2.2E-03 0.12 0.06 0.06
345 Track Hoe Diesel 2270002036 345 82% 0.77 1.90 3.1E-03 0.15 0.12 0.12 3,214 0.77 1.90 3.1E-03 0.15 0.12 0.12
Stringing Skids and Pipe
Skid Truck Gasoline 2265002072 265 82% 64.68 4.53 0.01 2.00 0.07 0.07 2,411 37.35 2.62 0.01 1.16 0.04 0.04
Boom Truck Gasoline 2265002045 240 82% 58.03 4.06 0.01 1.78 0.07 0.07 2,411 30.34 2.12 0.01 0.93 0.04 0.04
583 Sideboom Diesel 2270002045 300 82% 0.74 2.89 3.2E-03 0.18 0.11 0.11 2,411 0.49 1.89 2.1E-03 0.12 0.07 0.07
D6 LGP Dozers Diesel 2270002069 205 73% 0.52 1.55 2.9E-03 0.16 0.10 0.10 4,821 0.42 1.24 2.3E-03 0.13 0.08 0.08
Athey Wagons Diesel 2270002069 300 78% 0.89 2.22 3.1E-03 0.16 0.13 0.13 4,821 1.10 2.74 3.9E-03 0.20 0.16 0.16
Pipe Haul Trucks (SUB) Diesel 2016126123 30 100% 1.39 5.15 0.01 0.30 0.21 0.20 24,105 1.11 4.11 0.01 0.24 0.17 0.16
Field Bending
Bender Diesel 2270002081 50 73% 2.41 3.72 3.6E-03 0.28 0.29 0.29 3,314 0.32 0.50 4.9E-04 0.04 0.04 0.04
125 Air Compressor for mandrel Gasoline 2265006020 50 73% 21.34 1.89 0.01 0.64 0.07 0.07 3,314 2.85 0.25 1.7E-03 0.09 0.01 0.01
583 Sideboom Diesel 2270002045 300 64% 0.74 2.89 3.2E-03 0.18 0.11 0.11 3,314 0.52 2.03 2.2E-03 0.13 0.08 0.08
594 Sideboom Diesel 2270002045 310 64% 0.74 2.89 3.2E-03 0.18 0.11 0.11 3,314 0.54 2.09 2.3E-03 0.13 0.08 0.08
Nonroad Equipment
/ On-Road Equipment
Nonroad Engine Emission Factor (g/hp-hr)
On-road Engine Emission Factor (g/VMT)
Pollutant Emissions
(tons)
Florida Southeast Connection 9.A-1 March 2014

Table 9.A.1.1 - Florida Southeast Connection Table 9.A.1.2 - Florida Southeast Connection2016 Construction Equipment Criteria Pollutant Tailpipe Emissions 2016 Construction Equipment Greenhouse Gas Tailpipe Emissions
(Continued) (Continued)Fuel Source
Category1
Nonroad
Horspower
Load
Factor
Operating
Time
/ On-Road
Ave MPH
CO² NOx² SO₂² VOC² PM₁₀² PM₂.₅² (hours) CO NOx SO₂ VOC PM₁₀ PM₂.₅
Nonroad Equipment
/ On-Road Equipment
Nonroad Engine Emission Factor (g/hp-hr)
On-road Engine Emission Factor (g/VMT)
Pollutant Emissions
(tons)
Firing Line Welding
125 Air Compressor for mandrel Gasoline 2265006020 50 55% 21.34 1.89 0.01 0.64 0.07 0.07 3,214 2.08 0.18 1.3E-03 0.06 0.01 0.01
Tack Rig D7 w/ 4 welders Diesel 2270002069 235 55% 0.52 1.55 2.9E-03 0.16 0.10 0.10 6,428 0.48 1.42 2.7E-03 0.15 0.09 0.09
welder #1 Diesel 2270006025 25 78% 4.09 4.92 4.3E-03 0.93 0.65 0.65 6,428 0.56 0.67 6.0E-04 0.13 0.09 0.09
welder #2 Diesel 2270006025 25 78% 4.09 4.92 4.3E-03 0.93 0.65 0.65 6,428 0.56 0.67 6.0E-04 0.13 0.09 0.09
welder #3 Diesel 2270006025 25 78% 4.09 4.92 4.3E-03 0.93 0.65 0.65 6,428 0.56 0.67 6.0E-04 0.13 0.09 0.09
welder #4 Diesel 2270006025 25 78% 4.09 4.92 4.3E-03 0.93 0.65 0.65 6,428 0.56 0.67 6.0E-04 0.13 0.09 0.09
583 Sideboom Diesel 2270002045 300 69% 0.74 2.89 3.2E-03 0.18 0.11 0.11 3,214 0.54 2.10 2.3E-03 0.13 0.08 0.08
Morooka Buggies Diesel 2270002069 300 64% 0.89 2.22 3.1E-03 0.16 0.13 0.13 32,140 6.06 15.11 0.02 1.10 0.87 0.87
Welding Machines Diesel 2270006025 25 82% 4.09 4.92 4.3E-03 0.93 0.65 0.65 80,350 7.42 8.93 0.01 1.70 1.17 1.17
Field Joint Coating
Skid Truck and or Morooka Diesel 2270002069 300 64% 0.89 2.22 3.1E-03 0.16 0.13 0.13 9,642 1.82 4.53 0.01 0.33 0.26 0.26
FBE Coating Equipment Gasoline 2265002081 85 87% 65.34 4.58 0.01 2.03 0.07 0.07 6,428 34.04 2.39 0.01 1.06 0.04 0.04
375 Air compressor Gasoline 2265006020 110 87% 21.34 1.89 0.01 0.64 0.07 0.07 6,428 14.39 1.27 0.01 0.43 0.05 0.05
Ditching
336 Track Hoe Diesel 2270002036 266 82% 0.44 1.34 2.9E-03 0.15 0.08 0.08 7,432 0.78 2.40 0.01 0.27 0.14 0.14
345 Track Hoe Diesel 2270002036 345 82% 0.77 1.90 3.1E-03 0.15 0.12 0.12 7,432 1.78 4.40 0.01 0.35 0.27 0.27
D7 LGP Dozers Diesel 2270002069 235 82% 0.52 1.55 2.9E-03 0.16 0.10 0.10 2,477 0.28 0.82 1.5E-03 0.09 0.05 0.05
D8 LGP Dozers Diesel 2270002069 310 82% 0.89 2.22 3.1E-03 0.16 0.13 0.13 2,477 0.62 1.54 2.2E-03 0.11 0.09 0.09
Lower In and Tie-ins
336 Track Hoe Diesel 2270002036 266 64% 0.44 1.34 2.9E-03 0.15 0.08 0.08 5,223 0.43 1.32 2.8E-03 0.15 0.08 0.08
345 Track Hoe Diesel 2270002036 345 64% 0.77 1.90 3.1E-03 0.15 0.12 0.12 5,223 0.98 2.41 3.9E-03 0.19 0.15 0.15
583 Sideboom Diesel 2270002045 300 64% 0.74 2.89 3.2E-03 0.18 0.11 0.11 15,668 2.46 9.58 0.01 0.61 0.37 0.37
594 Sideboom Diesel 2270002045 310 64% 0.74 2.89 3.2E-03 0.18 0.11 0.11 15,668 2.54 9.90 0.01 0.63 0.38 0.38
Morooka Buggies Diesel 2270002069 300 55% 0.89 2.22 3.1E-03 0.16 0.13 0.13 10,446 1.69 4.22 0.01 0.31 0.24 0.24
185 Air compressor Gasoline 2265006020 65 55% 21.34 1.89 0.01 0.64 0.07 0.07 5,223 4.39 0.39 2.7E-03 0.13 0.01 0.01
Welding Machines Diesel 2270006025 25 64% 4.09 4.92 4.3E-03 0.93 0.65 0.65 17,409 1.25 1.51 1.3E-03 0.29 0.20 0.20
Backfill & Clean-up
336 Track Hoe Diesel 2270002036 266 82% 0.44 1.34 2.9E-03 0.15 0.08 0.08 2,411 0.25 0.78 1.7E-03 0.09 0.05 0.05
345 Track Hoe Diesel 2270002036 345 82% 0.77 1.90 3.1E-03 0.15 0.12 0.12 2,411 0.58 1.43 2.3E-03 0.12 0.09 0.09
D7 LGP Dozers Diesel 2270002069 235 82% 0.52 1.55 2.9E-03 0.16 0.10 0.10 4,821 0.54 1.59 3.0E-03 0.17 0.10 0.10
D8 LGP Dozers Diesel 2270002069 310 82% 0.89 2.22 3.1E-03 0.16 0.13 0.13 4,821 1.20 3.00 4.2E-03 0.22 0.17 0.17
Farm Tractor Diesel 2270005010 90 82% 4.66 4.34 4.0E-03 0.57 0.38 0.38 4,821 1.83 1.70 1.6E-03 0.22 0.15 0.15
Florida Southeast Connection 9.A-2 March 2014
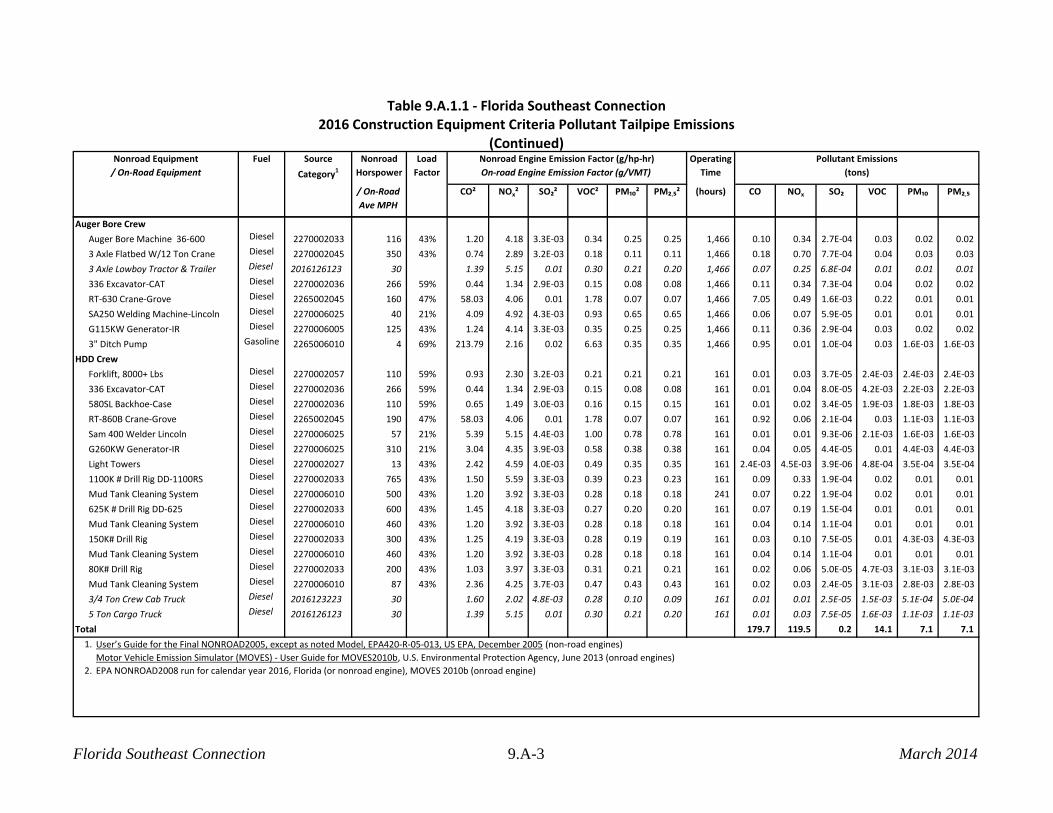
Table 9.A.1.1 - Florida Southeast Connection Table 9.A.1.2 - Florida Southeast Connection2016 Construction Equipment Criteria Pollutant Tailpipe Emissions 2016 Construction Equipment Greenhouse Gas Tailpipe Emissions
(Continued) (Continued)Fuel Source
Category1
Nonroad
Horspower
Load
Factor
Operating
Time
/ On-Road
Ave MPH
CO² NOx² SO₂² VOC² PM₁₀² PM₂.₅² (hours) CO NOx SO₂ VOC PM₁₀ PM₂.₅
Nonroad Equipment
/ On-Road Equipment
Nonroad Engine Emission Factor (g/hp-hr)
On-road Engine Emission Factor (g/VMT)
Pollutant Emissions
(tons)
Auger Bore Crew
Auger Bore Machine 36-600 Diesel 2270002033 116 43% 1.20 4.18 3.3E-03 0.34 0.25 0.25 1,466 0.10 0.34 2.7E-04 0.03 0.02 0.02
3 Axle Flatbed W/12 Ton Crane Diesel 2270002045 350 43% 0.74 2.89 3.2E-03 0.18 0.11 0.11 1,466 0.18 0.70 7.7E-04 0.04 0.03 0.03
3 Axle Lowboy Tractor & Trailer Diesel 2016126123 30 100% 1.39 5.15 0.01 0.30 0.21 0.20 1,466 0.07 0.25 6.8E-04 0.01 0.01 0.01
336 Excavator-CAT Diesel 2270002036 266 59% 0.44 1.34 2.9E-03 0.15 0.08 0.08 1,466 0.11 0.34 7.3E-04 0.04 0.02 0.02
RT-630 Crane-Grove Diesel 2265002045 160 47% 58.03 4.06 0.01 1.78 0.07 0.07 1,466 7.05 0.49 1.6E-03 0.22 0.01 0.01
SA250 Welding Machine-Lincoln Diesel 2270006025 40 21% 4.09 4.92 4.3E-03 0.93 0.65 0.65 1,466 0.06 0.07 5.9E-05 0.01 0.01 0.01
G115KW Generator-IR Diesel 2270006005 125 43% 1.24 4.14 3.3E-03 0.35 0.25 0.25 1,466 0.11 0.36 2.9E-04 0.03 0.02 0.02
3" Ditch Pump Gasoline 2265006010 4 69% 213.79 2.16 0.02 6.63 0.35 0.35 1,466 0.95 0.01 1.0E-04 0.03 1.6E-03 1.6E-03
HDD Crew
Forklift, 8000+ Lbs Diesel 2270002057 110 59% 0.93 2.30 3.2E-03 0.21 0.21 0.21 161 0.01 0.03 3.7E-05 2.4E-03 2.4E-03 2.4E-03
336 Excavator-CAT Diesel 2270002036 266 59% 0.44 1.34 2.9E-03 0.15 0.08 0.08 161 0.01 0.04 8.0E-05 4.2E-03 2.2E-03 2.2E-03
580SL Backhoe-Case Diesel 2270002036 110 59% 0.65 1.49 3.0E-03 0.16 0.15 0.15 161 0.01 0.02 3.4E-05 1.9E-03 1.8E-03 1.8E-03
RT-860B Crane-Grove Diesel 2265002045 190 47% 58.03 4.06 0.01 1.78 0.07 0.07 161 0.92 0.06 2.1E-04 0.03 1.1E-03 1.1E-03
Sam 400 Welder Lincoln Diesel 2270006025 57 21% 5.39 5.15 4.4E-03 1.00 0.78 0.78 161 0.01 0.01 9.3E-06 2.1E-03 1.6E-03 1.6E-03
G260KW Generator-IR Diesel 2270006025 310 21% 3.04 4.35 3.9E-03 0.58 0.38 0.38 161 0.04 0.05 4.4E-05 0.01 4.4E-03 4.4E-03
Light Towers Diesel 2270002027 13 43% 2.42 4.59 4.0E-03 0.49 0.35 0.35 161 2.4E-03 4.5E-03 3.9E-06 4.8E-04 3.5E-04 3.5E-04
1100K # Drill Rig DD-1100RS Diesel 2270002033 765 43% 1.50 5.59 3.3E-03 0.39 0.23 0.23 161 0.09 0.33 1.9E-04 0.02 0.01 0.01
Mud Tank Cleaning System Diesel 2270006010 500 43% 1.20 3.92 3.3E-03 0.28 0.18 0.18 241 0.07 0.22 1.9E-04 0.02 0.01 0.01
625K # Drill Rig DD-625 Diesel 2270002033 600 43% 1.45 4.18 3.3E-03 0.27 0.20 0.20 161 0.07 0.19 1.5E-04 0.01 0.01 0.01
Mud Tank Cleaning System Diesel 2270006010 460 43% 1.20 3.92 3.3E-03 0.28 0.18 0.18 161 0.04 0.14 1.1E-04 0.01 0.01 0.01
150K# Drill Rig Diesel 2270002033 300 43% 1.25 4.19 3.3E-03 0.28 0.19 0.19 161 0.03 0.10 7.5E-05 0.01 4.3E-03 4.3E-03
Mud Tank Cleaning System Diesel 2270006010 460 43% 1.20 3.92 3.3E-03 0.28 0.18 0.18 161 0.04 0.14 1.1E-04 0.01 0.01 0.01
80K# Drill Rig Diesel 2270002033 200 43% 1.03 3.97 3.3E-03 0.31 0.21 0.21 161 0.02 0.06 5.0E-05 4.7E-03 3.1E-03 3.1E-03
Mud Tank Cleaning System Diesel 2270006010 87 43% 2.36 4.25 3.7E-03 0.47 0.43 0.43 161 0.02 0.03 2.4E-05 3.1E-03 2.8E-03 2.8E-03
3/4 Ton Crew Cab Truck Diesel 2016123223 30 100% 1.60 2.02 4.8E-03 0.28 0.10 0.09 161 0.01 0.01 2.5E-05 1.5E-03 5.1E-04 5.0E-04
5 Ton Cargo Truck Diesel 2016126123 30 100% 1.39 5.15 0.01 0.30 0.21 0.20 161 0.01 0.03 7.5E-05 1.6E-03 1.1E-03 1.1E-03
Total 179.7 119.5 0.2 14.1 7.1 7.1
1. User’s Guide for the Final NONROAD2005, except as noted Model, EPA420-R-05-013, US EPA, December 2005 (non-road engines)
Motor Vehicle Emission Simulator (MOVES) - User Guide for MOVES2010b, U.S. Environmental Protection Agency, June 2013 (onroad engines)
2. EPA NONROAD2008 run for calendar year 2016, Florida (or nonroad engine), MOVES 2010b (onroad engine)
Florida Southeast Connection 9.A-3 March 2014
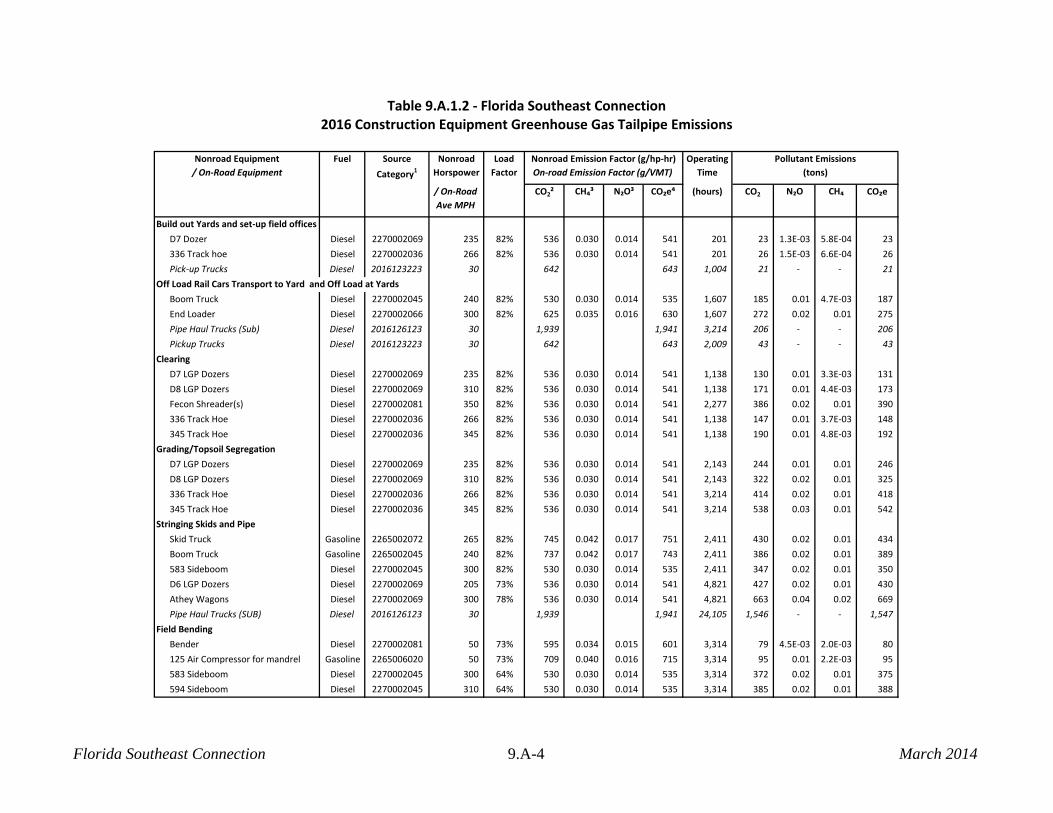
Table 9.A.1.2 - Florida Southeast Connection2016 Construction Equipment Greenhouse Gas Tailpipe Emissions
Fuel Source
Category1
Nonroad
Horspower
Load
Factor
Operating
Time
Pollutant Emissions
(tons)
/ On-Road
Ave MPH
CO2² CH₄³ N₂O³ CO₂e⁴ (hours) CO2 N₂O CH₄ CO₂e
Build out Yards and set-up field offices
D7 Dozer Diesel 2270002069 235 82% 536 0.030 0.014 541 201 23 1.3E-03 5.8E-04 23
336 Track hoe Diesel 2270002036 266 82% 536 0.030 0.014 541 201 26 1.5E-03 6.6E-04 26
Pick-up Trucks Diesel 2016123223 30 100% 642 643 1,004 21 - - 21
Off Load Rail Cars Transport to Yard and Off Load at Yards
Boom Truck Diesel 2270002045 240 82% 530 0.030 0.014 535 1,607 185 0.01 4.7E-03 187
End Loader Diesel 2270002066 300 82% 625 0.035 0.016 630 1,607 272 0.02 0.01 275
Pipe Haul Trucks (Sub) Diesel 2016126123 30 100% 1,939 1,941 3,214 206 - - 206
Pickup Trucks Diesel 2016123223 30 100% 642 643 2,009 43 - - 43
Clearing
D7 LGP Dozers Diesel 2270002069 235 82% 536 0.030 0.014 541 1,138 130 0.01 3.3E-03 131
D8 LGP Dozers Diesel 2270002069 310 82% 536 0.030 0.014 541 1,138 171 0.01 4.4E-03 173
Fecon Shreader(s) Diesel 2270002081 350 82% 536 0.030 0.014 541 2,277 386 0.02 0.01 390
336 Track Hoe Diesel 2270002036 266 82% 536 0.030 0.014 541 1,138 147 0.01 3.7E-03 148
345 Track Hoe Diesel 2270002036 345 82% 536 0.030 0.014 541 1,138 190 0.01 4.8E-03 192
Grading/Topsoil Segregation
D7 LGP Dozers Diesel 2270002069 235 82% 536 0.030 0.014 541 2,143 244 0.01 0.01 246
D8 LGP Dozers Diesel 2270002069 310 82% 536 0.030 0.014 541 2,143 322 0.02 0.01 325
336 Track Hoe Diesel 2270002036 266 82% 536 0.030 0.014 541 3,214 414 0.02 0.01 418
345 Track Hoe Diesel 2270002036 345 82% 536 0.030 0.014 541 3,214 538 0.03 0.01 542
Stringing Skids and Pipe
Skid Truck Gasoline 2265002072 265 82% 745 0.042 0.017 751 2,411 430 0.02 0.01 434
Boom Truck Gasoline 2265002045 240 82% 737 0.042 0.017 743 2,411 386 0.02 0.01 389
583 Sideboom Diesel 2270002045 300 82% 530 0.030 0.014 535 2,411 347 0.02 0.01 350
D6 LGP Dozers Diesel 2270002069 205 73% 536 0.030 0.014 541 4,821 427 0.02 0.01 430
Athey Wagons Diesel 2270002069 300 78% 536 0.030 0.014 541 4,821 663 0.04 0.02 669
Pipe Haul Trucks (SUB) Diesel 2016126123 30 100% 1,939 1,941 24,105 1,546 - - 1,547
Field Bending
Bender Diesel 2270002081 50 73% 595 0.034 0.015 601 3,314 79 4.5E-03 2.0E-03 80
125 Air Compressor for mandrel Gasoline 2265006020 50 73% 709 0.040 0.016 715 3,314 95 0.01 2.2E-03 95
583 Sideboom Diesel 2270002045 300 64% 530 0.030 0.014 535 3,314 372 0.02 0.01 375
594 Sideboom Diesel 2270002045 310 64% 530 0.030 0.014 535 3,314 385 0.02 0.01 388
Nonroad Equipment
/ On-Road Equipment
Nonroad Emission Factor (g/hp-hr)
On-road Emission Factor (g/VMT)
Florida Southeast Connection 9.A-4 March 2014
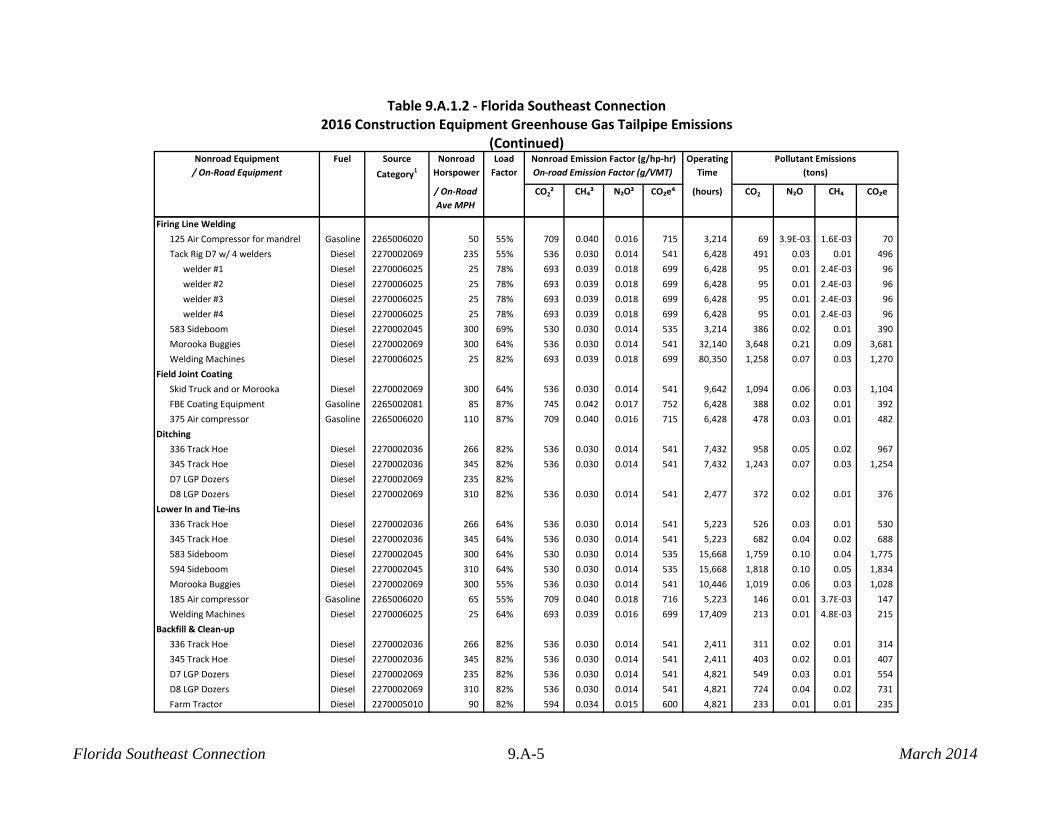
Table 9.A.1.2 - Florida Southeast Connection2016 Construction Equipment Greenhouse Gas Tailpipe Emissions
(Continued)Fuel Source
Category1
Nonroad
Horspower
Load
Factor
Operating
Time
Pollutant Emissions
(tons)
/ On-Road
Ave MPH
CO2² CH₄³ N₂O³ CO₂e⁴ (hours) CO2 N₂O CH₄ CO₂e
Nonroad Equipment
/ On-Road Equipment
Nonroad Emission Factor (g/hp-hr)
On-road Emission Factor (g/VMT)
Firing Line Welding
125 Air Compressor for mandrel Gasoline 2265006020 50 55% 709 0.040 0.016 715 3,214 69 3.9E-03 1.6E-03 70
Tack Rig D7 w/ 4 welders Diesel 2270002069 235 55% 536 0.030 0.014 541 6,428 491 0.03 0.01 496
welder #1 Diesel 2270006025 25 78% 693 0.039 0.018 699 6,428 95 0.01 2.4E-03 96
welder #2 Diesel 2270006025 25 78% 693 0.039 0.018 699 6,428 95 0.01 2.4E-03 96
welder #3 Diesel 2270006025 25 78% 693 0.039 0.018 699 6,428 95 0.01 2.4E-03 96
welder #4 Diesel 2270006025 25 78% 693 0.039 0.018 699 6,428 95 0.01 2.4E-03 96
583 Sideboom Diesel 2270002045 300 69% 530 0.030 0.014 535 3,214 386 0.02 0.01 390
Morooka Buggies Diesel 2270002069 300 64% 536 0.030 0.014 541 32,140 3,648 0.21 0.09 3,681
Welding Machines Diesel 2270006025 25 82% 693 0.039 0.018 699 80,350 1,258 0.07 0.03 1,270
Field Joint Coating
Skid Truck and or Morooka Diesel 2270002069 300 64% 536 0.030 0.014 541 9,642 1,094 0.06 0.03 1,104
FBE Coating Equipment Gasoline 2265002081 85 87% 745 0.042 0.017 752 6,428 388 0.02 0.01 392
375 Air compressor Gasoline 2265006020 110 87% 709 0.040 0.016 715 6,428 478 0.03 0.01 482
Ditching
336 Track Hoe Diesel 2270002036 266 82% 536 0.030 0.014 541 7,432 958 0.05 0.02 967
345 Track Hoe Diesel 2270002036 345 82% 536 0.030 0.014 541 7,432 1,243 0.07 0.03 1,254
D7 LGP Dozers Diesel 2270002069 235 82%
D8 LGP Dozers Diesel 2270002069 310 82% 536 0.030 0.014 541 2,477 372 0.02 0.01 376
Lower In and Tie-ins
336 Track Hoe Diesel 2270002036 266 64% 536 0.030 0.014 541 5,223 526 0.03 0.01 530
345 Track Hoe Diesel 2270002036 345 64% 536 0.030 0.014 541 5,223 682 0.04 0.02 688
583 Sideboom Diesel 2270002045 300 64% 530 0.030 0.014 535 15,668 1,759 0.10 0.04 1,775
594 Sideboom Diesel 2270002045 310 64% 530 0.030 0.014 535 15,668 1,818 0.10 0.05 1,834
Morooka Buggies Diesel 2270002069 300 55% 536 0.030 0.014 541 10,446 1,019 0.06 0.03 1,028
185 Air compressor Gasoline 2265006020 65 55% 709 0.040 0.018 716 5,223 146 0.01 3.7E-03 147
Welding Machines Diesel 2270006025 25 64% 693 0.039 0.016 699 17,409 213 0.01 4.8E-03 215
Backfill & Clean-up
336 Track Hoe Diesel 2270002036 266 82% 536 0.030 0.014 541 2,411 311 0.02 0.01 314
345 Track Hoe Diesel 2270002036 345 82% 536 0.030 0.014 541 2,411 403 0.02 0.01 407
D7 LGP Dozers Diesel 2270002069 235 82% 536 0.030 0.014 541 4,821 549 0.03 0.01 554
D8 LGP Dozers Diesel 2270002069 310 82% 536 0.030 0.014 541 4,821 724 0.04 0.02 731
Farm Tractor Diesel 2270005010 90 82% 594 0.034 0.015 600 4,821 233 0.01 0.01 235
Florida Southeast Connection 9.A-5 March 2014
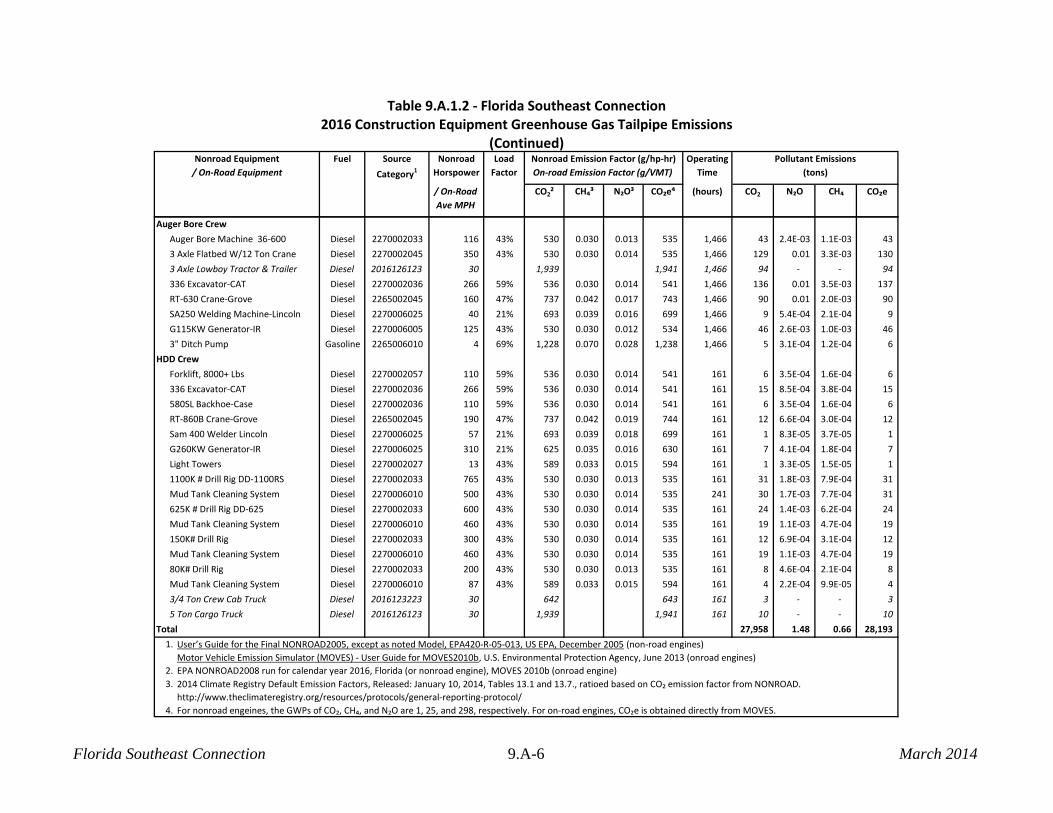
Table 9.A.1.2 - Florida Southeast Connection2016 Construction Equipment Greenhouse Gas Tailpipe Emissions
(Continued)Fuel Source
Category1
Nonroad
Horspower
Load
Factor
Operating
Time
Pollutant Emissions
(tons)
/ On-Road
Ave MPH
CO2² CH₄³ N₂O³ CO₂e⁴ (hours) CO2 N₂O CH₄ CO₂e
Nonroad Equipment
/ On-Road Equipment
Nonroad Emission Factor (g/hp-hr)
On-road Emission Factor (g/VMT)
Auger Bore Crew
Auger Bore Machine 36-600 Diesel 2270002033 116 43% 530 0.030 0.013 535 1,466 43 2.4E-03 1.1E-03 43
3 Axle Flatbed W/12 Ton Crane Diesel 2270002045 350 43% 530 0.030 0.014 535 1,466 129 0.01 3.3E-03 130
3 Axle Lowboy Tractor & Trailer Diesel 2016126123 30 100% 1,939 1,941 1,466 94 - - 94
336 Excavator-CAT Diesel 2270002036 266 59% 536 0.030 0.014 541 1,466 136 0.01 3.5E-03 137
RT-630 Crane-Grove Diesel 2265002045 160 47% 737 0.042 0.017 743 1,466 90 0.01 2.0E-03 90
SA250 Welding Machine-Lincoln Diesel 2270006025 40 21% 693 0.039 0.016 699 1,466 9 5.4E-04 2.1E-04 9
G115KW Generator-IR Diesel 2270006005 125 43% 530 0.030 0.012 534 1,466 46 2.6E-03 1.0E-03 46
3" Ditch Pump Gasoline 2265006010 4 69% 1,228 0.070 0.028 1,238 1,466 5 3.1E-04 1.2E-04 6
HDD Crew
Forklift, 8000+ Lbs Diesel 2270002057 110 59% 536 0.030 0.014 541 161 6 3.5E-04 1.6E-04 6
336 Excavator-CAT Diesel 2270002036 266 59% 536 0.030 0.014 541 161 15 8.5E-04 3.8E-04 15
580SL Backhoe-Case Diesel 2270002036 110 59% 536 0.030 0.014 541 161 6 3.5E-04 1.6E-04 6
RT-860B Crane-Grove Diesel 2265002045 190 47% 737 0.042 0.019 744 161 12 6.6E-04 3.0E-04 12
Sam 400 Welder Lincoln Diesel 2270006025 57 21% 693 0.039 0.018 699 161 1 8.3E-05 3.7E-05 1
G260KW Generator-IR Diesel 2270006025 310 21% 625 0.035 0.016 630 161 7 4.1E-04 1.8E-04 7
Light Towers Diesel 2270002027 13 43% 589 0.033 0.015 594 161 1 3.3E-05 1.5E-05 1
1100K # Drill Rig DD-1100RS Diesel 2270002033 765 43% 530 0.030 0.013 535 161 31 1.8E-03 7.9E-04 31
Mud Tank Cleaning System Diesel 2270006010 500 43% 530 0.030 0.014 535 241 30 1.7E-03 7.7E-04 31
625K # Drill Rig DD-625 Diesel 2270002033 600 43% 530 0.030 0.014 535 161 24 1.4E-03 6.2E-04 24
Mud Tank Cleaning System Diesel 2270006010 460 43% 530 0.030 0.014 535 161 19 1.1E-03 4.7E-04 19
150K# Drill Rig Diesel 2270002033 300 43% 530 0.030 0.014 535 161 12 6.9E-04 3.1E-04 12
Mud Tank Cleaning System Diesel 2270006010 460 43% 530 0.030 0.014 535 161 19 1.1E-03 4.7E-04 19
80K# Drill Rig Diesel 2270002033 200 43% 530 0.030 0.013 535 161 8 4.6E-04 2.1E-04 8
Mud Tank Cleaning System Diesel 2270006010 87 43% 589 0.033 0.015 594 161 4 2.2E-04 9.9E-05 4
3/4 Ton Crew Cab Truck Diesel 2016123223 30 100% 642 643 161 3 - - 3
5 Ton Cargo Truck Diesel 2016126123 30 100% 1,939 1,941 161 10 - - 10
Total 27,958 1.48 0.66 28,193
1. User’s Guide for the Final NONROAD2005, except as noted Model, EPA420-R-05-013, US EPA, December 2005 (non-road engines)
Motor Vehicle Emission Simulator (MOVES) - User Guide for MOVES2010b, U.S. Environmental Protection Agency, June 2013 (onroad engines)
2. EPA NONROAD2008 run for calendar year 2016, Florida (or nonroad engine), MOVES 2010b (onroad engine)
3. 2014 Climate Registry Default Emission Factors, Released: January 10, 2014, Tables 13.1 and 13.7., ratioed based on CO₂ emission factor from NONROAD.
http://www.theclimateregistry.org/resources/protocols/general-reporting-protocol/
4. For nonroad engeines, the GWPs of CO₂, CH₄, and N₂O are 1, 25, and 298, respectively. For on-road engines, CO₂e is obtained directly from MOVES.
Florida Southeast Connection 9.A-6 March 2014

Table 9.A.1.3 - Florida Southeast Connection Table 2017 Construction Equipment Criteria Pollutant Tailpipe Emissions 2017
(ContFuel Source
Category1
Nonroad
Horspower
Load
Factor
Operating
Time
/ On-Road
Ave MPH
CO² NOx² SO₂² VOC² PM₁₀² PM₂.₅² (hours) CO NOx SO₂ VOC PM₁₀ PM₂.₅
Build out Yards and set-up field offices
D7 Dozer Diesel 2270002069 235 82% 0.42 1.28 2.9E-03 0.15 0.08 0.08 99 0.01 0.03 6.0E-05 3.2E-03 1.6E-03 1.6E-03
336 Track hoe Diesel 2270002036 266 82% 0.32 1.07 2.8E-03 0.15 0.05 0.05 99 0.01 0.03 6.6E-05 3.5E-03 1.3E-03 1.3E-03
Pick-up Trucks Diesel 2017123223 30 100% 1.49 1.85 4.7E-03 0.25 0.08 0.08 496 0.02 0.03 7.7E-05 4.0E-03 1.4E-03 1.4E-03
Off Load Rail Cars Transport to Yard and Off Load at Yards
Boom Truck Diesel 2270002045 240 82% 0.37 1.67 3.0E-03 0.17 0.07 0.07 793 0.06 0.29 5.1E-04 0.03 0.01 0.01
End Loader Diesel 2270002066 300 82% 1.77 3.45 3.7E-03 0.50 0.33 0.33 793 0.38 0.74 8.1E-04 0.11 0.07 0.07
Pipe Haul Trucks (Sub) Diesel 2017126123 30 100% 1.21 4.48 0.01 0.26 0.18 0.17 1,586 0.06 0.23 7.3E-04 0.01 0.01 0.01
Pickup Trucks Diesel 2017123223 30 100% 1.49 1.85 4.7E-03 0.25 0.08 0.08 991 0.05 0.06 1.5E-04 0.01 2.8E-03 2.7E-03
Clearing
D7 LGP Dozers Diesel 2270002069 235 82% 0.42 1.28 2.9E-03 0.15 0.08 0.08 562 0.05 0.15 3.4E-04 0.02 0.01 0.01
D8 LGP Dozers Diesel 2270002069 310 82% 0.78 1.93 3.1E-03 0.16 0.11 0.11 562 0.12 0.30 4.8E-04 0.02 0.02 0.02
Fecon Shreader(s) Diesel 2270002081 350 82% 1.29 3.00 3.2E-03 0.20 0.18 0.18 1,123
336 Track Hoe Diesel 2270002036 266 82% 0.32 1.07 2.8E-03 0.15 0.05 0.05 562 0.04 0.14 3.7E-04 0.02 0.01 0.01
345 Track Hoe Diesel 2270002036 345 82% 0.66 1.63 3.0E-03 0.15 0.10 0.10 562 0.12 0.29 5.2E-04 0.03 0.02 0.02
Grading/Topsoil Segregation
D7 LGP Dozers Diesel 2270002069 235 82% 0.42 1.28 2.9E-03 0.15 0.08 0.08 1,057 0.09 0.29 6.4E-04 0.03 0.02 0.02
D8 LGP Dozers Diesel 2270002069 310 82% 0.78 1.93 3.1E-03 0.16 0.11 0.11 1,057 0.23 0.57 9.0E-04 0.05 0.03 0.03
336 Track Hoe Diesel 2270002036 266 82% 0.32 1.07 2.8E-03 0.15 0.05 0.05 1,586 0.12 0.41 1.1E-03 0.06 0.02 0.02
345 Track Hoe Diesel 2270002036 345 82% 0.66 1.63 3.0E-03 0.15 0.10 0.10 1,586 0.33 0.81 1.5E-03 0.07 0.05 0.05
Stringing Skids and Pipe
Skid Truck Gasoline 2265002072 265 82% 57.59 4.04 0.01 1.77 0.07 0.07 1,189 16.41 1.15 3.8E-03 0.50 0.02 0.02
Boom Truck Gasoline 2265002045 240 82% 50.38 3.53 0.01 1.53 0.07 0.07 1,189 13.00 0.91 3.4E-03 0.40 0.02 0.02
583 Sideboom Diesel 2270002045 300 82% 0.67 2.58 3.1E-03 0.18 0.10 0.10 1,189 0.22 0.83 1.0E-03 0.06 0.03 0.03
D6 LGP Dozers Diesel 2270002069 205 73% 0.42 1.28 2.9E-03 0.15 0.08 0.08 2,379 0.16 0.50 1.1E-03 0.06 0.03 0.03
Athey Wagons Diesel 2270002069 300 78% 0.78 1.93 3.1E-03 0.16 0.11 0.11 2,379 0.48 1.18 1.9E-03 0.10 0.07 0.07
Pipe Haul Trucks (SUB) Diesel 2017126123 30 100% 1.21 4.48 0.01 0.26 0.18 0.17 11,895 0.48 1.76 0.01 0.10 0.07 0.07
Field Bending
Bender Diesel 2270002081 50 73% 2.16 3.59 3.6E-03 0.25 0.25 0.25 1,636 0.14 0.24 2.3E-04 0.02 0.02 0.02
125 Air Compressor for mandrel Gasoline 2265006020 50 73% 18.82 1.67 0.01 0.56 0.07 0.07 1,636 1.24 0.11 8.5E-04 0.04 4.5E-03 4.5E-03
583 Sideboom Diesel 2270002045 300 64% 0.67 2.58 3.1E-03 0.18 0.10 0.10 1,636 0.23 0.89 1.1E-03 0.06 0.03 0.03
594 Sideboom Diesel 2270002045 310 64% 0.67 2.58 3.1E-03 0.18 0.10 0.10 1,636 0.24 0.92 1.1E-03 0.06 0.04 0.04
Nonroad Equipment
/ On-Road Equipment
Nonroad Engine Emission Factor (g/hp-hr)
On-road Engine Emission Factor (g/VMT)
Pollutant Emissions
(tons)
Florida Southeast Connection 9.A-7 March 2014

Table 9.A.1.3 - Florida Southeast Connection Table 2017 Construction Equipment Criteria Pollutant Tailpipe Emissions 2017
(Continued) (ContFuel Source
Category1
Nonroad
Horspower
Load
Factor
Operating
Time
/ On-Road
Ave MPH
CO² NOx² SO₂² VOC² PM₁₀² PM₂.₅² (hours) CO NOx SO₂ VOC PM₁₀ PM₂.₅
Nonroad Equipment
/ On-Road Equipment
Nonroad Engine Emission Factor (g/hp-hr)
On-road Engine Emission Factor (g/VMT)
Pollutant Emissions
(tons)
Firing Line Welding
125 Air Compressor for mandrel Gasoline 2265006020 50 55% 18.82 1.67 0.01 0.56 0.07 0.07 1,586 0.90 0.08 6.2E-04 0.03 3.3E-03 3.3E-03
Tack Rig D7 w/ 4 welders Diesel 2270002069 235 55% 0.42 1.28 2.9E-03 0.15 0.08 0.08 3,172 0.19 0.58 1.3E-03 0.07 0.03 0.03
welder #1 Diesel 2270006025 25 78% 3.59 4.72 4.3E-03 0.80 0.57 0.57 3,172 0.24 0.32 2.9E-04 0.05 0.04 0.04
welder #2 Diesel 2270006025 25 78% 3.59 4.72 4.3E-03 0.80 0.57 0.57 3,172 0.24 0.32 2.9E-04 0.05 0.04 0.04
welder #3 Diesel 2270006025 25 78% 3.59 4.72 4.3E-03 0.80 0.57 0.57 3,172 0.24 0.32 2.9E-04 0.05 0.04 0.04
welder #4 Diesel 2270006025 25 78% 3.59 4.72 4.3E-03 0.80 0.57 0.57 3,172 0.24 0.32 2.9E-04 0.05 0.04 0.04
583 Sideboom Diesel 2270002045 300 69% 0.67 2.58 3.1E-03 0.18 0.10 0.10 1,586 0.24 0.93 1.1E-03 0.06 0.04 0.04
Morooka Buggies Diesel 2270002069 300 64% 0.78 1.93 3.1E-03 0.16 0.11 0.11 15,860 2.63 6.49 0.01 0.52 0.39 0.39
Welding Machines Diesel 2270006025 25 82% 3.59 4.72 4.3E-03 0.80 0.57 0.57 39,650 3.22 4.23 3.8E-03 0.72 0.51 0.51
Field Joint Coating
Skid Truck and or Morooka Diesel 2270002069 300 64% 0.78 1.93 3.1E-03 0.16 0.11 0.11 4,758 0.79 1.95 3.1E-03 0.16 0.12 0.12
FBE Coating Equipment Gasoline 2265002081 85 87% 58.29 4.09 0.01 1.79 0.07 0.07 3,172 14.98 1.05 3.5E-03 0.46 0.02 0.02
375 Air compressor Gasoline 2265006020 110 87% 18.82 1.67 0.01 0.56 0.07 0.07 3,172 6.26 0.55 4.3E-03 0.19 0.02 0.02
Ditching
336 Track Hoe Diesel 2270002036 266 82% 0.32 1.07 2.8E-03 0.15 0.05 0.05 3,668 0.29 0.94 2.4E-03 0.13 0.05 0.05
345 Track Hoe Diesel 2270002036 345 82% 0.66 1.63 3.0E-03 0.15 0.10 0.10 3,668 0.76 1.87 3.4E-03 0.17 0.12 0.12
D7 LGP Dozers Diesel 2270002069 235 82% 0.42 1.28 2.9E-03 0.15 0.08 0.08 1,223 0.11 0.33 7.4E-04 0.04 0.02 0.02
D8 LGP Dozers Diesel 2270002069 310 82% 0.78 1.93 3.1E-03 0.16 0.11 0.11 1,223 0.27 0.66 1.0E-03 0.05 0.04 0.04
Lower In and Tie-ins
336 Track Hoe Diesel 2270002036 266 64% 0.32 1.07 2.8E-03 0.15 0.05 0.05 2,577 0.16 0.52 1.3E-03 0.07 0.03 0.03
345 Track Hoe Diesel 2270002036 345 64% 0.66 1.63 3.0E-03 0.15 0.10 0.10 2,577 0.41 1.02 1.9E-03 0.09 0.06 0.06
583 Sideboom Diesel 2270002045 300 64% 0.67 2.58 3.1E-03 0.18 0.10 0.10 7,732 1.09 4.23 0.01 0.29 0.16 0.16
594 Sideboom Diesel 2270002045 310 64% 0.67 2.58 3.1E-03 0.18 0.10 0.10 7,732 1.13 4.37 0.01 0.30 0.17 0.17
Morooka Buggies Diesel 2270002069 300 55% 0.78 1.93 3.1E-03 0.16 0.11 0.11 5,154 0.73 1.81 2.9E-03 0.15 0.11 0.11
185 Air compressor Gasoline 2265006020 65 55% 18.82 1.67 0.01 0.56 0.07 0.07 2,577 1.91 0.17 1.3E-03 0.06 0.01 0.01
Welding Machines Diesel 2270006025 25 64% 3.59 4.72 4.3E-03 0.80 0.57 0.57 8,591 0.54 0.72 6.5E-04 0.12 0.09 0.09
Backfill & Clean-up
336 Track Hoe Diesel 2270002036 266 82% 0.32 1.07 2.8E-03 0.15 0.05 0.05 1,189 0.09 0.31 7.9E-04 0.04 0.02 0.02
345 Track Hoe Diesel 2270002036 345 82% 0.66 1.63 3.0E-03 0.15 0.10 0.10 1,189 0.25 0.61 1.1E-03 0.06 0.04 0.04
D7 LGP Dozers Diesel 2270002069 235 82% 0.42 1.28 2.9E-03 0.15 0.08 0.08 2,379 0.21 0.65 1.4E-03 0.08 0.04 0.04
D8 LGP Dozers Diesel 2270002069 310 82% 0.78 1.93 3.1E-03 0.16 0.11 0.11 2,379 0.52 1.29 2.0E-03 0.10 0.08 0.08
Farm Tractor Diesel 2270005010 90 82% 4.60 4.33 4.0E-03 0.57 0.37 0.37 2,379 0.89 0.84 7.8E-04 0.11 0.07 0.07
Florida Southeast Connection 9.A-8 March 2014
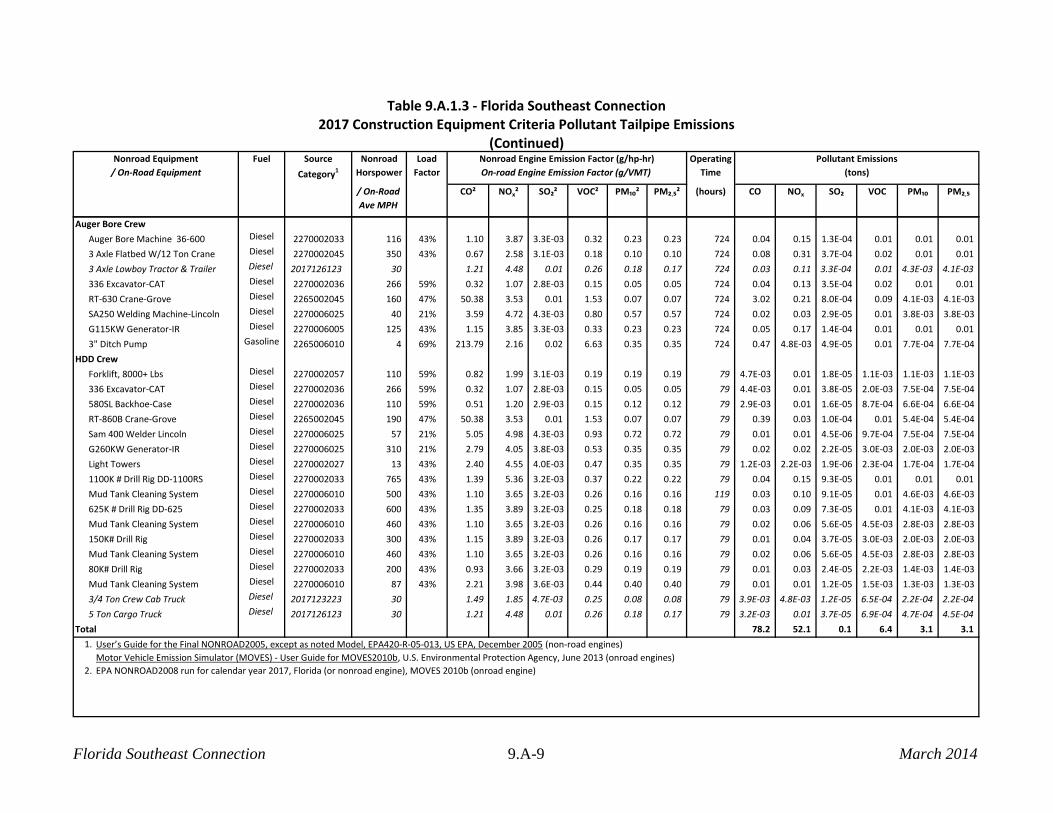
Table 9.A.1.3 - Florida Southeast Connection Table 2017 Construction Equipment Criteria Pollutant Tailpipe Emissions 2017
(Continued) (ContFuel Source
Category1
Nonroad
Horspower
Load
Factor
Operating
Time
/ On-Road
Ave MPH
CO² NOx² SO₂² VOC² PM₁₀² PM₂.₅² (hours) CO NOx SO₂ VOC PM₁₀ PM₂.₅
Nonroad Equipment
/ On-Road Equipment
Nonroad Engine Emission Factor (g/hp-hr)
On-road Engine Emission Factor (g/VMT)
Pollutant Emissions
(tons)
Auger Bore Crew
Auger Bore Machine 36-600 Diesel 2270002033 116 43% 1.10 3.87 3.3E-03 0.32 0.23 0.23 724 0.04 0.15 1.3E-04 0.01 0.01 0.01
3 Axle Flatbed W/12 Ton Crane Diesel 2270002045 350 43% 0.67 2.58 3.1E-03 0.18 0.10 0.10 724 0.08 0.31 3.7E-04 0.02 0.01 0.01
3 Axle Lowboy Tractor & Trailer Diesel 2017126123 30 100% 1.21 4.48 0.01 0.26 0.18 0.17 724 0.03 0.11 3.3E-04 0.01 4.3E-03 4.1E-03
336 Excavator-CAT Diesel 2270002036 266 59% 0.32 1.07 2.8E-03 0.15 0.05 0.05 724 0.04 0.13 3.5E-04 0.02 0.01 0.01
RT-630 Crane-Grove Diesel 2265002045 160 47% 50.38 3.53 0.01 1.53 0.07 0.07 724 3.02 0.21 8.0E-04 0.09 4.1E-03 4.1E-03
SA250 Welding Machine-Lincoln Diesel 2270006025 40 21% 3.59 4.72 4.3E-03 0.80 0.57 0.57 724 0.02 0.03 2.9E-05 0.01 3.8E-03 3.8E-03
G115KW Generator-IR Diesel 2270006005 125 43% 1.15 3.85 3.3E-03 0.33 0.23 0.23 724 0.05 0.17 1.4E-04 0.01 0.01 0.01
3" Ditch Pump Gasoline 2265006010 4 69% 213.79 2.16 0.02 6.63 0.35 0.35 724 0.47 4.8E-03 4.9E-05 0.01 7.7E-04 7.7E-04
HDD Crew
Forklift, 8000+ Lbs Diesel 2270002057 110 59% 0.82 1.99 3.1E-03 0.19 0.19 0.19 79 4.7E-03 0.01 1.8E-05 1.1E-03 1.1E-03 1.1E-03
336 Excavator-CAT Diesel 2270002036 266 59% 0.32 1.07 2.8E-03 0.15 0.05 0.05 79 4.4E-03 0.01 3.8E-05 2.0E-03 7.5E-04 7.5E-04
580SL Backhoe-Case Diesel 2270002036 110 59% 0.51 1.20 2.9E-03 0.15 0.12 0.12 79 2.9E-03 0.01 1.6E-05 8.7E-04 6.6E-04 6.6E-04
RT-860B Crane-Grove Diesel 2265002045 190 47% 50.38 3.53 0.01 1.53 0.07 0.07 79 0.39 0.03 1.0E-04 0.01 5.4E-04 5.4E-04
Sam 400 Welder Lincoln Diesel 2270006025 57 21% 5.05 4.98 4.3E-03 0.93 0.72 0.72 79 0.01 0.01 4.5E-06 9.7E-04 7.5E-04 7.5E-04
G260KW Generator-IR Diesel 2270006025 310 21% 2.79 4.05 3.8E-03 0.53 0.35 0.35 79 0.02 0.02 2.2E-05 3.0E-03 2.0E-03 2.0E-03
Light Towers Diesel 2270002027 13 43% 2.40 4.55 4.0E-03 0.47 0.35 0.35 79 1.2E-03 2.2E-03 1.9E-06 2.3E-04 1.7E-04 1.7E-04
1100K # Drill Rig DD-1100RS Diesel 2270002033 765 43% 1.39 5.36 3.2E-03 0.37 0.22 0.22 79 0.04 0.15 9.3E-05 0.01 0.01 0.01
Mud Tank Cleaning System Diesel 2270006010 500 43% 1.10 3.65 3.2E-03 0.26 0.16 0.16 119 0.03 0.10 9.1E-05 0.01 4.6E-03 4.6E-03
625K # Drill Rig DD-625 Diesel 2270002033 600 43% 1.35 3.89 3.2E-03 0.25 0.18 0.18 79 0.03 0.09 7.3E-05 0.01 4.1E-03 4.1E-03
Mud Tank Cleaning System Diesel 2270006010 460 43% 1.10 3.65 3.2E-03 0.26 0.16 0.16 79 0.02 0.06 5.6E-05 4.5E-03 2.8E-03 2.8E-03
150K# Drill Rig Diesel 2270002033 300 43% 1.15 3.89 3.2E-03 0.26 0.17 0.17 79 0.01 0.04 3.7E-05 3.0E-03 2.0E-03 2.0E-03
Mud Tank Cleaning System Diesel 2270006010 460 43% 1.10 3.65 3.2E-03 0.26 0.16 0.16 79 0.02 0.06 5.6E-05 4.5E-03 2.8E-03 2.8E-03
80K# Drill Rig Diesel 2270002033 200 43% 0.93 3.66 3.2E-03 0.29 0.19 0.19 79 0.01 0.03 2.4E-05 2.2E-03 1.4E-03 1.4E-03
Mud Tank Cleaning System Diesel 2270006010 87 43% 2.21 3.98 3.6E-03 0.44 0.40 0.40 79 0.01 0.01 1.2E-05 1.5E-03 1.3E-03 1.3E-03
3/4 Ton Crew Cab Truck Diesel 2017123223 30 100% 1.49 1.85 4.7E-03 0.25 0.08 0.08 79 3.9E-03 4.8E-03 1.2E-05 6.5E-04 2.2E-04 2.2E-04
5 Ton Cargo Truck Diesel 2017126123 30 100% 1.21 4.48 0.01 0.26 0.18 0.17 79 3.2E-03 0.01 3.7E-05 6.9E-04 4.7E-04 4.5E-04
Total 78.2 52.1 0.1 6.4 3.1 3.1
1. User’s Guide for the Final NONROAD2005, except as noted Model, EPA420-R-05-013, US EPA, December 2005 (non-road engines)
Motor Vehicle Emission Simulator (MOVES) - User Guide for MOVES2010b, U.S. Environmental Protection Agency, June 2013 (onroad engines)
2. EPA NONROAD2008 run for calendar year 2017, Florida (or nonroad engine), MOVES 2010b (onroad engine)
Florida Southeast Connection 9.A-9 March 2014
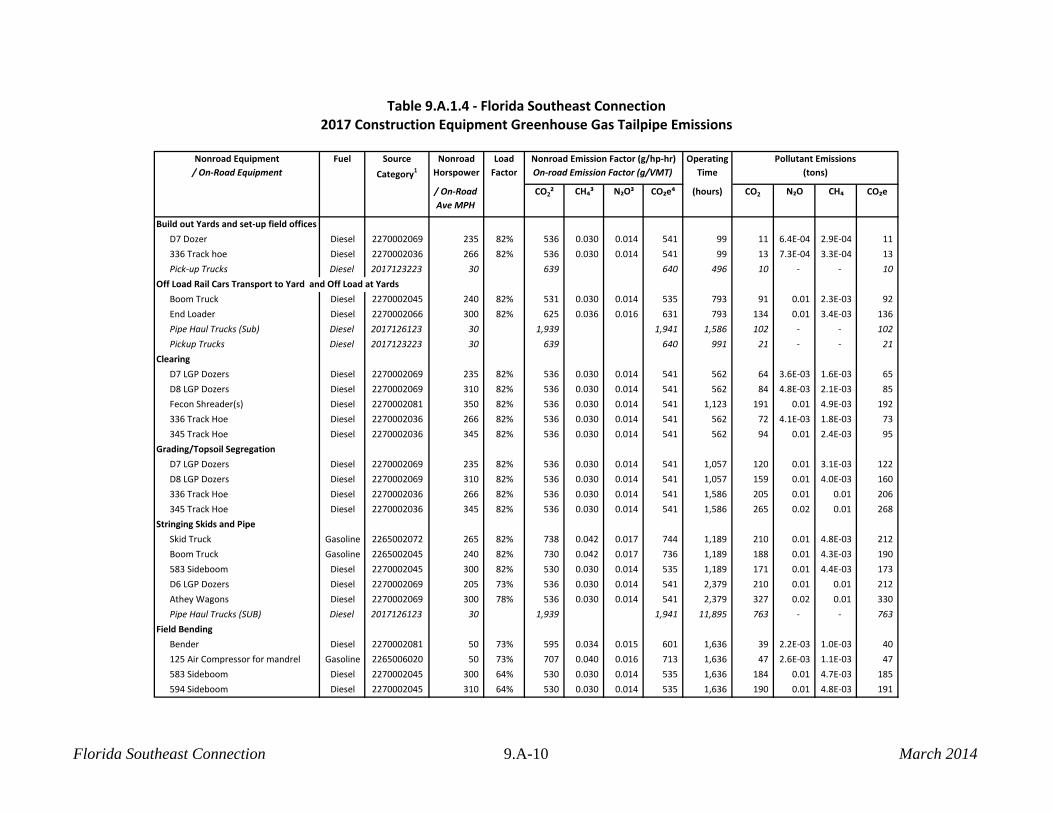
Table 9.A.1.4 - Florida Southeast Connection2017 Construction Equipment Greenhouse Gas Tailpipe Emissions
Fuel Source
Category1
Nonroad
Horspower
Load
Factor
Operating
Time
Pollutant Emissions
(tons)
/ On-Road
Ave MPH
CO2² CH₄³ N₂O³ CO₂e⁴ (hours) CO2 N₂O CH₄ CO₂e
Build out Yards and set-up field offices
D7 Dozer Diesel 2270002069 235 82% 536 0.030 0.014 541 99 11 6.4E-04 2.9E-04 11
336 Track hoe Diesel 2270002036 266 82% 536 0.030 0.014 541 99 13 7.3E-04 3.3E-04 13
Pick-up Trucks Diesel 2017123223 30 100% 639 640 496 10 - - 10
Off Load Rail Cars Transport to Yard and Off Load at Yards
Boom Truck Diesel 2270002045 240 82% 531 0.030 0.014 535 793 91 0.01 2.3E-03 92
End Loader Diesel 2270002066 300 82% 625 0.036 0.016 631 793 134 0.01 3.4E-03 136
Pipe Haul Trucks (Sub) Diesel 2017126123 30 100% 1,939 1,941 1,586 102 - - 102
Pickup Trucks Diesel 2017123223 30 100% 639 640 991 21 - - 21
Clearing
D7 LGP Dozers Diesel 2270002069 235 82% 536 0.030 0.014 541 562 64 3.6E-03 1.6E-03 65
D8 LGP Dozers Diesel 2270002069 310 82% 536 0.030 0.014 541 562 84 4.8E-03 2.1E-03 85
Fecon Shreader(s) Diesel 2270002081 350 82% 536 0.030 0.014 541 1,123 191 0.01 4.9E-03 192
336 Track Hoe Diesel 2270002036 266 82% 536 0.030 0.014 541 562 72 4.1E-03 1.8E-03 73
345 Track Hoe Diesel 2270002036 345 82% 536 0.030 0.014 541 562 94 0.01 2.4E-03 95
Grading/Topsoil Segregation
D7 LGP Dozers Diesel 2270002069 235 82% 536 0.030 0.014 541 1,057 120 0.01 3.1E-03 122
D8 LGP Dozers Diesel 2270002069 310 82% 536 0.030 0.014 541 1,057 159 0.01 4.0E-03 160
336 Track Hoe Diesel 2270002036 266 82% 536 0.030 0.014 541 1,586 205 0.01 0.01 206
345 Track Hoe Diesel 2270002036 345 82% 536 0.030 0.014 541 1,586 265 0.02 0.01 268
Stringing Skids and Pipe
Skid Truck Gasoline 2265002072 265 82% 738 0.042 0.017 744 1,189 210 0.01 4.8E-03 212
Boom Truck Gasoline 2265002045 240 82% 730 0.042 0.017 736 1,189 188 0.01 4.3E-03 190
583 Sideboom Diesel 2270002045 300 82% 530 0.030 0.014 535 1,189 171 0.01 4.4E-03 173
D6 LGP Dozers Diesel 2270002069 205 73% 536 0.030 0.014 541 2,379 210 0.01 0.01 212
Athey Wagons Diesel 2270002069 300 78% 536 0.030 0.014 541 2,379 327 0.02 0.01 330
Pipe Haul Trucks (SUB) Diesel 2017126123 30 100% 1,939 1,941 11,895 763 - - 763
Field Bending
Bender Diesel 2270002081 50 73% 595 0.034 0.015 601 1,636 39 2.2E-03 1.0E-03 40
125 Air Compressor for mandrel Gasoline 2265006020 50 73% 707 0.040 0.016 713 1,636 47 2.6E-03 1.1E-03 47
583 Sideboom Diesel 2270002045 300 64% 530 0.030 0.014 535 1,636 184 0.01 4.7E-03 185
594 Sideboom Diesel 2270002045 310 64% 530 0.030 0.014 535 1,636 190 0.01 4.8E-03 191
Nonroad Equipment
/ On-Road Equipment
Nonroad Emission Factor (g/hp-hr)
On-road Emission Factor (g/VMT)
Florida Southeast Connection 9.A-10 March 2014

Table 9.A.1.4 - Florida Southeast Connection2017 Construction Equipment Greenhouse Gas Tailpipe Emissions
(Continued)Fuel Source
Category1
Nonroad
Horspower
Load
Factor
Operating
Time
Pollutant Emissions
(tons)
/ On-Road
Ave MPH
CO2² CH₄³ N₂O³ CO₂e⁴ (hours) CO2 N₂O CH₄ CO₂e
Nonroad Equipment
/ On-Road Equipment
Nonroad Emission Factor (g/hp-hr)
On-road Emission Factor (g/VMT)
Firing Line Welding
125 Air Compressor for mandrel Gasoline 2265006020 50 55% 707 0.040 0.016 713 1,586 34 1.9E-03 7.7E-04 34
Tack Rig D7 w/ 4 welders Diesel 2270002069 235 55% 536 0.030 0.014 541 3,172 242 0.01 0.01 245
welder #1 Diesel 2270006025 25 78% 693 0.039 0.018 700 3,172 47 2.7E-03 1.2E-03 47
welder #2 Diesel 2270006025 25 78% 693 0.039 0.018 700 3,172 47 2.7E-03 1.2E-03 47
welder #3 Diesel 2270006025 25 78% 693 0.039 0.018 700 3,172 47 2.7E-03 1.2E-03 47
welder #4 Diesel 2270006025 25 78% 693 0.039 0.018 700 3,172 47 2.7E-03 1.2E-03 47
583 Sideboom Diesel 2270002045 300 69% 530 0.030 0.014 535 1,586 191 0.01 4.9E-03 192
Morooka Buggies Diesel 2270002069 300 64% 536 0.030 0.014 541 15,860 1,800 0.10 0.05 1,817
Welding Machines Diesel 2270006025 25 82% 693 0.039 0.018 700 39,650 621 0.04 0.02 627
Field Joint Coating
Skid Truck and or Morooka Diesel 2270002069 300 64% 536 0.030 0.014 541 4,758 540 0.03 0.01 545
FBE Coating Equipment Gasoline 2265002081 85 87% 738 0.042 0.017 744 3,172 190 0.01 4.3E-03 191
375 Air compressor Gasoline 2265006020 110 87% 707 0.040 0.016 713 3,172 235 0.01 0.01 237
Ditching
336 Track Hoe Diesel 2270002036 266 82% 536 0.030 0.014 541 3,668 473 0.03 0.01 477
345 Track Hoe Diesel 2270002036 345 82% 536 0.030 0.014 541 3,668 613 0.03 0.02 619
D7 LGP Dozers Diesel 2270002069 235 82%
D8 LGP Dozers Diesel 2270002069 310 82% 536 0.030 0.014 541 1,223 184 0.01 4.7E-03 185
Lower In and Tie-ins
336 Track Hoe Diesel 2270002036 266 64% 536 0.030 0.014 541 2,577 259 0.01 0.01 262
345 Track Hoe Diesel 2270002036 345 64% 536 0.030 0.014 541 2,577 336 0.02 0.01 339
583 Sideboom Diesel 2270002045 300 64% 530 0.030 0.014 535 7,732 868 0.05 0.02 876
594 Sideboom Diesel 2270002045 310 64% 530 0.030 0.014 535 7,732 897 0.05 0.02 905
Morooka Buggies Diesel 2270002069 300 55% 536 0.030 0.014 541 5,154 503 0.03 0.01 507
185 Air compressor Gasoline 2265006020 65 55% 707 0.040 0.018 713 2,577 72 4.1E-03 1.8E-03 72
Welding Machines Diesel 2270006025 25 64% 693 0.039 0.016 699 8,591 105 0.01 2.4E-03 106
Backfill & Clean-up
336 Track Hoe Diesel 2270002036 266 82% 536 0.030 0.014 541 1,189 153 0.01 3.9E-03 155
345 Track Hoe Diesel 2270002036 345 82% 536 0.030 0.014 541 1,189 199 0.01 0.01 201
D7 LGP Dozers Diesel 2270002069 235 82% 536 0.030 0.014 541 2,379 271 0.02 0.01 273
D8 LGP Dozers Diesel 2270002069 310 82% 536 0.030 0.014 541 2,379 358 0.02 0.01 361
Farm Tractor Diesel 2270005010 90 82% 594 0.034 0.015 600 2,379 115 0.01 2.9E-03 116
Florida Southeast Connection 9.A-11 March 2014
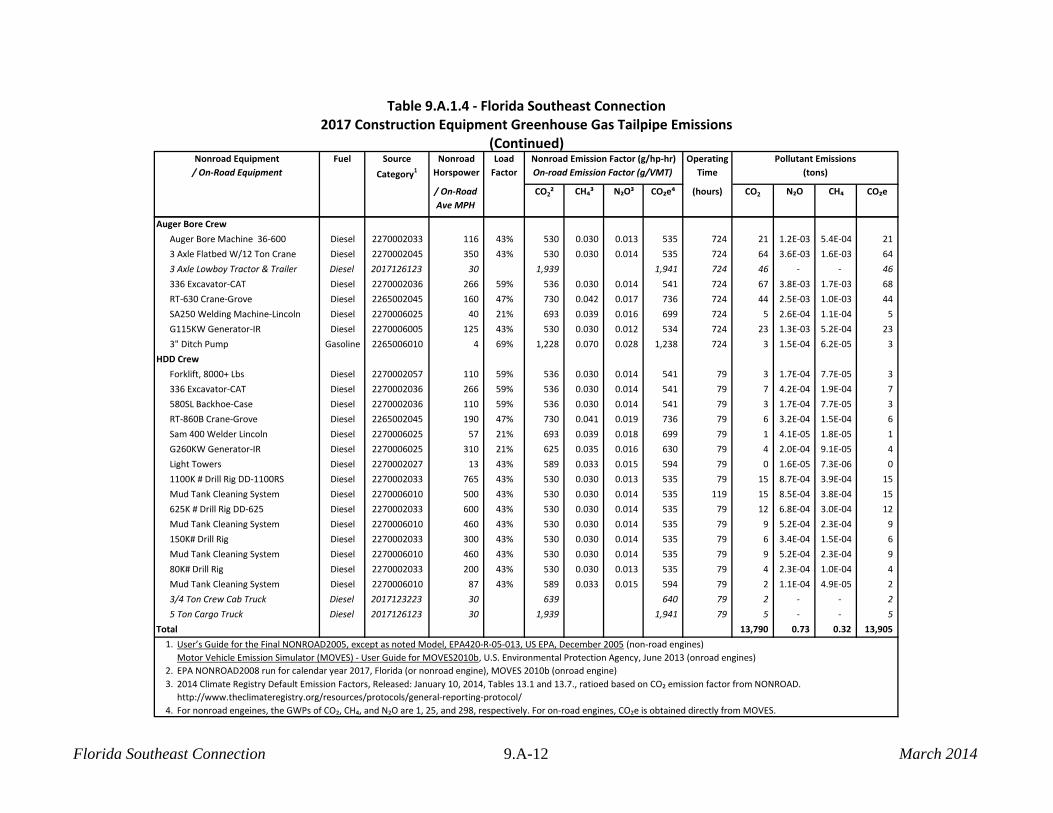
Table 9.A.1.4 - Florida Southeast Connection2017 Construction Equipment Greenhouse Gas Tailpipe Emissions
(Continued)Fuel Source
Category1
Nonroad
Horspower
Load
Factor
Operating
Time
Pollutant Emissions
(tons)
/ On-Road
Ave MPH
CO2² CH₄³ N₂O³ CO₂e⁴ (hours) CO2 N₂O CH₄ CO₂e
Nonroad Equipment
/ On-Road Equipment
Nonroad Emission Factor (g/hp-hr)
On-road Emission Factor (g/VMT)
Auger Bore Crew
Auger Bore Machine 36-600 Diesel 2270002033 116 43% 530 0.030 0.013 535 724 21 1.2E-03 5.4E-04 21
3 Axle Flatbed W/12 Ton Crane Diesel 2270002045 350 43% 530 0.030 0.014 535 724 64 3.6E-03 1.6E-03 64
3 Axle Lowboy Tractor & Trailer Diesel 2017126123 30 100% 1,939 1,941 724 46 - - 46
336 Excavator-CAT Diesel 2270002036 266 59% 536 0.030 0.014 541 724 67 3.8E-03 1.7E-03 68
RT-630 Crane-Grove Diesel 2265002045 160 47% 730 0.042 0.017 736 724 44 2.5E-03 1.0E-03 44
SA250 Welding Machine-Lincoln Diesel 2270006025 40 21% 693 0.039 0.016 699 724 5 2.6E-04 1.1E-04 5
G115KW Generator-IR Diesel 2270006005 125 43% 530 0.030 0.012 534 724 23 1.3E-03 5.2E-04 23
3" Ditch Pump Gasoline 2265006010 4 69% 1,228 0.070 0.028 1,238 724 3 1.5E-04 6.2E-05 3
HDD Crew
Forklift, 8000+ Lbs Diesel 2270002057 110 59% 536 0.030 0.014 541 79 3 1.7E-04 7.7E-05 3
336 Excavator-CAT Diesel 2270002036 266 59% 536 0.030 0.014 541 79 7 4.2E-04 1.9E-04 7
580SL Backhoe-Case Diesel 2270002036 110 59% 536 0.030 0.014 541 79 3 1.7E-04 7.7E-05 3
RT-860B Crane-Grove Diesel 2265002045 190 47% 730 0.041 0.019 736 79 6 3.2E-04 1.5E-04 6
Sam 400 Welder Lincoln Diesel 2270006025 57 21% 693 0.039 0.018 699 79 1 4.1E-05 1.8E-05 1
G260KW Generator-IR Diesel 2270006025 310 21% 625 0.035 0.016 630 79 4 2.0E-04 9.1E-05 4
Light Towers Diesel 2270002027 13 43% 589 0.033 0.015 594 79 0 1.6E-05 7.3E-06 0
1100K # Drill Rig DD-1100RS Diesel 2270002033 765 43% 530 0.030 0.013 535 79 15 8.7E-04 3.9E-04 15
Mud Tank Cleaning System Diesel 2270006010 500 43% 530 0.030 0.014 535 119 15 8.5E-04 3.8E-04 15
625K # Drill Rig DD-625 Diesel 2270002033 600 43% 530 0.030 0.014 535 79 12 6.8E-04 3.0E-04 12
Mud Tank Cleaning System Diesel 2270006010 460 43% 530 0.030 0.014 535 79 9 5.2E-04 2.3E-04 9
150K# Drill Rig Diesel 2270002033 300 43% 530 0.030 0.014 535 79 6 3.4E-04 1.5E-04 6
Mud Tank Cleaning System Diesel 2270006010 460 43% 530 0.030 0.014 535 79 9 5.2E-04 2.3E-04 9
80K# Drill Rig Diesel 2270002033 200 43% 530 0.030 0.013 535 79 4 2.3E-04 1.0E-04 4
Mud Tank Cleaning System Diesel 2270006010 87 43% 589 0.033 0.015 594 79 2 1.1E-04 4.9E-05 2
3/4 Ton Crew Cab Truck Diesel 2017123223 30 100% 639 640 79 2 - - 2
5 Ton Cargo Truck Diesel 2017126123 30 100% 1,939 1,941 79 5 - - 5
Total 13,790 0.73 0.32 13,905
1. User’s Guide for the Final NONROAD2005, except as noted Model, EPA420-R-05-013, US EPA, December 2005 (non-road engines)
Motor Vehicle Emission Simulator (MOVES) - User Guide for MOVES2010b, U.S. Environmental Protection Agency, June 2013 (onroad engines)
2. EPA NONROAD2008 run for calendar year 2017, Florida (or nonroad engine), MOVES 2010b (onroad engine)
3. 2014 Climate Registry Default Emission Factors, Released: January 10, 2014, Tables 13.1 and 13.7., ratioed based on CO₂ emission factor from NONROAD.
http://www.theclimateregistry.org/resources/protocols/general-reporting-protocol/
4. For nonroad engeines, the GWPs of CO₂, CH₄, and N₂O are 1, 25, and 298, respectively. For on-road engines, CO₂e is obtained directly from MOVES.
Florida Southeast Connection 9.A-12 March 2014
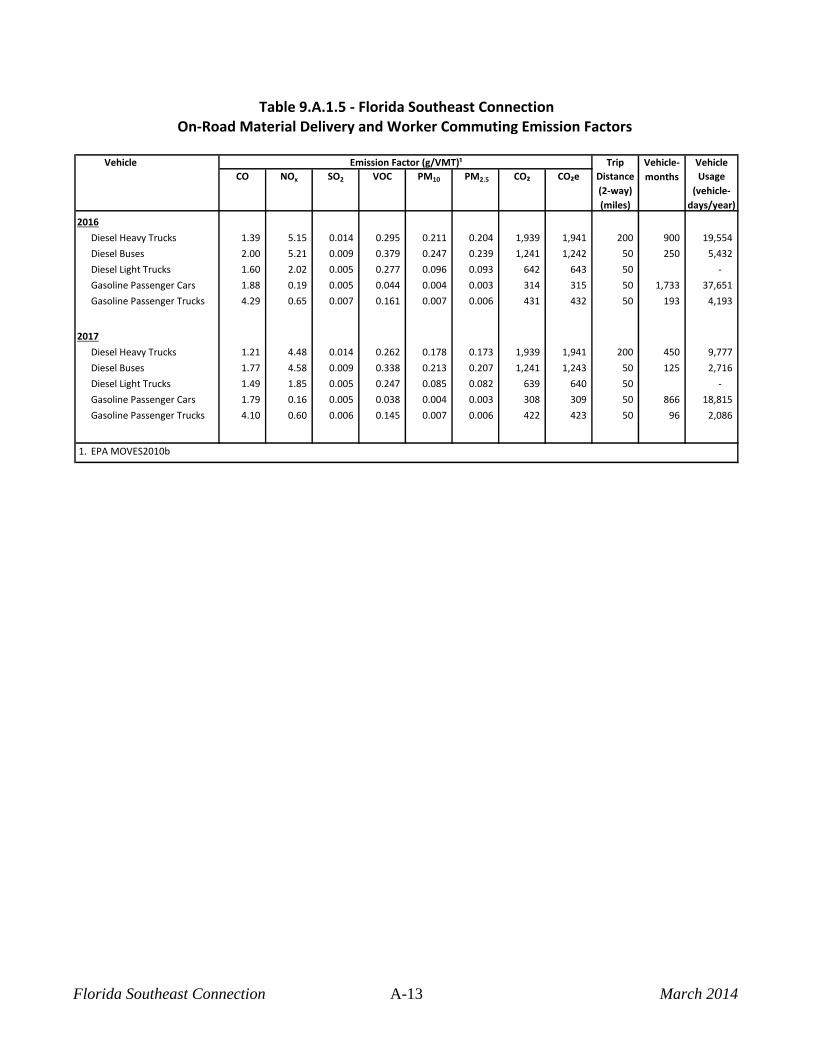
Table 9.A.1.5 - Florida Southeast Connection Table 9.A.1.6 - Florida Southeast ConnectionOn-Road Material Delivery and Worker Commuting Emission Factors On-Road Material Delivery and Worker Commuting Emissions
Vehicle Emission Factor (g/VMT)¹ Trip Vehicle
CO NOx SO2 VOC PM10 PM2.5 CO₂ CO₂e Distance
(2-way)
(miles)
Usage
(vehicle-
days/year)
Diesel Heavy Trucks 1.39 5.15 0.014 0.295 0.211 0.204 1,939 1,941 200 900 19,554
Diesel Buses 2.00 5.21 0.009 0.379 0.247 0.239 1,241 1,242 50 250 5,432
Diesel Light Trucks 1.60 2.02 0.005 0.277 0.096 0.093 642 643 50 -
Gasoline Passenger Cars 1.88 0.19 0.005 0.044 0.004 0.003 314 315 50 1,733 37,651
Gasoline Passenger Trucks 4.29 0.65 0.007 0.161 0.007 0.006 431 432 50 193 4,193
Diesel Heavy Trucks 1.21 4.48 0.014 0.262 0.178 0.173 1,939 1,941 200 450 9,777
Diesel Buses 1.77 4.58 0.009 0.338 0.213 0.207 1,241 1,243 50 125 2,716
Diesel Light Trucks 1.49 1.85 0.005 0.247 0.085 0.082 639 640 50 -
Gasoline Passenger Cars 1.79 0.16 0.005 0.038 0.004 0.003 308 309 50 866 18,815
Gasoline Passenger Trucks 4.10 0.60 0.006 0.145 0.007 0.006 422 423 50 96 2,086
1. EPA MOVES2010b
Vehicle-
months
2016
2017
Florida Southeast Connection A-13 March 2014
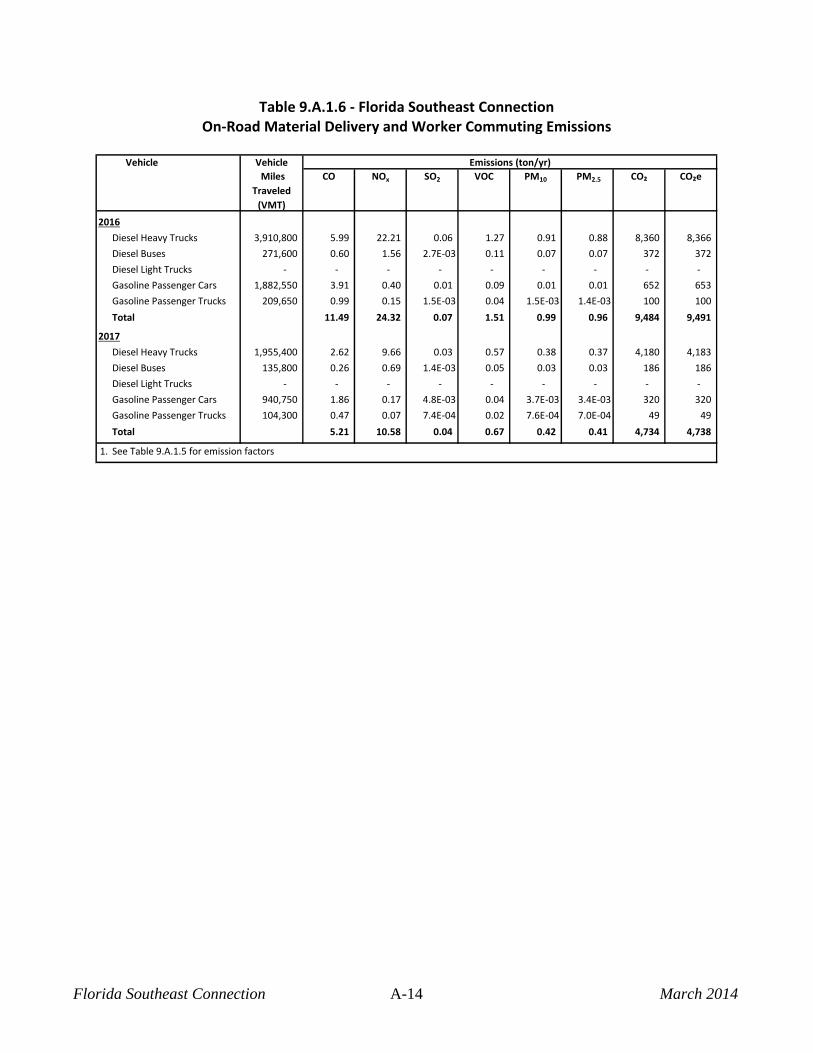
Table 9.A.1.6 - Florida Southeast Connection
On-Road Material Delivery and Worker Commuting Emissions
Vehicle Vehicle Emissions (ton/yr)
Miles
Traveled
(VMT)
CO NOx SO2 VOC PM10 PM2.5 CO₂ CO₂e
Diesel Heavy Trucks 3,910,800 5.99 22.21 0.06 1.27 0.91 0.88 8,360 8,366
Diesel Buses 271,600 0.60 1.56 2.7E-03 0.11 0.07 0.07 372 372
Diesel Light Trucks - - - - - - - - -
Gasoline Passenger Cars 1,882,550 3.91 0.40 0.01 0.09 0.01 0.01 652 653
Gasoline Passenger Trucks 209,650 0.99 0.15 1.5E-03 0.04 1.5E-03 1.4E-03 100 100
Total 11.49 24.32 0.07 1.51 0.99 0.96 9,484 9,491
Diesel Heavy Trucks 1,955,400 2.62 9.66 0.03 0.57 0.38 0.37 4,180 4,183
Diesel Buses 135,800 0.26 0.69 1.4E-03 0.05 0.03 0.03 186 186
Diesel Light Trucks - - - - - - - - -
Gasoline Passenger Cars 940,750 1.86 0.17 4.8E-03 0.04 3.7E-03 3.4E-03 320 320
Gasoline Passenger Trucks 104,300 0.47 0.07 7.4E-04 0.02 7.6E-04 7.0E-04 49 49
Total 5.21 10.58 0.04 0.67 0.42 0.41 4,734 4,738
1. See Table 9.A.1.5 for emission factors
2016
2017
Florida Southeast Connection A-14 March 2014
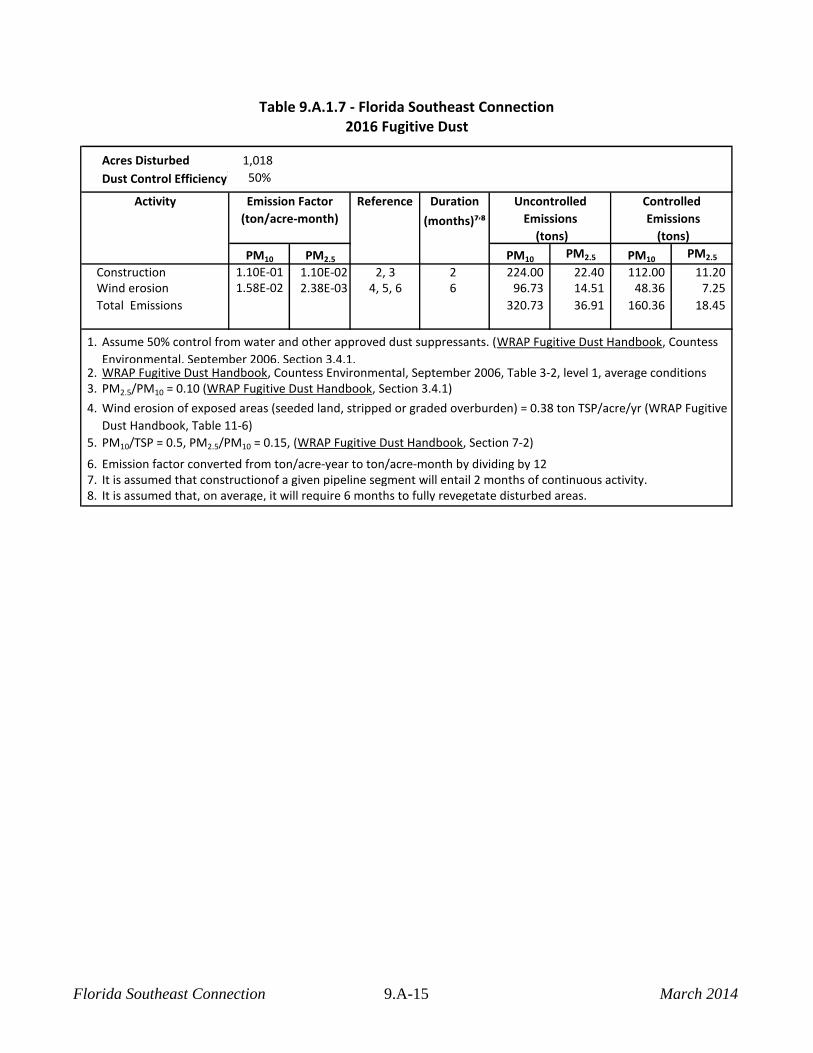
Table 9.A.1.7 - Florida Southeast Connection Table 9.A.1.8 - Florida Southeast Connection2016 Fugitive Dust 2017 Fugitive Dust
Acres Disturbed 1,018
Dust Control Efficiency1 50%
Activity Emission Factor
(ton/acre-month)
Reference Duration
(months)⁷,⁸
Uncontrolled
Emissions
(tons)
Controlled
Emissions
(tons)
Activity
PM10 PM2.5 PM10PM2.5 PM10
PM2.5
Construction 1.10E-01 1.10E-02 2, 3 2 224.00 22.40 112.00 11.20Wind erosion 1.58E-02 2.38E-03 4, 5, 6 6 96.73 14.51 48.36 7.25
Total Emissions 320.73 36.91 160.36 18.45
1.
2. WRAP Fugitive Dust Handbook, Countess Environmental, September 2006, Table 3-2, level 1, average conditions3. PM2.5/PM10 = 0.10 (WRAP Fugitive Dust Handbook, Section 3.4.1)
4.
5. PM10/TSP = 0.5, PM2.5/PM10 = 0.15, (WRAP Fugitive Dust Handbook, Section 7-2)
6. Emission factor converted from ton/acre-year to ton/acre-month by dividing by 127. It is assumed that constructionof a given pipeline segment will entail 2 months of continuous activity.8. It is assumed that, on average, it will require 6 months to fully revegetate disturbed areas.
Wind erosion of exposed areas (seeded land, stripped or graded overburden) = 0.38 ton TSP/acre/yr (WRAP Fugitive
Dust Handbook, Table 11-6)
Assume 50% control from water and other approved dust suppressants. (WRAP Fugitive Dust Handbook, Countess
Environmental, September 2006, Section 3.4.1.
Florida Southeast Connection 9.A-15 March 2014

Table 9.A.1.8 - Florida Southeast Connection2017 Fugitive Dust
Acres Disturbed 509
Dust Control Efficiency1 50%
Activity Emission Factor
(ton/acre-month)
Reference Duration
(months)⁷,⁸
Uncontrolled
Emissions
(tons)
Controlled
Emissions
(tons)
PM10 PM2.5 PM10PM2.5 PM10
PM2.5
Construction 1.10E-01 1.10E-02 2, 3 2 112.00 11.20 56.00 5.60Wind erosion 1.58E-02 2.38E-03 4, 5, 6 6 48.36 7.25 24.18 3.63
Total Emissions 160.36 18.45 80.18 9.23
1.
2. WRAP Fugitive Dust Handbook, Countess Environmental, September 2006, Table 3-2, level 1, average conditions3. PM2.5/PM10 = 0.10 (WRAP Fugitive Dust Handbook, Section 3.4.1)
4.
5. PM10/TSP = 0.5, PM2.5/PM10 = 0.15, (WRAP Fugitive Dust Handbook, Section 7-2)
6. Emission factor converted from ton/acre-year to ton/acre-month by dividing by 127. It is assumed that constructionof a given pipeline segment will entail 2 months of continuous activity.8. It is assumed that, on average, it will require 6 months to fully revegetate disturbed areas.
Wind erosion of exposed areas (seeded land, stripped or graded overburden) = 0.38 ton TSP/acre/yr (WRAP Fugitive
Dust Handbook, Table 11-6)
Assume 50% control from water and other approved dust suppressants. (WRAP Fugitive Dust Handbook, Countess
Environmental, September 2006, Section 3.4.1.
Florida Southeast Connection 9.A-16 March 2014
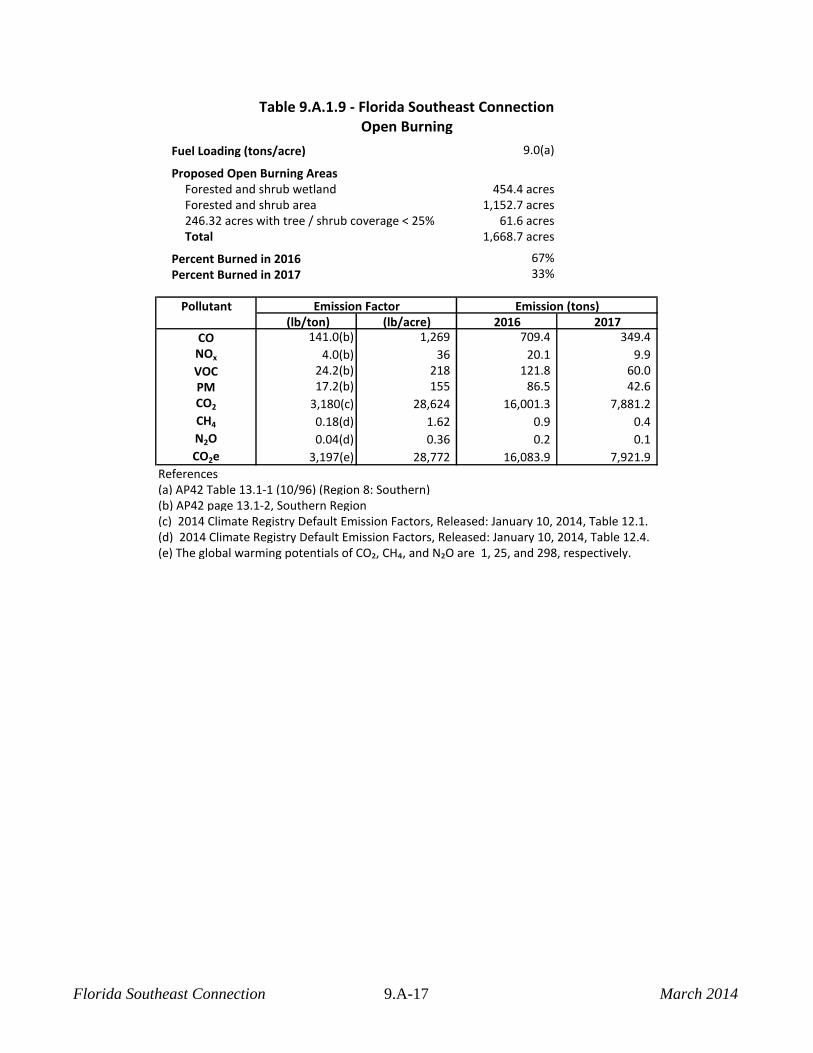
Table 9.A.1.9 - Florida Southeast ConnectionOpen Burning
Fuel Loading (tons/acre) 9.0(a)
454.4 acres1,152.7 acres
61.6 acres1,668.7 acres
Percent Burned in 2016 67%
Percent Burned in 2017 33%
Pollutant Emission Factor Emission (tons) (lb/ton) (lb/acre) 2016 2017
CO 141.0(b) 1,269 709.4 349.4
NOx 4.0(b) 36 20.1 9.9
VOC 24.2(b) 218 121.8 60.0
PM 17.2(b) 155 86.5 42.6
CO2 3,180(c) 28,624 16,001.3 7,881.2
CH4 0.18(d) 1.62 0.9 0.4
N2O 0.04(d) 0.36 0.2 0.1
CO2e 3,197(e) 28,772 16,083.9 7,921.9
References(a) AP42 Table 13.1-1 (10/96) (Region 8: Southern)(b) AP42 page 13.1-2, Southern Region(c) 2014 Climate Registry Default Emission Factors, Released: January 10, 2014, Table 12.1. (d) 2014 Climate Registry Default Emission Factors, Released: January 10, 2014, Table 12.4. (e) The global warming potentials of CO₂, CH₄, and N₂O are 1, 25, and 298, respectively.
Proposed Open Burning Areas
Total
Forested and shrub wetlandForested and shrub area246.32 acres with tree / shrub coverage < 25%
Florida Southeast Connection 9.A-17 March 2014
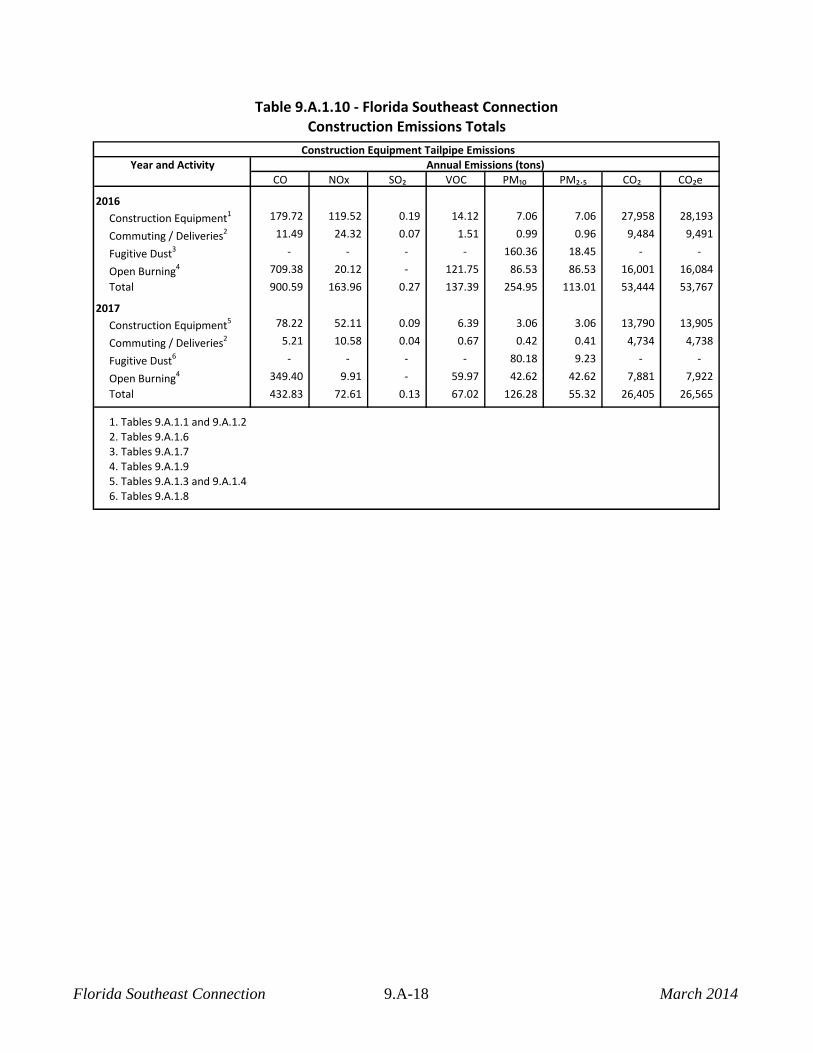
Table 9.A.1.10 - Florida Southeast ConnectionConstruction Emissions Totals
Construction Equipment Tailpipe EmissionsYear and Activity Annual Emissions (tons)
CO NOх SO₂ VOC PM₁₀ PM₂.₅ CO₂ CO₂e
2016
Construction Equipment1 179.72 119.52 0.19 14.12 7.06 7.06 27,958 28,193
Commuting / Deliveries2 11.49 24.32 0.07 1.51 0.99 0.96 9,484 9,491
Fugitive Dust3 - - - - 160.36 18.45 - -
Open Burning4 709.38 20.12 - 121.75 86.53 86.53 16,001 16,084
Total 900.59 163.96 0.27 137.39 254.95 113.01 53,444 53,767
2017
Construction Equipment5 78.22 52.11 0.09 6.39 3.06 3.06 13,790 13,905
Commuting / Deliveries2 5.21 10.58 0.04 0.67 0.42 0.41 4,734 4,738
Fugitive Dust6 - - - - 80.18 9.23 - -
Open Burning4 349.40 9.91 - 59.97 42.62 42.62 7,881 7,922
Total 432.83 72.61 0.13 67.02 126.28 55.32 26,405 26,565
1. Tables 9.A.1.1 and 9.A.1.22. Tables 9.A.1.63. Tables 9.A.1.74. Tables 9.A.1.95. Tables 9.A.1.3 and 9.A.1.46. Tables 9.A.1.8
Florida Southeast Connection 9.A-18 March 2014