florida market update - faia
TRANSCRIPT

Florida Market UpdateMichelle Baurkot, Director
David Blades, Associate DirectorChris Draghi, Sr. Financial Analyst
FAIA WebinarMarch 20th, 2020

AM Best Participants
Chris DraghiSr. Financial Analyst
Michelle BaurkotDirector
David BladesAssociate Director
2

FAIA Introduction
Challenges Facing Florida Insurers
First Look at 2019 Results
Florida Legislation Update
AMB Ratings Process
Q&A
3
Agenda

Florida Challenges
• Hardening reinsurance market
• Social inflation- Assignment of Benefit abuse (reforms enacted July
2019)
- First Party Lawsuits
• More frequent hurricane activity- Matthew (2016), Irma (2017), Michael (2018)
• Adverse loss reserve development
• Shifting intrastate/interstate risk appetites
• Significant rate increases requested by Florida insurers
5
Challenges

6
Assignment of Benefits (AOB)
Source: Insurance Information Institute

• Allowed insurance companies to offer AOB-restricted policies
• Established contract requirements
• Outlined duties and obligations of assignees under AOB contracts
• Established rights of the assignor
• Set up payment scale for attorney’s fees. When the difference between the judgement obtained and the pre-suit settlement offer is:
- Less than 25% of the disputed amount – Insurer is awarded fees
- 25% but less than 50% – No party is awarded fees
- 50% or greater – The assignee is awarded fees
7
AOB Reform SB 122/HB 7065 (July 2019)

• Windhaven Insurance Company and Windhaven National Insurance liquidations.
• Florida Specialty Insurance Company liquidation.
• Anchor Specialty Ins. Co. to be purchased by Weston Ins. Holdings Corp.
• HCI Group policy replacement agreement with Anchor P&C Ins. Co.
• Avatar Partners LP to acquire Centauri Specialty Ins. Co. and Centauri National Ins. Co.
• Prepared Insurance Company to be purchased by Lighthouse Property Insurance Corp.
8
Mergers/Acquisitions/Liquidations

First Look – 2019 Results

10
Florida Domiciled Personal Property CompaniesTop 20 Ranked by Total 2019 Florida Personal Property Direct Premiums Written (DPW) -- ($ thousands)
AMB # Company Name Policyholders' Surplus HO MP Fire & Allied Lines 2019 FL HO MP &
Fire/Allied DPW 2019 Total DPWFL Prop DPW as
a % of Total DPW
Net Loss & LAE Ratio
012123 Universal Property & Casualty Ins Co 301,120 984,620 72,309 1,056,929 1,285,227 82.2 71.6
012235 State Farm Florida Insurance Company 896,786 641,797 26 641,823 738,358 86.9 55.5
000711 FedNat Insurance Company 141,783 383,342 80,457 463,799 605,202 76.6 81.8
011468 Security First Insurance Company 82,488 352,908 81,120 434,028 434,028 100.0 144.3
014558 Heritage Property & Casualty Ins Company 158,619 372,415 36,144 408,559 535,440 76.3 68.7
013917 ASI Preferred Insurance Corp. 53,097 300,591 76,605 377,196 387,393 97.4 68.8
012686 St. Johns Insurance Company, Inc. 46,751 315,876 35,607 351,483 371,488 94.6 204.3
013765 American Integrity Insurance Co of FL 78,061 256,969 83,628 340,597 341,514 99.7 78.4
012201 First Protective Insurance Company 73,122 296,384 27,490 323,874 432,484 74.9 74.5
013895 Homeowners Choice Property & Casualty 159,163 271,675 30,946 302,621 302,907 99.9 58.7
012311 United Property & Casualty Ins Co 159,004 208,867 49,496 258,363 761,039 33.9 63.2
013934 People's Trust Insurance Company 78,335 173,193 61,739 234,932 234,982 100.0 61.9
013087 Florida Peninsula Insurance Company 90,999 218,479 0 218,479 218,531 100.0 69.8
012359 Tower Hill Prime Insurance Company 123,248 205,550 5,905 211,455 260,462 81.2 99.4
013848 Olympus Insurance Company 34,837 171,813 17,532 189,345 190,980 99.1 27.0
012203 Capitol Preferred Insurance Co, Inc. 42,712 122,682 47,857 170,539 210,760 80.9 127.3
000120 American Bankers Insurance Company of FL 619,204 50,034 111,974 162,008 5,225,869 3.1 46.5
013312 Tower Hill Signature Ins Co 71,233 116,010 39,382 155,392 156,186 99.5 66.2
022029 Safepoint Insurance Company 38,890 75,213 56,399 131,612 147,274 89.4 109.7
013075 American Traditions Insurance Company 30,355 116,931 11,227 128,158 129,057 99.3 63.8Since this exhibit is focused on Florida-domiciled domestic insurers that are members of AM Best's predominating personal property composite (meaning more than 50% of each company's total premium is comprised of the primary personal property lines of coverage -- homeowners' multiperil, farmowners' multiperil, fire, and auto physical damage, some companies with appreciable market share such as AIG's Lexington Insurance Company and AIG Property Casualty Company, and Chubb's Federal Insurance Company are not included. Citizens data for 2019 was not yet available.
Source: AM Best data and research
11
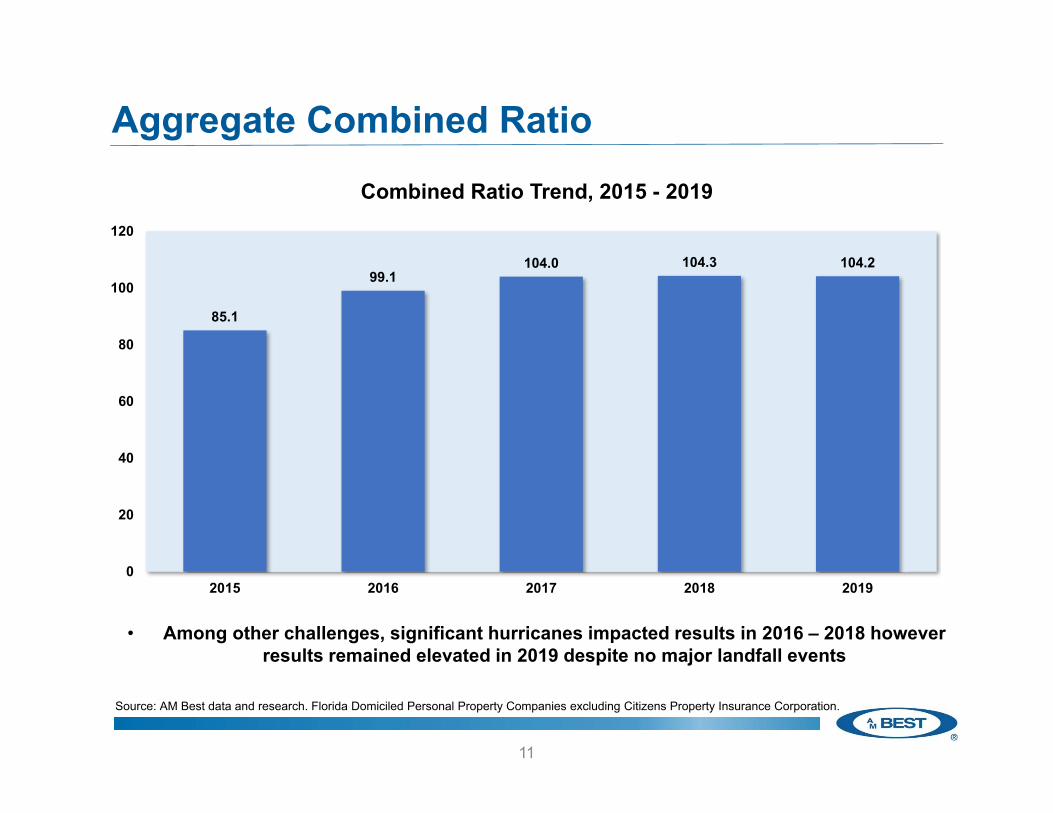
Aggregate Combined Ratio
• Among other challenges, significant hurricanes impacted results in 2016 – 2018 however results remained elevated in 2019 despite no major landfall events
85.1
99.1104.0 104.3 104.2
0
20
40
60
80
100
120
2015 2016 2017 2018 2019
Combined Ratio Trend, 2015 - 2019
Source: AM Best data and research. Florida Domiciled Personal Property Companies excluding Citizens Property Insurance Corporation.

12
3 Year Results Ranked by Highest Combined RatioFlorida Domiciled Personal Property Insurers Loss, Expense and Combined Ratio Trends, 2017-2019
(Ranked by highest 2019 Combined Ratio)
AMB # Company Name
2017 2018 2019Loss &
LAE Ratio
Expense Ratio
Combined Ratio
Loss & LAE Ratio
Expense Ratio
Combined Ratio
Loss & LAE Ratio
Expense Ratio
Combined Ratio
013848 Olympus Insurance Company (48.2) 710.5 662.3 272.6 (99.9) 125.8 999.9 999.9 999.9 022283 Anchor Property & Casualty Insurance Co 165.0 43.3 208.3 131.9 42.6 174.6 156.3 62.6 219.0 011468 Security First Insurance Company 86.7 19.5 106.2 89.6 34.7 124.3 134.4 46.6 181.0 012686 St. Johns Insurance Company, Inc. 118.2 10.4 128.5 118.1 13.1 131.3 203.1 (24.4) 178.7 022318 Monarch National Insurance Company 130.1 36.6 166.7 158.1 31.7 189.8 137.7 32.0 169.7 014120 Prepared Insurance Company 141.0 44.3 185.3 109.5 45.1 154.6 113.3 39.1 152.5 013917 ASI Preferred Insurance Corp. 54.5 69.2 123.7 56.8 52.2 109.0 71.2 77.0 148.2 012203 Capitol Preferred Insurance Co, Inc. 92.9 18.5 111.4 103.3 19.9 123.2 129.3 9.1 138.3 022029 Safepoint Insurance Company 98.2 18.5 116.7 80.2 43.2 123.4 107.3 30.5 137.8 020564 Vault Reciprocal Exchange 207.2 (99.9) (99.9) 59.8 44.7 104.5 79.6 48.7 128.3 012201 First Protective Insurance Company 44.8 38.5 83.3 34.0 88.0 122.0 74.2 51.4 125.5 010124 Gulfstream Property and Casualty Ins Co 63.6 37.4 101.0 78.7 37.3 116.0 86.6 38.8 125.5 012719 Tower Hill Select Insurance Company 96.1 29.1 125.2 97.4 18.4 115.8 98.1 25.3 123.4 013017 Southern Fidelity Insurance Company 62.0 40.2 102.2 66.5 37.7 104.1 90.9 32.1 122.9 002727 Omega Insurance Company 125.3 30.3 155.7 187.2 51.4 238.7 95.7 26.8 122.5 012991 Southern Oak Insurance Company 66.5 30.7 97.2 71.8 31.3 103.0 89.1 32.1 121.2 013087 Florida Peninsula Insurance Company 81.0 36.3 117.3 74.5 44.6 119.0 69.8 49.1 118.9 012247 Cypress Property & Casualty Insurance Co 58.3 57.4 115.7 63.3 46.5 109.9 91.6 27.2 118.8 012713 Universal Insurance Co of North America 81.4 30.6 112.0 72.0 31.0 103.0 84.3 33.9 118.1 013118 Centauri Specialty Insurance Company 79.3 37.2 116.5 114.7 7.3 121.9 207.1 (91.3) 115.8
Source: AM Best data and research. Florida Domiciled Personal Property Companies excluding Citizens Property Insurance Corporation.

13
Aggregate Loss & LAE Ratio
• Citizens remains an insurer for the more volatile risks as evidenced by the impact it has on the aggregate loss ratio when included
49.7
62.8
69.1 69.1 68.5
51.4
64.6
85.7
72.6
0
10
20
30
40
50
60
70
80
90
2015 2016 2017 2018 2019*
Net
Los
s &
LA
E R
atio
Comparison of Aggregate Loss Ratio with and without Citizens
Net Loss & LAE Ratio w/o Citizens Net Loss & LAE Ratio w/ Citizens
Source: AM Best data and research. Florida Domiciled Personal Property Companies.

14
Net Loss & LAE Ratio Ranked by Highest YoY Change
Florida Domiciled Personal Property Insurers Year-over-Year Change in Net loss & Loss Adjustment Expense Ratio
(Ranked by largest YoY Change)
AMB # Company Name 2018 Net Loss & LAE Ratio
2019 Net Loss & LAE Ratio
YoY Loss Ratio Change
013848 Olympus Insurance Company 272.6 2797.3 2524.6013118 Centauri Specialty Insurance Company 114.7 207.1 92.4012686 St. Johns Insurance Company, Inc. 118.1 203.1 85.0011468 Security First Insurance Company 89.6 134.4 44.7012201 First Protective Insurance Company 34.0 74.2 40.2022603 TypTap Insurance Company 19.2 53.9 34.8012247 Cypress Property & Casualty Insurance Co 63.3 91.6 28.2022029 Safepoint Insurance Company 80.2 107.3 27.1012203 Capitol Preferred Insurance Co, Inc. 103.3 129.3 26.0022283 Anchor Property & Casualty Insurance Co 131.9 156.3 24.4013017 Southern Fidelity Insurance Company 66.5 90.9 24.4020564 Vault Reciprocal Exchange 59.8 79.6 19.8012991 Southern Oak Insurance Company 71.8 89.1 17.3013917 ASI Preferred Insurance Corp. 56.8 71.2 14.4012359 Tower Hill Prime Insurance Company 86.0 99.6 13.6012713 Universal Insurance Co of North America 72.0 84.3 12.3000711 FedNat Insurance Company 67.9 78.9 11.0012123 Universal Property & Casualty Ins Co 63.3 72.1 8.8011540 ASI Home Insurance Corp. 62.6 70.9 8.3010124 Gulfstream Property and Casualty Ins Co 78.7 86.6 8.0
Source: AM Best data and research. Florida Domiciled Personal Property Companies excluding Citizens Property Insurance Corporation.

15
Defense and Cost Containment (DCC)
• Rise since 2014 driven by AOB and litigation costs, noticeable dip in 2019 likely influenced by AOB reform enacted in July
0
0.5
1
1.5
2
2.5
3
3.5
4
4.5
0
100
200
300
400
500
600
700
2009 2010 2011 2012 2013 2014 2015 2016 2017 2018 2019
DC
C to D
PE (%)D
CC
Exp
ense
($ m
illio
ns)
DCC Expense ($ millions) DCC to DPE (%)
Source: AM Best data and research. Florida Domiciled Personal Property Companies excluding Citizens Property Insurance Corporation.
DCC Expense - Whole Dollar and As a Percent of Direct Earned Premium
16
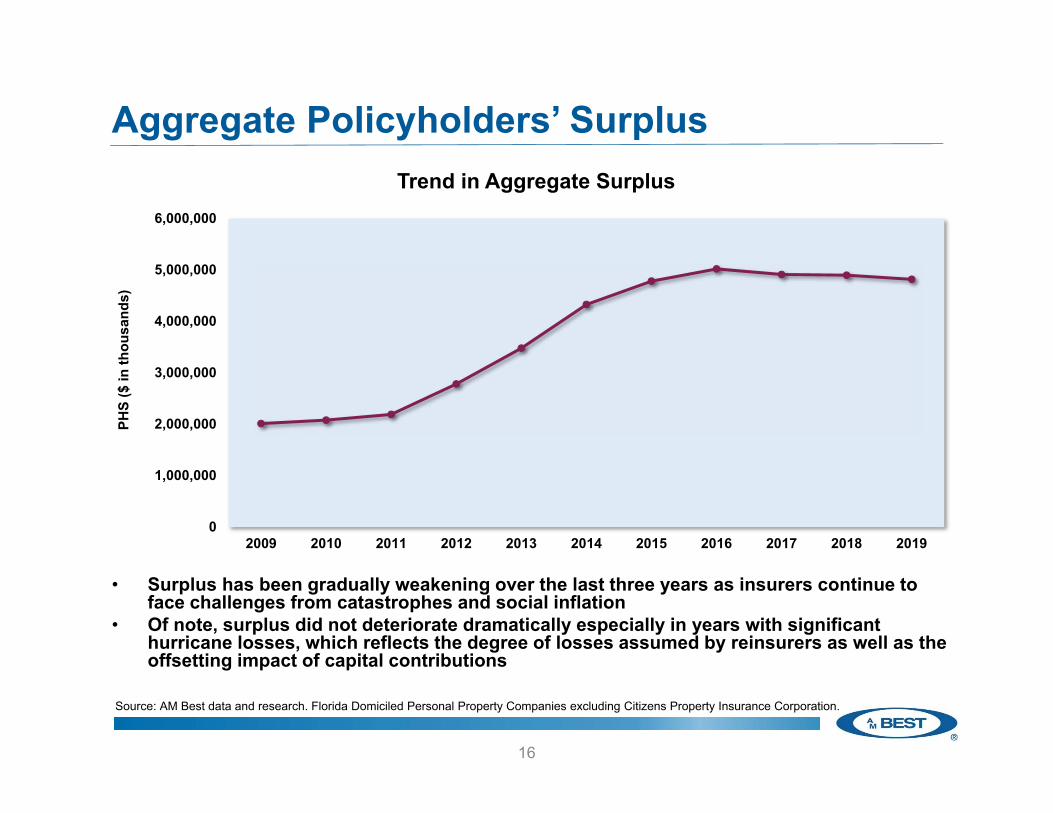
Aggregate Policyholders’ Surplus
• Surplus has been gradually weakening over the last three years as insurers continue to face challenges from catastrophes and social inflation
• Of note, surplus did not deteriorate dramatically especially in years with significant hurricane losses, which reflects the degree of losses assumed by reinsurers as well as the offsetting impact of capital contributions
Source: AM Best data and research. Florida Domiciled Personal Property Companies excluding Citizens Property Insurance Corporation.
0
1,000,000
2,000,000
3,000,000
4,000,000
5,000,000
6,000,000
2009 2010 2011 2012 2013 2014 2015 2016 2017 2018 2019
PHS
($ in
thou
sand
s)
Trend in Aggregate Surplus

17
Aggregate Policyholders’ Surplus
• While surplus has moderately dipped over the past three years, the severity of the decline has been offset by material capital contributions. Had contributions not been made, the
aggregate surplus would have declined by $1B as opposed to $186M
-200
-100
0
100
200
300
400
500
2016 2017 2018 2019
($ m
illio
ns)
Aggregate Contributed Capital and Change in Surplus
Contributed Capital Change in Surplus
Source: AM Best data and research. Florida Domiciled Personal Property Companies excluding Citizens Property Insurance Corporation.

18
Top Insurers Ranked by Capital Contributions
• Some insurers benefit from being part of larger corporations with readily available capital
Florida Domiciled Property Companies Largest Aggregate Receipt of Capital Contributions, 2015-2019(Ranked by Companies with the highest Contributed Capital, with a Minimum of $25 million in Aggregate Contributed Capital)
AMB # Company Name 2019 Pretax Income/(Loss)
2019 Contributed
Capital
Cumulative Pretax Income/(Loss)
Cumulative Contributed Capital Total
012150 American Strategic Insurance Corp. (28,415) 0 (17,856) 260,500 012311 United Property & Casualty Ins Co (21,404) 10,824 (65,208) 90,120 011468 Security First Insurance Company (19,650) 10,000 (72,756) 85,033 000711 FedNat Insurance Company (24,192) 0 (57,570) 67,253 022283 Anchor Property & Casualty Insurance Co (22,367) 5,000 (79,430) 61,476 012359 Tower Hill Prime Insurance Company 9,552 (5,000) (12,567) 54,000 014120 Prepared Insurance Company (12,555) 11,755 (48,580) 50,394 020564 Vault Reciprocal Exchange (3,845) 0 (6,515) 50,000 014558 Heritage Property & Casualty Ins Company (30,050) 1,265 (88,955) 44,262 012686 St. Johns Insurance Company, Inc. (26,847) 22,824 (53,420) 40,120 000120 American Bankers Insurance Company of FL 241,974 0 1,140,442 40,000 022318 Monarch National Insurance Company (3,624) 5,000 (17,311) 36,000 012203 Capitol Preferred Insurance Co, Inc. (25,738) 25,000 (39,539) 33,300 013917 ASI Preferred Insurance Corp. (695) 8,202 (9,190) 32,621 022613 US Coastal Property & Casualty Ins Co 375 4,000 (4,623) 30,400 022029 Safepoint Insurance Company (9,802) 0 (26,469) 30,000 022603 TypTap Insurance Company (5,178) 5,000 (3,889) 30,000 013312 Tower Hill Signature Ins Co 1,876 26,931 807 26,304
Source: AM Best data and research. Florida Domiciled Personal Property Companies excluding Citizens Property Insurance Corporation.

19
Ceded Premium Written
• A hardening reinsurance market has made coverage more expensive, forcing moredifficult risk management decisions. In cases where less coverage is purchased,
capital is more at risk. Source: AM Best data and research. Florida Domiciled Personal Property Companies excluding Citizens Property Insurance Corporation.
6.0
6.5
7.0
7.5
8.0
8.5
9.0
9.5
2015 2016 2017 2018 2019
Una
ffilia
ted
CPW
Aggregate Unaffiliated CPW ($ in billions)

131.6 140.9
153.2 165.8
192.4
-
50.0
100.0
150.0
200.0
250.0
2015 2016 2017 2018 2019
(%)
Unaffiliated Ceded Premium as a Percent of Surplus
Unaffiliated CPW to PHS
20
Unaffiliated Ceded Premium Leverage
• Growing reinsurance dependency illustrates greater reliance on 3rd parties to protect capital positions
Source: AM Best data and research. Florida Domiciled Personal Property Companies excluding Citizens Property Insurance Corporation.

21
Top 15 Insurers based on Reinsurance Dependence
Florida Direct Market: Reinsurance Dependence, 2019Top 15 Companies Ranked by the Ratio of Unaffiliated Ceded Premiums Written to Gross Premiums Written
AMB# Company Name FL Property DPW as a % of Total DPW
Unaffiliated CPW/GPW Unaffiliated CPW/PHS
013848 Olympus Insurance Company 99.1 94.7 519.4
012686 St. Johns Insurance Company, Inc. 94.6 93.5 743.0
014386 Weston Insurance Company 76.0 92.5 193.0
013118 Centauri Specialty Insurance Company 35.4 90.5 1,013.2
012201 First Protective Insurance Company 74.9 85.1 503.2
022283 Anchor Property & Casualty Insurance Co 100.0 79.1 821.1
000120 American Bankers Insurance Company of FL 3.1 78.0 706.3
011468 Security First Insurance Company 100.0 75.1 395.0
022029 Safepoint Insurance Company 91.5 74.9 304.1
012203 Capitol Preferred Insurance Co, Inc. 80.9 72.9 359.8
010124 Gulfstream Property and Casualty Ins Co 73.5 72.8 430.5
013087 Florida Peninsula Insurance Company 100.0 66.2 158.9
014120 Prepared Insurance Company 99.8 62.7 218.7
013765 American Integrity Insurance Co of FL 99.7 58.2 254.6
013077 Edison Insurance Company 100.0 56.6 203.2
Source: AM Best data and research. Florida Domiciled Personal Property Companies excluding Citizens Property Insurance Corporation.

22
Loss Reserve Development Trends
• The weakening redundancy in earlier years illustrates the impact that AOB and water litigation trends had prior to hurricanes. Hurricanes in the later years exacerbated the
dynamic, creating large deficiencies.
-96.9 -88.3
-7.5
48.8
268.6 290.0
-150
-100
-50
0
50
100
150
200
250
300
350
2014 2015 2016 2017 2018 2019
One
-Yea
r Dev
elop
men
t ($
mill
ions
)
One-Year Loss Reserve Development
Source: AM Best data and research. Florida Domiciled Personal Property Companies excluding Citizens Property Insurance Corporation.

23
Citizens Property Insurance Corporation
• Represents roughly 5% of Gross Written Premium within this group used within this presentation
• After fairly successful depopulation efforts, recent market pressures and changing risk appetites appear to be undoing previous efforts with personal residential PIF increasing
275
280
285
290
295
300
305
310
315
320
325
330
Polic
ies-
in-fo
rce
Citizens Property Insurance - Personal Residential MultiperilQuarterly Policies-in-force
Source: Citizens Property Insurance Corp.

• Why are insurers increasing rates?- Offset rising reinsurance costs
- Increased hurricane activity
- Rising litigation costs• AOB, First Party Lawsuits
- Adverse development
• How much of an increase?- Capital Preferred Insurance – 36.5%
- Edison Insurance Company – 21.9%
- National Specialty Ins. Co (Velocity) – 28.1%
- Rate hearing required for anything above 15%
24
Rate Increases

Legislative Update

26
2020 Legislative Session
While they have not passed, bills have been raised in the legislature:
• SB 914 – Limits attorney fees by tempering contingency risk multipliers
• SB 924 – The insured/claimant is responsible for the burden of proof in bad faith actions against insurers
• SJR 1460 – Proposes making the Insurance Commissioner role an elected official
AMB Rating Process

AM Best Overview
Established in 1899
Only Global Insurance Focused Rating Agency
• Office Locations: Oldwick, London, Hong Kong, Singapore, Dubai (rep office), Mexico City, Amsterdam
• Rating over 3,300 insurance companies worldwide, over 800 outside the U.S. in over 90 countries.
• Cover 16,000 insurance companies globally through a wide range of analytical resources, references, directories and periodicals.
Over 600 Employees Focused on Insurance
• 135 analysts averaging 6 years tenure and 17 years industry experiences.
• Skills and designations: CPA, CFA, MBA/MS/MA, CAS/SOA, Ph.D.
28

AM Best’s interactive rating process is intended to provide an opinion of a company’s ability to meet its ongoing obligations to
policyholders.
Evaluation of an insurance company’s financial strength is based on an in-depth analysis of its balance sheet strength – including
capital adequacy and claims-paying resources – along with a review of its operating performance, business profile, and ERM.
Currently all AMB-rated Florida personal property focused writers have ratings that are acceptable by Fannie Mae and Freddie Mac.
29
AM Best’s Rating Process

30
BCRM Building Blocks: Balance Sheet Strength
Balance Sheet Strength Components
• BCAR • Quality of Capital
• Stress Tests • Quality of Reinsurance
• Liquidity • Reinsurance Dependence
• Asset Liability Management • Appropriateness of Reinsurance Program
• Internal Capital Models • Financial Flexibility
Business Profile
(+2/-2)
Enterprise Risk
Management
(+1/-4)
ComprehensiveAdjustment
(+1/-1)
Rating Lift/Drag
Issuer Credit Rating
Issuer Credit Rating
Country Risk
Operating Performance
(+2/-3)
Balance Sheet
Strength
Baseline
31
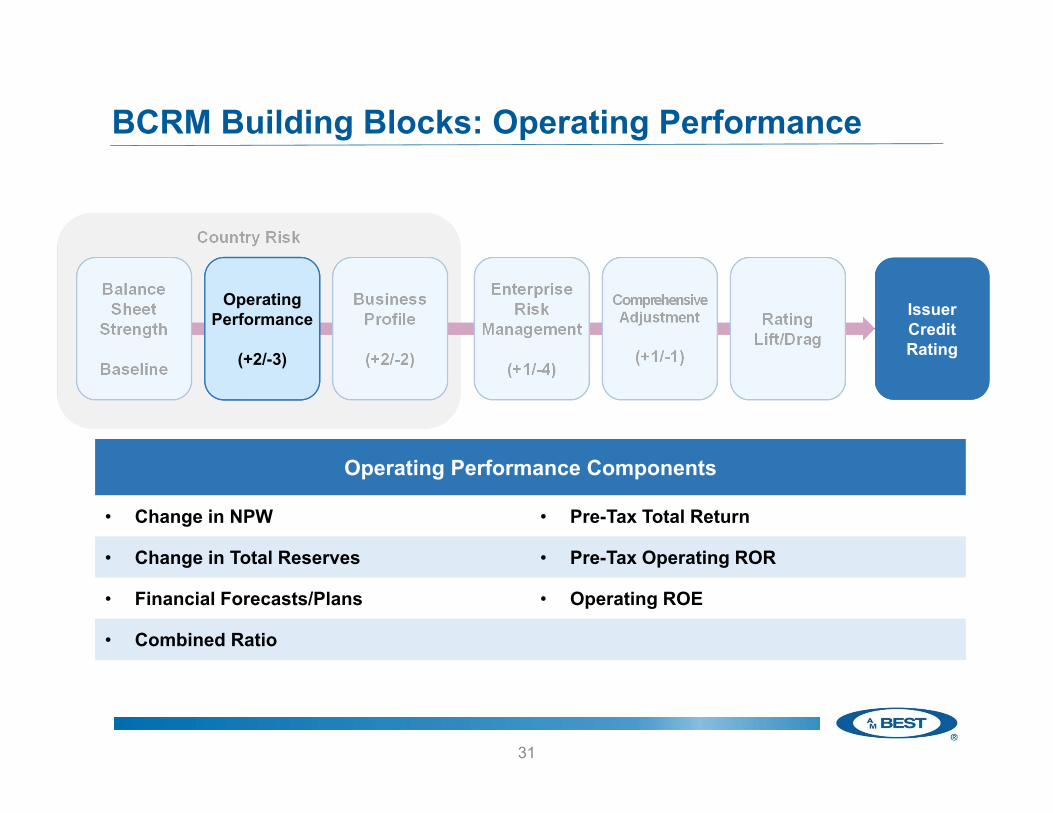
BCRM Building Blocks: Operating Performance
Operating Performance Components
• Change in NPW • Pre-Tax Total Return
• Change in Total Reserves • Pre-Tax Operating ROR
• Financial Forecasts/Plans • Operating ROE
• Combined Ratio
Business Profile
(+2/-2)
Enterprise Risk
Management
(+1/-4)
ComprehensiveAdjustment
(+1/-1)
Rating Lift/Drag
Issuer Credit Rating
Issuer Credit Rating
Country Risk
Balance Sheet
Strength
Baseline
Operating Performance
(+2/-3)

32
BCRM Building Blocks: Business Profile
Business Profile Components
• Market Position • Management Quality
• Pricing Sophistication & Data Quality • Regulatory, Event, and Country Risks
• Product Risk • Distribution Channels
• Degree of Competition • Product/Geographic Concentration• Innovation
Enterprise Risk
Management
(+1/-4)
ComprehensiveAdjustment
(+1/-1)
Rating Lift/Drag
Issuer Credit Rating
Issuer Credit Rating
Country Risk
Balance Sheet
Strength
Baseline
Operating Performance
(+2/-3)
Business Profile
(+2/-2)

33
BCRM Building Blocks: ERM
Enterprise Risk Management Framework Components
• Risk Identification and Reporting • Governance and Risk Culture
• Risk Management and Controls • Stress Testing
• Risk Appetite and Tolerances
ComprehensiveAdjustment
(+1/-1)
Rating Lift/Drag
Issuer Credit Rating
Issuer Credit Rating
Country Risk
Balance Sheet
Strength
Baseline
Operating Performance
(+2/-3)
Business Profile
(+2/-2)
Enterprise Risk
Management
(+1/-4)

Questions?

© AM Best Company, Inc. (AMB) and/or its licensors and affiliates. All rights reserved. ALL INFORMATION CONTAINED HEREIN ISPROTECTED BY COPYRIGHT LAW AND NONE OF SUCH INFORMATION MAY BE COPIED OR OTHERWISE REPRODUCED,REPACKAGED, FURTHER TRANSMITTED, TRANSFERRED, DISSEMINATED, REDISTRIBUTED OR RESOLD, OR STORED FORSUBSEQUENT USE FOR ANY SUCH PURPOSE, IN WHOLE OR IN PART, IN ANY FORM OR MANNER OR BY ANY MEANSWHATSOEVER, BY ANY PERSON WITHOUT AMB’s PRIOR WRITTEN CONSENT. All information contained herein is obtained by AMBfrom sources believed by it to be accurate and reliable. AMB does not audit or otherwise independently verify the accuracy or reliability ofinformation received or otherwise used and therefore all information contained herein is provided “AS IS” without warranty of any kind.Under no circumstances shall AMB have any liability to any person or entity for (a) any loss or damage in whole or in part caused by,resulting from, or relating to, any error (negligent or otherwise) or other circumstance or contingency within or outside the control of AMBor any of its directors, officers, employees or agents in connection with the procurement, collection, compilation, analysis, interpretation,communication, publication or delivery of any such information, or (b) any direct, indirect, special, consequential, compensatory orincidental damages whatsoever (including without limitation, lost profits), even if AMB is advised in advance of the possibility of suchdamages, resulting from the use of or inability to use, any such information. The credit ratings, financial reporting analysis, projections, andother observations, if any, constituting part of the information contained herein are, and must be construed solely as, statements of opinionand not statements of fact or recommendations to purchase, sell or hold any securities, insurance policies, contracts or any other financialobligations, nor does it address the suitability of any particular financial obligation for a specific purpose or purchaser. Credit risk is therisk that an entity may not meet its contractual, financial obligations as they come due. Credit ratings do not address any other risk,including but not limited to, liquidity risk, market value risk or price volatility of rated securities. AMB is not an investment advisor and doesnot offer consulting or advisory services, nor does the company or its rating analysts offer any form of structuring or financial advice. NOWARRANTY, EXPRESS OR IMPLIED, AS TO THE ACCURACY, TIMELINESS, COMPLETENESS, MERCHANTABILITY OR FITNESSFOR ANY PARTICULAR PURPOSE OF ANY SUCH RATING OR OTHER OPINION OR INFORMATION IS GIVEN OR MADE BY AMBIN ANY FORM OR MANNER WHATSOEVER. Each credit rating or other opinion must be weighed solely as one factor in any investmentor purchasing decision made by or on behalf of any user of the information contained herein, and each such user must accordingly makeits own study and evaluation of each security or other financial obligation and of each issuer and guarantor of, and each provider of creditsupport for, each security or other financial obligation that it may consider purchasing, holding or selling.
35