flood inundation modelling of flash floods in steep …orca.cf.ac.uk/104717/1/water-09-00705.pdf ·...
TRANSCRIPT

water
Article
Flood Inundation Modelling of Flash Floods inSteep River Basins and Catchments
Davor Kvocka ID Reza Ahmadian ID and Roger A Falconer ID
Hydro-environmental Research Centre School of Engineering Cardiff University Cardiff CF24 3AA UKahmadianrcardiffacuk (RA) falconerracardiffacuk (RAF) Correspondence kvockadcfacuk
Received 31 July 2017 Accepted 12 September 2017 Published 15 September 2017
Abstract The potential flood inundation extent can be estimated with flood inundation modelswhich can differ in the level of physical and numerical modelling complexity included in the solutionprocedure In recent years several studies have highlighted the benefits of shock-capturing floodinundation models particularly when modelling a high Froude number or supercritical flows or inareas prone to the occurrence of rapidly varying flood events such as flash floods Nonethelessdecision makers are often reluctant to implement more complex modelling tools into practical floodinundation modelling studies unless evidence is provided to establish when such refined modellingtools should be used The main objective of this study was to determine a general threshold value ofthe bottom slope that could be used by decision makers as an orientation guide to ascertain when touse a specific type of flood inundation model The results obtained suggest that in torrential riverbasins or catchments (ie river basins and catchments with a bed slope generally greater than 1)the flood inundation modelling should be conducted by using a flood inundation model that includeshock-capturing algorithms in the model solution procedure
Keywords flood inundation modelling computational hydraulics shock-capturing flood risk riverbasins steep catchments
1 Introduction
Flood risk is expected to increase significantly in the future as a result of climate changean increase in the worldrsquos population and intensified urbanisation in flood-prone areas [1ndash4]Furthermore recent flood events in the UK have led to a comprehensive government review ofnatural flood resilience [5] The key findings provided by the Met Office have indicated uplifts inextreme rainfall intensity of between 20 and 30 for each of the six standard climatological regionsof England and Wales over the next 20ndash30 years Therefore there is a growing need for even moreaccurate flood modelling tools in the future to better manage flood risk
Two-dimensional (2D) flood inundation modelling is nowadays one of the key components of themajority of flood risk assessment and management strategies Such 2D hydrodynamic models canbe divided into three general categories These include [6] (i) models that are based on a simplifiedversion of the 2D shallow water equations (ii) models that solve the full 2D shallow water equationsand (iii) full hydrodynamic 2D models with shock-capturing ability A number of studies have focusedon benchmarking different types of 2D flood inundation models for a range of various test casesandor real flood events [6ndash10] Such studies have outlined the main differences between 2D modelswith different complexities including highlighting the pros and cons of each type of 2D hydrodynamicmodel and generally establishing what level of model sophistication is appropriate for modellingvarious flow conditions
However these research findings often do not significantly influence the practitioner flood riskcommunity This is due to the difference in the perception of flood risks between model developers
Water 2017 9 705 doi103390w9090705 wwwmdpicomjournalwater
Water 2017 9 705 2 of 16
and flood risk practitioners [11ndash14] The researchers generally frame flood risk issues using scientificknowledge and expertise Therefore they assume that more detailed models will generally lead tomore accurate model predictions and thus better decisions can be made [15] On the other handflood risk practitioners generally lack the time and resources to perform complex analyses or toincorporate the results of complex analyses in their decisions [16] Therefore they are often reluctantto adopt more complex modelling procedures (or procedures that they are not familiar with) that aredesirable but which can also increase the complexity of the modelling problem [15]
The main objective of this study was to determine a general threshold value of the bed slope thatcould be used by regulatory authorities and flood risk practitioners as an orientation guide as to when touse a specific type of flood inundation model Three different model configurations of the DIVAST-TVDmodel were considered in this study including (i) a configuration that included a shock-capturingcapability (ie the total variation diminishing (TVD) test case) (ii) a configuration that solved thefull 2D shallow water equations (ie the MacCormack MAC test case) and (iii) a configurationbased on a simplified version of the 2D shallow water equations ie without the advection terms(ie the simplified SI test case) These three model configurations were used to simulate two differentevents including (i) a flood wave propagating along an idealised valley and (ii) a flash flood event ina short steep river basin in Wales UK The results obtained in this study suggest that in a torrentialor flashy river basin or catchment (ie river basins and catchments with a gradient or bed slopegenerally greater than 1) any flood inundation studies should include shock-capturing algorithmsin the model solution procedure However this is an orientation threshold value and therefore furtherresearch is needed to propose more detailed modelling guidelines
2 Study Areas
21 Idealised Valley
The idealised valley consisted of a trapezoidal channel (14 m wide and 1 m deep) and two adjacentfloodplains that were each 100 m wide The overall length of the idealised valley was 2000 m with thevalley being divided into two 1000 m reaches The upper reach (ie the first 1000 m) had a differentbed slope for each test case with the bed slope varying from S = 0001 to S = 01 For the lower reach(ie the second 1000 m) the bed slope remained nearly horizontal (ie S = 0001) for every test caseFinally there was a 100 m long and 2 m deep reservoir at the end of the idealised valley (see Figure 1)
The idea behind the design of this test case was to mimic the propagation of a flash flood ina short and steep river basin Flash floods generally occur due to a unique and complex combinationof meteorological hydrological and topographical conditions [17] Intense precipitation is usuallyconsidered as the main factor in the generation of flash floods [18] However the steepness of theterrain often plays as an important role due to its (i) orographic effects that augment precipitationand (ii) promotion of the rapid concentration and propagation of stream flow [19] Therefore shortand steep river basin valleys or catchments are a characteristic feature of many areas prone to flashflooding such as much of Wales and the south-east of England in the UK the Mediterranean region(eg Greece France Spain) Central Europe (eg Slovenia Slovakia Austria) etc [19ndash21]
The idealised valley computational domain was divided into square cells with each cell havinga plan-form area of 1 m2 An inflow boundary was set as the upstream boundary conditionwith a sinusoidal hydrograph being used to represent a flood wave of the form [22]
Q = qpsin(π
Tt)
(1)
where qp is the unit-width peak discharge T is the duration of flooding and t is the time step
Water 2017 9 705 3 of 16Water 2017 9 705 3 of 16
Figure 1 Schematic illustration of the idealised valley including (a) the cross-section and (b) the longitudinal section
In this study the value of qp was set to 150 m3s and T was set to 4 h Therefore the hydrograph used as a boundary input had a relatively high peak discharge (considering the dimensions of the main channel and the valley) a short time-to-peak (ie 2 h) and the overall flood duration was also generally short (ie 4 h) The idea behind the construction of this hydrograph was to mimic the general characteristics of an extreme flash flood event [1920] The downstream boundary was set at the end of the reservoir and a prescribed water level was specified as the downstream boundary condition The main channel was assigned a Manningrsquos roughness coefficient of 004 while the floodplains were assigned a Manningrsquos roughness coefficient of 005 The selection of these roughness values was based on the roughness parameters applied in the second study case considered in this study
22 Borth (Wales UK)
Borth is a coastal village and holiday seaside resort in west Wales UK with many caravan and camping sites located in the surrounding region (see Figure 2a) It is located at the end of the relatively small and generally steep River Leri catchment which is prone to flash flooding [21] The most recent flash flood occurred on 9 June 2012 which flooded Borth and the nearby villages of Dol-y-bont and Tal-y-bont Around 60 properties and tens of caravans were flooded around Borth Furthermore a relatively large number of people were evacuated from flooded properties in Tal-y-bont and the caravan sites near Dol-y-bont [2324] There was a general perception that the 2012 flash flood was one of the severest in history due to extensive media coverage However the post-flood study revealed that the magnitude of this flood event was more common than first thought It was estimated that the return period for this flood event was between 50 and 80 years [21]
Figure 1 Schematic illustration of the idealised valley including (a) the cross-section and (b) thelongitudinal section
In this study the value of qp was set to 150 m3s and T was set to 4 h Therefore the hydrographused as a boundary input had a relatively high peak discharge (considering the dimensions of themain channel and the valley) a short time-to-peak (ie 2 h) and the overall flood duration was alsogenerally short (ie 4 h) The idea behind the construction of this hydrograph was to mimic the generalcharacteristics of an extreme flash flood event [1920] The downstream boundary was set at the endof the reservoir and a prescribed water level was specified as the downstream boundary conditionThe main channel was assigned a Manningrsquos roughness coefficient of 004 while the floodplains wereassigned a Manningrsquos roughness coefficient of 005 The selection of these roughness values was basedon the roughness parameters applied in the second study case considered in this study
22 Borth (Wales UK)
Borth is a coastal village and holiday seaside resort in west Wales UK with many caravan andcamping sites located in the surrounding region (see Figure 2a) It is located at the end of the relativelysmall and generally steep River Leri catchment which is prone to flash flooding [21] The most recentflash flood occurred on 9 June 2012 which flooded Borth and the nearby villages of Dol-y-bont andTal-y-bont Around 60 properties and tens of caravans were flooded around Borth Furthermorea relatively large number of people were evacuated from flooded properties in Tal-y-bont and thecaravan sites near Dol-y-bont [2324] There was a general perception that the 2012 flash flood was oneof the severest in history due to extensive media coverage However the post-flood study revealedthat the magnitude of this flood event was more common than first thought It was estimated that thereturn period for this flood event was between 50 and 80 years [21]
The Borth study domain was 9 km long 7 km wide and covered a relatively wide area aroundBorth and the villages of Dol-y-bont and Tal-y-bont (see Figure 2b) The 2 m LiDAR (Light Detectionand Ranging) data were used to set up a computational hydraulics model A rectangular grid wasconsidered in this study and the computational domain was thus divided into nearly 16 million squarecells The upstream boundary was set as an inflow boundary for the River Leri and the River Ceulannear Tal-y-bont The estimated peak discharge for the River Leri at Dol-y-bont for the 2012 flashflood was around 80 m3s [21] However there were no estimates of the discharges further upstream(ie Tal-y-bont) which could be used as inflow boundaries in this study
Water 2017 9 705 4 of 16Water 2017 9 705 4 of 16
Figure 2 The village of Borth (a) (Retrieved from httpwwwjanetbaxterphotographycouk) and the Borth study domain (b) (adopted from Google Maps)
The Borth study domain was 9 km long 7 km wide and covered a relatively wide area around Borth and the villages of Dol-y-bont and Tal-y-bont (see Figure 2b) The 2 m LiDAR (Light Detection and Ranging) data were used to set up a computational hydraulics model A rectangular grid was considered in this study and the computational domain was thus divided into nearly 16 million square cells The upstream boundary was set as an inflow boundary for the River Leri and the River Ceulan near Tal-y-bont The estimated peak discharge for the River Leri at Dol-y-bont for the 2012 flash flood was around 80 m3s [21] However there were no estimates of the discharges further upstream (ie Tal-y-bont) which could be used as inflow boundaries in this study
Therefore a 1100-year flood event was simulated in this study with the estimated peak discharge values for the River Leri and River Ceulan being 645 m3s and 191 m3s These peak discharge values yield to a similar peak discharge value for the River Leri at Dol-y-bont as it was estimated for the 2012 flash flood This meant that a general comparison could be made of the flood depths predicted in this study and the flood depths observedestimated for the 2012 flash flood The downstream boundary was set in the Dyfi estuary and a prescribed water level was specified as the downstream boundary condition The elevation conditions in the Dyfi estuary are governed by the tide However there were no reports suggesting that the tide had any effect on the actual flood levels further inland (eg around Borth) during the 2012 flash flood Therefore it was not deemed to be necessary to include a time-varying tide in the model
The selection of roughness parameters was based on a site-survey conducted by the authors and on the roughness values proposed in a previous study conducted for Natural Resources Wales Based on this survey the floodplains were assigned a roughness value of 005 while the natural river channel was assigned a roughness value of 004 A post-flood survey was conducted almost immediately after the flood in 2012 by Ceredigion County Council [24] The aim of the survey was to inspect what damage had been done to hydraulic structures (eg culverts and bridges) by the flood The survey did not find any evidences of damages blockages or channel obstructions Therefore it was assumed that there was no need to specifically model any hydraulic structures in the numerical model (eg limited propagation of the flow due to blockage etc) However such an assumption should be made carefully as hydraulic structures can have an important impact on the flooding phenomenon in the surrounding area such as during the 2004 Boscastle flash flood [10]
3 Numerical Model
The DIVAST-TVD model is a shock-capturing flood inundation model which was developed by Liang et al [25] This numerical model combines the standard MacCormack scheme with a symmetric five-point total variation diminishing (TVD) term Total variation diminishing schemes
Figure 2 The village of Borth (a) (Retrieved from httpwwwjanetbaxterphotographycouk) and theBorth study domain (b) (adopted from Google Maps)
Therefore a 1100-year flood event was simulated in this study with the estimated peak dischargevalues for the River Leri and River Ceulan being 645 m3s and 191 m3s These peak dischargevalues yield to a similar peak discharge value for the River Leri at Dol-y-bont as it was estimated forthe 2012 flash flood This meant that a general comparison could be made of the flood depths predictedin this study and the flood depths observedestimated for the 2012 flash flood The downstreamboundary was set in the Dyfi estuary and a prescribed water level was specified as the downstreamboundary condition The elevation conditions in the Dyfi estuary are governed by the tide Howeverthere were no reports suggesting that the tide had any effect on the actual flood levels further inland(eg around Borth) during the 2012 flash flood Therefore it was not deemed to be necessary toinclude a time-varying tide in the model
The selection of roughness parameters was based on a site-survey conducted by the authorsand on the roughness values proposed in a previous study conducted for Natural Resources WalesBased on this survey the floodplains were assigned a roughness value of 005 while the naturalriver channel was assigned a roughness value of 004 A post-flood survey was conducted almostimmediately after the flood in 2012 by Ceredigion County Council [24] The aim of the survey was toinspect what damage had been done to hydraulic structures (eg culverts and bridges) by the floodThe survey did not find any evidences of damages blockages or channel obstructions Therefore it wasassumed that there was no need to specifically model any hydraulic structures in the numerical model(eg limited propagation of the flow due to blockage etc) However such an assumption should bemade carefully as hydraulic structures can have an important impact on the flooding phenomenon inthe surrounding area such as during the 2004 Boscastle flash flood [10]
3 Numerical Model
The DIVAST-TVD model is a shock-capturing flood inundation model which was developedby Liang et al [25] This numerical model combines the standard MacCormack scheme witha symmetric five-point total variation diminishing (TVD) term Total variation diminishing schemesprevent the emergence of numerical oscillations through added non-linear artificial dissipationterms [26] This makes such schemes applicable to cases that could involve discontinuities in the modelsolution (eg flash floods dam breaks etc) The model is explained briefly below for completenesswhile more detailed information about the model development and verifications can be found in theliterature [7102527ndash29]
Water 2017 9 705 5 of 16
By neglecting the Coriolis wind and viscous forces the shallow water equations can be written inthe following form
partη
partt+
partqx
partx+
partqy
party= 0 (2)
partqx
partt+
part(
βq2x
H
)partx
+part(
βqxqyH
)party
= minusgHpartζ
partxminus
gqx
radicq2
x + q2y
H2C2 (3)
partqy
partt+
part(
βqxqyH
)partx
+
part
(βq2
yH
)party
= minusgHpartζ
partyminus
gqy
radicq2
x + q2y
H2C2 (4)
where t is the time η is the water surface elevation above the still water datum qx and qy arethe discharge per unit width in the x and y directions β is the momentum correction factor fora non-uniform vertical velocity profile g is gravitational acceleration H = h + η is the total watercolumn depth (where h is the depth below the still water datum) and C is the Chezy roughnesscoefficient (generally evaluated in terms of a Manning coefficient where C = R16n with R being thehydraulic radius and n the Manning roughness coefficient)
The conservative form of the shallow water equations is usually deployed to ensure theconservation of mass and momentum after the discretisation of equations Following Rogers et al [30]Equations (2)ndash(4) can be rearranged in the following conservative form
partXpartt
+partFpartx
+partGparty
= S + T (5)
X =
η
qx
qy
F =
qx
βq2x
h+η + gη2
2 + ghηβqxqyh+η
G =
qy
βqxqyh+η
βq2y
h+η + gη2
2 + ghη
S =
0
gη parthpartx minus
gqx
radicq2
x+q2y
(h+η)2C2
0
T =
00
gη parthparty minus
gqy
radicq2
x+q2y
(h+η)2C2
(6)
Using the Strang operator-splitting technique [31] the solution to Equation (5) is obtained bysolving two one-dimensional problems
partXpartt
+partFpartx
= S (7)
partXpartt
+partGparty
= T (8)
For a regular rectangular grid as used in this study the explicit discretisation ofEquations (7) and (8) can be written as
Xn+1ij = LxXn
ij (9)
Xn+1ij = LyXn
ij (10)
where Lx and Ly are the finite-difference operators and the subscript and the superscript for X denotethe corresponding grid cell location and time level
Water 2017 9 705 6 of 16
In the DIVAST-TVD model the MacCormack TVD scheme is utilised to solve consecutively thetwo one-dimensional hyperbolic equations at each time step For example the discretisation schemefor Equation (9) is given as
Xpi = Xn
i minus(Fn
i minus Fniminus1)middot ∆t∆x
+ Snmiddot∆t (11)
Xci = Xn
i minus(
Fpi+1 minus Fp
i
)middot ∆t∆x
+ Spmiddot∆t (12)
Xn+1i =
12
(Xp
i + Xci
)+ TVDn
i (13)
where the superscripts p and c denote the predictor and corrector steps ∆x is the grid size ∆t is thetime step and TVDn
i is a TVD term appended to the corrector step of the MacCormack scheme toprevent the emergence of non-physical oscillations near the sharp gradient regions defined as
TVDni =
[G(r+i)+ G
(rminusi+1
)]middot∆Xn
i+12 minus[
G(
r+iminus1
)+ G
(rminusi)]middot∆Xn
iminus12 (14)
where G is a function dependent on the wave speed direction and flux limiter function and r valuesare dependent on the gradients around the solution cell
4 Methodology
Different types of flood inundation models would need to be considered in order to reach themain objective of this study However one of the major problems when comparing different codes isto enable consistent testing conditions Different numerical codes can treat some of the key modellingprocesses differently such as wetting and drying implementation of boundary conditions frictionestimation source terms etc This can alter simulation results before different numerical schemesor the level of physical complexity is taken into account [9] The problem can be avoided by usinga single numerical code Therefore all simulations within this study were conducted by using differentconfigurations of the DIVAST-TVD flood inundation model The use of a single code enabled equitabletesting conditions as all simulations were conducted using the same model parameters such as thesame time step roughness parameters boundary conditions and numerical scheme
Three different configurations of the DIVAST-TVD model were considered in this study including
bull a configuration that included shock-capturing ability (ie the TVD test case)bull a configuration that solved the full 2D shallow water equations (ie the MAC test case)bull a configuration based on a simplified version of the 2D shallow water equations that excluded the
advection terms (ie the SI test case)
In the TVD test case the full shock-capturing ability of the DIVAST-TVD model was includedThis meant that the model worked on the principle of solving the full hydrodynamic 2D model withthe ability of shock-capturing In the MAC test case the shock-capturing ability of the DIVAST-TVDmodel was excluded ie TVDn
i term was excluded (eg see Equation (13)) This meant that the modelworked on the principle of solving only the full hydrodynamic 2D model In the SI test case both theTVDn
i term and the advection terms were excluded Therefore the model worked on the principleadopted in many reduced complexity and rapid assessment flood inundation models
This study considered flood events that are characterised by a high Froude number andsupercritical flows and sudden changes in the flow regime (eg hydraulic jumps) The applicationof full hydrodynamic 2D solvers to model such flows often results in unstable model solution andoscillatory results [10] Even if the model can produce a stable solution such a solution may notrepresent properly the conservation of mass and momentum in the regions where sudden changes inin the flow regime occur [32] The oscillations (or instabilities) in the model solution are caused bythe advection terms in the shallow water equations This being the case a simple modification wasapplied to the MAC solution method to improve on the model stability
Water 2017 9 705 7 of 16
The modification to the MAC solution method was based on the reduction of the value of themomentum correction factor β (see Equations (3) and (4)) The momentum correction factor β was(i) reduced to 05 when the Froude number was between 05 and 075 (ii) reduced to 025 when theFroude number was between 075 and 1 and (iii) was set to 0 when the Froude number was equalor greater than 1 This simple modification can vastly improve numerical stability as flows becomesupercritical However it also reduces the accuracy of the model predictions due to the reduction inthe magnitude of the advection terms Nonetheless such modifications are applied in commercialmodels (eg Flood Modeller Pro etc) and thus widely used by flood risk practitioners
The main assumption of this study was that as the bed slope becomes steeper and consequentlyflow characteristics become more volatile the difference in the model predictions between thethree codes considered would increase accordingly More precisely it was expected that the modelconfiguration which included shock-capturing ability (ie the TVD test case) would be best ableto produce generally realistic predictions for steep slopes and consequently rapidly varying flowconditions whereas the other two model configurations (ie the MAC and SI test case) would beless accurate
5 Results and Discussion
51 Idealised Valley Test Case
Figure 3 shows the maximum water depths as predicted by the TVD MAC and SI modelconfigurations for different variations of the idealised valley test case These water depth predictionswere recorded in the middle of the floodplains and along the entire length of the idealised valleyIn addition the dashed line in the middle of the each of the smaller figures indicates the boundarybetween the upper and lower section of the idealised valley ie where the value of the bed slopechanged In addition all simulations were run on Cardiff Universityrsquos supercomputer and weregenerally completed in less than 15 min
It can be seen in Figure 3 that there was practically no difference in the model predictions betweenthe three considered model configurations when the value of the bed slope in the upper part of theidealised valley was less than 15 When the value of the bed slope in the upper part of the idealisedvalley was set to 2 then the predictions from the MAC and SI configurations started to differ morenoticeably from the TVD model configuration The difference in the water depth predictions betweenthe TVD and the other two model configurations was even more significant with a further increase inthe value of the bed slope in the upper part of the idealised valley This can be readily observed fromTable 1 which shows the average difference in the water depth predictions between the MAC andTVD and SI and TVD test cases expressed in terms of percentage errors
Table 1 Average difference in water depth predictions between the MAC and TVD and SI and TVDmodel configurations for the idealised valley test case expressed in terms of percentage errors
Bed SlopeAverage Difference in the Water Depth Prediction
MAC vs TVD SI vs TVD
S = 001 147 262S = 0015 372 1787S = 002 2537 8784
S = 0025 7566 6425S = 005 23510 22751S = 01 31665 50992
Water 2017 9 705 8 of 16
Water 2017 9 705 8 of 16
Figure 3 Predicted maximum water depths for the TVD MAC and SI test cases for different variations of the idealised valley test case
The results presented in Figure 3 indicate that only shock-capturing (or similar) flood inundation models can produce numerically realistic water depth predictions in steep river basins or catchments Steep river basins or catchments are often characterised by high velocity and high Froude number flows These can cause numerical instabilities in the model solution of the simplified 2D and full hydrodynamic 2D models with a conventional solution procedure and consequently lead to inaccurate model predictions [691033] For example Figure 4 shows the predicted maximum Froude numbers for the different configurations of the idealised valley test case It can be seen in Figure 4 that Froude numbers in the upper part of the valley became higher with increasing bed slopes On the other hand the Froude numbers remained generally the same in the nearly horizontal lower part of the valley for all test cases
When the predicted maximum Froude numbers in Figure 4 are compared with the results presented in Figure 3 it can be seen that the MAC and SI model configurations predicted much more realistic water depths where the Froude numbers were relatively low In contrast the MAC and SI
Figure 3 Predicted maximum water depths for the TVD MAC and SI test cases for different variationsof the idealised valley test case
The results presented in Figure 3 indicate that only shock-capturing (or similar) flood inundationmodels can produce numerically realistic water depth predictions in steep river basins or catchmentsSteep river basins or catchments are often characterised by high velocity and high Froude numberflows These can cause numerical instabilities in the model solution of the simplified 2D and fullhydrodynamic 2D models with a conventional solution procedure and consequently lead to inaccuratemodel predictions [691033] For example Figure 4 shows the predicted maximum Froude numbersfor the different configurations of the idealised valley test case It can be seen in Figure 4 that Froudenumbers in the upper part of the valley became higher with increasing bed slopes On the other handthe Froude numbers remained generally the same in the nearly horizontal lower part of the valley forall test cases
When the predicted maximum Froude numbers in Figure 4 are compared with the resultspresented in Figure 3 it can be seen that the MAC and SI model configurations predicted muchmore realistic water depths where the Froude numbers were relatively low In contrast the MAC and
Water 2017 9 705 9 of 16
SI model configurations predicted highly unrealistic results in the steeper part of the idealised valleywhere the Froude numbers were generally high For this simple case the obtained results indicate thatreduced complexity and full hydrodynamic 2D models were generally as accurate as shock-capturingflood inundations models when the bed slope was generally less than 15 When the slope wasgenerally greater than 15 only the model configuration that included shock-capturing capabilityproduced numerically realistic water depth predictions
These results are particularly interesting when one considers how river streamscatchmentsare generally divided according to the value of the bed slope In particular rivers are often definedas having a bed slope that is less than 1 torrential rivers have a bed slope ranging from 1 to 6and finally streams are often referred to as torrents when the bed slope is greater than 6 [34]This means that the value of the bed slope that is used to distinguish between a river and a torrentialriver (ie river and torrential catchments) is similar to the value of the bed slope at which the waterdepth predictions from the considered three model configurations started to differ more significantly
Furthermore torrential catchments are small in size (ie typically less than 100 km2) characterisedby a steep terrain and susceptible to the occurrence of sudden short and violent flood events [34]However these are also the characteristic features of catchments prone to flash flooding [19]with shock-capturing flood inundation models already identified as the most appropriate type of floodinundation models for modelling in such areas [10] All in all the results obtained for the idealisedvalley test case suggest that in torrential or flashy river basins and catchments (ie where the slopeis generally greater than 1) any flood inundation modelling should be undertaken using floodinundations models with a shock-capturing (or similar) capability
Water 2017 9 705 9 of 16
model configurations predicted highly unrealistic results in the steeper part of the idealised valley where the Froude numbers were generally high For this simple case the obtained results indicate that reduced complexity and full hydrodynamic 2D models were generally as accurate as shock-capturing flood inundations models when the bed slope was generally less than 15 When the slope was generally greater than 15 only the model configuration that included shock-capturing capability produced numerically realistic water depth predictions
These results are particularly interesting when one considers how river streamscatchments are generally divided according to the value of the bed slope In particular rivers are often defined as having a bed slope that is less than 1 torrential rivers have a bed slope ranging from 1 to 6 and finally streams are often referred to as torrents when the bed slope is greater than 6 [34] This means that the value of the bed slope that is used to distinguish between a river and a torrential river (ie river and torrential catchments) is similar to the value of the bed slope at which the water depth predictions from the considered three model configurations started to differ more significantly
Furthermore torrential catchments are small in size (ie typically less than 100 km2) characterised by a steep terrain and susceptible to the occurrence of sudden short and violent flood events [34] However these are also the characteristic features of catchments prone to flash flooding [19] with shock-capturing flood inundation models already identified as the most appropriate type of flood inundation models for modelling in such areas [10] All in all the results obtained for the idealised valley test case suggest that in torrential or flashy river basins and catchments (ie where the slope is generally greater than 1) any flood inundation modelling should be undertaken using flood inundations models with a shock-capturing (or similar) capability
Figure 4 Predicted maximum Froude numbers for different variations of the idealised valley test case
Figure 4 Predicted maximum Froude numbers for different variations of the idealised valley test case
Water 2017 9 705 10 of 16
52 Flood Inundation Modelling around Borth
All simulations were run on Cardiff Universityrsquos supercomputer The TVD simulation case wascompleted in seven days whereas the MAC and SI simulation case were completed in around five daysThe predicted maximum water depths from the three considered model configurations were comparedat several monitoring points around Tal-y-bont Dol-y-bont and Borth (see Figure 5) It was possible toestimate the maximum flood levels for the 2012 flash flood for several of these locations due to extensivemedia reports These observationsestimations of the actual flood depths for the 2012 River Leri flashflood allowed for some level of validation of the modelling results The observedestimated floodlevels for the 2012 River Leri flash flood are summarised in Table 2
Water 2017 9 705 10 of 16
52 Flood Inundation Modelling around Borth
All simulations were run on Cardiff Universityrsquos supercomputer The TVD simulation case was completed in seven days whereas the MAC and SI simulation case were completed in around five days The predicted maximum water depths from the three considered model configurations were compared at several monitoring points around Tal-y-bont Dol-y-bont and Borth (see Figure 5) It was possible to estimate the maximum flood levels for the 2012 flash flood for several of these locations due to extensive media reports These observationsestimations of the actual flood depths for the 2012 River Leri flash flood allowed for some level of validation of the modelling results The observedestimated flood levels for the 2012 River Leri flash flood are summarised in Table 2
Figure 5 Approximate locations of the selected monitoring points around Tal-y-bont Dol-y-bont and Borth (adopted from Google maps)
Figure 6 shows the predicted maximum water depths at the selected monitoring points for the TVD MAC and SI model configurations It can be seen in Figure 6 that the TVD model configuration matched the observedestimated flood depth data most accurately whereas the MAC and SI model configurations were less accurate This can be more readily observed from Table 3 which shows the difference in water depth predictions between the simulated results and the estimatedobserved values for the Borth study case expressed in terms of percentage errors The greatest difference between the simulated results can be observed in the steepest part of the domain (ie Tal-y-bont) while the differences are smaller in the flatter parts of the domain (eg Dol-y-bont) As it was shown for the idealised valley test case steep river basins are often characterised by high velocity and high Froude number flows Such flow conditions usually cause numerical instabilities in the model
Figure 5 Approximate locations of the selected monitoring points around Tal-y-bont Dol-y-bont andBorth (adopted from Google maps)
Figure 6 shows the predicted maximum water depths at the selected monitoring points for theTVD MAC and SI model configurations It can be seen in Figure 6 that the TVD model configurationmatched the observedestimated flood depth data most accurately whereas the MAC and SI modelconfigurations were less accurate This can be more readily observed from Table 3 which showsthe difference in water depth predictions between the simulated results and the estimatedobservedvalues for the Borth study case expressed in terms of percentage errors The greatest differencebetween the simulated results can be observed in the steepest part of the domain (ie Tal-y-bont)while the differences are smaller in the flatter parts of the domain (eg Dol-y-bont) As it was shownfor the idealised valley test case steep river basins are often characterised by high velocity andhigh Froude number flows Such flow conditions usually cause numerical instabilities in the modelsolution of simplified 2D and full hydrodynamic 2D models and consequently result in erroneousmodel predictions
Water 2017 9 705 11 of 16
Table 2 The observedestimated flood levels for the 2012 River Leri flash flood
Monitoring Point ObservedEstimated Depth Source
5 05 m Picture [2335]12 12 m Eye-witness account [23]17 12 m Eye-witness account [36]18 03 m Picture (Retrieved from httpwwwalanannacouk)19 03 m Picture (Retrieved from httpwwwalanannacouk)20 03 m Picture (Retrieved from httpwwwalanannacouk)24 05 m Picture [37]25 05 m Picture [38]27 03 m Picture (Retrieved from httpwwwalanannacouk)
Water 2017 9 705 11 of 16
solution of simplified 2D and full hydrodynamic 2D models and consequently result in erroneous model predictions
Table 2 The observedestimated flood levels for the 2012 River Leri flash flood
Monitoring Point ObservedEstimated Depth Source5 05 m Picture [2335] 12 12 m Eye-witness account [23] 17 12 m Eye-witness account [36] 18 03 m Picture (Retrieved from httpwwwalanannacouk) 19 03 m Picture (Retrieved from httpwwwalanannacouk) 20 03 m Picture (Retrieved from httpwwwalanannacouk) 24 05 m Picture [37] 25 05 m Picture [38] 27 03 m Picture (Retrieved from httpwwwalanannacouk)
Figure 6 Predicted maximum water depths at the selected monitoring points for the TVD MAC and SI model configurations
Table 3 The difference in water depth predictions between the simulated results and the estimatedobserved values for the Borth study case expressed in terms of percentage errors
Monitoring Point TVD MAC SI5 1075 1810 20726
12 271 3815 2705 17 232 1806 2768 18 1655 4743 4722 19 767 7037 7080 20 1445 6786 6476 24 1958 10000 7837 25 1342 6131 2396 27 683 3107 1699
For example Figure 7 shows the predicted maximum Froude numbers in the areas around Tal-y-bont Dol-y-bont and Borth It can be seen in Figure 7 that the supercritical flow conditions occurred throughout the area around Tal-y-bont This was as expected since the average value of the bed slope for the River Leri around Tal-y-bont is well above 1 The volatile flow conditions led to the
Figure 6 Predicted maximum water depths at the selected monitoring points for the TVD MAC andSI model configurations
Table 3 The difference in water depth predictions between the simulated results and theestimatedobserved values for the Borth study case expressed in terms of percentage errors
Monitoring Point TVD MAC SI
5 1075 1810 2072612 271 3815 270517 232 1806 276818 1655 4743 472219 767 7037 708020 1445 6786 647624 1958 10000 783725 1342 6131 239627 683 3107 1699
For example Figure 7 shows the predicted maximum Froude numbers in the areas aroundTal-y-bont Dol-y-bont and Borth It can be seen in Figure 7 that the supercritical flow conditionsoccurred throughout the area around Tal-y-bont This was as expected since the average value of thebed slope for the River Leri around Tal-y-bont is well above 1 The volatile flow conditions led to theoccurrence of numerical instabilities in the model solution of the MAC and SI model configurationsThis resulted in erroneous water depth predictions in the area around Tal-y-bont for the MAC and SI
Water 2017 9 705 12 of 16
model configurations On the contrary the TVD model configuration did not experience numericalinstabilities due to the shock-capturing capability Therefore the TVD configuration produced themost realistic flood depth predictions in the area around Tal-y-bont (see Figure 6)
Figure 7 also shows that the occurrence of supercritical flow conditions was less frequent in thearea around Dol-y-bont when compared to the area around Tal-y-bont This was again as expectedsince the average value of the bed slope for the River Leri at Dol-y-bont is around 06 Thereforethe flow conditions around Dol-y-bont were less volatile than the flow conditions further upstreamaround Tal-y-bont This meant that the MAC and SI model configurations were less susceptible to theemergence of numerical instabilities in the solution procedure Thus these two model configurationspredicted more realistic flood depths in the area around Dol-y-bont than they did in the area aroundTal-y-bont (see Figure 6)
Water 2017 9 705 12 of 16
occurrence of numerical instabilities in the model solution of the MAC and SI model configurations This resulted in erroneous water depth predictions in the area around Tal-y-bont for the MAC and SI model configurations On the contrary the TVD model configuration did not experience numerical instabilities due to the shock-capturing capability Therefore the TVD configuration produced the most realistic flood depth predictions in the area around Tal-y-bont (see Figure 6)
Figure 7 also shows that the occurrence of supercritical flow conditions was less frequent in the area around Dol-y-bont when compared to the area around Tal-y-bont This was again as expected since the average value of the bed slope for the River Leri at Dol-y-bont is around 06 Therefore the flow conditions around Dol-y-bont were less volatile than the flow conditions further upstream around Tal-y-bont This meant that the MAC and SI model configurations were less susceptible to the emergence of numerical instabilities in the solution procedure Thus these two model configurations predicted more realistic flood depths in the area around Dol-y-bont than they did in the area around Tal-y-bont (see Figure 6)
Figure 7 Predicted maximum Froude numbers around Tal-y-bont Dol-y-bont and Borth
It can also be seen in Figure 7 that the flow conditions were relatively mild around Borth with the maximum Froude number generally being less than 05 This was also as expected since the terrain around Borth is nearly horizontal Therefore it would be reasonable to assume that the difference between the model predictions should be the smallest in this area For example Table 4 shows the average difference in the water depth predictions between the MAC and TVD and SI and TVD test cases at the selected monitoring points in the Borth study domain It can be again seen in Table 4 that the greatest difference in the model predictions occurred where the gradient was steep and the smallest where the gradient was mild However Table 4 also outlines the main differences between
Figure 7 Predicted maximum Froude numbers around Tal-y-bont Dol-y-bont and Borth
It can also be seen in Figure 7 that the flow conditions were relatively mild around Borth with themaximum Froude number generally being less than 05 This was also as expected since the terrainaround Borth is nearly horizontal Therefore it would be reasonable to assume that the differencebetween the model predictions should be the smallest in this area For example Table 4 shows theaverage difference in the water depth predictions between the MAC and TVD and SI and TVD testcases at the selected monitoring points in the Borth study domain It can be again seen in Table 4that the greatest difference in the model predictions occurred where the gradient was steep and thesmallest where the gradient was mild However Table 4 also outlines the main differences between
Water 2017 9 705 13 of 16
the simplified and full hydrodynamic 2D solvers when modelling flood events with a high Froudenumber or supercritical flows
Table 4 Average difference in water depth predictions between the MAC and TVD and SI and TVDmodel configurations at the selected monitoring points in the Borth study domain
Bed SlopeAverage Difference in the Water Depth Prediction
MAC vs TVD SI vs TVD
S gt 001 409 cm 990 cm001 gt S gt 0001 259 cm 262 cm
S asymp 0001 236 cm 87 cm
As discussed earlier flow conditions were particularly volatile in the steeper parts of thedomain (see Figure 7) This meant for example that the full 2D hydrodynamic model would havemajor difficulties in preserving the peak flood wave along the entire modelling reach due to theadvection terms As indicated earlier advection terms can cause numerical instabilities when full2D hydrodynamic schemes are used to model high Froude number or supercritical flows The rise ofnumerical instabilities generally lead to erroneous predictions in the areas where the gradients aresteep (see Figure 6) and usually result in the dissipation of the peak flood wave This means that suchmodels would thus be prone to under-predict flood levels in the areas further downstream where thegradients are less steep This course of events can also be observed in this study for the MAC modelconfiguration (eg see Figure 6 for the Borth area)
The simplified 2D models (eg the SI configuration in this study) generally also have difficulties inpreserving the peak flood wave along the entire modelling reach that includes areas characterised by ahigh Froude number or supercritical flows For example the SI model configuration did not include theadvection terms which significantly increased the numerical stability However the complete exclusionof advection terms reduces the accuracy of the model predictions This is particularly evident in areascharacterised by a high Froude number or supercritical flows For example the SI model configurationgreatly over-predicted the peak flood levels in the steepest parts of the domain (eg see Figure 6 forthe Tal-y-bont area) where the flow conditions were the most volatile (see Figure 7) On the other handthe SI model configuration predicted (numerically) more accurate flood depths in the flatter parts ofthe domain (eg see Figure 6 for the Borth area) The flow conditions in this area were generally mild(see Figure 7) Thus decreased physical complexity in the model solution had less of an impact on theaccuracy of the SI model predictions
Simplified and full hydrodynamic 2D models can produce accurate model predictions for floodscenarios that include a high Froude number or supercritical flows if these flows are not dominantduring the simulation process [939] For such studies model instability can be reduced by artificiallyimproving modelling results eg introducing a small patch of high roughness to slow water downin the problematic areas [32] However such procedures are not generic and should be applied withcaution because the level of such improvements is based on the modellerrsquos perception of how muchfine-tuning is needed [1032]
Finally simplified and full hydrodynamic 2D models can produce (to some extent) realistic floodlevel predictions for rapidly varying flood events if there exists quality validation data that canbe used to fine-tune the models However quality validation and calibration data for flood eventsoccurring in steep catchments (eg flash floods) are generally scarce [40] Therefore the physicaland mathematical complexity in the model solution is particularly important for studies conductedin torrential river basins and catchments because the validation of the modelling results is oftenimpossible Thus shock-capturing models are more appropriate for such flood studies as these modelscan produce (numerically) accurate predictions for high Froude numbers or supercritical flows withoutany additional modification or improvements of the modelling procedure
Water 2017 9 705 14 of 16
6 Conclusions
In this paper we have investigated the threshold value of the bed slope that could stand asan orientation guide as to when to use a specific type of flood inundation model Three differentmodel configurations of the DIVAST-TVD model were considered in this study (i) a configuration thatincluded a shock-capturing ability (ie the TVD test case) (ii) a configuration that solved the full 2Dshallow water equations (ie the MAC test case) and (iii) a configuration based on a simplified versionof the 2D shallow water equations (ie the SI test case) The three considered model configurationswere used to model two different flood events ie a flood wave propagating along an idealised valleyand a flash flood event in Wales UK
The results obtained indicate that in torrential or flashy river basins or catchments (ie riverbasins and catchments with a stream gradient generally greater than 1) flood inundation modellingshould be undertaken using flood inundation models with shock-capturing (or similar) capabilitySteep catchments are prone to the occurrence of high Froude numbers and supercritical flowsSuch flow conditions usually cause numerical instabilities (eg spurious oscillations) in the modelsolution of simplified 2D and full hydrodynamic 2D models These instabilities can lead to the dissipationof the peak flood wave and consequently to erroneous model predictions Even though flood inundationmodels with shock-capturing (or similar) capabilities are generally more computationally expensivethese models prevent the occurrence of numerical instabilities and thus prevent the dissipation of theflood wave Therefore such models can predict (numerically) accurate flood levels for flood eventscharacterised by high Froude numbers or supercritical flows such as floods occurring in steep riverbasins and catchments (eg flash floods)
This paper proposes an orientation value of the bed slope (ie 1) that can be used as a guideas when to use a specific type of flood inundation model Therefore further research is needed todevelop more detailed modelling guidelines for steep river basins and catchments Future research willinclude more rigorous testing conditions and more complex modelling environments As indicatedwithin this paper modelling in steep river basins is faced with many difficulties eg a lack of qualitydata etc Therefore future research would also benefit from closer cooperation between academicresearchers regulatory authorities and flood risk practitioners which would enable more efficientsharing of information data and practical experience All these would help in easier development andlater implementation of the state-of-the-art modelling techniques to the practical hydro-environmentalengineering community
Acknowledgments This research project was supported by an Engineering and Physical Sciences ResearchCouncil (EPSRC) Impact Acceleration grant The topographical and hydrological data for the Borth study wereprovided by Natural Resources Wales (NRW) The contribution of these organisations is gratefully acknowledgedThe authors would also like to thank Thomas Green from Advance Research ComputingmdashCardiff University(ARCCA) for his assistance in using the Universityrsquos high-performance computing facilities
Author Contributions Davor Kvocka was the Research Associate on the project and set-up the model applicationsand undertook the studies including assessing the conditions under which shock-capturing algorithms need tobe included Roger A Falconer and Reza Ahmadian have been leading a wide range of research projects in floodrisk modelling and were instrumental in developing the original models Davor Kvocka drafted the manuscriptwhich was refined by all authors
Conflicts of Interest The authors declare no conflict of interest The founding sponsors had no role in the designof the study in the collection analyses or interpretation of data in the writing of the manuscript and in thedecision to publish the results
References
1 United Nations (UN) World Urbanizations Prospects The 2014 Revision United Nations New York NY USA 20142 United Nations (UN) World Population Prospects The 2015 Revision United Nations New York NY USA 20153 Guumlneralp B Guumlneralp I Liu Y Changing global patterns of urban exposure to flood and drought hazards
Glob Environ Chang 2015 31 217ndash225 [CrossRef]
Water 2017 9 705 15 of 16
4 Muis S Guumlneralp B Jongman B Aerts JC Ward PJ Flood risk and adaptation strategies under climatechange and urban expansion A probabilistic analysis using global data Sci Total Environ 2015 538 445ndash457[CrossRef] [PubMed]
5 HM Government National Flood Resilience Review HM Government London UK 2016 p 1456 Neelz S Pender G Benchmarking the Latest Generation of 2d Hydraulic Modelling Packages Environment Agency
Bristol UK 20137 Hunter N Bates P Neelz S Pender G Villanueva I Wright N Liang D Falconer RA Lin B
Waller S Benchmarking 2d Hydraulic Models for Urban Flood Simulations In Proceedings of the Institutionof Civil EngineersmdashWater Management Thomas Telford (ICE Publishing) London UK 2008 pp 13ndash30
8 Neacuteelz S Pender G Benchmarking of 2d Hydraulic Modelling Packages SC080035SR2 Environment AgencyBristol UK 2010
9 Neal J Villanueva I Wright N Willis T Fewtrell T Bates P How much physical complexity is neededto model flood inundation Hydrol Process 2012 26 2264ndash2282 [CrossRef]
10 Kvocka D Falconer RA Bray M Appropriate model use for predicting elevations and inundation extentfor extreme flood events Nat Hazards 2015 79 1791ndash1808 [CrossRef]
11 Faulkner H Parker D Green C Beven K Developing a translational discourse to communicateuncertainty in flood risk between science and the practitioner AMBIO J Hum Environ 2007 36 692ndash704[CrossRef]
12 Janssen JA Hoekstra AY de Kok J-L Schielen RM Delineating the model-stakeholder gap Framingperceptions to analyse the information requirement in river management Water Resour Manag 200923 1423ndash1445 [CrossRef]
13 Timmerman J Beinat E Termeer C Cofino W A methodology to bridge the water information gapWater Sci Technol 2010 62 2419ndash2426 [CrossRef] [PubMed]
14 Wood M Kovacs D Bostrom A Bridges T Linkov I Flood risk management US army corps ofengineers and layperson perceptions Risk Anal 2012 32 1349ndash1368 [CrossRef] [PubMed]
15 Leskens J Brugnach M Hoekstra A Schuurmans W Why are decisions in flood disaster management sopoorly supported by information from flood models Environ Model Softw 2014 53 53ndash61 [CrossRef]
16 Leskens JG Kehl C Tutenel T Kol T Haan Gd Stelling G Eisemann E An interactive simulationand visualization tool for flood analysis usable for practitioners Mitig Adapt Strateg Glob Chang 201722 307ndash324 [CrossRef]
17 Rozalis S Morin E Yair Y Price C Flash flood prediction using an uncalibrated hydrological model andradar rainfall data in a mediterranean watershed under changing hydrological conditions J Hydrol 2010394 245ndash255 [CrossRef]
18 Hill C Verjee F Flash Flood Early Warning System Reference Guide 2010 University Corporation forAtmospheric Research Boulder CO USA 2010
19 Marchi L Borga M Preciso E Gaume E Characterisation of selected extreme flash floods in europe andimplications for flood risk management J Hydrol 2010 394 118ndash133 [CrossRef]
20 Gaume E Bain V Bernardara P Newinger O Barbuc M Bateman A Blaškovicovaacute L Bloumlschl GBorga M Dumitrescu A et al A compilation of data on european flash floods J Hydrol 2009 367 70ndash78[CrossRef]
21 Foulds S Brewer P Macklin M Betson R Rassner S Causes and Consequences of a Large SummerStorm and Flood in West Wales 8thndash9th June 2012 Fluvio Report No 20120173 Aberystwyth UniversityAberystwyth UK 2012 p 53
22 Lin B Wicks JM Falconer RA Adams K Integrating 1d and 2d hydrodynamic models for floodsimulation In Proceedings of the Institution of Civil EngineersmdashWater Management ICE Virtual Library(ICE Publishing) London UK 2006 Volume 159 pp 19ndash25
23 BBC Wales Flooding Major Rescue Continuing Near Aberystwyth Available online httpwwwbbccouknewsuk-wales-18378124 (accessed on 1 November 2016)
24 Ceredigion County Council Flood Investigation Report North Ceredigion 8 and 9 June 2012 Availableonline httpwwwceredigiongovukutilitiesactionact_downloadcfmmediaid=43372 (accessed on1 November 2016)
25 Liang D Falconer RA Lin B Comparison between tvd-maccormack and adi-type solvers of the shallowwater equations Adv Water Resour 2006 29 1833ndash1845 [CrossRef]
Water 2017 9 705 16 of 16
26 Mingham CG Causon DM Ingram D Mingham CG Causon DM Ingram D A tvd maccormackscheme for transcritical flow In Proceedings of the Institution of Civil EngineersmdashWater and Maritime EngineeringICE Virtual Library (ICE Publishing) London UK 2001 Volume 148 pp 167ndash175
27 Liang D Lin B Falconer RA A boundary-fitted numerical model for flood routing with shock-capturingcapability J Hydrol 2007 332 477ndash486 [CrossRef]
28 Ahmadian R Falconer RA Wicks J Benchmarking of flood inundation extent using various dynamicallylinked one- and two-dimensional approaches J Flood Risk Manag 2015 [CrossRef]
29 Kvocka D Falconer RA Bray M Flood hazard assessment for extreme flood events Nat Hazards 201684 1569ndash1599 [CrossRef]
30 Rogers BD Borthwick AG Taylor PH Mathematical balancing of flux gradient and source terms priorto using roersquos approximate riemann solver J Comput Phys 2003 192 422ndash451 [CrossRef]
31 Strang G On the construction and comparison of difference schemes SIAM J Numer Anal 1968 5 506ndash517[CrossRef]
32 CH2M Flood Modeller Pro User Manual Available online httphelpfloodmodellercomfloodmodeller(accessed on 1 November 2016)
33 Ozdemir H Sampson C de Almeida GA Bates P Evaluating scale and roughness effects in urban floodmodelling using terrestrial lidar data Hydrol Earth Syst Sci 2013 10 5903ndash5942 [CrossRef]
34 Ancey C Debris flows In Environmental Geomechanics Schrefler B Delage P Eds John Wiley amp SonsHoboken NJ USA 2013 pp 1ndash37
35 WalesOnline Lessons to Be Learnt from Ceredigion Floods Available online httpwwwwalesonlinecouknewswales-newslessons-learnt-ceredigion-floods-6520699 (accessed on 7 December 2016)
36 BBC Dol-y-Bont Resident Jason Hughes Recalls lsquoAwfulrsquo Flood Available online httpwwwbbccouknewsuk-wales-18391889 (accessed on 11 November 2016)
37 ITV Floods Overrun Luxury Caravan Park Available online httpwwwitvcomnewsupdate2012-06-09flood-overruns-luxury-caravan-park (accessed on 11 November 2016)
38 WalesOnline Astonishing Pictures and Video of Flooding Rescues from Aberystwythrsquos Stricken VillagesAvailable online httpwwwwalesonlinecouknewslocal-newsastonishing-pictures-video-flooding-rescues-2052558 (accessed on 17 November 2016)
39 Martins R Leandro J Djordjevic S A well balanced roe scheme for the local inertial equations withan unstructured mesh Adv Water Resour 2015 83 351ndash363 [CrossRef]
40 Gourley JJ Flamig ZL Hong Y Howard KW Evaluation of past present and future tools for radar-basedflash-flood prediction in the USA Hydrol Sci J 2014 59 1377ndash1389 [CrossRef]
copy 2017 by the authors Licensee MDPI Basel Switzerland This article is an open accessarticle distributed under the terms and conditions of the Creative Commons Attribution(CC BY) license (httpcreativecommonsorglicensesby40)
- Introduction
- Study Areas
-
- Idealised Valley
- Borth (Wales UK)
-
- Numerical Model
- Methodology
- Results and Discussion
-
- Idealised Valley Test Case
- Flood Inundation Modelling around Borth
-
- Conclusions
-
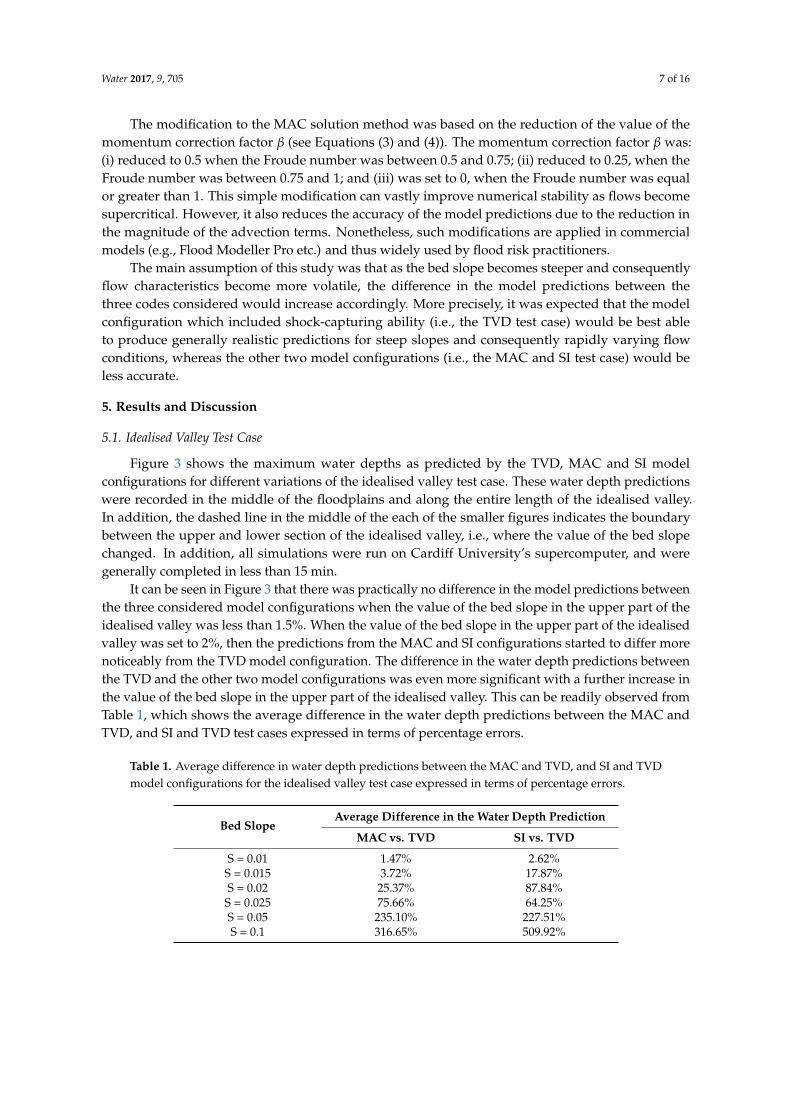

Water 2017 9 705 8 of 16
Water 2017 9 705 8 of 16
Figure 3 Predicted maximum water depths for the TVD MAC and SI test cases for different variations of the idealised valley test case
The results presented in Figure 3 indicate that only shock-capturing (or similar) flood inundation models can produce numerically realistic water depth predictions in steep river basins or catchments Steep river basins or catchments are often characterised by high velocity and high Froude number flows These can cause numerical instabilities in the model solution of the simplified 2D and full hydrodynamic 2D models with a conventional solution procedure and consequently lead to inaccurate model predictions [691033] For example Figure 4 shows the predicted maximum Froude numbers for the different configurations of the idealised valley test case It can be seen in Figure 4 that Froude numbers in the upper part of the valley became higher with increasing bed slopes On the other hand the Froude numbers remained generally the same in the nearly horizontal lower part of the valley for all test cases
When the predicted maximum Froude numbers in Figure 4 are compared with the results presented in Figure 3 it can be seen that the MAC and SI model configurations predicted much more realistic water depths where the Froude numbers were relatively low In contrast the MAC and SI
Figure 3 Predicted maximum water depths for the TVD MAC and SI test cases for different variationsof the idealised valley test case
The results presented in Figure 3 indicate that only shock-capturing (or similar) flood inundationmodels can produce numerically realistic water depth predictions in steep river basins or catchmentsSteep river basins or catchments are often characterised by high velocity and high Froude numberflows These can cause numerical instabilities in the model solution of the simplified 2D and fullhydrodynamic 2D models with a conventional solution procedure and consequently lead to inaccuratemodel predictions [691033] For example Figure 4 shows the predicted maximum Froude numbersfor the different configurations of the idealised valley test case It can be seen in Figure 4 that Froudenumbers in the upper part of the valley became higher with increasing bed slopes On the other handthe Froude numbers remained generally the same in the nearly horizontal lower part of the valley forall test cases
When the predicted maximum Froude numbers in Figure 4 are compared with the resultspresented in Figure 3 it can be seen that the MAC and SI model configurations predicted muchmore realistic water depths where the Froude numbers were relatively low In contrast the MAC and
Water 2017 9 705 9 of 16
SI model configurations predicted highly unrealistic results in the steeper part of the idealised valleywhere the Froude numbers were generally high For this simple case the obtained results indicate thatreduced complexity and full hydrodynamic 2D models were generally as accurate as shock-capturingflood inundations models when the bed slope was generally less than 15 When the slope wasgenerally greater than 15 only the model configuration that included shock-capturing capabilityproduced numerically realistic water depth predictions
These results are particularly interesting when one considers how river streamscatchmentsare generally divided according to the value of the bed slope In particular rivers are often definedas having a bed slope that is less than 1 torrential rivers have a bed slope ranging from 1 to 6and finally streams are often referred to as torrents when the bed slope is greater than 6 [34]This means that the value of the bed slope that is used to distinguish between a river and a torrentialriver (ie river and torrential catchments) is similar to the value of the bed slope at which the waterdepth predictions from the considered three model configurations started to differ more significantly
Furthermore torrential catchments are small in size (ie typically less than 100 km2) characterisedby a steep terrain and susceptible to the occurrence of sudden short and violent flood events [34]However these are also the characteristic features of catchments prone to flash flooding [19]with shock-capturing flood inundation models already identified as the most appropriate type of floodinundation models for modelling in such areas [10] All in all the results obtained for the idealisedvalley test case suggest that in torrential or flashy river basins and catchments (ie where the slopeis generally greater than 1) any flood inundation modelling should be undertaken using floodinundations models with a shock-capturing (or similar) capability
Water 2017 9 705 9 of 16
model configurations predicted highly unrealistic results in the steeper part of the idealised valley where the Froude numbers were generally high For this simple case the obtained results indicate that reduced complexity and full hydrodynamic 2D models were generally as accurate as shock-capturing flood inundations models when the bed slope was generally less than 15 When the slope was generally greater than 15 only the model configuration that included shock-capturing capability produced numerically realistic water depth predictions
These results are particularly interesting when one considers how river streamscatchments are generally divided according to the value of the bed slope In particular rivers are often defined as having a bed slope that is less than 1 torrential rivers have a bed slope ranging from 1 to 6 and finally streams are often referred to as torrents when the bed slope is greater than 6 [34] This means that the value of the bed slope that is used to distinguish between a river and a torrential river (ie river and torrential catchments) is similar to the value of the bed slope at which the water depth predictions from the considered three model configurations started to differ more significantly
Furthermore torrential catchments are small in size (ie typically less than 100 km2) characterised by a steep terrain and susceptible to the occurrence of sudden short and violent flood events [34] However these are also the characteristic features of catchments prone to flash flooding [19] with shock-capturing flood inundation models already identified as the most appropriate type of flood inundation models for modelling in such areas [10] All in all the results obtained for the idealised valley test case suggest that in torrential or flashy river basins and catchments (ie where the slope is generally greater than 1) any flood inundation modelling should be undertaken using flood inundations models with a shock-capturing (or similar) capability
Figure 4 Predicted maximum Froude numbers for different variations of the idealised valley test case
Figure 4 Predicted maximum Froude numbers for different variations of the idealised valley test case
Water 2017 9 705 10 of 16
52 Flood Inundation Modelling around Borth
All simulations were run on Cardiff Universityrsquos supercomputer The TVD simulation case wascompleted in seven days whereas the MAC and SI simulation case were completed in around five daysThe predicted maximum water depths from the three considered model configurations were comparedat several monitoring points around Tal-y-bont Dol-y-bont and Borth (see Figure 5) It was possible toestimate the maximum flood levels for the 2012 flash flood for several of these locations due to extensivemedia reports These observationsestimations of the actual flood depths for the 2012 River Leri flashflood allowed for some level of validation of the modelling results The observedestimated floodlevels for the 2012 River Leri flash flood are summarised in Table 2
Water 2017 9 705 10 of 16
52 Flood Inundation Modelling around Borth
All simulations were run on Cardiff Universityrsquos supercomputer The TVD simulation case was completed in seven days whereas the MAC and SI simulation case were completed in around five days The predicted maximum water depths from the three considered model configurations were compared at several monitoring points around Tal-y-bont Dol-y-bont and Borth (see Figure 5) It was possible to estimate the maximum flood levels for the 2012 flash flood for several of these locations due to extensive media reports These observationsestimations of the actual flood depths for the 2012 River Leri flash flood allowed for some level of validation of the modelling results The observedestimated flood levels for the 2012 River Leri flash flood are summarised in Table 2
Figure 5 Approximate locations of the selected monitoring points around Tal-y-bont Dol-y-bont and Borth (adopted from Google maps)
Figure 6 shows the predicted maximum water depths at the selected monitoring points for the TVD MAC and SI model configurations It can be seen in Figure 6 that the TVD model configuration matched the observedestimated flood depth data most accurately whereas the MAC and SI model configurations were less accurate This can be more readily observed from Table 3 which shows the difference in water depth predictions between the simulated results and the estimatedobserved values for the Borth study case expressed in terms of percentage errors The greatest difference between the simulated results can be observed in the steepest part of the domain (ie Tal-y-bont) while the differences are smaller in the flatter parts of the domain (eg Dol-y-bont) As it was shown for the idealised valley test case steep river basins are often characterised by high velocity and high Froude number flows Such flow conditions usually cause numerical instabilities in the model
Figure 5 Approximate locations of the selected monitoring points around Tal-y-bont Dol-y-bont andBorth (adopted from Google maps)
Figure 6 shows the predicted maximum water depths at the selected monitoring points for theTVD MAC and SI model configurations It can be seen in Figure 6 that the TVD model configurationmatched the observedestimated flood depth data most accurately whereas the MAC and SI modelconfigurations were less accurate This can be more readily observed from Table 3 which showsthe difference in water depth predictions between the simulated results and the estimatedobservedvalues for the Borth study case expressed in terms of percentage errors The greatest differencebetween the simulated results can be observed in the steepest part of the domain (ie Tal-y-bont)while the differences are smaller in the flatter parts of the domain (eg Dol-y-bont) As it was shownfor the idealised valley test case steep river basins are often characterised by high velocity andhigh Froude number flows Such flow conditions usually cause numerical instabilities in the modelsolution of simplified 2D and full hydrodynamic 2D models and consequently result in erroneousmodel predictions
Water 2017 9 705 11 of 16
Table 2 The observedestimated flood levels for the 2012 River Leri flash flood
Monitoring Point ObservedEstimated Depth Source
5 05 m Picture [2335]12 12 m Eye-witness account [23]17 12 m Eye-witness account [36]18 03 m Picture (Retrieved from httpwwwalanannacouk)19 03 m Picture (Retrieved from httpwwwalanannacouk)20 03 m Picture (Retrieved from httpwwwalanannacouk)24 05 m Picture [37]25 05 m Picture [38]27 03 m Picture (Retrieved from httpwwwalanannacouk)
Water 2017 9 705 11 of 16
solution of simplified 2D and full hydrodynamic 2D models and consequently result in erroneous model predictions
Table 2 The observedestimated flood levels for the 2012 River Leri flash flood
Monitoring Point ObservedEstimated Depth Source5 05 m Picture [2335] 12 12 m Eye-witness account [23] 17 12 m Eye-witness account [36] 18 03 m Picture (Retrieved from httpwwwalanannacouk) 19 03 m Picture (Retrieved from httpwwwalanannacouk) 20 03 m Picture (Retrieved from httpwwwalanannacouk) 24 05 m Picture [37] 25 05 m Picture [38] 27 03 m Picture (Retrieved from httpwwwalanannacouk)
Figure 6 Predicted maximum water depths at the selected monitoring points for the TVD MAC and SI model configurations
Table 3 The difference in water depth predictions between the simulated results and the estimatedobserved values for the Borth study case expressed in terms of percentage errors
Monitoring Point TVD MAC SI5 1075 1810 20726
12 271 3815 2705 17 232 1806 2768 18 1655 4743 4722 19 767 7037 7080 20 1445 6786 6476 24 1958 10000 7837 25 1342 6131 2396 27 683 3107 1699
For example Figure 7 shows the predicted maximum Froude numbers in the areas around Tal-y-bont Dol-y-bont and Borth It can be seen in Figure 7 that the supercritical flow conditions occurred throughout the area around Tal-y-bont This was as expected since the average value of the bed slope for the River Leri around Tal-y-bont is well above 1 The volatile flow conditions led to the
Figure 6 Predicted maximum water depths at the selected monitoring points for the TVD MAC andSI model configurations
Table 3 The difference in water depth predictions between the simulated results and theestimatedobserved values for the Borth study case expressed in terms of percentage errors
Monitoring Point TVD MAC SI
5 1075 1810 2072612 271 3815 270517 232 1806 276818 1655 4743 472219 767 7037 708020 1445 6786 647624 1958 10000 783725 1342 6131 239627 683 3107 1699
For example Figure 7 shows the predicted maximum Froude numbers in the areas aroundTal-y-bont Dol-y-bont and Borth It can be seen in Figure 7 that the supercritical flow conditionsoccurred throughout the area around Tal-y-bont This was as expected since the average value of thebed slope for the River Leri around Tal-y-bont is well above 1 The volatile flow conditions led to theoccurrence of numerical instabilities in the model solution of the MAC and SI model configurationsThis resulted in erroneous water depth predictions in the area around Tal-y-bont for the MAC and SI
Water 2017 9 705 12 of 16
model configurations On the contrary the TVD model configuration did not experience numericalinstabilities due to the shock-capturing capability Therefore the TVD configuration produced themost realistic flood depth predictions in the area around Tal-y-bont (see Figure 6)
Figure 7 also shows that the occurrence of supercritical flow conditions was less frequent in thearea around Dol-y-bont when compared to the area around Tal-y-bont This was again as expectedsince the average value of the bed slope for the River Leri at Dol-y-bont is around 06 Thereforethe flow conditions around Dol-y-bont were less volatile than the flow conditions further upstreamaround Tal-y-bont This meant that the MAC and SI model configurations were less susceptible to theemergence of numerical instabilities in the solution procedure Thus these two model configurationspredicted more realistic flood depths in the area around Dol-y-bont than they did in the area aroundTal-y-bont (see Figure 6)
Water 2017 9 705 12 of 16
occurrence of numerical instabilities in the model solution of the MAC and SI model configurations This resulted in erroneous water depth predictions in the area around Tal-y-bont for the MAC and SI model configurations On the contrary the TVD model configuration did not experience numerical instabilities due to the shock-capturing capability Therefore the TVD configuration produced the most realistic flood depth predictions in the area around Tal-y-bont (see Figure 6)
Figure 7 also shows that the occurrence of supercritical flow conditions was less frequent in the area around Dol-y-bont when compared to the area around Tal-y-bont This was again as expected since the average value of the bed slope for the River Leri at Dol-y-bont is around 06 Therefore the flow conditions around Dol-y-bont were less volatile than the flow conditions further upstream around Tal-y-bont This meant that the MAC and SI model configurations were less susceptible to the emergence of numerical instabilities in the solution procedure Thus these two model configurations predicted more realistic flood depths in the area around Dol-y-bont than they did in the area around Tal-y-bont (see Figure 6)
Figure 7 Predicted maximum Froude numbers around Tal-y-bont Dol-y-bont and Borth
It can also be seen in Figure 7 that the flow conditions were relatively mild around Borth with the maximum Froude number generally being less than 05 This was also as expected since the terrain around Borth is nearly horizontal Therefore it would be reasonable to assume that the difference between the model predictions should be the smallest in this area For example Table 4 shows the average difference in the water depth predictions between the MAC and TVD and SI and TVD test cases at the selected monitoring points in the Borth study domain It can be again seen in Table 4 that the greatest difference in the model predictions occurred where the gradient was steep and the smallest where the gradient was mild However Table 4 also outlines the main differences between
Figure 7 Predicted maximum Froude numbers around Tal-y-bont Dol-y-bont and Borth
It can also be seen in Figure 7 that the flow conditions were relatively mild around Borth with themaximum Froude number generally being less than 05 This was also as expected since the terrainaround Borth is nearly horizontal Therefore it would be reasonable to assume that the differencebetween the model predictions should be the smallest in this area For example Table 4 shows theaverage difference in the water depth predictions between the MAC and TVD and SI and TVD testcases at the selected monitoring points in the Borth study domain It can be again seen in Table 4that the greatest difference in the model predictions occurred where the gradient was steep and thesmallest where the gradient was mild However Table 4 also outlines the main differences between
Water 2017 9 705 13 of 16
the simplified and full hydrodynamic 2D solvers when modelling flood events with a high Froudenumber or supercritical flows
Table 4 Average difference in water depth predictions between the MAC and TVD and SI and TVDmodel configurations at the selected monitoring points in the Borth study domain
Bed SlopeAverage Difference in the Water Depth Prediction
MAC vs TVD SI vs TVD
S gt 001 409 cm 990 cm001 gt S gt 0001 259 cm 262 cm
S asymp 0001 236 cm 87 cm
As discussed earlier flow conditions were particularly volatile in the steeper parts of thedomain (see Figure 7) This meant for example that the full 2D hydrodynamic model would havemajor difficulties in preserving the peak flood wave along the entire modelling reach due to theadvection terms As indicated earlier advection terms can cause numerical instabilities when full2D hydrodynamic schemes are used to model high Froude number or supercritical flows The rise ofnumerical instabilities generally lead to erroneous predictions in the areas where the gradients aresteep (see Figure 6) and usually result in the dissipation of the peak flood wave This means that suchmodels would thus be prone to under-predict flood levels in the areas further downstream where thegradients are less steep This course of events can also be observed in this study for the MAC modelconfiguration (eg see Figure 6 for the Borth area)
The simplified 2D models (eg the SI configuration in this study) generally also have difficulties inpreserving the peak flood wave along the entire modelling reach that includes areas characterised by ahigh Froude number or supercritical flows For example the SI model configuration did not include theadvection terms which significantly increased the numerical stability However the complete exclusionof advection terms reduces the accuracy of the model predictions This is particularly evident in areascharacterised by a high Froude number or supercritical flows For example the SI model configurationgreatly over-predicted the peak flood levels in the steepest parts of the domain (eg see Figure 6 forthe Tal-y-bont area) where the flow conditions were the most volatile (see Figure 7) On the other handthe SI model configuration predicted (numerically) more accurate flood depths in the flatter parts ofthe domain (eg see Figure 6 for the Borth area) The flow conditions in this area were generally mild(see Figure 7) Thus decreased physical complexity in the model solution had less of an impact on theaccuracy of the SI model predictions
Simplified and full hydrodynamic 2D models can produce accurate model predictions for floodscenarios that include a high Froude number or supercritical flows if these flows are not dominantduring the simulation process [939] For such studies model instability can be reduced by artificiallyimproving modelling results eg introducing a small patch of high roughness to slow water downin the problematic areas [32] However such procedures are not generic and should be applied withcaution because the level of such improvements is based on the modellerrsquos perception of how muchfine-tuning is needed [1032]
Finally simplified and full hydrodynamic 2D models can produce (to some extent) realistic floodlevel predictions for rapidly varying flood events if there exists quality validation data that canbe used to fine-tune the models However quality validation and calibration data for flood eventsoccurring in steep catchments (eg flash floods) are generally scarce [40] Therefore the physicaland mathematical complexity in the model solution is particularly important for studies conductedin torrential river basins and catchments because the validation of the modelling results is oftenimpossible Thus shock-capturing models are more appropriate for such flood studies as these modelscan produce (numerically) accurate predictions for high Froude numbers or supercritical flows withoutany additional modification or improvements of the modelling procedure
Water 2017 9 705 14 of 16
6 Conclusions
In this paper we have investigated the threshold value of the bed slope that could stand asan orientation guide as to when to use a specific type of flood inundation model Three differentmodel configurations of the DIVAST-TVD model were considered in this study (i) a configuration thatincluded a shock-capturing ability (ie the TVD test case) (ii) a configuration that solved the full 2Dshallow water equations (ie the MAC test case) and (iii) a configuration based on a simplified versionof the 2D shallow water equations (ie the SI test case) The three considered model configurationswere used to model two different flood events ie a flood wave propagating along an idealised valleyand a flash flood event in Wales UK
The results obtained indicate that in torrential or flashy river basins or catchments (ie riverbasins and catchments with a stream gradient generally greater than 1) flood inundation modellingshould be undertaken using flood inundation models with shock-capturing (or similar) capabilitySteep catchments are prone to the occurrence of high Froude numbers and supercritical flowsSuch flow conditions usually cause numerical instabilities (eg spurious oscillations) in the modelsolution of simplified 2D and full hydrodynamic 2D models These instabilities can lead to the dissipationof the peak flood wave and consequently to erroneous model predictions Even though flood inundationmodels with shock-capturing (or similar) capabilities are generally more computationally expensivethese models prevent the occurrence of numerical instabilities and thus prevent the dissipation of theflood wave Therefore such models can predict (numerically) accurate flood levels for flood eventscharacterised by high Froude numbers or supercritical flows such as floods occurring in steep riverbasins and catchments (eg flash floods)
This paper proposes an orientation value of the bed slope (ie 1) that can be used as a guideas when to use a specific type of flood inundation model Therefore further research is needed todevelop more detailed modelling guidelines for steep river basins and catchments Future research willinclude more rigorous testing conditions and more complex modelling environments As indicatedwithin this paper modelling in steep river basins is faced with many difficulties eg a lack of qualitydata etc Therefore future research would also benefit from closer cooperation between academicresearchers regulatory authorities and flood risk practitioners which would enable more efficientsharing of information data and practical experience All these would help in easier development andlater implementation of the state-of-the-art modelling techniques to the practical hydro-environmentalengineering community
Acknowledgments This research project was supported by an Engineering and Physical Sciences ResearchCouncil (EPSRC) Impact Acceleration grant The topographical and hydrological data for the Borth study wereprovided by Natural Resources Wales (NRW) The contribution of these organisations is gratefully acknowledgedThe authors would also like to thank Thomas Green from Advance Research ComputingmdashCardiff University(ARCCA) for his assistance in using the Universityrsquos high-performance computing facilities
Author Contributions Davor Kvocka was the Research Associate on the project and set-up the model applicationsand undertook the studies including assessing the conditions under which shock-capturing algorithms need tobe included Roger A Falconer and Reza Ahmadian have been leading a wide range of research projects in floodrisk modelling and were instrumental in developing the original models Davor Kvocka drafted the manuscriptwhich was refined by all authors
Conflicts of Interest The authors declare no conflict of interest The founding sponsors had no role in the designof the study in the collection analyses or interpretation of data in the writing of the manuscript and in thedecision to publish the results
References
1 United Nations (UN) World Urbanizations Prospects The 2014 Revision United Nations New York NY USA 20142 United Nations (UN) World Population Prospects The 2015 Revision United Nations New York NY USA 20153 Guumlneralp B Guumlneralp I Liu Y Changing global patterns of urban exposure to flood and drought hazards
Glob Environ Chang 2015 31 217ndash225 [CrossRef]
Water 2017 9 705 15 of 16
4 Muis S Guumlneralp B Jongman B Aerts JC Ward PJ Flood risk and adaptation strategies under climatechange and urban expansion A probabilistic analysis using global data Sci Total Environ 2015 538 445ndash457[CrossRef] [PubMed]
5 HM Government National Flood Resilience Review HM Government London UK 2016 p 1456 Neelz S Pender G Benchmarking the Latest Generation of 2d Hydraulic Modelling Packages Environment Agency
Bristol UK 20137 Hunter N Bates P Neelz S Pender G Villanueva I Wright N Liang D Falconer RA Lin B
Waller S Benchmarking 2d Hydraulic Models for Urban Flood Simulations In Proceedings of the Institutionof Civil EngineersmdashWater Management Thomas Telford (ICE Publishing) London UK 2008 pp 13ndash30
8 Neacuteelz S Pender G Benchmarking of 2d Hydraulic Modelling Packages SC080035SR2 Environment AgencyBristol UK 2010
9 Neal J Villanueva I Wright N Willis T Fewtrell T Bates P How much physical complexity is neededto model flood inundation Hydrol Process 2012 26 2264ndash2282 [CrossRef]
10 Kvocka D Falconer RA Bray M Appropriate model use for predicting elevations and inundation extentfor extreme flood events Nat Hazards 2015 79 1791ndash1808 [CrossRef]
11 Faulkner H Parker D Green C Beven K Developing a translational discourse to communicateuncertainty in flood risk between science and the practitioner AMBIO J Hum Environ 2007 36 692ndash704[CrossRef]
12 Janssen JA Hoekstra AY de Kok J-L Schielen RM Delineating the model-stakeholder gap Framingperceptions to analyse the information requirement in river management Water Resour Manag 200923 1423ndash1445 [CrossRef]
13 Timmerman J Beinat E Termeer C Cofino W A methodology to bridge the water information gapWater Sci Technol 2010 62 2419ndash2426 [CrossRef] [PubMed]
14 Wood M Kovacs D Bostrom A Bridges T Linkov I Flood risk management US army corps ofengineers and layperson perceptions Risk Anal 2012 32 1349ndash1368 [CrossRef] [PubMed]
15 Leskens J Brugnach M Hoekstra A Schuurmans W Why are decisions in flood disaster management sopoorly supported by information from flood models Environ Model Softw 2014 53 53ndash61 [CrossRef]
16 Leskens JG Kehl C Tutenel T Kol T Haan Gd Stelling G Eisemann E An interactive simulationand visualization tool for flood analysis usable for practitioners Mitig Adapt Strateg Glob Chang 201722 307ndash324 [CrossRef]
17 Rozalis S Morin E Yair Y Price C Flash flood prediction using an uncalibrated hydrological model andradar rainfall data in a mediterranean watershed under changing hydrological conditions J Hydrol 2010394 245ndash255 [CrossRef]
18 Hill C Verjee F Flash Flood Early Warning System Reference Guide 2010 University Corporation forAtmospheric Research Boulder CO USA 2010
19 Marchi L Borga M Preciso E Gaume E Characterisation of selected extreme flash floods in europe andimplications for flood risk management J Hydrol 2010 394 118ndash133 [CrossRef]
20 Gaume E Bain V Bernardara P Newinger O Barbuc M Bateman A Blaškovicovaacute L Bloumlschl GBorga M Dumitrescu A et al A compilation of data on european flash floods J Hydrol 2009 367 70ndash78[CrossRef]
21 Foulds S Brewer P Macklin M Betson R Rassner S Causes and Consequences of a Large SummerStorm and Flood in West Wales 8thndash9th June 2012 Fluvio Report No 20120173 Aberystwyth UniversityAberystwyth UK 2012 p 53
22 Lin B Wicks JM Falconer RA Adams K Integrating 1d and 2d hydrodynamic models for floodsimulation In Proceedings of the Institution of Civil EngineersmdashWater Management ICE Virtual Library(ICE Publishing) London UK 2006 Volume 159 pp 19ndash25
23 BBC Wales Flooding Major Rescue Continuing Near Aberystwyth Available online httpwwwbbccouknewsuk-wales-18378124 (accessed on 1 November 2016)
24 Ceredigion County Council Flood Investigation Report North Ceredigion 8 and 9 June 2012 Availableonline httpwwwceredigiongovukutilitiesactionact_downloadcfmmediaid=43372 (accessed on1 November 2016)
25 Liang D Falconer RA Lin B Comparison between tvd-maccormack and adi-type solvers of the shallowwater equations Adv Water Resour 2006 29 1833ndash1845 [CrossRef]
Water 2017 9 705 16 of 16
26 Mingham CG Causon DM Ingram D Mingham CG Causon DM Ingram D A tvd maccormackscheme for transcritical flow In Proceedings of the Institution of Civil EngineersmdashWater and Maritime EngineeringICE Virtual Library (ICE Publishing) London UK 2001 Volume 148 pp 167ndash175
27 Liang D Lin B Falconer RA A boundary-fitted numerical model for flood routing with shock-capturingcapability J Hydrol 2007 332 477ndash486 [CrossRef]
28 Ahmadian R Falconer RA Wicks J Benchmarking of flood inundation extent using various dynamicallylinked one- and two-dimensional approaches J Flood Risk Manag 2015 [CrossRef]
29 Kvocka D Falconer RA Bray M Flood hazard assessment for extreme flood events Nat Hazards 201684 1569ndash1599 [CrossRef]
30 Rogers BD Borthwick AG Taylor PH Mathematical balancing of flux gradient and source terms priorto using roersquos approximate riemann solver J Comput Phys 2003 192 422ndash451 [CrossRef]
31 Strang G On the construction and comparison of difference schemes SIAM J Numer Anal 1968 5 506ndash517[CrossRef]
32 CH2M Flood Modeller Pro User Manual Available online httphelpfloodmodellercomfloodmodeller(accessed on 1 November 2016)
33 Ozdemir H Sampson C de Almeida GA Bates P Evaluating scale and roughness effects in urban floodmodelling using terrestrial lidar data Hydrol Earth Syst Sci 2013 10 5903ndash5942 [CrossRef]
34 Ancey C Debris flows In Environmental Geomechanics Schrefler B Delage P Eds John Wiley amp SonsHoboken NJ USA 2013 pp 1ndash37
35 WalesOnline Lessons to Be Learnt from Ceredigion Floods Available online httpwwwwalesonlinecouknewswales-newslessons-learnt-ceredigion-floods-6520699 (accessed on 7 December 2016)
36 BBC Dol-y-Bont Resident Jason Hughes Recalls lsquoAwfulrsquo Flood Available online httpwwwbbccouknewsuk-wales-18391889 (accessed on 11 November 2016)
37 ITV Floods Overrun Luxury Caravan Park Available online httpwwwitvcomnewsupdate2012-06-09flood-overruns-luxury-caravan-park (accessed on 11 November 2016)
38 WalesOnline Astonishing Pictures and Video of Flooding Rescues from Aberystwythrsquos Stricken VillagesAvailable online httpwwwwalesonlinecouknewslocal-newsastonishing-pictures-video-flooding-rescues-2052558 (accessed on 17 November 2016)
39 Martins R Leandro J Djordjevic S A well balanced roe scheme for the local inertial equations withan unstructured mesh Adv Water Resour 2015 83 351ndash363 [CrossRef]
40 Gourley JJ Flamig ZL Hong Y Howard KW Evaluation of past present and future tools for radar-basedflash-flood prediction in the USA Hydrol Sci J 2014 59 1377ndash1389 [CrossRef]
copy 2017 by the authors Licensee MDPI Basel Switzerland This article is an open accessarticle distributed under the terms and conditions of the Creative Commons Attribution(CC BY) license (httpcreativecommonsorglicensesby40)
- Introduction
- Study Areas
-
- Idealised Valley
- Borth (Wales UK)
-
- Numerical Model
- Methodology
- Results and Discussion
-
- Idealised Valley Test Case
- Flood Inundation Modelling around Borth
-
- Conclusions
-

Water 2017 9 705 9 of 16
SI model configurations predicted highly unrealistic results in the steeper part of the idealised valleywhere the Froude numbers were generally high For this simple case the obtained results indicate thatreduced complexity and full hydrodynamic 2D models were generally as accurate as shock-capturingflood inundations models when the bed slope was generally less than 15 When the slope wasgenerally greater than 15 only the model configuration that included shock-capturing capabilityproduced numerically realistic water depth predictions
These results are particularly interesting when one considers how river streamscatchmentsare generally divided according to the value of the bed slope In particular rivers are often definedas having a bed slope that is less than 1 torrential rivers have a bed slope ranging from 1 to 6and finally streams are often referred to as torrents when the bed slope is greater than 6 [34]This means that the value of the bed slope that is used to distinguish between a river and a torrentialriver (ie river and torrential catchments) is similar to the value of the bed slope at which the waterdepth predictions from the considered three model configurations started to differ more significantly
Furthermore torrential catchments are small in size (ie typically less than 100 km2) characterisedby a steep terrain and susceptible to the occurrence of sudden short and violent flood events [34]However these are also the characteristic features of catchments prone to flash flooding [19]with shock-capturing flood inundation models already identified as the most appropriate type of floodinundation models for modelling in such areas [10] All in all the results obtained for the idealisedvalley test case suggest that in torrential or flashy river basins and catchments (ie where the slopeis generally greater than 1) any flood inundation modelling should be undertaken using floodinundations models with a shock-capturing (or similar) capability
Water 2017 9 705 9 of 16
model configurations predicted highly unrealistic results in the steeper part of the idealised valley where the Froude numbers were generally high For this simple case the obtained results indicate that reduced complexity and full hydrodynamic 2D models were generally as accurate as shock-capturing flood inundations models when the bed slope was generally less than 15 When the slope was generally greater than 15 only the model configuration that included shock-capturing capability produced numerically realistic water depth predictions
These results are particularly interesting when one considers how river streamscatchments are generally divided according to the value of the bed slope In particular rivers are often defined as having a bed slope that is less than 1 torrential rivers have a bed slope ranging from 1 to 6 and finally streams are often referred to as torrents when the bed slope is greater than 6 [34] This means that the value of the bed slope that is used to distinguish between a river and a torrential river (ie river and torrential catchments) is similar to the value of the bed slope at which the water depth predictions from the considered three model configurations started to differ more significantly
Furthermore torrential catchments are small in size (ie typically less than 100 km2) characterised by a steep terrain and susceptible to the occurrence of sudden short and violent flood events [34] However these are also the characteristic features of catchments prone to flash flooding [19] with shock-capturing flood inundation models already identified as the most appropriate type of flood inundation models for modelling in such areas [10] All in all the results obtained for the idealised valley test case suggest that in torrential or flashy river basins and catchments (ie where the slope is generally greater than 1) any flood inundation modelling should be undertaken using flood inundations models with a shock-capturing (or similar) capability
Figure 4 Predicted maximum Froude numbers for different variations of the idealised valley test case
Figure 4 Predicted maximum Froude numbers for different variations of the idealised valley test case
Water 2017 9 705 10 of 16
52 Flood Inundation Modelling around Borth
All simulations were run on Cardiff Universityrsquos supercomputer The TVD simulation case wascompleted in seven days whereas the MAC and SI simulation case were completed in around five daysThe predicted maximum water depths from the three considered model configurations were comparedat several monitoring points around Tal-y-bont Dol-y-bont and Borth (see Figure 5) It was possible toestimate the maximum flood levels for the 2012 flash flood for several of these locations due to extensivemedia reports These observationsestimations of the actual flood depths for the 2012 River Leri flashflood allowed for some level of validation of the modelling results The observedestimated floodlevels for the 2012 River Leri flash flood are summarised in Table 2
Water 2017 9 705 10 of 16
52 Flood Inundation Modelling around Borth
All simulations were run on Cardiff Universityrsquos supercomputer The TVD simulation case was completed in seven days whereas the MAC and SI simulation case were completed in around five days The predicted maximum water depths from the three considered model configurations were compared at several monitoring points around Tal-y-bont Dol-y-bont and Borth (see Figure 5) It was possible to estimate the maximum flood levels for the 2012 flash flood for several of these locations due to extensive media reports These observationsestimations of the actual flood depths for the 2012 River Leri flash flood allowed for some level of validation of the modelling results The observedestimated flood levels for the 2012 River Leri flash flood are summarised in Table 2
Figure 5 Approximate locations of the selected monitoring points around Tal-y-bont Dol-y-bont and Borth (adopted from Google maps)
Figure 6 shows the predicted maximum water depths at the selected monitoring points for the TVD MAC and SI model configurations It can be seen in Figure 6 that the TVD model configuration matched the observedestimated flood depth data most accurately whereas the MAC and SI model configurations were less accurate This can be more readily observed from Table 3 which shows the difference in water depth predictions between the simulated results and the estimatedobserved values for the Borth study case expressed in terms of percentage errors The greatest difference between the simulated results can be observed in the steepest part of the domain (ie Tal-y-bont) while the differences are smaller in the flatter parts of the domain (eg Dol-y-bont) As it was shown for the idealised valley test case steep river basins are often characterised by high velocity and high Froude number flows Such flow conditions usually cause numerical instabilities in the model
Figure 5 Approximate locations of the selected monitoring points around Tal-y-bont Dol-y-bont andBorth (adopted from Google maps)
Figure 6 shows the predicted maximum water depths at the selected monitoring points for theTVD MAC and SI model configurations It can be seen in Figure 6 that the TVD model configurationmatched the observedestimated flood depth data most accurately whereas the MAC and SI modelconfigurations were less accurate This can be more readily observed from Table 3 which showsthe difference in water depth predictions between the simulated results and the estimatedobservedvalues for the Borth study case expressed in terms of percentage errors The greatest differencebetween the simulated results can be observed in the steepest part of the domain (ie Tal-y-bont)while the differences are smaller in the flatter parts of the domain (eg Dol-y-bont) As it was shownfor the idealised valley test case steep river basins are often characterised by high velocity andhigh Froude number flows Such flow conditions usually cause numerical instabilities in the modelsolution of simplified 2D and full hydrodynamic 2D models and consequently result in erroneousmodel predictions
Water 2017 9 705 11 of 16
Table 2 The observedestimated flood levels for the 2012 River Leri flash flood
Monitoring Point ObservedEstimated Depth Source
5 05 m Picture [2335]12 12 m Eye-witness account [23]17 12 m Eye-witness account [36]18 03 m Picture (Retrieved from httpwwwalanannacouk)19 03 m Picture (Retrieved from httpwwwalanannacouk)20 03 m Picture (Retrieved from httpwwwalanannacouk)24 05 m Picture [37]25 05 m Picture [38]27 03 m Picture (Retrieved from httpwwwalanannacouk)
Water 2017 9 705 11 of 16
solution of simplified 2D and full hydrodynamic 2D models and consequently result in erroneous model predictions
Table 2 The observedestimated flood levels for the 2012 River Leri flash flood
Monitoring Point ObservedEstimated Depth Source5 05 m Picture [2335] 12 12 m Eye-witness account [23] 17 12 m Eye-witness account [36] 18 03 m Picture (Retrieved from httpwwwalanannacouk) 19 03 m Picture (Retrieved from httpwwwalanannacouk) 20 03 m Picture (Retrieved from httpwwwalanannacouk) 24 05 m Picture [37] 25 05 m Picture [38] 27 03 m Picture (Retrieved from httpwwwalanannacouk)
Figure 6 Predicted maximum water depths at the selected monitoring points for the TVD MAC and SI model configurations
Table 3 The difference in water depth predictions between the simulated results and the estimatedobserved values for the Borth study case expressed in terms of percentage errors
Monitoring Point TVD MAC SI5 1075 1810 20726
12 271 3815 2705 17 232 1806 2768 18 1655 4743 4722 19 767 7037 7080 20 1445 6786 6476 24 1958 10000 7837 25 1342 6131 2396 27 683 3107 1699
For example Figure 7 shows the predicted maximum Froude numbers in the areas around Tal-y-bont Dol-y-bont and Borth It can be seen in Figure 7 that the supercritical flow conditions occurred throughout the area around Tal-y-bont This was as expected since the average value of the bed slope for the River Leri around Tal-y-bont is well above 1 The volatile flow conditions led to the
Figure 6 Predicted maximum water depths at the selected monitoring points for the TVD MAC andSI model configurations
Table 3 The difference in water depth predictions between the simulated results and theestimatedobserved values for the Borth study case expressed in terms of percentage errors
Monitoring Point TVD MAC SI
5 1075 1810 2072612 271 3815 270517 232 1806 276818 1655 4743 472219 767 7037 708020 1445 6786 647624 1958 10000 783725 1342 6131 239627 683 3107 1699
For example Figure 7 shows the predicted maximum Froude numbers in the areas aroundTal-y-bont Dol-y-bont and Borth It can be seen in Figure 7 that the supercritical flow conditionsoccurred throughout the area around Tal-y-bont This was as expected since the average value of thebed slope for the River Leri around Tal-y-bont is well above 1 The volatile flow conditions led to theoccurrence of numerical instabilities in the model solution of the MAC and SI model configurationsThis resulted in erroneous water depth predictions in the area around Tal-y-bont for the MAC and SI
Water 2017 9 705 12 of 16
model configurations On the contrary the TVD model configuration did not experience numericalinstabilities due to the shock-capturing capability Therefore the TVD configuration produced themost realistic flood depth predictions in the area around Tal-y-bont (see Figure 6)
Figure 7 also shows that the occurrence of supercritical flow conditions was less frequent in thearea around Dol-y-bont when compared to the area around Tal-y-bont This was again as expectedsince the average value of the bed slope for the River Leri at Dol-y-bont is around 06 Thereforethe flow conditions around Dol-y-bont were less volatile than the flow conditions further upstreamaround Tal-y-bont This meant that the MAC and SI model configurations were less susceptible to theemergence of numerical instabilities in the solution procedure Thus these two model configurationspredicted more realistic flood depths in the area around Dol-y-bont than they did in the area aroundTal-y-bont (see Figure 6)
Water 2017 9 705 12 of 16
occurrence of numerical instabilities in the model solution of the MAC and SI model configurations This resulted in erroneous water depth predictions in the area around Tal-y-bont for the MAC and SI model configurations On the contrary the TVD model configuration did not experience numerical instabilities due to the shock-capturing capability Therefore the TVD configuration produced the most realistic flood depth predictions in the area around Tal-y-bont (see Figure 6)
Figure 7 also shows that the occurrence of supercritical flow conditions was less frequent in the area around Dol-y-bont when compared to the area around Tal-y-bont This was again as expected since the average value of the bed slope for the River Leri at Dol-y-bont is around 06 Therefore the flow conditions around Dol-y-bont were less volatile than the flow conditions further upstream around Tal-y-bont This meant that the MAC and SI model configurations were less susceptible to the emergence of numerical instabilities in the solution procedure Thus these two model configurations predicted more realistic flood depths in the area around Dol-y-bont than they did in the area around Tal-y-bont (see Figure 6)
Figure 7 Predicted maximum Froude numbers around Tal-y-bont Dol-y-bont and Borth
It can also be seen in Figure 7 that the flow conditions were relatively mild around Borth with the maximum Froude number generally being less than 05 This was also as expected since the terrain around Borth is nearly horizontal Therefore it would be reasonable to assume that the difference between the model predictions should be the smallest in this area For example Table 4 shows the average difference in the water depth predictions between the MAC and TVD and SI and TVD test cases at the selected monitoring points in the Borth study domain It can be again seen in Table 4 that the greatest difference in the model predictions occurred where the gradient was steep and the smallest where the gradient was mild However Table 4 also outlines the main differences between
Figure 7 Predicted maximum Froude numbers around Tal-y-bont Dol-y-bont and Borth
It can also be seen in Figure 7 that the flow conditions were relatively mild around Borth with themaximum Froude number generally being less than 05 This was also as expected since the terrainaround Borth is nearly horizontal Therefore it would be reasonable to assume that the differencebetween the model predictions should be the smallest in this area For example Table 4 shows theaverage difference in the water depth predictions between the MAC and TVD and SI and TVD testcases at the selected monitoring points in the Borth study domain It can be again seen in Table 4that the greatest difference in the model predictions occurred where the gradient was steep and thesmallest where the gradient was mild However Table 4 also outlines the main differences between
Water 2017 9 705 13 of 16
the simplified and full hydrodynamic 2D solvers when modelling flood events with a high Froudenumber or supercritical flows
Table 4 Average difference in water depth predictions between the MAC and TVD and SI and TVDmodel configurations at the selected monitoring points in the Borth study domain
Bed SlopeAverage Difference in the Water Depth Prediction
MAC vs TVD SI vs TVD
S gt 001 409 cm 990 cm001 gt S gt 0001 259 cm 262 cm
S asymp 0001 236 cm 87 cm
As discussed earlier flow conditions were particularly volatile in the steeper parts of thedomain (see Figure 7) This meant for example that the full 2D hydrodynamic model would havemajor difficulties in preserving the peak flood wave along the entire modelling reach due to theadvection terms As indicated earlier advection terms can cause numerical instabilities when full2D hydrodynamic schemes are used to model high Froude number or supercritical flows The rise ofnumerical instabilities generally lead to erroneous predictions in the areas where the gradients aresteep (see Figure 6) and usually result in the dissipation of the peak flood wave This means that suchmodels would thus be prone to under-predict flood levels in the areas further downstream where thegradients are less steep This course of events can also be observed in this study for the MAC modelconfiguration (eg see Figure 6 for the Borth area)
The simplified 2D models (eg the SI configuration in this study) generally also have difficulties inpreserving the peak flood wave along the entire modelling reach that includes areas characterised by ahigh Froude number or supercritical flows For example the SI model configuration did not include theadvection terms which significantly increased the numerical stability However the complete exclusionof advection terms reduces the accuracy of the model predictions This is particularly evident in areascharacterised by a high Froude number or supercritical flows For example the SI model configurationgreatly over-predicted the peak flood levels in the steepest parts of the domain (eg see Figure 6 forthe Tal-y-bont area) where the flow conditions were the most volatile (see Figure 7) On the other handthe SI model configuration predicted (numerically) more accurate flood depths in the flatter parts ofthe domain (eg see Figure 6 for the Borth area) The flow conditions in this area were generally mild(see Figure 7) Thus decreased physical complexity in the model solution had less of an impact on theaccuracy of the SI model predictions
Simplified and full hydrodynamic 2D models can produce accurate model predictions for floodscenarios that include a high Froude number or supercritical flows if these flows are not dominantduring the simulation process [939] For such studies model instability can be reduced by artificiallyimproving modelling results eg introducing a small patch of high roughness to slow water downin the problematic areas [32] However such procedures are not generic and should be applied withcaution because the level of such improvements is based on the modellerrsquos perception of how muchfine-tuning is needed [1032]
Finally simplified and full hydrodynamic 2D models can produce (to some extent) realistic floodlevel predictions for rapidly varying flood events if there exists quality validation data that canbe used to fine-tune the models However quality validation and calibration data for flood eventsoccurring in steep catchments (eg flash floods) are generally scarce [40] Therefore the physicaland mathematical complexity in the model solution is particularly important for studies conductedin torrential river basins and catchments because the validation of the modelling results is oftenimpossible Thus shock-capturing models are more appropriate for such flood studies as these modelscan produce (numerically) accurate predictions for high Froude numbers or supercritical flows withoutany additional modification or improvements of the modelling procedure
Water 2017 9 705 14 of 16
6 Conclusions
In this paper we have investigated the threshold value of the bed slope that could stand asan orientation guide as to when to use a specific type of flood inundation model Three differentmodel configurations of the DIVAST-TVD model were considered in this study (i) a configuration thatincluded a shock-capturing ability (ie the TVD test case) (ii) a configuration that solved the full 2Dshallow water equations (ie the MAC test case) and (iii) a configuration based on a simplified versionof the 2D shallow water equations (ie the SI test case) The three considered model configurationswere used to model two different flood events ie a flood wave propagating along an idealised valleyand a flash flood event in Wales UK
The results obtained indicate that in torrential or flashy river basins or catchments (ie riverbasins and catchments with a stream gradient generally greater than 1) flood inundation modellingshould be undertaken using flood inundation models with shock-capturing (or similar) capabilitySteep catchments are prone to the occurrence of high Froude numbers and supercritical flowsSuch flow conditions usually cause numerical instabilities (eg spurious oscillations) in the modelsolution of simplified 2D and full hydrodynamic 2D models These instabilities can lead to the dissipationof the peak flood wave and consequently to erroneous model predictions Even though flood inundationmodels with shock-capturing (or similar) capabilities are generally more computationally expensivethese models prevent the occurrence of numerical instabilities and thus prevent the dissipation of theflood wave Therefore such models can predict (numerically) accurate flood levels for flood eventscharacterised by high Froude numbers or supercritical flows such as floods occurring in steep riverbasins and catchments (eg flash floods)
This paper proposes an orientation value of the bed slope (ie 1) that can be used as a guideas when to use a specific type of flood inundation model Therefore further research is needed todevelop more detailed modelling guidelines for steep river basins and catchments Future research willinclude more rigorous testing conditions and more complex modelling environments As indicatedwithin this paper modelling in steep river basins is faced with many difficulties eg a lack of qualitydata etc Therefore future research would also benefit from closer cooperation between academicresearchers regulatory authorities and flood risk practitioners which would enable more efficientsharing of information data and practical experience All these would help in easier development andlater implementation of the state-of-the-art modelling techniques to the practical hydro-environmentalengineering community
Acknowledgments This research project was supported by an Engineering and Physical Sciences ResearchCouncil (EPSRC) Impact Acceleration grant The topographical and hydrological data for the Borth study wereprovided by Natural Resources Wales (NRW) The contribution of these organisations is gratefully acknowledgedThe authors would also like to thank Thomas Green from Advance Research ComputingmdashCardiff University(ARCCA) for his assistance in using the Universityrsquos high-performance computing facilities
Author Contributions Davor Kvocka was the Research Associate on the project and set-up the model applicationsand undertook the studies including assessing the conditions under which shock-capturing algorithms need tobe included Roger A Falconer and Reza Ahmadian have been leading a wide range of research projects in floodrisk modelling and were instrumental in developing the original models Davor Kvocka drafted the manuscriptwhich was refined by all authors
Conflicts of Interest The authors declare no conflict of interest The founding sponsors had no role in the designof the study in the collection analyses or interpretation of data in the writing of the manuscript and in thedecision to publish the results
References
1 United Nations (UN) World Urbanizations Prospects The 2014 Revision United Nations New York NY USA 20142 United Nations (UN) World Population Prospects The 2015 Revision United Nations New York NY USA 20153 Guumlneralp B Guumlneralp I Liu Y Changing global patterns of urban exposure to flood and drought hazards
Glob Environ Chang 2015 31 217ndash225 [CrossRef]
Water 2017 9 705 15 of 16
4 Muis S Guumlneralp B Jongman B Aerts JC Ward PJ Flood risk and adaptation strategies under climatechange and urban expansion A probabilistic analysis using global data Sci Total Environ 2015 538 445ndash457[CrossRef] [PubMed]
5 HM Government National Flood Resilience Review HM Government London UK 2016 p 1456 Neelz S Pender G Benchmarking the Latest Generation of 2d Hydraulic Modelling Packages Environment Agency
Bristol UK 20137 Hunter N Bates P Neelz S Pender G Villanueva I Wright N Liang D Falconer RA Lin B
Waller S Benchmarking 2d Hydraulic Models for Urban Flood Simulations In Proceedings of the Institutionof Civil EngineersmdashWater Management Thomas Telford (ICE Publishing) London UK 2008 pp 13ndash30
8 Neacuteelz S Pender G Benchmarking of 2d Hydraulic Modelling Packages SC080035SR2 Environment AgencyBristol UK 2010
9 Neal J Villanueva I Wright N Willis T Fewtrell T Bates P How much physical complexity is neededto model flood inundation Hydrol Process 2012 26 2264ndash2282 [CrossRef]
10 Kvocka D Falconer RA Bray M Appropriate model use for predicting elevations and inundation extentfor extreme flood events Nat Hazards 2015 79 1791ndash1808 [CrossRef]
11 Faulkner H Parker D Green C Beven K Developing a translational discourse to communicateuncertainty in flood risk between science and the practitioner AMBIO J Hum Environ 2007 36 692ndash704[CrossRef]
12 Janssen JA Hoekstra AY de Kok J-L Schielen RM Delineating the model-stakeholder gap Framingperceptions to analyse the information requirement in river management Water Resour Manag 200923 1423ndash1445 [CrossRef]
13 Timmerman J Beinat E Termeer C Cofino W A methodology to bridge the water information gapWater Sci Technol 2010 62 2419ndash2426 [CrossRef] [PubMed]
14 Wood M Kovacs D Bostrom A Bridges T Linkov I Flood risk management US army corps ofengineers and layperson perceptions Risk Anal 2012 32 1349ndash1368 [CrossRef] [PubMed]
15 Leskens J Brugnach M Hoekstra A Schuurmans W Why are decisions in flood disaster management sopoorly supported by information from flood models Environ Model Softw 2014 53 53ndash61 [CrossRef]
16 Leskens JG Kehl C Tutenel T Kol T Haan Gd Stelling G Eisemann E An interactive simulationand visualization tool for flood analysis usable for practitioners Mitig Adapt Strateg Glob Chang 201722 307ndash324 [CrossRef]
17 Rozalis S Morin E Yair Y Price C Flash flood prediction using an uncalibrated hydrological model andradar rainfall data in a mediterranean watershed under changing hydrological conditions J Hydrol 2010394 245ndash255 [CrossRef]
18 Hill C Verjee F Flash Flood Early Warning System Reference Guide 2010 University Corporation forAtmospheric Research Boulder CO USA 2010
19 Marchi L Borga M Preciso E Gaume E Characterisation of selected extreme flash floods in europe andimplications for flood risk management J Hydrol 2010 394 118ndash133 [CrossRef]
20 Gaume E Bain V Bernardara P Newinger O Barbuc M Bateman A Blaškovicovaacute L Bloumlschl GBorga M Dumitrescu A et al A compilation of data on european flash floods J Hydrol 2009 367 70ndash78[CrossRef]
21 Foulds S Brewer P Macklin M Betson R Rassner S Causes and Consequences of a Large SummerStorm and Flood in West Wales 8thndash9th June 2012 Fluvio Report No 20120173 Aberystwyth UniversityAberystwyth UK 2012 p 53
22 Lin B Wicks JM Falconer RA Adams K Integrating 1d and 2d hydrodynamic models for floodsimulation In Proceedings of the Institution of Civil EngineersmdashWater Management ICE Virtual Library(ICE Publishing) London UK 2006 Volume 159 pp 19ndash25
23 BBC Wales Flooding Major Rescue Continuing Near Aberystwyth Available online httpwwwbbccouknewsuk-wales-18378124 (accessed on 1 November 2016)
24 Ceredigion County Council Flood Investigation Report North Ceredigion 8 and 9 June 2012 Availableonline httpwwwceredigiongovukutilitiesactionact_downloadcfmmediaid=43372 (accessed on1 November 2016)
25 Liang D Falconer RA Lin B Comparison between tvd-maccormack and adi-type solvers of the shallowwater equations Adv Water Resour 2006 29 1833ndash1845 [CrossRef]
Water 2017 9 705 16 of 16
26 Mingham CG Causon DM Ingram D Mingham CG Causon DM Ingram D A tvd maccormackscheme for transcritical flow In Proceedings of the Institution of Civil EngineersmdashWater and Maritime EngineeringICE Virtual Library (ICE Publishing) London UK 2001 Volume 148 pp 167ndash175
27 Liang D Lin B Falconer RA A boundary-fitted numerical model for flood routing with shock-capturingcapability J Hydrol 2007 332 477ndash486 [CrossRef]
28 Ahmadian R Falconer RA Wicks J Benchmarking of flood inundation extent using various dynamicallylinked one- and two-dimensional approaches J Flood Risk Manag 2015 [CrossRef]
29 Kvocka D Falconer RA Bray M Flood hazard assessment for extreme flood events Nat Hazards 201684 1569ndash1599 [CrossRef]
30 Rogers BD Borthwick AG Taylor PH Mathematical balancing of flux gradient and source terms priorto using roersquos approximate riemann solver J Comput Phys 2003 192 422ndash451 [CrossRef]
31 Strang G On the construction and comparison of difference schemes SIAM J Numer Anal 1968 5 506ndash517[CrossRef]
32 CH2M Flood Modeller Pro User Manual Available online httphelpfloodmodellercomfloodmodeller(accessed on 1 November 2016)
33 Ozdemir H Sampson C de Almeida GA Bates P Evaluating scale and roughness effects in urban floodmodelling using terrestrial lidar data Hydrol Earth Syst Sci 2013 10 5903ndash5942 [CrossRef]
34 Ancey C Debris flows In Environmental Geomechanics Schrefler B Delage P Eds John Wiley amp SonsHoboken NJ USA 2013 pp 1ndash37
35 WalesOnline Lessons to Be Learnt from Ceredigion Floods Available online httpwwwwalesonlinecouknewswales-newslessons-learnt-ceredigion-floods-6520699 (accessed on 7 December 2016)
36 BBC Dol-y-Bont Resident Jason Hughes Recalls lsquoAwfulrsquo Flood Available online httpwwwbbccouknewsuk-wales-18391889 (accessed on 11 November 2016)
37 ITV Floods Overrun Luxury Caravan Park Available online httpwwwitvcomnewsupdate2012-06-09flood-overruns-luxury-caravan-park (accessed on 11 November 2016)
38 WalesOnline Astonishing Pictures and Video of Flooding Rescues from Aberystwythrsquos Stricken VillagesAvailable online httpwwwwalesonlinecouknewslocal-newsastonishing-pictures-video-flooding-rescues-2052558 (accessed on 17 November 2016)
39 Martins R Leandro J Djordjevic S A well balanced roe scheme for the local inertial equations withan unstructured mesh Adv Water Resour 2015 83 351ndash363 [CrossRef]
40 Gourley JJ Flamig ZL Hong Y Howard KW Evaluation of past present and future tools for radar-basedflash-flood prediction in the USA Hydrol Sci J 2014 59 1377ndash1389 [CrossRef]
copy 2017 by the authors Licensee MDPI Basel Switzerland This article is an open accessarticle distributed under the terms and conditions of the Creative Commons Attribution(CC BY) license (httpcreativecommonsorglicensesby40)
- Introduction
- Study Areas
-
- Idealised Valley
- Borth (Wales UK)
-
- Numerical Model
- Methodology
- Results and Discussion
-
- Idealised Valley Test Case
- Flood Inundation Modelling around Borth
-
- Conclusions
-

Water 2017 9 705 10 of 16
52 Flood Inundation Modelling around Borth
All simulations were run on Cardiff Universityrsquos supercomputer The TVD simulation case wascompleted in seven days whereas the MAC and SI simulation case were completed in around five daysThe predicted maximum water depths from the three considered model configurations were comparedat several monitoring points around Tal-y-bont Dol-y-bont and Borth (see Figure 5) It was possible toestimate the maximum flood levels for the 2012 flash flood for several of these locations due to extensivemedia reports These observationsestimations of the actual flood depths for the 2012 River Leri flashflood allowed for some level of validation of the modelling results The observedestimated floodlevels for the 2012 River Leri flash flood are summarised in Table 2
Water 2017 9 705 10 of 16
52 Flood Inundation Modelling around Borth
All simulations were run on Cardiff Universityrsquos supercomputer The TVD simulation case was completed in seven days whereas the MAC and SI simulation case were completed in around five days The predicted maximum water depths from the three considered model configurations were compared at several monitoring points around Tal-y-bont Dol-y-bont and Borth (see Figure 5) It was possible to estimate the maximum flood levels for the 2012 flash flood for several of these locations due to extensive media reports These observationsestimations of the actual flood depths for the 2012 River Leri flash flood allowed for some level of validation of the modelling results The observedestimated flood levels for the 2012 River Leri flash flood are summarised in Table 2
Figure 5 Approximate locations of the selected monitoring points around Tal-y-bont Dol-y-bont and Borth (adopted from Google maps)
Figure 6 shows the predicted maximum water depths at the selected monitoring points for the TVD MAC and SI model configurations It can be seen in Figure 6 that the TVD model configuration matched the observedestimated flood depth data most accurately whereas the MAC and SI model configurations were less accurate This can be more readily observed from Table 3 which shows the difference in water depth predictions between the simulated results and the estimatedobserved values for the Borth study case expressed in terms of percentage errors The greatest difference between the simulated results can be observed in the steepest part of the domain (ie Tal-y-bont) while the differences are smaller in the flatter parts of the domain (eg Dol-y-bont) As it was shown for the idealised valley test case steep river basins are often characterised by high velocity and high Froude number flows Such flow conditions usually cause numerical instabilities in the model
Figure 5 Approximate locations of the selected monitoring points around Tal-y-bont Dol-y-bont andBorth (adopted from Google maps)
Figure 6 shows the predicted maximum water depths at the selected monitoring points for theTVD MAC and SI model configurations It can be seen in Figure 6 that the TVD model configurationmatched the observedestimated flood depth data most accurately whereas the MAC and SI modelconfigurations were less accurate This can be more readily observed from Table 3 which showsthe difference in water depth predictions between the simulated results and the estimatedobservedvalues for the Borth study case expressed in terms of percentage errors The greatest differencebetween the simulated results can be observed in the steepest part of the domain (ie Tal-y-bont)while the differences are smaller in the flatter parts of the domain (eg Dol-y-bont) As it was shownfor the idealised valley test case steep river basins are often characterised by high velocity andhigh Froude number flows Such flow conditions usually cause numerical instabilities in the modelsolution of simplified 2D and full hydrodynamic 2D models and consequently result in erroneousmodel predictions
Water 2017 9 705 11 of 16
Table 2 The observedestimated flood levels for the 2012 River Leri flash flood
Monitoring Point ObservedEstimated Depth Source
5 05 m Picture [2335]12 12 m Eye-witness account [23]17 12 m Eye-witness account [36]18 03 m Picture (Retrieved from httpwwwalanannacouk)19 03 m Picture (Retrieved from httpwwwalanannacouk)20 03 m Picture (Retrieved from httpwwwalanannacouk)24 05 m Picture [37]25 05 m Picture [38]27 03 m Picture (Retrieved from httpwwwalanannacouk)
Water 2017 9 705 11 of 16
solution of simplified 2D and full hydrodynamic 2D models and consequently result in erroneous model predictions
Table 2 The observedestimated flood levels for the 2012 River Leri flash flood
Monitoring Point ObservedEstimated Depth Source5 05 m Picture [2335] 12 12 m Eye-witness account [23] 17 12 m Eye-witness account [36] 18 03 m Picture (Retrieved from httpwwwalanannacouk) 19 03 m Picture (Retrieved from httpwwwalanannacouk) 20 03 m Picture (Retrieved from httpwwwalanannacouk) 24 05 m Picture [37] 25 05 m Picture [38] 27 03 m Picture (Retrieved from httpwwwalanannacouk)
Figure 6 Predicted maximum water depths at the selected monitoring points for the TVD MAC and SI model configurations
Table 3 The difference in water depth predictions between the simulated results and the estimatedobserved values for the Borth study case expressed in terms of percentage errors
Monitoring Point TVD MAC SI5 1075 1810 20726
12 271 3815 2705 17 232 1806 2768 18 1655 4743 4722 19 767 7037 7080 20 1445 6786 6476 24 1958 10000 7837 25 1342 6131 2396 27 683 3107 1699
For example Figure 7 shows the predicted maximum Froude numbers in the areas around Tal-y-bont Dol-y-bont and Borth It can be seen in Figure 7 that the supercritical flow conditions occurred throughout the area around Tal-y-bont This was as expected since the average value of the bed slope for the River Leri around Tal-y-bont is well above 1 The volatile flow conditions led to the
Figure 6 Predicted maximum water depths at the selected monitoring points for the TVD MAC andSI model configurations
Table 3 The difference in water depth predictions between the simulated results and theestimatedobserved values for the Borth study case expressed in terms of percentage errors
Monitoring Point TVD MAC SI
5 1075 1810 2072612 271 3815 270517 232 1806 276818 1655 4743 472219 767 7037 708020 1445 6786 647624 1958 10000 783725 1342 6131 239627 683 3107 1699
For example Figure 7 shows the predicted maximum Froude numbers in the areas aroundTal-y-bont Dol-y-bont and Borth It can be seen in Figure 7 that the supercritical flow conditionsoccurred throughout the area around Tal-y-bont This was as expected since the average value of thebed slope for the River Leri around Tal-y-bont is well above 1 The volatile flow conditions led to theoccurrence of numerical instabilities in the model solution of the MAC and SI model configurationsThis resulted in erroneous water depth predictions in the area around Tal-y-bont for the MAC and SI
Water 2017 9 705 12 of 16
model configurations On the contrary the TVD model configuration did not experience numericalinstabilities due to the shock-capturing capability Therefore the TVD configuration produced themost realistic flood depth predictions in the area around Tal-y-bont (see Figure 6)
Figure 7 also shows that the occurrence of supercritical flow conditions was less frequent in thearea around Dol-y-bont when compared to the area around Tal-y-bont This was again as expectedsince the average value of the bed slope for the River Leri at Dol-y-bont is around 06 Thereforethe flow conditions around Dol-y-bont were less volatile than the flow conditions further upstreamaround Tal-y-bont This meant that the MAC and SI model configurations were less susceptible to theemergence of numerical instabilities in the solution procedure Thus these two model configurationspredicted more realistic flood depths in the area around Dol-y-bont than they did in the area aroundTal-y-bont (see Figure 6)
Water 2017 9 705 12 of 16
occurrence of numerical instabilities in the model solution of the MAC and SI model configurations This resulted in erroneous water depth predictions in the area around Tal-y-bont for the MAC and SI model configurations On the contrary the TVD model configuration did not experience numerical instabilities due to the shock-capturing capability Therefore the TVD configuration produced the most realistic flood depth predictions in the area around Tal-y-bont (see Figure 6)
Figure 7 also shows that the occurrence of supercritical flow conditions was less frequent in the area around Dol-y-bont when compared to the area around Tal-y-bont This was again as expected since the average value of the bed slope for the River Leri at Dol-y-bont is around 06 Therefore the flow conditions around Dol-y-bont were less volatile than the flow conditions further upstream around Tal-y-bont This meant that the MAC and SI model configurations were less susceptible to the emergence of numerical instabilities in the solution procedure Thus these two model configurations predicted more realistic flood depths in the area around Dol-y-bont than they did in the area around Tal-y-bont (see Figure 6)
Figure 7 Predicted maximum Froude numbers around Tal-y-bont Dol-y-bont and Borth
It can also be seen in Figure 7 that the flow conditions were relatively mild around Borth with the maximum Froude number generally being less than 05 This was also as expected since the terrain around Borth is nearly horizontal Therefore it would be reasonable to assume that the difference between the model predictions should be the smallest in this area For example Table 4 shows the average difference in the water depth predictions between the MAC and TVD and SI and TVD test cases at the selected monitoring points in the Borth study domain It can be again seen in Table 4 that the greatest difference in the model predictions occurred where the gradient was steep and the smallest where the gradient was mild However Table 4 also outlines the main differences between
Figure 7 Predicted maximum Froude numbers around Tal-y-bont Dol-y-bont and Borth
It can also be seen in Figure 7 that the flow conditions were relatively mild around Borth with themaximum Froude number generally being less than 05 This was also as expected since the terrainaround Borth is nearly horizontal Therefore it would be reasonable to assume that the differencebetween the model predictions should be the smallest in this area For example Table 4 shows theaverage difference in the water depth predictions between the MAC and TVD and SI and TVD testcases at the selected monitoring points in the Borth study domain It can be again seen in Table 4that the greatest difference in the model predictions occurred where the gradient was steep and thesmallest where the gradient was mild However Table 4 also outlines the main differences between
Water 2017 9 705 13 of 16
the simplified and full hydrodynamic 2D solvers when modelling flood events with a high Froudenumber or supercritical flows
Table 4 Average difference in water depth predictions between the MAC and TVD and SI and TVDmodel configurations at the selected monitoring points in the Borth study domain
Bed SlopeAverage Difference in the Water Depth Prediction
MAC vs TVD SI vs TVD
S gt 001 409 cm 990 cm001 gt S gt 0001 259 cm 262 cm
S asymp 0001 236 cm 87 cm
As discussed earlier flow conditions were particularly volatile in the steeper parts of thedomain (see Figure 7) This meant for example that the full 2D hydrodynamic model would havemajor difficulties in preserving the peak flood wave along the entire modelling reach due to theadvection terms As indicated earlier advection terms can cause numerical instabilities when full2D hydrodynamic schemes are used to model high Froude number or supercritical flows The rise ofnumerical instabilities generally lead to erroneous predictions in the areas where the gradients aresteep (see Figure 6) and usually result in the dissipation of the peak flood wave This means that suchmodels would thus be prone to under-predict flood levels in the areas further downstream where thegradients are less steep This course of events can also be observed in this study for the MAC modelconfiguration (eg see Figure 6 for the Borth area)
The simplified 2D models (eg the SI configuration in this study) generally also have difficulties inpreserving the peak flood wave along the entire modelling reach that includes areas characterised by ahigh Froude number or supercritical flows For example the SI model configuration did not include theadvection terms which significantly increased the numerical stability However the complete exclusionof advection terms reduces the accuracy of the model predictions This is particularly evident in areascharacterised by a high Froude number or supercritical flows For example the SI model configurationgreatly over-predicted the peak flood levels in the steepest parts of the domain (eg see Figure 6 forthe Tal-y-bont area) where the flow conditions were the most volatile (see Figure 7) On the other handthe SI model configuration predicted (numerically) more accurate flood depths in the flatter parts ofthe domain (eg see Figure 6 for the Borth area) The flow conditions in this area were generally mild(see Figure 7) Thus decreased physical complexity in the model solution had less of an impact on theaccuracy of the SI model predictions
Simplified and full hydrodynamic 2D models can produce accurate model predictions for floodscenarios that include a high Froude number or supercritical flows if these flows are not dominantduring the simulation process [939] For such studies model instability can be reduced by artificiallyimproving modelling results eg introducing a small patch of high roughness to slow water downin the problematic areas [32] However such procedures are not generic and should be applied withcaution because the level of such improvements is based on the modellerrsquos perception of how muchfine-tuning is needed [1032]
Finally simplified and full hydrodynamic 2D models can produce (to some extent) realistic floodlevel predictions for rapidly varying flood events if there exists quality validation data that canbe used to fine-tune the models However quality validation and calibration data for flood eventsoccurring in steep catchments (eg flash floods) are generally scarce [40] Therefore the physicaland mathematical complexity in the model solution is particularly important for studies conductedin torrential river basins and catchments because the validation of the modelling results is oftenimpossible Thus shock-capturing models are more appropriate for such flood studies as these modelscan produce (numerically) accurate predictions for high Froude numbers or supercritical flows withoutany additional modification or improvements of the modelling procedure
Water 2017 9 705 14 of 16
6 Conclusions
In this paper we have investigated the threshold value of the bed slope that could stand asan orientation guide as to when to use a specific type of flood inundation model Three differentmodel configurations of the DIVAST-TVD model were considered in this study (i) a configuration thatincluded a shock-capturing ability (ie the TVD test case) (ii) a configuration that solved the full 2Dshallow water equations (ie the MAC test case) and (iii) a configuration based on a simplified versionof the 2D shallow water equations (ie the SI test case) The three considered model configurationswere used to model two different flood events ie a flood wave propagating along an idealised valleyand a flash flood event in Wales UK
The results obtained indicate that in torrential or flashy river basins or catchments (ie riverbasins and catchments with a stream gradient generally greater than 1) flood inundation modellingshould be undertaken using flood inundation models with shock-capturing (or similar) capabilitySteep catchments are prone to the occurrence of high Froude numbers and supercritical flowsSuch flow conditions usually cause numerical instabilities (eg spurious oscillations) in the modelsolution of simplified 2D and full hydrodynamic 2D models These instabilities can lead to the dissipationof the peak flood wave and consequently to erroneous model predictions Even though flood inundationmodels with shock-capturing (or similar) capabilities are generally more computationally expensivethese models prevent the occurrence of numerical instabilities and thus prevent the dissipation of theflood wave Therefore such models can predict (numerically) accurate flood levels for flood eventscharacterised by high Froude numbers or supercritical flows such as floods occurring in steep riverbasins and catchments (eg flash floods)
This paper proposes an orientation value of the bed slope (ie 1) that can be used as a guideas when to use a specific type of flood inundation model Therefore further research is needed todevelop more detailed modelling guidelines for steep river basins and catchments Future research willinclude more rigorous testing conditions and more complex modelling environments As indicatedwithin this paper modelling in steep river basins is faced with many difficulties eg a lack of qualitydata etc Therefore future research would also benefit from closer cooperation between academicresearchers regulatory authorities and flood risk practitioners which would enable more efficientsharing of information data and practical experience All these would help in easier development andlater implementation of the state-of-the-art modelling techniques to the practical hydro-environmentalengineering community
Acknowledgments This research project was supported by an Engineering and Physical Sciences ResearchCouncil (EPSRC) Impact Acceleration grant The topographical and hydrological data for the Borth study wereprovided by Natural Resources Wales (NRW) The contribution of these organisations is gratefully acknowledgedThe authors would also like to thank Thomas Green from Advance Research ComputingmdashCardiff University(ARCCA) for his assistance in using the Universityrsquos high-performance computing facilities
Author Contributions Davor Kvocka was the Research Associate on the project and set-up the model applicationsand undertook the studies including assessing the conditions under which shock-capturing algorithms need tobe included Roger A Falconer and Reza Ahmadian have been leading a wide range of research projects in floodrisk modelling and were instrumental in developing the original models Davor Kvocka drafted the manuscriptwhich was refined by all authors
Conflicts of Interest The authors declare no conflict of interest The founding sponsors had no role in the designof the study in the collection analyses or interpretation of data in the writing of the manuscript and in thedecision to publish the results
References
1 United Nations (UN) World Urbanizations Prospects The 2014 Revision United Nations New York NY USA 20142 United Nations (UN) World Population Prospects The 2015 Revision United Nations New York NY USA 20153 Guumlneralp B Guumlneralp I Liu Y Changing global patterns of urban exposure to flood and drought hazards
Glob Environ Chang 2015 31 217ndash225 [CrossRef]
Water 2017 9 705 15 of 16
4 Muis S Guumlneralp B Jongman B Aerts JC Ward PJ Flood risk and adaptation strategies under climatechange and urban expansion A probabilistic analysis using global data Sci Total Environ 2015 538 445ndash457[CrossRef] [PubMed]
5 HM Government National Flood Resilience Review HM Government London UK 2016 p 1456 Neelz S Pender G Benchmarking the Latest Generation of 2d Hydraulic Modelling Packages Environment Agency
Bristol UK 20137 Hunter N Bates P Neelz S Pender G Villanueva I Wright N Liang D Falconer RA Lin B
Waller S Benchmarking 2d Hydraulic Models for Urban Flood Simulations In Proceedings of the Institutionof Civil EngineersmdashWater Management Thomas Telford (ICE Publishing) London UK 2008 pp 13ndash30
8 Neacuteelz S Pender G Benchmarking of 2d Hydraulic Modelling Packages SC080035SR2 Environment AgencyBristol UK 2010
9 Neal J Villanueva I Wright N Willis T Fewtrell T Bates P How much physical complexity is neededto model flood inundation Hydrol Process 2012 26 2264ndash2282 [CrossRef]
10 Kvocka D Falconer RA Bray M Appropriate model use for predicting elevations and inundation extentfor extreme flood events Nat Hazards 2015 79 1791ndash1808 [CrossRef]
11 Faulkner H Parker D Green C Beven K Developing a translational discourse to communicateuncertainty in flood risk between science and the practitioner AMBIO J Hum Environ 2007 36 692ndash704[CrossRef]
12 Janssen JA Hoekstra AY de Kok J-L Schielen RM Delineating the model-stakeholder gap Framingperceptions to analyse the information requirement in river management Water Resour Manag 200923 1423ndash1445 [CrossRef]
13 Timmerman J Beinat E Termeer C Cofino W A methodology to bridge the water information gapWater Sci Technol 2010 62 2419ndash2426 [CrossRef] [PubMed]
14 Wood M Kovacs D Bostrom A Bridges T Linkov I Flood risk management US army corps ofengineers and layperson perceptions Risk Anal 2012 32 1349ndash1368 [CrossRef] [PubMed]
15 Leskens J Brugnach M Hoekstra A Schuurmans W Why are decisions in flood disaster management sopoorly supported by information from flood models Environ Model Softw 2014 53 53ndash61 [CrossRef]
16 Leskens JG Kehl C Tutenel T Kol T Haan Gd Stelling G Eisemann E An interactive simulationand visualization tool for flood analysis usable for practitioners Mitig Adapt Strateg Glob Chang 201722 307ndash324 [CrossRef]
17 Rozalis S Morin E Yair Y Price C Flash flood prediction using an uncalibrated hydrological model andradar rainfall data in a mediterranean watershed under changing hydrological conditions J Hydrol 2010394 245ndash255 [CrossRef]
18 Hill C Verjee F Flash Flood Early Warning System Reference Guide 2010 University Corporation forAtmospheric Research Boulder CO USA 2010
19 Marchi L Borga M Preciso E Gaume E Characterisation of selected extreme flash floods in europe andimplications for flood risk management J Hydrol 2010 394 118ndash133 [CrossRef]
20 Gaume E Bain V Bernardara P Newinger O Barbuc M Bateman A Blaškovicovaacute L Bloumlschl GBorga M Dumitrescu A et al A compilation of data on european flash floods J Hydrol 2009 367 70ndash78[CrossRef]
21 Foulds S Brewer P Macklin M Betson R Rassner S Causes and Consequences of a Large SummerStorm and Flood in West Wales 8thndash9th June 2012 Fluvio Report No 20120173 Aberystwyth UniversityAberystwyth UK 2012 p 53
22 Lin B Wicks JM Falconer RA Adams K Integrating 1d and 2d hydrodynamic models for floodsimulation In Proceedings of the Institution of Civil EngineersmdashWater Management ICE Virtual Library(ICE Publishing) London UK 2006 Volume 159 pp 19ndash25
23 BBC Wales Flooding Major Rescue Continuing Near Aberystwyth Available online httpwwwbbccouknewsuk-wales-18378124 (accessed on 1 November 2016)
24 Ceredigion County Council Flood Investigation Report North Ceredigion 8 and 9 June 2012 Availableonline httpwwwceredigiongovukutilitiesactionact_downloadcfmmediaid=43372 (accessed on1 November 2016)
25 Liang D Falconer RA Lin B Comparison between tvd-maccormack and adi-type solvers of the shallowwater equations Adv Water Resour 2006 29 1833ndash1845 [CrossRef]
Water 2017 9 705 16 of 16
26 Mingham CG Causon DM Ingram D Mingham CG Causon DM Ingram D A tvd maccormackscheme for transcritical flow In Proceedings of the Institution of Civil EngineersmdashWater and Maritime EngineeringICE Virtual Library (ICE Publishing) London UK 2001 Volume 148 pp 167ndash175
27 Liang D Lin B Falconer RA A boundary-fitted numerical model for flood routing with shock-capturingcapability J Hydrol 2007 332 477ndash486 [CrossRef]
28 Ahmadian R Falconer RA Wicks J Benchmarking of flood inundation extent using various dynamicallylinked one- and two-dimensional approaches J Flood Risk Manag 2015 [CrossRef]
29 Kvocka D Falconer RA Bray M Flood hazard assessment for extreme flood events Nat Hazards 201684 1569ndash1599 [CrossRef]
30 Rogers BD Borthwick AG Taylor PH Mathematical balancing of flux gradient and source terms priorto using roersquos approximate riemann solver J Comput Phys 2003 192 422ndash451 [CrossRef]
31 Strang G On the construction and comparison of difference schemes SIAM J Numer Anal 1968 5 506ndash517[CrossRef]
32 CH2M Flood Modeller Pro User Manual Available online httphelpfloodmodellercomfloodmodeller(accessed on 1 November 2016)
33 Ozdemir H Sampson C de Almeida GA Bates P Evaluating scale and roughness effects in urban floodmodelling using terrestrial lidar data Hydrol Earth Syst Sci 2013 10 5903ndash5942 [CrossRef]
34 Ancey C Debris flows In Environmental Geomechanics Schrefler B Delage P Eds John Wiley amp SonsHoboken NJ USA 2013 pp 1ndash37
35 WalesOnline Lessons to Be Learnt from Ceredigion Floods Available online httpwwwwalesonlinecouknewswales-newslessons-learnt-ceredigion-floods-6520699 (accessed on 7 December 2016)
36 BBC Dol-y-Bont Resident Jason Hughes Recalls lsquoAwfulrsquo Flood Available online httpwwwbbccouknewsuk-wales-18391889 (accessed on 11 November 2016)
37 ITV Floods Overrun Luxury Caravan Park Available online httpwwwitvcomnewsupdate2012-06-09flood-overruns-luxury-caravan-park (accessed on 11 November 2016)
38 WalesOnline Astonishing Pictures and Video of Flooding Rescues from Aberystwythrsquos Stricken VillagesAvailable online httpwwwwalesonlinecouknewslocal-newsastonishing-pictures-video-flooding-rescues-2052558 (accessed on 17 November 2016)
39 Martins R Leandro J Djordjevic S A well balanced roe scheme for the local inertial equations withan unstructured mesh Adv Water Resour 2015 83 351ndash363 [CrossRef]
40 Gourley JJ Flamig ZL Hong Y Howard KW Evaluation of past present and future tools for radar-basedflash-flood prediction in the USA Hydrol Sci J 2014 59 1377ndash1389 [CrossRef]
copy 2017 by the authors Licensee MDPI Basel Switzerland This article is an open accessarticle distributed under the terms and conditions of the Creative Commons Attribution(CC BY) license (httpcreativecommonsorglicensesby40)
- Introduction
- Study Areas
-
- Idealised Valley
- Borth (Wales UK)
-
- Numerical Model
- Methodology
- Results and Discussion
-
- Idealised Valley Test Case
- Flood Inundation Modelling around Borth
-
- Conclusions
-

Water 2017 9 705 11 of 16
Table 2 The observedestimated flood levels for the 2012 River Leri flash flood
Monitoring Point ObservedEstimated Depth Source
5 05 m Picture [2335]12 12 m Eye-witness account [23]17 12 m Eye-witness account [36]18 03 m Picture (Retrieved from httpwwwalanannacouk)19 03 m Picture (Retrieved from httpwwwalanannacouk)20 03 m Picture (Retrieved from httpwwwalanannacouk)24 05 m Picture [37]25 05 m Picture [38]27 03 m Picture (Retrieved from httpwwwalanannacouk)
Water 2017 9 705 11 of 16
solution of simplified 2D and full hydrodynamic 2D models and consequently result in erroneous model predictions
Table 2 The observedestimated flood levels for the 2012 River Leri flash flood
Monitoring Point ObservedEstimated Depth Source5 05 m Picture [2335] 12 12 m Eye-witness account [23] 17 12 m Eye-witness account [36] 18 03 m Picture (Retrieved from httpwwwalanannacouk) 19 03 m Picture (Retrieved from httpwwwalanannacouk) 20 03 m Picture (Retrieved from httpwwwalanannacouk) 24 05 m Picture [37] 25 05 m Picture [38] 27 03 m Picture (Retrieved from httpwwwalanannacouk)
Figure 6 Predicted maximum water depths at the selected monitoring points for the TVD MAC and SI model configurations
Table 3 The difference in water depth predictions between the simulated results and the estimatedobserved values for the Borth study case expressed in terms of percentage errors
Monitoring Point TVD MAC SI5 1075 1810 20726
12 271 3815 2705 17 232 1806 2768 18 1655 4743 4722 19 767 7037 7080 20 1445 6786 6476 24 1958 10000 7837 25 1342 6131 2396 27 683 3107 1699
For example Figure 7 shows the predicted maximum Froude numbers in the areas around Tal-y-bont Dol-y-bont and Borth It can be seen in Figure 7 that the supercritical flow conditions occurred throughout the area around Tal-y-bont This was as expected since the average value of the bed slope for the River Leri around Tal-y-bont is well above 1 The volatile flow conditions led to the
Figure 6 Predicted maximum water depths at the selected monitoring points for the TVD MAC andSI model configurations
Table 3 The difference in water depth predictions between the simulated results and theestimatedobserved values for the Borth study case expressed in terms of percentage errors
Monitoring Point TVD MAC SI
5 1075 1810 2072612 271 3815 270517 232 1806 276818 1655 4743 472219 767 7037 708020 1445 6786 647624 1958 10000 783725 1342 6131 239627 683 3107 1699
For example Figure 7 shows the predicted maximum Froude numbers in the areas aroundTal-y-bont Dol-y-bont and Borth It can be seen in Figure 7 that the supercritical flow conditionsoccurred throughout the area around Tal-y-bont This was as expected since the average value of thebed slope for the River Leri around Tal-y-bont is well above 1 The volatile flow conditions led to theoccurrence of numerical instabilities in the model solution of the MAC and SI model configurationsThis resulted in erroneous water depth predictions in the area around Tal-y-bont for the MAC and SI
Water 2017 9 705 12 of 16
model configurations On the contrary the TVD model configuration did not experience numericalinstabilities due to the shock-capturing capability Therefore the TVD configuration produced themost realistic flood depth predictions in the area around Tal-y-bont (see Figure 6)
Figure 7 also shows that the occurrence of supercritical flow conditions was less frequent in thearea around Dol-y-bont when compared to the area around Tal-y-bont This was again as expectedsince the average value of the bed slope for the River Leri at Dol-y-bont is around 06 Thereforethe flow conditions around Dol-y-bont were less volatile than the flow conditions further upstreamaround Tal-y-bont This meant that the MAC and SI model configurations were less susceptible to theemergence of numerical instabilities in the solution procedure Thus these two model configurationspredicted more realistic flood depths in the area around Dol-y-bont than they did in the area aroundTal-y-bont (see Figure 6)
Water 2017 9 705 12 of 16
occurrence of numerical instabilities in the model solution of the MAC and SI model configurations This resulted in erroneous water depth predictions in the area around Tal-y-bont for the MAC and SI model configurations On the contrary the TVD model configuration did not experience numerical instabilities due to the shock-capturing capability Therefore the TVD configuration produced the most realistic flood depth predictions in the area around Tal-y-bont (see Figure 6)
Figure 7 also shows that the occurrence of supercritical flow conditions was less frequent in the area around Dol-y-bont when compared to the area around Tal-y-bont This was again as expected since the average value of the bed slope for the River Leri at Dol-y-bont is around 06 Therefore the flow conditions around Dol-y-bont were less volatile than the flow conditions further upstream around Tal-y-bont This meant that the MAC and SI model configurations were less susceptible to the emergence of numerical instabilities in the solution procedure Thus these two model configurations predicted more realistic flood depths in the area around Dol-y-bont than they did in the area around Tal-y-bont (see Figure 6)
Figure 7 Predicted maximum Froude numbers around Tal-y-bont Dol-y-bont and Borth
It can also be seen in Figure 7 that the flow conditions were relatively mild around Borth with the maximum Froude number generally being less than 05 This was also as expected since the terrain around Borth is nearly horizontal Therefore it would be reasonable to assume that the difference between the model predictions should be the smallest in this area For example Table 4 shows the average difference in the water depth predictions between the MAC and TVD and SI and TVD test cases at the selected monitoring points in the Borth study domain It can be again seen in Table 4 that the greatest difference in the model predictions occurred where the gradient was steep and the smallest where the gradient was mild However Table 4 also outlines the main differences between
Figure 7 Predicted maximum Froude numbers around Tal-y-bont Dol-y-bont and Borth
It can also be seen in Figure 7 that the flow conditions were relatively mild around Borth with themaximum Froude number generally being less than 05 This was also as expected since the terrainaround Borth is nearly horizontal Therefore it would be reasonable to assume that the differencebetween the model predictions should be the smallest in this area For example Table 4 shows theaverage difference in the water depth predictions between the MAC and TVD and SI and TVD testcases at the selected monitoring points in the Borth study domain It can be again seen in Table 4that the greatest difference in the model predictions occurred where the gradient was steep and thesmallest where the gradient was mild However Table 4 also outlines the main differences between
Water 2017 9 705 13 of 16
the simplified and full hydrodynamic 2D solvers when modelling flood events with a high Froudenumber or supercritical flows
Table 4 Average difference in water depth predictions between the MAC and TVD and SI and TVDmodel configurations at the selected monitoring points in the Borth study domain
Bed SlopeAverage Difference in the Water Depth Prediction
MAC vs TVD SI vs TVD
S gt 001 409 cm 990 cm001 gt S gt 0001 259 cm 262 cm
S asymp 0001 236 cm 87 cm
As discussed earlier flow conditions were particularly volatile in the steeper parts of thedomain (see Figure 7) This meant for example that the full 2D hydrodynamic model would havemajor difficulties in preserving the peak flood wave along the entire modelling reach due to theadvection terms As indicated earlier advection terms can cause numerical instabilities when full2D hydrodynamic schemes are used to model high Froude number or supercritical flows The rise ofnumerical instabilities generally lead to erroneous predictions in the areas where the gradients aresteep (see Figure 6) and usually result in the dissipation of the peak flood wave This means that suchmodels would thus be prone to under-predict flood levels in the areas further downstream where thegradients are less steep This course of events can also be observed in this study for the MAC modelconfiguration (eg see Figure 6 for the Borth area)
The simplified 2D models (eg the SI configuration in this study) generally also have difficulties inpreserving the peak flood wave along the entire modelling reach that includes areas characterised by ahigh Froude number or supercritical flows For example the SI model configuration did not include theadvection terms which significantly increased the numerical stability However the complete exclusionof advection terms reduces the accuracy of the model predictions This is particularly evident in areascharacterised by a high Froude number or supercritical flows For example the SI model configurationgreatly over-predicted the peak flood levels in the steepest parts of the domain (eg see Figure 6 forthe Tal-y-bont area) where the flow conditions were the most volatile (see Figure 7) On the other handthe SI model configuration predicted (numerically) more accurate flood depths in the flatter parts ofthe domain (eg see Figure 6 for the Borth area) The flow conditions in this area were generally mild(see Figure 7) Thus decreased physical complexity in the model solution had less of an impact on theaccuracy of the SI model predictions
Simplified and full hydrodynamic 2D models can produce accurate model predictions for floodscenarios that include a high Froude number or supercritical flows if these flows are not dominantduring the simulation process [939] For such studies model instability can be reduced by artificiallyimproving modelling results eg introducing a small patch of high roughness to slow water downin the problematic areas [32] However such procedures are not generic and should be applied withcaution because the level of such improvements is based on the modellerrsquos perception of how muchfine-tuning is needed [1032]
Finally simplified and full hydrodynamic 2D models can produce (to some extent) realistic floodlevel predictions for rapidly varying flood events if there exists quality validation data that canbe used to fine-tune the models However quality validation and calibration data for flood eventsoccurring in steep catchments (eg flash floods) are generally scarce [40] Therefore the physicaland mathematical complexity in the model solution is particularly important for studies conductedin torrential river basins and catchments because the validation of the modelling results is oftenimpossible Thus shock-capturing models are more appropriate for such flood studies as these modelscan produce (numerically) accurate predictions for high Froude numbers or supercritical flows withoutany additional modification or improvements of the modelling procedure
Water 2017 9 705 14 of 16
6 Conclusions
In this paper we have investigated the threshold value of the bed slope that could stand asan orientation guide as to when to use a specific type of flood inundation model Three differentmodel configurations of the DIVAST-TVD model were considered in this study (i) a configuration thatincluded a shock-capturing ability (ie the TVD test case) (ii) a configuration that solved the full 2Dshallow water equations (ie the MAC test case) and (iii) a configuration based on a simplified versionof the 2D shallow water equations (ie the SI test case) The three considered model configurationswere used to model two different flood events ie a flood wave propagating along an idealised valleyand a flash flood event in Wales UK
The results obtained indicate that in torrential or flashy river basins or catchments (ie riverbasins and catchments with a stream gradient generally greater than 1) flood inundation modellingshould be undertaken using flood inundation models with shock-capturing (or similar) capabilitySteep catchments are prone to the occurrence of high Froude numbers and supercritical flowsSuch flow conditions usually cause numerical instabilities (eg spurious oscillations) in the modelsolution of simplified 2D and full hydrodynamic 2D models These instabilities can lead to the dissipationof the peak flood wave and consequently to erroneous model predictions Even though flood inundationmodels with shock-capturing (or similar) capabilities are generally more computationally expensivethese models prevent the occurrence of numerical instabilities and thus prevent the dissipation of theflood wave Therefore such models can predict (numerically) accurate flood levels for flood eventscharacterised by high Froude numbers or supercritical flows such as floods occurring in steep riverbasins and catchments (eg flash floods)
This paper proposes an orientation value of the bed slope (ie 1) that can be used as a guideas when to use a specific type of flood inundation model Therefore further research is needed todevelop more detailed modelling guidelines for steep river basins and catchments Future research willinclude more rigorous testing conditions and more complex modelling environments As indicatedwithin this paper modelling in steep river basins is faced with many difficulties eg a lack of qualitydata etc Therefore future research would also benefit from closer cooperation between academicresearchers regulatory authorities and flood risk practitioners which would enable more efficientsharing of information data and practical experience All these would help in easier development andlater implementation of the state-of-the-art modelling techniques to the practical hydro-environmentalengineering community
Acknowledgments This research project was supported by an Engineering and Physical Sciences ResearchCouncil (EPSRC) Impact Acceleration grant The topographical and hydrological data for the Borth study wereprovided by Natural Resources Wales (NRW) The contribution of these organisations is gratefully acknowledgedThe authors would also like to thank Thomas Green from Advance Research ComputingmdashCardiff University(ARCCA) for his assistance in using the Universityrsquos high-performance computing facilities
Author Contributions Davor Kvocka was the Research Associate on the project and set-up the model applicationsand undertook the studies including assessing the conditions under which shock-capturing algorithms need tobe included Roger A Falconer and Reza Ahmadian have been leading a wide range of research projects in floodrisk modelling and were instrumental in developing the original models Davor Kvocka drafted the manuscriptwhich was refined by all authors
Conflicts of Interest The authors declare no conflict of interest The founding sponsors had no role in the designof the study in the collection analyses or interpretation of data in the writing of the manuscript and in thedecision to publish the results
References
1 United Nations (UN) World Urbanizations Prospects The 2014 Revision United Nations New York NY USA 20142 United Nations (UN) World Population Prospects The 2015 Revision United Nations New York NY USA 20153 Guumlneralp B Guumlneralp I Liu Y Changing global patterns of urban exposure to flood and drought hazards
Glob Environ Chang 2015 31 217ndash225 [CrossRef]
Water 2017 9 705 15 of 16
4 Muis S Guumlneralp B Jongman B Aerts JC Ward PJ Flood risk and adaptation strategies under climatechange and urban expansion A probabilistic analysis using global data Sci Total Environ 2015 538 445ndash457[CrossRef] [PubMed]
5 HM Government National Flood Resilience Review HM Government London UK 2016 p 1456 Neelz S Pender G Benchmarking the Latest Generation of 2d Hydraulic Modelling Packages Environment Agency
Bristol UK 20137 Hunter N Bates P Neelz S Pender G Villanueva I Wright N Liang D Falconer RA Lin B
Waller S Benchmarking 2d Hydraulic Models for Urban Flood Simulations In Proceedings of the Institutionof Civil EngineersmdashWater Management Thomas Telford (ICE Publishing) London UK 2008 pp 13ndash30
8 Neacuteelz S Pender G Benchmarking of 2d Hydraulic Modelling Packages SC080035SR2 Environment AgencyBristol UK 2010
9 Neal J Villanueva I Wright N Willis T Fewtrell T Bates P How much physical complexity is neededto model flood inundation Hydrol Process 2012 26 2264ndash2282 [CrossRef]
10 Kvocka D Falconer RA Bray M Appropriate model use for predicting elevations and inundation extentfor extreme flood events Nat Hazards 2015 79 1791ndash1808 [CrossRef]
11 Faulkner H Parker D Green C Beven K Developing a translational discourse to communicateuncertainty in flood risk between science and the practitioner AMBIO J Hum Environ 2007 36 692ndash704[CrossRef]
12 Janssen JA Hoekstra AY de Kok J-L Schielen RM Delineating the model-stakeholder gap Framingperceptions to analyse the information requirement in river management Water Resour Manag 200923 1423ndash1445 [CrossRef]
13 Timmerman J Beinat E Termeer C Cofino W A methodology to bridge the water information gapWater Sci Technol 2010 62 2419ndash2426 [CrossRef] [PubMed]
14 Wood M Kovacs D Bostrom A Bridges T Linkov I Flood risk management US army corps ofengineers and layperson perceptions Risk Anal 2012 32 1349ndash1368 [CrossRef] [PubMed]
15 Leskens J Brugnach M Hoekstra A Schuurmans W Why are decisions in flood disaster management sopoorly supported by information from flood models Environ Model Softw 2014 53 53ndash61 [CrossRef]
16 Leskens JG Kehl C Tutenel T Kol T Haan Gd Stelling G Eisemann E An interactive simulationand visualization tool for flood analysis usable for practitioners Mitig Adapt Strateg Glob Chang 201722 307ndash324 [CrossRef]
17 Rozalis S Morin E Yair Y Price C Flash flood prediction using an uncalibrated hydrological model andradar rainfall data in a mediterranean watershed under changing hydrological conditions J Hydrol 2010394 245ndash255 [CrossRef]
18 Hill C Verjee F Flash Flood Early Warning System Reference Guide 2010 University Corporation forAtmospheric Research Boulder CO USA 2010
19 Marchi L Borga M Preciso E Gaume E Characterisation of selected extreme flash floods in europe andimplications for flood risk management J Hydrol 2010 394 118ndash133 [CrossRef]
20 Gaume E Bain V Bernardara P Newinger O Barbuc M Bateman A Blaškovicovaacute L Bloumlschl GBorga M Dumitrescu A et al A compilation of data on european flash floods J Hydrol 2009 367 70ndash78[CrossRef]
21 Foulds S Brewer P Macklin M Betson R Rassner S Causes and Consequences of a Large SummerStorm and Flood in West Wales 8thndash9th June 2012 Fluvio Report No 20120173 Aberystwyth UniversityAberystwyth UK 2012 p 53
22 Lin B Wicks JM Falconer RA Adams K Integrating 1d and 2d hydrodynamic models for floodsimulation In Proceedings of the Institution of Civil EngineersmdashWater Management ICE Virtual Library(ICE Publishing) London UK 2006 Volume 159 pp 19ndash25
23 BBC Wales Flooding Major Rescue Continuing Near Aberystwyth Available online httpwwwbbccouknewsuk-wales-18378124 (accessed on 1 November 2016)
24 Ceredigion County Council Flood Investigation Report North Ceredigion 8 and 9 June 2012 Availableonline httpwwwceredigiongovukutilitiesactionact_downloadcfmmediaid=43372 (accessed on1 November 2016)
25 Liang D Falconer RA Lin B Comparison between tvd-maccormack and adi-type solvers of the shallowwater equations Adv Water Resour 2006 29 1833ndash1845 [CrossRef]
Water 2017 9 705 16 of 16
26 Mingham CG Causon DM Ingram D Mingham CG Causon DM Ingram D A tvd maccormackscheme for transcritical flow In Proceedings of the Institution of Civil EngineersmdashWater and Maritime EngineeringICE Virtual Library (ICE Publishing) London UK 2001 Volume 148 pp 167ndash175
27 Liang D Lin B Falconer RA A boundary-fitted numerical model for flood routing with shock-capturingcapability J Hydrol 2007 332 477ndash486 [CrossRef]
28 Ahmadian R Falconer RA Wicks J Benchmarking of flood inundation extent using various dynamicallylinked one- and two-dimensional approaches J Flood Risk Manag 2015 [CrossRef]
29 Kvocka D Falconer RA Bray M Flood hazard assessment for extreme flood events Nat Hazards 201684 1569ndash1599 [CrossRef]
30 Rogers BD Borthwick AG Taylor PH Mathematical balancing of flux gradient and source terms priorto using roersquos approximate riemann solver J Comput Phys 2003 192 422ndash451 [CrossRef]
31 Strang G On the construction and comparison of difference schemes SIAM J Numer Anal 1968 5 506ndash517[CrossRef]
32 CH2M Flood Modeller Pro User Manual Available online httphelpfloodmodellercomfloodmodeller(accessed on 1 November 2016)
33 Ozdemir H Sampson C de Almeida GA Bates P Evaluating scale and roughness effects in urban floodmodelling using terrestrial lidar data Hydrol Earth Syst Sci 2013 10 5903ndash5942 [CrossRef]
34 Ancey C Debris flows In Environmental Geomechanics Schrefler B Delage P Eds John Wiley amp SonsHoboken NJ USA 2013 pp 1ndash37
35 WalesOnline Lessons to Be Learnt from Ceredigion Floods Available online httpwwwwalesonlinecouknewswales-newslessons-learnt-ceredigion-floods-6520699 (accessed on 7 December 2016)
36 BBC Dol-y-Bont Resident Jason Hughes Recalls lsquoAwfulrsquo Flood Available online httpwwwbbccouknewsuk-wales-18391889 (accessed on 11 November 2016)
37 ITV Floods Overrun Luxury Caravan Park Available online httpwwwitvcomnewsupdate2012-06-09flood-overruns-luxury-caravan-park (accessed on 11 November 2016)
38 WalesOnline Astonishing Pictures and Video of Flooding Rescues from Aberystwythrsquos Stricken VillagesAvailable online httpwwwwalesonlinecouknewslocal-newsastonishing-pictures-video-flooding-rescues-2052558 (accessed on 17 November 2016)
39 Martins R Leandro J Djordjevic S A well balanced roe scheme for the local inertial equations withan unstructured mesh Adv Water Resour 2015 83 351ndash363 [CrossRef]
40 Gourley JJ Flamig ZL Hong Y Howard KW Evaluation of past present and future tools for radar-basedflash-flood prediction in the USA Hydrol Sci J 2014 59 1377ndash1389 [CrossRef]
copy 2017 by the authors Licensee MDPI Basel Switzerland This article is an open accessarticle distributed under the terms and conditions of the Creative Commons Attribution(CC BY) license (httpcreativecommonsorglicensesby40)
- Introduction
- Study Areas
-
- Idealised Valley
- Borth (Wales UK)
-
- Numerical Model
- Methodology
- Results and Discussion
-
- Idealised Valley Test Case
- Flood Inundation Modelling around Borth
-
- Conclusions
-
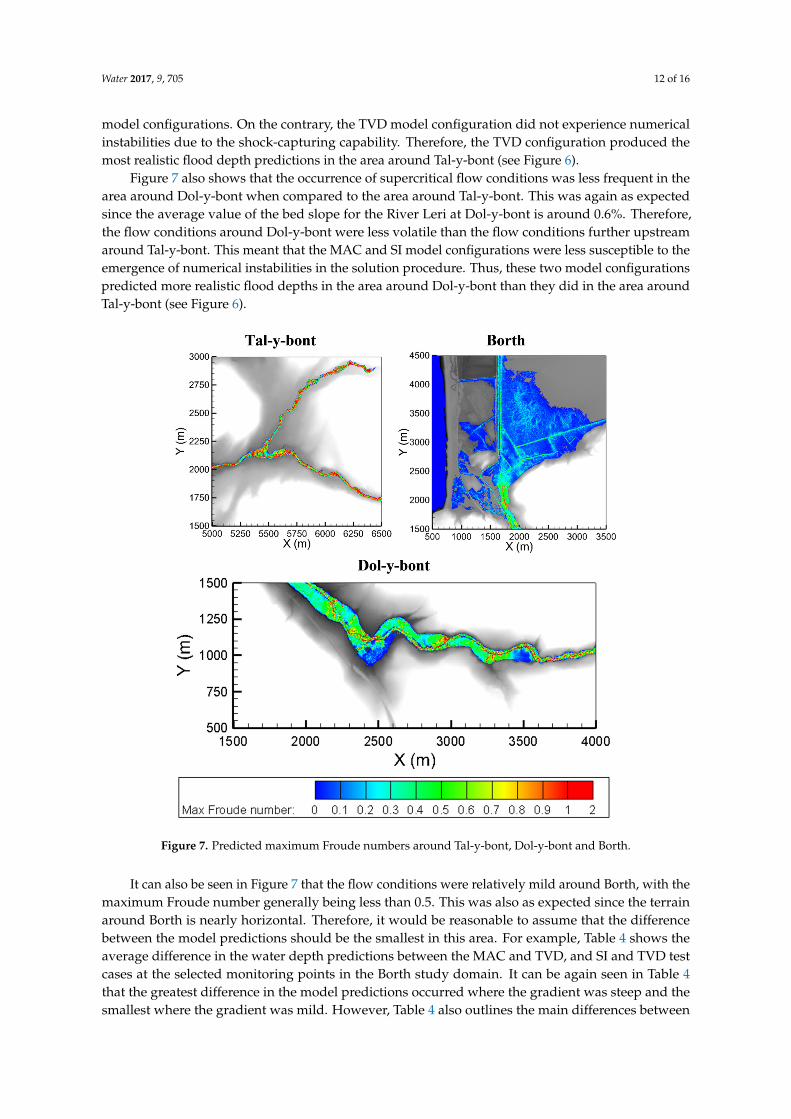
Water 2017 9 705 12 of 16
model configurations On the contrary the TVD model configuration did not experience numericalinstabilities due to the shock-capturing capability Therefore the TVD configuration produced themost realistic flood depth predictions in the area around Tal-y-bont (see Figure 6)
Figure 7 also shows that the occurrence of supercritical flow conditions was less frequent in thearea around Dol-y-bont when compared to the area around Tal-y-bont This was again as expectedsince the average value of the bed slope for the River Leri at Dol-y-bont is around 06 Thereforethe flow conditions around Dol-y-bont were less volatile than the flow conditions further upstreamaround Tal-y-bont This meant that the MAC and SI model configurations were less susceptible to theemergence of numerical instabilities in the solution procedure Thus these two model configurationspredicted more realistic flood depths in the area around Dol-y-bont than they did in the area aroundTal-y-bont (see Figure 6)
Water 2017 9 705 12 of 16
occurrence of numerical instabilities in the model solution of the MAC and SI model configurations This resulted in erroneous water depth predictions in the area around Tal-y-bont for the MAC and SI model configurations On the contrary the TVD model configuration did not experience numerical instabilities due to the shock-capturing capability Therefore the TVD configuration produced the most realistic flood depth predictions in the area around Tal-y-bont (see Figure 6)
Figure 7 also shows that the occurrence of supercritical flow conditions was less frequent in the area around Dol-y-bont when compared to the area around Tal-y-bont This was again as expected since the average value of the bed slope for the River Leri at Dol-y-bont is around 06 Therefore the flow conditions around Dol-y-bont were less volatile than the flow conditions further upstream around Tal-y-bont This meant that the MAC and SI model configurations were less susceptible to the emergence of numerical instabilities in the solution procedure Thus these two model configurations predicted more realistic flood depths in the area around Dol-y-bont than they did in the area around Tal-y-bont (see Figure 6)
Figure 7 Predicted maximum Froude numbers around Tal-y-bont Dol-y-bont and Borth
It can also be seen in Figure 7 that the flow conditions were relatively mild around Borth with the maximum Froude number generally being less than 05 This was also as expected since the terrain around Borth is nearly horizontal Therefore it would be reasonable to assume that the difference between the model predictions should be the smallest in this area For example Table 4 shows the average difference in the water depth predictions between the MAC and TVD and SI and TVD test cases at the selected monitoring points in the Borth study domain It can be again seen in Table 4 that the greatest difference in the model predictions occurred where the gradient was steep and the smallest where the gradient was mild However Table 4 also outlines the main differences between
Figure 7 Predicted maximum Froude numbers around Tal-y-bont Dol-y-bont and Borth
It can also be seen in Figure 7 that the flow conditions were relatively mild around Borth with themaximum Froude number generally being less than 05 This was also as expected since the terrainaround Borth is nearly horizontal Therefore it would be reasonable to assume that the differencebetween the model predictions should be the smallest in this area For example Table 4 shows theaverage difference in the water depth predictions between the MAC and TVD and SI and TVD testcases at the selected monitoring points in the Borth study domain It can be again seen in Table 4that the greatest difference in the model predictions occurred where the gradient was steep and thesmallest where the gradient was mild However Table 4 also outlines the main differences between
Water 2017 9 705 13 of 16
the simplified and full hydrodynamic 2D solvers when modelling flood events with a high Froudenumber or supercritical flows
Table 4 Average difference in water depth predictions between the MAC and TVD and SI and TVDmodel configurations at the selected monitoring points in the Borth study domain
Bed SlopeAverage Difference in the Water Depth Prediction
MAC vs TVD SI vs TVD
S gt 001 409 cm 990 cm001 gt S gt 0001 259 cm 262 cm
S asymp 0001 236 cm 87 cm
As discussed earlier flow conditions were particularly volatile in the steeper parts of thedomain (see Figure 7) This meant for example that the full 2D hydrodynamic model would havemajor difficulties in preserving the peak flood wave along the entire modelling reach due to theadvection terms As indicated earlier advection terms can cause numerical instabilities when full2D hydrodynamic schemes are used to model high Froude number or supercritical flows The rise ofnumerical instabilities generally lead to erroneous predictions in the areas where the gradients aresteep (see Figure 6) and usually result in the dissipation of the peak flood wave This means that suchmodels would thus be prone to under-predict flood levels in the areas further downstream where thegradients are less steep This course of events can also be observed in this study for the MAC modelconfiguration (eg see Figure 6 for the Borth area)
The simplified 2D models (eg the SI configuration in this study) generally also have difficulties inpreserving the peak flood wave along the entire modelling reach that includes areas characterised by ahigh Froude number or supercritical flows For example the SI model configuration did not include theadvection terms which significantly increased the numerical stability However the complete exclusionof advection terms reduces the accuracy of the model predictions This is particularly evident in areascharacterised by a high Froude number or supercritical flows For example the SI model configurationgreatly over-predicted the peak flood levels in the steepest parts of the domain (eg see Figure 6 forthe Tal-y-bont area) where the flow conditions were the most volatile (see Figure 7) On the other handthe SI model configuration predicted (numerically) more accurate flood depths in the flatter parts ofthe domain (eg see Figure 6 for the Borth area) The flow conditions in this area were generally mild(see Figure 7) Thus decreased physical complexity in the model solution had less of an impact on theaccuracy of the SI model predictions
Simplified and full hydrodynamic 2D models can produce accurate model predictions for floodscenarios that include a high Froude number or supercritical flows if these flows are not dominantduring the simulation process [939] For such studies model instability can be reduced by artificiallyimproving modelling results eg introducing a small patch of high roughness to slow water downin the problematic areas [32] However such procedures are not generic and should be applied withcaution because the level of such improvements is based on the modellerrsquos perception of how muchfine-tuning is needed [1032]
Finally simplified and full hydrodynamic 2D models can produce (to some extent) realistic floodlevel predictions for rapidly varying flood events if there exists quality validation data that canbe used to fine-tune the models However quality validation and calibration data for flood eventsoccurring in steep catchments (eg flash floods) are generally scarce [40] Therefore the physicaland mathematical complexity in the model solution is particularly important for studies conductedin torrential river basins and catchments because the validation of the modelling results is oftenimpossible Thus shock-capturing models are more appropriate for such flood studies as these modelscan produce (numerically) accurate predictions for high Froude numbers or supercritical flows withoutany additional modification or improvements of the modelling procedure
Water 2017 9 705 14 of 16
6 Conclusions
In this paper we have investigated the threshold value of the bed slope that could stand asan orientation guide as to when to use a specific type of flood inundation model Three differentmodel configurations of the DIVAST-TVD model were considered in this study (i) a configuration thatincluded a shock-capturing ability (ie the TVD test case) (ii) a configuration that solved the full 2Dshallow water equations (ie the MAC test case) and (iii) a configuration based on a simplified versionof the 2D shallow water equations (ie the SI test case) The three considered model configurationswere used to model two different flood events ie a flood wave propagating along an idealised valleyand a flash flood event in Wales UK
The results obtained indicate that in torrential or flashy river basins or catchments (ie riverbasins and catchments with a stream gradient generally greater than 1) flood inundation modellingshould be undertaken using flood inundation models with shock-capturing (or similar) capabilitySteep catchments are prone to the occurrence of high Froude numbers and supercritical flowsSuch flow conditions usually cause numerical instabilities (eg spurious oscillations) in the modelsolution of simplified 2D and full hydrodynamic 2D models These instabilities can lead to the dissipationof the peak flood wave and consequently to erroneous model predictions Even though flood inundationmodels with shock-capturing (or similar) capabilities are generally more computationally expensivethese models prevent the occurrence of numerical instabilities and thus prevent the dissipation of theflood wave Therefore such models can predict (numerically) accurate flood levels for flood eventscharacterised by high Froude numbers or supercritical flows such as floods occurring in steep riverbasins and catchments (eg flash floods)
This paper proposes an orientation value of the bed slope (ie 1) that can be used as a guideas when to use a specific type of flood inundation model Therefore further research is needed todevelop more detailed modelling guidelines for steep river basins and catchments Future research willinclude more rigorous testing conditions and more complex modelling environments As indicatedwithin this paper modelling in steep river basins is faced with many difficulties eg a lack of qualitydata etc Therefore future research would also benefit from closer cooperation between academicresearchers regulatory authorities and flood risk practitioners which would enable more efficientsharing of information data and practical experience All these would help in easier development andlater implementation of the state-of-the-art modelling techniques to the practical hydro-environmentalengineering community
Acknowledgments This research project was supported by an Engineering and Physical Sciences ResearchCouncil (EPSRC) Impact Acceleration grant The topographical and hydrological data for the Borth study wereprovided by Natural Resources Wales (NRW) The contribution of these organisations is gratefully acknowledgedThe authors would also like to thank Thomas Green from Advance Research ComputingmdashCardiff University(ARCCA) for his assistance in using the Universityrsquos high-performance computing facilities
Author Contributions Davor Kvocka was the Research Associate on the project and set-up the model applicationsand undertook the studies including assessing the conditions under which shock-capturing algorithms need tobe included Roger A Falconer and Reza Ahmadian have been leading a wide range of research projects in floodrisk modelling and were instrumental in developing the original models Davor Kvocka drafted the manuscriptwhich was refined by all authors
Conflicts of Interest The authors declare no conflict of interest The founding sponsors had no role in the designof the study in the collection analyses or interpretation of data in the writing of the manuscript and in thedecision to publish the results
References
1 United Nations (UN) World Urbanizations Prospects The 2014 Revision United Nations New York NY USA 20142 United Nations (UN) World Population Prospects The 2015 Revision United Nations New York NY USA 20153 Guumlneralp B Guumlneralp I Liu Y Changing global patterns of urban exposure to flood and drought hazards
Glob Environ Chang 2015 31 217ndash225 [CrossRef]
Water 2017 9 705 15 of 16
4 Muis S Guumlneralp B Jongman B Aerts JC Ward PJ Flood risk and adaptation strategies under climatechange and urban expansion A probabilistic analysis using global data Sci Total Environ 2015 538 445ndash457[CrossRef] [PubMed]
5 HM Government National Flood Resilience Review HM Government London UK 2016 p 1456 Neelz S Pender G Benchmarking the Latest Generation of 2d Hydraulic Modelling Packages Environment Agency
Bristol UK 20137 Hunter N Bates P Neelz S Pender G Villanueva I Wright N Liang D Falconer RA Lin B
Waller S Benchmarking 2d Hydraulic Models for Urban Flood Simulations In Proceedings of the Institutionof Civil EngineersmdashWater Management Thomas Telford (ICE Publishing) London UK 2008 pp 13ndash30
8 Neacuteelz S Pender G Benchmarking of 2d Hydraulic Modelling Packages SC080035SR2 Environment AgencyBristol UK 2010
9 Neal J Villanueva I Wright N Willis T Fewtrell T Bates P How much physical complexity is neededto model flood inundation Hydrol Process 2012 26 2264ndash2282 [CrossRef]
10 Kvocka D Falconer RA Bray M Appropriate model use for predicting elevations and inundation extentfor extreme flood events Nat Hazards 2015 79 1791ndash1808 [CrossRef]
11 Faulkner H Parker D Green C Beven K Developing a translational discourse to communicateuncertainty in flood risk between science and the practitioner AMBIO J Hum Environ 2007 36 692ndash704[CrossRef]
12 Janssen JA Hoekstra AY de Kok J-L Schielen RM Delineating the model-stakeholder gap Framingperceptions to analyse the information requirement in river management Water Resour Manag 200923 1423ndash1445 [CrossRef]
13 Timmerman J Beinat E Termeer C Cofino W A methodology to bridge the water information gapWater Sci Technol 2010 62 2419ndash2426 [CrossRef] [PubMed]
14 Wood M Kovacs D Bostrom A Bridges T Linkov I Flood risk management US army corps ofengineers and layperson perceptions Risk Anal 2012 32 1349ndash1368 [CrossRef] [PubMed]
15 Leskens J Brugnach M Hoekstra A Schuurmans W Why are decisions in flood disaster management sopoorly supported by information from flood models Environ Model Softw 2014 53 53ndash61 [CrossRef]
16 Leskens JG Kehl C Tutenel T Kol T Haan Gd Stelling G Eisemann E An interactive simulationand visualization tool for flood analysis usable for practitioners Mitig Adapt Strateg Glob Chang 201722 307ndash324 [CrossRef]
17 Rozalis S Morin E Yair Y Price C Flash flood prediction using an uncalibrated hydrological model andradar rainfall data in a mediterranean watershed under changing hydrological conditions J Hydrol 2010394 245ndash255 [CrossRef]
18 Hill C Verjee F Flash Flood Early Warning System Reference Guide 2010 University Corporation forAtmospheric Research Boulder CO USA 2010
19 Marchi L Borga M Preciso E Gaume E Characterisation of selected extreme flash floods in europe andimplications for flood risk management J Hydrol 2010 394 118ndash133 [CrossRef]
20 Gaume E Bain V Bernardara P Newinger O Barbuc M Bateman A Blaškovicovaacute L Bloumlschl GBorga M Dumitrescu A et al A compilation of data on european flash floods J Hydrol 2009 367 70ndash78[CrossRef]
21 Foulds S Brewer P Macklin M Betson R Rassner S Causes and Consequences of a Large SummerStorm and Flood in West Wales 8thndash9th June 2012 Fluvio Report No 20120173 Aberystwyth UniversityAberystwyth UK 2012 p 53
22 Lin B Wicks JM Falconer RA Adams K Integrating 1d and 2d hydrodynamic models for floodsimulation In Proceedings of the Institution of Civil EngineersmdashWater Management ICE Virtual Library(ICE Publishing) London UK 2006 Volume 159 pp 19ndash25
23 BBC Wales Flooding Major Rescue Continuing Near Aberystwyth Available online httpwwwbbccouknewsuk-wales-18378124 (accessed on 1 November 2016)
24 Ceredigion County Council Flood Investigation Report North Ceredigion 8 and 9 June 2012 Availableonline httpwwwceredigiongovukutilitiesactionact_downloadcfmmediaid=43372 (accessed on1 November 2016)
25 Liang D Falconer RA Lin B Comparison between tvd-maccormack and adi-type solvers of the shallowwater equations Adv Water Resour 2006 29 1833ndash1845 [CrossRef]
Water 2017 9 705 16 of 16
26 Mingham CG Causon DM Ingram D Mingham CG Causon DM Ingram D A tvd maccormackscheme for transcritical flow In Proceedings of the Institution of Civil EngineersmdashWater and Maritime EngineeringICE Virtual Library (ICE Publishing) London UK 2001 Volume 148 pp 167ndash175
27 Liang D Lin B Falconer RA A boundary-fitted numerical model for flood routing with shock-capturingcapability J Hydrol 2007 332 477ndash486 [CrossRef]
28 Ahmadian R Falconer RA Wicks J Benchmarking of flood inundation extent using various dynamicallylinked one- and two-dimensional approaches J Flood Risk Manag 2015 [CrossRef]
29 Kvocka D Falconer RA Bray M Flood hazard assessment for extreme flood events Nat Hazards 201684 1569ndash1599 [CrossRef]
30 Rogers BD Borthwick AG Taylor PH Mathematical balancing of flux gradient and source terms priorto using roersquos approximate riemann solver J Comput Phys 2003 192 422ndash451 [CrossRef]
31 Strang G On the construction and comparison of difference schemes SIAM J Numer Anal 1968 5 506ndash517[CrossRef]
32 CH2M Flood Modeller Pro User Manual Available online httphelpfloodmodellercomfloodmodeller(accessed on 1 November 2016)
33 Ozdemir H Sampson C de Almeida GA Bates P Evaluating scale and roughness effects in urban floodmodelling using terrestrial lidar data Hydrol Earth Syst Sci 2013 10 5903ndash5942 [CrossRef]
34 Ancey C Debris flows In Environmental Geomechanics Schrefler B Delage P Eds John Wiley amp SonsHoboken NJ USA 2013 pp 1ndash37
35 WalesOnline Lessons to Be Learnt from Ceredigion Floods Available online httpwwwwalesonlinecouknewswales-newslessons-learnt-ceredigion-floods-6520699 (accessed on 7 December 2016)
36 BBC Dol-y-Bont Resident Jason Hughes Recalls lsquoAwfulrsquo Flood Available online httpwwwbbccouknewsuk-wales-18391889 (accessed on 11 November 2016)
37 ITV Floods Overrun Luxury Caravan Park Available online httpwwwitvcomnewsupdate2012-06-09flood-overruns-luxury-caravan-park (accessed on 11 November 2016)
38 WalesOnline Astonishing Pictures and Video of Flooding Rescues from Aberystwythrsquos Stricken VillagesAvailable online httpwwwwalesonlinecouknewslocal-newsastonishing-pictures-video-flooding-rescues-2052558 (accessed on 17 November 2016)
39 Martins R Leandro J Djordjevic S A well balanced roe scheme for the local inertial equations withan unstructured mesh Adv Water Resour 2015 83 351ndash363 [CrossRef]
40 Gourley JJ Flamig ZL Hong Y Howard KW Evaluation of past present and future tools for radar-basedflash-flood prediction in the USA Hydrol Sci J 2014 59 1377ndash1389 [CrossRef]
copy 2017 by the authors Licensee MDPI Basel Switzerland This article is an open accessarticle distributed under the terms and conditions of the Creative Commons Attribution(CC BY) license (httpcreativecommonsorglicensesby40)
- Introduction
- Study Areas
-
- Idealised Valley
- Borth (Wales UK)
-
- Numerical Model
- Methodology
- Results and Discussion
-
- Idealised Valley Test Case
- Flood Inundation Modelling around Borth
-
- Conclusions
-