fiveways feasibility modelling final report - base and
TRANSCRIPT

August 2014
FIVEWAYS FEASIBILITY MODELLING
FINAL REPORT - BASE AND
FORECASTING MODELLING
Transport for London
[287370A-PTL][Final]

Fiveways Feasibility Modelling
Final Report - Base andForecasting Modelling
287370A-PTL
Prepared forTransport for London
Prepared byParsons Brinckerhoff
www.pbworld.com


Fiveways Feasibility ModellingFinal Report - Base and Forecasting
Modelling
Fiveways Feasibility Modelling - Final Report_ISSUED 05082014 Prepared by Parsons BrinckerhoffAugust 2014 for Transport for London
- 5 -
CONTENTSPage
1 Introduction 71.1 Background 71.2 Structure of report 7
2 Base Model Development 82.1 Introduction 82.2 Network 82.3 Traffic Demand 92.4 Model Calibration 92.5 Model Validation 132.6 Model Audit 172.7 Base Validation Summary 17
3 Summary of Scenarios 183.1 Overview 183.2 Concept 1 183.3 Concept 2 193.4 Fiveways Option 1 193.5 Fiveways Option 2 193.6 Fiveways Option 3 203.7 Fiveways Option 4 203.8 Fiveways Option 5 203.9 Modelled Scenarios 21
4 Scenario Model Development 224.1 Forecasting Background Growth 224.2 Signals and Green Times 23
5 Scenario Results 245.1 Introduction 245.2 General Traffic Journey Times 245.3 Bus Journey Times 305.4 Queue Data 32
6 Performance Summary 336.1 Scenario 1 – Do Nothing 336.2 Concept 1 Scenarios 336.3 Concept 2 Scenarios 35
7 Croydon Road sensitivity testing 377.1 Introduction 377.2 Assessment Scenarios 377.3 Results 387.4 Summary 39
8 Conclusion 40
Fiveways Feasibility ModellingFinal Report - Base and Forecasting
Modelling
Fiveways Feasibility Modelling - Final Report_ISSUED 05082014 Prepared by Parsons BrinckerhoffAugust 2014 for Transport for London
- 6 -
Appendix A – Model Audit 43Appendix B – Flow Calibration 45Appendix C – Concept Designs 49Appendix D – Fiveways Option Designs 52Appendix E – J20/016 Indicative LINSIG staging for Concept 1 55Appendix F – Concept 1 VISSIM Layout 57Appendix G – Concept 2 VISSIM Layout 58Appendix H – Fiveways options VISSIM Layout 59Appendix I – General Traffic Journey Time summary 61Appendix J – Bus Journey Time summary 66Appendix K – Queue summary 69

Fiveways Feasibility ModellingFinal Report - Base and Forecasting
Modelling
Fiveways Feasibility Modelling - Final Report_ISSUED 05082014 Prepared by Parsons BrinckerhoffAugust 2014 for Transport for London
- 7 -
1 INTRODUCTION
1.1 Background
1.1.1 Parsons Brinckerhoff (PB) was commissioned by Transport for London (TfL) todevelop a VISSIM model of Fiveways junction and Fiveways Corner in Croydon. Avalidated base year model was produced and used to test the feasibility of a numberof options to improve the performance of the highway network, in particular East-Westmovements through the area. The outcomes from the feasibility modelling will formpart of a business case prepared by TfL to obtain funding for progressing thedevelopment of an improvement scheme.
1.1.2 This report summarises the development of the base and forecasting model, and theresults of the feasibility testing.
1.2 Structure of report
1.2.1 The remaining sections of the report set out the following
· Section 2 – Details of base year model development including calibration andvalidation
· Section 3 – Summary of scenarios tested
· Section 4 – Development of scenario models
· Section 5 – Results from the scenario models
· Section 6 – Summary of performance of scenarios and selection of preferredoption

Fiveways Feasibility ModellingFinal Report - Base and Forecasting
Modelling
Fiveways Feasibility Modelling - Final Report_ISSUED 05082014 Prepared by Parsons BrinckerhoffAugust 2014 for Transport for London
- 8 -
2 BASE MODEL DEVELOPMENT
2.1 Introduction
2.1.1 This section describes the development of the base year model including calibration,validation and an internal model audit.
2.2 Network
2.2.1 TfL’s existing corridor model was cordoned to provide an AM peak, base year VISSIMmodel of the agreed study area shown in Figure 2-1 below.
Figure 2-1: VISSIM model study area
2.2.2 The cordoned model was used as a basis for the network, but was updated to reflectrecent alterations. In particular, the southbound lane markings on Purley Waysouthbound at the entrance to the Morrison’s retail park on A23 Purley Way wereamended. A site visit was undertaken on 1 May 2014 to confirm the network layoutand observe traffic behaviour.

Fiveways Feasibility ModellingFinal Report - Base and Forecasting
Modelling
Fiveways Feasibility Modelling - Final Report_ISSUED 05082014 Prepared by Parsons BrinckerhoffAugust 2014 for Transport for London
- 9 -
2.3 Traffic Demand
2.3.1 The model was updated with recent traffic data to produce an AM, PM and Saturdaypeak base year model. AM and PM Manual Classified Counts (MCC’s) werecommissioned by TfL on 25th June 2013 from 07:00 -10:00, and 16:00-19:00.Saturday MCC’s were commissioned by PB on 26th April 2014 from 11:00-13:00. Thecounts were undertaken at the following locations which are mapped in Figure 2-2;
1. A23 Purley Way / Waddon Park Avenue
2. A23 Purley Way / A232 Croydon Road / McDonald’s Retail Park
3. A23 Purley Way / Epsom Road
4. A23 Purley Way / Land of Leather Retail Park
5. Fiveways Junction
6. A232 Stafford Road / Epsom Road
7. A232 Duppas Hill Road / Epsom Road
8. A232 Duppas Hill Road / Duppas Road
9. A232 Duppas Hill Road / Warrington Road
10. A232 / Davenant Road
Figure 2-2: Location of base year traffic surveys
2.3.2 The traffic flow data was analysed to determine the peak hours for the AM, PM andSaturday models. The hours selected were 07:45-08:45, 17:30-18:30 and Saturday11:30-12:30.
2.4 Model Calibration
2.4.1 The model was calibrated using turning counts, saturation flow measurements, recentsignal timing data and site observations.
1
4
6
3
5
2
8 9710
Contains Ordnance Survey data © Crown copyright and database right 2014

Fiveways Feasibility ModellingFinal Report - Base and Forecasting
Modelling
Fiveways Feasibility Modelling - Final Report_ISSUED 05082014 Prepared by Parsons BrinckerhoffAugust 2014 for Transport for London
- 10 -
Signals and Green Times
2.4.2 Recorded signal timing data was provided by TfL for 23-27 April 2014 from whichaverage green times, cycle times and offsets were derived. The following signalisedjunctions are coded within the VISSIM model using VAP coding:
· J20/011 (UTC Micro) – Purley Way/Epsom Road
· J20/013 (UTC Micro) – Fiveways
· J20/016 (UTC Micro) - Croydon Road/Purley Way
· J20/021 (Pelican Crossing) – Purley Way by Waddon Park Avenue.
· J20/075 (UTC Micro) – Epsom Road/Stafford Road.
· J20/076 (Pedestrian Crossing) – Duppas Hill/Stafford Road.
· J20/089 (UTC Micro) – Purley Way/Retail Park
2.4.3 Table 2-1 overleaf shows the observed (and modelled) green times.
Jctn Phase DescriptionGreen Time (seconds)
AM Peak PM Peak Sat Peak
J20/011A Purley Way NB 80 77 73B Purley Way SB 89 86 82C Epsom Road 19 22 26
J20/013
A Purley Way NB 30 29 34B Purley Way SB 30 29 34C Purley Way NB Right 23 21 22D Purley Way SB Right 25 23 24E Stafford Road WB 22 25 23F Stafford Road EB 24 27 25G Denning Avenue 14 14 10
J20/016
A Purley Way SB Ahead 61 63 62B Purley Way NB Ahead LT 32 39 46C Purley Way SB RT 24 19 11D McDonalds 7 7 8E Croydon Road 28 26 26F Purley Way NB LT 20 18 17M Croydon Rd LT 27 23 19
J20/075 A Stafford Road NB 81 71 68B Duppas Hill WB 27 37 40
J20/076 F Duppas Hill SB 33 33 93G Pedestrian Crossing 14 14 14
J20/089R Purley Way NB 101 101 96S Purley Way SB 90 90 84T Retail Access 7 7 12
Table 2-1: Summary of Green Times
Turning Flows
2.4.4 The model has been calibrated against turning flows at all junctions within the model.Appendix B contains a comparison of the observed and modelled flows at all locations

Fiveways Feasibility ModellingFinal Report - Base and Forecasting
Modelling
Fiveways Feasibility Modelling - Final Report_ISSUED 05082014 Prepared by Parsons BrinckerhoffAugust 2014 for Transport for London
- 11 -
in each of the peaks. The GEH (Geoffrey Edward Havers) statistic is a commonlyused measure which assesses the fit between the observed and modelled flows. 85%of the modelled flows should have a GEH of less than 5. A summary of GEH values isgiven in
2.4.5 PeakPeriod
Light vehicles Heavyvehicles
GEH <3 GEH <5 GEH<3
GEH<5
AM peak 63 3 66 0PM peak 64 2 66 0Saturday peak 66 0 66 0
2.4.6 Table 2-2.
Peak PeriodLight vehicles Heavy vehicles
GEH <3 GEH <5 GEH <3 GEH <5
AM peak 63 3 66 0PM peak 64 2 66 0Saturday peak 66 0 66 0
Table 2-2: Summary of flow comparison
Observations
2.4.7 A site visit was undertaken on 1st May 2014 during which the observations listedbelow were made. These observations have been reflected in the VISSIM model.
· A queue forms on Duppas Hill Road westbound, reaching back to The CroydonFlyover;
· The signal timings are co-ordinated to avoid blocking the section of the A23between Fiveways and the junction with Croydon Road;
· The number of pedestrians is generally low;
· The nearside lane of Purley Way Northbound at Fiveways is not as heavily usedas the middle lane for ahead movements;
· Traffic from Epsom Road to Purley Way North favours the middle lane over theoffside lane and hence the queue is similarly unequal at this location;
· Right turners from Stafford Road at Fiveways make use of separate right turnbays so that those turning into Purley Way do not block those turning intoDenning Avenue.
Saturation Flows
2.4.8 Saturation flow values were obtained from surveys undertaken on 10th, 12th and 13th
May 2012 and were used to calibrate the model.
2.4.9 In three locations it was not possible to collect accurate measurements of thesaturation flow on site or from the model. These sites are listed below with theexplanation in brackets as to why it was not possible to obtain data.
Fiveways Feasibility ModellingFinal Report - Base and Forecasting
Modelling
Fiveways Feasibility Modelling - Final Report_ISSUED 05082014 Prepared by Parsons BrinckerhoffAugust 2014 for Transport for London
- 12 -
· Macdonald’s exit at Croydon Road (short green time results in an insufficientnumber of vehicles released per signal cycle to obtain saturation flow reading);
· Denning Avenue (observed data was not recorded for this approach, andreadings from the model were not able to be obtained);
· All arms at retail access north of Fiveways (lack of observed weekday data, anRR67 calculations are not appropriate due to occasional blocking back on PurleyWay).
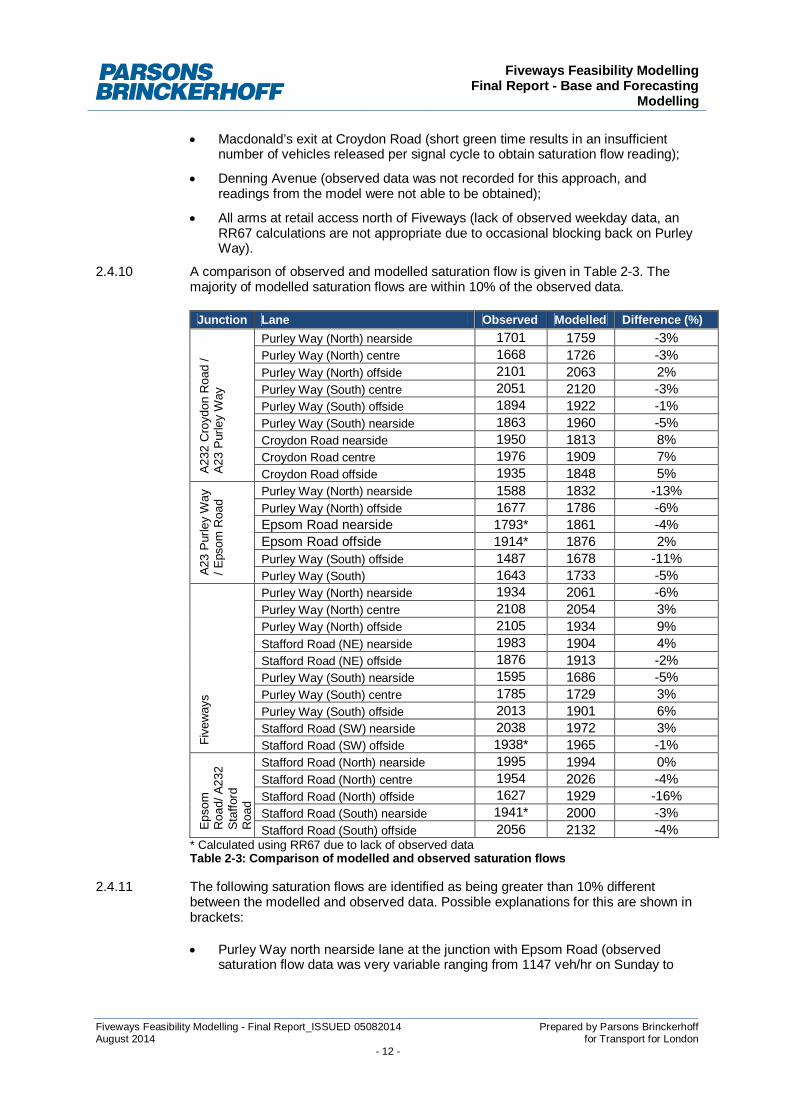
2.4.10 A comparison of observed and modelled saturation flow is given in Table 2-3. Themajority of modelled saturation flows are within 10% of the observed data.
Junction Lane Observed Modelled Difference (%)
A232
Cro
ydon
Roa
d/
A23
Purle
yW
ay
Purley Way (North) nearside 1701 1759 -3%Purley Way (North) centre 1668 1726 -3%Purley Way (North) offside 2101 2063 2%Purley Way (South) centre 2051 2120 -3%Purley Way (South) offside 1894 1922 -1%Purley Way (South) nearside 1863 1960 -5%Croydon Road nearside 1950 1813 8%Croydon Road centre 1976 1909 7%Croydon Road offside 1935 1848 5%
A23
Purle
yW
ay/E
psom
Roa
d
Purley Way (North) nearside 1588 1832 -13%Purley Way (North) offside 1677 1786 -6%Epsom Road nearside 1793* 1861 -4%Epsom Road offside 1914* 1876 2%Purley Way (South) offside 1487 1678 -11%Purley Way (South) 1643 1733 -5%
Five
way
s
Purley Way (North) nearside 1934 2061 -6%Purley Way (North) centre 2108 2054 3%Purley Way (North) offside 2105 1934 9%Stafford Road (NE) nearside 1983 1904 4%Stafford Road (NE) offside 1876 1913 -2%Purley Way (South) nearside 1595 1686 -5%Purley Way (South) centre 1785 1729 3%Purley Way (South) offside 2013 1901 6%Stafford Road (SW) nearside 2038 1972 3%Stafford Road (SW) offside 1938* 1965 -1%
Epso
mR
oad/
A232
Staf
ford
Roa
d
Stafford Road (North) nearside 1995 1994 0%Stafford Road (North) centre 1954 2026 -4%Stafford Road (North) offside 1627 1929 -16%Stafford Road (South) nearside 1941* 2000 -3%Stafford Road (South) offside 2056 2132 -4%
* Calculated using RR67 due to lack of observed dataTable 2-3: Comparison of modelled and observed saturation flows
2.4.11 The following saturation flows are identified as being greater than 10% differentbetween the modelled and observed data. Possible explanations for this are shown inbrackets:
· Purley Way north nearside lane at the junction with Epsom Road (observedsaturation flow data was very variable ranging from 1147 veh/hr on Sunday to

Fiveways Feasibility ModellingFinal Report - Base and Forecasting
Modelling
Fiveways Feasibility Modelling - Final Report_ISSUED 05082014 Prepared by Parsons BrinckerhoffAugust 2014 for Transport for London
- 13 -
1768 veh/hr on Thursday – it is thought that this is due to occasional blockingback, which is also observed within the model).
· Purley Way south offside lane at the junction with Epsom Road (observedsaturation flow data was questionable with recordings as low 691 veh/hr onThursday- it is thought that this is due to occasional blocking back, which is alsoobserved within the model).
· Stafford Road North offside lane at Epsom Road/Stafford Road (weekdayobserved data for this lane was not available, and the observed reading istherefore reliant on Saturday observed data only).
2.5 Model Validation
General Traffic Journey Times
2.5.1 The modelled journey times for general traffic have been compared to observedjourney times along three routes in two directions. The routes are described belowand shown on a map in Figure 2-3.
Figure 2-3: General traffic journey time routes
Route 1 (red)
· WB: Duppas Hill Road near Warrington Road to Croydon Road near AldwickRoad
· EB: Croydon Road near Aldwick Road to Duppas Hill Road near WarringtonRoad
Route 2 (yellow)
· SB: Purley Way near Alton Way to Purley Way near Coldharbour Road
· NB: Purley Way near Coldharbour Road to Purley Way near Alton Way
Route 1
Route 2
Route 3Contains Ordnance Survey data © Crown copyright and database right 2014

Fiveways Feasibility ModellingFinal Report - Base and Forecasting
Modelling
Fiveways Feasibility Modelling - Final Report_ISSUED 05082014 Prepared by Parsons BrinckerhoffAugust 2014 for Transport for London
- 14 -
Route 3 (green)
· SB: Duppas Hill Road near Warrington Road to Purley Way near ColdharbourRoad
· NB: Purley Way near Coldharbour Road to Duppas Hill Road near WarringtonRoad
2.5.2 Observed TrafficMaster journey times were obtained for each of these routes in June2013. These are compared against modelled journey times in Table 2-4, Table 2-5and Table 2-6 below. The modelled journey time for all routes is within 15% of theobserved value.
2.5.3 The modelled journey times generally correlate well for all routes and are within 15%of the observed values.
AM Peak Observed Modelled Difference(%)
Route 1 WB 255 234 -8.3%Route 1 EB 249 226 -9.3%Route 2 SB 190 178 -5.9%Route 2 NB 228 204 -10.7%Route 3 SB 238 206 -13.3%Route 3 NB 224 196 -12.3%
Table 2-4: AM peak journey time comparison
PM Peak Observed Modelled Difference(%)
Route 1 WB 227 243 7.0%Route 1 EB 296 276 -6.8%Route 2 SB 250 216 -13.5%Route 2 NB 212 225 5.8%Route 3 SB 234 214 -8.5%Route 3 NB 210 191 -8.9%
Table 2-5: PM peak journey time comparison
Sat Peak Observed Modelled Difference(%)
Route 1 WB 200 226 12.5%Route 1 EB 243 280 14.9%Route 2 SB 239 220 -8.0%Route 2 NB 300 299 -0.4%Route 3 SB 209 231 10.7%Route 3 NB 242 246 1.7%
Table 2-6: Saturday peak journey time comparison
Bus Journey Times
2.5.4 iBus data was obtained for two bus routes through the study area (157 and 289). Theextent of the two routes within the modelled network is shown in Figure 2-4.

Fiveways Feasibility ModellingFinal Report - Base and Forecasting
Modelling
Fiveways Feasibility Modelling - Final Report_ISSUED 05082014 Prepared by Parsons BrinckerhoffAugust 2014 for Transport for London
- 15 -
Figure 2-4: Bus journey time routes
2.5.5 The iBus values are compared to the modelled journey times in Tables 2-7 to 2-9below.
AMPeak
ObservedMinimum
ObservedMaximum
ObservedAverage
ModelledAverage
Diff.(%)
Within Minand Max?
157 NB 155 311 211 186 -11.9% Yes157 SB 82 179 140 167 19.5% Yes289 NB 115 177 148 194 31.2% No289 SB 99 148 121 167 38.0% NoRoute 3Table 2-7: AM peak bus journey time comparison
PMPeak
ObservedMinimum
ObservedMaximum
ObservedAverage
ModelledAverage
Diff.(%)
Within Minand Max?
157 NB 145 294 200 185 -7.3% Yes157 SB 87 179 132 167 27.0% Yes289 NB 100 177 145 206 42.0% No289 SB 127 179 156 226 44.8% NoRoute 3Table 2-8: PM peak bus journey time comparison
SatPeak
ObservedMinimum
ObservedMaximum
ObservedAverage
ModelledAverage
Diff.(%)
Within Minand Max?
157 NB 184 284 228 195 -14.6% Yes157 SB 106 171 133 154 16.3% Yes289 NB 169 176 173 268 55.5% No289 SB 116 162 141 223 57.4% NoRoute 3 228Table 2-9: Saturday peak bus journey time comparison
Route 157
Route 289

Fiveways Feasibility ModellingFinal Report - Base and Forecasting
Modelling
Fiveways Feasibility Modelling - Final Report_ISSUED 05082014 Prepared by Parsons BrinckerhoffAugust 2014 for Transport for London
- 16 -
2.5.6 Route 15 northbound generally validates well with all average modelled journey timeswithin 15% of the observed data. Although the modelled journey time for the 157southbound does not validate within 15% of the observed data, the average readingsits within the minimum and maximum observed values.
2.5.7 It is noted that the bus route 289 covers a very similar distance to route 2 for generaltraffic. However, the observed journey times are significantly different. For examplethe Route 2 NB journey time for general traffic in the AM peak was observed as 228seconds whilst the journey time recorded on bus route 289 NB is 148 seconds. Thereare no bus priority measures in place along this route to explain the difference inthese observed values and therefore validation to both data sets is not achievable.Given that the models will be used to assess the impact of highway improvements ongeneral traffic, a decision was made to match the general traffic journey times ratherthan the bus journey times.
Queue Lengths
2.5.8 Although not required for validation, the average and maximum queue lengths inPCUs have been extracted from the VISSIM models to give an indication of modelperformance.
2.5.9 The modelled queue lengths are presented in Table 2-10.
Junction Approach
Queue (PCU)
AM Peak PM Peak Sat Peak
Av. Max. Av. Max. Av. Max.J20/011 (PurleyWay/EpsomRoad)
Purley Way (North) 1 10 4 17 6 15Epsom Road 3 13 4 13 4 16Purley Way (South) 5 15 6 15 8 19
J20/013(Fiveways)
Purley Way (North) 6 12 6 11 6 11Stafford Road (NE) 8 22 14 34 15 30Denning Avenue 5 14 2 9 4 11Purley Way (South) 12 30 9 26 32 50Stafford Road (SW) 46 59 10 23 11 22
J20/016 (PurleyWay/CroydonRd)
Purley Way (North) 3 12 5 12 3 11Access McDonalds 1 5 6 9 6 9Purley Way (South) 11 21 11 21 9 21Croydon Road 5 18 9 29 6 19
J20/075 (EpsomRd/Stafford Rd)
Stafford Road(North)
3 13 6 17 4 14Stafford Road(South)
4 30 7 33 6 31J20/089 (PurleyWay/RetailAccess)
Purley Way (North) 6 22 11 26 13 27Purley Way (South) 0 6 0 3 2 7Retail Access 0 3 1 3 3 7
Table 2-10: Summary of Queue Lengths
2.5.10 Overall, the longest queues are shown at Fiveways where Stafford Road eastboundhas an average queue of 46 PCUs in the AM Peak. However, average queues onother approaches are shown to be relatively low.
2.5.11 Average queues of 32 PCUs are also shown on Purley Road on the northboundapproach to Fiveways in the Saturday Peak.

Fiveways Feasibility ModellingFinal Report - Base and Forecasting
Modelling
Fiveways Feasibility Modelling - Final Report_ISSUED 05082014 Prepared by Parsons BrinckerhoffAugust 2014 for Transport for London
- 17 -
2.6 Model Audit
2.6.1 To ensure the accuracy and robustness of the base year model an independentmodel audit was undertaken within PB. The audit was completed by an experiencedVISSIM modeller outside of the project team and assessed the accuracy of thefollowing;
· Network Structure
· Simulation parameters
· Vehicle speeds
· Give-way control
· Signal control
· Traffic data
· Public Transport data
· Vehicle behaviour
· Saturation flows
· Journey times
2.6.2 The model audit highlighted a number of minor issues in the models and amendmentswere made to address these issues. Full details of comments from the audit areincluded in Appendix A.
2.7 Base Validation Summary
2.7.1 Generally, the models have been shown to calibrate and validate well with theobserved data with almost all validation criteria being met as set out in TfL ModellingGuidelines.
2.7.2 It has not been possible to validate north and southbound bus journey times for the189 service. However, the observed bus journey time data appears to conflict with thecar journey time data. Given the model will be used to test improvements with the aimof improving car journey times, it was chosen to ensure car journey times validate toguidelines rather than the 189 bus route.
2.7.3 The models are therefore considered fit for purpose for testing future improvementoptions in the study area.

Fiveways Feasibility ModellingFinal Report - Base and Forecasting
Modelling
Fiveways Feasibility Modelling - Final Report_ISSUED 05082014 Prepared by Parsons BrinckerhoffAugust 2014 for Transport for London
- 18 -
3 SUMMARY OF SCENARIOS
3.1 Overview
3.1.1 The improvement proposals for Fiveways consist of two main Concepts for the studyarea, and four Options for improvement at Fiveways junction. These are describedbelow and overleaf.
3.2 Concept 1
3.2.1 The proposed Concept 1 scheme is shown in Appendix C.
3.2.2 Concept 1 would provide a new road linking east/west from Duppas Hill to the junctionof Purley Way/Croydon Road. The new Link Road would be formed of a single 3mlane in each direction.
3.2.3 Base VISSIM models of the study area provided by TfL indicated the followingeastbound route splits from Croydon Road in the existing scenario:
· 44% of right turning eastbound traffic on Croydon Road is destined for DuppasHill in the AM peak, (i.e. continuing eastbound along the A232), and 56% isdestined for other destinations (e.g. A23 south);
· 68% of right turning eastbound traffic on Croydon Road is destined for DuppasHill in the PM peak, (i.e. continuing eastbound along the A232), and 32% isdestined for other destinations (e.g. A23 south).
3.2.4 Likewise, in the westbound direction, the following route splits were shown fromDuppas Hill in the existing scenario:
· 95% of westbound traffic is destined for Croydon Road in the AM peak, (i.e.continuing westbound along the A232), and 5% is destined for Purley Way North(i.e. A23);
· 79% of westbound traffic is destined for Croydon Road in the PM peak, (i.e.continuing westbound along the A232), and 21% is destined for Purley WayNorth (i.e. A23).
3.2.5 The % route splits indicated within the TfL base models (as stated above) were usedto establish the number of vehicles likely to divert onto the proposed new east/westlink. Since no data was available for Saturday, routing assumptions were assumed tobe the same as the AM peak. The resulting routings have been assumed within theproposed Concept 1 VISSIM modelling for the study area.
3.2.6 In Concept 1, traffic reassignment is assumed as follows:
· All eastbound traffic currently travelling from Purley Way (at the north of thestudy area), Croydon Road and McDonalds to Duppas Hill would divert via thenew Link Road;
· All eastbound traffic currently travelling from Purley Way (at the north of thestudy area), Croydon Road and McDonalds to Epsom Road would continue toroute as existing via Fiveways junction;
· All westbound traffic currently travelling from Duppas Hill to Purley Way (at thenorth of the study area) and Croydon Road would divert via the new Link Road;

Fiveways Feasibility ModellingFinal Report - Base and Forecasting
Modelling
Fiveways Feasibility Modelling - Final Report_ISSUED 05082014 Prepared by Parsons BrinckerhoffAugust 2014 for Transport for London
- 19 -
· All westbound traffic currently travelling from Epsom Road to Purley Way (at thenorth of the study area) and Croydon Road would continue to route as existingvia Epsom Road.
3.2.7 The layout of Concept 1 within VISSIM is shown in Appendix F.
3.3 Concept 2
3.3.1 The proposed Concept 2 scheme is shown in Appendix C.
3.3.2 Concept 2 would convert Epsom Road to two-way between Stafford Road and PurleyWay to allow traffic going east to Duppas Hill and Epsom Road to bypass Fivewaysjunction.
3.3.3 The eastbound carriageway would be formed of two 3.0m lanes, making the sectionof Epsom Road between Purley Way and Stafford Road two lanes in each direction.
3.3.4 In addition, the section of Purley Way between Epsom Road and Croydon Roadwould be widened to three lanes in each direction.
3.3.5 In Concept 2, traffic reassignment is assumed as follows:
· All traffic currently travelling from Purley Way (at the north of the study area) andCroydon Road to Epsom Road and Duppas Hill would divert via Epsom Road.
3.3.6 The layout of Concept 2 within VISSIM is shown in Appendix G.
3.4 Fiveways Option 1
3.4.1 The proposed Option 1 scheme for Fiveways is shown in Appendix H. The mainimprovement proposals are as follows:
· Purley Way Southbound – Clearer lane definition and protection of right turnersinto the retail park;
· Denning Avenue – Reduction from three lanes to two lanes at the stopline toallow for footway widening;
· Purley Way Northbound – Clearer definition of lanes and removal of keep clearbox in the outside lanes and
· Stafford Road Northeastbound – Addition of a 3PCU right turn flare lane.
3.5 Fiveways Option 2
3.5.1 The proposed Option 2 scheme for Fiveways is shown in Appendix H. The mainimprovement proposals are as follows:
· Purley Way Southbound – as per Option 1 scheme;
· Denning Avenue – Reduction from three lanes to one lane at the stopline to allowfor improvements to the public realm;
· Purley Way Northbound – As per Option 1 scheme with extension of the existingrefuge island between Stafford Road and Purley Way; and
· Stafford Road Southbound – Conversion of 2 staggered crossings into 1 straightcrossing in order to facilitate pedestrian movement.

Fiveways Feasibility ModellingFinal Report - Base and Forecasting
Modelling
Fiveways Feasibility Modelling - Final Report_ISSUED 05082014 Prepared by Parsons BrinckerhoffAugust 2014 for Transport for London
- 20 -
3.6 Fiveways Option 3
3.6.1 The proposed Option 3 scheme has been excluded at an early stage from a furtherassessment; however the numbering of the remaining options remained unchanged(Option 4 and Option 5). The results of option 1 and 2 testing made option 3redundant.
3.7 Fiveways Option 4
3.7.1 The proposed Option 4 scheme for Fiveways is shown in Appendix B. The mainimprovement proposals are as follows:
· Purley Way Southbound – as per Option 1 scheme;
· Denning Avenue – as per Option 1 scheme;
· Purley Way Northbound – as per Option 2 scheme;
· Stafford Road Northeastbound – as per Option 1 scheme; and
· Stafford Road Southbound – as per Option 2 scheme.
3.8 Fiveways Option 5
3.8.1 The proposed Option 5 scheme for Fiveways is shown in Appendix B. The mainimprovement proposals are as follows:
· Layout as per Option 4 scheme; and
· Denning Avenue – bus only in both directions, in order to increase the proportionof green time for other movements and increase the capacity at other arms.
3.8.2 For the purpose of this study, all existing movements at the junction have beenassumed to be maintained in all Options except Option 5, in which:
· The existing traffic from Denning Avenue was shifted into Stafford Rd SB (58%)and Purley Way NB (42%);
· Turning movements to Denning Avenue were split between Purley Way SB(49%) and Stafford Rd NB (51%).
3.8.3 The above proportions were based on the current origin-destination patterns obtainedfrom the TfL’s 2021 South London Highways Assignment Model (SoLHAM) model asagreed with TfL.
For the purpose of this study, all existing movements at the junction have beenassumed to be maintained in both Options (with the exception of Denning Avenue inOption 5 as discussed above).

Fiveways Feasibility ModellingFinal Report - Base and Forecasting
Modelling
Fiveways Feasibility Modelling - Final Report_ISSUED 05082014 Prepared by Parsons BrinckerhoffAugust 2014 for Transport for London
- 21 -
3.9 Modelled Scenarios
3.9.1 The Concepts and Options presented above have been used to form sevenScenarios to test within the VISSIM model. The Scenarios are as follows:
Scenario No Scenario Name Layout Additional informationConcept Option
Scenario 1 DN Existing ‘Do Nothing' = Existing layout + 2021traffic flows
Scenario 2a C1a 1 N/A 2021 traffic flowsScenario 2b C1b 1 N/A 2021 traffic flows + Peds on Demand
Scenario 2c C1b no RT 1 N/A2021 traffic flows + no R turn fromPurley Way to New Link + Peds onDemand
Scenario 3 C2 2 N/A 2021 traffic flowsScenario 4 C1 + O1 1 1 2021 traffic flows
Scenario 4a C1 + O1 no RT 1 1 2021 traffic flows + no R turn fromPurley Way to New Link
Scenario 5 C2 + O1 2 1 2021 traffic flowsScenario 6 C1 + O2 1 2 2021 traffic flows
Scenario 6a C1 + O2 no RT 1 2 2021 traffic flows + no R turn fromPurley Way to New Link
Scenario 7 C2 + O2 2 2 2021 traffic flowsScenario 8 C1 + O4 1 4 2021 traffic flows
Scenario 8a C1 + O4 no RT 1 4 2021 traffic flows + no R turn fromPurley Way to New Link
Scenario 9 C2 + O4 2 4 2021 traffic flowsScenario 10 C1 + O5 1 5 2021 traffic flowsScenario10a C1 + O5 no RT 1 5 2021 traffic flows + no R turn from
Purley Way to New LinkScenario 11 C2 + O5 2 5 2021 traffic flows
Table 3-1: Details of scenario’s tested

Fiveways Feasibility ModellingFinal Report - Base and Forecasting
Modelling
Fiveways Feasibility Modelling - Final Report_ISSUED 05082014 Prepared by Parsons BrinckerhoffAugust 2014 for Transport for London
- 22 -
4 SCENARIO MODEL DEVELOPMENT
4.1 Forecasting Background Growth
4.1.1 The future assessment year for all scenarios is 2021.The SoLHAM has beencordoned for the study area and used to derive forecast growth for the future yeargrowth. Growth on each of the entry arms to the study area has been forecastbetween the base year SoLHAM Model (2009), and the forecast year model (2021).
4.1.2 This growth has then been applied as a percentage change on each of the VISSIMentry links. On Epsom Road in the AM Peak, growth has been applied in the form ofthe actual vehicle number due t the relatively low traffic flow on this link. It has beenassumed that no growth will occur on minor residential entry links. The applied growthis shown in Table 4-1, Table 4-2 and Table 4-3.
Entry LinkCurrent peak hour traffic flows [veh/h]
AM PM SATLights Heavies Lights Heavies Lights Heavies
Croydon Road 934 21 899 6 791 4Purley Way North 846 65 993 15 1092 9Epsom Road 72 0 88 1 96 1Duppas Hill Road 1057 31 1297 13 1298 16Denning Avenue 446 4 391 1 365 0Purley Way South 971 68 903 21 1096 6Stafford Road Southwest 778 9 762 1 616 3
Table 4-1: Summary of the current peak hour traffic
Entry Link% traffic change by 2021
AM PM SATLights Heavies Lights Heavies Lights Heavies
Croydon Road -1.1% 23.9% 8.9% 26.1% -1.1% 23.9%Purley Way North 15.9% 2.7% -0.8% 2.2% 15.9% 2.7%Epsom Road 0.0% 0.0% 0.0% 0.0% 0.0% 0.0%Duppas Hill Road -0.1% 0.6% -0.5% 11.6% -0.1% 0.6%Denning Avenue 1.2% -4.8% 0.4% 0.0% 1.2% -4.8%Purley Way South -4.3% 6.7% -1.8% 10.2% -4.3% 6.7%Stafford Road -3.0% 1.0% 1.4% 0.0% -3.0% 1.0%
Table 4-2: Summary of the traffic growth by 2021 [%]
Entry LinkTraffic change at peak hour [veh/h]
AM PM SATLights Heavies Lights Heavies Lights Heavies
Croydon Road -10 5 80 2 -9 1Purley Way North 134 2 -8 0 173 0Epsom Road 0 0 0 0 0 0Duppas Hill Road -1 0 -6 2 -1 0Denning Avenue 5 0 2 0 4 0Purley Way South -42 5 -17 2 -47 0Stafford Road Southwest -23 0 11 0 -19 0
Table 4-3: Summary of the traffic growth by 2021 [veh]

Fiveways Feasibility ModellingFinal Report - Base and Forecasting
Modelling
Fiveways Feasibility Modelling - Final Report_ISSUED 05082014 Prepared by Parsons BrinckerhoffAugust 2014 for Transport for London
- 23 -
4.1.3 It is acknowledged that the VISSIM base year model for this Study is based on 2013data, and therefore growth estimates from 2009 to 2021 may be an overestimation.However, overall growth for the study area as derived from the SoLHAM model wasfound to be relatively low (less than 2% in total vehicles in each peak period).Therefore, growth forecasts have not been adjusted to take into account thedifference in base years between the VISSIM and SoLHAM models. Rather, it hasbeen assumed that use of growth forecasts between 2009 and 2021 present a worstcase scenario in terms of growth projection.
4.2 Signals and Green Times
4.2.1 All signal staging arrangements have been kept as existing for all scenarios.However, there are some exceptions where the option being tested requiredalterations to the signal control. These instances are described below.
· Scenarios 2a, 2b, 2c, 4, 4a, 6 and 6a (with Concept 1) – Signal timings havebeen altered at J20/016 (Purley Way/Epsom Road) to take into account of thetraffic using the Elevated Link Road. Indicative signal timings from LINSIG wereinput within the model, and the LINSIG timings are provided in Appendix E. Thetimings underwent minor amendments within VISSIM to co-ordinate them withother junctions.
· Scenarios 2b, 2c, 4, 4a, 6 and 6a (with Concept 1) - In addition to theamendments described above, the pedestrian crossing on the exit arm to theElevated Link Road is called on average 50% of the time.
· Scenarios 3, 5 and 7 (with Concept 2) – At J20/075 (Epsom Road/StaffordRoad), an additional Phase has been added for Epsom Road. However, this runsin parallel with Duppas Hill Road, and does not require a change to the stagingarrangement. At J20/011 (Purley Way/Epsom Road), the southbound left turn isallowed with the southbound ahead movement and therefore no changes to thestaging or timings at this junction have been made.
· Scenarios 6, 6a, 7, 8, 8a and 9 (with options 2 or 4) – Signal timings as J20/013are amended to include a signalised left turn from Purley Way south to StaffordRoad which currently operates as a give way. The pedestrian crossing on theStafford Road south-west exit arm currently runs in stage one alongside trafficmovements from Purley Way north and south. The signalisation of the left turnrequires the pedestrian crossing to run during the interstage between stages 1and 2, and part of stage 2.
· Scenarios 10, 10a and 11 (with option 5) – Signal timings as J20/13 areamended as described above. In addition, stage 3 in which Denning Avenue runsis called only when a bus arrives at the stopline.
Fiveways Feasibility ModellingFinal Report - Base and Forecasting
Modelling
Fiveways Feasibility Modelling - Final Report_ISSUED 05082014 Prepared by Parsons BrinckerhoffAugust 2014 for Transport for London
- 24 -
5 SCENARIO RESULTS
5.1 Introduction
5.1.1 This section reports the results of the Scenario modelling within VISSIM. A discussionof these results for each of the scenarios is shown in Section 6.
5.2 General Traffic Journey Times
5.2.1 The journey times for general traffic have been assessed along 3 routes in twodirections, and are consistent with the Base model journey times. Although theroutings vary depending on the Concept, the measured start and end points areconsistent with the base model as follows:
Route 1
· Between Duppas Hill Road near Warrington Road and Croydon Road nearAldwick Road
Route 2
· Between Purley Way near Alton Way and Purley Way near Coldharbour Road
Route 3
· Between Duppas Hill Road near Warrington Road and Purley Way nearColdharbour Road
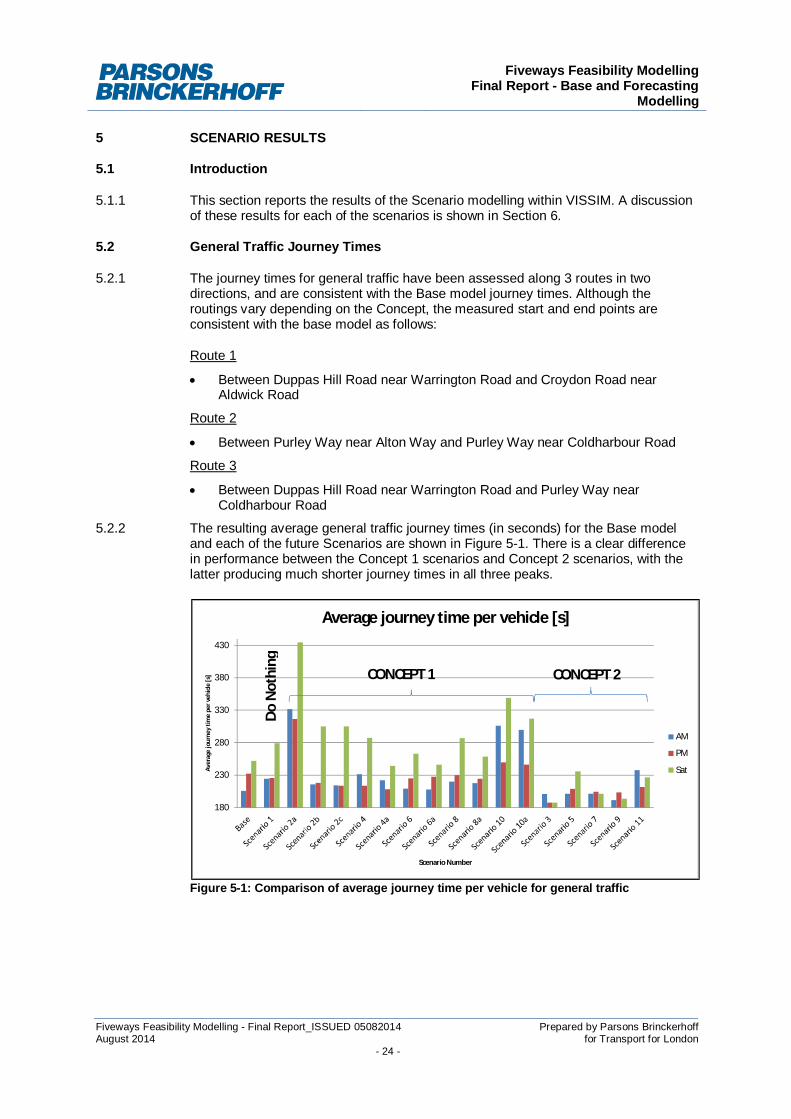
5.2.2 The resulting average general traffic journey times (in seconds) for the Base modeland each of the future Scenarios are shown in Figure 5-1. There is a clear differencein performance between the Concept 1 scenarios and Concept 2 scenarios, with thelatter producing much shorter journey times in all three peaks.
Figure 5-1: Comparison of average journey time per vehicle for general traffic
180
230
280
330
380
430
Aver
age
jour
ney
time
perv
ehic
le[s
]
Scenario Number
Average journey time per vehicle [s]
AM
PM
Sat
CONCEPT 1 CONCEPT 2
DoN
othi
ng
Fiveways Feasibility ModellingFinal Report - Base and Forecasting
Modelling
Fiveways Feasibility Modelling - Final Report_ISSUED 05082014 Prepared by Parsons BrinckerhoffAugust 2014 for Transport for London
- 25 -
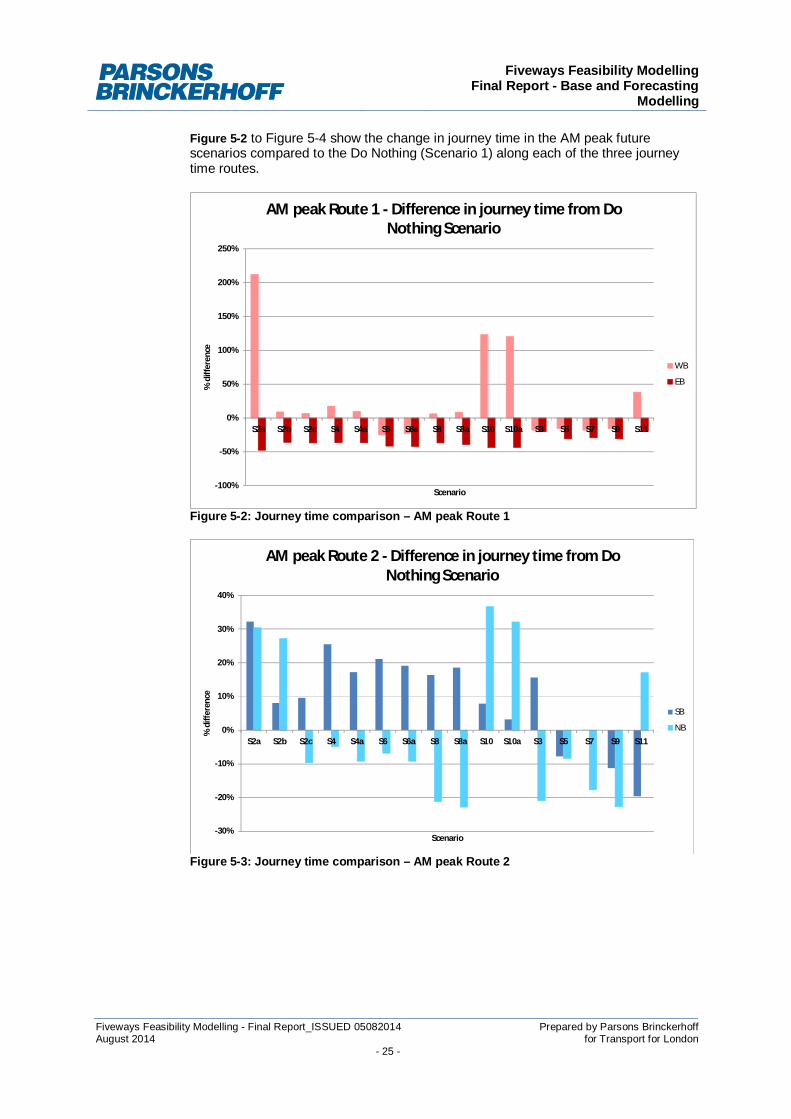
Figure 5-2 to Figure 5-4 show the change in journey time in the AM peak futurescenarios compared to the Do Nothing (Scenario 1) along each of the three journeytime routes.
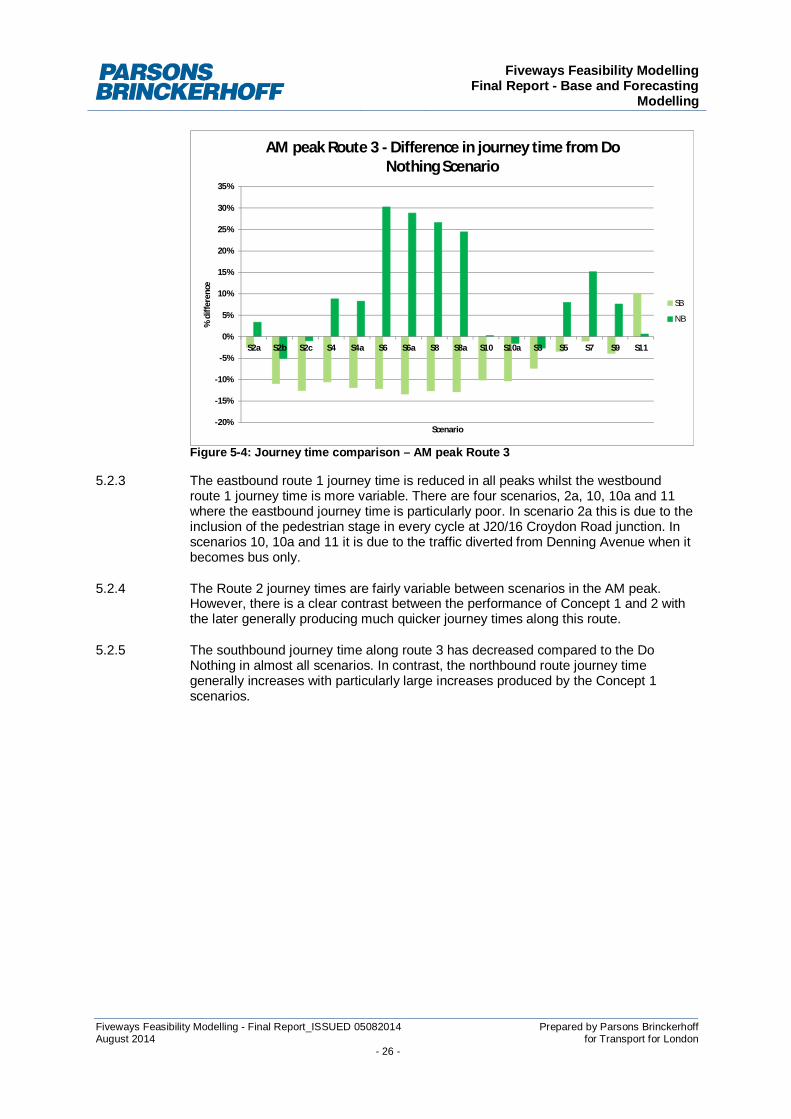
Figure 5-2: Journey time comparison – AM peak Route 1
Figure 5-3: Journey time comparison – AM peak Route 2
-100%
-50%
0%
50%
100%
150%
200%
250%
S2a S2b S2c S4 S4a S6 S6a S8 S8a S10 S10a S3 S5 S7 S9 S11
%di
ffere
nce
Scenario
AM peak Route 1 - Difference in journey time from DoNothing Scenario
WB
EB
-30%
-20%
-10%
0%
10%
20%
30%
40%
S2a S2b S2c S4 S4a S6 S6a S8 S8a S10 S10a S3 S5 S7 S9 S11
%di
ffere
nce
Scenario
AM peak Route 2 - Difference in journey time from DoNothing Scenario
SB
NB
Fiveways Feasibility ModellingFinal Report - Base and Forecasting
Modelling
Fiveways Feasibility Modelling - Final Report_ISSUED 05082014 Prepared by Parsons BrinckerhoffAugust 2014 for Transport for London
- 26 -
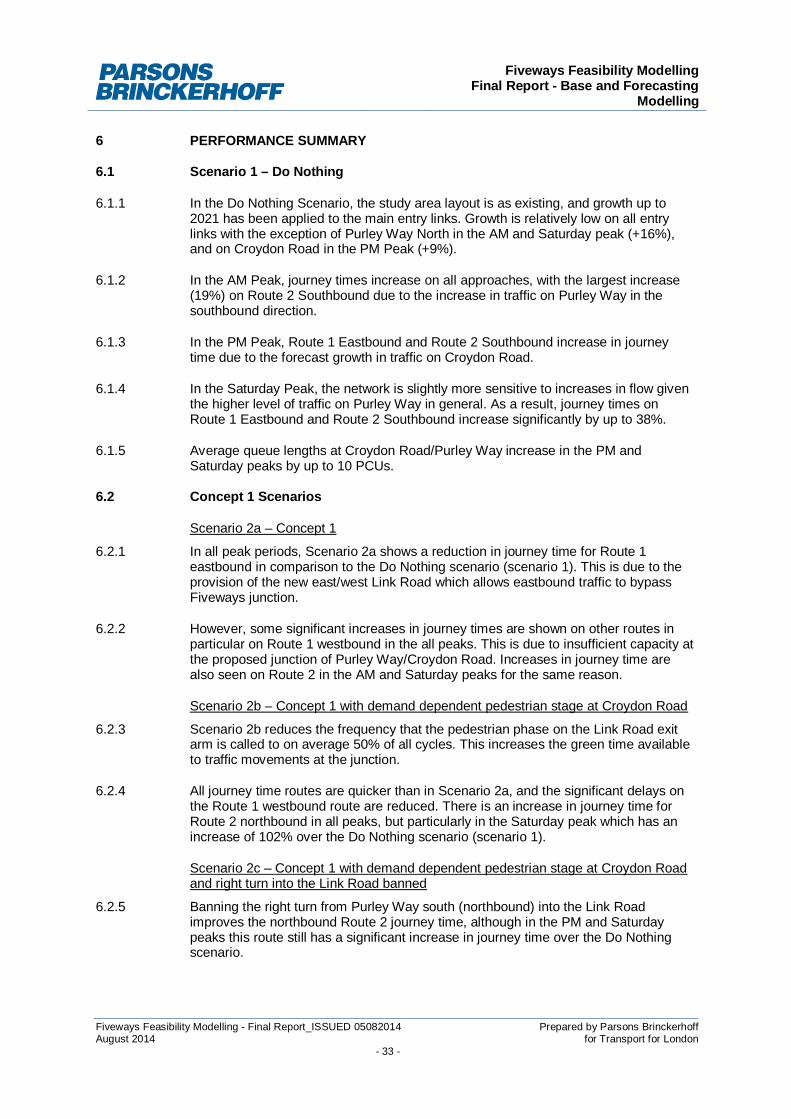
Figure 5-4: Journey time comparison – AM peak Route 3
5.2.3 The eastbound route 1 journey time is reduced in all peaks whilst the westboundroute 1 journey time is more variable. There are four scenarios, 2a, 10, 10a and 11where the eastbound journey time is particularly poor. In scenario 2a this is due to theinclusion of the pedestrian stage in every cycle at J20/16 Croydon Road junction. Inscenarios 10, 10a and 11 it is due to the traffic diverted from Denning Avenue when itbecomes bus only.
5.2.4 The Route 2 journey times are fairly variable between scenarios in the AM peak.However, there is a clear contrast between the performance of Concept 1 and 2 withthe later generally producing much quicker journey times along this route.
5.2.5 The southbound journey time along route 3 has decreased compared to the DoNothing in almost all scenarios. In contrast, the northbound route journey timegenerally increases with particularly large increases produced by the Concept 1scenarios.
-20%
-15%
-10%
-5%
0%
5%
10%
15%
20%
25%
30%
35%
S2a S2b S2c S4 S4a S6 S6a S8 S8a S10 S10a S3 S5 S7 S9 S11
%di
ffere
nce
Scenario
AM peak Route 3 - Difference in journey time from DoNothing Scenario
SB
NB

Fiveways Feasibility ModellingFinal Report - Base and Forecasting
Modelling
Fiveways Feasibility Modelling - Final Report_ISSUED 05082014 Prepared by Parsons BrinckerhoffAugust 2014 for Transport for London
- 27 -
5.2.6 Figure 5-5 to Figure 5-7 show the change in journey time in the PM peak futurescenarios compared to the Do Nothing (Scenario 1) along each of the three journeytime routes.
Figure 5-5: Journey time comparison – PM peak Route 1
Figure 5-6: Journey time comparison – PM peak Route 2
-100%
-50%
0%
50%
100%
150%
200%
250%
300%
350%
400%
S2a S2b S2c S4 S4a S6 S6a S8 S8a S10 S10a S3 S5 S7 S9 S11
%di
ffere
nce
Scenario
PM peak Route 1 - Difference in journey time from DoNothing Scenario
WB
EB
-40%
-30%
-20%
-10%
0%
10%
20%
30%
40%
50%
S2a S2b S2c S4 S4a S6 S6a S8 S8a S10 S10a S3 S5 S7 S9 S11%di
ffere
nce
Scenario
PM peak Route 2 - Difference in journey time from DoNothing Scenario
SB
NB

Fiveways Feasibility ModellingFinal Report - Base and Forecasting
Modelling
Fiveways Feasibility Modelling - Final Report_ISSUED 05082014 Prepared by Parsons BrinckerhoffAugust 2014 for Transport for London
- 28 -
Figure 5-7: Journey time comparison – PM peak Route 3
5.2.7 The journey time on Route 1 eastbound is consistently around 154 seconds quickerthan the Do Nothing scenario in all the Concept 1 scenarios. The reduction is slightlyless for the Concept 2 scenarios, but it is a consistent reduction nonetheless. In mostscenarios the Route 2 journey times are very similar to the Do Nothing scenario. Theexceptions are Scenario 2a due to the staging at J20/16 Croydon Road junction andscenarios 10, 10a and 11 due the re-assigned traffic from Denning Avenue.
5.2.8 In general the Concept 1 scenarios produce an increase in journey time along boththe northbound and southbound Route 2, whilst the Concept 2 scenarios produce areduction in journey time.
5.2.9 Scenarios 2a, 2b, 2c, 4 and 4a generally have a reduction in journey time on Route 3northbound and southbound. For all other scenarios the journey time on Route 3 inboth directions almost always increases.
-20%
-10%
0%
10%
20%
30%
40%
50%
60%
70%
S2a S2b S2c S4 S4a S6 S6a S8 S8a S10 S10a S3 S5 S7 S9 S11
%di
ffere
nce
Scenario
PM peak Route 3 - Difference in journey time from DoNothing Scenario
SB
NB

Fiveways Feasibility ModellingFinal Report - Base and Forecasting
Modelling
Fiveways Feasibility Modelling - Final Report_ISSUED 05082014 Prepared by Parsons BrinckerhoffAugust 2014 for Transport for London
- 29 -
5.2.10 Figure 5-8 to Figure 5-10 show the change in journey time in the Saturday peak futurescenarios compared to the Do Nothing (Scenario 1) along each of the three journeytime routes.
Figure 5-8: Journey time comparison – Saturday peak Route 1
Figure 5-9: Journey time comparison – Saturday peak Route 2
-100%
-50%
0%
50%
100%
150%
200%
250%
300%
S2a S2b S2c S4 S4a S6 S6a S8 S8a S10 S10a S3 S5 S7 S9 S11
%di
ffere
nce
Scenario
Sat peak Route 1 - Difference in journey time from DoNothing Scenario
WB
EB
-60%
-40%
-20%
0%
20%
40%
60%
80%
100%
120%
S2a S2b S2c S4 S4a S6 S6a S8 S8a S10 S10a S3 S5 S7 S9 S11
%di
ffere
nce
Scenario
Sat peak Route 2 - Difference in journey time from DoNothing Scenario
SB
NB

Fiveways Feasibility ModellingFinal Report - Base and Forecasting
Modelling
Fiveways Feasibility Modelling - Final Report_ISSUED 05082014 Prepared by Parsons BrinckerhoffAugust 2014 for Transport for London
- 30 -
Figure 5-10: Journey time comparison – Saturday peak Route 3
5.2.11 The journey time along Route 1 eastbound decreases compared to the Do Nothing inall scenarios. Route 1 eastbound is fairly similar to the Do Nothing in most scenarios,the exceptions being scenarios 2a, 10 and 10a. The reasons for this are the same asin the other two peaks.
5.2.12 The journey times along Route 2 show a clear difference in the performance ofConcept 1 and Concept 2 scenarios. The Concept 1 scenarios all produce anincrease in journey time along the northbound route compared to the Do Nothing andonly a small decrease in journey time on the southbound route. In contrast, Concept 2produces significant decreases in journey time along the northbound and southboundRoute 2.
5.2.13 In most scenarios the journey time on northbound route 3 is quicker than the DoNothing whilst the southbound journey time is more variable.
5.3 Bus Journey Times
5.3.1 Bus journey time data has been extracted in conjunction with the Base model for twobus routes through the study area; 157 and 289. These journey times are shownrelative to the Do Nothing scenario in Figure 5-11, Figure 5-12 and Figure 5-13.
-30%
-20%
-10%
0%
10%
20%
30%
40%
50%
S2a S2b S2c S4 S4a S6 S6a S8 S8a S10 S10a S3 S5 S7 S9 S11
%di
ffer
ence
Scenario
Sat peak Route 3 - Difference in journey time from DoNothing Scenario
SB
NB

Fiveways Feasibility ModellingFinal Report - Base and Forecasting
Modelling
Fiveways Feasibility Modelling - Final Report_ISSUED 05082014 Prepared by Parsons BrinckerhoffAugust 2014 for Transport for London
- 31 -
Figure 5-11: Bus journey time comparison – AM peak
Figure 5-12: Bus journey time comparison – PM peak
-40%
-30%
-20%
-10%
0%
10%
20%
30%
40%
50%
S2a
S2b
S2c
S4 S4a
S6 S6a
S8 S8a
S10
S10a
S3 S5 S7 S9 S11
%di
ffer
ence
Scenario
AM Peak - Difference in bus journey time from Do Nothing
157 NB 157 SB 289 NB 289 SB
-30%
-20%
-10%
0%
10%
20%
30%
40%
50%
60%
70%
S2a
S2b
S2c
S4 S4a
S6 S6a
S8 S8a
S10
S10a
S3 S5 S7 S9 S11
%di
ffere
nce
Scenario
PM Peak - Difference in bus journey time from Do Nothing
157 NB 157 SB 289 NB 289 SB

Fiveways Feasibility ModellingFinal Report - Base and Forecasting
Modelling
Fiveways Feasibility Modelling - Final Report_ISSUED 05082014 Prepared by Parsons BrinckerhoffAugust 2014 for Transport for London
- 32 -
Figure 5-13: Bus journey time comparison – Sat peak
5.3.2 The results are fairly consistent for all scenarios based on Concept 1; the southboundjourney times are generally reduced whilst the northbound journey times are generallyincreased. In contrast, the Concept 2 options reduced the northbound andsouthbound journey times. This pattern is consistent in all three peaks.
5.4 Queue Data
5.4.1 The average and maximum queue for each stopline within the model has beenextracted from each of the scenario models, and is presented in Appendix K.Interesting aspects from the queue results are highlighted in section 6 of this report.
5.4.2 The queues on Denning Avenue are noteworthy since Options 1, 2, 4 and 5 restrictthe capacity of the stop line at Fiveways from Denning Avenue resulting inconsiderable queuing. In many scenarios the queuing is so excessive that aproportion of traffic cannot get onto the network within the peak hour. This traffic issummarised in Table 5-1 below and should be considered in addition to the queuesreported on Denning Avenue.
S1 S2a S2b S2c S4 S4a S6 S6a S8 S8a S10 S10a S3 S5 S7 S9 S11AM peak 0 0 0 0 34 41 316 313 201 206 0 0 0 12 288 174 0
PM peak 0 0 0 0 27 27 191 190 37 37 0 0 0 0 194 120 0
Sat peak 0 0 0 0 112 109 226 235 144 143 0 0 0 16 231 137 0Table 5-1: Vehicles on Denning Avenue unable to enter the network in peak hour
-50%
-40%
-30%
-20%
-10%
0%
10%
20%
30%
40%
50%
60%
70%
80%
S2a
S2b
S2c
S4 S4a
S6 S6a
S8 S8a
S10
S10a
S3 S5 S7 S9 S11
%di
ffere
mce
Scenario
Sat Peak - Difference in bus journey time from Do Nothing
157 NB 157 SB 289 NB 289 SB
Fiveways Feasibility ModellingFinal Report - Base and Forecasting
Modelling
Fiveways Feasibility Modelling - Final Report_ISSUED 05082014 Prepared by Parsons BrinckerhoffAugust 2014 for Transport for London
- 33 -
6 PERFORMANCE SUMMARY
6.1 Scenario 1 – Do Nothing
6.1.1 In the Do Nothing Scenario, the study area layout is as existing, and growth up to2021 has been applied to the main entry links. Growth is relatively low on all entrylinks with the exception of Purley Way North in the AM and Saturday peak (+16%),and on Croydon Road in the PM Peak (+9%).
6.1.2 In the AM Peak, journey times increase on all approaches, with the largest increase(19%) on Route 2 Southbound due to the increase in traffic on Purley Way in thesouthbound direction.
6.1.3 In the PM Peak, Route 1 Eastbound and Route 2 Southbound increase in journeytime due to the forecast growth in traffic on Croydon Road.
6.1.4 In the Saturday Peak, the network is slightly more sensitive to increases in flow giventhe higher level of traffic on Purley Way in general. As a result, journey times onRoute 1 Eastbound and Route 2 Southbound increase significantly by up to 38%.
6.1.5 Average queue lengths at Croydon Road/Purley Way increase in the PM andSaturday peaks by up to 10 PCUs.
6.2 Concept 1 Scenarios
Scenario 2a – Concept 1
6.2.1 In all peak periods, Scenario 2a shows a reduction in journey time for Route 1eastbound in comparison to the Do Nothing scenario (scenario 1). This is due to theprovision of the new east/west Link Road which allows eastbound traffic to bypassFiveways junction.
6.2.2 However, some significant increases in journey times are shown on other routes inparticular on Route 1 westbound in the all peaks. This is due to insufficient capacity atthe proposed junction of Purley Way/Croydon Road. Increases in journey time arealso seen on Route 2 in the AM and Saturday peaks for the same reason.
Scenario 2b – Concept 1 with demand dependent pedestrian stage at Croydon Road
6.2.3 Scenario 2b reduces the frequency that the pedestrian phase on the Link Road exitarm is called to on average 50% of all cycles. This increases the green time availableto traffic movements at the junction.
6.2.4 All journey time routes are quicker than in Scenario 2a, and the significant delays onthe Route 1 westbound route are reduced. There is an increase in journey time forRoute 2 northbound in all peaks, but particularly in the Saturday peak which has anincrease of 102% over the Do Nothing scenario (scenario 1).
Scenario 2c – Concept 1 with demand dependent pedestrian stage at Croydon Roadand right turn into the Link Road banned
6.2.5 Banning the right turn from Purley Way south (northbound) into the Link Roadimproves the northbound Route 2 journey time, although in the PM and Saturdaypeaks this route still has a significant increase in journey time over the Do Nothingscenario.

Fiveways Feasibility ModellingFinal Report - Base and Forecasting
Modelling
Fiveways Feasibility Modelling - Final Report_ISSUED 05082014 Prepared by Parsons BrinckerhoffAugust 2014 for Transport for London
- 34 -
Scenario 4 - Concept 1 + Option 1
6.2.6 Scenario 4 performs similarly to Scenario 2b. The average journey time per vehicle isslightly longer in the AM peak (232 seconds compared to 215 in Scenario 2b), verysimilar in the PM peak (214 seconds compared to 218 in Scenario 2b) and slightlyquicker in the Saturday peak (287 seconds compared to 305 in Scenario 2b).
6.2.7 The average and maximum queue on Denning Avenue increases significantly in allpeak periods due to the reduction in lanes from three to two on this approach.Furthermore, between 27 and 114 vehicles (depending on the peak) are unable toenter the network on Denning Avenue due to excess queuing.
6.2.8 It is worth noting that the journey time routes assessed do not capture theperformance of Stafford Road South which benefits from this option.
Scenario 4a - Concept 1 + Option 1 with right turn into the Link Road banned
6.2.9 The journey times are slightly decreased in all peaks compared with Scenario 4. TheSaturday peak, where the number of right turners from Purley Way at Croydon Roadis the greatest, improves significantly compared to Scenario 4. Routes 2 and 3northbound had journey times 57% and 20% respectively greater than the Do Nothingin Scenario 4. Banning the right turn in Scenario 4a reduces this to an increase of 5%on Route 2 northbound, and a decrease of 3% on Route 3 southbound compared tothe Do Nothing.
Scenario 6 - Concept 1 + Option 2
6.2.10 Concept 1 combined with option two performs better than Concept 1 combined withoption 1. Journey time improvements are shown for Route 1 eastbound andwestbound, although Route 3 northbound experiences increases in journey time of upto 33%.
6.2.11 The reduction of Denning Avenue from three lanes down to only one producessignificant queuing and between 191 and 316 vehicles (depending on the peak) wereunable to enter the network on this approach.
Scenario 6a - Concept 1 + Option 2 with right turn into the Link Road banned
6.2.12 Banning the right turn form Purley Way south at Croydon Road into the Link Roadproduces very little change in the journey time along most routes in the AM and PMpeaks. In the Saturday peak there is a more obvious improvement compared toScenario 6, particularly on Route 2 northbound. This is due to the greater number ofright turning vehicles in the Saturday peak compared to the AM and PM peaks.
Scenario 8 - Concept 1 + Option 4
6.2.13 Concept 1 with Option 4 produces very similar average journey times per vehicle asConcept 1 with Option 1 (scenario 4).
6.2.14 In all peaks there is an increase in the journey time along Route 3 northbound and asignificant decrease in journey time along Route 1 eastbound compared to the DoNothing. Route 1 westbound journey time remains very similar to the Do Nothingscenario (scenario 1).
Scenario 8a - Concept 1 + Option 4 with right turn into the Link Road banned
6.2.15 The Route 2 and 3 northbound Routes are improved by banning the right turn fromPurley Way south into the new Link Road. This is particularly noticeable in the

Fiveways Feasibility ModellingFinal Report - Base and Forecasting
Modelling
Fiveways Feasibility Modelling - Final Report_ISSUED 05082014 Prepared by Parsons BrinckerhoffAugust 2014 for Transport for London
- 35 -
Saturday peak where the increase in Route 2 and 3 northbound compared to the DoNothing has reduced from 39% and 43% respectively in Scenario 8 to 0% and 30% inScenario 8a.
Scenario 10 - Concept 1 + Option 5
6.2.16 Option 5 has an identical layout to Option 4, the only difference being that DenningAvenue is bus only. All general traffic previously using Denning Avenue has been re-assigned onto alternative routes through the network. Due to the heavy queuing onDenning Avenue in Option 4, significant numbers of vehicles could not get onto thenetwork. With the re-assignment of these vehicles they are all able to complete theirroute in the peak hour, but this has an adverse impact on several of the journey timeroutes.
6.2.17 The traffic is re-assigned to enter from either Purley Way south or Duppas Hill Roadand this is reflected in the results by an increase in journey time on Route 1westbound and route 2 northbound in all peaks.
6.2.18 The signal control at Fiveways is altered to only call the stage containing DenningAvenue when buses arrive at the stopline. This allows a greater proportion of greentime to be allocated to other movements through the Fiveways junction and thisresults in an decrease in journey time along Route 3 northbound compared toConcept 1 with Option 4 (scenario 8) in all peaks. In the Saturday peak the journeytime along this route is still longer than the Do Nothing journey time.
6.2.19 The journey time on Route 1 eastbound has decreased compared to the Do Nothing
Scenario 10a - Concept 1 + Option 5 with right turn into the Link Road banned
6.2.20 The journey times along all routes in the AM and PM peaks remains very similar inthis Scenario to Scenario 10 (Concept 1 + Option 5). In the Saturday peak Routes 2and 3 northbound are quicker than in Scenario 10, though both are still slightly slowerthan the Do Nothing scenario (Scenario 1).
6.3 Concept 2 Scenarios
Scenario 3 – Concept 2
6.3.1 In the AM Peak, journey times decrease on all routes compared with the Do Nothing(Scenario 1), except Route 2 southbound which is slightly increased. The largestdecrease (-21%) is on Route 1 Eastbound. This is a result of making Epsom Roadtwo-way allowing eastbound traffic to bypass Fiveways junction, and decreasing thedistance travelled by eastbound vehicles. The journey times on Route 2 northboundand Route 1 westbound also decrease significantly due to the extended provision ofthree approach lanes on Purley Way northbound at the junction with Croydon Road.
6.3.2 A similar pattern in journey times is shown in the PM and Saturday peaks, with thelargest decrease (-49% in PM peak and 58% on Saturday peak)) on Route 1Eastbound.
6.3.3 Average queue lengths on the network are generally similar or reduced from theBase.

Fiveways Feasibility ModellingFinal Report - Base and Forecasting
Modelling
Fiveways Feasibility Modelling - Final Report_ISSUED 05082014 Prepared by Parsons BrinckerhoffAugust 2014 for Transport for London
- 36 -
Scenario 5 – Concept 2 + Option 1
6.3.4 Scenario 5 performs similarly to Scenario 3 with almost all journey times reducedwhen compared to Scenario 1. However, the reductions in journey times are not assignificant as in Scenario 3.
6.3.5 The largest reduction in journey times in all peaks is shown on Route 1 Eastbounddue to the introduction of two-way running on Epsom Road.
6.3.6 Optimisation of the signals along with the proposals at Fiveways (in particular, theintroduction of the right turn flare lane on Stafford Road eastbound) result in areduction in average queue on Stafford Road eastbound in all peak periods.
6.3.7 The average queue on Denning Avenue increases significantly in all peak periods dueto the reduction in lanes from three to two on this approach.
Scenario 7 – Concept 2 + Option 2
6.3.8 Scenario 7 performs similarly to Scenarios 3 and 5 with almost all journey timesreduced when compared to Scenario 1. However, the reductions in journey times arenot as significant as in Scenarios 3 and 5.
6.3.9 The journey time on Route 3 northbound increases in all peak periods but this journeytime is not dissimilar from the base.
6.3.10 Average queues at Fiveways are generally increased from Scenarios 1, 3 and 5,particularly on Denning Avenue where the reduction to a single lane approach resultsin relatively long average queues and between 194 and 288 vehicles (depending onthe peak) on this approach were unable to enter the model network due to queuing.
Scenario 9 – Concept 2 + Option 4
6.3.11 Scenario 9 produces very similar results to scenarios 3, 5 and 7 with reductions injourney time on most route sin all three peaks. The largest reduction in journey time ison Route 1 eastbound which is 31%, 36% and 56% quicker than the Do Nothing inthe AM, PM and Saturday models respectively.
6.3.12 The queue on Denning Avenue remains relatively long with between 120 and 174(depending on the peak) vehicles unable to enter the network in the modelled period.
Scenario 11 – Concept 2 + Option 5
6.3.13 The journey times in Scenario 11 are slower than in Scenario 9 because the trafficfrom Denning Avenue has been re-assigned to Purley Way South and Duppas Hilland therefore is now able to enter the network. This increase in vehicles on thenetwork produces a corresponding increase in journey time, particularly on Route 1westbound and Route 2 northbound.

Fiveways Feasibility ModellingFinal Report - Base and Forecasting
Modelling
Fiveways Feasibility Modelling - Final Report_ISSUED 05082014 Prepared by Parsons BrinckerhoffAugust 2014 for Transport for London
- 37 -
7 CROYDON ROAD SENSITIVITY TESTING
7.1 Introduction
7.1.1 The VISSIM modelling results showed that Concept 1 produces worse journey timesthan a Do Nothing scenario due to the constraints at the Purley Way/Croydon Roadjunction (UTC Signal J20/016). In response to this, sensitivity testing within LinSigwas undertaken to establish whether junction performance may be improved either bybanning movements at the junction, or by altering routing assumptions. Although it isrecognised that LINSIG will not be as robust as the VISSIM testing (which makes useof a validated base model), it is able to optimise the signal timings and provide anindication of the impact of such changes. This was then used to inform the VISSIMtesting for Fiveways.
7.1.2 The sensitivity testing was carried out for the Saturday peak, since this is the worstperforming peak period. The aim of the testing was to establish the impact of thefollowing changes at the junction:
· Banning the right turn movement northbound from Purley Way South turning in tothe new link.
· Altering the % split of eastbound traffic from Croydon Road which follows a routevia the proposed new link (the assumptions made in the VISSIM model aresummarised in section 3.2).
7.2 Assessment Scenarios
7.2.1 Table 7-1 shows the scenarios for J20/016 which have been tested within LINSIG.The assessment year for all scenarios is 2021.
AssessmentScenario
Proposed Junction Layout Eastbound route split(% Ahead:% Right Turn)
C1 Baseline Concept 1 layout (as per Figure 1) As per existing (44%:56%)
C1 BannedRight Turn
Concept 1 layout with northbound rightturn on Purley Way south banned
As per existing (44%:56%)
C1 30/70 Concept 1 layout (as per Figure 1) 30% Ahead:70% Right
C1 50/50 Concept 1 layout (as per Figure 1) 50% Ahead:50% Right
C1 70/30 Concept 1 layout (as per Figure 1) 70% Ahead:30% Right
C1 80/20 Concept 1 layout (as per Figure 1) 80% Ahead:20% Right
C1 90/10 Concept 1 layout (as per Figure 1) 90% Ahead:10% RightTable 7-1: LinSig sensitivity testing scenarios
7.2.2 The following assumptions have been made within the LINSIG modelling:
· The signal cycle time is 120 seconds (as per existing);
· Pedestrian phase J (i.e. Stage 3) is called every other cycle. Pedestrian phase L(i.e. Stage 5, which also allows right turners from Croydon Rd a designatedgreen arrow) is called every other cycle.
Signal timings for all scenarios have been optimised for PRC within LINSIG.

Fiveways Feasibility ModellingFinal Report - Base and Forecasting
Modelling
Fiveways Feasibility Modelling - Final Report_ISSUED 05082014 Prepared by Parsons BrinckerhoffAugust 2014 for Transport for London
- 38 -
7.3 Results
7.3.1 Table 7-2 shows the results of the LINSIG Sensitivity testing.
Approach Lane (withflare)
C1 Baseline C1 BannedRT
C1 30/70 C1 50/50 C1 70/30 C1 80/20 C1 90/10
DoS[%]
MMQ[PCU]
DoS[%]
MMQ[PCU]
DoS[%]
MMQ[PCU]
DoS[%]
MMQ[PCU]
DoS[%]
MMQ[PCU]
DoS[%]
MMQ[PCU]
DoS[%]
MMQ[PCU]
Purley Way SB Ahead/Left 106.8 55 106.8 56 107.9 60 105.6 52 98.2 35 98 35 98 35
Ahead (Right) 105.9 55 105.9 56 107.4 61 104.5 50 97.7 34 97.9 34 97.9 34
New Link Ahead/Left 96.8 33 96.8 33 108.2 63 96.8 34 98.6 46 98.6 46 98.6 46
Purley Way NB Ahead (Left) 96.5 26 69.7 12 93 23 94.9 24 98.6 31 94.6 26 94.6 26
Ahead/Right 76.5 5 50.5 9 81 7 76.7 5 61.8 3 70.4 4 70.4 4
Croydon Rd Ahead (Left) 40.2 6 40.2 6 35.8 6 41.7 6 55 10 61.7 12 68.1 14
Right 104.5 26 104.5 26 108.9 39 103.1 23 88.2 10 58.6 5 29.6 1Table 7-2: Croydon Road sensitivity test results

Fiveways Feasibility ModellingFinal Report - Base and Forecasting
Modelling
Fiveways Feasibility Modelling - Final Report_ISSUED 05082014 Prepared by Parsons BrinckerhoffAugust 2014 for Transport for London
- 39 -
7.3.2 In the C1 Baseline scenario, the junction is shown to operate over capacity withDegrees of Saturation (DoS) close to or over 100% on the majority of approaches.This is consistent with the VISSIM modelling undertaken for Concept 1, which alsoshowed the junction to be operating at or close to capacity.
7.3.3 When the northbound right turn from Purley Way south is banned, the DoS on thisapproach reduces within acceptable levels. However, other approaches to thejunction (i.e. Purley Way southbound and Croydon Road) remain over capacity with aDoS in excess of 100%.
7.3.4 Testing the variance in eastbound routing reveals the following:
· Increasing the proportion of traffic turning right on Croydon Road (i.e. assumingfewer vehicles will use the new link road) increases the DoS on a number ofapproaches from the baseline, and the junction remains forecast to operate overcapacity. This is due to the allocation of more time to Stage 5 for right turners,and less time for other Stages.
· Decreasing the proportion of traffic turning right on Croydon Road (i.e. assumingmore vehicles will use the new link road) decreases the DoS on a number ofapproaches from the baseline. However, the junction continues to operate aboveacceptable levels with Degrees of Saturation in excess of 94% on three of fourapproaches.
· Decreasing the proportion of traffic turning right on Croydon Road to less than30% has little or no impact on the junction performance. This is because Stage 5already receives a minimum green (which also allows for pedestrian Phase L torun) at 30% right turners. Therefore, the green time cannot reduce further withfewer right turners, unless pedestrian Phase L was assumed to be called at alower frequency.
7.4 Summary
7.4.1 The LINSIG sensitivity modelling for Purley Way/Croydon Road for Concept 1 showsthat:
· Banning the northbound right turn movement from Purley Way South wouldimprove performance on Purley Way Northbound. However, this would notimpact on other arms, and the junction would remain over capacity in theSaturday peak.
· Decreasing the proportion of traffic turning right on Croydon Road (i.e. assumingmore vehicles will use the new link road) to around 30% right turners decreasesthe DoS on a number of approaches from the baseline. However, the junctioncontinues to operate above acceptable levels with Degrees of Saturation inexcess of 94% on three of four approaches in the Saturday peak.

Fiveways Feasibility ModellingFinal Report - Base and Forecasting
Modelling
Fiveways Feasibility Modelling - Final Report_ISSUED 05082014 Prepared by Parsons BrinckerhoffAugust 2014 for Transport for London
- 40 -
8 CONCLUSION
8.1.1 This study has tested the traffic impact of seventeen future scenarios for the Fivewaysstudy area in Croydon as listed in Table 8-1:
Scenario No Scenario Name Layout Additional informationConcept Option
Scenario 1 DN Existing ‘Do Nothing' = Existing layout + 2021traffic flows
Scenario 2a C1a 1 N/A 2021 traffic flowsScenario 2b C1b 1 N/A 2021 traffic flows + Peds on Demand
Scenario 2c C1b no RT 1 N/A2021 traffic flows + no R turn fromPurley Way to New Link + Peds onDemand
Scenario 3 C2 2 N/A 2021 traffic flowsScenario 4 C1 + O1 1 1 2021 traffic flows
Scenario 4a C1 + O1 no RT 1 1 2021 traffic flows + no R turn fromPurley Way to New Link
Scenario 5 C2 + O1 2 1 2021 traffic flowsScenario 6 C1 + O2 1 2 2021 traffic flows
Scenario 6a C1 + O2 no RT 1 2 2021 traffic flows + no R turn fromPurley Way to New Link
Scenario 7 C2 + O2 2 2 2021 traffic flowsScenario 8 C1 + O4 1 4 2021 traffic flows
Scenario 8a C1 + O4 no RT 1 4 2021 traffic flows + no R turn fromPurley Way to New Link
Scenario 9 C2 + O4 2 4 2021 traffic flowsScenario 10 C1 + O5 1 5 2021 traffic flowsScenario10a C1 + O5 no RT 1 5 2021 traffic flows + no R turn from
Purley Way to New LinkScenario 11 C2 + O5 2 5 2021 traffic flows
Table 8-1: Details of scenarios tested
8.1.2 All scenarios have been tested for a future assessment year of 2021, and forecastgrowth in traffic has been derived from the SoLHAM strategic model. Where required,LINSIG has been used to derive indicative signal timings, which have then beenfurther optimised within VISSIM.

Fiveways Feasibility ModellingFinal Report - Base and Forecasting
Modelling
Fiveways Feasibility Modelling - Final Report_ISSUED 05082014 Prepared by Parsons BrinckerhoffAugust 2014 for Transport for London
- 41 -
8.1.3 The modelling has demonstrated that Concept 2 performs considerably better thanConcept 1, regardless of which option it is paired with. A summary of performance ofeach Concept 2 scenario is given in Table 6-1 along with an indicative ranking inorder of preference.
Scenario Performance notes Order ofPreference
3Decrease in journey time on the majority of routes in allthree peaks resulting in a substantial reduction in averagejourney time per vehicle compared to the Do Nothing.
2
5 Average journey time per vehicle is increased comparedto Scenario 3 in all peaks. 4
7Reduces journey times on Routes 1 and 2 in particular,but the reduction is not as pronounced as in scenarios 3and 9.
3
9Produces the largest reduction in average journey timeper vehicle of all the scenarios, and all routes are eithersimilar or reduced from the Do Nothing scenario.
1
11Produces some substantial increases in journey timecompared to Do Nothing scenario in AM and PM peaks. 5
Table 8-2: Concept 2 Scenario Performance Summary
8.1.4


Fiveways Feasibility ModellingFinal Report - Base and Forecasting Modelling
Fiveways Feasibility Modelling - Final Report_ISSUED 31072014.docx Prepared by Parsons BrinckerhoffJuly 2014 for Transport for London
- 43 -
Appendix A – Model Audit
Ref Model Checks Comments Severity Changes made1 Modelling
Reports/Notesn/a N/A
2 SimulationParameters
(unchanged from received model)Appear to be TfL defaults
Green N/A
3 Vehicle Speeds (unchanged from received model)Acceptable
Green N/A
4 Network - OverallStructure
(unchanged from received model).There are two connectors for the same movement and samelanes from Stafford Rd to A23 Purley Way South
Some of the flare lengths are modelled a little generously, eglink 198 and Denning Ave
Denning Avenue doesn't match the CAD backgroundaccurately. For example the bus stop and stop line bothappear to be misplaced
Amber Two connectors are noted on Stafford Rd, but their existencedoes not compromise the modelling results.
The flare on Denning Avenue has been amended.
The locations of the stop line and bus stop on DenningAvenue have been checked and amended.
5 Network - Give-way Control
Right turning traffic into Denning Avenue from Stafford RoadSouth does not give way to all opposing movements. Priorityrule 76 should be amended.
Links 139, 10152, 10007 and 23 would benefit from a red/redconflict area in order to prevent vehicles squeezing pastqueued traffic in spaces that are not realistic. This is not anexhaustive list and there may be others within the model,particularly at Fiveways junction.
Red Priority rule 76 has been checked and amended to include allopposing movements.
Where this behaviour is evident the connectors have beenadjusted to reflect realistic behaviour.
6 Signal ControlData
The signal data appears to have been accurately coded Green N/A
7 Traffic Data Inc.VehicleCompositions
Flow calibration is presented for all turns within the studyarea and the model matches the observed data well
Green N/A
8 Public TransportInc. Infrastructure
Aside from the bus stop on Denning Avenue the PTinfrastructure appears correct. It is noted that there is anissue in the journey time data preventing full validation ofthese routes
Amber The location of the bus stop on Denning Avenue has beenchecked and amended.

Fiveways Feasibility ModellingFinal Report - Base and Forecasting Modelling
Fiveways Feasibility Modelling - Final Report_ISSUED 31072014.docx Prepared by Parsons BrinckerhoffJuly 2014 for Transport for London
- 44 -
9 Vehicle BehaviourInc. LaneUtilisation andMerges/Diverges
There are a few places within the model where theemergency stop settings are set to 5m. This occasionallyresults in vehicles changing lanes very late or causing delayat the junctions - does this match site observations?(connectors in question include 10154, 10194 & 10114)
Amber Reviewed and amended where required
10a Validation -Journey Time
The observed data is an average of traffic master data for07:00-08:00 and 08:00-09:00. Is this a fair comparison giventhat, for southbound traffic 08:00 seems an obvious peak and07:00 seems a bit of a shoulder? Also the journey timeaverage should be weighted by the flow for each of the twohours; an un-weighted average is likely to be biased to thelower journey times
Green The amount of traffic using Fiveways between 07:00-08:00and 08:00-09:00 is almost identical therefore a weightedaverage will be very similar to a straightforward one. Noamendments have been made.
10b Validation - SatFlows
The saturation flow data is from a Thursday PM, Saturdayand Sunday peak whereas the modelled data is AM, PM andSaturday peak. Comparing the two sets of data is not ideal.In addition the observed data contains a number of issues,with some very low or very high saturation flows.
Green There are instances where it has been difficult to collect goodsaturation flow data due to queuing, lack of demand orinsufficient green time. In most cases, the model alsostruggles to produce an accurate saturation flow reading atthe same location demonstrating the accuracy of themodelling. Where saturation flows have been recorded themodelled value it within 10% of the observed.

Fiveways Feasibility ModellingFinal Report - Base and Forecasting
Modelling
Fiveways Feasibility Modelling - Final Report_ISSUED 31072014.docx Prepared by Parsons BrinckerhoffJuly 2014 for Transport for London
- 45 -
Appendix B – Flow Calibration

Fiveways Feasibility ModellingFinal Report - Base and Forecasting
Modelling
Fiveways Feasibility Modelling - Final Report_ISSUED 05082014 Prepared by Parsons BrinckerhoffAugust 2014 for Transport for London
- 46 -
Table 8-3:Comparison of modelled and observed flows – AM peak
Junction From to Lights Heavies Lights Heavies Lights Heavies Lights HeaviesA23 Purley Way / Waddon Park Avenue Purley Way (North) Purley Way (South) 840 65 835 65 -5 0 0 0A23 Purley Way / Waddon Park Avenue Purley Way (North) Waddon Park Avenue 6 0 5 0 -1 0 0 0A23 Purley Way / Waddon Park Avenue Waddon Park Avenue Purley Way (North) 6 1 4 1 -2 0 1 0A23 Purley Way / Waddon Park Avenue Waddon Park Avenue Purley Way (South) 19 0 18 0 -1 0 0 0A23 Purley Way / Waddon Park Avenue Purley Way (South) Waddon Park Avenue 3 0 4 0 1 0 0 0A23 Purley Way / Waddon Park Avenue Purley Way (South) Purley Way (North) 1068 54 1024 40 -44 -14 1 2A232 Croydon Road / A23 Purley Way Purley Way (North) Croydon Road 184 5 180 4 -4 -1 0 0A232 Croydon Road / A23 Purley Way Purley Way (North) Purley Way (South) 645 59 659 61 14 2 1 0A232 Croydon Road / A23 Purley Way Purley Way (North) Access McDonalds 22 0 20 0 -2 0 0 0A232 Croydon Road / A23 Purley Way Access McDonalds Purley Way (North) 20 1 18 1 -2 0 1 0A232 Croydon Road / A23 Purley Way Access McDonalds Croydon Road 24 0 26 0 2 0 0 0A232 Croydon Road / A23 Purley Way Access McDonalds Purley Way (South) 28 0 26 0 -2 0 0 0A232 Croydon Road / A23 Purley Way Purley Way (South) Access McDonalds 34 1 29 1 -5 0 1 0A232 Croydon Road / A23 Purley Way Purley Way (South) Purley Way (North) 717 48 662 37 -55 -11 2 2A232 Croydon Road / A23 Purley Way Purley Way (South) Croydon Road 502 15 466 9 -36 -6 2 2A232 Croydon Road / A23 Purley Way Croydon Road Purley Way (South) 578 18 568 19 -10 1 0 0A232 Croydon Road / A23 Purley Way Croydon Road Access McDonalds 16 0 17 0 0 0 0 0A232 Croydon Road / A23 Purley Way Croydon Road Purley Way (North) 340 3 348 2 9 -1 0 0A23 Purley Way / Epsom Road Purley Way (North) Purley Way (South) 1256 80 1254 80 -3 0 0 0A23 Purley Way / Epsom Road Epsom Road Purley Way (North) 409 16 371 11 -38 -5 2 1A23 Purley Way / Epsom Road Epsom Road Purley Way (South) 22 0 21 0 -1 0 0 0A23 Purley Way / Epsom Road Purley Way (South) Purley Way (North) 846 49 790 36 -56 -13 2 2A23 Purley Way / Retail Access Purley Way (North) World of Leather 30 4 29 3 -1 -1 0 1A23 Purley Way / Retail Access Purley Way (North) Purley Way (South) 1235 75 1247 76 12 1 0 0A23 Purley Way / Retail Access Purley Way (South) Purley Way (North) 824 45 809 34 -14 -11 1 2A23 Purley Way / Retail Access Purley Way (South) World of Leather 31 5 37 1 6 -4 1 2A23 Purley Way / Retail Access World of Leather Purley Way (South) 16 4 17 4 1 0 0 0A23 Purley Way / Retail Access World of Leather Purley Way (North) 7 2 6 2 -1 0 0 0Fiveways Purley Way (North) Stafford Road (SW) 138 5 136 5 -2 0 0 0Fiveways Purley Way (North) Purley Way (South) 543 60 549 57 6 -3 0 0Fiveways Purley Way (North) Denning Avenue 145 0 151 0 6 0 0 0Fiveways Purley Way (North) Stafford Road (NE) 433 16 429 18 -5 2 0 0Fiveways Stafford Road (NE) Purley Way (North) 0 0 0 0 0 0 0 0Fiveways Stafford Road (NE) Stafford Road (SW) 449 9 430 6 -19 -3 1 1Fiveways Stafford Road (NE) Purley Way South 212 7 195 3 -17 -4 1 2Fiveways Stafford Road (NE) Denning Avenue 21 1 20 1 -1 0 0 0Fiveways Denning Avenue Stafford Road (NE) 51 0 50 0 -1 0 0 0Fiveways Denning Avenue Purley Way (North) 145 0 152 0 7 0 1 0Fiveways Denning Avenue Stafford Road (SW) 226 3 223 3 -3 0 0 0Fiveways Denning Avenue Purley Way (South) 23 1 22 1 -1 0 0 0Fiveways Purley Way (South) Denning Avenue 12 0 9 0 -3 0 1 0Fiveways Purley Way (South) Stafford Road (NE) 307 15 292 14 -15 -1 1 0Fiveways Purley Way (South) Purley Way (North) 626 48 615 31 -11 -17 0 3Fiveways Purley Way (South) Stafford Road (SW) 27 5 24 5 -3 0 1 0Fiveways Stafford Road (SW) Purley Way (South) 6 1 7 1 1 0 1 0Fiveways Stafford Road (SW) Denning Avenue 86 0 87 0 1 0 0 0Fiveways Stafford Road (SW) Stafford Road (NE) 601 4 532 2 -69 -2 3 1Fiveways Stafford Road (SW) Purley Way (North) 85 4 83 5 -2 1 0 0Epsom Road/ A232 Stafford Road Stafford Road (North) Epsom Road 409 16 382 11 -27 -5 1 1Epsom Road/ A232 Stafford Road Stafford Road (North) Stafford Road (South) 670 18 640 10 -30 -8 1 2Epsom Road/ A232 Stafford Road Stafford Road (South) Stafford Road (North) 1407 32 1293 34 -114 2 3 0Epsom Road/ A232 Stafford Road Stafford Road (South) Epsom Road 13 0 15 0 1 0 0 0Epsom Road / A232 Duppas Hill Road Epsom Road Duppas Hill Road (S) 56 0 55 0 -2 0 0 0Epsom Road / A232 Duppas Hill Road Epsom Road Duppas Hill Road (N) 16 0 17 0 1 0 0 0Epsom Road / A232 Duppas Hill Road Duppas Hill Road (N) Duppas Hill Road (S) 1026 34 965 21 -61 -13 2 3Epsom Road / A232 Duppas Hill Road Duppas Hill Road (S) Duppas Hill Road (N) 1248 30 1151 32 -97 2 3 0Epsom Road / A232 Duppas Hill Road Duppas Hill Road (S) Epsom Road 155 2 143 2 -13 0 1 0A232 Duppas Hill Road / Duppas Road Duppas Road Duppas Hill Road (West) 2 1 3 1 1 0 1 0A232 Duppas Hill Road / Duppas Road Duppas Road Duppas Hill Road (East) 29 1 28 1 -1 0 0 0A232 Duppas Hill Road / Duppas Road Duppas Hill Road (East) Duppas Road 86 0 95 0 9 0 1 0A232 Duppas Hill Road / Duppas Road Duppas Hill Road (East) Duppas Hill Road (West) 972 30 961 19 -12 -11 0 2A232 Duppas Hill Road / Duppas Road Duppas Hill Road (West)Duppas Hill Road (East) 1278 41 1165 32 -113 -9 3 1A232 Duppas Hill Road / Duppas Road Duppas Hill Road (West)Duppas Road 3 0 3 0 0 0 0 0A232 Duppas Hill Road / Warrington Road Warrington Road Duppas Hill Road (East) 97 1 96 1 -1 0 0 0A232 Duppas Hill Road / Warrington Road Duppas Hill Road (East) Duppas Hill Road (West) 1057 31 1056 19 -1 -12 0 2A232 Duppas Hill Road / Warrington Road Duppas Hill Road (West)Duppas Hill Road (East) 1307 40 1193 33 -114 -7 3 1
Modelled (veh)Observed (veh) Difference (veh) GEH
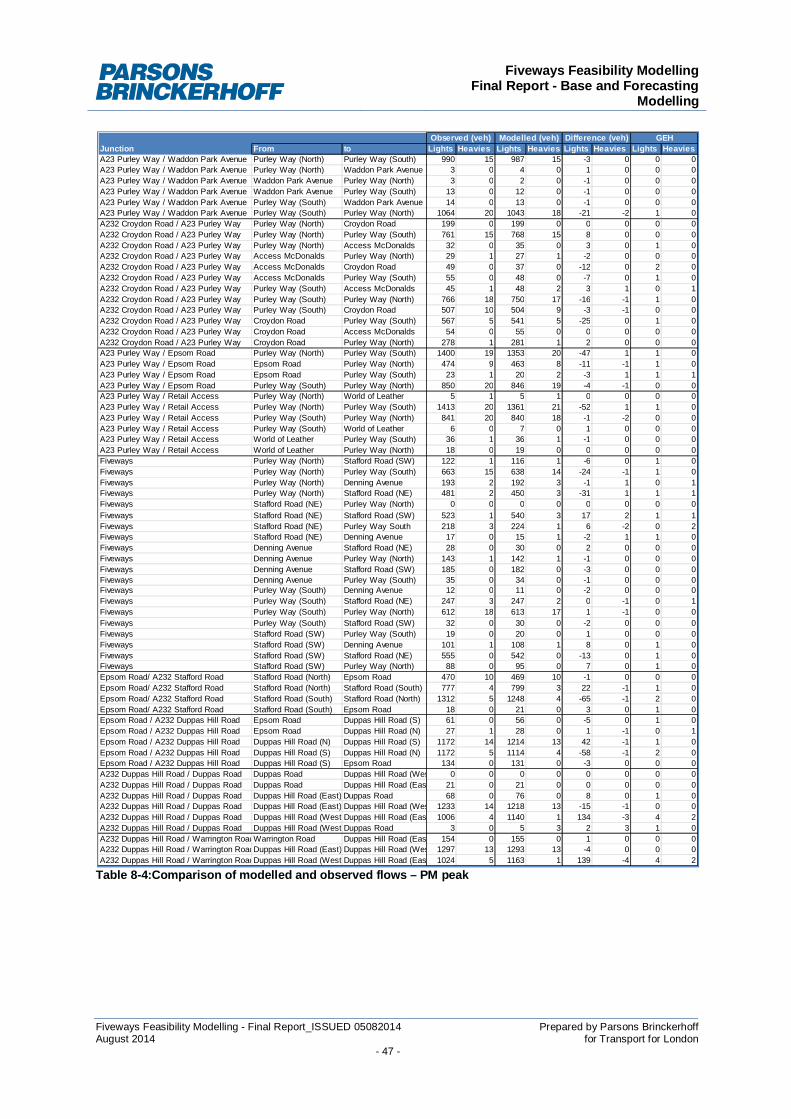
Fiveways Feasibility ModellingFinal Report - Base and Forecasting
Modelling
Fiveways Feasibility Modelling - Final Report_ISSUED 05082014 Prepared by Parsons BrinckerhoffAugust 2014 for Transport for London
- 47 -
Table 8-4:Comparison of modelled and observed flows – PM peak
Junction From to Lights Heavies Lights Heavies Lights Heavies Lights HeaviesA23 Purley Way / Waddon Park Avenue Purley Way (North) Purley Way (South) 990 15 987 15 -3 0 0 0A23 Purley Way / Waddon Park Avenue Purley Way (North) Waddon Park Avenue 3 0 4 0 1 0 0 0A23 Purley Way / Waddon Park Avenue Waddon Park Avenue Purley Way (North) 3 0 2 0 -1 0 0 0A23 Purley Way / Waddon Park Avenue Waddon Park Avenue Purley Way (South) 13 0 12 0 -1 0 0 0A23 Purley Way / Waddon Park Avenue Purley Way (South) Waddon Park Avenue 14 0 13 0 -1 0 0 0A23 Purley Way / Waddon Park Avenue Purley Way (South) Purley Way (North) 1064 20 1043 18 -21 -2 1 0A232 Croydon Road / A23 Purley Way Purley Way (North) Croydon Road 199 0 199 0 0 0 0 0A232 Croydon Road / A23 Purley Way Purley Way (North) Purley Way (South) 761 15 768 15 8 0 0 0A232 Croydon Road / A23 Purley Way Purley Way (North) Access McDonalds 32 0 35 0 3 0 1 0A232 Croydon Road / A23 Purley Way Access McDonalds Purley Way (North) 29 1 27 1 -2 0 0 0A232 Croydon Road / A23 Purley Way Access McDonalds Croydon Road 49 0 37 0 -12 0 2 0A232 Croydon Road / A23 Purley Way Access McDonalds Purley Way (South) 55 0 48 0 -7 0 1 0A232 Croydon Road / A23 Purley Way Purley Way (South) Access McDonalds 45 1 48 2 3 1 0 1A232 Croydon Road / A23 Purley Way Purley Way (South) Purley Way (North) 766 18 750 17 -16 -1 1 0A232 Croydon Road / A23 Purley Way Purley Way (South) Croydon Road 507 10 504 9 -3 -1 0 0A232 Croydon Road / A23 Purley Way Croydon Road Purley Way (South) 567 5 541 5 -25 0 1 0A232 Croydon Road / A23 Purley Way Croydon Road Access McDonalds 54 0 55 0 0 0 0 0A232 Croydon Road / A23 Purley Way Croydon Road Purley Way (North) 278 1 281 1 2 0 0 0A23 Purley Way / Epsom Road Purley Way (North) Purley Way (South) 1400 19 1353 20 -47 1 1 0A23 Purley Way / Epsom Road Epsom Road Purley Way (North) 474 9 463 8 -11 -1 1 0A23 Purley Way / Epsom Road Epsom Road Purley Way (South) 23 1 20 2 -3 1 1 1A23 Purley Way / Epsom Road Purley Way (South) Purley Way (North) 850 20 846 19 -4 -1 0 0A23 Purley Way / Retail Access Purley Way (North) World of Leather 5 1 5 1 0 0 0 0A23 Purley Way / Retail Access Purley Way (North) Purley Way (South) 1413 20 1361 21 -52 1 1 0A23 Purley Way / Retail Access Purley Way (South) Purley Way (North) 841 20 840 18 -1 -2 0 0A23 Purley Way / Retail Access Purley Way (South) World of Leather 6 0 7 0 1 0 0 0A23 Purley Way / Retail Access World of Leather Purley Way (South) 36 1 36 1 -1 0 0 0A23 Purley Way / Retail Access World of Leather Purley Way (North) 18 0 19 0 0 0 0 0Fiveways Purley Way (North) Stafford Road (SW) 122 1 116 1 -6 0 1 0Fiveways Purley Way (North) Purley Way (South) 663 15 638 14 -24 -1 1 0Fiveways Purley Way (North) Denning Avenue 193 2 192 3 -1 1 0 1Fiveways Purley Way (North) Stafford Road (NE) 481 2 450 3 -31 1 1 1Fiveways Stafford Road (NE) Purley Way (North) 0 0 0 0 0 0 0 0Fiveways Stafford Road (NE) Stafford Road (SW) 523 1 540 3 17 2 1 1Fiveways Stafford Road (NE) Purley Way South 218 3 224 1 6 -2 0 2Fiveways Stafford Road (NE) Denning Avenue 17 0 15 1 -2 1 1 0Fiveways Denning Avenue Stafford Road (NE) 28 0 30 0 2 0 0 0Fiveways Denning Avenue Purley Way (North) 143 1 142 1 -1 0 0 0Fiveways Denning Avenue Stafford Road (SW) 185 0 182 0 -3 0 0 0Fiveways Denning Avenue Purley Way (South) 35 0 34 0 -1 0 0 0Fiveways Purley Way (South) Denning Avenue 12 0 11 0 -2 0 0 0Fiveways Purley Way (South) Stafford Road (NE) 247 3 247 2 0 -1 0 1Fiveways Purley Way (South) Purley Way (North) 612 18 613 17 1 -1 0 0Fiveways Purley Way (South) Stafford Road (SW) 32 0 30 0 -2 0 0 0Fiveways Stafford Road (SW) Purley Way (South) 19 0 20 0 1 0 0 0Fiveways Stafford Road (SW) Denning Avenue 101 1 108 1 8 0 1 0Fiveways Stafford Road (SW) Stafford Road (NE) 555 0 542 0 -13 0 1 0Fiveways Stafford Road (SW) Purley Way (North) 88 0 95 0 7 0 1 0Epsom Road/ A232 Stafford Road Stafford Road (North) Epsom Road 470 10 469 10 -1 0 0 0Epsom Road/ A232 Stafford Road Stafford Road (North) Stafford Road (South) 777 4 799 3 22 -1 1 0Epsom Road/ A232 Stafford Road Stafford Road (South) Stafford Road (North) 1312 5 1248 4 -65 -1 2 0Epsom Road/ A232 Stafford Road Stafford Road (South) Epsom Road 18 0 21 0 3 0 1 0Epsom Road / A232 Duppas Hill Road Epsom Road Duppas Hill Road (S) 61 0 56 0 -5 0 1 0Epsom Road / A232 Duppas Hill Road Epsom Road Duppas Hill Road (N) 27 1 28 0 1 -1 0 1Epsom Road / A232 Duppas Hill Road Duppas Hill Road (N) Duppas Hill Road (S) 1172 14 1214 13 42 -1 1 0Epsom Road / A232 Duppas Hill Road Duppas Hill Road (S) Duppas Hill Road (N) 1172 5 1114 4 -58 -1 2 0Epsom Road / A232 Duppas Hill Road Duppas Hill Road (S) Epsom Road 134 0 131 0 -3 0 0 0A232 Duppas Hill Road / Duppas Road Duppas Road Duppas Hill Road (West) 0 0 0 0 0 0 0 0A232 Duppas Hill Road / Duppas Road Duppas Road Duppas Hill Road (East) 21 0 21 0 0 0 0 0A232 Duppas Hill Road / Duppas Road Duppas Hill Road (East) Duppas Road 68 0 76 0 8 0 1 0A232 Duppas Hill Road / Duppas Road Duppas Hill Road (East) Duppas Hill Road (West) 1233 14 1218 13 -15 -1 0 0A232 Duppas Hill Road / Duppas Road Duppas Hill Road (West)Duppas Hill Road (East) 1006 4 1140 1 134 -3 4 2A232 Duppas Hill Road / Duppas Road Duppas Hill Road (West)Duppas Road 3 0 5 3 2 3 1 0A232 Duppas Hill Road / Warrington RoadWarrington Road Duppas Hill Road (East) 154 0 155 0 1 0 0 0A232 Duppas Hill Road / Warrington RoadDuppas Hill Road (East) Duppas Hill Road (West) 1297 13 1293 13 -4 0 0 0A232 Duppas Hill Road / Warrington RoadDuppas Hill Road (West)Duppas Hill Road (East) 1024 5 1163 1 139 -4 4 2
Modelled (veh)Observed (veh) Difference (veh) GEH

Fiveways Feasibility ModellingFinal Report - Base and Forecasting
Modelling
Fiveways Feasibility Modelling - Final Report_ISSUED 05082014 Prepared by Parsons BrinckerhoffAugust 2014 for Transport for London
- 48 -
Table 8-5:Comparison of modelled and observed flows – Saturday peak
Junction From to Lights Heavies Lights Heavies Lights Heavies Lights HeaviesA23 Purley Way / Waddon Park Avenue Purley Way (North) Purley Way (South) 1082 9 1074 8 -9 -1 0 0A23 Purley Way / Waddon Park Avenue Purley Way (North) Waddon Park Avenue 10 0 9 1 -1 1 0 0A23 Purley Way / Waddon Park Avenue Waddon Park Avenue Purley Way (North) 3 0 0 0 -3 0 2 0A23 Purley Way / Waddon Park Avenue Waddon Park Avenue Purley Way (South) 2 0 0 0 -2 0 2 0A23 Purley Way / Waddon Park Avenue Purley Way (South) Waddon Park Avenue 9 0 10 1 1 1 0 0A23 Purley Way / Waddon Park Avenue Purley Way (South) Purley Way (North) 1393 11 1332 9 -62 -2 2 1A232 Croydon Road / A23 Purley Way Purley Way (North) Croydon Road 60 0 59 3 -1 3 0 0A232 Croydon Road / A23 Purley Way Purley Way (North) Purley Way (South) 833 8 831 5 -2 -3 0 1A232 Croydon Road / A23 Purley Way Purley Way (North) Access McDonalds 188 1 186 0 -2 -1 0 1A232 Croydon Road / A23 Purley Way Access McDonalds Purley Way (North) 43 0 34 1 -9 1 1 0A232 Croydon Road / A23 Purley Way Access McDonalds Croydon Road 52 0 43 0 -9 0 1 0A232 Croydon Road / A23 Purley Way Access McDonalds Purley Way (South) 64 0 57 2 -7 2 1 0A232 Croydon Road / A23 Purley Way Purley Way (South) Access McDonalds 57 0 58 3 1 3 0 0A232 Croydon Road / A23 Purley Way Purley Way (South) Purley Way (North) 1028 9 979 8 -48 -1 2 0A232 Croydon Road / A23 Purley Way Purley Way (South) Croydon Road 460 1 459 0 -1 -1 0 1A232 Croydon Road / A23 Purley Way Croydon Road Purley Way (South) 406 2 394 3 -12 1 1 1A232 Croydon Road / A23 Purley Way Croydon Road Access McDonalds 51 0 52 0 1 0 0 0A232 Croydon Road / A23 Purley Way Croydon Road Purley Way (North) 334 2 330 0 -4 -2 0 2A23 Purley Way / Epsom Road Purley Way (North) Purley Way (South) 1290 10 1280 10 -10 0 0 0A23 Purley Way / Epsom Road Epsom Road Purley Way (North) 546 4 537 2 -10 -2 0 1A23 Purley Way / Epsom Road Epsom Road Purley Way (South) 42 0 46 5 4 5 1 0A23 Purley Way / Epsom Road Purley Way (South) Purley Way (North) 1006 6 961 8 -44 2 1 1A23 Purley Way / Retail Access Purley Way (North) World of Leather 80 0 79 2 -2 2 0 0A23 Purley Way / Retail Access Purley Way (North) Purley Way (South) 1237 9 1242 13 5 4 0 1A23 Purley Way / Retail Access Purley Way (South) Purley Way (North) 926 6 895 7 -31 1 1 1A23 Purley Way / Retail Access Purley Way (South) World of Leather 121 0 114 0 -7 0 1 0A23 Purley Way / Retail Access World of Leather Purley Way (South) 137 0 141 0 4 0 0 0A23 Purley Way / Retail Access World of Leather Purley Way (North) 73 0 72 0 -1 0 0 0Fiveways Purley Way (North) Stafford Road (SW) 107 1 114 0 7 -1 1 1Fiveways Purley Way (North) Purley Way (South) 711 6 704 5 -7 -1 0 1Fiveways Purley Way (North) Denning Avenue 167 0 174 0 6 0 0 0Fiveways Purley Way (North) Stafford Road (NE) 398 3 392 8 -7 5 0 2Fiveways Stafford Road (NE) Purley Way (North) 1 0 0 0 -1 0 1 0Fiveways Stafford Road (NE) Stafford Road (SW) 375 4 388 4 12 0 1 0Fiveways Stafford Road (NE) Purley Way South 294 6 299 10 4 4 0 2Fiveways Stafford Road (NE) Denning Avenue 25 0 23 0 -2 0 0 0Fiveways Denning Avenue Stafford Road (NE) 15 0 15 0 0 0 0 0Fiveways Denning Avenue Purley Way (North) 148 0 150 0 1 0 0 0Fiveways Denning Avenue Stafford Road (SW) 148 0 146 0 -2 0 0 0Fiveways Denning Avenue Purley Way (South) 53 0 55 0 2 0 0 0Fiveways Purley Way (South) Denning Avenue 19 0 15 0 -4 0 1 0Fiveways Purley Way (South) Stafford Road (NE) 291 0 278 0 -14 0 1 0Fiveways Purley Way (South) Purley Way (North) 745 6 711 6 -34 0 1 0Fiveways Purley Way (South) Stafford Road (SW) 43 0 37 0 -6 0 1 0Fiveways Stafford Road (SW) Purley Way (South) 27 1 29 2 2 1 0 1Fiveways Stafford Road (SW) Denning Avenue 76 0 83 0 7 0 1 0Fiveways Stafford Road (SW) Stafford Road (NE) 362 2 353 0 -10 -2 1 2Fiveways Stafford Road (SW) Purley Way (North) 151 0 149 1 -2 1 0 0Epsom Road/ A232 Stafford Road Stafford Road (North) Epsom Road 572 4 570 2 -2 -2 0 1Epsom Road/ A232 Stafford Road Stafford Road (North) Stafford Road (South) 717 9 723 15 6 6 0 2Epsom Road/ A232 Stafford Road Stafford Road (South) Stafford Road (North) 1052 4 1021 3 -31 -1 1 0Epsom Road/ A232 Stafford Road Stafford Road (South) Epsom Road 17 0 20 5 3 5 1 0Epsom Road / A232 Duppas Hill Road Epsom Road Duppas Hill Road (S) 68 0 64 1 -4 1 1 0Epsom Road / A232 Duppas Hill Road Epsom Road Duppas Hill Road (N) 28 1 31 0 3 -1 1 1Epsom Road / A232 Duppas Hill Road Duppas Hill Road (N) Duppas Hill Road (S) 1230 13 1227 16 -3 3 0 1Epsom Road / A232 Duppas Hill Road Duppas Hill Road (S) Duppas Hill Road (N) 915 4 883 3 -32 -1 1 1Epsom Road / A232 Duppas Hill Road Duppas Hill Road (S) Epsom Road 140 0 137 0 -3 0 0 0A232 Duppas Hill Road / Duppas Road Duppas Road Duppas Hill Road (West) 2 0 2 0 0 0 0 0A232 Duppas Hill Road / Duppas Road Duppas Road Duppas Hill Road (East) 24 0 24 0 0 0 0 0A232 Duppas Hill Road / Duppas Road Duppas Hill Road (East) Duppas Road 66 2 75 0 9 -2 1 2A232 Duppas Hill Road / Duppas Road Duppas Hill Road (East) Duppas Hill Road (West) 1228 13 1222 16 -6 3 0 1A232 Duppas Hill Road / Duppas Road Duppas Hill Road (West)Duppas Hill Road (East) 938 5 904 1 -34 -4 1 3A232 Duppas Hill Road / Duppas Road Duppas Hill Road (West)Duppas Road 2 0 3 2 1 2 1 0A232 Duppas Hill Road / Warrington Road Warrington Road Duppas Hill Road (East) 139 0 139 0 0 0 0 0A232 Duppas Hill Road / Warrington Road Duppas Hill Road (East) Duppas Hill Road (West) 1298 16 1296 16 -2 0 0 0A232 Duppas Hill Road / Warrington Road Duppas Hill Road (West)Duppas Hill Road (East) 961 5 929 1 -32 -4 1 3
Modelled (veh)Observed (veh) Difference (veh) GEH

Fiveways Feasibility ModellingFinal Report - Base and Forecasting
Modelling
Fiveways Feasibility Modelling - Final Report_ISSUED 31072014.docx Prepared by Parsons BrinckerhoffJuly 2014 for Transport for London
- 49 -
Appendix C – Concept Designs


Fiveways Feasibility ModellingFinal Report - Base and Forecasting
Modelling
Fiveways Feasibility Modelling - Final Report_ISSUED 31072014.docx Prepared by Parsons BrinckerhoffJuly 2014 for Transport for London
- 52 -
Appendix D – Fiveways Option Designs

STAFF


Fiveways Feasibility ModellingFinal Report - Base and Forecasting
Modelling
Fiveways Feasibility Modelling - Final Report_ISSUED 31072014.docx Prepared by Parsons BrinckerhoffJuly 2014 for Transport for London
- 55 -
Appendix E – J20/016 Indicative LINSIG staging for Concept 1
Fiveways Feasibility ModellingFinal Report - Base and Forecasting
Modelling
Fiveways Feasibility Modelling - Final Report_ISSUED 31072014.docx Prepared by Parsons BrinckerhoffJuly 2014 for Transport for London
- 57 -
Appendix F – Concept 1 VISSIM Layout
Flyover Section
J20/016
Fiveways Feasibility ModellingFinal Report - Base and Forecasting
Modelling
Fiveways Feasibility Modelling - Final Report_ISSUED 31072014.docx Prepared by Parsons BrinckerhoffJuly 2014 for Transport for London
- 58 -
Appendix G – Concept 2 VISSIM Layout
Epsom Road two way section
J20/011
Fiveways Feasibility ModellingFinal Report - Base and Forecasting
Modelling
Fiveways Feasibility Modelling - Final Report_ISSUED 31072014.docx Prepared by Parsons BrinckerhoffJuly 2014 for Transport for London
- 59 -
Appendix H – Fiveways options VISSIM Layout
Option 1
Option 2

Fiveways Feasibility ModellingFinal Report - Base and Forecasting
Modelling
Fiveways Feasibility Modelling - Final Report_ISSUED 31072014.docx Prepared by Parsons BrinckerhoffJuly 2014 for Transport for London
- 60 -
Option 4

Fiveways Feasibility ModellingFinal Report - Base and Forecasting
Modelling
Fiveways Feasibility Modelling - Final Report_ISSUED 05082014 Prepared by Parsons BrinckerhoffAugust 2014 for Transport for London
- 61 -
Appendix I – General Traffic Journey Time summary
S1Change in Journey Time (in seconds) from Scenario 1 (Do Nothing) – AM Peak
S2a S2b S2c S4 S4a S6 S6a S8 S8a S10 S10a S3 S5 S7 S9 S11
Rt 1 WB 260 551 23 17 45 26 -64 -59 16 22 319 312 -47 -41 -47 -41 99
Rt 1 EB 253 -121 -91 -93 -92 -92 -104 -106 -93 -99 -112 -110 -52 -78 -74 -78 -50
Rt 2 SB 213 68 17 20 54 37 45 41 35 39 17 7 33 -17 0 -24 -42
Rt 2 NB 224 68 61 -22 -11 -20 -15 -20 -48 -51 82 72 -47 -19 -40 -51 38
Rt 3 SB 218 -5 -24 -27 -23 -26 -26 -29 -28 -28 -22 -23 -16 -7 -2 -8 22
Rt 3 NB 197 7 -10 -2 17 16 60 57 52 48 1 -3 -5 16 30 15 1
S1Change in Journey Time (in seconds) from Scenario 1 (Do Nothing) – PM Peak
S2a S2b S2c S4 S4a S6 S6a S8 S8a S10 S10a S3 S5 S7 S9 S11
Rt 1 WB 243 858 -7 -10 -7 -5 18 29 -4 -20 144 125 -41 -6 -5 -6 22
Rt 1 EB 316 -164 -154 -159 -153 -154 -154 -156 -154 -153 -153 -154 -154 -88 -90 -115 -134
Rt 2 SB 232 21 -3 17 1 13 34 41 36 26 -22 -25 -40 -18 -48 -33 -66
Rt 2 NB 197 19 88 57 55 21 18 13 31 29 75 78 -22 -23 -24 -17 28
Rt 3 SB 211 3 -17 -11 -9 -8 24 42 13 7 23 32 -2 5 14 11 73
Rt 3 NB 193 -7 -5 -7 -1 0 63 63 112 111 -7 -11 5 10 13 22 9
S1Change in Journey Time (in seconds) from Scenario 1 (Do Nothing) – Saturday Peak
S2a S2b S2c S4 S4a S6 S6a S8 S8a S10 S10a S3 S5 S7 S9 S11
Rt 1 WB 238 646 15 58 -1 -8 -36 -34 -5 2 247 212 -36 7 -37 -32 8
Rt 1 EB 386 -255 -220 -222 -199 -214 -200 -202 -217 -214 -231 -225 -224 -123 -221 -216 -223
Rt 2 SB 296 -18 -51 -48 -27 -25 -34 -39 -9 -11 -48 -52 -104 22 -127 -68 -117
Rt 2 NB 295 177 302 247 167 15 68 6 116 -0 128 47 -120 -101 -87 -124 -22
Rt 3 SB 238 -25 -39 -9 -39 -36 30 26 17 9 28 25 -28 17 -32 -24 -54
Rt 3 NB 211 46 94 73 42 -6 56 42 92 63 38 12 -14 -10 26 -16 31
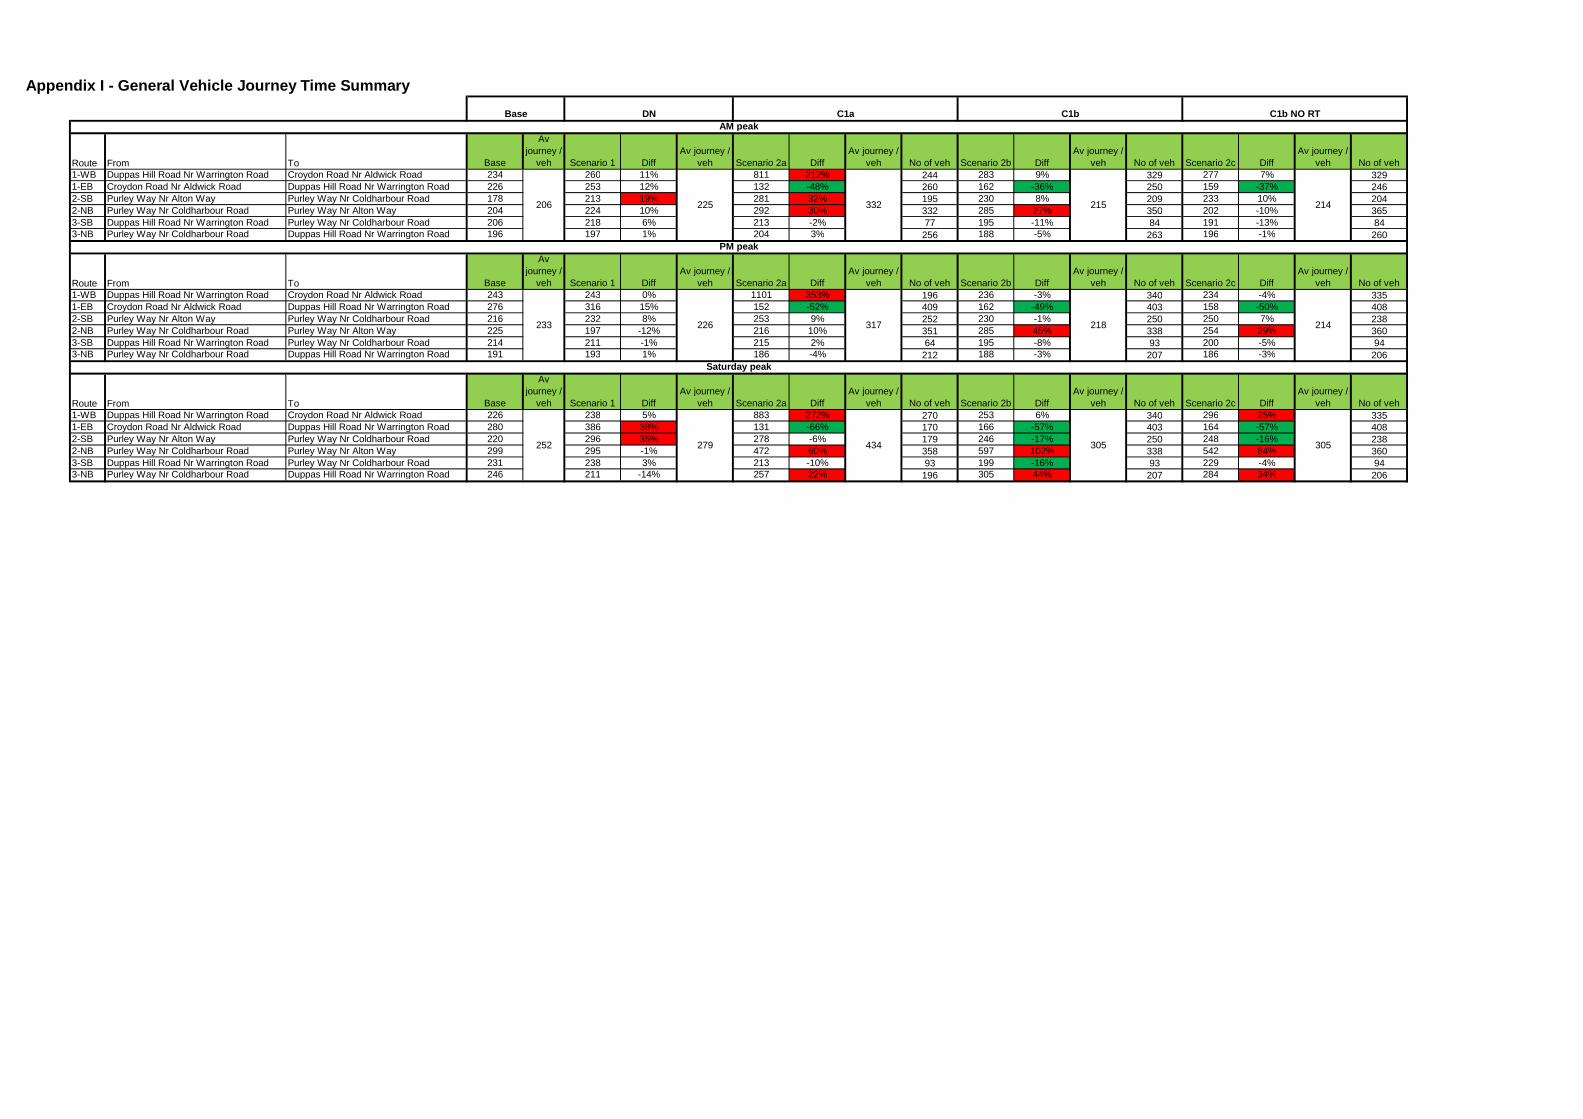
Appendix I - General Vehicle Journey Time Summary
Route From To Base
Avjourney /
veh Scenario 1 DiffAv journey /
veh Scenario 2a DiffAv journey /
veh No of veh Scenario 2b DiffAv journey /
veh No of veh Scenario 2c DiffAv journey /
veh No of veh101 1-WB Duppas Hill Road Nr Warrington Road Croydon Road Nr Aldwick Road 234 260 11% 811 212% 244 283 9% 329 277 7% 329102 1-EB Croydon Road Nr Aldwick Road Duppas Hill Road Nr Warrington Road 226 253 12% 132 -48% 260 162 -36% 250 159 -37% 246103 2-SB Purley Way Nr Alton Way Purley Way Nr Coldharbour Road 178 213 19% 281 32% 195 230 8% 209 233 10% 204104 2-NB Purley Way Nr Coldharbour Road Purley Way Nr Alton Way 204 224 10% 292 30% 332 285 27% 350 202 -10% 365105 3-SB Duppas Hill Road Nr Warrington Road Purley Way Nr Coldharbour Road 206 218 6% 213 -2% 77 195 -11% 84 191 -13% 84106 3-NB Purley Way Nr Coldharbour Road Duppas Hill Road Nr Warrington Road 196 197 1% 204 3% 256 188 -5% 263 196 -1% 260
Route From To Base
Avjourney /
veh Scenario 1 DiffAv journey /
veh Scenario 2a DiffAv journey /
veh No of veh Scenario 2b DiffAv journey /
veh No of veh Scenario 2c DiffAv journey /
veh No of veh101 1-WB Duppas Hill Road Nr Warrington Road Croydon Road Nr Aldwick Road 243 243 0% 1101 353% 196 236 -3% 340 234 -4% 335102 1-EB Croydon Road Nr Aldwick Road Duppas Hill Road Nr Warrington Road 276 316 15% 152 -52% 409 162 -49% 403 158 -50% 408103 2-SB Purley Way Nr Alton Way Purley Way Nr Coldharbour Road 216 232 8% 253 9% 252 230 -1% 250 250 7% 238104 2-NB Purley Way Nr Coldharbour Road Purley Way Nr Alton Way 225 197 -12% 216 10% 351 285 45% 338 254 29% 360105 3-SB Duppas Hill Road Nr Warrington Road Purley Way Nr Coldharbour Road 214 211 -1% 215 2% 64 195 -8% 93 200 -5% 94106 3-NB Purley Way Nr Coldharbour Road Duppas Hill Road Nr Warrington Road 191 193 1% 186 -4% 212 188 -3% 207 186 -3% 206
Route From To Base
Avjourney /
veh Scenario 1 DiffAv journey /
veh Scenario 2a DiffAv journey /
veh No of veh Scenario 2b DiffAv journey /
veh No of veh Scenario 2c DiffAv journey /
veh No of veh101 1-WB Duppas Hill Road Nr Warrington Road Croydon Road Nr Aldwick Road 226 238 5% 883 272% 270 253 6% 340 296 25% 335102 1-EB Croydon Road Nr Aldwick Road Duppas Hill Road Nr Warrington Road 280 386 38% 131 -66% 170 166 -57% 403 164 -57% 408103 2-SB Purley Way Nr Alton Way Purley Way Nr Coldharbour Road 220 296 35% 278 -6% 179 246 -17% 250 248 -16% 238104 2-NB Purley Way Nr Coldharbour Road Purley Way Nr Alton Way 299 295 -1% 472 60% 358 597 102% 338 542 84% 360105 3-SB Duppas Hill Road Nr Warrington Road Purley Way Nr Coldharbour Road 231 238 3% 213 -10% 93 199 -16% 93 229 -4% 94106 3-NB Purley Way Nr Coldharbour Road Duppas Hill Road Nr Warrington Road 246 211 -14% 257 22% 196 305 44% 207 284 34% 206
AM peak
PM peak
Saturday peak
252 434279
332
DN
206
233
305
226
215
218
305
Base C1a C1b
317
225 214
214
C1b NO RT

Route From To Scenario 4 DiffAv journey /
veh No of veh Scenario 4a DiffAv journey /
veh No of veh Scenario 6 DiffAv journey /
veh No of veh Scenario 6a DiffAv journey /
veh No of veh1-WB Duppas Hill Road Nr Warrington Road Croydon Road Nr Aldwick Road 305 17% 327 286 10% 332 195 -25% 349 200 -23% 3481-EB Croydon Road Nr Aldwick Road Duppas Hill Road Nr Warrington Road 161 -36% 245 161 -36% 241 148 -41% 252 147 -42% 2542-SB Purley Way Nr Alton Way Purley Way Nr Coldharbour Road 267 26% 204 249 17% 202 258 21% 205 253 19% 2122-NB Purley Way Nr Coldharbour Road Purley Way Nr Alton Way 213 -5% 350 204 -9% 364 209 -7% 349 204 -9% 3643-SB Duppas Hill Road Nr Warrington Road Purley Way Nr Coldharbour Road 195 -11% 85 192 -12% 86 192 -12% 88 189 -13% 883-NB Purley Way Nr Coldharbour Road Duppas Hill Road Nr Warrington Road 215 9% 258 214 8% 260 257 30% 249 254 29% 248
Route From To Scenario 4 DiffAv journey /
veh No of veh Scenario 4a DiffAv journey /
veh No of veh Scenario 6 DiffAv journey /
veh No of veh Scenario 6a DiffAv journey /
veh No of veh1-WB Duppas Hill Road Nr Warrington Road Croydon Road Nr Aldwick Road 236 -3% 334 238 -2% 334 261 7% 325 272 12% 3311-EB Croydon Road Nr Aldwick Road Duppas Hill Road Nr Warrington Road 164 -48% 397 162 -49% 399 162 -49% 399 160 -49% 4042-SB Purley Way Nr Alton Way Purley Way Nr Coldharbour Road 234 1% 237 245 6% 238 266 14% 238 273 18% 2382-NB Purley Way Nr Coldharbour Road Purley Way Nr Alton Way 252 28% 346 218 11% 374 215 9% 370 210 6% 3803-SB Duppas Hill Road Nr Warrington Road Purley Way Nr Coldharbour Road 203 -4% 95 204 -4% 96 235 11% 93 254 20% 953-NB Purley Way Nr Coldharbour Road Duppas Hill Road Nr Warrington Road 192 0% 211 193 0% 213 256 33% 210 256 33% 209
Route From To Scenario 4 DiffAv journey /
veh No of veh Scenario 4a DiffAv journey /
veh No of veh Scenario 6 DiffAv journey /
veh No of veh Scenario 6a DiffAv journey /
veh No of veh1-WB Duppas Hill Road Nr Warrington Road Croydon Road Nr Aldwick Road 236 0% 472 230 -3% 474 201 -15% 472 204 -14% 4771-EB Croydon Road Nr Aldwick Road Duppas Hill Road Nr Warrington Road 187 -52% 159 172 -55% 162 186 -52% 150 184 -52% 1552-SB Purley Way Nr Alton Way Purley Way Nr Coldharbour Road 269 -9% 213 271 -8% 203 262 -12% 232 257 -13% 2332-NB Purley Way Nr Coldharbour Road Purley Way Nr Alton Way 462 57% 369 310 5% 419 363 23% 392 301 2% 4233-SB Duppas Hill Road Nr Warrington Road Purley Way Nr Coldharbour Road 199 -16% 153 202 -15% 147 268 13% 140 264 11% 1393-NB Purley Way Nr Coldharbour Road Duppas Hill Road Nr Warrington Road 253 20% 205 205 -3% 216 267 26% 209 254 20% 205
PM peak
AM peak
Saturday peak
C1+O2 no RT
208
228
246287 263
225208
244
C1+O1 no RT
232
C1+O1 C1+O2
209
214
222

Route From To Scenario 8 DiffAv journey /
veh No of veh Scenario 8a DiffAv journey /
veh No of veh Scenario 10 DiffAv journey /
veh No of vehScenario
10a DiffAv journey /
veh No of veh1-WB Duppas Hill Road Nr Warrington Road Croydon Road Nr Aldwick Road 276 6% 333 282 8% 331 579 123% 380 572 120% 3801-EB Croydon Road Nr Aldwick Road Duppas Hill Road Nr Warrington Road 160 -37% 242 154 -39% 248 141 -44% 284 143 -43% 2842-SB Purley Way Nr Alton Way Purley Way Nr Coldharbour Road 247 16% 209 252 19% 206 229 8% 223 219 3% 2222-NB Purley Way Nr Coldharbour Road Purley Way Nr Alton Way 177 -21% 349 173 -23% 378 306 37% 397 296 32% 4153-SB Duppas Hill Road Nr Warrington Road Purley Way Nr Coldharbour Road 191 -13% 87 190 -13% 88 196 -10% 88 196 -10% 943-NB Purley Way Nr Coldharbour Road Duppas Hill Road Nr Warrington Road 250 27% 254 246 24% 256 198 0% 277 194 -2% 282
Route From To Scenario 8 DiffAv journey /
veh No of veh Scenario 8a DiffAv journey /
veh No of veh Scenario 10 DiffAv journey /
veh No of vehScenario
10a DiffAv journey /
veh No of veh1-WB Duppas Hill Road Nr Warrington Road Croydon Road Nr Aldwick Road 239 -2% 332 223 -8% 333 387 59% 393 368 51% 4001-EB Croydon Road Nr Aldwick Road Duppas Hill Road Nr Warrington Road 162 -49% 402 163 -48% 400 163 -48% 417 163 -49% 4182-SB Purley Way Nr Alton Way Purley Way Nr Coldharbour Road 268 15% 232 258 11% 240 211 -9% 278 207 -11% 2792-NB Purley Way Nr Coldharbour Road Purley Way Nr Alton Way 228 16% 348 226 15% 371 272 38% 399 275 40% 4093-SB Duppas Hill Road Nr Warrington Road Purley Way Nr Coldharbour Road 225 6% 94 218 3% 96 234 11% 112 244 15% 1143-NB Purley Way Nr Coldharbour Road Duppas Hill Road Nr Warrington Road 305 58% 218 304 57% 217 186 -4% 224 182 -6% 220
Route From To Scenario 8 DiffAv journey /
veh No of veh Scenario 8a DiffAv journey /
veh No of veh Scenario 10 DiffAv journey /
veh No of vehScenario
10a DiffAv journey /
veh No of veh1-WB Duppas Hill Road Nr Warrington Road Croydon Road Nr Aldwick Road 232 -2% 473 240 1% 464 484 104% 469 449 89% 4901-EB Croydon Road Nr Aldwick Road Duppas Hill Road Nr Warrington Road 169 -56% 163 172 -55% 163 155 -60% 181 161 -58% 1802-SB Purley Way Nr Alton Way Purley Way Nr Coldharbour Road 287 -3% 213 285 -4% 212 248 -16% 285 244 -18% 2892-NB Purley Way Nr Coldharbour Road Purley Way Nr Alton Way 411 39% 373 295 0% 425 423 43% 426 342 16% 4873-SB Duppas Hill Road Nr Warrington Road Purley Way Nr Coldharbour Road 255 7% 140 247 4% 143 266 12% 133 263 10% 1413-NB Purley Way Nr Coldharbour Road Duppas Hill Road Nr Warrington Road 303 43% 203 274 30% 215 249 18% 204 223 6% 216
AM peak
PM peak
Saturday peak
220
230
287
306
250
349
C1+O4 C1+O5C1+O4 no RT
218
225
258
C1+O5 no RT
300
246
317

Route From To Scenario 3 DiffAv journey /
veh No of veh Scenario 5 DiffAv journey /
veh No of veh Scenario 7 DiffAv journey /
veh No of veh Scenario 9 DiffAv journey /
veh No of veh Scenario 11 DiffAv journey /
veh No of veh1-WB Duppas Hill Road Nr Warrington Road Croydon Road Nr Aldwick Road 212 -18% 144 218 -16% 145 213 -18% 148 219 -16% 148 359 38% 2131-EB Croydon Road Nr Aldwick Road Duppas Hill Road Nr Warrington Road 201 -21% 211 175 -31% 247 179 -29% 248 175 -31% 247 203 -20% 2802-SB Purley Way Nr Alton Way Purley Way Nr Coldharbour Road 246 16% 210 196 -8% 198 213 0% 211 189 -11% 204 171 -20% 2252-NB Purley Way Nr Coldharbour Road Purley Way Nr Alton Way 177 -21% 378 205 -8% 346 184 -18% 362 173 -23% 364 262 17% 4103-SB Duppas Hill Road Nr Warrington Road Purley Way Nr Coldharbour Road 202 -7% 117 211 -3% 95 216 -1% 95 210 -4% 96 241 10% 1153-NB Purley Way Nr Coldharbour Road Duppas Hill Road Nr Warrington Road 192 -3% 259 213 8% 257 227 15% 249 213 8% 260 199 1% 286
Route From To Scenario 3 DiffAv journey /
veh No of veh Scenario 5 DiffAv journey /
veh No of veh Scenario 7 DiffAv journey /
veh No of veh Scenario 9 DiffAv journey /
veh No of veh Scenario 11 DiffAv journey /
veh No of veh1-WB Duppas Hill Road Nr Warrington Road Croydon Road Nr Aldwick Road 202 -17% 139 237 -2% 173 238 -2% 170 237 -2% 173 265 9% 2141-EB Croydon Road Nr Aldwick Road Duppas Hill Road Nr Warrington Road 162 -49% 161 228 -28% 358 226 -28% 359 201 -36% 389 182 -42% 4082-SB Purley Way Nr Alton Way Purley Way Nr Coldharbour Road 192 -17% 205 215 -8% 236 184 -21% 248 200 -14% 242 167 -28% 2602-NB Purley Way Nr Coldharbour Road Purley Way Nr Alton Way 175 -11% 404 173 -12% 357 173 -12% 362 179 -9% 358 225 14% 4123-SB Duppas Hill Road Nr Warrington Road Purley Way Nr Coldharbour Road 210 -1% 146 217 2% 101 225 6% 100 223 5% 100 284 34% 1213-NB Purley Way Nr Coldharbour Road Duppas Hill Road Nr Warrington Road 198 2% 257 203 5% 215 206 7% 214 215 11% 214 201 4% 230
Route From To Scenario 3 DiffAv journey /
veh No of veh Scenario 5 DiffAv journey /
veh No of veh Scenario 7 DiffAv journey /
veh No of veh Scenario 9 DiffAv journey /
veh No of veh Scenario 11 DiffAv journey /
veh No of veh1-WB Duppas Hill Road Nr Warrington Road Croydon Road Nr Aldwick Road 202 -15% 139 245 3% 141 201 -16% 148 206 -13% 149 246 3% 1891-EB Croydon Road Nr Aldwick Road Duppas Hill Road Nr Warrington Road 162 -58% 161 263 -32% 155 165 -57% 163 170 -56% 159 163 -58% 1592-SB Purley Way Nr Alton Way Purley Way Nr Coldharbour Road 192 -35% 205 319 8% 215 169 -43% 194 228 -23% 233 179 -40% 2632-NB Purley Way Nr Coldharbour Road Purley Way Nr Alton Way 175 -41% 404 194 -34% 423 208 -30% 449 171 -42% 430 273 -8% 4823-SB Duppas Hill Road Nr Warrington Road Purley Way Nr Coldharbour Road 210 -12% 146 255 7% 145 206 -13% 154 214 -10% 159 184 -23% 1703-NB Purley Way Nr Coldharbour Road Duppas Hill Road Nr Warrington Road 198 -6% 257 201 -5% 233 237 12% 236 196 -7% 223 243 15% 245
AM peak
PM peak
Saturday peak
204
187
238
211
226194
191
203
236 201
202
209
202
187
201
C2+O5C2 C2+O1 C2+O2 C2+O4

Fiveways Feasibility ModellingFinal Report - Base and Forecasting
Modelling
Fiveways Feasibility Modelling - Final Report_ISSUED 05082014 Prepared by Parsons BrinckerhoffAugust 2014 for Transport for London
- 66 -
Appendix J – Bus Journey Time summary
S1Change in Bus Journey Time (in seconds) from Scenario 1 (Do Nothing) – AM Peak
S2a S2b S2c S4 S4a S6 S6a S8 S8a S10 S10a S3 S5 S7 S9 S11
157 NB 185 -12 -7 -6 -27 -28 -1 -5 -28 -29 -11 -11 -24 -11 -11 -29 -10
157 SB 180 -45 -54 -57 -53 -48 -58 -68 -57 -55 -62 -52 -29 -36 -32 -22 82
289 NB 200 10 6 7 24 19 -1 1 -24 -20 90 92 -28 -11 -36 -6 22
289 SB 184 44 46 39 75 51 58 55 47 57 6 8 49 1 5 -17 -32
S1Change in Bus Journey Time (in seconds) from Scenario 1 (Do Nothing) – PM Peak
S2a S2b S2c S4 S4a S6 S6a S8 S8a S10 S10a S3 S5 S7 S9 S11
157 NB 186 -5 -1 -6 -11 -11 19 20 -2 1 -6 -4 -18 -9 15 -5 1
157 SB 156 -21 -32 -32 -30 -32 -25 -22 -20 -14 -15 -17 8 -1 8 -1 48
289 NB 179 96 97 66 78 60 11 19 55 55 79 111 14 -37 -27 -22 30
289 SB 226 2 -8 7 -3 -9 33 23 27 10 -34 -45 -60 -40 -66 -50 -52
S1Change in Bus Journey Time (in seconds) from Scenario 1 (Do Nothing) – Saturday Peak
S2a S2b S2c S4 S4a S6 S6a S8 S8a S10 S10a S3 S5 S7 S9 S11
157 NB 183 -14 10 23 -22 -21 13 19 -3 0 -2 -3 -15 -9 4 -4 -28
157 SB 175 -75 -75 -63 -78 -79 -23 -32 -40 -39 -42 -43 -11 -35 -44 -46 -9
289 NB 281 -13 224 199 176 79 110 71 113 17 147 83 -88 -49 -62 -79 -8
289 SB 253 -33 -28 -27 -36 -35 -33 -39 -15 -15 -26 -16 -87 78 -114 -35 -83

Route From To Base Scenario 1 Diff Scenario 2a Diff Scenario 2b Diff Scenario 2c Diff Scenario 4 Diff Scenario 4a Diff Scenario 6 Diff Scenario 6a Diff107 157 NB Waddon Leisure Centre Epsom Road 186 185 0% 174 -6% 178 -4% 179 -3% 159 -14% 157 -15% 184 -1% 181 -3%108 157 SB Epsom Road Waddon Leisure Centre 167 180 8% 135 -25% 126 -30% 124 -32% 127 -30% 132 -27% 122 -32% 113 -38%109 289 NB Waddon Leisure Centre Alton Road 194 200 3% 209 5% 206 3% 207 4% 224 12% 218 9% 199 0% 201 1%110 289 SB Alton Road Waddon Leisure Centre 167 184 10% 228 24% 230 25% 223 21% 259 41% 235 28% 242 32% 239 30%
Route From To Base Scenario 1 Diff Scenario 2a Diff Scenario 2b Diff Scenario 2c Diff Scenario 4 Diff Scenario 4a Diff Scenario 6 Diff Scenario 6a Diff107 157 NB Waddon Leisure Centre Epsom Road 185 186 1% 181 -3% 185 -1% 181 -3% 175 -6% 176 -6% 206 10% 207 11%108 157 SB Epsom Road Waddon Leisure Centre 167 156 -7% 135 -14% 124 -21% 124 -20% 126 -19% 124 -20% 131 -16% 134 -14%109 289 NB Waddon Leisure Centre Alton Road 206 179 -13% 275 54% 276 54% 245 37% 257 44% 239 34% 190 6% 198 11%110 289 SB Alton Road Waddon Leisure Centre 226 226 0% 228 1% 218 -3% 233 3% 223 -1% 218 -4% 259 15% 249 10%
Route From To Base Scenario 1 Diff Scenario 2a Diff Scenario 2b Diff Scenario 2c Diff Scenario 4 Diff Scenario 4a Diff Scenario 6 Diff Scenario 6a Diff107 157 NB Waddon Leisure Centre Epsom Road 195 183 -6% 168 -8% 193 5% 206 13% 160 -12% 162 -11% 196 7% 202 10%108 157 SB Epsom Road Waddon Leisure Centre 154 175 13% 100 -43% 100 -43% 112 -36% 97 -45% 96 -45% 152 -13% 143 -18%109 289 NB Waddon Leisure Centre Alton Road 268 281 5% 268 -4% 505 80% 480 71% 457 63% 360 28% 391 39% 352 25%110 289 SB Alton Road Waddon Leisure Centre 223 253 14% 220 -13% 225 -11% 226 -11% 217 -14% 218 -14% 220 -13% 214 -16%
AM peak
Sat peak
PM peak
C1b C1b no RT C1+O1 no RT C1+O2 no RTApendix J - Bus Journey Time Summary
DN C1a C1+O1 C1+O2

Route From To Scenario 8 Diff Scenario 8a Diff Scenario 10 Diff Scenario 10a Diff Scenario 3 Diff Scenario 5 Diff Scenario 7 Diff Scenario 9 Diff Scenario 11 Diff157 NB Waddon Leisure CentreEpsom Road 157 -15% 157 -15% 174 -6% 174 -6% 161 -13% 174 -6% 174 -6% 156 -16% 176 -5%157 SB Epsom Road Waddon Leisure Centre124 -32% 125 -31% 119 -34% 128 -29% 151 -16% 145 -20% 148 -18% 158 -12% 263 46%289 NB Waddon Leisure CentreAlton Road 176 -12% 180 -10% 290 45% 292 46% 172 -14% 189 -5% 164 -18% 194 -3% 222 11%289 SB Alton Road Waddon Leisure Centre231 26% 241 31% 190 3% 192 4% 233 27% 185 0% 188 2% 167 -9% 152 -18%
Route From To Scenario 8 Diff Scenario 8a Diff Scenario 10 Diff Scenario 10a Diff Scenario 3 Diff Scenario 5 Diff Scenario 7 Diff Scenario 9 Diff Scenario 11 Diff157 NB Waddon Leisure CentreEpsom Road 185 -1% 187 1% 180 -3% 183 -2% 168 -10% 177 -5% 201 8% 182 -2% 187 0%157 SB Epsom Road Waddon Leisure Centre136 -13% 142 -9% 141 -10% 139 -11% 164 5% 155 -1% 164 5% 155 -1% 204 31%289 NB Waddon Leisure CentreAlton Road 234 31% 234 31% 258 44% 290 62% 193 8% 142 -21% 152 -15% 157 -12% 209 17%289 SB Alton Road Waddon Leisure Centre253 12% 236 4% 192 -15% 181 -20% 166 -27% 186 -18% 160 -29% 176 -22% 174 -23%
Route From To Scenario 8 Diff Scenario 8a Diff Scenario 10 Diff Scenario 10a Diff Scenario 3 Diff Scenario 5 Diff Scenario 7 Diff Scenario 9 Diff Scenario 11 Diff157 NB Waddon Leisure CentreEpsom Road 180 -1% 182 0% 181 -1% 179 -2% 168 -8% 174 -5% 187 2% 179 -2% 155 -15%157 SB Epsom Road Waddon Leisure Centre135 -23% 136 -22% 133 -24% 132 -24% 164 -6% 140 -20% 131 -25% 129 -26% 166 -5%289 NB Waddon Leisure CentreAlton Road 394 40% 298 6% 428 52% 364 30% 193 -31% 232 -17% 219 -22% 202 -28% 273 -3%289 SB Alton Road Waddon Leisure Centre238 -6% 238 -6% 227 -10% 237 -6% 166 -34% 331 31% 139 -45% 218 -14% 170 -33%
AM peak
PM peak
Saturday peak
C2+O4 C2+O5C1+O4 C1+O4 no RT C1+O5 C2 C2+O1 C2+O2C1+O5 no RT

Fiveways Feasibility ModellingFinal Report - Base and Forecasting
Modelling
Fiveways Feasibility Modelling - Final Report_ISSUED 31072014.docx Prepared by Parsons BrinckerhoffJuly 2014 for Transport for London
- 69 -
Appendix K – Queue summary
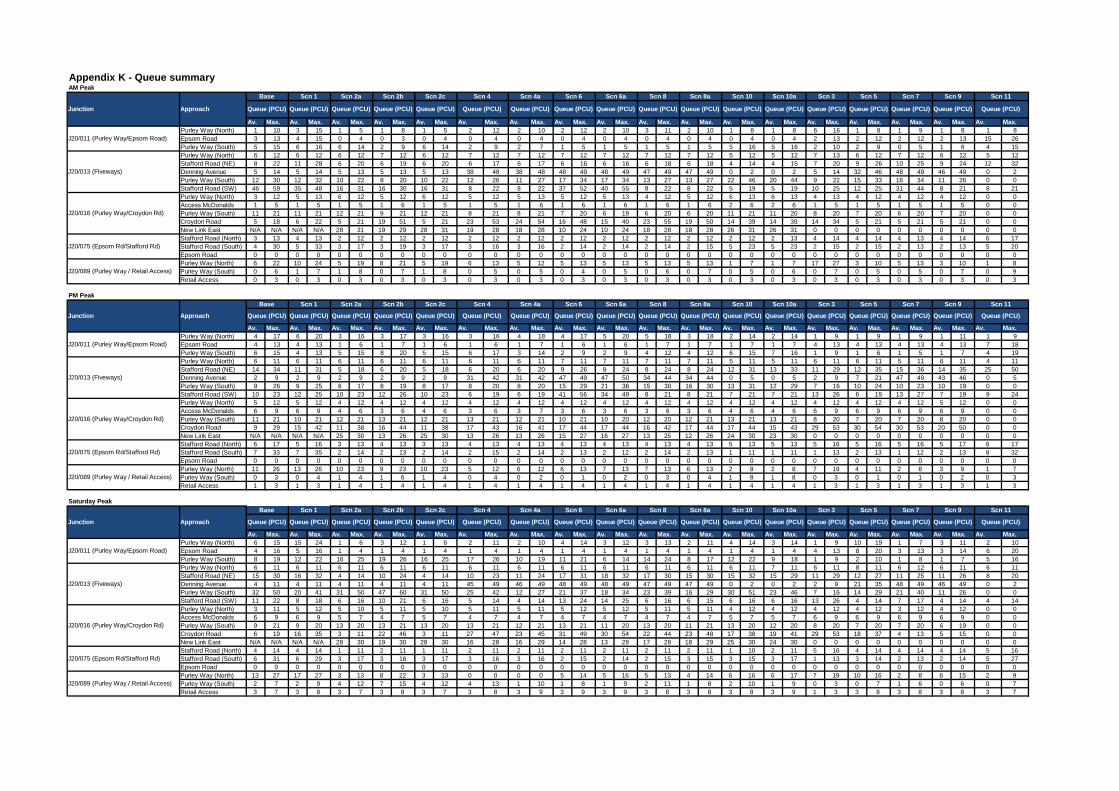
Appendix K - Queue summaryAM Peak
Av. Max. Av. Max. Av. Max. Av. Max. Av. Max. Av. Max. Av. Max. Av. Max. Av. Max. Av. Max. Av. Max. Av. Max. Av. Max. Av. Max. Av. Max. Av. Max. Av. Max. Av. Max.Purley Way (North) 1 10 3 15 1 5 1 8 1 5 2 12 2 10 2 12 2 10 3 11 2 10 1 8 1 8 6 16 1 8 1 9 1 8 1 8Epsom Road 3 13 4 15 0 4 0 3 0 4 0 4 0 4 0 4 0 4 0 4 0 4 0 4 0 4 2 13 2 12 2 12 2 13 15 26Purley Way (South) 5 15 6 16 6 14 2 9 6 14 2 9 2 7 1 5 1 5 1 5 1 5 5 16 5 16 2 10 2 9 0 5 1 6 4 15Purley Way (North) 6 12 6 12 6 12 7 12 6 12 7 12 7 12 7 12 7 12 7 12 7 12 5 12 5 12 7 13 6 12 7 12 6 12 5 12Stafford Road (NE) 8 22 11 28 6 20 6 19 6 20 6 17 6 17 6 16 6 16 6 18 6 18 4 14 4 15 7 20 9 26 10 25 9 24 12 32Denning Avenue 5 14 5 14 5 13 5 13 5 13 38 48 38 48 48 49 48 49 47 49 47 49 0 2 0 2 5 14 32 46 48 49 46 49 0 2Purley Way (South) 12 30 12 32 10 22 8 20 10 22 12 26 11 27 17 34 17 34 13 27 13 27 22 46 20 44 9 22 15 33 16 34 11 26 0 0Stafford Road (SW) 46 59 35 48 16 31 16 30 16 31 8 22 8 22 37 52 40 55 8 22 8 22 5 19 5 19 10 25 12 25 31 44 8 21 8 21Purley Way (North) 3 12 5 13 6 12 5 12 6 12 5 12 5 13 5 12 5 13 4 12 5 12 6 13 6 13 4 13 4 12 4 12 4 12 0 0Access McDonalds 1 5 1 5 1 5 1 6 1 5 1 5 1 6 1 6 1 6 1 6 1 6 2 6 2 6 1 5 1 5 1 5 1 5 0 0Purley Way (South) 11 21 11 21 12 21 9 21 12 21 8 21 8 21 7 20 6 19 6 20 6 20 11 21 11 20 8 20 7 20 6 20 7 20 0 0Croydon Road 5 18 6 22 5 21 19 51 5 21 23 53 24 54 16 48 15 40 23 55 19 50 14 39 14 39 14 34 5 21 5 21 5 21 0 0New Link East N/A N/A N/A N/A 28 31 19 29 28 31 19 28 18 28 10 24 10 24 18 28 18 28 26 31 26 31 0 0 0 0 0 0 0 0 0 0Stafford Road (North) 3 13 4 13 2 12 2 12 2 12 2 12 2 12 2 12 2 12 2 12 2 12 2 12 2 13 4 14 4 14 4 13 4 14 6 17Stafford Road (South) 4 30 5 33 3 17 3 19 3 17 3 16 3 16 2 14 2 14 2 14 2 15 5 23 5 23 2 15 2 15 2 13 2 13 5 20Epsom Road 0 0 0 0 0 0 0 0 0 0 0 0 0 0 0 0 0 0 0 0 0 0 0 0 0 0 0 0 0 0 0 0 0 0 0 0Purley Way (North) 6 22 10 24 5 19 8 21 5 19 6 13 5 12 5 13 5 13 5 13 5 13 1 7 1 7 17 27 3 10 5 13 3 10 1 8Purley Way (South) 0 6 1 7 1 8 0 7 1 8 0 5 0 5 0 4 0 5 0 6 0 7 0 5 0 6 0 7 0 5 0 5 0 7 0 9Retail Access 0 3 0 3 0 3 0 3 0 3 0 3 0 3 0 3 0 3 0 3 0 3 0 3 0 3 0 3 0 3 0 3 0 3 0 3
PM Peak
Av. Max. Av. Max. Av. Max. Av. Max. Av. Max. Av. Max. Av. Max. Av. Max. Av. Max. Av. Max. Av. Max. Av. Max. Av. Max. Av. Max. Av. Max. Av. Max. Av. Max. Av. Max.Purley Way (North) 4 17 6 20 3 16 3 17 3 16 3 16 4 18 4 17 5 20 5 18 3 18 2 14 2 14 1 9 1 9 1 9 1 11 1 9Epsom Road 4 13 4 13 1 6 1 7 1 6 1 6 1 7 1 6 1 6 1 7 1 7 1 7 1 7 4 13 4 13 4 13 4 13 7 18Purley Way (South) 6 15 4 13 5 15 8 20 5 15 6 17 3 14 2 9 2 9 4 12 4 12 6 15 7 16 1 9 1 6 1 5 1 7 4 19Purley Way (North) 6 11 6 11 6 11 6 11 6 11 6 11 6 11 7 11 7 11 7 11 7 11 5 11 5 11 6 11 6 11 5 11 6 11 4 11Stafford Road (NE) 14 34 11 31 5 18 6 20 5 18 6 20 6 20 9 26 8 24 8 24 8 24 12 31 13 33 11 29 12 35 15 36 14 35 25 50Denning Avenue 2 9 2 9 2 9 2 9 2 9 31 42 31 42 47 49 47 50 34 44 34 44 0 5 0 5 2 9 7 21 47 49 43 46 0 5Purley Way (South) 9 26 9 25 8 17 8 19 8 17 8 20 8 20 15 29 21 36 15 30 16 30 13 31 12 29 7 16 10 24 10 23 10 19 0 0Stafford Road (SW) 10 23 12 25 10 23 12 26 10 23 6 19 6 19 41 56 34 49 8 21 8 21 7 21 7 21 13 26 6 19 13 27 7 19 9 24Purley Way (North) 5 12 5 12 4 12 4 12 4 12 4 12 4 12 4 12 4 12 4 12 4 12 4 12 4 12 4 12 4 12 4 12 5 12 0 0Access McDonalds 6 9 6 9 4 6 3 6 4 6 3 6 3 7 3 6 3 6 3 6 3 6 4 6 4 6 6 9 6 9 6 9 6 9 0 0Purley Way (South) 11 21 10 21 12 21 13 21 12 21 13 21 12 21 10 21 10 20 12 20 12 21 13 21 13 21 8 20 7 20 7 20 8 20 0 0Croydon Road 9 29 15 42 11 38 16 44 11 38 17 43 16 41 17 44 17 44 16 42 17 44 17 44 15 43 29 53 30 54 30 53 20 50 0 0New Link East N/A N/A N/A N/A 25 30 13 26 25 30 13 26 13 26 15 27 16 27 13 25 12 26 24 30 23 30 0 0 0 0 0 0 0 0 0 0Stafford Road (North) 6 17 5 16 3 13 4 13 3 13 4 13 4 13 4 13 4 13 4 13 4 13 5 13 5 13 5 16 5 16 5 16 5 17 6 17Stafford Road (South) 7 33 7 35 2 14 2 13 2 14 2 15 2 14 2 13 2 12 2 14 2 13 1 11 1 11 1 13 2 13 1 12 2 13 8 32Epsom Road 0 0 0 0 0 0 0 0 0 0 0 0 0 0 0 0 0 0 0 0 0 0 0 0 0 0 0 0 0 0 0 0 0 0 0 0Purley Way (North) 11 26 13 26 10 23 9 23 10 23 5 12 6 12 6 13 7 13 7 13 6 13 2 8 2 8 7 19 4 11 2 8 3 9 1 7Purley Way (South) 0 3 0 4 1 4 1 6 1 4 0 4 0 2 0 1 0 2 0 3 0 4 1 8 1 8 0 3 0 1 0 1 0 2 0 3Retail Access 1 3 1 3 1 4 1 4 1 4 1 4 1 4 1 4 1 4 1 4 1 4 1 4 1 4 1 3 1 3 1 3 1 3 1 3
Saturday Peak
Av. Max. Av. Max. Av. Max. Av. Max. Av. Max. Av. Max. Av. Max. Av. Max. Av. Max. Av. Max. Av. Max. Av. Max. Av. Max. Av. Max. Av. Max. Av. Max. Av. Max. Av. Max.Purley Way (North) 6 15 15 24 1 6 3 12 1 6 2 11 2 10 4 14 3 12 3 13 2 11 4 14 3 14 1 9 10 19 1 7 3 11 2 10Epsom Road 4 16 5 16 1 4 1 4 1 4 1 4 1 4 1 4 1 4 1 4 1 4 1 4 1 4 4 13 8 20 3 13 3 14 6 20Purley Way (South) 8 19 12 22 16 25 19 26 16 25 17 26 10 19 11 21 6 14 14 24 8 17 12 22 9 18 1 9 2 10 1 8 1 7 5 16Purley Way (North) 6 11 6 11 6 11 6 11 6 11 6 11 6 11 6 11 6 11 6 11 6 11 6 11 7 11 6 11 8 11 6 12 6 11 6 11Stafford Road (NE) 15 30 16 32 4 14 10 24 4 14 10 23 11 24 17 31 18 32 17 30 15 30 15 32 15 29 11 29 12 27 11 25 11 26 8 20Denning Avenue 4 11 4 11 4 11 4 11 4 11 45 49 46 49 48 49 48 49 47 49 47 49 0 2 0 2 2 9 21 35 48 49 46 49 0 2Purley Way (South) 32 50 20 41 31 50 47 60 31 50 25 42 12 27 21 37 18 34 23 39 16 29 30 51 23 46 7 16 14 29 21 40 11 26 0 0Stafford Road (SW) 11 22 8 18 6 16 10 21 6 16 5 14 4 14 13 24 14 25 6 16 6 15 6 16 6 16 13 26 4 14 7 17 4 14 4 14Purley Way (North) 3 11 5 12 5 10 5 11 5 10 5 11 5 11 5 12 5 12 5 11 5 11 4 12 4 12 4 12 4 12 3 12 4 12 0 0Access McDonalds 6 9 6 9 5 7 4 7 5 7 4 7 4 7 4 7 4 7 4 7 4 7 5 7 5 7 6 9 6 9 6 9 6 9 0 0Purley Way (South) 9 21 9 20 13 20 13 21 13 20 13 21 12 21 13 21 11 20 13 20 11 21 13 20 12 20 8 20 7 20 7 20 6 19 0 0Croydon Road 6 19 16 35 3 11 22 46 3 11 27 47 23 45 31 49 30 54 22 44 23 48 17 38 19 41 29 53 18 37 4 13 5 15 0 0New Link East N/A N/A N/A N/A 28 30 19 30 28 30 16 28 16 29 14 28 13 28 17 28 18 29 25 30 24 30 0 0 0 0 0 0 0 0 0 0Stafford Road (North) 4 14 4 14 1 11 2 11 1 11 2 11 2 11 2 11 2 11 2 11 2 11 1 10 2 11 5 16 4 14 4 14 4 14 5 16Stafford Road (South) 6 31 6 29 3 17 3 16 3 17 3 16 3 16 2 15 2 14 2 15 3 15 3 15 3 17 1 13 3 14 2 13 2 14 5 27Epsom Road 0 0 0 0 0 0 0 0 0 0 0 0 0 0 0 0 0 0 0 0 0 0 0 0 0 0 0 0 0 0 0 0 0 0 0 0Purley Way (North) 13 27 17 27 3 13 8 22 3 13 0 0 0 0 5 14 5 16 5 13 4 14 6 16 6 17 7 19 10 16 2 8 6 15 2 9Purley Way (South) 2 7 2 9 4 12 7 15 4 12 4 13 1 10 1 8 1 9 2 11 1 8 2 10 1 9 0 3 0 7 1 6 0 6 0 7Retail Access 3 7 3 8 3 7 3 8 3 7 3 8 3 9 3 9 3 9 3 8 3 8 3 8 3 9 1 3 3 8 3 8 3 8 3 7
Scn 9 Scn 11
Scn 9 Scn 11
Scn 9 Scn 11Scn 4aScn 2b Scn 2c
Queue (PCU) Queue (PCU) Queue (PCU) Queue (PCU)
Scn 6a
Scn 6a
Scn 6a
Scn 8 Scn 8a
Scn 8 Scn 8a
Scn 8 Scn 8a
Queue (PCU) Queue (PCU)
Scn 10 Scn 10a
Scn 10 Scn 10a
Scn 10 Scn 10a
J20/075 (Epsom Rd/Stafford Rd)
J20/089 (Purley Way / Retail Access)
Scn 4 Scn 5Scn 6
J20/016 (Purley Way/Croydon Rd)
Queue (PCU) Queue (PCU) Queue (PCU) Queue (PCU) Queue (PCU) Queue (PCU) Queue (PCU) Queue (PCU) Queue (PCU) Queue (PCU)
J20/011 (Purley Way/Epsom Road)
J20/013 (Fiveways)
Junction Approach
Base Scn 1 Scn 2a Scn 3
J20/075 (Epsom Rd/Stafford Rd)
J20/089 (Purley Way / Retail Access)
J20/016 (Purley Way/Croydon Rd)
Scn 1 Scn 2a Scn 3Scn 4 Scn 5Scn 6Scn 4aScn 2b Scn 2c
Queue (PCU) Queue (PCU)
J20/075 (Epsom Rd/Stafford Rd)
J20/089 (Purley Way / Retail Access)
Junction Approach
Base
Queue (PCU)
Scn 7
J20/011 (Purley Way/Epsom Road)
J20/013 (Fiveways)
Scn 7
J20/011 (Purley Way/Epsom Road)
J20/013 (Fiveways)
Junction Approach
Base Scn 1 Scn 2a Scn 3Scn 2b Scn 2c Scn 4a
Queue (PCU) Queue (PCU)Queue (PCU)Queue (PCU) Queue (PCU) Queue (PCU)
J20/016 (Purley Way/Croydon Rd)
Scn 4 Scn 5Scn 6
Queue (PCU) Queue (PCU) Queue (PCU) Queue (PCU) Queue (PCU)Queue (PCU) Queue (PCU) Queue (PCU) Queue (PCU) Queue (PCU)
Queue (PCU) Queue (PCU) Queue (PCU) Queue (PCU) Queue (PCU)Queue (PCU) Queue (PCU) Queue (PCU) Queue (PCU) Queue (PCU)
Queue (PCU) Queue (PCU) Queue (PCU) Queue (PCU)
Queue (PCU) Queue (PCU) Queue (PCU) Queue (PCU) Queue (PCU)
Scn 7