volume 1 – systems modelling - dwa.gov.za systems... · and modelling report: volume 1 ......
TRANSCRIPT

WP 11004
DETERMINATION OF WATER RESOURCE CLASSES AND
RESOURCE QUALITY OBJECTIVES FOR THE WATER
RESOURCES IN THE MZIMVUBU CATCHMENT
River Desktop EWR
and Modelling Report:
VOLUME 1 – SYSTEMS
MODELLING
May 2017
Report Number: WE/WMA7/00/CON/CLA/0217, Volume 1

Published by
Department of Water and Sanitation
Private Bag X313
PRETORIA, 0001
Republic of South Africa
Tel: +27 (12) 336 7500
Fax: +27 (12) 323 0321
Copyright reserved
No part of this publication may be reproduced in any manner
without full acknowledgement of the source
This report should be cited as:
Department of Water and Sanitation (DWS), South Africa, 2017. Determination of Water Resource
Classes and Resource Quality Objectives for Water Resources in the Mzimvubu Catchment. River
Desktop EWR and Modelling Report: Volume 1 – Systems Modelling. Compiled by WRP
Consulting Engineers (Pty) Ltd for Scherman Colloty and Associates cc. Report no.
WE/WMA7/00/CON/CLA/0217, Volume 1
Compiled by:
Scherman Colloty & Associates cc
22 Somerset Street
Grahamstown
6139
Determination of Water Resource Classes and Resource Quality Objectives for the Water Resources in the Mzimvubu Catchment
Project No. WP 11004 / River Desktop EWR and Modelling Report: Volume 1 – Systems Modelling
Page i
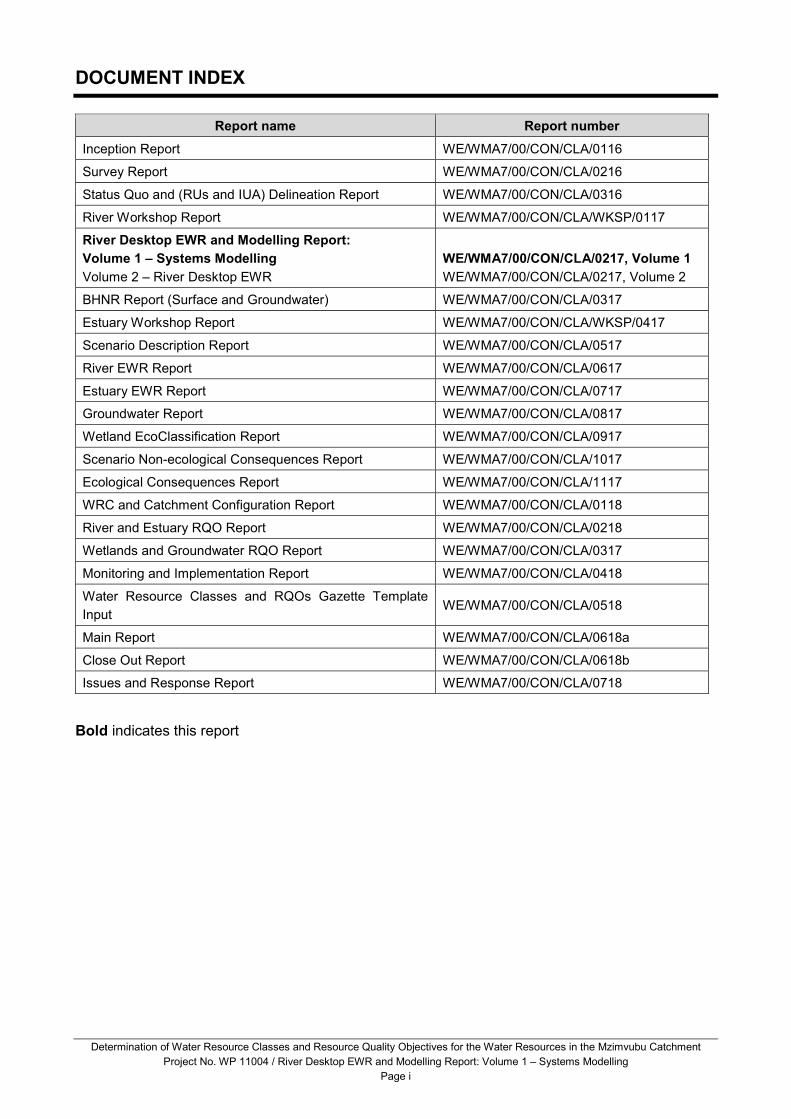
DOCUMENT INDEX
Report name Report number
Inception Report WE/WMA7/00/CON/CLA/0116
Survey Report WE/WMA7/00/CON/CLA/0216
Status Quo and (RUs and IUA) Delineation Report WE/WMA7/00/CON/CLA/0316
River Workshop Report WE/WMA7/00/CON/CLA/WKSP/0117
River Desktop EWR and Modelling Report:
Volume 1 – Systems Modelling
Volume 2 – River Desktop EWR
WE/WMA7/00/CON/CLA/0217, Volume 1
WE/WMA7/00/CON/CLA/0217, Volume 2
BHNR Report (Surface and Groundwater) WE/WMA7/00/CON/CLA/0317
Estuary Workshop Report WE/WMA7/00/CON/CLA/WKSP/0417
Scenario Description Report WE/WMA7/00/CON/CLA/0517
River EWR Report WE/WMA7/00/CON/CLA/0617
Estuary EWR Report WE/WMA7/00/CON/CLA/0717
Groundwater Report WE/WMA7/00/CON/CLA/0817
Wetland EcoClassification Report WE/WMA7/00/CON/CLA/0917
Scenario Non-ecological Consequences Report WE/WMA7/00/CON/CLA/1017
Ecological Consequences Report WE/WMA7/00/CON/CLA/1117
WRC and Catchment Configuration Report WE/WMA7/00/CON/CLA/0118
River and Estuary RQO Report WE/WMA7/00/CON/CLA/0218
Wetlands and Groundwater RQO Report WE/WMA7/00/CON/CLA/0317
Monitoring and Implementation Report WE/WMA7/00/CON/CLA/0418
Water Resource Classes and RQOs Gazette Template
Input WE/WMA7/00/CON/CLA/0518
Main Report WE/WMA7/00/CON/CLA/0618a
Close Out Report WE/WMA7/00/CON/CLA/0618b
Issues and Response Report WE/WMA7/00/CON/CLA/0718
Bold indicates this report

Determination of Water Resource Classes and Resource Quality Objectives for the Water Resources in the Mzimvubu Catchment
Project No. WP 11004 / River Desktop EWR and Modelling Report: Volume 1 – Systems Modelling
Page ii
APPROVAL
TITLE: River Desktop EWR and Modelling Report:
Volume 1 – Systems Modelling
DATE: May 2017
AUTHORS: Talanda C
EDITOR: Gowans L
REVIEWERS: Project Management Team
LEAD CONSULTANT: Scherman Colloty & Associates cc
REPORT NO: WE/WMA7/00/CON/CLA/0217, Volume 1
FORMAT: MSWord and PDF
WEB ADDRESS: http://www.dws.gov.za
Approved for Scherman Colloty & Associates cc:
_________________________________
Dr Patsy Scherman
Study Leader
Supported by: Recommended by:
_________________________________ ________________________________
Lawrence Mulangaphuma Ms Lebogang Matlala
Project Manager Director: Water Resource Classification
Approved for the Department of Water and Sanitation by:
_________________________________
Ms Ndileka Mohapi
Chief Director: Water Ecosystems

Determination of Water Resource Classes and Resource Quality Objectives for the Water Resources in the Mzimvubu Catchment
Project No. WP 11004 / River Desktop EWR and Modelling Report: Volume 1 – Systems Modelling
Page iii
ACKNOWLEDGEMENTS
The following persons contributed to this project:
Project Management Team
Matlala, L DWS: Water Ecosystems; Classification
Mulangaphuma, L DWS: Water Ecosystems; Classification
Scherman, P-A Scherman Colloty & Associates cc.
Sauer, J Scherman Colloty & Associates cc.
Weni, E DWS: Eastern Cape Regional Office
Barbara Weston DWS: Water Ecosystems; Surface Water Reserves
Tinyiko Neswiswi DWS: Water Ecosystems; Surface Water Reserves
Mosefowa Kganetsi DWS: Resource Protection and Waste
Lerato Molokomme DWS: Water Ecosystems; Groundwater Reserves
Namisha Muthraparsad DWS: Environment and Recreation
Isa Thompson DWS: Integrated Water Resource Planning
Mahasha Matume DWS: Stakeholder Engagement and Coordination
Gerhard Cilliers DWS: Resource Quality Information Services
Sibusiso Majola DWS: Resource Quality Information Services

Determination of Water Resource Classes and Resource Quality Objectives for the Water Resources in the Mzimvubu Catchment
Project No. WP 11004 / River Desktop EWR and Modelling Report: Volume 1 – Systems Modelling
Page iv
AUTHORS
The following persons contributed to this report:
Author Company
Talanda, C WRP Consulting Engineers (Pty) Ltd
REPORT SCHEDULE
Version Date
First draft February 2017
Final May 2017

Determination of Water Resource Classes and Resource Quality Objectives for the Water Resources in the Mzimvubu Catchment
Project No. WP 11004 / River Desktop EWR and Modelling Report: Volume 1 – Systems Modelling
Page v
EXECUTIVE SUMMARY
INTRODUCTION
The purpose of this Systems Modelling Report is to present the information used and the
methodology applied to determine the natural and present day monthly river flow time-series data
at the relevant Ecological Water Requirement (EWR) sites and the identified desktop biophysical
nodes in the study area. This data is required for the ecological assessments.
The study area was delineated into Resource Units (RUs) during Step 1 of the study, with each RU
represented by a biophysical node. These nodes are either survey or EWR sites, or hypothetical
points known as desktop biophysical nodes. The determination of ecological water requirements
for both survey sites (i.e. EWR sites) and desktop biophysical nodes, are undertaken during Step 3
and will be reported in the next series of reports for the study.
The following EWR sites were surveyed during the study:
� MzimEWR1 on the Tsitsa River in T35E
� MzimEWR2 on the Thina River in T34J
� MzimEWR3 on the Kinira River in T33G
� MzimEWR4 on the lower Mzimvubu River in T36A
The Mzimvubu catchment consists of the main Mzimvubu River, the Tsitsa, Thina, Kinira and
Mzintlava main tributaries and the estuary at Port St Johns (Figure 1.1). The river reaches
sizeable proportions after the confluence of these four tributaries in the Lower Mzimvubu area,
approximately 120 km from its source.
The Mzimvubu catchment and river system lies along the northern boundary of the Eastern Cape
and extends for over 200 km from its source in the Maloti-Drakensberg watershed on the Lesotho
escarpment to the estuary at Port St Johns. The catchment is in Primary T, comprises of T31-36
and stretches from the Mzimkhulu River on the north-eastern side to the Mbashe and Mthatha
River catchments in the south. The Mzimvubu River catchment is within the Water Management
Area (WMA) 7, i.e. the Mzimvubu to Tsitsikamma WMA.
No major instream dams occur along the main rivers, although there are approximately 10 dams
used to supply municipal water requirements. Some remnant catchment dams exist in the
Ongeluksnek Valley and on the commercial farms in the margins of the Cedarville flats, but this is
not a common practice in traditional farming systems (ERS/CSA, 2011). However, there are a
number of instream abstraction weirs.
METHODOLOGY
Natural hydrology
A review of the various past and current studies in the study area was undertaken as part of the
status quo assessments to confirm the availability and status of both the hydrology and water
resource models available.
The natural flow forms the baseline against which all scenarios will be assessed. The hydrology for
the baseline was derived from the DWAF (2009) study in support of AsgiSA-EC (Accelerated and

Determination of Water Resource Classes and Resource Quality Objectives for the Water Resources in the Mzimvubu Catchment
Project No. WP 11004 / River Desktop EWR and Modelling Report: Volume 1 – Systems Modelling
Page vi
Shared Growth Initiative for South Africa-Eastern Cape), and the more recent DWS Feasibility
Study for the Mzimvubu Water Project (DWS, 2014), which updated the hydrology of the Kinira and
Tsitsa rivers, which were expected to be at higher confidence levels.
A comparison assessment of the available hydrology was undertaken and the results confirmed
that the updated hydrology from the DWS Feasibility Study for the Mzimvubu Water Project for the
Kinira River System was unacceptable (Section 2.2), and thus only the Tsitsa hydrology was
utilised from the study (as shown in Table 1 below).
The hydrology was generally available at a quaternary level resolution and was downscaled
linearly where the catchment area of the EWRs and biophysical nodes (Figure 2.3) was less than
the existing catchment areas, i.e. hydrological parameters scaled down in proportion to the area
reduction.
Table 1 Hydrology source per catchment
Catchment Accepted hydrology source
Mzimvubu (T31A–T31J) (DWAF, 2009)
Mzintlava (T32A–T32H) (DWAF, 2009)
Kinira (T33A–T33G) (DWAF, 2009)
Thina (T34A–T34K) (DWAF, 2009)
Tsitsa (T35A–T35M) (DWS, 2014)
Mzimvubu (T36A–T36B) (DWAF, 2009)
Present day hydrology
The integrated Water Resources Yield Model (WRYM) was generally configured at a quaternary
level, which was also downscaled where the catchment area of the EWRs and biophysical nodes
(defined as part of this Classification study) was less than the quaternaries, to ensure that the
present day flows could be generated at these points.
The WRYM was updated with the latest catchment development or land use information available
in order to produce the best possible estimates of present day flow. The land use components
included are listed below and each of them are described in more detail in subsequent sections:
� Afforestation
� Alien invasive plants (AIP)
� Irrigation
� Urban/Rural water requirements and return flows
The large dams and the so-called smaller farm dams were also included in the WRYM setup. The
smaller dams were incorporated to include the effect of irrigation from farm dams, as well as the
effect of multiple small dams’ regulation of streamflow and loss of water by evaporation from the
dam surfaces. The subsequent result is a reduction in water yield from water resource
developments downstream of these dams.
The present day flows were then generated using the configured WRYM with all the catchment
development information incorporated at the required resolution.
Determination of Water Resource Classes and Resource Quality Objectives for the Water Resources in the Mzimvubu Catchment
Project No. WP 11004 / River Desktop EWR and Modelling Report: Volume 1 – Systems Modelling
Page vii
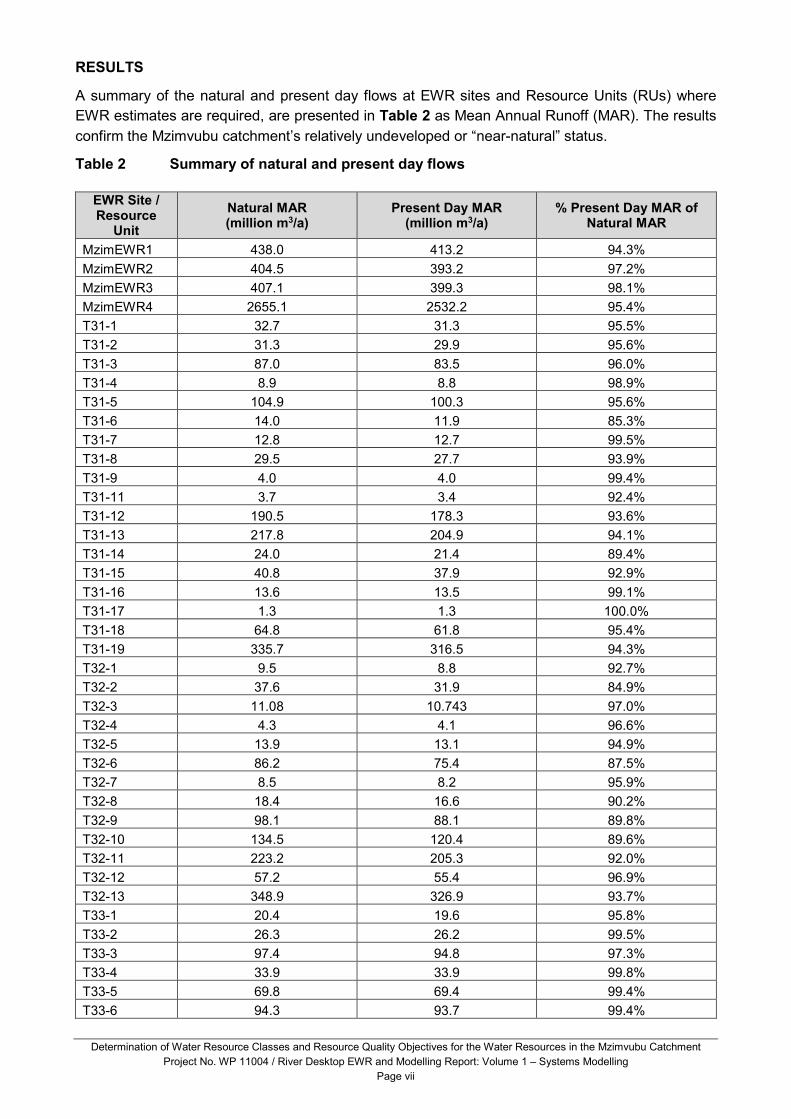
RESULTS
A summary of the natural and present day flows at EWR sites and Resource Units (RUs) where
EWR estimates are required, are presented in Table 2 as Mean Annual Runoff (MAR). The results
confirm the Mzimvubu catchment’s relatively undeveloped or “near-natural” status.
Table 2 Summary of natural and present day flows
EWR Site / Resource
Unit
Natural MAR (million m3/a)
Present Day MAR (million m3/a)
% Present Day MAR of Natural MAR
MzimEWR1 438.0 413.2 94.3%
MzimEWR2 404.5 393.2 97.2%
MzimEWR3 407.1 399.3 98.1%
MzimEWR4 2655.1 2532.2 95.4%
T31-1 32.7 31.3 95.5%
T31-2 31.3 29.9 95.6%
T31-3 87.0 83.5 96.0%
T31-4 8.9 8.8 98.9%
T31-5 104.9 100.3 95.6%
T31-6 14.0 11.9 85.3%
T31-7 12.8 12.7 99.5%
T31-8 29.5 27.7 93.9%
T31-9 4.0 4.0 99.4%
T31-11 3.7 3.4 92.4%
T31-12 190.5 178.3 93.6%
T31-13 217.8 204.9 94.1%
T31-14 24.0 21.4 89.4%
T31-15 40.8 37.9 92.9%
T31-16 13.6 13.5 99.1%
T31-17 1.3 1.3 100.0%
T31-18 64.8 61.8 95.4%
T31-19 335.7 316.5 94.3%
T32-1 9.5 8.8 92.7%
T32-2 37.6 31.9 84.9%
T32-3 11.08 10.743 97.0%
T32-4 4.3 4.1 96.6%
T32-5 13.9 13.1 94.9%
T32-6 86.2 75.4 87.5%
T32-7 8.5 8.2 95.9%
T32-8 18.4 16.6 90.2%
T32-9 98.1 88.1 89.8%
T32-10 134.5 120.4 89.6%
T32-11 223.2 205.3 92.0%
T32-12 57.2 55.4 96.9%
T32-13 348.9 326.9 93.7%
T33-1 20.4 19.6 95.8%
T33-2 26.3 26.2 99.5%
T33-3 97.4 94.8 97.3%
T33-4 33.9 33.9 99.8%
T33-5 69.8 69.4 99.4%
T33-6 94.3 93.7 99.4%

Determination of Water Resource Classes and Resource Quality Objectives for the Water Resources in the Mzimvubu Catchment
Project No. WP 11004 / River Desktop EWR and Modelling Report: Volume 1 – Systems Modelling
Page viii
EWR Site / Resource
Unit
Natural MAR (million m3/a)
Present Day MAR (million m3/a)
% Present Day MAR of Natural MAR
T33-7 303.0 296.4 97.8%
T33-8 6.2 6.1 99.5%
T33-9 368.3 360.8 98.0%
T33-10 15.6 15.1 97.3%
T33-11 14.0 12.1 86.1%
T33-12 17.1 16.9 99.1%
T33-13 9.2 8.6 93.6%
T33-14 No estimate required as extrapolated from MzimEWR4 using the WRYM
T34-1 33.6 33.5 99.7%
T34-2 32.9 32.6 99.2%
T34-3 41.1 40.9 99.4%
T34-4 68.1 67.4 99.0%
T34-5 123.5 120.1 97.2%
T34-6 20.3 20.2 99.3%
T34-7 45.2 44.4 98.2%
T34-8 84.7 83.3 98.4%
T34-9 27.1 22.5 83.1%
T34-10 20.1 19.0 94.5%
T34-11 11.9 11.3 95.2%
T34-12 18.2 17.1 93.9%
T35-1 101.1 97.6 96.5%
T35-2 79.7 78.4 98.3%
T35-3 63.7 61.5 96.6%
T35-4 127.6 111.9 87.7%
T35-5 46.1 43.9 95.2%
T35-6 37.6 33.7 89.6%
T35-7 26.1 24.0 91.9%
T35-8 14.3 9.7 67.7%
EWR Inxu1 44.4 39.4 88.8%
EWR Inxu2 57.2 49.7 87.0%
EWR GAT1 2.9 1.5 51.9%
EWR GAT2 10.9 8.1 74.8%
T35-9 35.1 34.4 98.2%
T35-10 19.87 19.72 99.3%
T35-11 29.76 29.18 98.1%
T35-12 18.1 17.6 97.0%
T35-13 14.7 14.3 96.8%
T35-14 36.2 33.4 92.1%
T35-15 10.2 10.1 98.8%
T35-16 13.5 13.5 100.0%
T36-1 14.3 14.2 99.3%
T36-2 9.8 9.7 99.4%

Determination of Water Resource Classes and Resource Quality Objectives for the Water Resources in the Mzimvubu Catchment
Project No. WP 11004 / River Desktop EWR and Modelling Report: Volume 1 – Systems Modelling
Page ix
TABLE OF CONTENTS
DOCUMENT INDEX ........................................................................................................................ i
APPROVAL .................................................................................................................................... ii
ACKNOWLEDGEMENTS .............................................................................................................. iii
AUTHORS ..................................................................................................................................... iv
REPORT SCHEDULE ................................................................................................................... iv
EXECUTIVE SUMMARY ................................................................................................................ v
TABLE OF CONTENTS ................................................................................................................ ix
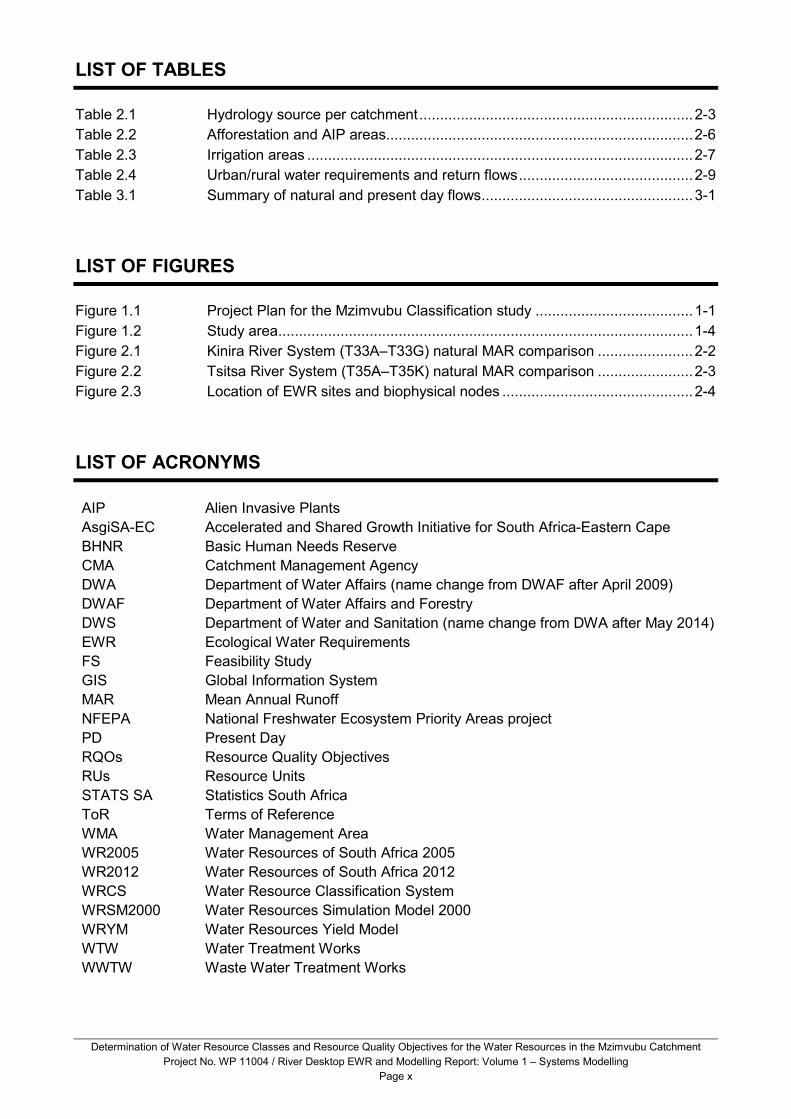
LIST OF TABLES ........................................................................................................................... x
LIST OF FIGURES ......................................................................................................................... x
LIST OF ACRONYMS .................................................................................................................... x
1 INTRODUCTION ................................................................................................................ 1-1
1.1 BACKGROUND ......................................................................................................... 1-1
1.2 STUDY AREA ............................................................................................................ 1-2
1.3 PURPOSE AND OUTLINE OF THIS REPORT .......................................................... 1-2
2 METHODOLOGY ............................................................................................................... 2-1
2.1 EXISTING HYDROLOGY AND DECISION SUPPORT SYSTEMS ............................ 2-1
2.2 NATURAL HYDROLOGY .......................................................................................... 2-1
2.3 PRESENT DAY HYDROLOGY .................................................................................. 2-5
2.3.1 Afforestation ................................................................................................. 2-5
2.3.2 Alien invasive plants ..................................................................................... 2-5
2.3.3 Irrigation ....................................................................................................... 2-7
2.3.4 Urban and rural water requirements and return flows ................................... 2-8
3 RESULTS ........................................................................................................................... 3-1
4 REFERENCES ................................................................................................................... 4-1
APPENDIX A: COMMENTS REPORT ....................................................................................... A-1
Determination of Water Resource Classes and Resource Quality Objectives for the Water Resources in the Mzimvubu Catchment
Project No. WP 11004 / River Desktop EWR and Modelling Report: Volume 1 – Systems Modelling
Page x
LIST OF TABLES
Table 2.1 Hydrology source per catchment .................................................................. 2-3
Table 2.2 Afforestation and AIP areas.......................................................................... 2-6
Table 2.3 Irrigation areas ............................................................................................. 2-7
Table 2.4 Urban/rural water requirements and return flows .......................................... 2-9
Table 3.1 Summary of natural and present day flows ................................................... 3-1
LIST OF FIGURES
Figure 1.1 Project Plan for the Mzimvubu Classification study ...................................... 1-1
Figure 1.2 Study area .................................................................................................... 1-4
Figure 2.1 Kinira River System (T33A–T33G) natural MAR comparison ....................... 2-2
Figure 2.2 Tsitsa River System (T35A–T35K) natural MAR comparison ....................... 2-3
Figure 2.3 Location of EWR sites and biophysical nodes .............................................. 2-4
LIST OF ACRONYMS
AIP Alien Invasive Plants
AsgiSA-EC Accelerated and Shared Growth Initiative for South Africa-Eastern Cape
BHNR Basic Human Needs Reserve
CMA Catchment Management Agency
DWA Department of Water Affairs (name change from DWAF after April 2009)
DWAF Department of Water Affairs and Forestry
DWS Department of Water and Sanitation (name change from DWA after May 2014)
EWR Ecological Water Requirements
FS Feasibility Study
GIS Global Information System
MAR Mean Annual Runoff
NFEPA National Freshwater Ecosystem Priority Areas project
PD Present Day
RQOs Resource Quality Objectives
RUs Resource Units
STATS SA Statistics South Africa
ToR Terms of Reference
WMA Water Management Area
WR2005 Water Resources of South Africa 2005
WR2012 Water Resources of South Africa 2012
WRCS Water Resource Classification System
WRSM2000 Water Resources Simulation Model 2000
WRYM Water Resources Yield Model
WTW Water Treatment Works
WWTW Waste Water Treatment Works
Determination of Water Resource Classes and Resource Quality Objectives for the Water Resources in the Mzimvubu Catchment
Project No. WP 11004 / River Desktop EWR and Modelling Report: Volume 1 – Systems Modelling
Page 1-1
1 INTRODUCTION
1.1 BACKGROUND
The Department of Water and Sanitation (DWS) initiated this study to determine Water Resource
Classes and associated RQOs for the Mzimvubu catchment in Water Management Area (WMA) 7.
The main aims of the project, as defined by the Terms of Reference (ToR), is to undertake the
following:
� Coordinate the implementation of the Water Resource Classification System (WRCS) as
required in Regulation 810 in Government Gazette 33541 dated 17 September 2010, by
classifying all significant water resources in the Mzimvubu catchment,
� determine Resource Quality Objectives (RQOs) using the DWS’s procedures to determine
and implement RQOs for the defined classes, and
� review work previously done on Ecological Water Requirements (EWRs) and the Basic
Human Needs Reserve (BHNR) and assess whether suitable for the purposes of
Classification.
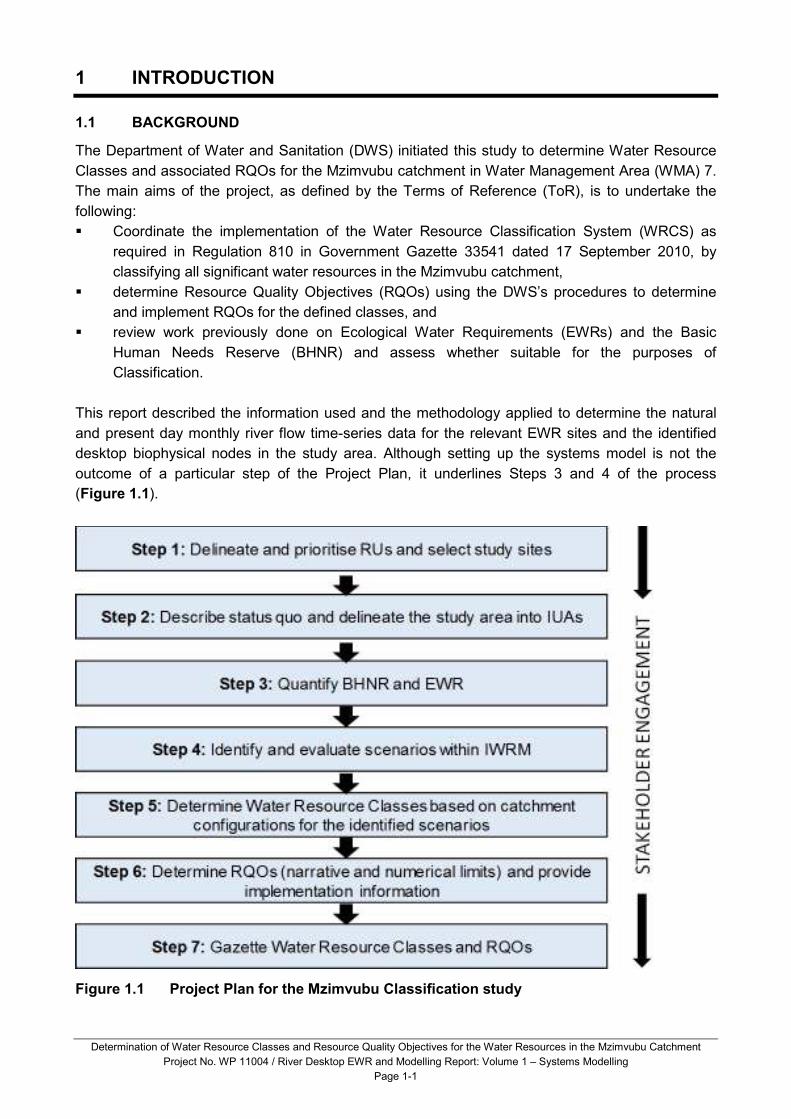
This report described the information used and the methodology applied to determine the natural
and present day monthly river flow time-series data for the relevant EWR sites and the identified
desktop biophysical nodes in the study area. Although setting up the systems model is not the
outcome of a particular step of the Project Plan, it underlines Steps 3 and 4 of the process
(Figure 1.1).
Figure 1.1 Project Plan for the Mzimvubu Classification study

Determination of Water Resource Classes and Resource Quality Objectives for the Water Resources in the Mzimvubu Catchment
Project No. WP 11004 / River Desktop EWR and Modelling Report: Volume 1 – Systems Modelling
Page 1-2
1.2 STUDY AREA
The study area is represented by the Mzimvubu catchment which consists of the main Mzimvubu
River, with the Tsitsa (Figure 1.2), Thina, Kinira and Mzintlava rivers as the main tributaries and
the estuary at Port St Johns. The river reaches sizeable proportions after the confluence of these
four tributaries in the Lower Mzimvubu area, approximately 120 km from its source, where the
impressive Tsitsa Falls can be found near Shawbury Mission. The Mzimvubu catchment and river
system lies along the northern boundary of the Eastern Cape and extends for over 200 km from its
source in the Maloti-Drakensberg watershed on the Lesotho escarpment to the estuary at Port St
Johns. The catchment is in Primary T, comprises of T31–36 and stretches from the Mzimkhulu
River on the north-eastern side to the Mbashe and Mthatha river catchments in the south. The
Mzimvubu River catchment is within the WMA 7, i.e. the Mzimvubu to Tsitsikamma WMA.
The catchment covers more than two million hectares in the Eastern Cape and is comprised of
almost 70% communal land. The Mzimvubu River system has been prioritised nationally as being
one of the few remaining ‘near-natural rivers’ (NFEPA Assessment; Nel et al., 2011), but the
catchment is classified as vulnerable as a result of rapid rates of degradation in the watershed,
primarily caused by erosion due to poor land management and highly erodible soils.
The WMA is relatively well endowed with water resources, with most occurring in the eastern part
of the area. Of the current usage in the WMA, the most significant by far is agriculture via irrigation.
The next largest use is by municipalities. No major instream dams occur along the main rivers,
however the only dams of any significant size being:
� Mountain Lake Dam [Mvenyane River (T31H)],
� Crystal Springs Dam [Mzintlava River (T32C)],
� Mountain Dam [Keneka River (T33A)],
� Belfort Dam [(Mafube River (T33A)]
� Ntenetyana Dam [Ntenetyana River (T33G)],
� Ugie Dam [Wildebees River (T35F)],
� Nquadu Dam (T35K),
� Majola Dam (T36B),
� Mount Fletcher Dam (T34C),
� Maclear Dam (T35D), and
� Forest Dam (T33H).
Some remnant catchment dams exist in the Ongeluksnek valley and on the commercial farms in
the margins of the Cedarville flats, but this is not a common practice in traditional farming systems
(ERS/CSA, 2011). However, there are a number of instream abstraction weirs.
1.3 PURPOSE AND OUTLINE OF THIS REPORT
The purpose of the Systems Modelling Report is to present the information used and the
methodology applied to determine the natural and present day monthly river flow time-series data
for the relevant EWR sites and the identified desktop biophysical nodes in the study area
(Figure 2.3). This information is required for the ecological assessments to be undertaken by the
study.

Determination of Water Resource Classes and Resource Quality Objectives for the Water Resources in the Mzimvubu Catchment
Project No. WP 11004 / River Desktop EWR and Modelling Report: Volume 1 – Systems Modelling
Page 1-3
The report outline is as follows:
� Section 2 describes the methodology applied to determine the natural and present day
flows.
� A summary of the natural and present day flow results are presented in Section 3.
� References are listed in Section 4.
Figure 1.2 represents the study area.

Determination of Water Resource Classes and Resource Quality Objectives for the Water Resources in the Mzimvubu Catchment
Project No. WP 11004 / River Desktop EWR and Modelling Report: Volume 1 – Systems Modelling
Page 1-4
Figure 1.2 Study area

Determination of Water Resource Classes and Resource Quality Objectives for the Water Resources in the Mzimvubu Catchment
Project No. WP 11004 / River Desktop EWR and Modelling Report: Volume 1 – Systems Modelling
Page 2-1
2 METHODOLOGY
2.1 EXISTING HYDROLOGY AND DECISION SUPPORT SYSTEMS
A review of the various past and current studies in the study area was undertaken as part of the
status quo assessment to confirm the availability and status of both the hydrology and water
resource models available.
The DWS Water Resources Yield Model (WRYM) was configured for the entire Mzimvubu
catchment by the DWAF (2009) study in support of the AsgiSA-EC Mzimvubu Development
Project, which was conducted prior to the feasibility study for Ntabelanga Dam. The study made
use of the WR2005 hydrology.
The WRYM model and hydrological data was updated in the recent DWS Feasibility Study for the
Mzimvubu Water Project (DWS, 2014), where it was expected that the confidence of the WRYM
and hydrological data was improved through a detailed hydrological assessment including rainfall
analysis, rainfall-runoff modelling and stochastic streamflow analysis of both the Kinira and Tsitsa
rivers.
The hydrology common to both projects was compared to understand the difference, and the latest
checked and accepted hydrology was integrated with the Mzimvubu Development Project WRYM
configuration (WR2005 hydrology) for the remaining portion of the Mzimvubu catchment.
The WR2012 study data also recently became available (in 2016), which is an update of the
WR2005 data. At the time of this study the WR2012 had not created the irrigation, afforestation
and streamflow reduction water use files that are required to determine the present day developed
flows. As a result the WR2012 hydrology was not used for this study.
2.2 NATURAL HYDROLOGY
The natural flow forms the baseline against which all scenarios will be assessed. The natural
hydrology was sourced from the DWAF (2009) study in support of AsgiSA-EC’s Mzimvubu
Development Project study and the more recent DWS Feasibility Study for the Mzimvubu Water
Project (DWS, 2014).
A comparison of the updated natural hydrology for the Kinira and Tsitsa River systems against the
WR2005 and WR2012 data (for reference purposes) was undertaken to gain an understanding of
the differences and the related reasons for the differences.
The comparison results for the Kinira River System (T33A–T33G) are presented in Figure 2.1.
From the results it can be seen that the total WR2005 and WR2012 MARs are very similar (total
difference of 3%) while the DWS Feasibility Study is substantially higher (47% higher than the
WR2005).
The major differences appear in T33E, T33F and T33G and further investigation showed that the
catchment rainfall was noticeably higher in these quaternaries, especially in T33E (79 vs 20 Mm3)
and T33F (146 vs 52 Mm3).

Determination of Water Resource Classes and Resource Quality Objectives for the Water Resources in the Mzimvubu Catchment
Project No. WP 11004 / River Desktop EWR and Modelling Report: Volume 1 – Systems Modelling
Page 2-2
The hydrology was calibrated at gauging station T3H002 (T33A, T33B, T33C and T33D outflow)
with a record period of 45 years, and T3H007 (T33G outflow) with a shorter record period of 16
years. The MAR comparison of the three information sources seem tolerable for T33A, T33B,
T33C and T33D (unit mm runoff were also compared), but the DWS Feasibility Study MAR is
noticeably higher for the quaternaries between T3H002 and T3H007, i.e. T33E, T33F and T33G.
The calibration at T3H007 was undertaken for a very short record period of 17 years, which also
coincided with the wettest period of the rainfall record, and these calibration factors were then
applied to the entire 89-year record period (1920–2009).
The findings presented above contributed to the excessively high DWS Feasibility MAR for T33E,
T33F and T33G quaternaries. As a result, the DWS Feasibility Study hydrology for the Kinira River
System was regarded as unacceptable.
Figure 2.1 Kinira River System (T33A–T33G) natural MAR comparison
The comparison results for the Tsitsa River System (T33A–T33G) are presented in Figure 2.2.
From the results it can be seen that the total WR2012 MAR is slightly higher than WR2005 MARs
(5%) while the DWS Feasibility Study (FS) MAR is about 9% higher than the WR2012 MAR.
The catchment rainfall, calibrations and unit runoffs (mm runoff) were checked and based on the
findings, the DWS Feasibility Study hydrology was accepted for the Tsitsa River system.
97
94
52
61
21
52
61
43
8
96
93
60
51
20
52
61
43
3
98
82
51
51
79
14
6
13
5
64
2
0
100
200
300
400
500
600
700
T33A T33B T33C T33D T33E T33F T33G Total
Na
ura
l M
AR
(m
illi
on
m3/a
)
WR2005 WR2012 DWS Feasibility Study

Determination of Water Resource Classes and Resource Quality Objectives for the Water Resources in the Mzimvubu Catchment
Project No. WP 11004 / River Desktop EWR and Modelling Report: Volume 1 – Systems Modelling
Page 2-3
Figure 2.2 Tsitsa River System (T35A–T35K) natural MAR comparison
A summary of the accepted natural hydrology for each of the catchments is presented in Table 2.1.
The Thina hydrology and associated WRYM network configuration was integrated with the SA-EC
Mzimvubu Development Project WRYM configuration.
Table 2.1 Hydrology source per catchment
Catchment Accepted hydrology source
Mzimvubu (T31A–T31J) DWAF, 2009
Mzintlava (T32A–T32H) DWAF, 2009
Kinira (T33A–T33G) DWAF, 2009
Thina (T34A–T34K) DWAF, 2009
Tsitsa (T35A–T35M) DWS, 2014
Mzimvubu (T36A–T36B) DWAF, 2009
The hydrology was generally available at a quaternary level resolution and was downscaled
linearly where the catchment area of the EWRs and biophysical nodes (defined as part of this
Classification study) are less than the existing catchment areas, i.e. hydrological parameters
scaled down in proportion to the area reduction. The location of the EWR sites and biophysical
nodes are illustrated in Figure 2.3.
92
78
87
53
10
3
58
64
85
40
86
74
6
96
81
98
55
10
6
61
68
88
42
89
78
5
99
70
11
0
55
10
6
73
70
11
5
47
11
1
85
6
0
100
200
300
400
500
600
700
800
900
T35A T35B T35C T35D T35E T35F T35G T35H T35J T35K Total
Na
tura
l M
AR
(m
illi
on
m3/a
)
WR2005 WR2012 FS

Determination of Water Resource Classes and Resource Quality Objectives for the Water Resources in the Mzimvubu Catchment
Project No. WP 11004 / River Desktop EWR and Modelling Report: Volume 1 – Systems Modelling
Page 2-4
Figure 2.3 Location of EWR sites and biophysical nodes

Determination of Water Resource Classes and Resource Quality Objectives for the Water Resources in the Mzimvubu Catchment
Project No. WP 11004 / River Desktop EWR and Modelling Report: Volume 1 – Systems Modelling
Page 2-5
2.3 PRESENT DAY HYDROLOGY
The integrated WRYM was generally configured at a quaternary level, which was also downscaled
where the catchment area of the EWRs and biophysical nodes (defined as part of this
Classification study), was less than the quaternaries to ensure that the present day flows can be
generated at these points.
The WRYM was updated with the latest catchment development or land use information available
in order to produce the best possible estimates of present day flow. The land use components
included are listed below and each of them are described in more detail in subsequent sections:
� Afforestation
� Alien invasive plants (AIP)
� Irrigation
� Urban/Rural water requirements and return flows
The large dams and the so-called smaller farm dams were also included in the WRYM setup. The
smaller dams were incorporated to include the effect of irrigation from farm dams, as well as the
effect of multiple small dams’ regulation in streamflow and loss of water by evaporation from the
dam surfaces. The subsequent result is a reduction in water yield from water resource
developments downstream of these dams. This information was sourced from the DWAF (2009)
AsgiSA-EC Mzimvubu Development Project for the entire study area, with the exception of the
Tsitsa catchment, which was sourced from the DWS Feasibility Study (DWS, 2014).
The present day flows were then generated using the configured WRYM with all the catchment
development information incorporated at the required resolution.
2.3.1 Afforestation
Commercial forestry has been declared a streamflow reduction activity and reduces baseflow in
rivers. Existing forestry water use therefore needed to be considered in determining the present
day flows.
The afforestation information was adopted from DWS Feasibility Study (DWS, 2014) for the Tsitsa
catchments and from the DWAF (2009) AsgiSA-EC Mzimvubu Development Project WRYM for the
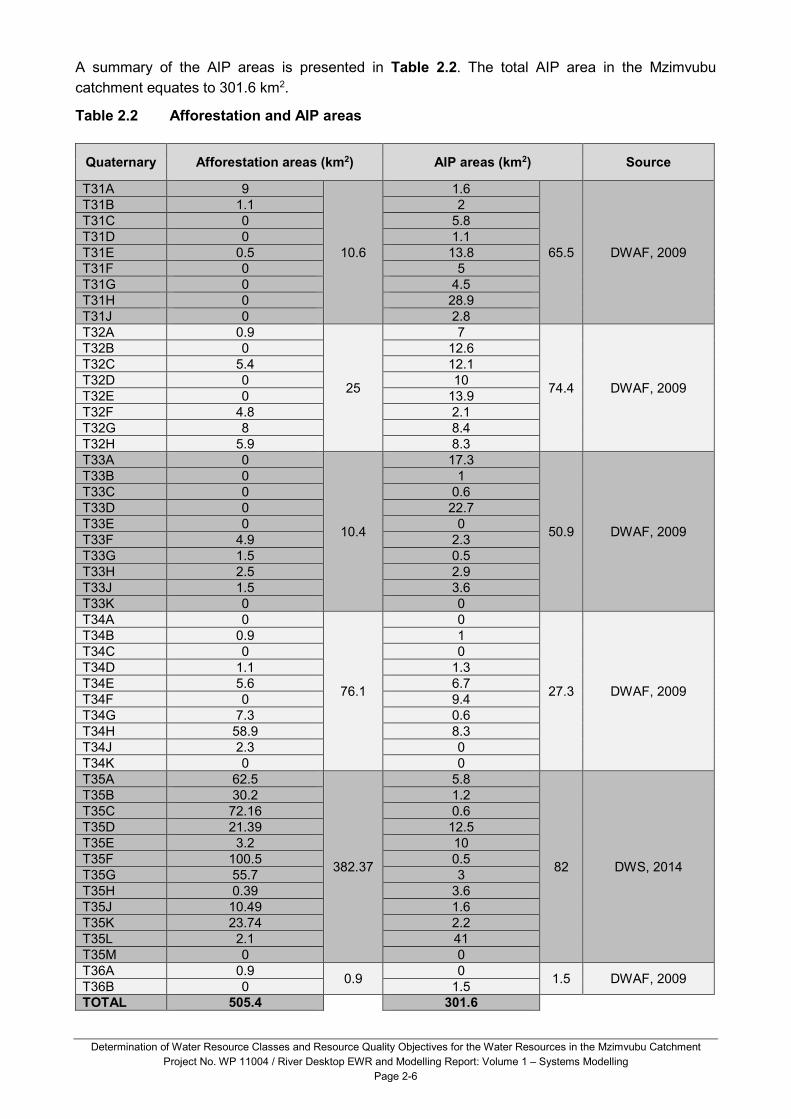
remainder of the study area. A summary of the afforestation areas is presented in Table 2.2. The
total afforestation in the study area equates to 505.37 km2 and is predominantly concentrated in
the middle to upper portion of the Tsitsa River catchment.
The GIS afforestation shapefiles were sourced and utilised where catchment areas were
downscaled to accommodate the EWRs and biophysical nodes.
2.3.2 Alien invasive plants
Alien invasive plants (AIPs), particularly those in the riparian zones, also cause a reduction of
baseflow in rivers. The areas of invasive alien vegetation were obtained from the DWS Feasibility
Study (DWS, 2014) for the Tsitsa catchments and from the DWAF (2009) AsgiSA-EC Mzimvubu
Development Project WRYM for the remainder of the Mzimvubu catchment and the effects of the
alien vegetation on water resources were included in this study’s present day estimates.
Determination of Water Resource Classes and Resource Quality Objectives for the Water Resources in the Mzimvubu Catchment
Project No. WP 11004 / River Desktop EWR and Modelling Report: Volume 1 – Systems Modelling
Page 2-6
A summary of the AIP areas is presented in Table 2.2. The total AIP area in the Mzimvubu
catchment equates to 301.6 km2.
Table 2.2 Afforestation and AIP areas
Quaternary Afforestation areas (km2) AIP areas (km2) Source
T31A 9
10.6
1.6
65.5 DWAF, 2009
T31B 1.1 2
T31C 0 5.8
T31D 0 1.1
T31E 0.5 13.8
T31F 0 5
T31G 0 4.5
T31H 0 28.9
T31J 0 2.8
T32A 0.9
25
7
74.4 DWAF, 2009
T32B 0 12.6
T32C 5.4 12.1
T32D 0 10
T32E 0 13.9
T32F 4.8 2.1
T32G 8 8.4
T32H 5.9 8.3
T33A 0
10.4
17.3
50.9 DWAF, 2009
T33B 0 1
T33C 0 0.6
T33D 0 22.7
T33E 0 0
T33F 4.9 2.3
T33G 1.5 0.5
T33H 2.5 2.9
T33J 1.5 3.6
T33K 0 0
T34A 0
76.1
0
27.3 DWAF, 2009
T34B 0.9 1
T34C 0 0
T34D 1.1 1.3
T34E 5.6 6.7
T34F 0 9.4
T34G 7.3 0.6
T34H 58.9 8.3
T34J 2.3 0
T34K 0 0
T35A 62.5
382.37
5.8
82 DWS, 2014
T35B 30.2 1.2
T35C 72.16 0.6
T35D 21.39 12.5
T35E 3.2 10
T35F 100.5 0.5
T35G 55.7 3
T35H 0.39 3.6
T35J 10.49 1.6
T35K 23.74 2.2
T35L 2.1 41
T35M 0 0
T36A 0.9 0.9
0 1.5 DWAF, 2009
T36B 0 1.5
TOTAL 505.4 301.6
Determination of Water Resource Classes and Resource Quality Objectives for the Water Resources in the Mzimvubu Catchment
Project No. WP 11004 / River Desktop EWR and Modelling Report: Volume 1 – Systems Modelling
Page 2-7
2.3.3 Irrigation
Irrigation water requirements are strongly linked to land tenure systems present in the catchment.
The catchment can be roughly divided into two land tenure sectors, namely sector one, which is
the old Natal and Eastern Cape regions of the catchment outside of the former Transkei borders,
and sector two is the former Transkei region of the catchment.
Sector one is characterised by commercial agricultural and irrigation operations, while sector two is
characterised by state-owned land mostly administered through the tribal land tenure system, and
subsistence agriculture.
Irrigation expansions have been prominent in the Mzimvubu (T31A–T31J) and Mzintlava (T32A–
T32H) catchments, which prompted further investigations as part of this study. Information on the
irrigation areas and crop mixes here adopted from the following studies:
� This study: Mzimvubu (T31A–T31J), Mzintlava (T32A–T32H) and Mzimvubu (T36A–T36B)
� DWS Feasibility Study (DWS, 2014): Kinira (T33A–T33G) and Tsitsa (T35A–T35M)
� DWAF (2009) AsgiSA-EC Mzimvubu Development Project: Thina (T34A–T34K)
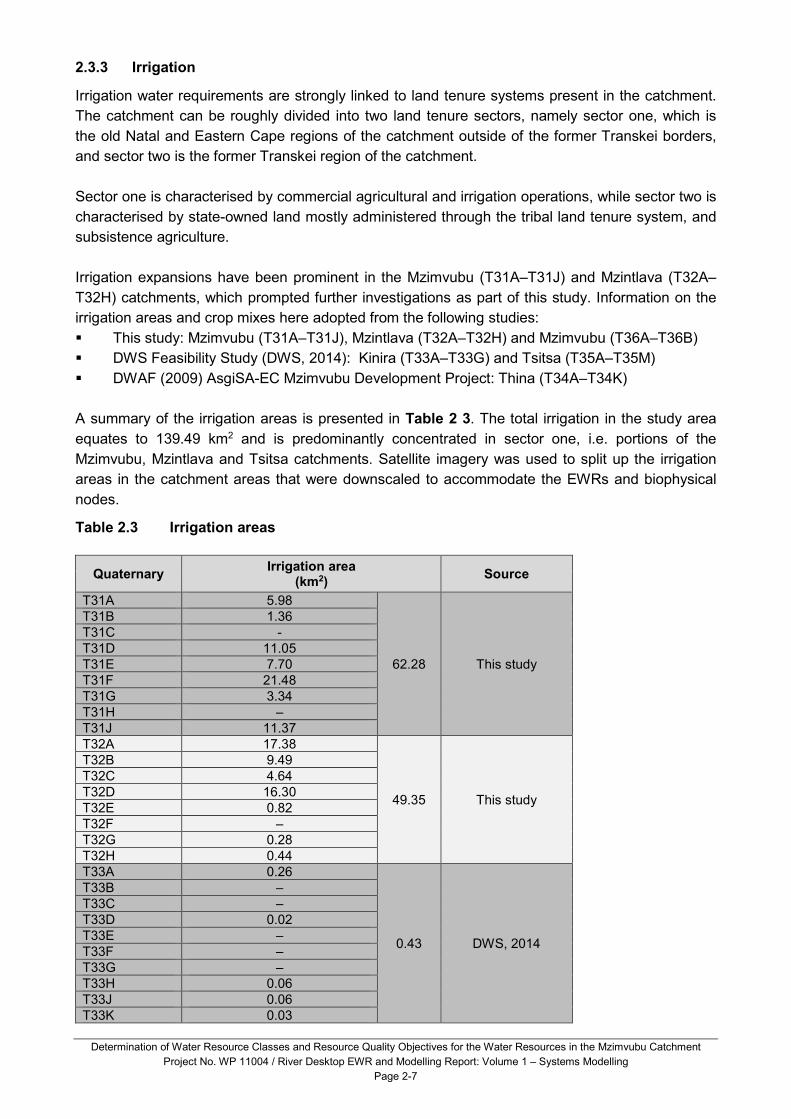
A summary of the irrigation areas is presented in Table 2 3. The total irrigation in the study area
equates to 139.49 km2 and is predominantly concentrated in sector one, i.e. portions of the
Mzimvubu, Mzintlava and Tsitsa catchments. Satellite imagery was used to split up the irrigation
areas in the catchment areas that were downscaled to accommodate the EWRs and biophysical
nodes.
Table 2.3 Irrigation areas
Quaternary Irrigation area
(km2) Source
T31A 5.98
62.28 This study
T31B 1.36
T31C -
T31D 11.05
T31E 7.70
T31F 21.48
T31G 3.34
T31H –
T31J 11.37
T32A 17.38
49.35 This study
T32B 9.49
T32C 4.64
T32D 16.30
T32E 0.82
T32F –
T32G 0.28
T32H 0.44
T33A 0.26
0.43 DWS, 2014
T33B –
T33C –
T33D 0.02
T33E –
T33F –
T33G –
T33H 0.06
T33J 0.06
T33K 0.03

Determination of Water Resource Classes and Resource Quality Objectives for the Water Resources in the Mzimvubu Catchment
Project No. WP 11004 / River Desktop EWR and Modelling Report: Volume 1 – Systems Modelling
Page 2-8
Quaternary Irrigation area
(km2) Source
T34A 0.06
0.72 DWAF, 2009
T34B 0.06
T34C 0.09
T34D 0.09
T34E 0.06
T34F 0.06
T34G 0.09
T34H 0.12
T34J 0.03
T34K 0.06
T35A 0.4
20.23 DWS, 2014
T35B 2.03
T35C –
T35D 1.02
T35E –
T35F 0.09
T35G 16.56
T35H 0.1
T35J –
T35K –
T35L –
T35M 0.03
T36A 5.00 6.48 This study
T36B 1.48
TOTAL 139.49
2.3.4 Urban and rural water requirements and return flows
Information on urban and rural water use within the catchment was obtained from the following
sources.
� DWAF (2009) study supporting the AsgiSA-EC Mzimvubu Development Project
� Development of Reconciliation Strategies for All Towns (DWS, 2015)
� Census 2011 (STATS SA, 2012)
� DWA Blue Drop (DWA, 2012a)
� DWA Green Drop (DWA, 2012b)
The DWAF (2009) AsgiSA-EC Mzimvubu Development Project investigated rural water and urban
water use throughout the study area, which was incorporated into the WRYM configuration. The
DWS feasibility study did not include any urban or rural water use.
The approach followed was to use the DWAF (2009) urban and rural water use as the base source
of information, which was then updated with information from the DWS Development of
Reconciliation Strategies for All Towns study (DWS, 2015) where available (all urban areas and
some rural areas were updated). Information from the DWS Blue Drop report (DWA, 2012a) was
also used to confirm the production volumes of the Water Treatment Works (WTW). The water use
information from the different sources was for different dates or time stamps, which were then
projected to a common present day date (2014) by using the Census 2011 municipal 2001–2011
population growth rates (STATS SA, 2012). Where water requirement projections for the specific
demand centre were unavailable, water use was assumed to remain constant for the demand
centres located in municipalities where the Census 2001–2011 population growth was negative
(conservative approach).
Determination of Water Resource Classes and Resource Quality Objectives for the Water Resources in the Mzimvubu Catchment
Project No. WP 11004 / River Desktop EWR and Modelling Report: Volume 1 – Systems Modelling
Page 2-9
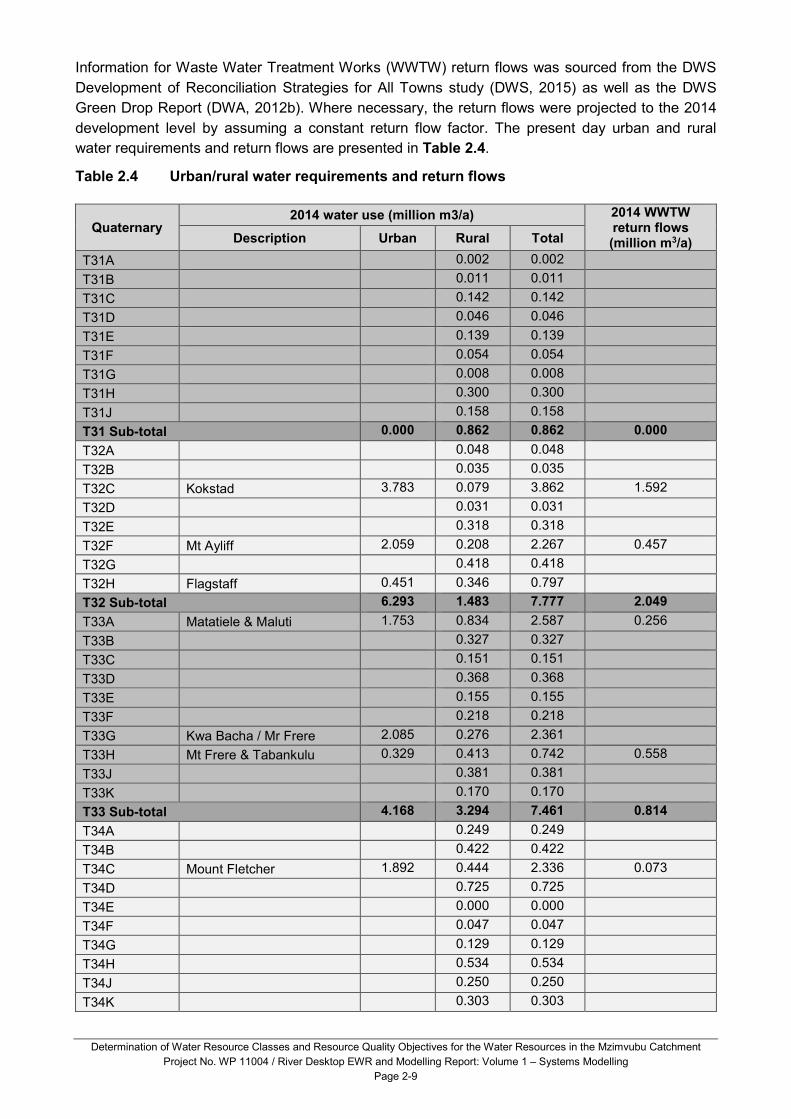
Information for Waste Water Treatment Works (WWTW) return flows was sourced from the DWS
Development of Reconciliation Strategies for All Towns study (DWS, 2015) as well as the DWS
Green Drop Report (DWA, 2012b). Where necessary, the return flows were projected to the 2014
development level by assuming a constant return flow factor. The present day urban and rural
water requirements and return flows are presented in Table 2.4.
Table 2.4 Urban/rural water requirements and return flows
Quaternary 2014 water use (million m3/a) 2014 WWTW
return flows (million m3/a) Description Urban Rural Total
T31A 0.002 0.002
T31B
0.011 0.011
T31C
0.142 0.142
T31D
0.046 0.046
T31E
0.139 0.139
T31F
0.054 0.054
T31G 0.008 0.008
T31H
0.300 0.300
T31J
0.158 0.158
T31 Sub-total 0.000 0.862 0.862 0.000
T32A 0.048 0.048
T32B
0.035 0.035
T32C Kokstad 3.783 0.079 3.862 1.592
T32D
0.031 0.031
T32E
0.318 0.318
T32F Mt Ayliff 2.059 0.208 2.267 0.457
T32G
0.418 0.418
T32H Flagstaff 0.451 0.346 0.797
T32 Sub-total 6.293 1.483 7.777 2.049
T33A Matatiele & Maluti 1.753 0.834 2.587 0.256
T33B
0.327 0.327
T33C
0.151 0.151
T33D
0.368 0.368
T33E
0.155 0.155
T33F
0.218 0.218
T33G Kwa Bacha / Mr Frere 2.085 0.276 2.361
T33H Mt Frere & Tabankulu 0.329 0.413 0.742 0.558
T33J
0.381 0.381
T33K
0.170 0.170
T33 Sub-total 4.168 3.294 7.461 0.814
T34A
0.249 0.249
T34B
0.422 0.422
T34C Mount Fletcher 1.892 0.444 2.336 0.073
T34D
0.725 0.725
T34E
0.000 0.000
T34F
0.047 0.047
T34G 0.129 0.129
T34H
0.534 0.534
T34J 0.250 0.250
T34K
0.303 0.303

Determination of Water Resource Classes and Resource Quality Objectives for the Water Resources in the Mzimvubu Catchment
Project No. WP 11004 / River Desktop EWR and Modelling Report: Volume 1 – Systems Modelling
Page 2-10
Quaternary 2014 water use (million m3/a) 2014 WWTW
return flows (million m3/a) Description Urban Rural Total
T34 Sub-total 1.892 3.104 4.996 0.073
T35A 0.088 0.088
T35B 0.000 0.000
T35C Maclear 1.057 0.000 1.057 0.311
T35D 0.082 0.082
T35E
0.272 0.272
T35F Ugie 1.017 0.000 1.017 0.215
T35G
0.052 0.052
T35H
0.286 0.286
T35J
0.177 0.177
T35K Tsolo, Qumbo etc. 0.478 0.567 1.045
T35L 0.317 0.317
T35M
0.190 0.190
T35 Sub-total 2.552 2.031 4.583 0.526
T36A
0.312 0.312
T36B Port St. Johns 0.023 0.232 0.255
T36 Sub-total 0.023 0.544 0.567 0.000
Total 14.928 11.317 26.246 3.462

Determination of Water Resource Classes and Resource Quality Objectives for the Water Resources in the Mzimvubu Catchment
Project No. WP 11004 / River Desktop EWR and Modelling Report: Volume 1 – Systems Modelling
Page 3-1
3 RESULTS
A summary of the natural and present day flows derived by applying the methodologies presented
in Section 2.2 and Section 2.3, and at EWR sites and Resource Units where EWR estimates are
required, are presented in Table 3.1. The results confirm the Mzimvubu River system’s relatively
undeveloped or ‘near-natural’ status. The most significant land use contributing to the lower
present day flows is agriculture via irrigation, followed by the urban and rural or municipal water
use, afforestation and AIPs. No major instream dams occur along the main rivers, with the only
dams (approximately 10) of any significant size being used to support municipal requirements.
The hydrology, natural and present day time-series files for each of the sites and the Mzimvubu
WRYM setup are available in electronic format on the study database.
Table 3.1 Summary of natural and present day flows
EWR Site / Resource
Unit
Natural MAR (million m3/a)
Present Day MAR (million m3/a)
% Present Day MAR of Natural MAR
MzimEWR1 438.0 413.2 94.3%
MzimEWR2 404.5 393.2 97.2%
MzimEWR3 407.1 399.3 98.1%
MzimEWR4 2655.1 2532.2 95.4%
T31-1 32.7 31.3 95.5%
T31-2 31.3 29.9 95.6%
T31-3 87.0 83.5 96.0%
T31-4 8.9 8.8 98.9%
T31-5 104.9 100.3 95.6%
T31-6 14.0 11.9 85.3%
T31-7 12.8 12.7 99.5%
T31-8 29.5 27.7 93.9%
T31-9 4.0 4.0 99.4%
T31-11 3.7 3.4 92.4%
T31-12 190.5 178.3 93.6%
T31-13 217.8 204.9 94.1%
T31-14 24.0 21.4 89.4%
T31-15 40.8 37.9 92.9%
T31-16 13.6 13.5 99.1%
T31-17 1.3 1.3 100.0%
T31-18 64.8 61.8 95.4%
T31-19 335.7 316.5 94.3%
T32-1 9.5 8.8 92.7%
T32-2 37.6 31.9 84.9%
T32-3 11.08 10.743 97.0%
T32-4 4.3 4.1 96.6%
T32-5 13.9 13.1 94.9%
T32-6 86.2 75.4 87.5%
T32-7 8.5 8.2 95.9%
T32-8 18.4 16.6 90.2%
T32-9 98.1 88.1 89.8%
T32-10 134.5 120.4 89.6%

Determination of Water Resource Classes and Resource Quality Objectives for the Water Resources in the Mzimvubu Catchment
Project No. WP 11004 / River Desktop EWR and Modelling Report: Volume 1 – Systems Modelling
Page 3-2
EWR Site / Resource
Unit
Natural MAR (million m3/a)
Present Day MAR (million m3/a)
% Present Day MAR of Natural MAR
T32-11 223.2 205.3 92.0%
T32-12 57.2 55.4 96.9%
T32-13 348.9 326.9 93.7%
T33-1 20.4 19.6 95.8%
T33-2 26.3 26.2 99.5%
T33-3 97.4 94.8 97.3%
T33-4 33.9 33.9 99.8%
T33-5 69.8 69.4 99.4%
T33-6 94.3 93.7 99.4%
T33-7 303.0 296.4 97.8%
T33-8 6.2 6.1 99.5%
T33-9 368.3 360.8 98.0%
T33-10 15.6 15.1 97.3%
T33-11 14.0 12.1 86.1%
T33-12 17.1 16.9 99.1%
T33-13 9.2 8.6 93.6%
T33-14 No estimate required as extrapolated from MzimEWR4 using the WRYM
T34-1 33.6 33.5 99.7%
T34-2 32.9 32.6 99.2%
T34-3 41.1 40.9 99.4%
T34-4 68.1 67.4 99.0%
T34-5 123.5 120.1 97.2%
T34-6 20.3 20.2 99.3%
T34-7 45.2 44.4 98.2%
T34-8 84.7 83.3 98.4%
T34-9 27.1 22.5 83.1%
T34-10 20.1 19.0 94.5%
T34-11 11.9 11.3 95.2%
T34-12 18.2 17.1 93.9%
T35-1 101.1 97.6 96.5%
T35-2 79.7 78.4 98.3%
T35-3 63.7 61.5 96.6%
T35-4 127.6 111.9 87.7%
T35-5 46.1 43.9 95.2%
T35-6 37.6 33.7 89.6%
T35-7 26.1 24.0 91.9%
T35-8 14.3 9.7 67.7%
EWR Inxu1 44.4 39.4 88.8%
EWR Inxu2 57.2 49.7 87.0%
EWR GAT1 2.9 1.5 51.9%
EWR GAT2 10.9 8.1 74.8%
T35-9 35.1 34.4 98.2%
T35-10 19.87 19.72 99.3%
T35-11 29.76 29.18 98.1%
T35-12 18.1 17.6 97.0%
T35-13 14.7 14.3 96.8%
T35-14 36.2 33.4 92.1%
T35-15 10.2 10.1 98.8%
Determination of Water Resource Classes and Resource Quality Objectives for the Water Resources in the Mzimvubu Catchment
Project No. WP 11004 / River Desktop EWR and Modelling Report: Volume 1 – Systems Modelling
Page 3-3
EWR Site / Resource
Unit
Natural MAR (million m3/a)
Present Day MAR (million m3/a)
% Present Day MAR of Natural MAR
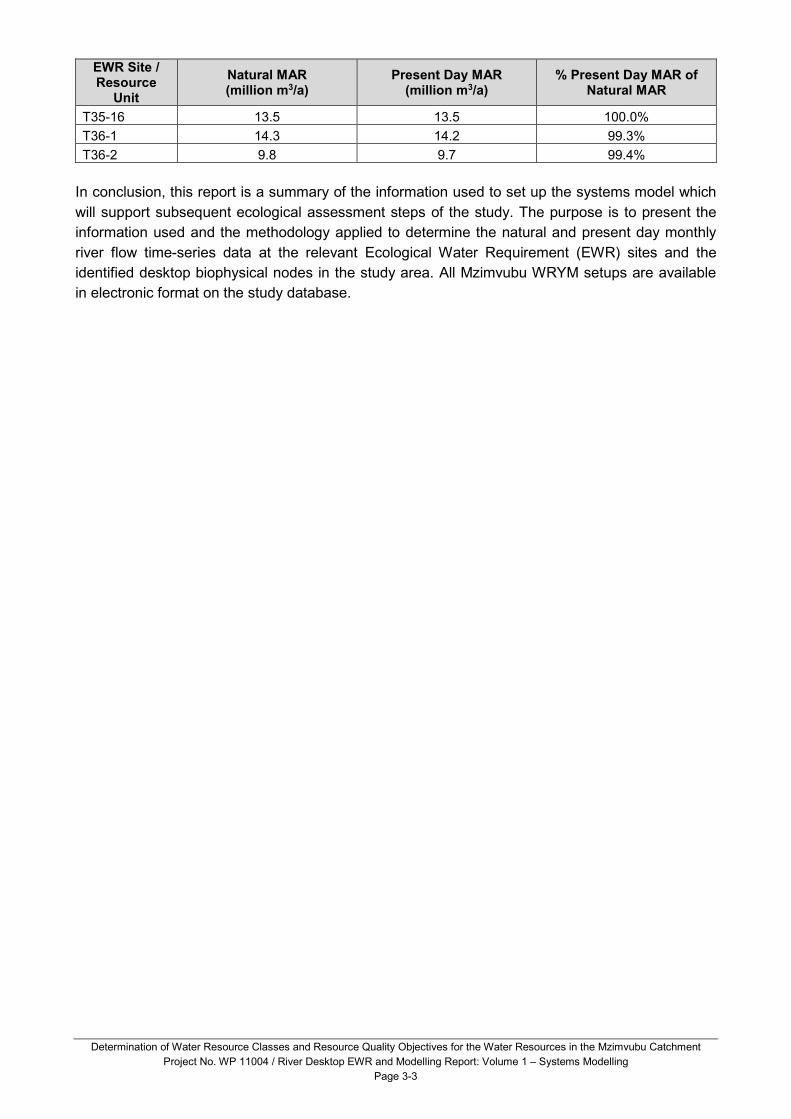
T35-16 13.5 13.5 100.0%
T36-1 14.3 14.2 99.3%
T36-2 9.8 9.7 99.4%
In conclusion, this report is a summary of the information used to set up the systems model which
will support subsequent ecological assessment steps of the study. The purpose is to present the
information used and the methodology applied to determine the natural and present day monthly
river flow time-series data at the relevant Ecological Water Requirement (EWR) sites and the
identified desktop biophysical nodes in the study area. All Mzimvubu WRYM setups are available
in electronic format on the study database.

Determination of Water Resource Classes and Resource Quality Objectives for the Water Resources in the Mzimvubu Catchment
Project No. WP 11004 / River Desktop EWR and Modelling Report: Volume 1 – Systems Modelling
Page 4-1
4 REFERENCES
Department of Water Affairs (DWA). South Africa 2012a. Blue Drop Report. Prepared by DWA,
Pretoria, South Africa.
Department of Water Affairs (DWA). South Africa 2012b. Green Drop Report. Prepared by DWA,
Pretoria, South Africa.
Department of Water Affairs and Forestry (DWAF), South Africa. 2009. DWAF Water Resource
Study in Support of the AsgiSA-EC Mzimvubu Development Project. Prepared by BKS (Pty) Ltd.
For: DWS Directorate: National Water Resources Planning. Report No: P WMA 12/000/00/3609,
Pretoria, South Africa.
Department of Water and Sanitation (DWS), South Africa. 2014. Feasibility Study for the Mzimvubu
Water Project: Water Resources. Prepared by Jeffares & Green (Pty) Ltd for DWS Directorate:
Options Analysis. Report No: P WMA 12/T30/00/5212/5, Pretoria, South Africa.
Department of Water and Sanitation (DWS), South Africa. 2015. Development of Reconciliation
Strategies for All Towns in the Southern Planning Region. Prepared by Umvoto for DWS
Directorate: National Water Resources Planning, Pretoria, South Africa.
Environmental and Rural Solutions – Conservation South Africa (ERS/CSA). 2011. Umzimvubu
overview. December 2011, Draft 2.
Nel, J.L., Murray, K.M., Maherry, A.M., Petersen, C.P., Roux, D.J., Driver, A., Hill, L., van
Deventer, H., Funke, N., Swartz, E.R., Smith-Adao, L.B., Mbona, N., Downsborough, L., and
Nienaber, S. 2011. Technical Report for the National Freshwater Ecosystem Priority Areas Project.
WRC Report No. 1801/2/11.
Statistics South Africa (STATS SA), 2012. Census. 2011. Published by Statistics South Africa,
Pretoria, 2012.

Determination of Water Resource Classes and Resource Quality Objectives for the Water Resources in the Mzimvubu Catchment
Project No. WP 11004 / River Desktop EWR and Modelling Report: Volume 1 – Systems Modelling
Page A-1
APPENDIX A: COMMENTS REPORT
Page / Section
Report statement Comments Changes made?
Author comment
DWS Project Management Committee – 7 April 2017
Report Editorial comments Yes Addressed throughout.
Page iv, Exec Summary
Add:
• Information about the number of EWRs and RUs so that when you discuss them under results one has already been introduced to the subject.
• Briefly explain the relationship between the nodes and EWR sites.
• Explain the next step which will guide readers of what is likely going to happen.
Yes Text added as required.
Section 1.1: General
Change Section name to “Background” Yes
Pg 1-1 It would help to add a little bit of information pertaining to which step we are at; what that step entails and what is the expected outcome.
Yes
Pg 2-1
“As a result the WR2012
hydrology was not considered for
the study.”
The discussion of WR2012 is confusing because
you mentioned that this was not considered but
the information discussed here indicates that you
used it somehow. Why say you did not consider
it then come down and say something contrary?
Yes
The text has been changed to clarify that the WR2012 information that became available in 2016 was considered, but not used.
Chapter 3
Vol 1 of the Water Resource classification
system guideline, part 7.1.2.1.1 (page 21)
outlines what a river node table should look like.
I don’t get it in this report? I expected to get that
information under results.
No
The guideline documents present an outline of what information should be contained in a river node table. It is not prescriptive as to exactly what such a table should look like.
Page 3-3 Add a Conclusion Yes

Determination of Water Resource Classes and Resource Quality Objectives for the Water Resources in the Mzimvubu Catchment
Project No. WP 11004 / River Desktop EWR and Modelling Report: Volume 1 – Systems Modelling
Page A-2
Page / Section
Report statement Comments Changes made?
Author comment
Isa Thompson – 20 April 2017
Report
Example: “..was configured for the entire Mzimvubu catchment by the ASGISA-EC Mzimvubu Development Project”.
Please correct the reference to this study throughout all reports and presentations. It was a DWAF (2009) study, in support of the AsgiSA-EC study.
Yes Reference to the study changed throughout the document.