fisheries research report no. 151, 2005 - · pdf filefisheries research report no. 151, 2005...
TRANSCRIPT

FISHERIES RESEARCH REPORT NO. 151, 2005
Biology and stock assessment of the thickskin (sandbar) shark, Carcharhinus plumbeus,
in Western Australia and further refinement of the dusky shark, Carcharhinus obscurus, stock assessment
Final FRDC Report – Project 2000/134
R. McAuley, R. Lenanton*, J. Chidlow, R. Allison and E. Heist*Principal Investigator
Fisheries Research DivisionWestern Australian Fisheries and Marine Research Laboratories
PO Box 20 NORTH BEACHWestern Australia 6920
Fisheries Research and Development Corporation
Australian Government

2 Fisheries Research Report [Western Australia] No. 151, 2005
Fisheries Research ReportTitles in the fisheries research series contain technical and scientific information that represents an important contribution to existing knowledge, but which may not be suitable for publication in national or international scientific journals.
Fisheries Research Reports may be cited as full publications. The full citation is:McAuley, R., Lenanton, R., Chidlow, J., Allison, R. and Heist, E. 2005. Biology and stock assessment of the thickskin (sandbar) shark, Carcharhinus plumbeus, in Western Australia and further refinement of the dusky shark, Carcharhinus obscurus, stock assessment, Final FRDC Report – Project 2000/134, Fisheries Research Report No. 151, Department of Fisheries, Western Australia, 132p.
Numbers 1-80 in this series were issued as Reports. Numbers 81-82 were issued as Fisheries Reports, and from number 83 the series has been issued under the current title.
EnquiriesDepartment of Fisheries3rd floor The Atrium168-170 St George’s TerracePERTH WA 6000Telephone (08) 9482 7333Facsimile (08) 9482 7389Website: http://www.fish.wa.gov.au
Published by Department of Fisheries, Perth, Western Australia. December 2005.ISSN: 1035 - 4549 ISBN: 1 877098 75 2
An electronic copy of this report will be available at the above website where parts may be shown in colour where this is thought to improve clarity.
Fisheries Research in Western AustraliaThe Fisheries Research Division of the Department of Fisheries is based at the Western Australian Fisheries and Marine Research Laboratories, PO Box 20, North Beach (Perth), Western Australia, 6920. The Fisheries and Marine Research Laboratories serve as the centre for fisheries research in the State of Western Australia.
Research programs conducted by the Fisheries Research Division and laboratories investigate basic fish biology, stock identity and levels, population dynamics, environmental factors, and other factors related to commercial fisheries, recreational fisheries and aquaculture. The Fisheries Research Division also maintains the State data base of catch and effort fisheries statistics.
The primary function of the Fisheries Research Division is to provide scientific advice to government in the formulation of management policies for developing and sustaining Western Australian fisheries.

Fisheries Research Report [Western Australia] No. 151, 2005 �
Contents
NoN TechNical Summary ...........................................................................................5
Objectives ..........................................................................................................................6
Outcomes achieved to date................................................................................................6
1.0 BackgrouNd ..............................................................................................................8
1.1 Western Australian shark fisheries.............................................................................8
1.2 Dusky and sandbar shark catch histories .................................................................10
2.0 Need ..............................................................................................................................12
3.0 oBjecTiveS ................................................................................................................12
4.0 meThodS .....................................................................................................................13
4.1 Biology of Carcharhinus plumbeus .........................................................................134.1.1 Data collection and sampling ................................................................................... 1�
4.1.2 Movement ................................................................................................................ 14
4.1.� Age and growth ........................................................................................................ 16
4.1.3.1 Vertebral sample collection ....................................................................... 164.1.3.2 Vertebral processing and analysis.............................................................. 164.1.3.3 Growth rate estimation using tagging data ............................................... 174.1.3.4 Validation of growth band periodicity and seasonality ............................. 18
4.1.4 Reproduction ............................................................................................................ 19
4.1.5 Diet ........................................................................................................................... 20
4.1.6 Stock discrimination ................................................................................................ 21
4.2 Mortality and exploitation of sandbar, dusky and related oceanic shark species ..224.2.1 Determining valid catch and effort in the target fisheries ....................................... 22
4.2.1.1 Temperate demersal gillnet and longline fisheries .................................... 224.2.1.2 Northern shark fisheries .......................................................................... 24
4.2.2 Species composition of shark catches in non-target fisheries ................................. 244.2.2.1 Pilbara Fish Trawl ..................................................................................... 244.2.2.2 Northern inshore gillnet fisheries ............................................................. 25
4.2.� Gillnet mesh selectivity of sandbar sharks .............................................................. 274.2.3.1 Data collection ......................................................................................... 27
4.2.4 Natural mortality ...................................................................................................... 29
4.2.5 Fishing mortality ...................................................................................................... �14.2.5.1 Sandbar sharks ........................................................................................... 314.2.5.2 Dusky sharks .............................................................................................. 33
4.� Stock assessment .....................................................................................................�44.�.1 Demographic analysis of Carcharhinus plumbeus .................................................. 34
4.�.2 Refining the dusky shark, Carcharhinus obscurus, stock assessment .................... �5
5.0 reSulTS .......................................................................................................................37
5.1 Biology of Carcharhinus plumbeus .........................................................................�7

4 Fisheries Research Report [Western Australia] No. 151, 2005
5.1.1 Distribution and regional size structure ................................................................... �7
5.1.2 Movement ................................................................................................................ 40
5.1.� Age and growth ........................................................................................................ 445.1.3.1 Validation of growth band periodicity and seasonality ............................. 445.1.3.2 Vertebral analysis ....................................................................................... 465.1.3.3 Estimation of growth rates from tagging data .......................................... 48
5.1.4 Reproductive biology ............................................................................................... 495.1.4.1 Male Reproductive Biology ........................................................................ 495.1.4.2 Female Reproductive Biology .................................................................... 51
5.1.5 Diet ........................................................................................................................... 54
5.2 Mortality and exploitation of sandbar, dusky and related oceanic shark species ..565.2.1 Catch and effort in the target fisheries ..................................................................... 56
5.2.1.1 Temperate demersal gillnet and longline fisheries .................................... 565.2.1.2 Northern shark fisheries ............................................................................. 61
5.2.2 Non target fisheries elasmobranch catches .............................................................. 645.2.2.1 Pilbara Fish Trawl ..................................................................................... 645.2.2.2 Northern Inshore gillnet fisheries .............................................................. 67
5.2.� Gillnet mesh selectivity of Carcharhinus plumbeus................................................ 71
5.2.4 Natural mortality ...................................................................................................... 76
5.2.5 Age-specific rates of fishing mortality .................................................................... 785.2.5.1 Sources of tag capture data ........................................................................ 785.2.5.2 Tag captures and fishing mortality rates ................................................... 79
5.� Stock Assessment .....................................................................................................825.�.1 Demographic analysis of the WA sandbar stock ..................................................... 82
5.�.2 Alternative management options for the WA sandbar fishery ................................. 84
5.�.� Refining the dusky shark, Carcharhinus obscurus, stock assessment .................... 875.3.3.1 Biological parameters ................................................................................ 875.3.3.2 Natural mortality rates ............................................................................... 895.3.3.3 Tag non-reporting rates .............................................................................. 915.3.3.4 Fishing mortality ........................................................................................ 925.3.3.5 Demographic analysis ................................................................................ 93
6.0 coNcluSioNS ............................................................................................................96
7.0 BeNefiTS .....................................................................................................................99
8.0 ackNowledgemeNTS ..........................................................................................99
9.0 refereNceS ............................................................................................................100
10.0 aPPeNdiceS .............................................................................................................103Appendix I Carcharhinus plumbeus demographic analysis results. ...................................... 10�
Appendix II Demographic analysis results for hypothetical rates of Carcharhinus plumbeus fishing mortality ................................................................................. 107
Appendix III Carcharhinus plumbeus demographic analysis results ....................................... 109
Appendix IV Summary of new management arrangements for the WA target-shark fisheries .. 122
Appendix V Genetic population structure of Western Australian sandbar shark (Carcharhinus plumbeus) based on nuclear DNA microsatellite loci ................ 127

Fisheries Research Report [Western Australia] No. 151, 2005 5
Biology and stock assessment of the thickskin (sandbar) shark, Carcharhinus plumbeus, in Western Australia and further refinement of the dusky shark, Carcharhinus obscurus, stock assessment
Final FRDC Report – Project 2000/134
Principal investigator: Rod Lenanton
address: Department of Fisheries Research Division PO Box 20 North Beach Western Australia, 6920 Telephone: (08) 920� 2111 Facsimile: (08) 920� 0199
email: [email protected]
Non Technical Summary
The purpose of this project was to collect the biological and fishery information necessary to conduct a stock assessment of the sandbar (known locally as ‘thickskin’) shark, Carcharhinus plumbeus and to improve and update the existing stock assessment for the dusky shark, Carcharhinus obscurus. Results from this project have already been used by the Western Australian Department of Fisheries to determine appropriate management arrangements for the State’s shark fisheries to ensure the sustainable exploitation of these species. Results have also assisted the WA target-shark fisheries in conducting Ecologically Sustainable Development (ESD) assessment in order to meet Department of Environment and Heritage ecological assessment requirements for maintaining the fisheries’ export approval.
During the mid to late 1990s, changes in targeting practices of vessels operating in the west coast zone of the temperate WA target-shark fisheries caused rapidly escalating sandbar shark catches. By 1998, sandbar sharks had overtaken dusky sharks as the primary component of the west coast fishery’s catch and had become the �rd largest component of the temperate fisheries’ total catch. At the same time, a demersal longline fishery, targeting sandbar shark off the Pilbara and Kimberley coasts began to develop and sandbar catches also began to increase dramatically in the State’s north. Given this species’ demonstrated vulnerability to overfishing, a formal assessment of the status of this stock and sustainable levels of exploitation became imperative.
The current project therefore collected the biological and fishery-related data that was necessary for accurate stock assessment and developed assessment models appropriate for this long-lived species. Extensive sampling was undertaken in the target fisheries, as well as in those fisheries that were identified as having a significant bycatch of sharks. Additional research was conducted through a series of cruises on board the WA Department of Fisheries research vessels Flinders and Naturaliste. Commercial sampling involved the collection of operational data from the various fisheries, e.g. fishing locations, dates, set times, depths, gear characteristics, etc., as well as identifying and measuring catches, collection of biological data

6 Fisheries Research Report [Western Australia] No. 151, 2005
and samples and tagging large numbers of sharks. Fishery independent sampling allowed data to be collected from areas in which commercial vessels are prohibited from operating, in areas where commercial fishers choose not to operate and with fishing gear-types in areas where commercial vessels are not permitted to use them.
Previous FRDC funded research into WA’s shark stocks (projects 9�/067 and 96/1�0) focussed on the traditional target species of the State’s temperate target-shark fisheries, i.e. dusky shark, C. obscurus, gummy shark, Mustelus antarcticus, and whiskery shark, Furgaleus macki. One of the key findings of this previous research was that, whilst the exploitation of dusky sharks in the target fisheries was likely to be sustainable, their sustainability was dependent on a very low level of mortality of older sharks outside the temperate shark fisheries. Since this research was undertaken, several potential and developing sources of adult dusky shark mortality were identified. Consequently, the assumption that there was a negligible level of exploitation of older dusky sharks could no longer be relied upon and further advice on the status of this species was required. In addition, it was necessary to update the biological parameters and exploitation rates used in the previous assessment with new data, derived from project 96/1�0 and the current study.
Objectives
1 Study the biology of sandbar sharks in Western Australian waters, including:
(i) Movement patterns
(ii) Age and growth
(iii) Reproductive biology
(iv) Diet
(v) Stock Discrimination
2 Determine the level of mortality and exploitation of sandbar, dusky and related oceanic shark species in Western Australian waters by all fishing methods
3 Conduct stock assessments, including risk assessment of management options for sandbar sharks and refine the assessment of the status of the dusky shark stock.
Outcomes achieved to date
All biological and fishery data for sandbar and dusky sharks have been collected, analysed and incorporated into stock assessments. Results from these assessments have been used to develop and implement new management arrangements for the Western Australian target shark fisheries. Key results of this project are outlined below.
Western Australian C. plumbeus were found to attain smaller maximum sizes and sizes at maturity than have been reported for this species elsewhere. The stock is mainly distributed between Cape Leveque (16º �0’S, 12�ºE) in the north and Point D’Entrecasteaux (116ºE) on the south coast. Juvenile sharks tended to occur in temperate waters, while mature-sized sharks predominantly occurred in tropical waters. Unlike other regions, juveniles were found in offshore continental shelf waters rather than shallow waters of estuaries and marine embayments. Sharks are born at 40-45 cm FL during autumn after a 12 month gestation. Parturition appears to occur throughout the stock’s range, although the majority of observed neonates were caught in temperate latitudes. Mean litter size was 6.5 embryos, 60% of which were females.

Fisheries Research Report [Western Australia] No. 151, 2005 7
Vertebral growth bands were validated as being formed annually in sharks up to 17 years by analysis of calcein-marked centrum sections. Due to the high variability in the observed growth of tagged sharks, growth rates determined from vertebral analysis were judged to provide a more reliable description of age and growth than those derived from the tagging data. Males were estimated to reach maturity at approximately 14 years and females at 16. Maximum age was estimated to be between �0 and 40 years of age. Additional reproductive data for dusky sharks (Carcharhinus obscurus) obtained during this project indicated that females of this species takes longer to reach maturity (ca. �0 years) than previously believed (ca. 19 years).
Tagging data indicated that juvenile sandbar sharks born in the south west of the State remained in temperate waters for several years and slowly migrated northwards to join the breeding stock in the north-west as sub-adults or adults. Due to the broad size-selectivity of the mesh sizes used in the temperate ‘shark’ fisheries and the relative abundance of most juvenile age-classes in waters off the southern half of the west coast of Western Australia, demersal gillnet catches of sandbar sharks were primarily comprised of sharks of between 2 and 10 years of age. The catch in the WA North Coast Shark Fishery, however, contained mainly adult-sized sharks. The area between Steep Point and North West Cape, which has effectively been closed to shark fishing since 199�, was found to afford no significant or long-term protection to this stock.
Demographic analysis confirmed that the WA sandbar shark population has a very limited biological capacity to withstand fishing mortality. Using stochastically estimated biological and natural mortality parameters, the stock was estimated to have a potential rate of population growth of 0.025 (2.5%) per year, in the absence of fishing. This is at the lower end of population growth rate estimates for this species and indicates that the stock is more susceptible to population depletion than previously thought. Furthermore, the estimated generation and population doubling times of approximately 2� years, indicated a lengthy recovery period for the stock should it be reduced to lower than acceptable levels. The best estimates of age-specific fishing mortality resulted in population growth rates of -�.2% per year, -0.9% per year and -4.9% per year in 2001/02, 2002/0� and 200�/04, respectively, and were predicted to result in population growth of –7.8% per year in 2004/05.
Several potential combinations of fishing mortality that would deliver neutral or positive population growth rates were identified from the demographic model. As both of the target fisheries (temperate demersal gillnet and longline fishery and the WA North Coast Shark Fishery) contributed to the over-exploitation of this stock, appropriate levels of harvest in either fishery could not be determined independently of the other. The model indicated that to achieve the capacity for positive growth in the population, and thus reverse the current declining trend in this stock, major reductions in fishing mortality are necessary in both of the target fisheries, unless the fishing mortality in one or other fishery is reduced to zero.
Re-assessment of the status of the dusky shark, Carcharhinus obscurus, using the new demographic analysis techniques developed for sandbar sharks also indicated that this stock is less resilient to fishing than was previously estimated. However, the model also indicated that the rates of age-specific fishing mortality experienced by sharks released as neonates in 1994 and 1995 were probably sustainable, as long as there was negligible additional fishing mortality (less than 1-2% per year) outside the temperate demersal gillnet and longline fisheries. The lower estimate of the sustainable level of external fishing mortality is in keeping with recent analyses of dusky shark CPUE data from the demersal gillnet and longline fisheries, which indicate that the breeding stock of dusky sharks has been in decline for some years and has caused a reduction in recruitment of neonates to the fishery.

8 Fisheries Research Report [Western Australia] No. 151, 2005
1.0 Background
1.1 Western Australian shark fisheries
Commercial shark fishing began in Western Australia in 1941 with a single boat setting demersal longlines in the Leschenault Inlet, primarily targeting the gummy shark, Mustelus antarcticus (Whitely, 194�). The fishery expanded throughout the late 1940s and early 1950s to other ports including Albany, Fremantle and Geraldton but remained a largely part-time occupation for most fishers. Throughout the 1960s, demersally set multifilament gillnets began to replace longlines as the preferred method for catching shark and catches rose steadily until the early 1970s, when public concern over the level of mercury in shark flesh contributed to a dramatic decrease in demand for shark (Heald, 1987; Simpfendorfer and Donohue, 1998). Following research carried out by the WA Fisheries Department, the WA Health Department introduced regulations in 1974 prohibiting the sale of shark flesh with mercury concentrations in excess of 0.5 parts per million (Hancock and Edmonds, 1977) and consumer confidence gradually returned. As the market for shark flesh began to recover and the introduction of new management regulations restricted vessels’ access to other fisheries, effort in the shark fisheries began to rise dramatically.
Throughout the 1980s, shark fishing became an increasingly full-time occupation. Operators began using larger and faster vessels equipped with satellite navigation systems and colour sounders, which enabled them to operate further offshore and in areas that had previously been out of range. Additionally, monofilament gillnets and powered net-reels significantly increased the amount of net that fishers were able to operate. Fishing effort was previously reported to have peaked in 1987 at 787,000 km gillnet hours, more than four times the effort exerted in 1980. However, this is now thought to be an unrealistically high estimate due to the likelihood of some operators overestimating their fishing effort as they tried to demonstrate an established use of the shark resource ahead of proposed management of the fishery.
Increased fishing effort, together with declining catch rates, prompted the introduction of the first management plan for Western Australia’s shark fishery in 1988. Under an agreement between the State and Commonwealth governments, the area between ��°S (Cape Bouvard) and the South Australian border (Figure 1.1.) was declared the Joint Authority Southern Demersal Gillnet and Demersal Longline Limited Entry Fishery (JASDGDLF). This fishery was split into 2 zones: Zone 1 between ��°S and Chatham Island (116° �0’E) and Zone 2 from Chatham Island (116° �0’E) to the W.A./S.A. border (129°E). Entry to this fishery was restricted to fishers who could demonstrate a historical use of the stock and access is currently limited to 57 licenses. Effort in the newly managed fishery was limited by the allocation of time/gear units, with each unit allowing an operator to use 600m of demersal gillnet or 200 longline hooks for one month. As a result of two FRDC-funded research projects (no. 9�/067 and no. 96/1�0), stock assessments for the three main shark species caught by this fishery (dusky sharks, Carcharhinus obscurus; gummy sharks, Mustelus antarcticus; and whiskery sharks, Furgaleus macki) were conducted in the mid-late 90s. These indicated that stocks were either fully or over exploited. Consequently, as a means of reducing effort in the JASDGDLF, the amount of fishing gear that each unit allows has gradually been reduced to 270m of net or 90 hooks (45% of the original allowance).

Fisheries Research Report [Western Australia] No. 151, 2005 9
110˚E 125˚E120˚E115˚E
35˚S
20˚S
15˚S
25˚S
30˚S
WANCSF
JANSF
Closedarea
WCDGDLF
JASDGDLFZone2JASDGDLF
Zone1
NorthWestCape
CapeBouvard
Geraldton
Fremantle
Albany
ChathamIs.
SteepPoint
CapeLeveque
Figure 1.1. BoundariesoftheWesternAustraliantarget-sharkfisheries.Abbreviations: JASDGDLF=JointAuthoritySouthernDemersalGillnetandDemersalLongline Fishery;JANSF=JointAuthorityNorthernSharkFisheryWANCSF=Western AustralianNorthCoastSharkFishery;WCDGDLF=WestCoastDemersalGillnet andDemersalLonglineFishery.
Following the restriction of shark fishing in southern waters, the amount of demersal gillnet effort north of ��° S increased steadily during the late 1980s and early 1990s. The first regulation of shark fishing on the west coast occurred in 199�, when the area between Steep Point (26° �0’S) and North West Cape was closed to shark fishing in an attempt to protect breeding stocks of dusky sharks, Carcharhinus obscurus, (Simpfendorfer and Donohue, 1998). An interim management plan for the West coast fishery, based on the JASDGDLF plan, was introduced in 1997. This plan designated the area between Cape Bouvard and North West Cape as the West Coast Demersal Gillnet and Demersal Longline (Interim Managed) Fishery (WCDGDLF) giving it similar management arrangements to the JASDGDLF, although the northern sector remained closed. Access to the west coast fishery was limited to 26 licenses.
In 1995, under the Offshore Constitutional Settlement, management of the Australian northern shark fishery was handed to the respective state and territory authorities under Joint Authority agreements. The management boundaries of the Western Australian north coast shark fisheries depend upon the type of gear used. The WA State government was charged with managing dropline fishing for shark from longitude 114°06′E to the WA/NT border (129°E) and longline fishing for shark from longitude 114°06′E to 12�°45′E as the WA North Coast Shark Fishery (WANCSF). Management of longline and gillnet fishing for shark from longitude 12�°45′E to the WA/NT border was undertaken by Joint Authority between Western Australia and the Commonwealth as the Joint Authority Northern Shark Fishery (JANSF).

10 Fisheries Research Report [Western Australia] No. 151, 2005
Catches and fishing effort remained low in the northern shark fisheries until the late 1990s, when larger and better-equipped longline vessels began full-time fishing for sharks in the WANCSF. Despite the flesh from the generally larger sharks caught in this fishery having a low commercial value, effort continued to increase in the WANCSF as more dedicated shark longline vessels entered the fishery in response to the high value of shark fins. In September 200�, the use of droplines in the WANCSF was prohibited and the eastern boundary of the State-managed sector was redefined as 12�° 45’. A total of 1� fishers have licensed access to one or more zones of the WA northern shark fisheries.
The combined annual value of the southern and west coast demersal gillnet and longline fisheries during the 2002/0� season, was estimated at approximately $5.5 million (Gaughan and Chidlow, 2005a). For the same period, the combined value of the northern fisheries was estimated to be approximately $1.4 million (Gaughan and Chidlow, 2005b).
1.2 Dusky and sandbar shark catch histories
Catch and effort data have been collected from the Western Australian temperate shark fisheries since 1975. Since reporting began in WA, dusky sharks have been reported using the descriptive name of ‘bronze whaler’, which also includes a small quantity (ca. �%) of the similar, copper shark, (Carcharhinus brachyurus). Bronze whaler catches climbed steadily through the 1970s and early 1980s before beginning to decline in the early 1990s (Figure 1.2.). Until 2001/02, when they were replaced by gummy sharks, bronze whalers were the most important component of the catch, both in terms of weight and value, in the State’s temperate demersal gillnet and longline fisheries. Historically, due to the selectivity of the permitted mesh sizes and the size composition of the stock in the areas of the JASDGDLF and WCDGDLF, most of this catch comprised first year (neonate) and young juvenile sharks. During the mid 1990s, approximately 45% (by weight) of bronze whalers caught in these fisheries were neonates (McAuley, 2004). The total reported catch of bronze whalers in the JASDGDLF and WCDGDLF during 2002/0� was 266.5 tonnes (McAuley, 2004; Gaughan and Chidlow, 2005a), of which 10�.� tonnes were caught in Zone 1 of the southern fishery, 8�.0 tonnes in Zone 2 and 80.1 tonnes in the WCDGDLF.
Year
1975
-76
1977
-78
1979
-80
1981
-82
1983
-84
1985
-86
1987
-88
1989
-90
1991
-92
1993
-94
1995
-96
1997
-98
1999
-00
2001
-02
Cat
ch (
tonn
es w
hole
wt.)
0
100
200
300
400JASDGDLF Zone 1 JASDGDLF Zone 2 WCDGDLF
Figure 1.2. Reportedannual‘bronzewhaler’sharkcatchesintheWesternAustraliantemperate demersalgillnetanddemersallonglinefisheries.

Fisheries Research Report [Western Australia] No. 151, 2005 11
Records of sandbar shark catches in WA began in 1985/86, when the species was given its own code in the Department’s Catch and Effort Statistics Section’s (CAESS) database. However, fishers did not routinely separate their catches of this species until the mid 1990s, thus early records are considered to be underestimated. In the four years preceding 1999, when funding for this project was sought, the total catch of C. plumbeus nearly trebled in Western Australia (Figure 1.�). Since then, the species has been the dominant component of the shark catch in the WCDGDLF and in the developing WANCSF. In 2002-0�, the most recent year for which data are available, the WCDGDLF catch was 1��.7 tonnes (live weight), which constituted �8.9% of the fishery’s total shark catch (McAuley, 2004, Gaughan and Chidlow 2005a). In the same year, the catch of sandbar sharks in the WA North Coast Shark Fishery was 87.7 tonnes (17.9% of the shark catch). The Joint Authority Southern Demersal Gillnet and Demersal Longline Fishery catch remained proportionately small at 29.9 tonnes (�.4%) in 2001/02 and in 2002/0� was zero. However, as sandbar sharks have historically been of minor commercial importance to most southern shark fishers, actual catches in the JASDGDLF are believed to have been somewhat under-estimated due to fishers reporting them as unidentified shark in monthly fishing returns.
Year
1988
-89
1990
-91
1992
-93
1994
-95
1996
-97
1998
-99
2000
-01
2002
-03
Cat
ch (
tonn
es w
hole
wt.)
0
20
40
60
80
100
120
140
160 JASDGDLF WCDGDLF Northern SharkOther commercial
Figure 1.3. ReportedannualsandbarsharkcatchesinWesternAustralianfisheries.
The true level of C. obscurus and C. plumbeus catches by other commercial fishing sectors in Western Australia is harder to ascertain due to identification problems and possible underreporting. In 2002/0�, 55.� tonnes of dusky shark and 9 tonnes of sandbar shark were reported to have been landed by fishers operating outside the target-shark fisheries, virtually all of which was from vessels operating without specific access to other fisheries, referred to as ‘wetline’ catch (McAuley, 2004). However, it is probable that a proportion of the remaining �77 tonnes of other sharks, which included 112 tonnes of unidentified sharks, caught by ‘non-target’ fisheries in 2002/0� were also C. obscurus and C. plumbeus (McAuley, 2004). Additionally, both dusky and sandbar sharks are known components of the bycatch of the Commonwealth-managed Southern and Western Tuna and Billfish (pelagic longline) Fishery (SWTBF) that operates off the Western Australian coast (McAuley, unpublished data). Whilst the reported bycatch of these species in SWTBF log books is currently low, the gear employed in these fisheries is known to be highly suitable for

12 Fisheries Research Report [Western Australia] No. 151, 2005
catching medium to large sized carcharhinid sharks (Stevens and Wayte, 1999; Francis et al., 2000). In earlier years, when this fishery was developing in waters adjacent to the continental shelf and vessels used metal trace wire, it is believed that levels of C. obscurus and C. plumbeus bycatch were considerably higher than are currently reported.
2.0 NeedPresently, no stock assessment for sandbar sharks has been completed in Western Australia. New management arrangements have been proposed for the West Coast Demersal Gillnet and Demersal Longline Fishery, Western Australia’s two Northern shark fisheries and the Commonwealth Tuna and Billfish Fisheries (which could lead to a dramatic increase in longline fishing effort in Western Australia). It is therefore necessary for fisheries managers to have a much better understanding of the catch of sandbar sharks, the status of their stocks and the catch of other long-lived carcharhinids, such as the dusky shark, as a basis for future management decisions.
There is also a need for a methodology to be established on which to base future stock assessments for sandbar sharks. The stock assessment process requires a better understanding of the species’ biology in Western Australia than is currently available. With the northern and western fisheries for sandbar sharks separated by a large closed area, studies of stock discrimination and movement are necessary to determine the appropriate geographic scale for management of this species.
Information relevant to the ongoing sustainable management of the shark stocks is not only important to enable the continued viability of the commercial shark fisheries, but also for the conservation of sharks in recognition of their importance as apex predators in the marine ecosystem and their role in maintaining biodiversity.
The effects of sandbar and dusky shark bycatch in ‘non-shark’ fisheries also need to be quantified and considered in relation to Australia’s national and international conservation responsibilities. If exploitation of these species by non-target fisheries is shown to be unsustainable, the future viability of valuable fisheries (eg. Pilbara Fish Trawl and Southern and Western Tuna and Billfish) may be threatened.
3.0 Objectives1. Study the biology of sandbar sharks in Western Australian waters, including:
(i) Movement patterns
(ii) Age and growth
(iii) Reproductive biology
(iv) Diet
(v) Stock Discrimination
2. Determine the level of mortality and exploitation of sandbar, dusky and related oceanic shark species in Western Australian waters by all fishing methods
3. Conduct stock assessments, including risk assessment of management options or sandbar sharks and refine the assessment of the status of the dusky shark stock.

Fisheries Research Report [Western Australia] No. 151, 2005 1�
4.0 Methods
4.1 Biology of Carcharhinus plumbeus
4.1.1 Data collection and sampling
Sampling for this project was conducted from August 2000 to June 200�, in waters between Admiralty Gulf (14°S, 126°E) in the Kimberley and Albany (�5°S, 118°E) on the south coast. During the project, staff observed 1,195 gillnet sets over 756 days and 540 longline sets over �48 days. The spatial distribution of sampling effort, by each fishing method, is summarised by one degree latitude by one degree longitude blocks in Figure 4.1.a.
In total, 7,�87 Carcharhinus plumbeus were sampled during the current project, from a variety of commercial gillnet and longline fisheries and during a series of fishery-independent longline fishing surveys on board the WA Department of Fisheries’ research vessels Flinders and Naturaliste. As the gear used during research surveys was effectively identical to that used by the commercial longline sector, data from these surveys have been combined with the commercially-derived data, unless specified otherwise. The majority of sampled sharks (n = 5,041) were caught by demersal gillnets deployed from vessels operating in the WCDGDLF and JASDGDLF and a smaller number (n = 2,�46) were caught by demersal longlines deployed from WANCSF vessels and during research surveys. The spatial distribution of samples collected by each fishing method during this project is summarised by one degree latitude by one degree longitude blocks in Figure 4.1.b. In addition to data and samples collected during this project, biological information on C. plumbeus and C. obscurus that was collected by the WA Department of Fisheries’ Shark Research Section during other projects (eg. FRDC projects 9�/067, 96/1�0, 2001/077, 2002/064), has also been included in some of the following analyses. These additional data include 90 sandbar sharks that were either tagged or sampled during a Department of Environment and Heritage (DEH) funded survey of the Pilbara Fish Trawl Fishery (Stephenson and Chidlow, 200�) and 20 gravid females, caught during a WA Department of Fisheries (DOF) drum-line survey off NW Cape in May 2000 (McAuley, unpublished data; Figure 4.1.b). Data from �48 sandbar sharks that were tagged prior to commencement of the current study are also included in tag movement analyses.

14 Fisheries Research Report [Western Australia] No. 151, 2005
120°E115°E 125°E
20°S
15°S
35°S
30°S
NorthWestCape
Perth
Albany
AbrolhosIslands
Eighty-milebeach
CapeLeeuwin
SharkBay
AdmiraltyGulf
(a)
BremmerBay
13
55
2
2
13
49 90
68
5 32
1
4
31 7
4
4 15
9 2 2
201
3
42
26
39
2
103
35
4472
6
8
25
2 7
2 6
2
22
1782
220
4
15
1
1
1381
1301
21610
45
262
4
130
120°E115°E 125°E
20°S
15°S
35°S
30°S
NorthWestCape
Perth
Albany
AbrolhosIslands
Eighty-milebeach
CapeLeeuwin
SharkBay
AdmiraltyGulf
(b)
BremmerBay
213
18
166
16
278
50
27
126
204 664
1841
16
27 29
15623 48
818
37
2
2
44
33
319
917
88
128501
36
1
190
20
30
25
10
1255278
1
70415
328
277
91
1
10
31
19644
12
43
1 2
16
1
Figure 4.1. Spatialdistribution,inonedegreelatitudebyonedegreelongitudeblocks, of(a)samplingeffortand(b)specimencollection,betweenAugust2000andJune2003. Rednumbersindicate(a)numbersofgillnetsetsand(b)numbersofsharkscaughtby gillnets.Blacknumbersindicate(a)numbersoflonglinesetsand(b)numbersofsharks caughtbylonglines.Bluenumbersindicatesamplesizesofsharkscaughtbyfish trawlingandgreennumbersindicatesamplesizesofsharkscaughtbydrum-lines.
Commercial gillnets were constructed of 0.9-1.0 mm diameter monofilament webbing, hung in a combination of 165 mm (6.5”) and 178 mm (7”) stretched mesh sizes with either a 15 or 20 mesh drop. Longlines (commercial and research) comprised size 12/0 J-shaped hooks, baited with mullet (Mugil cephalus) or mackerel (family Scombridae) and attached to their main lines via approximately 2m metal snoods. Gillnets and longlines were set demersally in depth ranges of 0-121 m (mean = 51 m) and 7.5-225 m (mean = 102 m), respectively. Details of trawl net and drumline configurations are given in Stephenson and Chidlow (200�) and Simpfendorfer et al (1999), respectively.
Whenever possible, sharks were sexed and fork length (FL) measured (to the nearest centimetre) as a straight line from the tip of the snout to the fork of the caudal fin. Total lengths (TL) of a subsample of sharks were also measured, as a straight line, along the same axis as fork length, from the tip of the snout to the tip of the caudal fin in its natural position.
4.1.2 Movement
An extensive tagging project, in which 1,759 sharks were tagged, was undertaken between August 2000 and June 2004 to study movements of Carcharhinus plumbeus. Additional data from �48 sandbar sharks, tagged during FRDC project nos. 9�/067 and 96/1�0 between March 1994 and June 1999, were also included in these analyses. Sharks were tagged between Cape Leveque (16° �0’S, 12�°E) and Hopetoun (�4°S, 120°E, Figure 4.2). Release and capture data

Fisheries Research Report [Western Australia] No. 151, 2005 15
were stratified into 4 geographic regions to examine differences in the movements of sharks in different parts of the State. These were: north of 22ºS (North Coast), between 22°S and 29°S (Upper West Coast), between 29°S and �4°S (Lower West Coast) and south and east of �4°S 114°E (South Coast). Prior to release, sharks were sexed, measured and the date, location, and depth of each release were recorded. Sharks were tagged with Jumbo Rototags in the posterior half of their first dorsal fins, at approximately �0-50% of the height of the fin. A subsample of sharks were tagged with both Jumbo Rototags and nylon-headed dart tags, attached at the base of the first dorsal. A second subsample of tagged sharks were injected with either oxytetracyclene (OTC) or calcein, to aid in the validation of age and growth (see 4.1.3.4).
120°E 125°E
20°S
15°S
35°S
30°S
25°S
115°E
>199
100-199
50-99
25-49
<1010-24
Figure 4.2. Releaselocationsof2,107Carcharhinus plumbeus,taggedbetween22/03/94and 15/06/04.
Tag recapture information was received from commercial and recreational fishers, as well as from research staff during commercial and fishery-independent sampling. The return of tag recapture information was encouraged by a State-wide advertising campaign and by the offer of rewards, such as T-shirts and caps. The recapture information requested included the date and location of capture, length, tag number, species, sex, and condition of the shark and tag. To assist in the collection of comprehensive and accurate reporting, commercial fishers and observers were trained how to measure Fork Length, collect vertebral samples and provided with measuring tapes and standardised tag-recapture reporting forms.

16 Fisheries Research Report [Western Australia] No. 151, 2005
4.1.3 Age and growth
4.1.3.1 Vertebral sample collection
Vertebral samples from 680 Carcharhinus plumbeus, ranging in size from 47 to 166cm FL, were collected from both commercial and fishery-independent sources between April 1999 and June 2002. Sharks obtained from commercial catches were caught by demersally-set gillnets (n=�79) and longlines (n=26�). A smaller number of sharks were caught using commercial-specification demersal longlines (n=20) and drum-lines (n=22, for details of drum-line specification see Simpfendorfer et al., 1999), deployed from Western Australian Department of Fisheries research vessels. Gillnets and longlines were fished in depth ranges of 9 m-121 m and 14m-157 m, respectively and drum-lines were fished in depths of between 54 and 100 m. Sampling was conducted between Eighty Mile Beach (20°S 120°E) on the north coast and Cape Leeuwin (�5°S 115°E) in the south west of the State (Figure 4.1). A section of anterior vertebral column was removed from each specimen and stored frozen until being processed.
4.1.3.2 Vertebral processing and analysis
After defrosting vertebral samples, the neural arch, transverse processes (haemal arches) and excess tissue were excised from vertebral samples and the individual centra separated. Centra were soaked in a 5-10% sodium hypochlorite solution for up to sixty minutes, depending on their size, quantity and age of the solution, until all remaining tissue was removed. Clean centra were thoroughly rinsed in fresh water and dried in an oven at 50°C. Three centra from each shark were embedded in polyester casting resin and longitudinal cross-sections of 170 µm thickness were taken from as close to the focus of each centrum as possible, using an Buelher Isomet 5000 variable speed linear precision saw. Sections were mounted on microscope slides with casting resin and digitally photographed through a dissecting microscope under reflected light. Images of centrum sections were viewed and brightness and contrast adjusted using Microsoft Photo Editor �.01. Growth bands (defined as a narrow translucent band and adjacent wide opaque band) were independently counted by three readers, without knowledge of the size, sex or previous results for any shark. Two readers had experience in ageing sharks, while the third had no experience in ageing sharks but was experienced in ageing teleosts. Counts commenced after the birth mark, which was identified by a change of angle on the outer edge of the corpus calcareum and an associated translucent band. The readability of each section was scored according to the definitions in Table 4.1. Sections with a readability score of zero were excluded from further analysis.
Table 4.1. Definitionsofvertebralsectionreadability.
readability definition0 Unreadable.1 Bands visible but difficult to interpret.2 Bands visible but the majority difficult to interpret accurately.3 Bands visible a minority difficult to interpret accurately.4 All bands unambiguous.
A consensus for each reader’s counts of the three centra from each shark was determined using the following criteria: (i) where at least two counts matched, the matching count was taken; (ii) where no counts matched but two counts varied by one, the count with the higher readability was taken; (iii) where no counts matched but two counts varied by one and readability was equal, the final reading, which was made with greater experience in the interpretation of band

Fisheries Research Report [Western Australia] No. 151, 2005 17
formation, was taken. Where a consensus could not be reached, that specimen was excluded from further analysis of that reader’s results. A final consensus of the number of growth bands for each specimen was determined by taking the count that matched in at least two of the consensus counts from each reader.
The index of average percentage error (IAPE) was calculated for each reader’s counts and for the consensus counts according to the method described by Beamish and Fournier (1981):
,
where N is the number of animals aged, R is the number of readings, Xij is the count from the jth animal at the ith reading and Xj is the mean age of the jth animal from i readings.
A form of the von Bertalanffy growth equation that fits the curve to a known size at birth (Simpfendorfer et al., 2000) was fitted to the resulting length at age data:
,
where L0 is the size at birth (42.5 cm FL for both sexes, see 5.1.4.2), LT is the length at time T, L∞ is the asymptotic length and K is the Brody growth coefficient. Including the known size at birth, makes full use of all the empirical data and, to some extent, accounts for the inclusion of fast growing neonate and younger sharks in the length-at-age dataset. The equation was fitted using the non-linear regression function of Sigmaplot 9.0 (Systat, 2004).
Each reader characterised the outer edge of each section as either opaque or translucent, to assist in the determination of the seasonality of band formation (see 4.1.3.4). Consensus on the outer edge condition for each specimen was decided for each reader by taking the condition that matched in at least two readings. A final consensus on outer edge condition was established by taking the condition that matched in at least two of the readers’ consensus readings.
4.1.3.3 Growth rate estimation using tagging data
Release and recapture data from 104 tagged C. plumbeus, which were at liberty for between 1 and 2,72� days (7.5 years), were used to estimate growth rates for comparison with the rates calculated by vertebral analysis. Growth rates were calculated from growth-increment data using the Francis (1988) maximum likelihood method. This method estimates growth of tagged fish based on growth rates, g and gß, at two arbitrary lengths, (70 cm FL) and ß (110 cm FL), so that:
,
where L1 = the length at release and ∆T1 = the period at liberty.

18 Fisheries Research Report [Western Australia] No. 151, 2005
The model also estimates variability in growth rates (v), measurement error and the probability of incorrectly recorded length data, referred to as the contamination probability p. It is assumed that n is normally distributed with a mean of μ and a standard deviation σ and that σ is proportional to µ, such that σ= vµ. Net measurement error at release and recapture is also assumed to be normally distributed with a mean of m and a standard deviation s.
The solver function of Excel (Microsoft, 200�) was used to estimate g , gß, v, µ, σ and p by maximising the likelihood function:
,
where, ,
R = the range of observed growth increments and subscript i refers to the ith fish.
Confidence intervals of parameter estimates were calculated by refitting the model to 500 ‘bootstrapped’ length increment data using the previously described methods. Bootstrapped length increments were generated by randomly selecting from a normal distribution with a mean equal to the predicted growth increment and a standard deviation of vµ. Bootstrapped measurement error data were generated by randomly selecting from a normal distribution with a mean equal of m and a standard deviation of s.
4.1.3.4 Validation of growth band periodicity and seasonality
A subsample of 887 tagged sharks were injected with either oxytetracyclene (OTC, prior to December 2000) or calcein (post December 2000) to mark their vertebral centra for age validation. Both OTC and calcein were injected into the dorsal musculature, anterior to the first dorsal fin and adjacent to the vertebral column. OTC was administered in 25 mg kg-1 dosages and calcein was administered at dosages of �-5 mg kg-1.
Vertebral samples from injected sharks were either returned after capture by commercial fishers or collected by researchers during at sea sampling and prepared according to the previously described sectioning methods (see 4.1.3.2). After mounting marked on microscope slides, they were digitally photographed via a dissecting microscope, firstly under normal reflected light and then under fluorescent light, through an ultra violet (UV) filter. Fluorescent images were then superimposed on their non-fluorescent counterparts using Adobe Illustrator 10.0. The transparency of the fluorescent layer of the composite image was then adjusted, so that the fluorescing mark was visible while banding patterns from the non-fluorescent layer could still be clearly distinguished. The number of complete growth bands after the fluorescing mark were then counted and plotted against time at liberty. The slope of the regression between post-injection band counts and time at liberty equates to the number of bands formed per year.
Sectioned OTC and calcein marked centrum sections were also used to examine the seasonality of growth band formation. Only those sections that exhibited complete opaque and translucent bands from the year in which the section was marked were used and it was assumed that a complete growth band took exactly one year to form. Widths of the opaque and translucent zone from the year in which the shark was tagged and the distance of the OTC/Calcein mark from the beginning of that year’s growth increment (i.e. the start of the opaque band) were
Fisheries Research Report [Western Australia] No. 151, 2005 19
measured along the midline of the corpus calcareum. The times taken to form opaque and translucent bands and the year of tagging growth increment start date were estimated as:
Opaque band formation time (days) = �65 x widthbandt Translucen widthband Opaque
widthband Opaque
+
Translucent band formation time (days) = �65 x widthbandt Translucen widthband Opaque
widthbandt Translucen
+
Increment start date = date tagged –
+
× widthbandt Translucen widthband Opaque
distancemark start toincrement Growth �65
The estimated start dates and duration of growth increment formation were then graphed and compared to examine whether there was any commonality between individuals in seasonality of growth band formation.
4.1.4 Reproduction
Males were examined for clasper length, the degree of clasper calcification and the presence or absence of spermatozoa in the epididymis. Clasper length was measured as the distance from the distal tip of the clasper to the junction with the pelvic fin. Three stages of male maturity were defined, relative to the degree of clasper calcification: immature (uncalcified, where claspers were small and could be easily bent along their entire length), maturing (partially calcified, where claspers had begun to elongate and calcify but could still be bent along most or all of their length) and mature (calcified, where claspers were elongate and could not be bent at all). A subsample of male sharks was dissected to test for the presence or absence of spermatozoa by making a transverse incision across the kidney, thereby severing the epididymis, and running a thumb or finger along the epididymis towards the incision. If a large amount of milky-white fluid was expelled, then spermatozoa were judged to be present.
The length at which 50% of male sharks were mature (L0.5) was calculated as -a/b using the parameters a and b that were estimated by logistic regression analysis of the proportions of mature shark in 2 cm FL size classes. The proportion of mature individuals in each size class (PL) was estimated as:
,
where xL is the mean length of size class L and a and b are parameters that determine the location and shape of this curve. Values of a and b were estimated using the Solver routine in Microsoft Excel to maximise a modified form of the log-likelihood function given by White et al. (2002):
where nL is the number of sharks that were examined in size class L, nm,L is the number of mature sharks in size class L and is the P̂L estimated proportion of mature sharks in size class L.
Ninety five percent confidence intervals were estimated for L0.5 by randomly re-sampling (with replacement) the maturity-at-length data to create 1,000 new ‘bootstrapped’ datasets and then re-fitting the logistic maturity function to each.

20 Fisheries Research Report [Western Australia] No. 151, 2005
Female maturity was defined by a combination of uterine and ovarian development (Table 4.2). Females were considered mature when they were classified as maturity stage of � or higher. The length at which 50% of female sharks were mature (L0.5) and 95% confidence intervals were estimated by logistic regression analysis of the proportions of mature shark in 2 cm FL size classes, as described for males. Where present, the diameter of the largest yolky ovarian ovum was measured (Maximum Ovum Diameter, MOD). In pregnant individuals, the number of embryos in each litter was recorded and the total lengths of all embryos were measured. The sex ratios of embryos, expressed as the proportion of the litter that was female, were also recorded for a subsample of litters.
Table 4.2. Maturitystagesoffemale Carcharhinus plumbeus.
female maturity stage description
1 Uterus very thin along its entire length, empty. Ovary indistinguishable from epigonal organ. Immature.
2 Uterus very thin along most of its length but enlarged posteriorly, empty. Ovary difficult to distinguish from epigonal organ. Maturing.
� Uterus enlarged along its entire length but empty. Ovary clearly distinguishable from epigonal organ and with differentiated ovarian follicles or developing yolky ova. Mature, not pregnant.
4 Uterus containing yolky eggs but no visible embryos on eggs. Ovulatory & post-ovulatory.
5 Uterus containing visible embryos. Pregnant.
6 Uterus enlarged and flaccid, appearing to have just given birth. Umbilical scars may be present. Post partum.
4.1.5 Diet
Dietary data were collected from 2,115 Carcharhinus plumbeus, caught by commercial gillnet and longline vessels and by drumlines and longlines during fishery independent research cruises in Western Australian waters, between December 199� and November 200�. Sharks were sexed and measured as previously described and their stomachs examined. Stomach fullness was visually assessed according to a scale of 0 - 4, with 0 equating to completely empty, 1 being up to ¼ full; 2 being between ¼ and ½ full; � being between ½ and ¾ full and 4 being between ¾ and entirely full. Dietary items were identified to the lowest possible taxa and counted. If prey items could be identified but not accurately counted, they were assumed to be a single item. Consumed bait was excluded from analysis.
The occurrence method (Hyslop 1980) was used to analyse the stomach content data. Individual prey counts were also used to illustrate the actual numbers of prey items retrieved from individual specimens. Prey items were grouped into the following six categories for comparison of diets between sexes, sizes and regions: Cephalopods, Crustaceans, Sharks, Rays & skates, Teleosts and Others. Sharks were grouped into three size-classes : small (< 90 cm FL), medium (90-1�0 cm FL) and large (> 1�0 cm FL) for analysis of size related changes in diet. Data were further separated into three regions: north west (north of latitude 26°S), west coast (between latitudes 26°S and ��°S) and south west (south of latitude ��°S) to compare diets between regions.

Fisheries Research Report [Western Australia] No. 151, 2005 21
Comparison of dietary overlap between sexes, size-classes and regions was performed using the Simplified Morisita Index (CH, Krebs 1989) and Langton’s scale of dietary overlap (Langton, 1982) of CH: low overlap, 0-0.29; medium overlap, 0.�0-0.59; and high overlap; > 0.60. Comparison of prey diversities between sexes, size-classes and regions was undertaken using the Shannon-Weiner Index (H’, Krebs 1989).
4.1.6 Stock discrimination
Blood samples were collected from a total of 102 C. plumbeus, caught in three locations between Broome and Cape Leeuwin (�4.7°S, 115.�°E) during commercial and fishery independent sampling between March 2001 and May 200� (Figure 4.�). Similar sample sizes were obtained from each region and sampling locations within each region were kept as discrete as possible. Each sample, consisted of between 1 and 2ml of blood, fixed with �-4 ml of 100% EtOH.
120°E115°E 125°E
20°S
15°S
35°S
30°S
25°S
Westcoastregionn=32
SouthWestregionn=34
NorthCoastRegionn=36
n=5
n=1n=3
n=27
Figure 4.3. Capturelocationsof102Carcharhinus plumbeus,fromwhichbloodsampleswere collectedforgeneticstockdiscriminationanalyses.
Samples are currently being analysed by Associate Professor Ed Heist (Fisheries and Illinois Aquaculture Center, Southern Illinois University), using microsatellite loci, which he has developed for north western Atlantic C. plumbeus. As results from this work were not complete when the draft of this report was submitted, they have instead been included in this report at Appendix V.

22 Fisheries Research Report [Western Australia] No. 151, 2005
4.2 Mortality and exploitation of sandbar, dusky and related oceanic shark species
4.2.1 Determining valid catch and effort in the target fisheries
4.2.1.1 Temperate demersal gillnet and longline fisheries
Catch and effort data for the temperate demersal gillnet and longline fisheries were derived from monthly fishing returns, submitted to the Department of Fisheries by commercial fishers as a condition of their licenses. Monthly returns, which have been collected from the temperate gillnet and longline fisheries since 1975, are reported in 1° latitude by 1° longitude geographical blocks and are maintained by the Department’s Catch and Effort Statistics Section (CAESS). These data have been validated and corrected as follows.
Definition of valid temperate ‘shark’ fishery dataAs licensing information for the WA temperate ‘shark’ fisheries is only available from 1988 onwards, the Temperate Demersal Gillnet and Demersal Longline Fishery (TDGDLF) was instead defined according to fishing method and area of operation. Prior to 199�, the catch and effort dataset for the TDGDLF includes all gillnet and longline fishing records, excluding those from the estuaries, between the South Australian border and, North West Cape (22°S Latitude 114°E). From 199� onwards, when the area between Steep Point (26° 45’S) and NW Cape was closed to targeted shark fishing, data have been taken from all gillnet and longline records outside estuaries, between the South Australian border and 26°S latitude (i.e. the nearest 1° line of latitude north of Steep Point). Nets with lengths of less than 100 m have been excluded from the dataset to remove misreported non-‘shark fishery’ netting methods (eg. haul nets, beach seines and throw nets), which were occasionally reported as gillnets, particularly in early records.
Correction of effort dataThe accuracy of the CAESS data necessary for calculating gillnet and longline fishery effort, ie net length, days fished, hours fished per day and number of shots per day, were examined and in a relatively small number of records, were found to be incomplete or incorrect, particularly prior to 1989/90. Data validation and correction procedures were therefore developed using Microsoft Access software (Microsoft Corporation), to adjust invalid effort parameters. Wherever possible, missing or invalid data were replaced with the average value observed on that vessel during commercial sampling by Department of Fisheries Shark Research Section staff in that year. If no observer data were available for a vessel in the year in which the data was missing or deemed invalid, then the annual average value (excluding invalid records) from that vessel was used. If an average annual value was not available for a particular vessel, for example where the only available record was the one judged to be incorrect, the monthly average value (excluding invalid records) of the remainder of the fleet in that region was used. Invalid effort data were identified according to the following criteria. Where any data was missing it was replaced according to the procedures outlined above. Where net length was reported as less than 100 m or more than 12,000 m, or hours fished per day was equal to 24, the invalid value was replaced. One common problem, particularly in earlier years, was records in which the product of hours fished per shot and number of shots per day exceeded 24 hours. As fishing for more than 24 hours per day is impossible, it was taken that fishers were referring to undertaking multiple shots over the course of 24 hours. These records were therefore corrected by assuming the average monthly ‘set time’ per day, (excluding invalid records) of the remainder of the fleet in that region and replacing number of shots with a value of one.

Fisheries Research Report [Western Australia] No. 151, 2005 2�
Once effort parameters were corrected, monthly gillnet effort was calculated for each vessel in each block as the net length multiplied by the number of days fished, the number of hours fished per shot and the number of shots per day. Total gillnet effort was then calculated for each management zone of the TDGDLF, as the sum of monthly effort by all vessels within the zone. As the majority of operators in this fishery use demersal gillnets, longline fishing effort was standardised in terms of equivalent gillnet fishing effort by using the longline catch and gillnet catch rate of all sharks to back-calculate the amount of gillnet effort that would have been necessary to have caught that quantity of sharks (i.e. gillnet equivalent effort = longline catch divided by gillnet CPUE). As previous analysis of the accuracy of catch and effort data from the TDGDLF determined that due to missing returns, data prior to 1990 was incomplete, both gillnet and longline effort (and catch) were increased by 5% (Simpfendorfer and Donohue, 1998). Although this previous analysis estimated that greater levels of correction were necessary for returns data from the mid to late 1980s, it is now suspected that reported catch and effort during this period may have been overestimated by some fishers attempting to demonstrate their use of the shark resource ahead of proposed management of the fishery (see 1.1). Additional correction to returns data from these years was therefore deemed unnecessary. Total fishing effort was calculated as the sum of the annual gillnet and longline effort and expressed in units of “kilometre gillnet hours” (km gn hr).
Correction of catch dataProblems were also found with gillnet and longline shark catches not attributed to the managed fishery’s catch due to discrepancies between catch and licensing data and in returns where shark catches were not properly separated (eg. records where all shark was reported as ‘shark, other’ or ‘bronze whaler’). The former problem was overcome by defining the fishery’s catch by method and area, rather than license information. The latter problem was overcome by assessing reported catches as either accurate or, where catches of key species (i.e. C. obscurus, C. plumbeus, Mustelus antarcticus, Furgaleus macki, Galeorhinus galeus and F. Squalidae) were not reported separately, inaccurate. Catch data were assessed regionally to account for differences in the composition of catches from different parts of the fishery and the criteria for determining accurate catches were adjusted through time to account for temporal changes in targeting practices, eg. less targeting of G. galeus since the late 1990s and the short-term fishery that developed for dogfish (F. Squalidae) out of Esperance in the mid 1990s. Catches were also judged to be inaccurate where the reported catch appeared to have been arbitrarily split (e.g. where catches were reported as 50% ‘gummy shark’ and 50% ‘bronze whaler’ or ��% ‘bronze whaler’, ��% ‘gummy shark’ and ��% ‘whiskery shark’, etc).
Catches of the fisheries’ traditional target species (i.e. C. obscurus, F. macki, M. antarcticus) in ‘inaccurate’ returns were re-estimated by reapportioning the total shark catch in those returns, based on the proportions of each species in returns from ‘accurately’ reporting vessels operating within the same block, in the same month or year. As C. plumbeus have historically been and remain a relatively minor component of the shark catch of some temperate demersal gillnet and longline vessels, some operators, particularly in the JASDGDLF, do not identify catches of this species separately. Therefore, catch records from TDGDLF vessels, operating between the northern limit of the WCDGDLF and a line of longitude at 118°E on the south coast, which did not separately report any C. plumbeus catch within a financial year were adjusted by reapportioning their monthly unidentified shark catch using the ratio of sandbar to unidentified shark catch from vessels operating in the same area in the same month or year, which did report C. plumbeus catches separately.

24 Fisheries Research Report [Western Australia] No. 151, 2005
4.2.1.2 Northern shark fisheries
Due to the small number of vessels which operated in the WANCSF, their sporadic patterns of fishing effort and the geographic scale of the northern fishery, the procedures used to validate catch and effort data in the TDGDLF could not be applied to records from the WANCSF. Instead, the accuracy of reported C. plumbeus catches in the WANCSF were examined by comparing the fishery’s monthly reported CPUE in the area west of 120°E (the area of the fishery that overlaps the primary range of C. plumbeus) with the monthly CPUE recorded in voluntary research log books from the same area. Log book data, comprising shot-by-shot catches (in numbers) and effort (number of hooks), were periodically kept by five vessels between July 1999 and June 2004. Log book catches were converted to live weight assuming a mean size of 156.1 cm TL, determined from commercial sampling on WANCSF vessels, and the length-weight relationship given by McAuley and Simpfendorfer (200�):
Live weight (kg) = 6.0 x 10⁻⁶ x TL2.9698
Monthly sandbar shark catch rates were calculated for both CAESS and log book datasets as the total monthly catch by all vessels operating in the area between NW Cape and longitude 120°E divided by total monthly effort (number of hooks) of those records.
Whilst reported CAESS effort (in terms of number of hooks and days fished per month) was consistent with both the log book data and the values observed during commercial sampling on board the majority of WANCSF vessels, there were significant differences between reported and log book catch rates. It was therefore deemed necessary to re-estimate the northern fishery’s total C. plumbeus catches to provide a more accurate representation of the overall level of mortality. This was done by bootstrapping 1,000 sets of estimated annual catches in the WANCSF, using the reported effort from the area between NW Cape and longitude 120°E and randomly resampling catch rates from within the range of the mean annual log book CPUE ± the calculated level of precision (PC) of these rates. The precision of monthly log book and CAES reported catch rates, i.e. the level of change in CPUE that should be detectable in each dataset, was determined using the equation:
where n is the sample size and CV is the coefficient of variation, calculated as the ratio of the standard deviation to average catch rate (van Belle, 2004), of each dataset.
4.2.2 Species composition of shark catches in non-target fisheries
4.2.2.1 Pilbara Fish Trawl
The Pilbara Fish Trawl Interim Managed Fishery (PFTF) is located between 114o10’E (North West Cape ) and 120°E and consists of two zones: Zone 1 (in the west of the Pilbara fishery) and Zone 2 from 116°E to 120°E generally seaward of the 50 m isobath and landward of the 200 m isobath (Figure 4.4). The PFTF is a multi-species finfish fishery, which harvests over 100 species. Among the principal target species of this fishery are: blue-spot emperor (Lethrinus hutchinsi), threadfin bream (Family, Nemipteridae), red snapper (Lutjanus erythopterus) and flagfish (Lutjanus vitta). Reported shark catches in the PFTF were 4� tonnes in 2001/02, 56 tonnes in 2002/0� and �9 tonnes in 200�/04 (McAuley, unpublished data). However, as sharks are a relatively minor byproduct of this fishery, catches are not reported to species level and the species composition of PFTF catches was therefore estimated from observer data.

Fisheries Research Report [Western Australia] No. 151, 2005 25
PFTF
KGBMF
20∫S
15∫S
120∫E 125∫E
Eighty-milebeachsouthernsite
AdmiraltyGulf
Broome
RoebuckBay
Wyndham
Derby
Eighty-milebeachnorthernsite
Figure 4.4. BoundariesofthePilbaraFishTrawlmanagedFishery(PFTF),KimberlyGillnetand BarramundiManagedFishery(KGBMF)andEightyMileBeachinshoregillnet samplinglocations.
Elasmobranch catch/bycatch data were collected by an experienced shark biologist over 100 days between February and June 2002, from the 5 vessels licensed to operate in the PFTF (Stephenson and Chidlow, 200�). Sharks were identified, sexed, and their lengths (FL and/or TL) were measured to the nearest centimetre. The fate of sharks was also recorded as either retained or discarded. It was assumed that the �7 C. plumbeus that were tagged during this survey would have been retained had the observer not been on board and these were therefore included in the retained portion of the catch. The weight of C. plumbeus catches were estimated using the length weight relationship given in 4.2.1.2, whilst catch weights of other species were estimated from published length weight relationships. Catches of individual elasmobranch species were then estimated by apportioning the annual reported shark catch by the PFTF according to the estimated proportions of each species in the observed catches.
4.2.2.2 Northern inshore gillnet fisheries
Elasmobranch catch composition data were collected by WA Department of Fisheries Shark Research Section staff from the two gillnet ‘fisheries’ that operate in northern Western Australia between the 19th of January 200� and the 9th of June 2004. These are the Kimberley Gillnet and Barramundi Managed Fishery (KGBMF) and fishers operating on Eighty Mile Beach under exemptions to their fishing licences (Figure 4.4). In total, seven vessels are licensed to fish in the KGBMF, whilst two fishers are authorised to fish with gillnets on Eighty Mile Beach, under exemptions to commercial fishing licenses. With the exception of two additional bait-net endorsements, the commercial use of ‘set’ gillnets is otherwise prohibited in the Pilbara and Kimberley regions. Fishers in the KGBMF operate in the river and tidal creek systems of the Kimberley, whilst gillnet fishing on Eighty Mile Beach occurs in the intertidal zone. The primary target species of these fisheries are Barramundi (Lates calcarifer) and threadfin salmon (Polydactylus macrochir and Eleutheronema tetradactylum). Between 2000 and 2004,

26 Fisheries Research Report [Western Australia] No. 151, 2005
reported annual landings of elasmobranchs in the KGBMF were between 2.6 and 4.6 tonnes (live weight) and between 11.1 and 25.4 tonnes (live weight) from the Eighty Mile Beach gillnet sector (McAuley, unpublished data).
Table 4.3. Summaryofnortherninshoregillnetobservereffortbetween19/01/03and9/6/04.
Data were collected from five vessels at four locations (Table 4.�). These were the northern and southern ends of Eighty mile beach, Roebuck Bay and Admiralty Gulf (Figure 4.4). In total, 160 days of gillnet fishing were observed in depths of less than 10 m. Nets were constructed of between 0.8 and 0.9 mm diameter webbing, hung between a positively buoyant head-line and negatively buoyant ground-line, with a ‘hanging coefficient’ of approximately 0.67. Mesh sizes were between 140 and 178 mm (5½-7"), with drops (i.e. depths) of between 16 and �� meshes. Elasmobranchs were identified, sexed, and their lengths (FL and/or TL) were measured to the nearest centimetre.
As the accuracy of fishing effort reported by the northern inshore gillnet sector has never been thoroughly assessed, CAESS data were examined to judge the reliability of the fisheries’ reported effort, using similar methods to those used to validate effort in the TDGDLF. Returns from the KGBMF were defined according to the licences permitted in this fishery since 1980. As gillnet fishing on Eighty Mile beach has never been a licensed activity, data from this sector were instead defined according to method and area. Records from vessels targeting bait-fish (mullet and whiting) with small mesh-size gillnets were excluded from these datasets by identifying those returns in which only baitfish were reported. This assessment revealed several problems with the ways in which different fishers reported their fishing effort. In particular, reported net length, number of shots per day and hours fished per day were found to be confounded in records from a number of vessels. Specifically, some vessels had defined number of shots per day as the number of times their total net allocation had been fished within the daily fishing period (i.e. hours fished per day). However, other vessels had defined shots as the number of nets that their total net allocation had been separated into, whilst others had defined shots as the number of times they checked and/or moved their net(s) during the daily fishing period. A small number of vessels also reported periods of fishing for 24 hours per day, i.e. the amount of time that these vessels were at sea, rather than period for which the nets were actually fished.
It was therefore necessary to standardise reported effort parameters to obtain an accurate record of annual fishing effort in the northern inshore gillnet sector. This was done according to the following procedures. Returns in which 24 hours fishing per day was reported or where the product of the number of shots per day and hours fished per day was in excess of 24 hours were considered invalid. For invalid records from vessels for which observer data were available, the invalid parameter(s) were replaced with the observed value(s). Although this approach assumes that fishing behaviour did not change between the time of the invalid report and the
No. ‘shots’ Obs. effort Mean soak Mean net Mesh size (mm) Mesh dropSite observed (km gn hr) time (hr) length (m) min max min max
RoebuckBay 33 8.5 1.0 325 140 140 33 33AdmiraltyGulf 24 17.1 4.4 176 178 178 ? ?SouthernEighty MileBeach 62 95.2 9.9 168 140 178 16 33NorthernEighty MileBeach 41 46.3 11.6 119 140 178 16 16

Fisheries Research Report [Western Australia] No. 151, 2005 27
collection of observer data, this seems to be a valid assumption as only one KGBMF skipper is known to have changed since the introduction of the fishery’s management plan in 1989 and several fishers have indicated that their fishing practices have changed little since that time. Invalid records from vessels for which observer data were not available were corrected using the mean effort parameter value(s) of the 12 preceding and 12 subsequent valid records from those vessels. Annual effort in each region (see below) was then calculated as the sum of each vessel’s standardised monthly effort.
As KGBMF fishers are not permitted to fillet shark catches at sea, the majority of the elasmobranchs caught in these fisheries are not retained and therefore, reported landings are thought to underestimate the fishery’s actual catch. Also, due to problems with species identification and the relatively minor economic importance of elasmobranch catches, landings in the northern inshore gillnet sector are generally not reported to species level. Northern gillnet elasmobranch catches were therefore estimated from the observed catch rates of individual species and the validated annual effort in these ‘fisheries’. Because observed species compositions in catches from northern and southern Eighty Mile Beach and Roebuck Bay (part of the KGBMF) were similar to each other but noticeably dissimilar to the observed composition in Admiralty Gulf, catches from Eighty Mile Beach and Roebuck Bay (Region 1) were estimated separately to those in the remainder of the KGBMF (Region 2).
4.2.3 Gillnet mesh selectivity of sandbar sharks
4.2.3.1 Data collection
To determine how the size composition of Carcharhinus plumbeus catches is related to the selectivity of the gillnets used in the TDGDLF and therefore, how catches might be affected by changes to the mesh sizes being used in the fishery, mesh selectivity data were collected from an experimental net, comprising six panels of different mesh sizes. The experimental net was deployed 8� times from commercial gillnet vessels during their normal fishing operations, in waters off the lower west coast of Western Australia between 01/0�/01 and 24/04/0�. The net was set demersally, adjacent to the vessels’ other nets, in depth of 9-111 m, in the area between 26.2°S, 11�.1°E and �0.9°S, 115.1°E (Figure 4.5). The net was constructed to commercial specifications, using commercially available nylon monofilament meshes and hung with a coefficient of 0.67 between a 20 mm diameter float-core head rope and a 11 mm diameter lead-core ground rope. The number of meshes between the top and bottom of each panel (i.e. the ‘mesh drop’) was varied so that all panels were approximately equal in depth (Table 4.4), and could be randomly ordered each time the net was deployed on a new vessel. Fork lengths (FL) of all Carcharhinus plumbeus captured in each panel of the experimental net, regardless of how they were captured, were recorded. As male and female sharks exhibited no discernible morphological differences in head-shape, it was assumed that their susceptibility to capture in the net was identical and data were not separated by sex for analysis.

Fremantle
Bunbury
Lancelin
Geraldton
115°E 120°E35°S
30°S
SouthernOcean
IndianOcean
Figure 4.5. Locationsof83experimentalnetdeploymentsinSWWesternAustraliabetween
March2001andApril2003.
Table 4.4. Experimentalgillnetandindividualnet-panelspecifications.Meshsizesarethe ‘stretched’meshsize.
4.2.3.2 Data analysis
The weight of C. plumbeus catches from each panel of net was calculated using the relationship given in 4.2.1.2. Fishing effort was calculated as the product of the length of each net panel and the amount of time for which it was fished and is expressed in units of kilometre gillnet hours (km gn hr). Catch rates were calculated, in terms of numbers of sharks and weight per km gn hr, for each panel and these log transformed catch rates compared by single factor analysis of variance (ANOVA).
Mesh selectivity parameters for C. plumbeus were calculated according to the method of Kirkwood and Walker (1986). This method assumes that: (i) the shape of the mesh selectivity curves are best described by a gamma distribution; (ii) each panel has equal fishing power; (iii) the length at maximum selectivity of each panel is proportional to mesh size; (iv) variance is constant for each panel; (v) catches within each length class are independent observations from a Poisson distribution and (vi) sampling occurs across the entire population (Kirkwood and Walker, 1986; McLoughlin and Stevens, 1994; Simpfendorfer and Unsworth, 1998). Gamma distributions were fitted to the length frequency data for each net panel, using the non-linear optimisation function in Microsoft Excel to maximise the log likelihood function:
28 Fisheries Research Report [Western Australia] No. 151, 2005
Meshsize(mm) Meshdrop(n) Depth(m) Linediameter(mm) Netlength(m)
102(4”) 33 2.5 0.8 91 140(5.5”) 25 2.6 0.8 113 152(6”) 21 2.4 0.9 108 178(7”) 18 2.4 0.9 105 224(8.8”) 15 2.5 0.9 105 254(10”) 13 2.4 0.9 103

where nij is the number of fish from length class j, caught by net i; µj is the relative proportion of length class j in the population, given by:
and Sij is the mean relative selectivity of mesh size i for fish from length class j,
where α and β describe the probability density function of the gamma distribution for net i. Values of α and β were calculated from:
and
where mi is the mesh size of net i, θ1 is a scaling parameter, which relates the mode of the gamma distribution (α,β) to mesh size and θ2 is the variance of the distribution.
To estimate the level of uncertainty in parameter estimates, the original length frequency data were randomly re-sampled to generate 500 bootstrapped length frequency datasets for each mesh size. The mesh selectivity model was then refitted to the bootstrapped data to calculate the 95% confidence intervals.
4.2.4 Natural mortality
Natural mortality (M) was estimated for Carcharhinus plumbeus and C. obscurus, using a variety of indirect methods (Table 4.5) including, the age-independent methods of Pauly (1980), Hoenig (198�) and Jensen (1996) and the age-dependent methods of Petersen and Wroblewski (1984) and Chen and Watanabe (1989). These methods rely on values for a variety of biological parameters, which were derived from the empirical data collected during this and previous projects. Although the Petersen and Wroblewski (1984) method is based on a relationship between natural mortality and dry weight of an organism, when calculated with dry weight (using the conversion of dry weight = 0.2 x live weight, from Cortés, 2002), resulting estimates of M were inconsistently low relative to estimates from the other methods. Therefore, as suggested by Beerkircher et al. (200�), live weight was used instead for this method. To account for the uncertainty and variability in the empirically measured data, each method was calculated with 1,000 stochastically derived estimates of the required biological parameter(s) and the 95% confidence intervals of the results from each method were determined.
Fisheries Research Report [Western Australia] No. 151, 2005 29

�0 Fisheries Research Report [Western Australia] No. 151, 2005
Table 4.5. Methodsusedtodeterminenaturalmortalityrates(M)forCarcharhinus plumbeusand C. obscurus.K(yr-1)andL∞(cmFL)areparametersofthevonBertalanffygrowth curve;T=averagewatertemperature(=24°C,McAuley,unpublisheddata);tmat=age atmaturity(years);tmax=maximumage(years);Z,totalmortality(year
-1);wt =live
weight(kg).
Values of age at maturity tmat (used in Jensen, 1996 and Chen and Watanabe, 1989) were derived from 1000 estimates of the lengths at which 50% of sharks were mature (L0.5), stochastically estimated combinations of the von Bertalanffy growth parameters K and L∞ and a known size at birth (L0) of 42.5 cm. Estimates of L0.5 were generated by randomly re-sampling (with replacement) the emprical maturity-at-length data to create 1000 new ‘bootstrapped’ datasets and then re-fitting the logistic maturity function (given in 4.1.4) to each. Values for the von Bertalanffy parameters, K and L∞ (also used in Pauly, 1980; Jensen, 1996 and Chen and Watanabe, 1989) were derived by re-sampling the empirical length-at-age data determined from vertebral analysis, to create 1000 new datasets and re-fitting the modified form of the growth curve (given in 4.1.3) to each, through the known size at birth of 42.5 cm FL. Values of t0 (used in Chen and Watanabe, 1989), were derived from each of the resulting estimates, using the standard definition of the von Bertalanffy curve:
Method Relationship Developedfor
Age independent methods
Pauly(1980) ln(M) = -0.0066 - 0.297.ln(L∞) 175fishstocks(including +0.654�.ln(K)+0.4627.ln(T) 2sharkspecies)
Hoenig(1983) (i) ln(Z) = 1.46 - 1.01.ln(tmax) Teleosts
(ii) ln(Z) = 0.941 - 0.87�.ln(tmax) Cetaceans
(iii) ln(Z) = 1.44 - 0.982.ln(tmax) Molluscs,teleostsandcetaceans
Jensen(1996) (i) M= 1.65/tmat Theoretical
(ii) M=1.5 K Theoretical
Age independent methods
Petersenand Mwt = 1.92wt-0.25 Particle-sizetheoryand
Wroblewski pelagicecosystemdata
(1984)
Chenand TheoreticalWatanabe(1989)
where:
and:

Fisheries Research Report [Western Australia] No. 151, 2005 �1
Based on the results of vertebral analysis and the maximum observed sizes of C. plumbeus during this and previous studies, maximum age, tmax (used in Hoenig, 198�), was determined to be between �0 and 40 years, i.e. the probability (P) of 30≤ tmax<40 = 1. The probability of maximum age being greater than �0 was assumed to decrease in a linear fashion by 10% yr-1, until there was a zero probability that it was 40 years, i.e. P(tmax = �1) = 0.9, P(tmax = �2) = 0.8…. P(tmax = 40) = 0.0. Probabilities were scaled, so that their cumulative probability was 1 and values for tmax were inversely-selected at random from within the cumulative probability distribution. The same approach was taken in estimating maximum age of C. obscurus. Based on the results of vertebral analysis (Simpfendorfer et al. 2002), tmax was determined to be at least 40 years. Although Simpfendorfer et al (2002) and Natanson and Kohler (1996) have suggested that maximum age could be as high as 60 or 70 years, given the maximum observed size in Australia (�65 cm TL, Last and Stevens, 1994), these estimates appear excessive. Therefore, maximum age was assumed to be less than 56 years, so that the probability (P) of 40≤ tmax<56 decreased by 6.25% yr-1, until there was a zero probability that it was 56 years.
4.2.5 Fishing mortality
4.2.5.1 Sandbar sharks
Age specific rates of fishing mortality experienced by Carcharhinus plumbeus during the 2001/02, 2002/0� and 200�/04 fishing seasons (July-June) were derived from reported recapture rates of 1,759 tagged sharks. Tagged sharks were released in waters between Cape Leveque (16°S, 12�°E) and Cape Leeuwin (�4°S, 115°E, Figure 4.6) between August 2000 and June 2004 according to the methods given in 4.1.2. In addition to recording the fork length, sex, date, location and depth of each release, the condition of tagged sharks was assessed on release as either: 1 (swam away strongly), 2 (swam away slowly) or � (sluggish or unable to swim away). Sharks with a release conditions of � or which exhibited other signs of being adversely affected by capture or tagging (such as bleeding from the gills) were excluded from the data used to determine recapture rates (n=88). To ensure tagged sharks had been allowed adequate time to mix into the population, recaptures of sharks that were at liberty for less than 90 days (n=9) were also excluded from determination of recapture rates. Recaptures reported by recreational fishers (n=�) were also excluded as these sharks were either reported or assumed to have been released alive, as was the single tag recapture during a fishery-independent research-cruise in August 200�. A total of 1,654 tagged C. plumbeus were therefore used for analysis of recapture rates.

�2 Fisheries Research Report [Western Australia] No. 151, 2005
120°E 125°E
20°S
15°S
35°S
30°S
25°S
115°E
Regioni=1
Regioni=2
Regioni=3
>199
100-199
50-99
25-49
<1010-24
Figure 4.6 Releaselocationsof1,654taggedC. plumbeus,usedindeterminationoffishing mortalityrates,showingtheareaclosedtosharkfishingbetweenNWCape(114º06’E) andSteepPoint(26º30’S)andregionsusedfordeterminingtagnon-reportingrates.
Information on tag recaptures was received from commercial and recreational fishers and from research staff during collection of samples from commercial catches and during fishery-independent sampling. Recapture data included the date and location of recapture, length, sex, and condition of the shark and tag. The recapture rates of C. plumbeus tagged inside the area between Steep Point and NW Cape, which has been closed to targeted shark fishing since the 1970s, were compared with the recapture rates of sharks tagged in open areas to examine whether this closure afforded the stock any substantive protection.
To account for unreported tag recaptures, tag reporting behaviour was assessed separately for three regions (Figure 1), corresponding to the areas of the JASDGDLF (i=1), WCDGDLF (i=2) and the northern shark fisheries (i=�), using the method of Simpfendorfer (1999). Fishers were classified as either “reporters” or “non-reporters” depending on whether they returned any tag information within a year. Regional non-reporting rates were then estimated as the proportion of each region’s annual C. plumbeus catch that was taken by “non-reporting” fishers. Catch figures were taken from compulsory monthly catch and effort returns supplied by all commercial fishers. The estimated number of recaptures of x year old tagged sharks
during each month ( ) between July 2001 and June 2004, was calculated as:
where is the number of reported recaptures of x year old sharks in region i during month
t and is the non-reporting rate in region i during year T.

Fisheries Research Report [Western Australia] No. 151, 2005 ��
The number of tagged sharks of age x that were present in the population at the start of month t +1 (nx,t+1) was calculated as:
,
where nx,t is the number of tagged sharks present in the population at the start of month t, Mx
is the instantaneous annual natural mortality rate of age-class x, S is the instantaneous annual tag shedding rate of 0.0�58 yr-1 calculated for C. obscurus (Simpfendorfer, 1999) and Rx,t is the number of sharks of age x tagged in month t. As results from reproductive sampling indicated that parturition in this population peaks between January and April, tagged sharks were assumed to move from age-class x into x+1 on the first of March each year.
The instantaneous annual rate of fishing mortality experienced by age class x during fishing season T, (Fx,T), was then derived from the Baranov catch equation (eg. Ricker, 1975; Quinn and Deriso, 1999):
,
where Zx,T is the instantaneous annual total mortality rate.
Since small numbers of recaptures from age classes in which the number of tagged sharks was low resulted in unrealistically high fishing mortality rates and because tag recaptures were not reported for all age classes in each year, it was necessary to modify the age-specific rates to provide a better representation of actual fishing mortality rates. This was achieved by pooling the tagging data from each �-year age-class to 17+ years and from sharks aged between 18+ and 24+ years. As no sharks older than 24 years were tagged, fishing mortality of sharks older than this was assumed to decrease uniformly from the rate experienced by the 18-24+ year old age-class, in each subsequent year-class, until F was zero for sharks older than �0+ years
of age. These multi-year age class rates, which are referred to as , and respectively, are believed to provide the best representation of the actual levels of fishing mortality experienced by the C. plumbeus stock over the three years of the tagging project. These rates have therefore been used as the basis for providing formal advice on the status of the Western Australian sandbar shark stock.
4.2.5.2 Dusky sharks
The three schedules of exploitation tested in the previous dusky shark assessment, i.e. no fishing and the exploitation rates experienced by sharks released as neonates in 1994 and 1995 (Simpfendorfer et al., 1999; Simpfendorfer, 1999), were reassessed using updated empirical biological information in the new demographic model. In addition to the previously estimated exploitation rates, longer-term tagging data were used to re-estimate age-specific fishing mortality rates of the 1994 and 1995 tagged ‘cohorts’ using the Baranov catch equation. To do this, it was also necessary to re-estimate the non-reporting rates of tag recaptures using the new dataset of validated catches by the temperate demersal gillnet and demersal longline fisheries (see 4.2.1.1). These were calculated for the same three regions as C. plumbeus used in the previous assessment (Figure 4.6). The previously estimated rate of tag-shedding was also used in determining fishing mortality rates of C. obscurus.

�4 Fisheries Research Report [Western Australia] No. 151, 2005
4.3 Stock assessment
4.3.1 Demographic analysis of Carcharhinus plumbeus
Demographic analysis was undertaken using standard life table techniques (e.g. Krebs, 1985) to test the effects of the estimated levels of fishing mortality on the Western Australian C. plumbeus stock. This technique is widely accepted as being the most appropriate method for assessing the status of long-lived elasmobranch species such as C. plumbeus (e.g. Hoenig and Gruber, 1990; Cailliet, 1992; Cortés, 1995; Cortés and Parsons, 1996; Smith et al., 1998; Simpfendorfer, 1999; Cortés, 1999; Brewster-Geisz and Miller, 2000; Cortés, 2002; Mollet and Cailliet, 2002; Simpfendorfer, 2004). Unlike other more sophisticated population-simulation models that rely on extensive and long-term information about catches, fishing effort, abundance, etc., demographic analysis is primarily based on biological parameters (particularly, age at maturity, maximum age and fecundity) and estimates of total mortality. In effect, demographic models calculate the survival of each age class in a population and the amount that each age class contributes to replenishment of the population.
The principal result from demographic analysis is generally referred to by ecologists as the rate, or current rate, of population increase (r). However, because this technique inherently assumes (unless specified otherwise) that all breeding-age females in a population contribute to its replenishment, r should more correctly be viewed as the maximum potential rate of population increase under the prescribed biological constraints. It has therefore become convention in demographic analysis of shark populations to describe r, as the intrinsic rate of population increase. Yet, this terminology can be easily confused with ecologists’ interpretation of intrinsic rate of population increase, which is the maximum possible rate of population growth when population density is low and all other environmental conditions are optimal (often referred to as rmax). Whilst ‘density-dependent’ responses to population depletion, such as a reduction in age at maturity or increased survival are well recognised in other fish stocks (e.g. Jennings et al., 2001; Walters and Martell, 2004), there is little empirical evidence for such changes in shark populations. Also, given the highly conservative (‘k-selected’) demographic characteristics of the Western Australian C. plumbeus stock, it is likely that any density-dependent changes in its life history would take many decades to be detectable. Therefore, to avoid confusion, r is referred to here as the (current) capacity for population growth. Regardless of terminology, positive values of r indicate a population with the biological capacity to grow and negative values indicate population decline. The value of fishing mortality that would provide the maximum sustainable yield (FMSY), when applied equally to all age classes, was calculated as FMSY=r/2 (Ricker, 1975). In addition to estimating r, the demographic model was also used to calculate the net reproductive rate per generation (Ro), generation time (G), population doubling time (tx2), proportion reaching maturity (PM) and the stable age distribution (Cx), for each schedule of mortality.
For each scenario of fishing mortality, the demographic model was calculated with 1000 sets of stochastically estimated biological parameters and natural mortality rates (derived by randomly re-sampling from the estimates obtained in 5.1 and 5.2, respectively), so that the mean and 95% confidence intervals of model results could be determined. The biological parameters used in the model were derived by re-sampling (with replacement) the empirical data collected during this project.

Fisheries Research Report [Western Australia] No. 151, 2005 �5
Life tables were based on the Euler-Lotka equation:
,
where lx is the proportion of females surviving to age x, mx is the fecundity (ie number of female offspring produced per female) at age x, α is the age at maturity and w is the maximum reproductive age.
Fecundity (mx) was calculated by multiplying litter size by the proportion of female embryos and dividing by the number of years between litters. Values for litter size and the proportion of female embryos in each litter were randomly selected from normal distributions with means and standard deviations equal to the values of the empirical data (see 5.1.4.2). The distribution for proportion of female embryos was truncated at zero and one to avoid negative values and values >1. As there was no indication from the analyses of reproductive data that breeding periodicity varied from 2 years, this value remained fixed. Values of female age at maturity (α) and maximum reproductive age (w) were derived according to the methods for tmat and tmax in 4.2.4.
The proportion of the population surviving at the beginning of each age class was derived from the modified survival equation:
,
where Fx is the instantaneous rate of fishing mortality of age-class x (see 4.2.5) and Mx is the instantaneous rate of natural mortality of age-class x (see 4.2.4).
Each schedule of annual age-specific (F2001/02, F2002/03 and F2003/04, respectively) and multi-year age class fishing mortality ( , and ) was applied separately in the demographic model, with each of the rates of natural mortality calculated in 4.2.4., to assess how the Western Australian C. plumbeus population was affected by fishing over this three year period.
4.3.2 Refining the dusky shark, Carcharhinus obscurus, stock assessment
The status of the Western Australian dusky shark, Carcharhinus obscurus, stock was reassessed using the demographic model developed for sandbar sharks. Whilst the previous assessment has provided a sound basis for recent management of this stock, it primarily relied on biological information derived from C. obscurus populations in the western North Atlantic and western Indian Ocean. Also, the deterministic framework of the previous model was unable to fully explore the possible effects of uncertainty and variability in the stock’s demographic rates. Additionally, longer-term tagging data is now available to estimate the fishing mortality rates of some older age classes. The new assessment therefore incorporates empirically measured data from the WA C. obscurus stock and updated exploitation rate data collected over the course of this project and during FRDC projects 9�/067 and 96/1�0.
Litter size was randomly selected from within the range of the mean observed litter size ± its standard deviation. As there were no empirical data to suggest that embryonic sex ratio differed significantly from 1:1, the proportion of female embryos was selected from within

�6 Fisheries Research Report [Western Australia] No. 151, 2005
a range with a mean of 0.5 and a standard deviation of 0.1. Values of female age at maturity (α) were determined by applying the same methods described for C. plumbeus (see 4.2.4.) to C. obscurus maturity at size data and stochastically estimated combinations of the von Bertalanffy growth parameters K and L∞. Female length at age data were re-sampled from the data given by Simpfendorfer et al (1999) and Simpfendorfer et al (2002) and the von Bertalanffy curve was re-fitted, assuming a size at birth of 75.�cm FL (Simpfendorfer et al, 1999; Simpfendorfer et al, 2002). Based on the results of vertebral analysis (Simpfendorfer et al, 1999; Simpfendorfer et al, 2002) and using the same method as was used for C. plumbeus (4.2.4), the probabilities of maximum age being between 40 and 55 were scaled, so that their cumulative probability was 1 and values for w were inversely-selected at random from within the cumulative probability distribution. Breeding frequency could not be adequately estimated from the available empirical data. The previous assessment assumed that females produced a litter every three years, although tested the sensitivity of the stock’s demographic rates for two and four year breeding periods. The current assessment was therefore conducted with five different scenarios of breeding frequency: two years, three years, four years, two or three years and two, three or four years. While two-year reproductive cycles are typical for the genus Carcharhinus, it has also been suggested that C. obscurus exhibits a two-year gestation and is therefore likely to have a three-year breeding cycle (GSAFDF, Simpfendorfer, 1999). Therefore, Scenario D (2-� year periodicity) is thought most likely to encompass the actual breeding frequency of this stock. Rates of natural mortality were also estimated according to the methods described for C. plumbeus in 4.2.4.

Fisheries Research Report [Western Australia] No. 151, 2005 �7
5.0 Results
5.1 Biology of Carcharhinus plumbeus
5.1.1 Distribution and regional size structure
Data from 7,497 Carcharhinus plumbeus (7,�87 from the current project, 90 from the Pilbara Trawl Fishery bycatch survey and 20 from the May 2000 drum-line survey), were examined to determine the species’ distribution and regional differences in the size composition of the stock. The majority of specimens (n=6,478) were sampled from commercial catches, whilst 1,019 were derived from fishery-independent catches. Of the commercially-derived samples, 5,0�9 were caught by demersal gillnets between Shark Bay (26ºS) on the west coast and Point D’Entrecasteaux (116ºE) on the south coast, 54 were caught by demersal longlines between Shark Bay and a latitude of �2ºS on the west coast, 1,279 were caught by demersal longlines between North West Cape (22ºS 114ºE) and longitude 12�ºE on the north coast and 90 were caught by fish trawl between 116ºE and 120ºE on the north coast. Of the 1,019 research-derived samples, 2�9 were caught by demersal longlines between Shark Bay and latitude �4ºS on the west coast, 758 by demersal longlines between Shark Bay and longitude 122ºE on the north coast, 20 by drumlines in the North West Cape region and two by demersal gillnets off Eighty-mile Beach during fishery-independent research cruises. The distribution and characteristics of sampling effort are summarised in Table 5.1. Capture locations are shown in Figure 4.1.
Table 5.1. DistributionandcharacteristicsofCarcharhinus plumbeussamplingeffortbetween July2000andJune2003.
The smallest free-swimming male and female sharks (which were both caught by gillnets in the temperate fishery, i.e. south of 26°S) were 40 cm FL and 44.5 cm FL, respectively. The largest observed male and female sharks measured 165 cm FL and 166 cm FL, respectively. The 166 cm female was caught by gillnet south of 26°S, whilst 165 cm males were caught south of 26°S by gillnet (n=1) and by longline (n=1). The relationships between FL and TL for post-natal sharks are described by the equations: TL=1.1175.(FL)+6.�017 (n=878, r2=0.9844) for males, TL=1.11262.(FL)+5.8188 (n=895, r2=0.9858) for females and TL=1.1224.(FL)+6.00�7 (n=177�, r2=0.9852) for both sexes combined. Male and female FL to TL regressions were significantly different (ANCOVA, F=5.5�; df=2, 1769; P=0.041).
No. Depth Mean net Mean soak Mean No.Method Region shots range (m) length (m) time (hr) No. hooks caught
Gillnet North 81 4-101 290 8 - 2 of26°S
South 730 9-121 1835 20 - 5,039 of26°S
Longline North 413 8-225 - 5 128 2,053 of26°S
South 126 35-142 - 12 79 293 of26°S
Trawl North 426 47-112 - 3 - 90 of26°S
Total 1,776 4-225 7,497

�8 Fisheries Research Report [Western Australia] No. 151, 2005
Smaller sharks were prevalent in longline and gillnet catches from south of 26°S and larger sharks were more common in northern longline and trawl catches (Figure 5.1). The size distribution of sharks caught by longline in the southern region was unimodal for males, with a peak at 70-75 cm and weakly bimodal for females with the major peak at 75-80 cm and a minor peak at 140-150 cm (Figure 5.1a). The size distribution of C. plumbeus caught in commercial gillnets in the south was weakly bimodal for both sexes, with the major peak at 75-90 cm and a minor peak at 1�0-1�5 cm for males and at 80-85 cm and 140-145 cm for females (Figure 5.1b). Larger sharks (>120 cm FL) were more dominant in longline and trawl catches in the northern region (Figures 5.1c and 5.1d, respectively). The size distribution of sharks in the northern longline and trawl samples were both unimodal, with peaks of 1�5-140 cm for males and 145-150 cm for females and 1�0-140 cm for males and 140-150 cm for females, respectively.
40 60 80 100 120 140 160 180
% fr
eque
ncy
8
6
4
2
0
2
4
6
8Male (n=151)
Female (n=147)
40 60 80 100 120 140 160 180
8
6
4
2
0
2
4
6
8Male (n=2466)
Female (n=2436)
Fork length (cm)
40 60 80 100 120 140 160 180
% fr
eque
ncy
16
12
8
4
0
4
8
12
16 Male (n=954)
Female (n=970)
Fork length (cm)
40 60 80 100 120 140 160 180
16
12
8
4
0
4
8
12
16
Female (n=73)
Male (n=15)
(a) (b)
(c) (d)
Figure 5.1. ComparativesizecompositionsofCarcharhinus plumbeuscaughtby(a)longlinesouth of26°S,(b)gillnetsouthof26°S,(c)longlinenorthof26°Sand(d)trawlnorthof26°S.
As an index of juvenile abundance in the southern sample region, i.e. south of 26°S, demersal gillnet catch per unit effort (CPUE) of sharks less than 100 cm FL were calculated for 10 m depth strata between 0 and 1�0 m (Figure 5.2). Catch rates in depths greater than 80 m were more than double those in shallower depths, with the maximum CPUE occurring within the 120-1�0 m stratum, although there was only a small amount of observed effort in depths greater than 120 m. After excluding data from the 0-10 m, 110-120 m and 120-1�0 m strata due to the low levels of observed effort, there was a statistically significant (ANOVA, r2=0.90, F=102.�4, P<0.0001) increase in CPUE with mean stratum depth between 10 m and 110 m.

Fisheries Research Report [Western Australia] No. 151, 2005 �9
The majority of neonate sharks (n=�4), which were identified by the presence of a visible umbilical scar, were caught south of 28°S (Figure 5.�), in depths of 28-119 m. However, two neonates were caught as far north as Broome (17°S 121°E) in 84 m depth and small numbers were also caught at North West Cape (21°S 114°E, n=2) in depths of 100-197 m and off Ningaloo Reef (2�°S 112°E, n=2) in a depth of 145 m.
Depth (m)
0-10
10-20
20-30
30-40
40-50
50-60
60-70
70-80
80-90
90-100
100-110
110-120
120-130
CP
UE
(no
./1,0
00 k
m g
illne
t hr)
0 .0
0 .2
0 .4
0 .6
0 .8
1 .0
1 .2
1 .4
1 .6
Eff
ort (
km g
illne
t hou
r)
0
2000
4000
6000
8000
10000
12000
Figure 5.2. MeanCatchPerUnitEffortofCarcharhinus plumbeuswithFL<100cminwaterssouth oflatitude26°S,by10mdepthstratum,betweenMay2000andJune2003.Errorbars indicateonestandarddeviation.Brokenlineshowsobservedeffort.
120°E115°E 125°E
20°S
15°S
35°S
30°S
25°S
Figure 5.3. Capturelocationsof40neonateCarcharhinus plumbeus.

40 Fisheries Research Report [Western Australia] No. 151, 2005
5.1.2 Movement
Recapture data were obtained for 154 tagged Carcharhinus plumbeus, equating to 7.2% of the sharks tagged since March 1994. Sharks for which data were returned were caught between 20/�/95 and �/9/04 in waters between 19°S, 118°E on the north coast and �5°S, 119°E on the south coast (Figure 5.4a). Tagged sharks were recaptured between 0 and 2,96� days after their release, with a mean time at liberty of 49� days (Figure 5.5a). The majority of recaptures occurred at displacement distances, measured as straight lines between release and recapture locations, of less than 250 km (mean displacement of 21� km), although four tags were returned from distances of over 1,000 km from their release locations (Figure 5.5b). The largest displacement was by a male shark, which measured 75 cm FL at its release on 25/�/96 near Hopetoun on the south coast, which was recaptured on 5/5/04, 1,582 km away on the north coast (Figure 5.4b). There was no significant difference in the proportions of males and females recaptured (0.0702 and 0.0745, respectively, χ2=0.0809, df=1, P=0.7761).
(a)
120°E115°E 125°E
20°S
15°S
35°S
30°S
(b)
120°E115°E 125°E
20°S
15°S
35°S
30°S
Figure 5.4. (a)Recapturelocationsand(b)displacementvectorsof141Carcharhinus plumbeus taggedbetweenMarch1994andJune2004.

Fisheries Research Report [Western Australia] No. 151, 2005 41
Time at liberty (days)
0 500 1000 1500 2000 2500 3000
Fre
quen
cy (
no)
0
5
10
15
20
25
30
Distance (km)
0 200 400 600 800 1000 1200 1400 1600
Fre
quen
cy (
no)
0
10
20
30
40
50(a) (b)
Figure 5.5. (a)Timeatlibertyand(b)displacementdistancehistogramsofCarcharhinus plumbeus tagrecaptures,forwhich(a)recapturedateswererecorded(n=133)and(b)recapture locationswere(n=141).
Although there was a significant linear increase in displacement distance with increased time at liberty (r2=0.6802; ANOVA, df=1��, P<0.0001), data from several tagged sharks differed substantially from this trend (Figure 5.6). Notable exceptions included a 141 cm FL at release male shark that was recaptured at North West Cape, 1,065 km from its release location (Cape Leveque), less than one year after his release and a 79 cm FL female shark that was recaptured 25 km from where she was tagged after nearly four years (1,445 days) at liberty. The slope of the regression between displacement distance and time at liberty (i.e. the expected dispersal rate of tagged sharks) was 2.8 km day-1.
Time at liberty (days)
0 500 1000 1500 2000 2500 3000
Dis
plac
emen
t dis
t (km
)
0
200
400
600
800
1000
1200
1400
1600
1800
Figure 5.6. Timedistanceplotof133Carcharhinus plumbeustagrecapturesforwhichboth recapturedatesandlocationswerereturned.
Between 6�% (South Coast) and 81% (Lower West Coast) of tag recaptures occurred within the same region as sharks were released (Table 5.2). However, sharks that were tagged on the south and lower west coasts, were also recaptured in all other regions, whilst (with one

42 Fisheries Research Report [Western Australia] No. 151, 2005
exception) sharks tagged in the upper west coast and north coast regions were only recaptured within those regions. Although the mean time at liberty and displacement distance were highest for sharks tagged in the South Coast region (Table 5.�), there were no significant differences in either time at liberty (ANOVA, F=1.959, df=�, P=0.12�) or displacement distances (ANOVA, df=�, P=0.182) between regions.
Table 5.2. Releaseandrecaptureregionsof141taggedCarcharhinus plumbeusforwhich recapturelocationswerereturned.
Table 5.3. Regionalsummaryoftimeatlibertyanddisplacementstatistics.
Tag dispersal rates within each region were also similar (Figure 5.7). The only significant difference in regional dispersal rates was that of sharks tagged in the Lower West Coast region, which, at �.5 km day-1, dispersed faster than the overall rate (ANCOVA, df=2, P=0.0�79). Sharks tagged in the Upper West Coast region dispersed least rapidly at 1.4 km day-1.
Release Recapture RegionRegion South Coast Lower WC Upper WC North Coast Total
North Coast - - 3(23%) 10(77%) 13Upper WC - 1(10%) 7(70%) 2(20%) 10Lower WC 3(4%) 61(81%) 10(13%) 1(1%) 75South Coast 27(63%) 11(26%) 4(9%) 1(2%) 43
Total 30 73 24 14 141
Release Release Time at Liberty (days) Displacement (km)Region (n) (n) Mean (min-max) (n) Mean (min-max)
North Coast 633 13 460(178-910) 13 246(11-1065)Upper WC 575 10 234(31-369) 10 195(0-666)Lower WC 656 70 466(2-2723) 75 172(1-1108)South Coast 243 40 639(0-2963) 43 278(2-1582)
Total 2107 133 500(0-2963) 141 213(0-1582)

Fisheries Research Report [Western Australia] No. 151, 2005 4�
0 200 400 600 800 1000 1200
Dis
plac
emen
t dis
t (km
)
0
200
400
600
800
1000
1200(a)
0 100 200 300 400 500
0
100
200
300
400
500
600
700 (b)
Time at liberty (days)
0 500 1000 1500 2000 2500 3000
Dis
plac
emen
t dis
t (km
)
0
200
400
600
800
1000
1200(c)
Time at liberty (days)
0 500 1000 1500 2000 2500 3000
0
200
400
600
800
1000
1200
1400
1600
1800 (d)
Figure 5.7. TimedistanceplotsofCarcharhinus plumbeustagrecapturesforwhichbothcapture dateandlocationswerereturnedof(a)sharkstaggedintheNorthCoastregion, (b)sharkstaggedintheUpperWestCoastregion,(c)sharkstaggedintheLower WestCoastregionand(d)theSouthCoastregion.
Sharks tagged in the South and Lower West Coast regions were mainly caught to the north or north-west of their release locations (Figure 5.8c and 5.8d, respectively). The mean displacement vector bearings (i.e. directions between release and capture locations) of sharks tagged in these regions were �02° (n=4�, circular standard deviation=77.2°) and �45° (n=75, circular standard deviation=76.9°), respectively. Sharks tagged in the Upper West and North Coast regions, on the other hand exhibited a greater degree of easterly movement and less uniform directionality. Mean displacement vector bearings from these regions were 101.7° (n=10, circular standard deviation=125.7°, Figure 5.8c) and 60.9° (n=1�, circular standard deviation=76.9°, Figure 5.8d), respectively.

44 Fisheries Research Report [Western Australia] No. 151, 2005
Dist (km)
0 - 300
>300 - 600
>600 - 900
>900 - 1200
>1200
3 3
3
3
2 2
2
2
1 1
1
1
0
90
180
270
Dist (km)
0 - 300
>300 - 600
>600 - 900
>900 - 1200
>1200
1 1
1
1
0.75 0.75
0.75
0.75
0.5 0.5
0.5
0.5
0.25 0.25
0.25
0.25
0
90
180
270
Dist (km)
0 - 300
>300 - 600
>600 - 900
>900 - 1200
>1200
15 15
15
15
12.5 12.5
12.5
12.5
10 10
10
10
7.5 7.5
7.5
7.5
5 5
5
5
2.5 2.5
2.5
2.5
0
90
180
270
Dist (km)
0 - 300
>300 - 600
>600 - 900
>900 - 1200
>1200
6 6
6
6
5 5
5
5
4 4
4
4
3 3
3
3
2 2
2
2
1 1
1
1
0
90
180
270
(a) (b)
(c) (d)
Figure 5.8. Frequencydistributionsofrecapturedisplacementdistance(km)anddisplacement vectorbearing,by10°increments,of141Carcharhinus plumbeustaggedinthe (a)NorthCoastregion,(b)UpperWestCoastregion,(c)LowerWestCoastregion and(d)SouthCoastregion.
5.1.3 Age and growth
5.1.3.1 Validation of growth band periodicity and seasonality
Capture details and centrum sections were obtained were received from 29 injected sharks, which were at liberty for between 16 and 2,96� days. Of these, 22 were marked with calcein and 7 with OTC. Fluorescing marks were visible in all sections from calcein-marked sharks, however, could not be detected in sections from two OTC-injected sharks, which had been at liberty for �1 and 272� days. There was a highly significant linear relationship between the number of complete growth bands counted after the injection marks and times at liberty (ANOVA, r2=0.972, F=945, P<0.0001, Figure 5.9). The slope of this regression was 1.02 (SE=0.0��), demonstrating that growth bands were formed annually.

Fisheries Research Report [Western Australia] No. 151, 2005 45
Time at liberty (yr)
0 2 4 6 8 10
No.
ban
ds a
fter
mar
k
0
1
2
3
4
5
6
7
8
9
10
Figure 5.9. NumberofgrowthbandscountedafterOTCorcalceinmarkin29sectioned Carcharhinus plumbeuscentra.
Opaque band formation was estimated to take between 175 and ��6 days (median=259 days), whilst translucent bands were formed over periods of 29-190 days (median=106). There appeared to be some degree of seasonality in growth band formation. Estimates of increment start dates were reasonably consistent with the formation of a new opaque zone in spring or summer (Figure 5.10). Growth increment start dates in the year(s) of tagging were estimated to be between April and February, however most (76%) began forming between August and January. Translucent band formation was also calculated to have occurred throughout the year, however, in 76% of examined sections, translucent bands were estimated to have started forming between April and September.
BandseasonalityBandseasonality
MonthMonth
Jan
Jan
TagNo
TagNo
584584100010002359235927632763500550055015501551045104510751075142514253255325553255325548554855765576558355835592559255955595561556155629562956965696579857985823582359335933690969098267826768976897
Feb
Feb
Mar
Mar
Apr
Apr
May
May Jun
Jun
Jul
Jul
Aug
Aug
Sep
Sep Oct
Oct
Nov
Nov
Dec
Dec Jan
Jan
Apr
Apr
Mar
Mar
Feb
FebJa
nJa
nFeb
Feb
Mar
Mar
Apr
Apr
May
May Jun
Jun
Jul
Jul
Aug
Aug
Sep
Sep Oct
Oct
Nov
Nov
Dec
Dec
Figure 5.10. Diagrammaticrepresentationoftheestimatedannualtimingofvertebralgrowth bandformation.

46 Fisheries Research Report [Western Australia] No. 151, 2005
Parameter Male Female Combined
n 105 10.0 528K (yr-1) 0.0440(0.0078) 0.0386(0.0052) 0.0402(0.0042)
L∞ (cm FL) 226.3(24.7) 245.8(20.5) 239.6(15.3)
t0 -4.8588r2 0.9253 0.9396 0.9344
5.1.3.2 Vertebral analysis
Mean band counts, mean readability, IAPE and the percentage of readings that were in agreement with the final consensus counts were similar for all three readers (Table 5.�), although more consensus readings were obtained for readers A and B than reader C. Reader C provided both the highest individual reading (27 years) and highest consensus age (26 years). Final consensus counts between readers were reached for 2�8 specimens, ranging in size between 47 and 154 cm FL. The oldest male shark for which a consensus age was agreed was 19 years and the oldest agreed female age was 25 years. The oldest immature male and female sharks were both 12 years. Maturing females were aged at between 12 and 16 years and a single maturing male was aged at 15 years. The youngest mature sharks were aged at 14 (female) and 1� (male) years.
Table 5.3. SummaryofvertebralbandcountsofWesternAustralianCarcharhinus plumbeus, for3readersandforfinalconsensuscounts.
As suggested by the standard errors of parameter estimates (Table 5.4), there was no difference between male and female von Bertalanffy growth curves (Kimura, 1980, Likelihood Ratio test, χ2=0.�50, df=2, P=0.8�9; Figure 5.11). Using the known size at which 50% of sharks are mature (L0.5, Section 5.1.4), age at maturity was calculated as 14.0 years for males and 15.9 years for females. As determined from vertebral analysis, annual growth rates declined gradually with age, from 7.8 cm FL yr-1 in the first year to 2.� cm FL yr-1 by �0 years of age.
Table 5.4. SummaryofvonBertalanffyparameters,estimatedfromvertebralanalysisof WesternAustralianCarcharhinus plumbeus.Valuesinparenthesesarestandarderrors ofparameterestimates.
Mean Mean band No consensus Agreement with finalReader readability count IAPE counts band count (%)
A 1.8 10.9 10.0 528 49.8B 2.1 10.2 14.0 522 44.8C 1.9 10.6 12.6 482 47.3Final - 8.7 11.7 238 -

Fisheries Research Report [Western Australia] No. 151, 2005 47
Band count (years)
0 5 10 15 20 25 30
For
k Le
ngth
(cm
)
30
40
50
60
70
80
90
100
110
120
130
140
150
160
170
180(a)
Band count (years)
0 5 10 15 20 25 30
For
k Le
ngth
(cm
)
30
40
50
60
70
80
90
100
110
120
130
140
150
160
170
180
Band count (years)
0 5 10 15 20 25 30
For
k Le
ngth
(cm
)
30
40
50
60
70
80
90
100
110
120
130
140
150
160
170
180
MaleFemaleUnknown
(b)
(c)
Figure 5.11. LengthatageestimatesandassociatedvonBertalanffygrowthcurves forWesternAustralianCarcharhinus plumbeusfromvertebralanalysis of(a)male(n=105),(b)female(n=130)and(c)combinedsexes(n=238).

48 Fisheries Research Report [Western Australia] No. 151, 2005
Age (years)
0 10 20 30 40
Gro
wth
(cm
FL
yr-1
)
0
1
2
3
4
5
6
7
8
9
10
Francis (1988)Vertebral analysis
Figure 5.12. ComparisonofannualgrowthratesinWesternAustralianCarcharhinus plumbeus, calculatedfromtaggingdata(Francis,1988)andlengthatagedataderivedfrom vertebralanalysis.
5.1.3.3 Estimation of growth rates from tagging data
The von Bertalanffy parameter estimates from the Francis (1988) model, were both noticeably different to and less precise than those calculated from vertebral analysis (Table 5.5). However, the confidence intervals associated with these estimates, suggest that the parameter estimates from the tagging data are unlikely to be statistically different to those obtained from vertebral analysis. The model indicated that growth variability in tagged sharks was substantial (n=0.�7, i.e. growth rates varied by �7% of predicted growth). Whilst measurement error was estimated to be relatively small (m=0.0� cm, s=0.54 cm), there was a high probability of data contamination (p=0.52) from other sources. This suggests that outliers in the dataset might be exerting an undue influence on the model’s ability to accurately estimate growth parameters and that these results should be treated with some caution.
Table 5.5. Growthandgrowthvariabilityparameterestimates,with95%confidence(CI),calculated fromtheFrancis(1988)methodfordetermininggrowthfromtaggingdata.
Growth rates, calculated from the tagging data were initially higher than those calculated by vertebral analysis, however they declined more rapidly and begin to asymptote at an earlier age. Growth rates, as described by the von Bertalanffy parameters estimated by the two methods, are compared in Figure 5.12.
g (cm yr--1) gß (cm yr--1) v m (cm) s (cm) p L∞ (cm FL) K (yr-1)
Median 7.50 4.54 4.54 4.54 4.54 4.54 4.54 4.5495%CI 0.7-15.8 0.3-11.7 0.3-11.7 0.3-11.7 0.3-11.7 0.3-11.7 0.3-11.7 0.3-11.7

Fisheries Research Report [Western Australia] No. 151, 2005 49
5.1.4 Reproductive biology
5.1.4.1 Male Reproductive Biology
The smallest male with fully calcified claspers was 117 cm FL and the largest with entirely uncalcified claspers was 125 cm FL (Figure 5.1�). Partial clasper calcification was observed in sharks of between 111cm FL and 1�8 cm FL. The size at which 50% of males were mature (L0.5) was 126.9 cm FL (with 95% confidence that L0.5 was between 121 cm and 128 cm FL, Figure 5.14), which corresponds to 76% of the maximum observed size of males. The proportion of mature male sharks with running spermatozoa was highest between January (79%) and March (80%), after which the proportions progressively decreased to June and August when no running spermatozoa was detected (Figure 5.15). The proportion of mature males with running spermatozoa increased from 7.1% in October to 58% in December. These data suggest that mating activity peaks between January and March.
Fork Length (cm)
80 90 100 110 120 130 140 150 160
Cla
sper
Len
gth
(% F
L)
0
2
4
6
8
10
12
14 Calcified (n=348)Partially calcified (n=51)Uncalcified (n=50)
Figure 5.13. Clasperlengthanddegreeofclaspercalcificationasafunctionofforklengthof449male Carcharhinus plumbeussampledbetweenMay2000andJune2003.

50 Fisheries Research Report [Western Australia] No. 151, 2005
Fork Length (cm)
90 100 110 120 130 140 150 160 170
Num
ber
of s
peci
men
s
0
20
40
60
80
100
120
140
Pro
port
ion
mat
ure
0.0
0.1
0.2
0.3
0.4
0.5
0.6
0.7
0.8
0.9
1.0
Uncalcified, immature(n=535)Partially calcified, maturing(n=167)Fully calcified, mature(n=688)
Figure 5.14. Degreeofclaspercalcificationin1,390maleCarcharhinus plumbeus,measuring between90cmand160cmFL,sampledbetweenMay2000andJune2003.Curve istheproportionofmaturesharksby2cmFLsizeclasses,asdeterminedbylogistic regressionanalysis;dashedverticallineindicatestheestimatedsizeat50%maturity (L0.5);errorbarsare95%confidenceintervalsoftheestimatedL0.5.
Month
Jan Feb Mar Apr May Jun Jul Aug Sep Oct Nov Dec
%
0
10
20
30
40
50
60
70
80
90
100
38 35
30
82
8
5
10
14
17
0 0(1)
Figure 5.15. Monthlypercentageof239maturemaleCarcharhinus plumbeus,sampledbetween May2000andJune2003,withrunningspermatozoapresentintheepididymis. Numbersabovepointsindicatesamplesizes.Monthsinwhichsamplesizeswere lessthanfivehavebeenexcludedandareshowninparentheses.

Fisheries Research Report [Western Australia] No. 151, 2005 51
5.1.4.2 Female Reproductive Biology
The smallest mature (reproductive stage ≥ 3) female was 125 cm FL and the largest immature (stage 2) female was 14� cm FL (Figure 5.16). All observed females were mature by 146 cm FL. The size at which 50% of females were mature (L0.5) was estimated by logistic regression analysis to be 1�5.9 cm FL (with 95% confidence that the value was between 1�4.7 cm and 1�6.8 cm FL), which corresponds to 8�% of the maximum observed size of females.
Fork Length (cm)
90 100 110 120 130 140 150 160 170
Num
ber
of s
peci
men
s
0
10
20
30
40
50
60
70
Pro
port
ion
mat
ure
0.0
0.1
0.2
0.3
0.4
0.5
0.6
0.7
0.8
0.9
1.0Stage 1, immature (n=239)Stage 2, maturing (n=57)Stages 3-6, mature (n=477)
Figure 5.16. Maturity(uterine)stagesof773femaleCarcharhinus plumbeus,measuringbetween90cmand160cmFL,sampledbetweenMay2000andJune2003.Curveistheproportionofmaturesharksby2cmFLsizeclasses,asdeterminedbylogisticregressionanalysis;dashedverticallineindicatestheestimatedsizeat50%maturity(L0.5);errorbarsare95%confidenceintervalsoftheestimatedL0.5.
All mature females that were examined (n=481) either had developing yolky ova, recently ovulated ova, embryos in-utero or showed evidence of recent parturition. Mature, non-pregnant females (i.e. stage � reproductive condition, n=182) were caught in all months except February, July and September, when sample sizes were small (Figure 5.17). However, they were most prevalent between April and November, when they contributed between 40% and 100% of the catch.
Ovulating and post-ovulatory females (i.e. stage 4 reproductive condition, n=40) were observed in January to April and again in November, however, the proportion of these was small (<5%) in all months except March, when they accounted for �4.7% of the mature females that were examined. Gravid females (i.e. stage 5 reproductive condition, n=171) were caught throughout the year, except in June and July, when limited sampling occurred (Figure 5.17). Only 15 gravid female sharks were observed with ‘yolky’ ova. However, the majority of these had a single (n=9) or pair (n=�) of large attritic ova, accompanied by numerous small previtellogenic follicles, suggesting that the larger ova, for which MOD was recorded, were the unovulated remnants of the previous ovarian cycle. Only one shark had more than four yolky ova concurrently with embryos in-utero. The proportion of post-partum female (i.e. stage 6 reproductive condition, n=88) in the catch of mature sharks decreased from 5�% in January to 12% in May (Figure 5.17). Post-partum females were absent from catches between June and November and were only a low proportion (1.8%) of the December catch.

52 Fisheries Research Report [Western Australia] No. 151, 2005
Month
Fre
quen
cy (
%)
0
20
40
60
80
100
Jan Feb Mar Apr May Jun
92 98 29 541 43 19 33 115
DecJul Aug Sep Oct Nov
)2(0)4(
Figure 5.17. Monthlyproportionsofuterineconditionsin481examinedmaturefemaleCarcharhinus plumbeus, sampledbetweenMay2000andJune2003.Whitebars=stage3,hatchedbars=stage4,greybars=stage5andblackbars=stage6.Numbersabovecolumnsindicatesamplesizes.Monthsinwhichsamplesizeswerelessthanfivehavebeenexcludedandareshowninparentheses.
The mean Maximum Ovum Diameter (MOD) of non-pregnant females decreased from 25-29 mm in January and March to approximately 10 mm between April and October (Figure 5.18). All sharks with MOD of less than 5 mm were observed between April and August. Mean MOD subsequently increased to approximately 20 mm in November and December. Ova development therefore appears to take approximately 12 months.
Month
Mea
n M
OD
(m
m)
0
10
20
30
40
DecJan Feb Mar Apr May Jun Jul Aug Sep Oct Nov
29
10
5
71
413
17 5
0 00
Figure 5.18. Monthlymeanmaximumovumdiameterfrom91stage3 Carcharhinus plumbeus sampledbetweenMay2000andJune2003.Errorbarsindicateonestandard deviationfromthemean.Numbersabovedatapointsindicatesamplesizes.

Fisheries Research Report [Western Australia] No. 151, 2005 5�
Litters from a subsample of 166 gravid female sharks, in addition to the 20 sharks caught during the drumline survey in May 2000, were examined for embryonic development. However, data from five near-term litters were excluded from the dataset, as there was evidence that embryos had been aborted prior to landing. Litter sizes ranged from four to 10 embryos, with a mean of 6.5. There was a weak but statistically significant correlation between litter size and maternal length (r2=0.0�4, P=0.021). Sex ratios were recorded for 20 litters and the proportion of females ranged from 0.� to 1.0, with a mean of 0.6 (std. dev. = 0.2), which significantly deviated from a 1:1 sex ratio (χ2=4.1�, df=1, P=0.04).
The monthly mean embryo length was high (42-48 cm TL) between January and April, after which it decreased to its minimum in May at 1� cm TL and then increased steadily between August and December, when it reached 4� cm TL (σ=� cm, Figure 5.19). Attainment of maximum embryo lengths coincides with the peak in occurrence of post partum females in January (Figures 5.17 and 5.19).
Month
Mea
n em
bryo
leng
th (
cm T
L)
0
10
20
30
40
50
60
DecJan Feb Mar Apr May Jun July Aug Sep Oct Nov
22
24 12
95
0
5
418 2
22
0
Figure 5.19. Monthlymeanembryolengthsof186Carcharhinus plumbeus litters,sampledbetweenMay2000andJune2003.Maydata,representedbyanunfilledcircle,includedatafrom20littersexaminedduringtheMay2000drumlinesurvey.Errorbarsindicateonestandarddeviationfromthemean.Numbersabovedatapointsindicatesamplesizes.
The largest recorded mean embryo length was 54 cm TL (which corresponds to 4� cm FL, using the post-natal FL-TL relationship) and the smallest free-swimming shark, which was caught by gillnet on the mid-west coast, was measured at 40 cm FL. Neonate sharks (n=40), which were identified by the presence of open umbilical scars, ranged in size from 40-66 cm FL. Embryos from three litters, ranging in size from �8-49 cm TL (29-�9 cm FL), were observed swimming freely following removal from the uterus between November and May. However, based on the size of the largest embryos examined in-utero and the size of the smallest free-swimming neonates, all but the largest of these were unlikely to have been fully developed when released. Based on a combination of these data, size at birth is estimated to be approximately 40-45 cm FL.

54 Fisheries Research Report [Western Australia] No. 151, 2005
5.1.5 Diet
Table 5.6. Occurrenceofpreyinthestomachsof1241 Carcharhinus plumbeus. Valuesinbold
italicsindicatetotalsforpreycategories.
Prey category Prey item n % occurence
Teleosts Family 724 34.2%
Clupeidae Pilchard 38 1.8% Sprat 1 <0.1% Scombridae Mackerel 32 1.5% Bonito 1 <0.1% Tuna 1 <0.1% Unidentifiedscombrid 4 0.2% Muraenidae Eel,moray 4 0.2% Ophichthidae Eel,snake 1 <0.1% Eel,unidentified 15 0.7% Labridae Wrasse 11 0.5% Baldchingroper 4 0.2% Carangidae Scad 5 0.2% Trevally 5 0.2% Samsonfish 1 <0.1% Monacanthidae Leatherjacket 11 0.5% Platycephalidae Flathead 10 0.5% Cheilodactylidae Queensnapper 9 0.4% Duskymorwong 1 <0.1% Mullidae Goatfish 6 0.3% Plotosidae Cobbler 6 0.3% Pleuronectidae/ Flounder 5 0.2% Bothidae Uranoscopidae Stargazer 5 0.2% Ballistidae Triggerfish 3 0.1% Triglidae Gurnard 3 0.1% Chaetodontidae Butterflyfish 2 <0.1% Engraulididae Anchovy 2 <0.1% Hemiramphidae Garfish 2 <0.1% Pomacanthidae Angelfish 2 <0.1% Scaridae Parrotfish 2 <0.1% Sillaginidae KingGeorgewhiting 1 <0.1% Whiting 1 <0.1% Sparidae Pinksnapper 2 <0.1% Acanthuridae Surgeonfish 1 <0.1% Ariidae Catfish 1 <0.1% Belonidae Longtom 1 <0.1% Berycidae Swallowtail 1 <0.1% Glaucosomidae Dhufish 1 <0.1% Lethrinidae Spangledemperor 1 <0.1% Ostraciidae Cowfish 1 <0.1% Scorpaenidae Scorpionfish 1 <0.1% Scorpididae Footballer 1 <0.1% Serranidae Cod 1 <0.1% Unidentifiedteleost 518 24.5%
Cephalopods 433 20.5%
Octopus 218 10.3% Unidentifiedcephapopod 113 5.3% Squid 75 3.5% Cuttlefish 27 1.3%

Fisheries Research Report [Western Australia] No. 151, 2005 55
Of the 2,115 C. plumbeus examined for dietary analysis, just over 52% (1,104) had empty stomachs. Teleosts were the most commonly observed prey category in the remaining specimens, occurring in �4.2% of examined stomachs (Table 5.6). Cephalopods (mainly octopus) were the only other major prey category, occurring in 20.5% of specimens, followed by other elasmobranchs (sharks, rays and skates, �.2%), crustaceans (0.5%) and ‘other’ prey items (0.�%). Although the majority of teleosts could not be accurately identified due to their advanced state of digestion, a wide variety of both demersal and pelagic fish were described from the stomach contents of C. plumbeus. Whilst clupeids, scombrids, eels, wrasses and carangids were the most commonly identified groups, in total �� families of teleosts were identified.
The diets of male and female sandbar sharks were similar, with a Morisita Index value (CH) of 0.87, indicating a high degree of dietary overlap. Prey diversity (H’) for females was 2.18, and 2.20 for males. Similarly high levels of dietary overlap were found between size classes, with Morisita Indices of between 0.80 (between the small and medium classes) and 1.00 (between medium and large classes). Prey diversity was lowest in the smallest size class (H’=1.87), followed by the large size class (H’=2.09) and highest in medium sized sharks (H’=2.45). Dietary overlap between sharks from the three different regions was also high, with CH values of between 0.80 (between sharks from the north-west and south-west) and 0.94 (between the south west and west coast regions). Prey diversity was highest in the north-west and west coast regions at 2.20 and 2.11, respectively and lowest in the south west at 1.60.
Sharks 34 1.6%
Gummyshark 3 0.1% Milkshark 3 0.1% Spottailshark 3 0.1% Catshark 2 <0.1% Angelshark 1 <0.1% Duskyshark 1 <0.1%
Spurdog 1 <0.1% Wobbegong 1 <0.1% Unidentifiedshark 19 0.9%
Rays & skates 33 1.6% Stingray 15 0.7% Southerneagleray 10 0.5% Shovelnoseray 3 0.1% Skate 1 <0.1% Stingray,bluespotted 1 <0.1% Unidentifiedray 3 0.1%
Crustaceans 11 0.5%
Westernrocklobster 6 0.3% Bug 3 0.1% Crab 1 <0.1% Prawn 1 <0.1%
Other 6 0.3%
Gastropod 2 <0.1% Plastic 1 <0.1%
Scallop(s) 1 <0.1% Turtle 1 <0.1% Unidentified 1 <0.1%
Total 1241 58.7%

56 Fisheries Research Report [Western Australia] No. 151, 2005
5.2 Mortality and exploitation of sandbar, dusky and related oceanic shark species
5.2.1 Catch and effort in the target fisheries
5.2.1.1 Temperate demersal gillnet and longline fisheries
Effort
Levels of validated effort in all areas corresponding to the current zones of the temperate demersal gillnet and demersal longline fisheries, were largely consistent with effort levels calculated directly from CAESS data in years for which license data were available (Figure 5.20). Effort peaked in 1985/86 in the area that became Zone 1 of the JASDGDLF (Figure 5.20a), in 1992/9� in Zone 2 of the southern fishery (Figure 5.20b) and in 1988/89 in the area now known as the WCDGDLF (Figure 5.20c). The rapid increase in predominantly gillnet effort in Zone 1 during the mid 1980s is believed to have arisen from increased fishing activity as operators attempted to establish catch history in the fishery before entry was limited by the introduction of the JASDGDLF management plan. The dramatic spike in fishing in the area north of Zone 1, in the area that was later (1997) to become the WCDGDLF, is believed to have been caused by a combination of displacement of effort from Zone 1 and increased fishing activity in anticipation of this area also becoming a fully managed limited entry fishery. Interestingly, there was no such surge in fishing activity in the area that was to become Zone 2 of the southern fishery, prior to the implementation of entry restrictions. Rather the peak in fishing activity there occurred some years after the introduction of the management plan.
Year
1975-76 1980-81 1985-86 1990-91 1995-96 2000-01
Eff
ort (
'000
km
gn
hr)
0
20
40
60
80
100
120
Year
1975-76 1980-81 1985-86 1990-91 1995-96 2000-01
Eff
ort (
'000
km
gn
hr)
0
50
100
150
200
250
300
Year
1975-76 1980-81 1985-86 1990-91 1995-96 2000-01
Eff
ort (
'000
km
gn
hr)
0
50
100
150
200
250
300
350
Year
1975-76 1980-81 1985-86 1990-91 1995-96 2000-01
Eff
ort (
'000
km
gn
hr)
0
100
200
300
400
500
600
(a)
(c)
(b)
(d)
Figure 5.20. Reported(CAESS,dottedlines)andvalidatedannualeffort(solidlines)in (a)JASDGDLFZone1,(b)JASDGDLFZone2,(c)WCDGDLFand (d)totaltemperatedemersalgillnetandlonglinefishery.

Fisheries Research Report [Western Australia] No. 151, 2005 57
Catch
Validated catches of all shark (and ray) species also generally matched CAESS reported catches in years where licensing data could be used to identify data from the fisheries (Figure 5.21). The biggest discrepancies between reported and validated catches were in the first year of management of the JASDGDLF. Trends in total shark catches generally matched the effort trends described above.
Year
1975-76 1980-81 1985-86 1990-91 1995-96 2000-01
Cat
ch (
tonn
es
live
wt.)
100
200
300
400
500
600
700
Year
1975-76 1980-81 1985-86 1990-91 1995-96 2000-01C
atch
(to
nnes
live
wt.)
0
200
400
600
800
1000
1200
Year
1975-76 1980-81 1985-86 1990-91 1995-96 2000-01
Cat
ch (
tonn
es
live
wt.)
0
200
400
600
800
Year
1975-76 1980-81 1985-86 1990-91 1995-96 2000-01
Cat
ch (
tonn
es
live
wt.)
0
500
1000
1500
2000
(a) (b)
(c) (d)
Figure 5.21. Reported(CAESS,dottedlines)andvalidatedannualcatchofallsharkandray species(solidlines)in(a)JASDGDLFZone1,(b)JASDGDLFZone2, (c)WCDGDLFand(d)totaltemperatedemersalgillnetandlonglinefishery.
Validated catches of the four temperate demersal gillnet and demersal longline fisheries key target species also closely match the CAESS reported catches since 1988 (Figures 5.22, 5.2�, 5.24 and 5.25).
Total catches of ‘bronze whalers’ (i.e. primarily dusky sharks, Figure 5.22) have declined steadily since 1992/9�. Until the late 1990s, the decline in dusky shark catches is believed to have been a direct result of the reduction in fishing effort, particularly in Zone 1 of the JASDGDLF and in the WCDGDLF. However, despite effort increases since 2001/02, ‘bronze whaler’ catches in Zone 1, have failed to rebound in the centre of the species’ Western Australian range. Further, the CPUE of bronze whalers has reached historically low levels in all management zones of the TDGDLF (McAuley, 2004). Whilst low catch rates in Zone 2 of the JASDGDLF and in the WCDGDLF can be explained by less targeting of this species, it is believed that changing targeting practices have, at least partly, been in response to declining abundance of juvenile dusky sharks at the northern and eastern edges of their distribution. Further, through sampling

58 Fisheries Research Report [Western Australia] No. 151, 2005
of commercial gillnet catches during this project a statistically significant decline in the proportion of neonate dusky sharks has been detected in the fishery’s catch over recent years, from 51% in 1994-96 to �8% in 2001-02. This suggests that the fishery’s reported ‘bronze whaler’ catch has been increasingly comprised of larger individuals over recent years and catch rates might therefore be masking a possible decline in the abundance of this stock.
Year
1975-76 1980-81 1985-86 1990-91 1995-96 2000-01
Cat
ch (
tonn
es
live
wt.)
0
50
100
150
200
250
300
350
400
Year
1975-76 1980-81 1985-86 1990-91 1995-96 2000-01
Cat
ch (
tonn
es
live
wt.)
0
20
40
60
80
100
120
140
160
180
Year
1975-76 1980-81 1985-86 1990-91 1995-96 2000-01
Cat
ch (
tonn
es li
ve w
t.)
0
50
100
150
200
250
300
Year
1975-76 1980-81 1985-86 1990-91 1995-96 2000-01
Cat
ch (
tonn
es li
ve w
t.)
0
100
200
300
400
500
600
700
(a)
(c)
(b)
(d)
Figure 5.22. Reported(CAESS,dottedlines)andvalidated(solidlines)annualcatchesof ‘bronzewhaler’sharksin(a)JASDGDLFZone1,(b)JASDGDLFZone2, (c)WCDGDLFand(d)totaltemperatedemersalgillnetandlonglinefishery.
Trends in sandbar catches in the JASDGDLF have been flat since this species was reported separately in 1985 at between ca. 20-40 tonnes per year (Figure 5.2�). The validated data indicate that since the mid 1990s, catches of this species have been relatively well reported and little adjustment to the CAESS data was required. Despite the nearly 200 tonne catch in 1989-90, sandbar catches have increased steadily in the WCDGDLF and, consequently in the TDGDLF as a whole, since reporting began. Increased targeting of this species is believed to have largely been a consequence of the declining abundance of the fishery’s other traditional target species, dusky and whiskery sharks. Although dropping by 6.6% in 200�/04, sandbar shark catch rates in the WCDGDLF have been steady since 1999/2000.

Fisheries Research Report [Western Australia] No. 151, 2005 59
Year
1975-76 1980-81 1985-86 1990-91 1995-96 2000-01
Cat
ch (
tonn
es li
ve w
t.)
0
10
20
30
40
50
Year
1975-76 1980-81 1985-86 1990-91 1995-96 2000-01
Cat
ch (
tonn
es li
ve w
t.)
0
2
4
6
8
10
12
14
16
Year
1975-76 1980-81 1985-86 1990-91 1995-96 2000-01
Cat
ch (
tonn
es li
ve w
t.)
0
50
100
150
200
250
Year
1975-76 1980-81 1985-86 1990-91 1995-96 2000-01
Cat
ch (
tonn
es li
ve w
t.)
0
50
100
150
200
250
(a)
(c)
(b)
(d)
Figure 5.23. Reported(CAESS,dottedlines)andvalidated(solidlines)annualcatchesof sandbarsharksin(a)JASDGDLFZone1,(b)JASDGDLFZone2,(c)WCDGDLF and(d)totaltemperatedemersalgillnetandlonglinefishery.
Gummy shark, Mustelus antarcticus, catches have increased rapidly in the JASDGDLF since 2000/01 (Figure 5.24). Although these increases correspond to increased levels of targeting, particularly in Zone 2, in response to declining availability of dusky sharks and the fishery’s other traditional target of school shark (Galeorhinus galeus), the steady upwards trend in CPUE is believed to indicate an increasing abundance since the fishery became managed in 1988 (McAuley, 2004). In addition, the effort reductions that were implemented in the JASDGDLF throughout the 1990s to address the depletion of the whiskery shark stock, are thought to have had a direct benefit in allowing the Western Australian component of the gummy shark stock to rebuild.

60 Fisheries Research Report [Western Australia] No. 151, 2005
Year
1975-76 1980-81 1985-86 1990-91 1995-96 2000-01
Cat
ch (
tonn
es li
ve w
t.)
0
10
20
30
40
50
60
Year
1975-76 1980-81 1985-86 1990-91 1995-96 2000-01
Cat
ch (
tonn
es li
ve w
t.)
0
100
200
300
400
500
Year
1975-76 1980-81 1985-86 1990-91 1995-96 2000-01
Cat
ch (
tonn
es li
ve w
t.)
0
2
4
6
8
10
12
Year
1975-76 1980-81 1985-86 1990-91 1995-96 2000-01
Cat
ch (
tonn
es li
ve w
t.)
0
100
200
300
400
500
600
(a)
(c)
(b)
(d)
Figure 5.24. Reported(CAESS,dottedlines)andvalidated(solidlines)annualcatchesof gummysharksin(a)JASDGDLFZone1,(b)JASDGDLFZone2,(c)WCDGDLF and(d)totaltemperatedemersalgillnetandlonglinefishery.
Whiskery shark catches have generally declined throughout the TDGDLGF since the mid to late 1980s (Figure 5.25), although overall, the catch rate of this species has remained relatively steady since 1988/89 (McAuley, 2004). The validated catch for years prior to 1988 indicate that historical catches of this stock were not as high as had previously been estimated (Simpfendorfer and Donohue, 1998). These new catch (and effort) data have been used to update the stock assessment for whiskery sharks, developed by Simpfendorfer et al. (2000). With the new catch and effort dataset, the model predicted that whilst the stock was depleted by historical levels of fishing, its estimated total biomass had stabilised at between ��.7% and �6.�% of its virgin level (B0), with a best estimate that it was �5.1% of B0 in 2002/0� (McAuley, 2004). The model also predicted that, although total biomass was still declining very slowly, mature female biomass had begun to increase.

Fisheries Research Report [Western Australia] No. 151, 2005 61
Year
1975-76 1980-81 1985-86 1990-91 1995-96 2000-01
Cat
ch (
tonn
es li
ve w
t.)
0
50
100
150
200
250
300
350
Year
1975-76 1980-81 1985-86 1990-91 1995-96 2000-01
Cat
ch (
tonn
es
live
wt.
)
0
50
100
150
200
250
Year
1975-76 1980-81 1985-86 1990-91 1995-96 2000-01
Cat
ch (
tonn
es li
ve w
t.)
0
20
40
60
80
100
120
140
Year
1975-76 1980-81 1985-86 1990-91 1995-96 2000-01
Cat
ch (
tonn
es li
ve w
t.)
0
100
200
300
400
500
600
(a)
(c)
(b)
(d)
Figure 5.25. Reported(CAESS,dottedlines)andvalidated(solidlines)annualcatchesof whiskerysharksin(a)JASDGDLFZone1,(b)JASDGDLFZone2,(c)WCDGDLF and(d)totaltemperatedemersalgillnetandlonglinefishery.
5.2.1.2 Northern shark fisheries
Monthly C. plumbeus catch rates calculated from log book data were consistently higher than those reported in statutory catch and effort returns (Figure 5.26). CAESS catch rates were also noticeably lower than the rates observed during commercial on board WANCSF vessels and fishery-independent sampling in the WANCSF area in all but one month (April 2004), when research sampling was being conducted at depths >�00m. There were no distinct trends in either CAESS or log book CPUE data over this period and there was a high degree of variability in both datasets. The level of log book reporting was also highly variable. Between zero and �9 shots were recorded per month, with a mean of 11.� shots recorded in all months, or 16.7 shots for months in which log book data were available.

62 Fisheries Research Report [Western Australia] No. 151, 2005
Month
Jul-99 Jan-00 Jul-00 Jan-01 Jul-01 Jan-02 Jul-02 Jan-03 Jul-03 Jan-04
CP
UE
(kg
/hoo
k)
0
1
2
38
12162024
Logbook CPUE CAESS CPUEResearch CPUE
Figure 5.26. MonthlyWANCSFcatchratescalculatedfrommonthlyfishingreturns(CAESS), logbookand(fishery-dependentandfishery-independent)researchdata.
Although C. plumbeus catch rates in daily log book data were generally more variable than the monthly CAESS catch rates, log book data were also more precise than the CAESS data due to the greater number of available records (Table 5.7). Mean monthly log book catch rates were considerably higher than CAESS monthly catch rates in all years between 2000/01 and 200�/04, with CAESS catch rates between 25% (2002/0�) and 6�% (1999/00) of the log book rates (Figure 5.27). As effort parameters (i.e. number of hooks, shots and days fished) in the CAESS data were consistent with log book data and the values observed during research sampling, these differences must therefore have been caused by lower than expected catches, hence the need to re-estimate the fishery’s catches.
Table 5.7. CoefficientofvariationandprecisionofmonthlyC. plumbeus catchratesintheWANCSF,
calculatedfromCAESSandresearchdatabetweenJuly1999andJune2004.
Data source Year No of Mean St. dev. records CPUE CPUE CV PC
Logbook 1999/00 143 1.25 0.83 0.67 20.2 2000/01 234 0.86 0.73 0.86 20.3 2001/02 96 1.20 1.03 0.86 30.2 2002/03 72 1.43 1.01 0.71 29.0 2003/04 208 1.01 0.95 0.94 23.3
CAESS 1999/00 13 0.95 1.13 1.19 2065 2000/01 14 0.56 0.37 0.67 650 2001/02 17 0.43 0.24 0.58 479 2002/03 12 0.38 0.24 0.63 569 2003/04 19 0.43 0.29 0.66 640

Fisheries Research Report [Western Australia] No. 151, 2005 6�
Year
1999-00 2000-01 2001-02 2002-03 2003-04
CP
UE
(kg
/hoo
k)
0.0
0.5
1.0
1.5
2.0
2.5
LogbookCAESS
92
13
209
14
97
17
72
12
204
19
Figure 5.27. MeanmonthlyC. plumbeuscatchratesofWANCSFvesselsoperatingwestof120°E longitude,calculatedfromCAESSandlogbookdata.Errorbarsindicateprecision (PC)measuredfromcoefficientofvariationandnumbersabovecolumnsarenumber ofrecords.
Both CPUE datasets indicate a similar inter-annual trend over this period, although the magnitude of changes in CPUE is greater in the log book data. Both CAESS and log book data indicate that the fishery experienced relatively high catch rates in 1999/00 as the fishery began to develop, followed by a decline in 2000/01, steady increases for the next two years and another decline in 200�/04 (Figure 5.27).
Between 1999/00 and 200�/04, reported catches of C. plumbeus in the WANCSF were between 41% and 49% of the catches estimated from log book data and all were below the lower 95% confidence bounds of the estimated catches (Figure 5.28). Both reported and estimated catches increased between 1999/00 and 2000/01 and then stabilised for two years before increasing dramatically in 200�/04. The majority of fishing effort was expended in the area west of 120°E in all years except 2002/0�, when 56% of fishing was to the east of C. plumbeus’ principal range. Increasing CPUE between 2000 and 200� caused stability in sandbar catches during this period, despite effort in the western area of the fishery declining in 2001/02 and 2002/0�. Total effort in the fishery over this period increased each year, with the most substantial increase occurring in 200�/2004. Whilst total effort in the fishery increased by 40% in the most recent year, the amount of effort that was effectively targeted at C. plumbeus by being fished in the western area, more than trebled.

64 Fisheries Research Report [Western Australia] No. 151, 2005
Year
1999-00 2000-01 2001-02 2002-03 2003-04
Eff
ort
('0
00 h
ooks
)
0
100
200
300
400
500
600
Cat
ch (
tonn
es
live
wt)
0
100
200
300
400
500
600
Effort West of longitude 120°EEffort East of longitude 120°ECAESS reported catchMean estimated catch 95%CI of estimated catch
Figure 5.28. Reported(CAESS)andestimatedannualcatchesofC. plumbeusintheWANCSF, showingreportedefforteastandwestoflongitude120°E.
5.2.2 Non target fisheries elasmobranch catches
5.2.2.1 Pilbara Fish Trawl
In total 1,541 elasmobranchs were observed in catches by PFTF vessels. Of these, 19� (12.5%) were either retained or tagged (Table 5.8). Including tagged sharks in the retained portion of the elasmobranch catch, Carcharhinus plumbeus accounted for 55% of the retained shark catch by the PFTF. Five species (C. plumbeus, Sphyrna mokarran, C. amboinensis, Hemipristis elongata and C. limbatus/C. tilstoni) accounted for 95% of the observed retained catch and thirteen species (or groups) were discarded. Based on reported total shark catches of 42.7 tonnes, 56.4 tonnes and �9.� tonnes (live wt), C. plumbeus catches were estimated to be 2�.5 tonnes, �1.0 tonnes and 21.6 tonnes in 2001/02, 2002/0� and 200�/04, respectively. Observed size compositions of elasmobranch catches in the PFTF are given in Figure 5.29.

Fisheries Research Report [Western Australia] No. 151, 2005 65
Table 5.8. Sharkcatch/bycatchobservedduringthePilbaraFishTrawlFisherysurvey,conducted betweenFebruaryandJune2002.Datahavebeenre-estimatedfromthosegivenin StephensonandChidlow,2003.
Common name Scientific name Total Est. weight Retained Retained Proportion (kg live wt) (no.) (kg live wt.) of retained catch
Retained
Sandbar Carcharhinus plumbeus 90 2058.6 78 1784.1 0.55
Greathammerhead Sphyrna mokarran 7 595.9 6 510.7 0.16
Pigeye Carcharhinus amboinensis 3 295.1 3 295.1 0.09
Fossil Hemipristis elongata 27 395.8 18 263.9 0.08
Blacktip Carcharhinus tilstoni & C. limbatus 80 593.2 34 252.1 0.08
Tiger Galeocerdo cuvier 5 168.3 2 67.3 0.02
Milk Rhizoprionodon acutus 238 522.6 18 39.5 0.01
Weasel Hemigaleus microstoma 559 772.7 18 24.9 0.01
Sharpnose Rhizoprionodon taylori 114 210.5 9 16.6 0.01
Whitecheek Carcharhinus dussumieri 102 214.2 7 14.7 0.00
Discarded
Leopard Stegastoma fasciatum 101 1627.8 0.0 0.00
Tawnynurse Nebrius ferrugineus 4 257.1 0.0 0.00
Scallopedhammerhead Sphyna lewini 115 189.5 0.0 0.00
Spottail Carcharhinus sorrah 25 90.7 0.0 0.00
Smoothhammerhead Sphyrna zygaena 1 39.4 0.0 0.00
Longtailcarpetsharks F. Hemiscylliidae 12 20.0 0.0 0.00
Bandedcatshark Chiloscylium punctatum 43 15.6 0.0 0.00
Winghead Eusphyra blochii 1 15.1 0.0 0.00
Tasseledwobbegong Eucrossorhinus dasypogon 4 9.5 0.0 0.00
Bignose Carcharhinus altimus 6 4.9 0.0 0.00
Longnosegrey Carcharhinus brevipinna 1 4.2 0.0 0.00
Siteye Loxodon macrorhinus 1 2.0 0.0 0.00
Northernwobbegong Orectolobus wardi 2 0.8 0.0 0.00
Total 1541 8103.3 193 3268.9 0.40

66 Fisheries Research Report [Western Australia] No. 151, 2005
30 40 50 60 70 80 90 100 110
Fre
quen
cy (
%)
10
5
0
5
10
15Male (n=352)
Female (n=207)
40 60 80 100 120 140 160 180 20030
25
20
15
10
5
0
5
10Male (n=15)
Female (n=74)
40 50 60 70 80 90
Fre
quen
cy (
%)
20
10
0
10
20
30
40Male (n=80)
Female (n=33)
50 60 70 80 90 100 11040
30
20
10
0
10
20Male (n=80)
Female (n=157)
100 120 140 160 180 200 220
Fre
quen
cy (
%)
20
15
10
5
0
5
10Male (n=32)
Female (n=67)
30 40 50 60 70 80 90 100 110 12020
15
10
5
0
5
10
15
20Male (n=60)
Female (n=55)
Total Length (cm)
30 40 50 60 70 80 90 100
Fre
quen
cy (
%)
15
10
5
0
5
10
15
20
25Male (n=63)
Female (n=39)
Total Length (cm)
20 40 60 80 100 120 140 160 180 200 22010
5
0
5
10Male (n=31)
Female (n=49)
(e) (f)
(g) (h)
(c) (d)
(a) (b)
Figure 5.29. SexandsizecompositionsoffrequentlyobservedelasmobranchspeciesinPilbara FishTrawlFisherycatches:(a)weaselshark, Hemigaleus microstoma, (b)sandbar shark,Carcharhinus plumbeus,(c)Australiansharpnoseshark,Rhizoprionodon taylori, (d)milkshark,R. acutus, (e)leopardshark,Stegastoma fasciatum, (f)scallopedhammerheadshark,Sphyrna lewini,(g)whitecheekshark, C. dussumieri,(h)blacktipsharks,C. limbatus and C. tilstoni.

Fisheries Research Report [Western Australia] No. 151, 2005 67
5.2.2.2 Inshore gillnet fisheries
Validated fishing effort in the KGBMF was far lower and less variable than the effort calculated directly from the reported data (Figure 5.�0a). The relatively stable trend in the validated annual effort is believed to more accurately reflect the stability of license ownership and continuity of skippers and fishing behaviour in the fishery over the last 25 years. Validated annual effort from the Eighty Mile Beach area was also generally lower than directly estimated from CAESS (Figure 5.�0b). The large spike in effort in 1988 resulted from the returns of a single vessel which reported fishing with a much larger amount of net (2,000 m) than has previously or since been reported by other vessels operating in this area. The decline in Eighty Mile Beach effort in 2005 is thought to be due, at least in part, to the omission of some overdue fishing returns.
Year
1980 1985 1990 1995 2000
Effo
rt (’0
00 k
m g
illnet
hr)
0
2
4
6
8
Year
1980 1985 1990 1995 20000
2
4
6
8
10(a) (b)
Figure 5.30. Reported(dottedlines)andvalidated(solidlines)annualeffortinthe(a)KGBMFand (b)EightyMileBeachgillnetsector.
In total, 2� elasmobranch species or species groups were recorded during northern inshore gillnet surveys (Table 5.9). Pigeye sharks (Carcharhinus amboinensis) were the most commonly recorded species in both regions. However, the five next most commonly recorded species in Region 1 (Anoxypristis cuspidata, Carcharhinus limbatus/C. tilstoni, C. cautus, Eusphyra blochii and C. amblyrhynchoides) were either absent or only recorded in small quantities in Region 2. By comparison, bull sharks (C. leucas), which were the second most common species in Region 2 were not observed in Region 1. The size compositions of the four most commonly caught species in the northern gillnet sector are shown in Figure 5.�1. Based on validated effort and observed catch rates, annual northern gillnet catches of elasmobranchs were estimated to be between 190 tonnes live wt (2004) and 454 tonnes live wt (2002) between 2000 and 2004 (Tables 5.10 and 5.11). However, as retention of elasmobranch bycatch in the northern gillnet sector is thought to vary dramatically between vessels and operators, it was not possible to estimate what proportion of this catch was landed.

68 Fisheries Research Report [Western Australia] No. 151, 2005
Region 1 Region 2 Est weight Est weight
Name Species n (kg live wt) % n (kg live wt) %
Blacktip Carcharhinus limbatus/C. tilstoni 75 487.1 5.3 12 91.0 10.3
Bull Carcharhinus leucas 0 0.0 0.0 32 126.5 14.4
Graceful Carcharhinus amblyrhynchoides 36 178.6 2.0 0 0.0 0.0
Hardnose Carcharhinus macloti 3 12.5 0.1 0 0.0 0.0
ScallopedHammerhead Sphyrna lewini 1 109.1 1.2 0 0.0 0.0
Winghead Eusphyra blochii 42 105.0 1.2 3 1.9 0.2
Lemon Negaprion acutidens 19 113.0 1.2 8 52.1 5.9
Longnosegrey Carcharhinus brevipinna 3 3.4 0.0 0 0.0 0.0
Milk Rhizoprionodon acutus 12 13.2 0.1 1 0.7 0.1
Nervous Carcharhinus cautus 73 378.2 4.1 9 44.3 5.0
Narrowsawfish Anoxypristis cuspidata 187 5156.4 56.5 3 82.7 9.4
Dwarfsawfish Pristis clavata 14 135.0 1.5 17 235.1 26.7
Pigeye Carcharhinus amboinensis 332 2066.0 22.6 66 218.5 24.8
Freshwatersawfish Pristis microdon 0 0.0 0.0 1 23.7 2.7
Greensawfish Pristis zijsron 17 161.6 1.8 0 0.0 0.0
Blacktipreef Carcharhinus melanopterus 1 1.4 0.0 0 0.0 0.0
Sliteye Loxodon macrorhinus 6 5.4 0.1 0 0.0 0.0
Shovelnose F. Rhynchobatidae/F Rhinobatidae 22 63.5 0.7 0 0.0 0.0
Spottail Carcharhinus sorrah 1 5.7 0.1 0 0.0 0.0
Stingray F. Dasyatididae 4 20.0 0.2 1 0.0 0.0
Aus.sharpnose Rhizoprionodon taylori 4 2.9 0.0 0 0.0 0.0
Tiger Galeocerdo cuvier 1 57.2 0.6 0 0.0 0.0
Whitespotguitarfish Rhynchobatus australiae 5 51.8 0.6 0 5.0 0.6
Total 858 9127.0 153 881.6
Table 5.9. ObserveddemersalgillnetcatchcompositionfromEightyMileBeach/RoebuckBay (Region1)andotherKGBMFregions(Region2).

Fisheries Research Report [Western Australia] No. 151, 2005 69
40 60 80 100 120 140 160 180 200 220 240
Fre
quen
cy (
%)
20
15
10
5
0
5
10
15
20Male (n=192)
Female (n=201)
0 50 100 150 200 250 300 35015
10
5
0
5
10
15
20
Male (n=20)
Female (n=12)
20 40 60 80 100 120 140 160 180
Fre
quen
cy (
%)
15
10
5
0
5
10Male
(n=30)
Female (n=57)
20 40 60 80 100 120 140 16015
10
5
0
5
10
15Male (n=46)
Female(n=35)
20 40 60 80 100 120 140 160
Fre
quen
cy (
%)
30
20
10
0
10
20
30
Male (n=24)
Female (n=21)
Total Length (cm)
20 40 60 80 100 120 140 16025
20
15
10
5
0
5
10
15Male (n=19)
Female (n=16)
Total Length (cm)
20 40 60 80 100 120 140 160
Fre
quen
cy (
%)
60
40
20
0
20
40
60
Male (n=16)
Female (n=15)
(a)
(c)
(b)
(d)
(e)
(g)
(f)
Figure 5.31. Sexandsizecompositionsoffrequentlyobservedelasmobranchspeciesin northerngillnetfisheries’catches:(a)Pigeyeshark,Carcharhinus amboinensis, (b)narrowsawfish,Anoxypristis cuspidata,(c)blacktipsharks,C. limbatus and C. tilstoni,(d)nervousshark,C. cautus,(e)wingheadshark,Eusphyra blochii, (f)gracefulshark,C. amblyrhynchoidesand(g)bullshark,C. leucas.

70 Fisheries Research Report [Western Australia] No. 151, 2005
Table 5.10. EstimatedgillnetcatchesofelasmobranchsinRegion1ofthenortherninshoregillnet sector(EightyMileBeachandRoebuckBay).
Table 5.11. EstimatedgillnetcatchesofelasmobranchsinRegion2ofthenortherninshoregillnet sector(areasotherthanEightyMileBeachandRoebuckBay).
Estimated catch (t live wt)
Name Species 2000 2001 2002 2003 2004
Narrowsawfish Anoxypristis cuspidata 204.4 154.2 241.5 214.6 85.4
Pigeye Carcharhinus amboinensis 82.0 60.4 91.1 77.4 24.5
Nervous Carcharhinus cautus 14.9 12.5 22.6 23.2 14.8
Blacktip Carcharhinus limbatus/C. tilstoni 19.3 14.4 22.3 19.5 7.2
Greensawfish Pristis zijsron 6.4 5.3 9.5 9.6 6.0
Graceful Carcharhinus amblyrhynchoides 7.1 5.5 8.8 8.1 3.8
Lemon Negaprion acutidens 4.5 3.6 6.0 5.8 3.1
Winghead Eusphyra blochii 4.2 3.3 5.5 5.3 2.8
Dwarfsawfish Pristis clavata 5.3 4.1 6.5 5.9 2.6
ScallopedHammerhead Sphyrna lewini 4.3 3.2 4.7 4.0 1.2
Whitespotguitarfish Rhyncobatus australiae 2.1 1.6 2.5 2.3 1.0
Shovelnose F. Rhynchobatidae/F Rhinobatidae 2.5 1.8 2.8 2.3 0.7
Tiger Galeocerdo cuvier 2.3 1.7 2.5 2.1 0.6
Stingray F. Dasyatididae 0.8 0.6 0.9 0.7 0.2
Blacktipreef Carcharhinus melanopterus 0.1 0.1 0.2 0.2 0.2
Milk Rhizoprionodon acutus 0.5 0.4 0.6 0.5 0.1
Hardnose Carcharhinus maccloti 0.5 0.4 0.5 0.5 0.1
Spottail Carcharhinus sorrah 0.2 0.2 0.2 0.2 0.1
Sliteye Loxodon macrorhinus 0.2 0.2 0.2 0.2 0.1
GrandTotal 361.5 273.2 429.0 382.5 154.4
Estimated catch (t live wt)
Name Species 2000 2001 2002 2003 2004
Dwarfsawfish Pristis clavata 11.1 9.7 6.6 9.8 9.4
Pigeye Carcharhinus amboinensis 10.3 9.1 6.2 9.1 8.7
Bull Carcharhinus leucas 6.0 5.2 3.6 5.3 5.1
Blacktip Carcharhinus limbatus/C. tilstoni 4.3 3.8 2.6 3.8 3.6
Narrowsawfish Anoxypristis cuspidata 3.9 3.4 2.3 3.5 3.3
Lemon Negaprion acutidens 2.5 2.2 1.5 2.2 2.1
Nervous Carcharhinus cautus 2.1 1.8 1.2 1.9 1.8
Freshwatersawfish Pristis microdon 1.1 1.0 0.7 1.0 0.9
Whitespotguitarfish Rhyncobatus australiae 0.2 0.2 0.1 0.2 0.2
Winghead Eusphyra blochii 0.1 0.1 0.1 0.1 0.1
GrandTotal 41.7 36.5 24.8 36.9 35.3

Fisheries Research Report [Western Australia] No. 151, 2005 71
5.2.3 Gillnet mesh selectivity of Carcharhinus plumbeus
The experimental net caught a total of 229 Carcharhinus plumbeus, of which, length measurements were obtained for 222. Length frequency (FL) data from both female and male sharks were pooled into 5 cm size classes for each mesh size (Figure 5.�2). Although all panels caught a wide range of size classes, the mean length of catches generally increased with mesh size. The exception was the 10.2 cm mesh, which had a higher mean length (86.5 cm FL) than the larger 14.0 cm mesh (79.0 cm FL). Although adult-sized sharks (127-1�6 cm FL, see 5.1.4) were caught by all mesh sizes, sharks smaller than 75 cm FL were not present in catches by the 22.4 cm and 25.4 cm panels.
10.2cm
n=31
Fork Length (cm)
45 55 65 75 85 95 105 115 125 135 145 155 165
Fre
quen
cy (
n)
0
1
2
3
4
5
614.0cm
n=51
Fork Length (cm)
45 55 65 75 85 95 105 115 125 135 145 155 165
Fre
quen
cy (
n)
0
2
4
6
8
15.2cm
n=38
Fork Length (cm)
45 55 65 75 85 95 105 115 125 135 145 155 165
Fre
quen
cy (
n)
0
1
2
3
4
5
6
717.8cm
n=41
Fork Length (cm)
45 55 65 75 85 95 105 115 125 135 145 155 165
Fre
quen
cy (
n)
0
2
4
6
8
22.4cm
n=45
Fork Length (cm)
45 55 65 75 85 95 105 115 125 135 145 155 165
Fre
quen
cy (
n)
0
2
4
6
825.4cm
n=16
Fork Length (cm)
45 55 65 75 85 95 105 115 125 135 145 155 165
Fre
quen
cy (
n)
0
1
2
3
4
5
Figure 5.32. Sizefrequencydistributionsof222Carcharhinus plumbeus specimenscaughtin experimentalgillnetpanels.Meshsizeandsamplesizearegivenintheupperright cornerofeachgraph.
Catch rates by each mesh size were highly variable (Figure 5.��). Log transformed catch rates differed significantly between mesh sizes in terms of numbers of sharks caught (ANOVA, df=5, P=0.048), although not in terms of weight of catches (ANOVA, df=5, P=0.062). Mean catch rates (by number) were lowest for the 10.2 cm and 25.4 cm panels (0.2 and 0.1 sharks/

72 Fisheries Research Report [Western Australia] No. 151, 2005
km gillnet hr, respectively) and approximately equal for the other 4 mesh sizes (0.� sharks/km gillnet hr). Mean catch rates (by weight) increased steadily between the 10.2 cm and 22.4 cm mesh sizes (�.6-7.4 kg/km gillnet hr), while the 25.4 cm mesh size yielded the lowest catch rate (�.2 kg/km gillnet hr).
Mesh Size (cm)
10.2 14.0 15.2 17.8 22.4 25.4
CP
UE
(n/
km g
illne
t hr)
0.0
0.2
0.4
0.6
0.8
1.0
1.2
CP
UE
(kg
/km
gill
net h
r)
0
5
10
15
20
25
30
Figure 5.33. Carcharhinus plumbeus catchratesbynumber(opencolumns)andweight (filledcolumns)fromeachpaneloftheexperimentalnet.Errorbarsindicate onestandarddeviation.
Estimates of θ1 and θ2 were 1�5.58 (with 95% confidence that the value was between 1�1.81 and 1�9.79) and 117,001 (with 95% confidence that the value was between 84,��8 and 165,91�), respectively. Relative selectivity plots of the six experimental mesh-sizes, show that the modal length of C. plumbeus catches increased with mesh size (Figure 5.�4). The length of maximum selectivity of the commercially-important 17.8 cm (7”) mesh-size was 94.7 cm. Although the other commercially utilised mesh size of 16.5 cm (6.5”) was not empirically tested during this study, by substituting the estimate for θ1 into equation (4), the length at maximum selectivity was calculated to be 87.9 cm.

Fisheries Research Report [Western Australia] No. 151, 2005 7�
Fork Length (cm)
45 55 65 75 85 95 105 115 125 135 145 155 165
Rel
ativ
e se
lect
ivity
0.0
0.2
0.4
0.6
0.8
1.0
25.4
10.2
14.015.2
17.8
22.4
54.1cm
74.4cm
81.1cm
94.7cm
119.0cm
135.2cm
Figure 5.34. Relativegillnetmeshselectivitiesofthesixpanelsoftheexperimentalnet. Meshsizesaregivenattherighthandsideofeachcurve.Lengthsatmaximum selectivityaregivenaboveeachcurve.
There were significant correlations between observed and predicted catches for all mesh sizes except 25.4 cm (Figure 5.�5), indicating that the model provided an adequate fit to the data for all but the largest mesh size. However, the correlation coefficients in all but the 22.4cm panel (r 2= 0.800), indicate that there was a considerable degree of variation in the length frequency data for most of the panels. Possible explanations for this are that the sample sizes might have been too small to accurately reflect the selectivity of each mesh size, particularly for the 25.4 cm dataset, or that sharks were not randomly distributed in relation to the nets.
As there were no obvious biases in the residual plots from the model (Figure 5.�6), there was unlikely to have been any gross violation of the model’s assumptions. The gamma distribution appears to provide a suitable representation of mesh selectivity for all datasets, except perhaps the 25.4 cm panel, as all size frequency plots exhibit a noticeable degree of right skew. Normal distributions were also fitted to these data but were found to provide a less satisfactory fit than gamma distributions.

74 Fisheries Research Report [Western Australia] No. 151, 2005
Observed catch (n)
0 1 2 3 4 5 6
Pre
dict
ed c
atch
(n)
0
1
2
3
4
5
6
Observed catch (n)
0 1 2 3 4 5 6
Pre
dic
ted
catc
h (n
)
0
1
2
3
4
5
6
Observed catch (n)
0 1 2 3 4 5 6
Pre
dict
ed c
atch
(n)
0
1
2
3
4
5
6
Observed catch (n)
0 1 2 3 4 5 6
Pre
dict
ed c
atch
(n)
0
1
2
3
4
5
6
Observed catch (n)
0 1 2 3 4 5 6
Pre
dic
ted
catc
h (n
)
0
1
2
3
4
5
6
Observed catch (n)
0 1 2 3 4 5 6
Pre
dict
ed c
atch
(n)
0
1
2
3
4
5
6
r2=0.426
P=0.001r2
=0.575P<0.0001
r2=0.613
P<0.0001r2
=0.444P=0.0007
r2=0.800
P<0.0001r2
=0.272P=0.0128
mc0.41mc2.01
mc8.71mc2.51
mc4.52mc4.22
Figure 5.35. ObservedversuspredictedCarcharhinus plumbeus catches (numberoffish)fromthe sixpanelsoftheexperimentalnet.Meshsizesaregivenintheupperrightcorner ofeachgraph.

Fisheries Research Report [Western Australia] No. 151, 2005 75
10.2cm
Fork length (cm)
40 60 80 100 120 140 160
Ca
tch
(n)
-4
-2
0
2
4
6
14.0cm
Fork length (cm)
40 60 80 100 120 140 160
Ca
tch
(n)
-4
-2
0
2
4
6
8
15.2cm
Fork length (cm)
40 60 80 100 120 140 160
Ca
tch
(n)
-4
-2
0
2
4
6
8
17.8cm
Fork length (cm)
40 60 80 100 120 140 160
Ca
tch
(n)
-6
-4
-2
0
2
4
6
8
22.4cm
Fork length (cm)
40 60 80 100 120 140 160
Cat
ch (
n)
-2
0
2
4
6
8
25.4cm
Fork length (cm)
40 60 80 100 120 140 160
Cat
ch (
n)
-3
-2
-1
0
1
2
3
4
5
Figure 5.36. Observedandpredictedcatchesandresidualvaluesofeachsizeclassfromthesix panelsoftheexperimentalnet.
The size frequency distribution of the stock estimated from the mesh-selectivity parameters (Figure 5.�7) is consistent with the observed size frequency in gillnet catches from the southern half of the State (see 5.1.1). These results further confirm that the C. plumbeus stock distributed south of Shark Bay is primarily comprised of juvenile sharks.

76 Fisheries Research Report [Western Australia] No. 151, 2005
Fork Length (cm)
50 60 70 80 90 100 110 120 130 140 150 160 170 180
Pre
dict
ed s
ize
freq
uenc
y (%
by
num
ber)
0
2
4
6
8
10
Obs
erve
d si
ze fr
eque
ncy
(% b
y nu
mbe
r)
0
2
4
6
8
10
12
Figure 5.37. SizefrequencyoftheWesternAustralianCarcharhinus plumbeus stockinwaters offthelowerwestcoast,aspredictedbygillnetmeshselectivityparameters(line) andobservedincommercialgillnetcatches(verticalbars;grey=female, white=male;see5.1.1).
5.2.4 Natural mortality
Estimates of instantaneous annual natural mortality rates (M) obtained from the Pauly (1980) and Hoenig (198�) methods were reasonably consistent (Table 5.1.2). The median rates calculated by each of these methods were within the 95% confidence limits of the other methods and all yielded realistic population growth rates when applied in the demographic model (see 5.�.1 and Appendix I). Estimates of M from the Jensen (1996) methods were generally lower than those calculated from the Pauly (1980) and Hoenig (198�) methods. In particular, Jensen’s (1996) methods (ii) and (iii) gave inconsistently low estimates, with upper confidence intervals that were lower than the lower confidence intervals of all other age-independent estimates. These values of M were therefore omitted from the ranges from which the stochastically-estimated rates of natural mortality were calculated.
Table 5.12. Ageindependentestimatesofinstantaneousannualrateofnaturalmortalityfor C. plumbeus. M = medianof1000estimates(unitsyr-1);CI=confidenceintervals.
Whilst the age-independent methods of Petersen and Wroblewski (1984) and Chen and Watanabe (1989) yielded higher estimates of M for the youngest and oldest sharks, rates for those age-classes that are caught by the fisheries were generally lower than were estimated by
Method M Min Max 95% CI
Pauly(1980,meanwatertemp=24°C) 0.113 0.081 0.139 (0.098-0.129)
Hoenig(1983),methodi 0.126 0.106 0.139 (0.109-0.139)
Hoenig(1983),methodii 0.124 0.105 0.132 (0.107-0.132)
Hoenig(1983),methodiii 0.136 0.116 0.150 (0.119-0.150)
Jensen(1996),methodi 0.098 0.095 0.106 (0.096-0.099)
Jensen(1996),methodii 0.060 0.040 0.077 (0.050-0.071)
Jensen(1996),methodiii 0.064 0.043 0.082 (0.054-0.075)

Fisheries Research Report [Western Australia] No. 151, 2005 77
age independent methods (Table 5.1.�). Substituting live weight for dry weight in the Petersen and Wroblewski (1984) method resulted in natural mortality rates that were consistent with estimates from the other methods and which, unlike the rates calculated using dry weight, gave positive population growth rates with zero fishing mortality in the demographic model (see 5.�.1 and Appendix I). The stochastically estimated rates of natural mortality used in the stock assessment retained some of the U-shaped characteristics of the Chen and Watanabe (1989) method, although the rates of the youngest and oldest age-classes were not as high as were estimated directly from this method.
Table 5.13. AgedependentestimatesofnaturalmortalityratesofC. plumbeus. =meanof 1,000estimatesfrombootstrappedbiologicalparameterestimates(unitsyr-1); CI=confidenceinterval.
Petersen &Age Wroblewski (1984) Chen & Watanabe (1989) Stochastically estimatedclass M M 95% CI M 95% CI
0+ 0.216 0.228 (0.214-0.245) 0.160 (0.101 - 0.226)1+ 0.194 0.193 (0.182-0.205) 0.146 (0.100-0.192)2+ 0.177 0.168 (0.159-0.178) 0.136 (0.100-0.176)3+ 0.164 0.149 (0.141-0.158) 0.132 (0.100-0.163)4+ 0.153 0.135 (0.128-0.142) 0.126 (0.099-0.152)5+ 0.144 0.123 (0.117-0.130) 0.121 (0.099-0.144)6+ 0.137 0.114 (0.108-0.120) 0.119 (0.099-0.143)7+ 0.131 0.106 (0.101-0.112) 0.117 (0.098-0.143)8+ 0.125 0.100 (0.095-0.106) 0.116 (0.098-0.144)9+ 0.120 0.094 (0.089-0.100) 0.115 (0.094-0.143)10+ 0.116 0.090 (0.085-0.095) 0.112 (0.090-0.143)11+ 0.112 0.085 (0.081-0.091) 0.110 (0.086-0.143)12+ 0.109 0.082 (0.077-0.087) 0.108 (0.082-0.141)13+ 0.106 0.079 (0.074-0.084) 0.108 (0.079-0.143)14+ 0.103 0.076 (0.071-0.081) 0.106 (0.076-0.142)15+ 0.101 0.073 (0.069-0.078) 0.103 (0.074-0.142)16+ 0.099 0.071 (0.066-0.076) 0.103 (0.072-0.141)17+ 0.097 0.069 (0.064-0.074) 0.101 (0.069-0.141)18+ 0.095 0.067 (0.063-0.072) 0.101 (0.067-0.141)19+ 0.093 0.065 (0.061-0.070) 0.102 (0.066-0.143)20+ 0.091 0.064 (0.059-0.069) 0.099 (0.065-0.141)21+ 0.090 0.062 (0.058-0.067) 0.100 (0.063-0.140)22+ 0.089 0.061 (0.057-0.066) 0.099 (0.063-0.142)23+ 0.087 0.060 (0.055-0.065) 0.097 (0.061-0.140)24+ 0.086 0.059 (0.054-0.064) 0.096 (0.059-0.140)25+ 0.085 0.057 (0.053-0.063) 0.095 (0.058-0.142)26+ 0.084 0.057 (0.052-0.062) 0.096 (0.058-0.140)27+ 0.083 0.056 (0.051-0.061) 0.096 (0.057-0.140)28+ 0.082 0.055 (0.050-0.060) 0.094 (0.056-0.141)29+ 0.081 0.054 (0.050-0.059) 0.094 (0.055-0.142)30+ 0.081 0.053 (0.049-0.059) 0.093 (0.055-0.145)31+ 0.080 0.053 (0.048-0.644) 0.094 (0.053-0.149)32+ 0.079 0.052 (0.047-0.660) 0.095 (0.054-0.333)33+ 0.079 0.051 (0.047-0.675) 0.097 (0.052-0.428)34+ 0.078 0.051 (0.046-0.690) 0.098 (0.052-0.525)35+ 0.077 0.050 (0.046-0.704) 0.100 (0.052-0.562)36+ 0.077 0.050 (0.045-0.717) 0.103 (0.051-0.580)37+ 0.076 0.049 (0.045-0.730) 0.107 (0.051-0.587)38+ 0.076 0.049 (0.044-0.741) 0.119 (0.051-0.615)39+ 0.075 0.587 (0.044-0.752) 0.128 (0.050-0.628)40+ 0.075 0.603 (0.043-0.762) 0.162 (0.051-0.656)

78 Fisheries Research Report [Western Australia] No. 151, 2005
5.2.5 Age-specific rates of fishing mortality
5.2.5.1 Sources of tag capture data
A total of 75 tagged C. plumbeus captures were reported between March 2001 and May 2004 (Table 5.14). More than 85% of these were reported from the target shark fisheries, of which 44 were caught by gillnets in the WCDGDLF, 12 by gillnets in the JASDGDLF and eight by longlines in the WANCSF. Of these, nine sharks were at liberty for less than 90 days, three were captured by recreational fishers and one was caught during a fishery independent survey and were excluded from analysis of capture rates.
Table 5.14. SourcesoftaggedC. plumbeuscapturesbetweenAugust2000andMay2004 byfisheryandmethod.Managedfisheriesareabbreviatedasfollows:WCDGDLF= WestCoastDemersalGillnetandDemersalLonglineFishery;JASDGDLF=Joint AuthoritySouthernDemersalGillnetandDemersalLonglineFishery;WANCSF=WA NorthCoastSharkFishery;PFTF=PilbaraFishTrawlfishery;SBPTF=SharkBay PrawnTrawlFishery.
A total of 664 sharks were tagged in the closed area between August 2000 and June 2004, compared to 1,080 tagged in open areas (Figure 4.6) over the same period. Thirteen of the sharks tagged in the closed area were captured before the end of 200�/04, compared to 6� captures of sharks tagged in open areas. Seven of the sharks tagged in the closed area were captured in the area of the WANCSF (five by WANCSF vessels, one by a ‘wetline’ vessel and one by a recreational fisher); three occurred inside the closed area (one by a recreational fisher, one during a fishery-independent research survey and one in the bycatch of a Shark Bay prawn trawler) and three were caught by WCDGDLF vessels.
The capture rate of sharks tagged in the closed area (n=1�, 2.0%) was marginally higher but not significantly different to that of sharks that were tagged in the area of WANCSF (n=6, 1.7%; χ2 = 0.007, df=1, P=0.9�1), indicating that sharks occurring in the closed area were no less likely to be caught than those in the adjacent area of the WANCSF. Although, overall the sharks tagged in the area of the TDGDLF were caught at a significantly higher rate (n=57, 7.9%) than those tagged in the closed area (χ2 = 2�.087, df=1, P=1.548 x10⁻⁶) and in the WANCSF (χ2 = 15.018, df=1, P=1.065 x10⁻⁴), most of the sharks tagged in the TDGDLF were juveniles, whilst most of those tagged in the area north of Steep Point were sub-adults and adults. However, when capture rates only for sharks older than seven years were compared between areas, there was found to be no significant difference between the capture rate of sharks tagged in the closed area (n=10, 1.9%) and that of sharks tagged in open areas (n=20, 2.8%; χ2 = 0.765, df=1, P=0.�82). These results strongly suggest that the closed area in the centre of this stock’s range provides no significant protection to the sub-adult and adult age classes that primarily reside in the area north of Steep Point.
Fishery n Method n
WCDGDLF 44 Demersalgillnet 53
JASDGDLF 12 Demersallongline 8
WANCSF 8 Unspecifiedhookmethods 5
WetlineFishery 4 Handline 3
Recreational 3 Dropline 3
SBPTF 2 Trawl 3
PFTF 1
Research 1

Fisheries Research Report [Western Australia] No. 151, 2005 79
In addition, longer-term tag recapture data from two sharks, which were released as juveniles (71 cm FL and 75 cm FL, respectively) in the south-west of the State (between �2°S and �4°S) and caught in the WANCSF 7½ - 8 years later, suggest that as C. plumbeus reach maturity, they migrate northwards up the West Coast and across the closed area to join the bulk of the adult stock residing in waters off the north coast.
5.2.5.2 Tag captures and fishing mortality rates
Estimated annual non-reporting rates (DiT) of tag captures were lowest in Region 1, generally higher in region 2 and highest in region � (Table 5.15). Non-reporting rates increased sharply in regions 2 and � during 200�/04 as a result of substantial increases in C. plumbeus catches by vessels that did not report any tag captures. It was estimated that a total of 29 tags were captured in 2001/02, 42 in 2002/0� and 80 in 200�/04. The majority of tags were captured in Region 2 in all years, although the number of estimated captures in region � increased by more than �00% between 2002/0� and 200�/04.
Table 5.15. Estimatedannualtagnon-reportingratesduringthe2001/02,2002/03and2003/04 fishingseasonsandnumbersofreportedandestimatedC. plumbeustagcaptures byregion(denotedbyi).
Age specific rates of instantaneous annual fishing mortality (Fx) were similar for 0+ to 10+ age-classes during 2001/02 and 2002/0� (Figure 5.�8). Fishing mortality rates of adult sharks during these years were generally lower than those experienced by juveniles and were limited to a few age-classes. While fishing mortality increased in most age-classes during 200�/04, rates were still highest for sharks younger than 14 years. With the exception of the unrealistically high fishing mortality rate experienced by the 24+ age-class in 2002/0� (which was based on the capture of 2 sharks), the highest levels of fishing mortality in all years were experienced by 6+ to 8+ age-classes. These ages correspond closely to the ages at which the mesh sizes used in the TDGDLF (16.5 - 17.8 cm) attain their maximum selectivity (7.5 – 8.7 yrs). As evidenced by the 95% confidence intervals around the median estimates, variations in fishing mortality due to stochastic estimation of natural mortality rates were negligible.
Non-reporting rates (Di,t) Reported captures (Ci,T) Estimated captures i,TYear i =1 i =2 i =3 i =1 i =2 i =3 i =1 i =2 i = 3
2001-02 0.23 0.50 0.39 3 11 2 4 22 3
2002-03 0.13 0.47 0.55 8 13 4 9 24 9
2003-04 0.09 0.67 0.84 0 16 5 0 48 31

80 Fisheries Research Report [Western Australia] No. 151, 2005
Age Class (x, yr)
0 5 10 15 20 25 30
Fis
hing
mor
talit
y (Fx)
0.0
0.1
0.2
0.3
0.4
Age Class (x, yr)
0 5 10 15 20 25 30
Fis
hing
mor
talit
y (Fx)
0.0
0.2
0.40.8
1.0
Age Class (x, yr)
0 5 10 15 20 25 30
Fis
hing
mor
talit
y ( Fx)
0.0
0.1
0.2
0.3
0.4
a b
c
Figure 5.38. Agespecificratesofinstantaneousannualfishingmortalityexperiencedbyindividual yearclassesofC. plumbeus, determinedfromcaptureratesoftaggedsharksin (a)2001/02,(b)2002/03,(c)2003/04.Barsarethemedianratesof1000estimates calculatedwithstochasticbiologicalparametervalues.Errorbarsindicate95% confidenceintervals.
The highest rates of fishing mortality determined for multi-year age classes (,
and ) were experienced by the 6-9 year age class in 2001/02 and 200�/04 and by the �-6 year age class in 2002/0� (Figure 5.�9). Rates of juvenile fishing mortality increased between 2001/02 and 200�/04, by between 11% in the 12-15 year age-class and 48% in the 6-9 year age-class. As no tag captures of sharks older than 17 years were reported during 2001/02, no estimates of fishing mortality could be made for the older age classes in the first year. Fishing mortality of the adult age-classes was estimated to have increased by between 108% (15-18 years) and 172% (18-24 years) between 2002/0� and 200�/04.

Fisheries Research Report [Western Australia] No. 151, 2005 81
g y
Age Class (x, yr)
0 5 10 15 20 25 30
Fis
hing
mor
talit
y (ˆx)
0.00
0.05
0.10
0.15
0.20
0.25
0.30
Age Class (x, yr)
0 5 10 15 20 25 300.00
0.05
0.10
0.15
0.20
0.25
0.30
Age Class (x, yr)
0 5 10 15 20 25 300.00
0.05
0.10
0.15
0.20
0.25
0.30
(a) (b)
(c)
F
Fis
hing
mor
talit
y (ˆx)F
Fis
hing
mor
talit
y (ˆx)F
Figure 5.39. Ratesofinstantaneousannualfishingmortality,experiencedbymulti-yearageclasses ofC. plumbeus, determinedfromcaptureratesoftaggedsharksin(a)2001/02, (b)2002/03,(c)2003/04.Barsarethemedianratesof1000estimatescalculatedwith stochasticbiologicalparametervalues.Errorbarsindicate95%confidenceintervals.

82 Fisheries Research Report [Western Australia] No. 151, 2005
5.3 Stock Assessment
5.3.1 Demographic analysis of the WA sandbar stock
Using stochastically estimated biological parameters and rates of natural mortality, the Western Australian C. plumbeus population was estimated to have an intrinsic rate of population growth of 0.025 (2.5% per year) with zero fishing mortality, with 95% confidence that r was between -0.018 and 0.055 yr-1 (Table 5.16; Appendix I, table i). Rates of natural mortality calculated from the Hoenig (198�) methods resulted in the lowest median population growth rates (r=0.007 to 0.02� yr-1) with no fishing, whilst M calculated by Jensen’s (1996) methods yielded the highest median values of r (0.046 to 0.086 yr-1). The level of fishing mortality that would deliver Maximum Sustainable Yield, when applied evenly across all age classes, was calculated from the median estimate of r, using the stochastically estimated M, to be 0.017 year-1. When tested in the demographic model, this rate resulted in a population growth rate of r= 0.01�.
The age specific fishing mortality rates, F2001/02, F2002/03 and F2003/04, all resulted in negative rates of population growth (r), under all but the most optimistic rates of natural mortality (Jensen, 1996, methods i and ii; Appendix I, tables ii-iv). Using stochastically estimated rates of natural mortality, median estimates of the rates at which the stock was declining under these levels of fishing mortality were: 4.9% per year in 2001/02 (with 95% confidence that r was between -0.092 and -0.019% yr-1), 5.9% per year in 2002/0� (95% confidence intervals of r = -0.110 to -0.026% yr-1) and 4.8% per year in 200�/04 (95% confidence intervals of r = -0.089 and -0.017% yr-1; Table 5.16; Appendix I, table ii-iv). The most severe rates of natural mortality (Hoenig, 198�, method iii), gave median rates of population decline of 7.4% yr-1, 8.5% yr-1 and 7.6% yr-1 in 2001/02, 2002/0� and 200�/04, respectively.
The adjusted multi-year age class rates of fishing mortality, , and , provided slightly more optimistic estimates of r than the age specific rates (Appendix I, tables v-vii). However, when combined in the demographic model with all but a few rates of natural mortality, r was nonetheless negative for all years of the study. Using stochastically estimated rates of natural mortality, median estimates of the rates at which the stock was declining under these levels of fishing mortality were: �.2% per year in 2001/02 (with 95% confidence intervals of r = -0.075 and -0.001% yr-1), 0.9% per year in 2002/0� (with 95% confidence of r = -0.054% yr-1 and +0.022% yr-1) and 4.9% per year in 200�/04 (95% confidence intervals of r = -0.09� and -0.018% yr-1; Table 5.16.; Appendix 1, tables v-vii). Estimates of natural mortality from Hoenig (198�, method iii), gave median rates of population decline of 5.6% yr-1, �.4% yr-1 and 7.8% yr-1 in 2001/02, 2002/0� and 200�/04, respectively.

Fisheries Research Report [Western Australia] No. 151, 2005 8�
Tab
le 5
.16.
Sum
maryofdem
ographicanalysisresultsforC
arch
arhi
nus
plum
beus
understochasticallyestimatedratesofnaturalm
ortality(M)andvarious
schedulesoffishingmortality.
Fis
hin
g m
ort
alit
y P
rop
ort
ion
rea
chin
g
Net
rep
rod
. ra
te
Gen
erat
ion
tim
e D
ou
blin
g t
ime
Po
ten
tial
po
p.
gro
wth
sch
edu
le
mat
uri
ty (
PM
) R
0 (n
o yr
-1)
G (
yr)
tx2
(yr)
ra
te (
r yr
-1)
Nofishing
0.134(0.12,0.13)
2.0(0.8,3.6)
22.7(21.9,24.2)
23.1(-263.5,193.0)
0.025(-0.018,0.055)
Ag
e sp
ecif
ic f
ish
ing
mo
rtal
ity
2001/02(F
2001
/02)
0.028(0.02,0.03)
0.4(0.1,0.7)
22.7(21.7,24.4)
-14.0(-34.9,-7.5)
-0.049(-0.092,-0.019)
2002/03( F
2002
/03)
0.033(0.03,0.04)
0.3(0.1,0.6)
20.0(19.8,20.6)
-11.7(-26.5,-6.3)
-0.059(-0.110,-0.026)
2003/04( F
2003
/04)
0.031(0.02,0.04)
0.4(0.2,0.8)
22.5(21.6,24.0)
-14.6(-40.6,-7.8)
-0.048(-0.089,-0.017)
Mu
lti-
year
ag
e cl
ass
fish
ing
mo
rtal
ity
2001/02()
0.040(0.03,0.05)
0.6(0.2,1.1)
22.8(21.8,24.2)
-21.1(-158.4,-6.4)
-0.032(-0.075,-0.001)
2002/03()
0.068(0.05,0.08)
0.9(0.3,1.8)
22.6(21.6,24.1)
-25.1(-460.5,609.1)
-0.009(-0.054,0.022)
2003/04()
0.032(0.03,0.04)
0.4(0.1,0.8)
22.1(21.3,23.5)
-14.2(-39.6,-7.5)
-0.049(-0.093,-0.018)
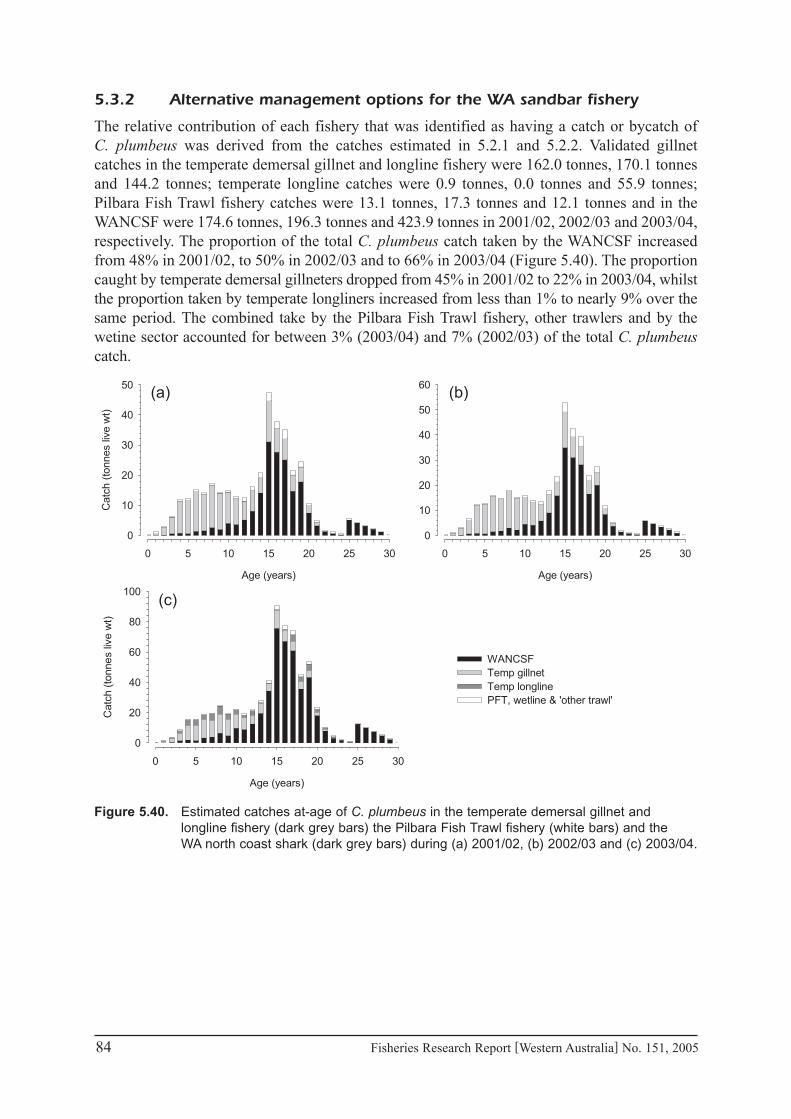
5.3.2 Alternative management options for the WA sandbar fishery
The relative contribution of each fishery that was identified as having a catch or bycatch of C. plumbeus was derived from the catches estimated in 5.2.1 and 5.2.2. Validated gillnet catches in the temperate demersal gillnet and longline fishery were 162.0 tonnes, 170.1 tonnes and 144.2 tonnes; temperate longline catches were 0.9 tonnes, 0.0 tonnes and 55.9 tonnes; Pilbara Fish Trawl fishery catches were 1�.1 tonnes, 17.� tonnes and 12.1 tonnes and in the WANCSF were 174.6 tonnes, 196.� tonnes and 42�.9 tonnes in 2001/02, 2002/0� and 200�/04, respectively. The proportion of the total C. plumbeus catch taken by the WANCSF increased from 48% in 2001/02, to 50% in 2002/0� and to 66% in 200�/04 (Figure 5.40). The proportion caught by temperate demersal gillneters dropped from 45% in 2001/02 to 22% in 200�/04, whilst the proportion taken by temperate longliners increased from less than 1% to nearly 9% over the same period. The combined take by the Pilbara Fish Trawl fishery, other trawlers and by the wetine sector accounted for between �% (200�/04) and 7% (2002/0�) of the total C. plumbeus catch.
Age (years)
0 5 10 15 20 25 30
Cat
ch (
tonn
es li
ve w
t)
0
10
20
30
40
50
Age (years)
0 5 10 15 20 25 30
0
10
20
30
40
50
60
Age (years)
0 5 10 15 20 25 30
Cat
ch (
tonn
es
live
wt)
0
20
40
60
80
100
WANCSFTemp gillnetTemp longlinePFT, wetline & 'other trawl'
(a) (b)
(c)
Figure 5.40. Estimatedcatchesat-ageofC. plumbeusinthetemperatedemersalgillnetand longlinefishery(darkgreybars)thePilbaraFishTrawlfishery(whitebars)andthe WAnorthcoastshark(darkgreybars)during(a)2001/02,(b)2002/03and(c)2003/04.
84 Fisheries Research Report [Western Australia] No. 151, 2005
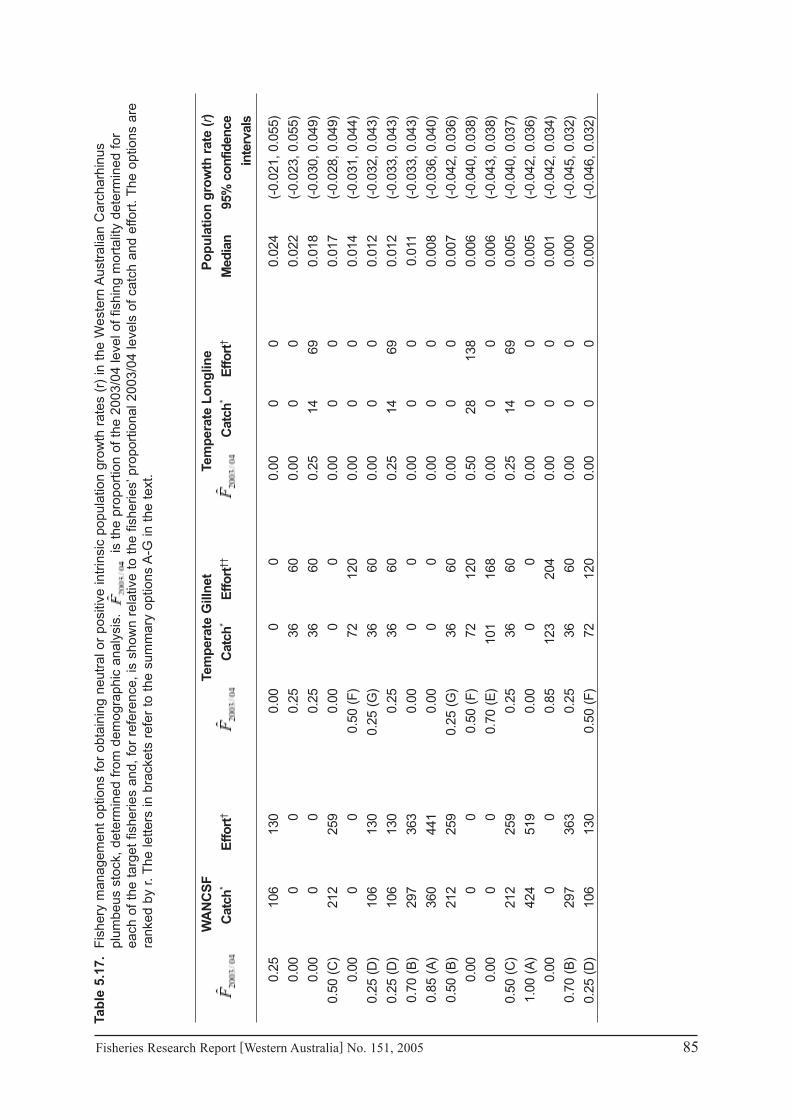
Tab
le 5
.17.
Fisherymanagem
entoptionsforobtainingneutralorpositiveintrinsicpopulationgrow
thrates(r)intheW
esternAustralianCarcharhinus
plum
beusstock,determinedfromdem
ographicanalysis.istheproportionofthe2003/04leveloffishingmortalitydeterminedfor
eachofthetargetfisheriesand,forreference,isshownrelativetothefisheries’proportional2003/04levelsofcatchandeffort.Theoptionsare
rankedbyr.Thelettersinbracketsrefertothesum
maryoptionsA-Ginthetext.
Fisheries Research Report [Western Australia] No. 151, 2005 85
W
AN
CS
F
Tem
per
ate
Gill
net
Te
mp
erat
e L
on
glin
e P
op
ula
tio
n g
row
th r
ate
(r)
Cat
ch*
Eff
ort
†
Cat
ch*
Eff
ort
††
C
atch
* E
ffo
rt†
Med
ian
95
% c
on
fiden
ce
in
terv
als
0.25
106
130
0.00
00
0.00
00
0.024
(-0.021,0.055)
0.00
00
0.25
36
60
0.00
00
0.022
(-0.023,0.055)
0.00
00
0.25
36
60
0.25
14
69
0.018
(-0.030,0.049)
0.50(C)
212
259
0.00
00
0.00
00
0.017
(-0.028,0.049)
0.00
00
0.50(F)
72
120
0.00
00
0.014
(-0.031,0.044)
0.25(D)
106
130
0.25(G)
36
60
0.00
00
0.012
(-0.032,0.043)
0.25(D)
106
130
0.25
36
60
0.25
14
69
0.012
(-0.033,0.043)
0.70(B)
297
363
0.00
00
0.00
00
0.011
(-0.033,0.043)
0.85(A)
360
441
0.00
00
0.00
00
0.008
(-0.036,0.040)
0.50(B)
212
259
0.25(G)
36
60
0.00
00
0.007
(-0.042,0.036)
0.00
00
0.50(F)
72
120
0.50
28
138
0.006
(-0.040,0.038)
0.00
00
0.70(E)
101
168
0.00
00
0.006
(-0.043,0.038)
0.50(C)
212
259
0.25
36
60
0.25
14
69
0.005
(-0.040,0.037)
1.00(A)
424
519
0.00
00
0.00
00
0.005
(-0.042,0.036)
0.00
00
0.85
123
204
0.00
00
0.001
(-0.042,0.034)
0.70(B)
297
363
0.25
36
60
0.00
00
0.000
(-0.045,0.032)
0.25(D)
106
130
0.50(F)
72
120
0.00
00
0.000
(-0.046,0.032)

86 Fisheries Research Report [Western Australia] No. 151, 2005
To test the outcomes of potential fishery management strategies, 65 hypothetical scenarios of fishing mortality in the various fishing sectors that catch C. plumbeus were tested in the model (Appendix II). A range of potential fishing mortality combinations, that would deliver neutral or positive population growth rates, were identified. Seventeen hypothetical combinations of fishing mortality that delivered neutral or positive intrinsic population growth rates were identified in the model (Table 5.17, Appendix II). Fifteen of these required zero fishing mortality in one or other of the target fisheries. The remaining two options required substantial reductions in both the WANCSF and the TDGDLF. These results are summarised as follows (unless otherwise stated, each case assumes zero fishing mortality in all other WA fishing sectors except the PFTF):
a. Maintaining the WANCSF at between 85 and 100% of its 200�/04 level of fishing mortality, requires closure of the temperate demersal gillnet and demersal longline fishery.
B. Reducing the WANCSF to 70% of its 200�/04 level of fishing mortality, would permit 25% of the 200�/04 level of exploitation by the temperate demersal gillnet fishery but would require closure of the temperate demersal longline fishery.
c. Reducing fishing mortality in the WANCSF to 50% of its 200�/04 level, would permit approximately 25% of the 200�/04 level of exploitation in the temperate demersal gillnet and demersal longline fishery.
d. Reducing fishing mortality in the WANCSF to 25% of its 200�/04 level, would permit either 25% of the 200�/04 level of exploitation in each of the temperate fisheries or 50% of the 200�/04 level of fishing in the temperate demersal gillnet fishery and no exploitation in the demersal longline fishery.
e. Maintaining the temperate gillnet fishery at between 70 and 85% of its 200�/04 level of exploitation, would permit 0% of the 200�/04 level of exploitation by the temperate longline fishery and the WANCSF.
f. Reducing the temperate gillnet fishery to 50% of its 200�/04 level of exploitation, would permit either 25% of the 200�/04 level of exploitation by the WANCSF and no exploitation by the temperate longline fishery (i.e. D above) or 50% of the 200�/04 level of exploitation by the temperate longline fishery and no exploitation by the WANCSF.
g. Reducing the temperate gillnet fishery to 25% of its 200�/04 level of exploitation, would permit either 70% of the 200�/04 level of exploitation by the WANCSF and no exploitation by the temperate longline fishery (i.e. B above) or 25% of the 200�/04 level of exploitation by the temperate longline fishery and no exploitation by the WANCSF. Other combinations are covered by the above points.

Fisheries Research Report [Western Australia] No. 151, 2005 87
5.3.3 Refining the dusky shark, Carcharhinus obscurus, stock assessment
5.3.3.1 Biological parameters
Table 5.18. SummaryofreproductiveandvonBertalanffydata,fromwhichC. obscurus demographicanalysisparametersweresampled.CI=confidenceinterval.
Reproductive parameters were sampled from data collected (according to the criteria given in 4.1.4) from 460 female C. obscurus, ranging in size from 64 cm FL to 289 cm FL. Specimens were collected between the 12th of June 199� and the 4th of June 2004, from waters west of the Lacepede Islands (17°S, 121°E) on the north coast to the east of Esperance (�4°S, 12�°E) on the south coast. Of these, 45 were mature (stages �-6, inclusive) and 21 were maturing (stage 2). The smallest mature shark measured 250 cm FL and the largest immature shark was 255 cm. By fitting the logistic maturity function to the proportion of mature sharks by 5 cm FL size classes, the length at which 50% of female C. obscurus were mature was estimated to be 251.� cm FL (Figure 5.41), with 95% confidence that L0.5 was between 247.5cm FL and 25.4 cm FL (Table 5.18). Litters from eleven pregnant females contained between six and 1� embryos. Mean litter size was 9.9 with a standard deviation of 2.7.
Proportion Age at Max Litter female Breeding L0.5 maturity K L∞ t0 age
size embryos freq. (yr) (cm FL) b (α, yr) (yr-1) (cm FL) (yr) (w, yr)
Mean 9.9 0.50 3 254.1 0.439 30 0.0367 374.4 -3.3 45
Std.Dev. 2.7 0.1
min 2.1 0.10 2 245.4 0.210 27 0.0191 302.6 -4.0 40
max 17.8 0.85 4 261.1 0.808 35 0.0519 573.2 -2.9 55
Lower95%CI4.7 0.29 2 247.5 0.227 27 0.0262 317.7 -3.7 40
Upper95%CI15.1 0.70 4 259.5 0.769 32 0.0476 460.8 -3.0 53

88 Fisheries Research Report [Western Australia] No. 151, 2005
Fork Length (cm)
180 200 220 240 260 280 300
Num
ber
of s
peci
men
s
0
2
4
6
8
10
12
Pro
port
ion
mat
ure
0.0
0.2
0.4
0.6
0.8
1.0
Stage 1, immature (n=48) Stage 2, maturing (n=21)Stage 3, mature (n=45)
Figure 5.41. Maturity(uterine)stagesof114femaleCarcharhinus obscurus, measuringbetween175cmand300cmFL,sampledbetweenJune1993andJune2004.Curveistheproportionofmaturesharksby5cmFLsizeclasses,asdeterminedbylogisticregressionanalysis;dashedverticallineindicatestheestimatedsizeat50%maturity(L0.5);errorbarsare95%confidenceintervalsoftheestimatedL0.5.
Length at age data were estimated from vertebral samples of 127 female C. obscurus collected in waters between the Montebello Islands (20°S 115°E) on the north coast and east of Esperance (��°S 124°E) on the south coast between the 10th of June 199� and the 4th of October 1998. Sharks ranged in size from 69 cm FL to 282 cm FL, with estimated ages between 0 and �2 years (Figure 5.42). When fitted to the assumed size at birth (L0) of 75.� cm FL, the fitted von Bertalanffy growth curve yielded parameter values of k=0.04� yr-1, L∞=�54.4 cm FL and t0= -�.0 years. The 95% confidence intervals of bootstrapped von Bertalanffy parameter estimates were k=0.026 and 0.048 yr-1, L∞=�17.7 and 460.8 cm FL and t0= -�.0 and -�.7 years. Age at 50% maturity was thereby estimated with 95% confidence to be between 27 and �2 years of age (Table 5.18), far higher than the 14-24 years tested in the previous assessment.

Fisheries Research Report [Western Australia] No. 151, 2005 89
Age (years)
0 10 20 30
FL
(cm
)
50
100
150
200
250
300
350
Figure 5.42. vonBertalanffygrowthcurvefittedtolengthatageestimatesof127female Carcharhinus obscurusfromWesternAustralia(fromSimpfendorferetal2002).
5.3.3.2 Natural mortality rates
Table 5.19. Ageindependentestimatesofinstantaneousannualratesofnaturalmortalityused inthecurrentandpreviousdemographicanalysesofC. obscurus. M=medianof 1,000estimates(unitsyr-1);CI=confidenceintervals.
Based on the von Bertalanffy parameters derived from the empirical length at age data, rates of natural mortality estimated by the Pauly (1980) and Jensen (1996) methods were lower than those used in the previous assessment (Table 5.19). The rates estimated by the methods of Hoenig (198�), however, gave higher values than was previously estimated from method i (for teleosts). All of the age-independent methods resulted in lower rates of natural mortality than were estimated for C. plumbeus.
Method M Min Max 95% CI Previous assessment
Pauly(1980,meanwatertemp=20°C) 0.088 0.050 0.115 (0.064-0.107) 0.110
Hoenig(1983),methodi 0.094 0.075 0.104 (0.078-0.104) 0.083
Hoenig(1983),methodii 0.094 0.078 0.102 (0.080-0.102)
Hoenig(1983),methodiii 0.103 0.082 0.113 (0.084-0.113)
Jensen(1996),methodi 0.056 0.049 0.062 (0.051-0.061) 0.082
Jensen(1996),methodii 0.055 0.029 0.078 (0.039-0.071) 0.081
Jensen(1996),methodiii 0.059 0.035 0.083 (0.042-0.076) 0.086

90 Fisheries Research Report [Western Australia] No. 151, 2005
Table 5.20. AgedependentestimatesofnaturalmortalityratesofC. obscurus. =meanof1,000estimatesfrombootstrappedbiologicalparameterestimates(unitsyr-1);CI=confidenceinterval.
Petersen Chen & Stochastically & Wroblewski (1984) Watanabe (1989) estimatedAgeclass M M 95% CI M 95% CI
0+ 0.131 0.319 (0.280-0.354) 0.176 (0.061-0.311)1+ 0.119 0.250 (0.224-0.273) 0.159 (0.060-0.243)2+ 0.109 0.207 (0.187-0.223) 0.133 (0.058-0.203)3+ 0.102 0.177 (0.161-0.191) 0.118 (0.057-0.173)4+ 0.095 0.156 (0.142-0.167) 0.104 (0.058-0.152)5+ 0.090 0.139 (0.128-0.150) 0.098 (0.057-0.137)6+ 0.086 0.127 (0.116-0.136) 0.087 (0.057-0.124)7+ 0.082 0.116 (0.106-0.125) 0.087 (0.056-0.114)8+ 0.079 0.108 (0.098-0.117) 0.081 (0.056-0.106)9+ 0.076 0.101 (0.092-0.109) 0.079 (0.056-0.102)10+ 0.073 0.095 (0.086-0.103) 0.078 (0.056-0.101)11+ 0.071 0.090 (0.081-0.098) 0.079 (0.056-0.101)12+ 0.069 0.085 (0.077-0.093) 0.078 (0.056-0.101)13+ 0.067 0.082 (0.073-0.089) 0.079 (0.056-0.101)14+ 0.065 0.078 (0.070-0.086) 0.080 (0.056-0.101)15+ 0.064 0.075 (0.067-0.083) 0.078 (0.056-0.101)16+ 0.062 0.072 (0.064-0.080) 0.078 (0.056-0.101)17+ 0.061 0.070 (0.062-0.077) 0.079 (0.056-0.102)18+ 0.060 0.068 (0.060-0.075) 0.079 (0.056-0.102)19+ 0.059 0.066 (0.058-0.073) 0.077 (0.055-0.102)20+ 0.058 0.064 (0.056-0.071) 0.078 (0.056-0.102)21+ 0.057 0.062 (0.054-0.070) 0.080 (0.056-0.101)22+ 0.056 0.061 (0.053-0.068) 0.081 (0.057-0.102)23+ 0.055 0.059 (0.051-0.067) 0.079 (0.056-0.101)24+ 0.054 0.058 (0.050-0.066) 0.080 (0.056-0.101)25+ 0.054 0.057 (0.049-0.065) 0.079 (0.055-0.101)26+ 0.053 0.056 (0.048-0.064) 0.079 (0.054-0.101)27+ 0.052 0.055 (0.047-0.063) 0.078 (0.054-0.102)28+ 0.052 0.054 (0.046-0.062) 0.077 (0.053-0.101)29+ 0.051 0.053 (0.045-0.061) 0.078 (0.053-0.101)30+ 0.051 0.052 (0.044-0.060) 0.077 (0.052-0.101)31+ 0.050 0.051 (0.043-0.059) 0.077 (0.051-0.101)32+ 0.050 0.051 (0.042-0.059) 0.077 (0.051-0.102)33+ 0.050 0.050 (0.042-0.058) 0.074 (0.051-0.101)34+ 0.049 0.049 (0.041-0.057) 0.076 (0.050-0.101)35+ 0.049 0.049 (0.040-0.057) 0.075 (0.049-0.101)36+ 0.048 0.049 (0.040-0.056) 0.075 (0.050-0.102)37+ 0.048 0.050 (0.039-0.056) 0.075 (0.048-0.101)38+ 0.048 0.050 (0.039-0.055) 0.075 (0.048-0.101)39+ 0.048 0.060 (0.038-0.055) 0.074 (0.048-0.102)40+ 0.047 0.074 (0.038-0.818) 0.076 (0.047-0.102)41+ 0.047 0.087 (0.037-0.827) 0.074 (0.047-0.101)42+ 0.047 0.102 (0.037-0.835) 0.075 (0.047-0.101)43+ 0.046 0.106 (0.036-0.842) 0.073 (0.046-0.101)44+ 0.046 0.130 (0.036-0.849) 0.075 (0.046-0.101)45+ 0.046 0.155 (0.036-0.856) 0.073 (0.045-0.101)46+ 0.046 0.176 (0.035-0.862) 0.073 (0.045-0.102)47+ 0.046 0.198 (0.035-0.868) 0.073 (0.044-0.101)48+ 0.045 0.216 (0.035-0.874) 0.072 (0.044-0.101)49+ 0.045 0.242 (0.034-0.879) 0.074 (0.044-0.101)50+ 0.045 0.266 (0.034-0.883) 0.073 (0.043-0.102)51+ 0.045 0.294 (0.034-0.888) 0.073 (0.044-0.102)52+ 0.045 0.314 (0.033-0.891) 0.073 (0.043-0.101)53+ 0.045 0.343 (0.033-0.894) 0.073 (0.043-0.101)54+ 0.045 0.376 (0.033-0.897) 0.070 (0.042-0.101)55+ 0.044 0.411 (0.033-0.899) 0.072 (0.043-0.101)

Fisheries Research Report [Western Australia] No. 151, 2005 91
Due to the relatively higher weight at age of C. obscurus, the age-dependent rates of natural mortality estimated by the Petersen and Wroblewski (1984) method were consistently lower than those for C. plumbeus (Table 5.20). The Chen and Watanabe (1989) method, however yielded slightly higher rates of M for the youngest age classes of C. obscurus than C. plumbeus. Also unlike C. plumbeus, where natural mortality was estimated to increase rapidly in the oldest age classes, mortality of older C. obscurus increased slowly and steadily after �9 years of age.
5.3.3.3 Tag non-reporting rates
Table 5.21. Annualtagnon-reportingratesestimatedfromvalidatedC. obscuruscatches, reportedandestimatedtagcapturesinthethreemanagementzones(denotedbyi) oftheWAtemperatedemersalgillnetanddemersallonglinefisheries.
Annual non-reporting rates of tag captures, estimated from validated catches in all three regions of the temperate demersal gil lnet and demersal longline fisheries varied between 0.00 (region 2, 2001) and 0.�6 (region �, 1995) (Table 5.21). Whilst the magnitude of these rates are similar to the monthly rates estimated for the previous assessment (Simpfendorfer et al., 1999; Simpfendorfer, 1999), there were noticeable differences between the monthly data from which the annual rates were estimated for this study and those calculated in the previous study (Figure 5.4�).
Valid C. obscurus Annual non-reporting Reported tag Estimated tag
catch (t live wt) Rates (Di,t) captures (Ci,T) Captures ( i,T)
Year i=1 i=2 i=3 i=1 i=2 i=3 i=1 i=2 i=3 i=1 i=2 i=3
1994 181 134 172 0.19 0.20 0.30 34 3 28 42 4 401995 126 87 133 0.09 0.09 0.36 68 10 37 75 11 581996 144 101 166 0.26 0.30 0.31 50 12 22 68 17 321997 142 116 113 0.34 0.30 0.18 10 12 7 15 17 91998 96 113 69 0.31 0.23 0.14 4 4 6 6 5 71999 193 90 75 0.13 0.31 0.08 2 1 2 0 12000 143 83 57 0.30 0.17 0.15 1 0 0 12001 111 75 54 0.17 0.00 0.15 1 2 0 1 22002 112 67 73 0.21 0.16 0.21 1 0 1 02003 97 83 78 0.23 0.15 0.14 2 3 0 0

92 Fisheries Research Report [Western Australia] No. 151, 2005
Jul 94 Jan 95 Jul 95 Jan 96Mon
thly
tag
non-
repo
rtin
g ra
te (D
i,t)
0.0
0.2
0.4
0.6
0.8
1.0
Month
Jul 94 Jan 95 Jul 95 Jan 96
0.0
0.1
0.2
0.3
0.4
Month
Jul 94 Jan 95 Jul 95 Jan 96Mon
thly
tag
non-
repo
rtin
g ra
te (D
i,t)
0.0
0.2
0.4
0.6
0.8
(a) (b)
(c)
Figure 5.43. Comparisonbetweenregionalmonthlytagnon-reportingratesestimatedfromdata usedinthisstudy(solidlines)andthosefrompreviousassessment(dottedlines, Simpfendorferetal.,1999;Simpfendorfer,1999).
5.3.3.4 Fishing mortality
As in the previous study (Simpfendorfer et al., 1999; Simpfendorfer, 1999), age-specific fishing mortality rates experienced by the 1994 and 1995 cohorts were estimated to be highest for 0+ age classes and to subsequently decline at older ages (Figure 5.44). Exploitation was determined to be slightly lower than previously estimated for the 0+ age-class and slightly higher for the 1+ age class of both the 1994 and 1995 cohorts. Both studies estimated similar exploitation rates of sharks aged between two and five years, however the present study estimated lower fishing mortality rates for these age classes in the 1995 cohort. Whilst the previous assessment assumed that exploitation of sharks older than 6 years was zero, it was possible to estimate rates of fishing mortality for age-classes up to 9+ years from longer-term tag capture data. Although these rates were low at between 0.5% yr-1 and 1.2% yr-1, their inclusion in the current assessment is important, given the very low levels of mortality that the previous assessment concluded were sustainable.

Fisheries Research Report [Western Australia] No. 151, 2005 9�
Age class (years)
0 1 2 3 4 5 6 7 8 9 10
Fis
hing
mor
talit
y (Fx,t)
0.00
0.05
0.10
0.15
0.20
0.25
0.30
Age class (years)
0 1 2 3 4 5 6 7 8 9 10
Fis
hing
mor
talit
y (Fx,t)
0.00
0.05
0.10
0.15
0.20
0.25(b)
(a)
Figure 5.44. Fishingmortalityratesestimatedfor(a)1994and(b)1995Carcharhinus obscurus cohortsinthecurrentstudy(greybars)andinthepreviousstudy(whitebars). Errorbarsindicate95%confidenceintervalsofestimates.
5.3.3.5 Demographic analysis
Based on a reproductive periodicity of two-years, in the absence of fishing mortality the Western Australian C. obscurus population was estimated to be potentially able to increase at rates of between 0.018 yr-1 (according to Hoenig, 198�, method iii) and 0.064 yr-1 (according to Jensen, 1996, methods i and ii, Appendix III, table i). Using stochastically derived rates of natural mortality, the median rate of potential population growth (r) was �.�% per year, with 95% confidence that under these conditions, r was between 0.004 and 0.055 yr-1 (Table 5.22; Appendix III, table i). With a three-year breeding frequency and zero fishing mortality, rates of potential population growth were between 0.004 yr-1 (Hoenig, 198�, method iii) and 0.051 yr-1 (Jensen, 1996, method ii, Appendix III, table ii). With stochastically estimated

94 Fisheries Research Report [Western Australia] No. 151, 2005
natural mortality, r was estimated to be 0.020 yr-1, with 95% confidence intervals of –0.008 yr-1 and 0.041 yr-1 (Table 5.22; Appendix III, table ii). With a four year breeding periodicity, r was estimated to be between –0.004 yr-1 (Hoenig, 198�, method iii) and 0.041 yr-1 (Jensen, 1996, method I, Appendix III, table iii) and with stochastically estimated natural mortality was 0.010 yr-1 (95% confidence intervals between –0.018 yr-1 and 0.0�2 yr-1; Appendix III, table iii). By randomly sampling breeding frequency from values of two, three and four years, r was estimated to vary between –0.008 yr-1 (Hoenig, 198�, method iii) and 0.0�7 yr-1 (Jensen, 1996, methods i and ii, Appendix III, table iv) and with stochastically estimated natural mortality was 0.008 yr-1 (95% confidence intervals between –0.027 yr-1 and 0.0�5 yr-1, Table 5.22; Appendix III, table iii). The best estimate of breeding frequency (i.e. randomly sampling between two and three years) resulted in median values of r that ranged between 0.01� yr-1 (Hoenig, 198�, method iv) and 0.057 yr-1 (Jensen, 1996, methods i and ii, Appendix III, table v) and with stochastically estimated natural mortality, of 0.025 yr-1 (95% confidence intervals between –0.007 yr-1 and 0.052 yr-1, Table 5.22; Appendix III, table v). These potential rates of population growth are far lower than the previous assessment’s best estimate of 0.042 yr-1, indicating that this stock is able to withstand lower levels of fishing mortality than were previously believed to be sustainable.
The age-specific exploitation rates previously estimated for the 1994 and 1995 cohorts (Simpfendorfer et al., 1999; Simpfendorfer, 1999), yielded similar potential population growth rates as the fishing mortality rates estimated for those cohorts in the current assessment (Table 5.22; Appendix III, tables vi-xxv). With the best estimate of breeding frequency (2-� years), the previously estimated exploitation rates yielded r estimates of 0.00 (95% confidence intervals between –0.0�8 and 0.0�4) and 0.00� (95% confidence intervals between –0.0�6 and 0.0�7) for the 1994 and 1995 cohorts, respectively. The fishing mortalities calculated in the current study estimated r as 0.00 (95% confidence intervals between –0.0�6 and 0.0�5) and 0.008 (95% confidence intervals between –0.0�1 and 0.040) for the 1994 and 1995 cohorts, respectively. With a breeding period of 2 years these rates increased to 0.007 (95% confidence intervals between –0.026 and 0.0�8) and 0.01� (95% confidence intervals between –0.022 and 0.044) for the two cohorts. At these marginal levels of potential population growth, the impacts of additional external fishing mortality (i.e. outside that inflicted by the temperate demersal gillnet and demersal longline fisheries) would be more severe than the previous assessment indicated.

Fisheries Research Report [Western Australia] No. 151, 2005 95
Tab
le 5
.22.
Sum
maryofdem
ographicanalysisresultsfor
Car
char
hinu
s ob
scur
us understochasticallyestimatedratesofnaturalm
ortality
(M)andvarious
schedulesoffishingmortality.
Fis
hin
g
R
epro
du
ctiv
e
Pro
po
rtio
n r
each
ing
N
et r
epro
d. r
ate
Gen
erat
ion
tim
e D
ou
blin
g t
ime
Po
ten
tial
po
p. g
row
th
mo
rtal
ity
C
oh
ort
fr
equ
ency
(yr
) m
atu
rity
(P
M)
R0
(no
yr-1 )
G
(yr
) tx
2 (y
r)
rate
(r
yr-1
)sc
hed
ule
Nofishing
n/a
20.066(0.023,0.149)
2.1(0.7,6.2)
31.4(29.7,33.5)
25.1(-171.9,230.6)
0.024(-0.010,0.058)
30.063(0.023,0.135)
1.4(0.5,3.5)
31.4(29.8,33.5)
31.2(-536.1,484.0)
0.011(-0.022,0.040)
40.065(0.025,0.150)
1.0(0.4,2.8)
31.4(29.7,33.7)
22.2(-675.5,689.7)
0.001(-0.032,0.033)
2-3
0.06
3 (0
.023
, 0.1
39)
1.7
(0.5
, 4.9
) 31
.4 (
29.8
, 33.
4)
27.3
(-3
24.7
, 332
.9)
0.01
6 (-
0.02
0, 0
.052
)
2-4
0.063(0.024,0.147)
1.4(0.4,4.9)
31.5(29.7,33.6)
27.2(-441.1,475.0)
0.012(-0.026,0.051)
Simpfendorfer
etal.,1999;
1994
20.036(0.013,0.086)
1.2(0.4,3.4)
31.4(29.7,33.7)
29.5(-414.9,602.7)
0.006(-0.030,0.039)
Simpfendorfer,
1999
30.038(0.014,0.084)
0.8(0.3,2.4)
31.4(29.7,33.6)
-27.8(-635.9,642.6)
-0.007(-0.044,0.028)
40.043(0.016,0.095)
0.7(0.2,1.9)
31.4(29.6,33.6)
-29.5(-426.3,336.0)
-0.012(-0.051,0.021)
2-3
0.03
7 (0
.014
, 0.0
82)
1.0
(0.3
, 2.9
) 31
.4 (
29.7
, 33.
8)
-13.
3 (-
586.
6, 6
93.0
) 0.
000
(-0.
038,
0.0
34)
2-4
0.038(0.014,0.086)
0.9(0.2,2.9)
31.4(29.7,33.7)
-23.8(-540.7,416.7)
-0.005(-0.044,0.033)
1995
20.042(0.016,0.093)
1.4(0.5,3.6)
31.5(29.8,33.6)
34.0(-565.7,524.7)
0.010(-0.022,0.040)
30.041(0.015,0.093)
0.9(0.3,2.7)
31.4(29.7,33.6)
-24.0(-439.9,578.6)
-0.003(-0.039,0.031)
40.043(0.016,0.095)
0.7(0.2,1.9)
31.4(29.6,33.6)
-29.5(-426.3,336.0)
-0.012(-0.051,0.021)
2-3
0.04
(0.
015,
0.0
91)
1.1
(0.3
, 3.2
) 31
.4 (
29.8
, 33.
4)
23.8
(-6
78.2
, 522
.3)
0.00
3 (-
0.03
6, 0
.037
)
2-4
0.041(0.015,0.092)
0.9(0.3,3.0)
31.4(29.8,33.7)
-19.2(-445.2,572.8)
-0.002(-0.041,0.035)
Thisstudy
1994
20.038(0.014,0.087)
1.2(0.4,3.3)
31.4(29.8,33.6)
29.8(-617.0,599.9)
0.007(-0.026,0.038)
30.038(0.014,0.087)
0.8(0.3,2.3)
31.4(29.8,33.5)
-28.2(-528.1,586.3)
-0.006(-0.043,0.026)
40.036(0.014,0.084)
0.6(0.2,1.7)
31.3(29.7,33.7)
-28.2(-402.2,393.3)
-0.016(-0.052,0.016)
2-3
0.03
8 (0
.014
, 0.0
89)
1.0
(0.3
, 3.0
) 31
.4 (
29.8
, 33.
6)
17.1
(-9
53.8
, 798
.5)
0.00
0 (-
0.03
6, 0
.035
)
2-4
0.037(0.014,0.080)
0.9(0.3,2.5)
31.4(29.8,33.6)
-23.0(-561.5,486.1)
-0.004(-0.043,0.029)
1995
20.045(0.016,0.103)
1.5(0.5,4.1)
31.3(29.7,33.6)
31.7(-399.7,472.7)
0.013(-0.022,0.044)
30.046(0.017,0.100)
1.0(0.3,2.8)
31.3(29.7,33.5)
15.4(-563.4,847.2)
0.000(-0.040,0.033)
40.045(0.016,0.103)
0.7(0.3,2.0)
31.4(29.7,33.5)
-31.4(-592.8,740.5)
-0.009(-0.044,0.022)
2-3
0.04
7 (0
.017
, 0.1
04)
1.3
(0.4
, 3.6
) 31
.4 (
29.7
, 33.
7)
28.9
(-5
14.2
, 652
.0)
0.00
8 (-
0.03
1, 0
.040
)
2-4
0.044(0.016,0.103)
1.0(0.3,3.2)
31.3(29.6,33.5)
-11.2(-463.3,542.9)
-0.001(-0.042,0.037)

96 Fisheries Research Report [Western Australia] No. 151, 2005
The previous assessment predicted that even low levels of exploitation of older age classes would be likely to result in the WA C. obscurus population declining. The levels of fishing mortality of sharks older than 10 years that would lead to such a decline were therefore re-estimated, assuming a 2-� year breeding period, in the new demographic model. Under the schedule of age-specific fishing mortality calculated for the 1994 cohort, the model predicted with 55% certainty that if sharks older than 10 years of age were subject to a fishing mortality rate greater than 0.01 yr-1 (i.e. 1.0% yr-1), the population was likely to decline (with 95% confidence that the rate could be no higher than 4.4% yr-1). For the 1995 cohort, this rate was estimated with to be 2.0% yr-1 (with 95% confidence that the rate could be no higher than 5.2% yr-1).
On the basis of these results it now appears far more likely that any additional mortality of older C. obscurus in catches and bycatch of other fisheries operating in Western Australian waters have lead to, at least temporarily, unsustainable levels of C. obscurus fishing mortality. However, given that catches of this species by the WA temperate demersal gillnet and longline fisheries have declined substantially since the tagging project was conducted (see 5.2.1.1), it is also possible that rates of juvenile fishing mortality have also decreased over the last decade.
6.0 ConclusionsThis FRDC-funded project has provided critical information, which has enabled the Western Australian Department of Fisheries to develop robust management strategies to deal with the rapidly escalating catches from the State’s Carcharhinus plumbeus population. Results from this project have already been used as the basis for developing an entirely new package of management arrangements for the WA North Coast Shark Fishery (Appendix IV) to ensure its long-term viability. These measures, together with some planned additional refinement of the West Coast Demersal Gillnet and Demersal Longline Fishery’s management plan, will also ensure the sustainability of two of the State’s temperate demersal gillnet and demersal longline fisheries’ primary target species. It is hoped that the improved assessment of Western Australia’s commercial shark stocks, which has been made possible by this and previous FRDC grants, will assist the State’s shark fisheries to meet the Australian government’s criteria for Ecologically Sustainable Management of Fisheries under Part 1� and 1�A of the Environment Protection and Biodiversity Act (1999). The major conclusions of this project include:
• The Western Australian range of the sandbar shark, Carcharhinus plumbeus, is between at least Cape Leveque (16° �0’S, 12�°E) in the north and Point D’Entrecasteaux (116°E) on the south coast. The species’ apparent absence in the northern Kimberley and in south eastern waters, suggests that the Western Australian C. plumbeus stock is separate from that on the east coast of Australia.
• This stock exhibits a considerable degree of segregation between juvenile sharks, which are prevalent in deeper continental-shelf waters south of 26°S latitude and adults, which are more abundant in more northerly waters. Neonate sharks, which are rarely caught in the target temperate demersal gillnet and demersal longline fisheries, primarily occur in waters south of the Houtman Abrolhos Islands. However, as small numbers of neonates were also observed as far north as Broome, parturition apparently occurs throughout the species Western Australian range.
• Tagging data supports the hypothesis that juveniles born in the south west of the State remain in temperate waters for several years and slowly migrate northwards to join the breeding stock in the north-west as sub-adults or adults.

Fisheries Research Report [Western Australia] No. 151, 2005 97
• To support the above conclusions adults must migrate into temperate waters to give birth. Whilst direct evidence of such migration was limited, several tag recaptures do support this hypothesis. These include two sub-adult and adult-sized tagged sharks, which travelled from NW Cape to the Abrolhos, two from NW Cape to Shark Bay and one from Cape Leveque to NW Cape. Most of these movements, including the latter, took less than 12 months to complete. Further, the dispersal rates of several tagged sharks demonstrated that sandbar sharks are probably capable of migrating distances of over 1,000 km in less than 1 year.
• Western Australian sandbar sharks are generally smaller at birth (40-45 cm FL) and attain a smaller maximum size (172 cm FL and 166 cm FL, observed in this study for males and females, respectively) than other populations for which data are available. Based on the results of vertebral analysis and maximum observed and reported sizes, maximum age was estimated to be at least �0 years and possibly as high as 40.
• The Western Australian sandbar shark population also attains sexual maturity at smaller sizes (127 cm FL and 1�6 cm FL for males and females, respectively) than populations elsewhere, notably those in the western North Atlantic and western Indian Ocean. However age at maturity (14 years and 16 years, for males and females, respectively) was found not to differ markedly from other populations.
• The von Bertalanffy growth curves derived from the tag-return data in the present study bore little resemblance to those estimated from the larger vertebral analysis dataset. The estimated level of natural variability in the growth of individual sharks suggests that in some situations, tagging data provide an unreliable basis for either determining or verifying growth rates of the population (as has been attempted in some previous studies). These situations include when most of the data come from short-term recaptures (when growth-increments are most variable) and when sample sizes are small relative to the amount of variation as were both the case in this study. These tagging data were therefore concluded to be a less reliable descriptor of age and growth than the length at age data derived from vertebral analysis and were therefore not included in the current stock assessment.
• In conjunction with the relatively small litters (mean of 6.5), 12-month gestation period and two-year breeding frequency, determined for this population, this combination of life-history parameters gives the WA sandbar shark stock a lower than expected capacity to withstand fishing pressure.
• In addition to this stock’s inherently low productivity, the results from gillnet mesh- selectivity trials demonstrated that the gillnets used in the temperate WA demersal gillnet fishery are much less size-selective for sandbar sharks than they are for the related and co-occurring dusky shark, Carcharhinus obscurus. The consequence of this, as well as the relatively high abundance of juvenile sandbar sharks within the temperate demersal gillnet fishery (particularly the WCDGDLF) is that most juvenile age-classes are vulnerable to capture in the temperate gillnet fisheries.
• Fishing mortality rates, determined from tag captures, also indicated that exploitation of juvenile sandbar sharks was relatively high across multiple age-classes.
• In addition to the relatively high levels of gillnet fishing mortality, longline catches of larger sandbar sharks in the WANCSF and, in the most recent years, in the WCDGDLF escalated rapidly over the course of this project.

98 Fisheries Research Report [Western Australia] No. 151, 2005
• Through demographic analysis, the combined levels of C. plumbeus fishing mortality were found to have become increasingly unsustainable over the course of the project. The best estimates of the potential rates of population growth, given the empirically measured biological constraints and estimated rates of fishing mortality, were –�.2% yr-1 in 2001/02, -0.9% yr-1 in 2002/0�, -4.9% yr-1 in 200�/04 and projected to be –7.8% yr-1 in the current year (2004/05).
• Several potential combinations of fishing mortality that would deliver neutral or positive population growth rates were identified from the demographic model. As both of the target fisheries contribute to the exploitation of this stock, appropriate levels of exploitation in the WANCSF could not be determined independently of exploitation by the TDGDLF (mainly in the WCDGDLF) and vice versa. The model indicated that to achieve the capacity for positive growth in the population, and thus reverse the current declining trend in this stock, major reductions in fishing mortality are necessary in both the WANCSF and in the TDGDLF, unless the fishing mortality in one or other fishery is reduced to zero
• Re-assessment of the status of the dusky shark, Carcharhinus obscurus, using the new demographic analysis techniques developed for sandbar sharks, empirically measured biological data and longer-term tag-capture data, also indicate that this species is less resilient to fishing than was previously estimated.
• However, the model also indicated that the rates of age-specific fishing mortality experienced by sharks released as neonates in 1994 and 1995 were probably sustainable, as long as there was negligible additional fishing mortality (less than 1-2% yr-1) outside the demersal gillnet and longline fisheries. The lower estimate of the sustainable level of external fishing mortality is in keeping with recent analyses of dusky shark CPUE data from the demersal gillnet and longline fisheries, which indicate that the breeding stock of dusky sharks has been in decline for some years and is leading to a reduction in recruitment.
• The stochastic demographic analysis framework developed during this project is a significant improvement on previous deterministic approaches to demographic assessment of shark populations. It is thought that these techniques, which account for the uncertainty and variability in the life-history characteristics of the Western Australian sandbar and dusky shark stocks, will benefit other researchers and fishery management agencies in the assessing shark stocks for which available time-series of catch and effort data are insufficient for construction of other types of model.

Fisheries Research Report [Western Australia] No. 151, 2005 99
7.0 BenefitsThe Western Australian shark fisheries, Department of Fisheries and the broader community have already received considerable benefit from identification of the unsustainable levels of fishing being experienced by the sandbar shark stock, before irreparable depletion had occurred. This research has enabled sustainable management arrangements to be developed for the Western Australian northern shark fisheries. The temperate demersal Gillnet and demersal longline fisheries, in which sandbar sharks have become a major component of the catch, will also benefit from the identification of the risk to this commercially important stock. Together with new management arrangements for the northern shark fisheries and imminent adjustments of the WCDGDLF management plan will not only ensure the continuing viability of these fisheries but will also greatly assist in their assessment under the Australian Government’s Ecologically Sustainable Management of Fisheries criteria. The techniques and expertise developed in assessing the sandbar stock and reassessing the dusky shark stock will also improve the WA Department of Fisheries’ ability to evaluate harvest strategies for key shark species, enabling more effective decision making processes for the management of the stocks.
8.0 AcknowledgementsThe completion of this project would not have been possible without the considerable assistance of the Western Australian shark fishing industry and their contribution is very gratefully acknowledged. The authors also wish to thank all the WA Department of Fisheries’ staff who contributed to the collection of data, especially Ryan Ashworth, Dennyse Newbound, Ben Sale and the skipper and crew of the Research Vessels Flinders and Naturaliste. Many thanks are due to all of the staff at the WA Marine Research Laboratory who provided invaluable advice throughout the project and during the analysis of data and drafting of this report. Particular thanks are due to Dr. Mike Moran who was instrumental in initiating this project, Dr Colin Simpfendorfer (Mote Marine Laboratory, Florida), who provided considerable advice on most of these analyses and Dr. Glenn Hyndes (Edith Cowan University), for his advice and support over the last four years. The detailed reviews of the stock assessment undertaken by Associate Professor Norm Hall (Centre for Fish and Fisheries, Murdoch University) and Professor Carl Walters (University of British Columbia, Fisheries Centre) have also greatly improved this report and they are also gratefully acknowledged.

100 Fisheries Research Report [Western Australia] No. 151, 2005
9.0 ReferencesBeamish, R.J. and Fournier, D.A. 1981. A method for comparing the precision of a set of age
determinations. Can. J. Fish. Aquat. Sci. �8: 982-98�
van Belle, G. 2004. Statistical rules of thumb. http://www.seattlecrc.org/vbelle
Beerkircher, L., Shivji, M. and Cortés, E. 200�. A Monte Carlo demographic analysis of the silky shark (Carcharhinus falciformis): implications of gear selectivity. Fish Bull. 101: 168-174
Brewster-Geisz, K. K., and T. J. Miller. 2000. Management of the sandbar shark, Carcharhinnus plumbeus: implications of a stage-based model. Fish. Bull. 98: 2�6-249.
Cailliet, G. M. 1992. Demography of the central Californian population of the leopard shark (Triakis semifasciata). Australian Journal of Marine and Freshwater Research 4�: 18�-19�.
Chen, S., and S. Watanabe. 1989. Age dependence of natural mortality coefficient in fish populations dynamics. Nippon Suisan Gakkaishi 55: 205-208.
Cortés, E. 1995. Demographic analysis of the Atlantic sharpnose shark, Rhizoprionodon terraenovae, in the Gulf of Mexico. Fishery Bulletin 9�: 57-66.
Cortés, E. 1999. A stochastic stage-based population model of the sandbar shark in the Western North Atlantic. p. 115-1�6. In, Life in the slow lane. Ecology and conservation of long-lived marine animals. J. A. Musick (ed.). American Fisheries Society Symposium 2�, Bethesda, Maryland.
Cortés, E. 2002. Incorporating uncertainty into demographic modeling: application to shark populations and their conservation. Conservation Biology 16: 1048-1062.
Cortés, E., And G. R. Parsons. 1996. Comparative demography of two populations of the bonnethead shark (Sphyrna tiburo). Canadian Journal of Fisheries and Aquatic Sciences 5�: 709-718.
Francis, M.P., Griggs, L. H., Baird, S.J., Murray, T.E. & Dean, H. A. 2000. Fish bycatch in New Zealand tuna longline fisheries, 1988–89 to 1997–98. NIWA Technical Report 76.
Gaughan and Chidlow, 2005a. Demersal Gillnet and Demersal Longline Fisheries status report. In: State of the Fisheries Report 200�/04, eds, J.W. Penn, W.J. Fletcher and F. Head, Department of Fisheries, Western Australia, pp. 186-191
Gaughan and Chidlow, 2005b. Northern Shark Fisheries status report. In: State of the Fisheries Report 200�/04, eds, J.W. Penn, W.J. Fletcher and F. Head, Department of Fisheries, Western Australia, pp. 146-150
Hancock, D. A. and Edmonds, J.S. 1977. Mercury in shark in Western Australia. A preliminary report. Fish. Res. Bull. Dep. Fish. Wildl. (West. Aust.); no. 18, 22 pp.
Heald, D. I. 1987. The commercial shark fishery in temperate waters of Western Australia. Fisheries Department of Western Australia Research Report No. 75, 71pp.
Hoenig, J. M. 198�. Empirical use of longevity data to estimate mortality rates. Fishery Bulletin 82: 898-90�.
Hoenig, J. M., And S. H. Gruber. 1990. Life history patterns in the elasmobranches: implications for fisheries management. p. 1 – 16. In, Elasmobranchs as living resources: advances in the biology, ecology, systematics, and the status of fisheries. H. L. Pratt Jr, S. H. Gruber, and T. Taniuchi (eds.). NOAA Technical Report NMFS 90.
Hyslop, .E. J. 1980. Stomach content analysis – review of methods used in studies of the food of fishes. J. Fish Biol. 17: 411-429.
Jennings, S., Kaiser, M. J., Reynolds, J. D. 2001. Marine Fisheries Ecology. Blackwell Science Ltd.
Jensen, A. L. 1996. Beverton and holt life history invariants result from optimal trade-off of reproduction and survival. Canadian Journal of Fisheries and Aquatic Sciences 5�: 820-822.

Fisheries Research Report [Western Australia] No. 151, 2005 101
Kirkwood, G. P. and Walker, T. I., 1986. Gill net selectivities for gummy shark, Mustelus antarcticus Günther, taken in south-eastern Australian waters. Aust. J. Mar. Fresh. Res., �7: 689-97.
Krebs, C. J. 1985. Ecology: the experimental analysis of distribution and abundance, �rd ed. Harper and row, New York.
Krebs, C.J. 1989. Ecological Methods. Harper and Rowe, New York.
Langton, R.S. 1982. Diet overlap between the Atlantic cod, Gadus morhua, silver hake, Merluccius bilinearis and fifteen other Atlantic finfish. Fish. Bull. 80:745-759
Last, P. R and Stevens, J. D. 1994. Sharks and Rays of Australia. CSIRO, Melbourne, Australia, 51�pp.
McAuley, R. 2004. Status Report for the Southern and West Coast Demersal Gillnet and Demersal Longline Fisheries and Northern Shark Fisheries. Number 11. April 2004. Unpublished report. Dept of Fisheries Government of Western Australia. Perth.
McAuley, R. and Simpfendorfer, C. 200�. Catch Composition of the Western Australian Temperate Demersal Gillnet and Demersal Longline Fisheries, 1994-1999. Fisheries Research Report No. 146, Department of Fisheries, Western Australia, 78 pp.
McLoughlin, K. J. and Stevens, J. D., 1994. Gill-net mesh selectivities for two species of commercial Carcharhinid sharks taken in northern Australia. Aust. J. Mar. Fresh. Res., 45: 521-�4.
Mollet, H. F., And G. M. Cailliet. 2002. Comparative population demography of elasmobranches using life history tables, Leslie matrices and stage-based matrix models. Marine and Freshwater Research 5�: 50�-516.
Natanson, L. J., and Kohler, N.E. 1996. A preliminary estimate of age and growth of the dusky shark Carcharhinus obscurus from the south-west Indian Ocean, with comparisons to the western North Atlantic population. S. Afr. J. mar. Sci. 17:217-224.
Pauly, D. 1980. On the interrelationships between natural mortality, growth parameters, and mean environmental temperature in 175 fish stocks. J. Cons. Int. Explor. Mer. �9: 175-192.
Peterson, I., And J. S. Wroblewski. 1984. Mortality rate of fishes in the pelagic ecosystem. Canadian Journal of Fisheries and Aquatic Sciences 41: 1117-1120.
Quinn, T. J. II and Deriso, R. B. 1999. Quantitative Fish Dynamics. Oxford University Press, New York. 542pp.
Ricker, W. E. 1975. Computation and Interpretation of Biological Statistics of Fish Populations. Bull. Fish. Res. Board Can. 191: 1-�82
Simpfendorfer, C. A. 1999. Demographic analysis of the dusky shark fishery in southwestern Australia. P. 149-160. In, Life in the slow lane. Ecology and conservation of long-lived marine animals. J. A. Musick (ed.). American Fisheries Society Symposium 2�, Bethesda, Maryland.
Simpfendorfer, C. A. 2004. Demographic models: life tables, matrix models and rebound potential. In, Elasmobranch fisheries management techniques. Musick, J. A. and Bonfil, R. (eds.), pp. 187-20�. APEC Secretariat, Singapore.
Simpfendorfer, C. A. and Unsworth, P., 1998. Gillnet mesh selectivity of dusky (Carcharhinus obscurus) and whiskery, (Furgaleus macki) sharks from south-western Australia. Aust. J. Marine Freshwater Res. 49: 71�-718.
Simpfendorfer, C. A., McAuley, R.., Chidlow, J., Lenanton, R., Hall, N. and Bastow, T. 1999. Biology and stock assessment of Western Australia’s commercially important shark species. Final report to the Fisheries Research and Development Corporation for project 96/1�0, 99 pp. December 1999. ISBN 0 7�09 8448 6.

102 Fisheries Research Report [Western Australia] No. 151, 2005
Simpfendorfer, C. A., Donohue, K. and Hall, N.G. 2000. Stock assessment for the whiskery shark (Furgaleus macki (Whitely)) in south-western Australia. Fish. Res. 47: 1-17.
Simpfendorfer, C.A., McAuley, R. Chidlow, J. and Unsworth. P. 2002. Validated Age and Growth of the Dusky Shark, Carcharhinus obscurus, from Western Australian Waters. Mar. Freshwater Res., 2002, 53, 567-57�
Smith, S. E., D. W. Au, And C. Snow. 1998. Intrinsic rebound potential of 26 species of Pacific sharks. Marine and Freshwater Research 48:66�-678.
Stephenson, P. and Chidlow, J.C. 200�. Bycatch in the Pilbara Fish Trawl Fishery. Final Report to National Heritage Trust. Western Australian Department of Fisheries, Perth.
Stevens, J. D. and Wayte, S. E., 1999. A review of Australia’s pelagic shark resources. Final Report to the Fisheries Research and Development Corporation for Project 98/107, 64pp.
Walters, C. J. and Martell, S. J. D. 2004. Fisheries Ecology and Management. Princeton University Press.
White, W. T. Hall, N. G and Potter, I. C. 2002. Size and age compositions and reproductive biology of the nervous shark, Carcharhinus cautus in a large subtropical embayment, including an analysis of growth during pre- and postnatal life. Marine Biology, 141: 115�-1164.
Whitely, G. P., 194�. Preliminary report on the long line fishery at Bunbury WA. Department of Fisheries, unpublished report, 9 pp (available from Western Australian Marine Research Laboratories: North Beach, WA).

Fisheries Research Report [Western Australia] No. 151, 2005 10�
109
10.0
A
PPEN
DIC
ES
APP
EN
DIX
I T
able
i.
Res
ults
of
dem
ogra
phic
ana
lysi
s of
the
Wes
tern
Aus
tralia
n C
arch
arhi
nus
plum
beus
pop
ulat
ion
unde
r ze
ro f
ishi
ng
mor
talit
y. D
efin
ition
s of d
emog
raph
ic p
aram
eter
sym
bols
are
giv
en in
Tab
le 5
.16.
PM
R0
Gt x2
r
MM
ean
95%
CI
Mea
n95
% C
I M
ean
95%
CI
Mea
n95
% C
I M
ean
95%
CI
Pau
ly (1
980)
0.
16
(0.1
2, 0
.21)
2.
1 (0
.8, 4
.2)
22.5
(2
1.6,
24.
0)
20.0
(-
138.
3, 1
94.0
) 0.
030
(-0.
018,
0.0
63)
Hoe
nig
(198
3), i
0.
13
(0.0
9, 0
.17)
1.
6 (0
.6, 3
.7)
22.2
(2
1.4,
24.
0)
24.3
(-
310.
0, 3
51.7
) 0.
017
(-0.
028,
0.0
54)
Hoe
nig
(198
3), i
i 0.
14
(0.1
1, 0
.18)
1.
8 (0
.6, 3
.9)
22.3
(2
1.5,
23.
9)
22.2
(-
307.
2, 1
96.4
) 0.
023
(-0.
027,
0.0
57)
Hoe
nig
(198
3), i
ii 0.
11
(0.0
8, 0
.15)
1.
3 (0
.5, 2
.7)
22.0
(2
1.2,
23.
8)
24.9
(-
362.
2, 4
73.6
) 0.
007
(-0.
040,
0.0
41)
Jens
en (1
996)
, i
0.21
(0
.19,
0.2
1)
3.0
(1.1
, 5.7
) 22
.8
(21.
9, 2
4.3)
14
.6
(-6.
0, 7
0.5)
0.
046
(-0.
002,
0.0
77)
Jens
en (1
996)
, ii
0.38
(0
.32,
0.4
5)
7.6
(2.7
, 15.
7)
23.5
(2
2.5,
25.
5)
8.1
(5.9
, 18.
3)
0.08
6 (0
.036
, 0.1
17)
Jens
en (1
996)
, iii
0.36
(0
.30,
0.4
2)
6.6
(2.2
, 14.
0)
23.5
(2
2.4,
25.
3)
8.7
(6.0
, 21.
3)
0.07
9 (0
.029
, 0.1
14)
Pet
erse
n &
Wro
blew
ski (
1984
) 0.
12
(0.1
1, 0
.12)
1.
9 (0
.7, 3
.6)
23.0
(2
2.1,
24.
8)
24.8
(-
166.
0, 3
38.9
) 0.
023
(-0.
019,
0.0
53)
Che
n &
Wat
anab
e (1
989)
0.
17
(0.1
5, 0
.19)
3.
3 (1
.3, 6
.6)
23.6
(2
2.5,
25.
5)
14.7
(8
.0, 6
3.8)
0.
046
(0.0
04, 0
.077
)
Sto
chas
ticM
0.
13
(0.1
2, 0
.13)
2.
0 (0
.8, 3
.6)
22.7
(2
1.9,
24.
2)
23.1
(-
263.
5, 1
93.0
) 0.
025
(-0.
018,
0.0
55)
Tab
le ii
. R
esul
ts o
f dem
ogra
phic
ana
lysis
of t
he W
este
rn A
ustra
lian
Car
char
hinu
s plu
mbe
us p
opul
atio
n us
ing
age
spec
ific
estim
ates
of
200
1/02
fish
ing
mor
talit
y (F
2001
/02 )
.
PM
R0
Gt x2
r
MM
ean
95%
CI
Mea
n95
% C
I M
ean
95%
CI
Mea
n95
% C
I M
ean
95%
CI
Pau
ly (1
980)
0.
03
(0.0
2, 0
.04)
0.
4 (0
.1, 0
.8)
22.4
(2
1.5,
23.
9)
-14.
3 (-
49.6
, -7.
3)
-0.0
49
(-0.
095,
-0.0
14)
Hoe
nig
(198
3), i
0.
02
(0.0
2, 0
.03)
0.
3 (0
.1, 0
.7)
22.1
(2
1.3,
24.
0)
-10.
6 (-
25.3
, -6.
3)
-0.0
65
(-0.
110,
-0.0
27)
Hoe
nig
(198
3), i
i 0.
03
(0.0
2, 0
.04)
0.
3 (0
.1, 0
.7)
22.2
(2
1.4,
23.
9)
-12.
1 (-
28.1
, -6.
9)
-0.0
57
(-0.
101,
-0.0
25)
Hoe
nig
(198
3), i
ii 0.
02
(0.0
1, 0
.03)
0.
2 (0
.1, 0
.5)
22.0
(2
1.2,
23.
6)
-9.4
(-
17.8
, -5.
8)
-0.0
74
(-0.
119,
-0.0
39)
Jens
en (1
996)
, i
0.04
(0
.04,
0.0
4)
0.6
(0.2
, 1.0
) 22
.7
(21.
9, 2
4.5)
-2
1.4
(-10
6.4,
-7.9
) -0
.032
(-
0.07
7, -0
.003
)
Jens
en (1
996)
, ii
0.08
(0
.06,
0.0
9)
1.4
(0.5
, 2.8
) 23
.5
(22.
4, 2
5.5)
28
.8
(-42
4.7,
417
.9)
0.00
8 (-
0.04
4, 0
.039
)
Jens
en (1
996)
, iii
0.07
(0
.06,
0.0
9)
1.2
(0.4
, 2.5
) 23
.4
(22.
3, 2
5.3)
22
.4
(-53
5.8,
498
.0)
0.00
2 (-
0.04
3, 0
.034
)
Pet
erse
n &
Wro
blew
ski (
1984
) 0.
02
(0.0
2, 0
.02)
0.
3 (0
.1, 0
.6)
22.9
(2
2.1,
24.
6)
-12.
5 (-
23.9
, -7.
2)
-0.0
56
(-0.
096,
-0.0
29)
Che
n &
Wat
anab
e (1
989)
0.
03
(0.0
3, 0
.04)
0.
6 (0
.2, 1
.1)
23.5
(2
2.4,
25.
4)
-22.
5 (-
138.
4, -8
.0)
-0.0
30
(-0.
074,
-0.0
02)
Sto
chas
ticM
0.
03
(0.0
2, 0
.03)
0.
4 (0
.1, 0
.7)
22.7
(2
1.7,
24.
4)
-14.
0 (-
34.9
, -7.
5)
-0.0
49
(-0.
092,
-0.0
19)
10
.0
APPEN
DIC
ES
APPEN
DIX
I
Tab
le i
. ResultsofdemographicanalysisoftheW
esternAustralian
Car
char
hinu
s pl
umbe
us populationunderzerofishingmortality.Definitionsof
demographicparam
etersym
bolsaregiveninTable5.16.
Tab
le i
i. ResultsofdemographicanalysisoftheW
esternAustralian
Car
char
hinu
s pl
umbe
uspopulationusing
age
spec
ificestimatesof2001/02fishing
mortality(F
2001
/02).

104 Fisheries Research Report [Western Australia] No. 151, 2005
110
Tab
le ii
i.
Res
ults
of d
emog
raph
ic a
naly
sis o
f the
Wes
tern
Aus
tralia
n C
arch
arhi
nus p
lum
beus
pop
ulat
ion
usin
g ag
e sp
ecifi
c es
timat
es
of 2
002/
03 fi
shin
g m
orta
lity
(F20
02/0
3).
PM
R0
Gt x2
r
MM
ean
95%
CI
Mea
n95
% C
I M
ean
95%
CI
Mea
n95
% C
I M
ean
95%
CI
Pau
ly (1
980)
0.
04
(0.0
3, 0
.05)
0.
3 (0
.1, 0
.7)
19.9
(1
9.8,
20.
6)
-12.
2 (-
33.0
, -6.
3)
-0.0
57
(-0.
109,
-0.0
21)
Hoe
nig
(198
3), i
0.
03
(0.0
2, 0
.04)
0.
2 (0
.1, 0
.5)
19.8
(1
9.8,
20.
5)
-9.5
(-
20.0
, -5.
7)
-0.0
73
(-0.
122,
-0.0
35)
Hoe
nig
(198
3), i
i 0.
03
(0.0
2, 0
.04)
0.
3 (0
.1, 0
.6)
19.8
(1
9.8,
20.
6)
-10.
6 (-
22.8
, -5.
7)
-0.0
65
(-0.
122,
-0.0
30)
Hoe
nig
(198
3), i
ii 0.
02
(0.0
2, 0
.03)
0.
2 (0
.1, 0
.4)
19.8
(1
9.7,
20.
5)
-8.1
(-
14.9
, -5.
1)
-0.0
85
(-0.
135,
-0.0
47)
Jens
en (1
996)
, i
0.05
(0
.04,
0.0
5)
0.4
(0.2
, 0.8
) 20
.0
(20.
0, 2
0.6)
-1
6.9
(-71
.0, -
7.9)
-0
.041
(-
0.08
7, -0
.009
)
Jens
en (1
996)
, ii
0.09
(0
.08,
0.1
1)
1.0
(0.3
, 1.9
) 20
.2
(20.
1, 2
0.8)
-1
2.6
(-44
5.3,
841
.2)
-0.0
02
(-0.
055,
0.0
31)
Jens
en (1
996)
, iii
0.08
(0
.07,
0.1
0)
0.9
(0.4
, 1.8
) 20
.1
(20.
0, 2
0.8)
-2
0.3
(-49
4.8,
491
.6)
-0.0
05
(-0.
051,
0.0
28)
Pet
erse
n &
Wro
blew
ski (
1984
) 0.
03
(0.0
2, 0
.03)
0.
2 (0
.1, 0
.5)
20.0
(2
0.0,
20.
6)
-10.
1 (-
17.8
, -5.
9)
-0.0
69
(-0.
118,
-0.0
39)
Che
n &
Wat
anab
e (1
989)
0.
04
(0.0
3, 0
.04)
0.
4 (0
.1, 0
.8)
20.1
(2
0.1,
20.
8)
-15.
5 (-
53.7
, -7.
1)
-0.0
45
(-0.
093,
-0.0
12)
Sto
chas
ticM
0.
03
(0.0
3, 0
.04)
0.
3 (0
.1, 0
.6)
20.0
(1
9.8,
20.
6)
-11.
7 (-
26.5
, -6.
3)
-0.0
59
(-0.
110,
-0.0
26)
Tab
le iv
. R
esul
ts o
f dem
ogra
phic
ana
lysi
s of t
he W
este
rn A
ustra
lian
Car
char
hinu
s plu
mbe
us p
opul
atio
n us
ing
age
spec
ific
estim
ates
of
200
3/04
fish
ing
mor
talit
y (F
2003
/04)
.
PM
R0
Gt x2
r
MM
ean
95%
CI
Mea
n95
% C
I M
ean
95%
CI
Mea
n95
% C
I M
ean
95%
CI
Pau
ly (1
980)
0.
03
(0.0
3, 0
.05)
0.
4 (0
.1, 0
.8)
22.3
(2
1.4,
23.
9)
-14.
9 (-
53.2
, -7.
5)
-0.0
47
(-0.
092,
-0.0
12)
Hoe
nig
(198
3), i
0.
03
(0.0
2, 0
.04)
0.
3 (0
.1, 0
.6)
22.0
(2
1.1,
23.
8)
-10.
9 (-
24.8
, -6.
6)
-0.0
64
(-0.
106,
-0.0
28)
Hoe
nig
(198
3), i
i 0.
03
(0.0
2, 0
.04)
0.
3 (0
.1, 0
.7)
22.1
(2
1.2,
23.
6)
-12.
2 (-
31.1
, -7.
1)
-0.0
57
(-0.
098,
-0.0
22)
Hoe
nig
(198
3), i
ii 0.
02
(0.0
1, 0
.03)
0.
2 (0
.1, 0
.5)
21.8
(2
1.0,
23.
6)
-9.1
(-
18.0
, -5.
8)
-0.0
76
(-0.
119,
-0.0
38)
Jens
en (1
996)
, i
0.05
(0
.04,
0.0
5)
0.6
(0.2
, 1.1
) 22
.5
(21.
7, 2
4.1)
-2
2.2
(-15
4.7,
61.
3)
-0.0
29
(-0.
073,
0.0
01)
Jens
en (1
996)
, ii
0.10
(0
.08,
0.1
2)
1.6
(0.6
, 3.3
) 23
.4
(22.
2, 2
5.4)
28
.7
(-30
1.2,
320
.2)
0.01
5 (-
0.02
8, 0
.044
)
Jens
en (1
996)
, iii
0.09
(0
.07,
0.1
1)
1.4
(0.6
, 3.0
) 23
.3
(22.
2, 2
5.2)
26
.4
(-52
0.1,
509
.4)
0.01
0 (-
0.03
4, 0
.044
)
Pet
erse
n &
Wro
blew
ski (
1984
) 0.
03
(0.0
2, 0
.03)
0.
3 (0
.1, 0
.6)
22.8
(2
1.9,
24.
4)
-12.
3 (-
24.1
, -7.
1)
-0.0
57
(-0.
098,
-0.0
29)
Che
n &
Wat
anab
e (1
989)
0.
04
(0.0
3, 0
.04)
0.
6 (0
.2, 1
.2)
23.4
(2
2.3,
25.
4)
-23.
4 (-
165.
5, -6
.4)
-0.0
28
(-0.
073,
-0.0
01)
Sto
chas
ticM
0.
03
(0.0
2, 0
.04)
0.
4 (0
.2, 0
.8)
22.5
(2
1.6,
24.
0)
-14.
6 (-
40.6
, -7.
8)
-0.0
48
(-0.
089,
-0.0
17)
Tab
le i
ii.
ResultsofdemographicanalysisoftheW
esternAustralian
Car
char
hinu
s pl
umbe
uspopulationusing
age
spec
ificestimatesof2002/03fishing
mortality(F
2002
/03).
Tab
le i
v.
ResultsofdemographicanalysisoftheW
esternAustralian
Car
char
hinu
s pl
umbe
uspopulationusing
age
spec
ificestimatesof2003/04fishing
mortality(F
2003
/04).

Fisheries Research Report [Western Australia] No. 151, 2005 105
111
Tab
le v
.
Res
ults
of
dem
ogra
phic
ana
lysi
s of
the
Wes
tern
Aus
tralia
n C
arch
arhi
nus
plum
beus
pop
ulat
ion
usin
g ad
just
ed a
ge-c
lass
es
timat
es o
f 200
1/02
fish
ing
mor
talit
y ( F̂
2001
/02 )
.
PM
R0
Gt x2
r
MM
ean
95%
CI
Mea
n95
% C
I M
ean
95%
CI
Mea
n95
% C
I M
ean
95%
CI
Pau
ly (1
980)
0.
04
(0.0
3, 0
.06)
0.
6 (0
.2, 1
.2)
22.4
(2
1.5,
23.
8)
-21.
0 (-
145.
1, 8
1.0)
-0
.031
(-
0.07
9, 0
.002
)
Hoe
nig
(198
3), i
0.
03
(0.0
2, 0
.05)
0.
4 (0
.1, 1
.0)
22.2
(2
1.4,
23.
8)
-15.
4 (-
65.7
, -6.
9)
-0.0
45
(-0.
096,
-0.0
09)
Hoe
nig
(198
3), i
i 0.
04
(0.0
3, 0
.05)
0.
4 (0
.2, 1
.0)
22.5
(2
1.5,
23.
9)
-16.
8 (-
78.7
, -8.
0)
-0.0
41
(-0.
082,
-0.0
08)
Hoe
nig
(198
3), i
ii 0.
03
(0.0
2, 0
.04)
0.
3 (0
.1, 0
.7)
22.0
(2
1.2,
23.
6)
-12.
4 (-
35.3
, -6.
8)
-0.0
56
(-0.
101,
-0.0
20)
Jens
en (1
996)
, i
0.06
(0
.05,
0.0
6)
0.8
(0.3
, 1.5
) 22
.7
(21.
9, 2
4.5)
-3
0.5
(-52
5.2,
580
.6)
-0.0
14
(-0.
056,
0.0
12)
Jens
en (1
996)
, ii
0.11
(0
.09,
0.1
3)
2.0
(0.7
, 4.0
) 23
.5
(22.
4, 2
5.6)
23
.1
(-15
9.2,
312
.8)
0.02
4 (-
0.02
3, 0
.055
)
Jens
en (1
996)
, iii
0.10
(0
.08,
0.1
2)
1.7
(0.7
, 3.6
) 23
.5
(22.
4, 2
5.3)
26
.2
(-37
6.0,
332
.2)
0.01
8 (-
0.02
4, 0
.051
)
Pet
erse
n &
Wro
blew
ski (
1984
) 0.
03
(0.0
3, 0
.03)
0.
5 (0
.2, 0
.9)
23.0
(2
2.1,
24.
6)
-17.
3 (-
55.8
, -8.
3)
-0.0
40
(-0.
082,
-0.0
12)
Che
n &
Wat
anab
e (1
989)
0.
05
(0.0
4, 0
.05)
0.
9 (0
.3, 1
.7)
23.6
(2
2.5,
25.
5)
-29.
5 (-
450.
1, 4
65.1
) -0
.014
(-
0.05
7, 0
.015
)
Sto
chas
ticM
0.
04
(0.0
3, 0
.05)
0.
6 (0
.2, 1
.1)
22.8
(2
1.8,
24.
2)
-21.
1 (-
158.
4, -6
.4)
-0.0
32
(-0.
075,
-0.0
01)
Tab
le v
i.
Res
ults
of
dem
ogra
phic
ana
lysi
s of
the
Wes
tern
Aus
tralia
n C
arch
arhi
nus
plum
beus
pop
ulat
ion
usin
g ad
just
ed a
ge-c
lass
es
timat
es o
f 200
2/03
fish
ing
mor
talit
y ( F̂
2002
/03)
.
PM
R0
Gt x2
r
MM
ean
95%
CI
Mea
n95
% C
I M
ean
95%
CI
Mea
n95
% C
I M
ean
95%
CI
Pau
ly (1
980)
0.
07
(0.0
6, 0
.10)
0.
9 (0
.3, 1
.9)
22.3
(2
1.4,
23.
8)
-24.
5 (-
382.
6, 6
61.7
) -0
.009
(-
0.05
6, 0
.025
)
Hoe
nig
(198
3), i
0.
06
(0.0
4, 0
.08)
0.
7 (0
.2, 1
.6)
22.0
(2
1.2,
23.
6)
-23.
9 (-
410.
4, 3
65.0
) -0
.022
(-
0.06
8, 0
.015
)
Hoe
nig
(198
3), i
i 0.
06
(0.0
5, 0
.08)
0.
8 (0
.3, 1
.6)
22.1
(2
1.3,
23.
6)
-27.
0 (-
397.
1, 3
66.5
) -0
.017
(-
0.06
1, 0
.017
)
Hoe
nig
(198
3), i
ii 0.
05
(0.0
3, 0
.07)
0.
5 (0
.2, 1
.2)
21.8
(2
1.1,
23.
3)
-19.
0 (-
145.
4, 8
5.9)
-0
.034
(-
0.08
6, 0
.004
)
Jens
en (1
996)
, i
0.10
(0
.09,
0.1
0)
1.3
(0.5
, 2.6
) 22
.5
(21.
8, 2
4.0)
29
.0
(-53
2.4,
548
.4)
0.00
7 (-
0.04
0, 0
.038
)
Jens
en (1
996)
, ii
0.18
(0
.15,
0.2
2)
3.1
(1.1
, 6.2
) 23
.4
(22.
3, 2
5.3)
14
.7
(-28
.8, 6
9.6)
0.
046
(0.0
00, 0
.075
)
Jens
en (1
996)
, iii
0.17
(0
.14,
0.2
1)
2.9
(0.9
, 6.0
) 23
.3
(22.
2, 2
5.1)
15
.5
(-54
.8, 9
7.0)
0.
042
(-0.
009,
0.0
76)
Pet
erse
n &
Wro
blew
ski (
1984
) 0.
06
(0.0
5, 0
.06)
0.
8 (0
.3, 1
.4)
22.8
(2
1.9,
24.
3)
-30.
1 (-
509.
0, 3
40.5
) -0
.017
(-
0.05
9, 0
.011
)
Che
n &
Wat
anab
e (1
989)
0.
08
(0.0
7, 0
.09)
1.
4 (0
.5, 2
.8)
23.4
(2
2.3,
25.
4)
27.2
(-
349.
4, 4
27.5
) 0.
008
(-0.
034,
0.0
38)
Sto
chas
ticM
0.
07
(0.0
5, 0
.08)
0.
9 (0
.3, 1
.8)
22.6
(2
1.6,
24.
1)
-25.
1 (-
460.
5, 6
09.1
) -0
.009
(-
0.05
4, 0
.022
)
Tab
le v
.
ResultsofdemographicanalysisoftheW
esternAustralian
Car
char
hinu
s pl
umbe
uspopulationusing
adju
sted
ag
e-cl
assestim
atesof2001/02
fishingmortality(
2001
/02).
Tab
le v
i. ResultsofdemographicanalysisoftheW
esternAustralian
Car
char
hinu
s pl
umbe
uspopulationusing
adju
sted
ag
e-cl
assestim
atesof2002/03
fishingmortality(
2002
/03).
Appendix I cont.

106 Fisheries Research Report [Western Australia] No. 151, 2005
Tab
le v
ii.
ResultsofdemographicanalysisoftheW
esternAustralian
Car
char
hinu
s pl
umbe
uspopulationusing
adju
sted
ag
e-cl
assestim
atesof
2003/04fishingmortality(
2003
/04).
112
Tab
le v
ii.
Res
ults
of
dem
ogra
phic
ana
lysis
of
the
Wes
tern
Aus
tralia
n C
arch
arhi
nus
plum
beus
pop
ulat
ion
usin
g ad
just
ed a
ge-c
lass
es
timat
es o
f 200
3/04
fish
ing
mor
talit
y ( F̂
2003
/04)
.
PM
R0
Gt x2
r
MM
ean
95%
CI
Mea
n95
% C
I M
ean
95%
CI
Mea
n95
% C
I M
ean
95%
CI
Pau
ly (1
980)
0.
04
(0.0
3, 0
.05)
0.
4 (0
.1, 0
.9)
21.9
(2
1.1,
23.
3)
-14.
5 (-
61.5
, -7.
2)
-0.0
47
(-0.
092,
-0.0
10)
Hoe
nig
(198
3), i
0.
03
(0.0
2, 0
.04)
0.
3 (0
.1, 0
.6)
21.6
(2
0.9,
23.
2)
-10.
7 (-
24.9
, -6.
1)
-0.0
65
(-0.
114,
-0.0
28)
Hoe
nig
(198
3), i
i 0.
03
(0.0
2, 0
.04)
0.
3 (0
.1, 0
.7)
21.8
(2
1.0,
23.
2)
-11.
9 (-
29.1
, -6.
6)
-0.0
58
(-0.
105,
-0.0
24)
Hoe
nig
(198
3), i
ii 0.
02
(0.0
1, 0
.03)
0.
2 (0
.1, 0
.5)
21.6
(2
0.7,
22.
9)
-8.9
(-
18.0
, -5.
5)
-0.0
78
(-0.
127,
-0.0
39)
Jens
en (1
996)
, i
0.05
(0
.04,
0.0
5)
0.6
(0.2
, 1.1
) 22
.2
(21.
5, 2
3.6)
-2
2.5
(-12
2.9,
-6.7
) -0
.030
(-
0.07
8, -0
.001
)
Jens
en (1
996)
, ii
0.10
(0
.08,
0.1
2)
1.5
(0.5
, 3.1
) 23
.0
(22.
0, 2
4.7)
26
.4
(-38
2.2,
336
.9)
0.01
3 (-
0.03
4, 0
.047
)
Jens
en (1
996)
, iii
0.09
(0
.07,
0.1
1)
1.3
(0.5
, 2.7
) 22
.9
(21.
9, 2
4.7)
27
.9
(-49
2.2,
508
.9)
0.00
8 (-
0.03
8, 0
.041
)
Pet
erse
n &
Wro
blew
ski (
1984
) 0.
03
(0.0
2, 0
.03)
0.
3 (0
.1, 0
.6)
22.4
(2
1.6,
24.
2)
-12.
1 (-
23.1
, -6.
8)
-0.0
57
(-0.
101,
-0.0
30)
Che
n &
Wat
anab
e (1
989)
0.
04
(0.0
3, 0
.04)
0.
6 (0
.2, 1
.1)
23.0
(2
2.0,
24.
8)
-22.
3 (-
167.
4, -7
.0)
-0.0
30
(-0.
074,
-0.0
01)
Sto
chas
ticM
0.
03
(0.0
3, 0
.04)
0.
4 (0
.1, 0
.8)
22.1
(2
1.3,
23.
5)
-14.
2 (-
39.6
, -7.
5)
-0.0
49
(-0.
093,
-0.0
18)

Fisheries Research Report [Western Australia] No. 151, 2005 107
APPEN
DIX
II
Populationgrow
thrates(r)intheW
AC
arch
arhi
nus
plum
beusstock,estim
atedbydemographicanalysisof65hypotheticalratesoffishingmortalityrelative
tothebestestim
atesoffishingmortalityin2003/04(
2003
/04).
113
APP
EN
DIX
II
Popu
latio
n gr
owth
rat
es (
r) i
n th
e W
A C
arch
arhi
nus
plum
beus
sto
ck, e
stim
ated
by
dem
ogra
phic
ana
lysi
s of
65
hypo
thet
ical
rat
es o
f fis
hing
mor
talit
y re
lativ
e to
the
best
est
imat
es o
f fis
hing
mor
talit
y in
200
3/04
(04/
2003
F̂).
Prop
ortio
n of
04/
2003
F̂Eq
uiva
lent
cat
ch (t
onne
s liv
e w
eigh
t) Eq
uiva
lent
Effo
rt
WA
NC
SFTe
mp
GN
Tem
p LL
PFT
Oth
ers
WA
NC
SF*
Tem
p G
N**
Tem
p LL
**
PFT*
**
Oth
ers
***
WA
NC
SF†
Wes
tern
W
AN
CSF
††Te
mp
GN†††
Tem
p LL
†PF
T††††
Oth
ers
Med
ian
r (lo
wer
95%
C
I, up
per 9
5% C
I)
0.25
0.
00
0.00
1.
00
0.00
10
6 0
0 12
0
130
105
0 0
663
n/a
0.02
4 (-
0.02
1, 0
.055
) 0.
00
0.25
0.
25
1.00
0.
00
0 36
14
12
0
0 0
60
69
663
n/a
0.01
8 (-
0.03
, 0.0
49)
0.50
0.
00
0.00
1.
00
0.00
21
2 0
0 12
0
259
210
0 0
663
n/a
0.01
7 (-
0.02
8, 0
.049
) 0.
00
0.50
0.
00
1.00
0.
00
0 72
0
12
0 0
0 12
0 0
663
n/a
0.01
4 (-
0.03
1, 0
.044
) 0.
25
0.25
0.
00
1.00
0.
00
106
36
0 12
0
130
105
60
0 66
3 n/
a 0.
012
(-0.
032,
0.0
43)
0.25
0.
25
0.25
1.
00
0.00
10
6 36
14
12
0
130
105
60
69
663
n/a
0.01
2 (-
0.03
3, 0
.043
) 0.
70
0.00
0.
00
1.00
0.
00
297
0 0
12
0 36
3 29
4 0
0 66
3 n/
a 0.
011
(-0.
033,
0.0
43)
0.85
0.
00
0.00
1.
00
0.00
36
0 0
0 12
0
441
357
0 0
663
n/a
0.00
8 (-
0.03
6, 0
.04)
0.
50
0.25
0.
00
1.00
0.
00
212
36
0 12
0
259
210
60
0 66
3 n/
a 0.
007
(-0.
042,
0.0
36)
0.00
0.
50
0.50
1.
00
0.00
0
72
28
12
0 0
0 12
0 13
8 66
3 n/
a 0.
006
(-0.
04, 0
.038
) 0.
00
0.70
0.
00
1.00
0.
00
0 10
1 0
12
0 0
0 16
8 0
663
n/a
0.00
6 (-
0.04
3, 0
.038
) 0.
50
0.25
0.
25
1.00
0.
00
212
36
14
12
0 25
9 21
0 60
69
66
3 n/
a 0.
005
(-0.
04, 0
.037
) 1.
00
0.00
0.
00
1.00
0.
00
424
0 0
12
0 51
9 42
0 0
0 66
3 n/
a 0.
005
(-0.
042,
0.0
36)
0.00
0.
85
0.00
1.
00
0.00
0
123
0 12
0
0 0
204
0 66
3 n/
a 0.
001
(-0.
042,
0.0
34)
0.70
0.
25
0.00
1.
00
0.00
29
7 36
0
12
0 36
3 29
4 60
0
663
n/a
0.00
0 (-
0.04
5, 0
.032
) 0.
25
0.50
0.
00
1.00
0.
00
106
72
0 12
0
130
105
120
0 66
3 n/
a 0.
000
(-0.
046,
0.0
32)
0.70
0.
25
0.25
1.
00
0.00
29
7 36
14
12
0
363
294
60
69
663
n/a
-0.0
01 (-
0.04
6, 0
.032
) 0.
25
0.50
0.
50
1.00
0.
00
106
72
28
12
0 13
0 10
5 12
0 13
8 66
3 n/
a -0
.002
(-0.
049,
0.0
32)
0.00
0.
70
0.70
1.
00
0.00
0
101
39
12
0 0
0 16
8 19
3 66
3 n/
a -0
.003
(-0.
045,
0.0
27)
0.85
0.
25
0.00
1.
00
0.00
36
0 36
0
12
0 44
1 35
7 60
0
663
n/a
-0.0
03 (-
0.05
2, 0
.028
) 0.
00
1.00
0.
00
1.00
0.
00
0 14
4 0
12
0 0
0 24
0 0
663
n/a
-0.0
04 (-
0.05
, 0.0
25)
0.85
0.
25
0.25
1.
00
0.00
36
0 36
14
12
0
441
357
60
69
663
n/a
-0.0
04 (-
0.05
, 0.0
27)
0.00
1.
00
0.00
1.
00
0.00
0
144
0 12
0
0 0
240
0 66
3 n/
a -0
.005
(-0.
049,
0.0
25)
0.50
0.
50
0.00
1.
00
0.00
21
2 72
0
12
0 25
9 21
0 12
0 0
663
n/a
-0.0
05 (-
0.05
3, 0
.025
) 0.
50
0.50
0.
50
1.00
0.
00
212
72
28
12
0 25
9 21
0 12
0 13
8 66
3 n/
a -0
.007
(-0.
052,
0.0
21)
1.00
0.
25
0.00
1.
00
0.00
42
4 36
0
12
0 51
9 42
0 60
0
663
n/a
-0.0
08 (-
0.05
6, 0
.024
) 1.
00
0.25
0.
25
1.00
0.
00
424
36
14
12
0 51
9 42
0 60
69
66
3 n/
a -0
.008
(-0.
053,
0.0
21)
0.25
0.
70
0.70
1.
00
0.00
10
6 10
1 39
12
0
130
105
168
193
663
n/a
-0.0
09 (-
0.05
6, 0
.022
) 0.
25
0.70
0.
00
1.00
0.
00
106
101
0 12
0
130
105
168
0 66
3 n/
a -0
.01
(-0.
053,
0.0
22)
0.00
0.
85
0.85
1.
00
0.00
0
123
48
12
0 0
0 20
4 23
5 66
3 n/
a -0
.011
(-0.
054,
0.0
2)
0.25
1.
00
0.00
1.
00
0.00
10
6 14
4 0
12
0 13
0 10
5 24
0 0
663
n/a
-0.0
12 (-
0.06
, 0.0
2)
0.70
0.
50
0.50
1.
00
0.00
29
7 72
28
12
0
363
294
120
138
663
n/a
-0.0
13 (-
0.05
3, 0
.018
)
Appendix II cont.

108 Fisheries Research Report [Western Australia] No. 151, 2005
114
Prop
ortio
n of
04/
2003
F̂Eq
uiva
lent
cat
ch (t
onne
s liv
e w
eigh
t) Eq
uiva
lent
Effo
rt
WA
NC
SFTe
mp
GN
Tem
p LL
PFT
Oth
ers
WA
NC
SF*
Tem
p G
N**
Tem
p LL
**
PFT*
**
Oth
ers
***
WA
NC
SF†
Wes
tern
W
AN
CSF
††Te
mp
GN†††
Tem
p LL
†PF
T††††
Oth
ers
Med
ian
r (lo
wer
95%
C
I, up
per 9
5% C
I)
0.70
0.
50
0.00
1.
00
0.00
29
7 72
0
12
0 36
3 29
4 12
0 0
663
n/a
-0.0
13 (-
0.05
9, 0
.02)
0.
85
0.50
0.
00
1.00
0.
00
360
72
0 12
0
441
357
120
0 66
3 n/
a -0
.016
(-0.
061,
0.0
13)
0.85
0.
50
0.50
1.
00
0.00
36
0 72
28
12
0
441
357
120
138
663
n/a
-0.0
17 (-
0.06
2, 0
.013
) 0.
50
0.70
0.
70
1.00
0.
00
212
101
39
12
0 25
9 21
0 16
8 19
3 66
3 n/
a -0
.017
(-0.
061,
0.0
16)
0.50
1.
00
0.00
1.
00
0.00
21
2 14
4 0
12
0 25
9 21
0 24
0 0
663
n/a
-0.0
17 (-
0.06
6, 0
.011
) 0.
50
0.70
0.
00
1.00
0.
00
212
101
0 12
0
259
210
168
0 66
3 n/
a -0
.018
(-0.
068,
0.0
14)
0.25
0.
85
0.85
1.
00
0.00
10
6 12
3 48
12
0
130
105
204
235
663
n/a
-0.0
18 (-
0.06
6, 0
.01)
0.
25
0.85
0.
00
1.00
0.
00
106
123
0 12
0
130
105
204
0 66
3 n/
a -0
.019
(-0.
064,
0.0
12)
0.00
1.
00
1.00
1.
00
0.00
0
144
56
12
0 0
0 24
0 27
6 66
3 n/
a -0
.02
(-0.
062,
0.0
12)
1.00
0.
50
0.00
1.
00
0.00
42
4 72
0
12
0 51
9 42
0 12
0 0
663
n/a
-0.0
2 (-
0.06
5, 0
.012
) 1.
00
0.50
0.
50
1.00
0.
00
424
72
28
12
0 51
9 42
0 12
0 13
8 66
3 n/
a -0
.021
(-0.
07, 0
.011
) 0.
70
0.70
0.
00
1.00
0.
00
297
101
0 12
0
363
294
168
0 66
3 n/
a -0
.023
(-0.
07, 0
.008
) 0.
70
0.70
0.
70
1.00
0.
00
297
101
39
12
0 36
3 29
4 16
8 19
3 66
3 n/
a -0
.023
(-0.
066,
0.0
1)
0.70
1.
00
0.00
1.
00
0.00
29
7 14
4 0
12
0 36
3 29
4 24
0 0
663
n/a
-0.0
23 (-
0.06
9, 0
.01)
0.
50
0.85
0.
85
1.00
0.
00
212
123
48
12
0 25
9 21
0 20
4 23
5 66
3 n/
a -0
.025
(-0.
071,
0.0
06)
0.50
0.
85
0.00
1.
00
0.00
21
2 12
3 0
12
0 25
9 21
0 20
4 0
663
n/a
-0.0
26 (-
0.07
2, 0
.007
) 0.
25
1.00
1.
00
1.00
0.
00
106
144
56
12
0 13
0 10
5 24
0 27
6 66
3 n/
a -0
.026
(-0.
066,
0.0
03)
0.85
0.
70
0.00
1.
00
0.00
36
0 10
1 0
12
0 44
1 35
7 16
8 0
663
n/a
-0.0
27 (-
0.07
1, 0
.004
) 0.
85
0.70
0.
70
1.00
0.
00
360
101
39
12
0 44
1 35
7 16
8 19
3 66
3 n/
a -0
.028
(-0.
072,
0.0
03)
0.85
1.
00
0.00
1.
00
0.00
36
0 14
4 0
12
0 44
1 35
7 24
0 0
663
n/a
-0.0
28 (-
0.07
5, 0
.001
) 0.
70
0.85
0.
00
1.00
0.
00
297
123
0 12
0
363
294
204
0 66
3 n/
a -0
.03
(-0.
074,
0.0
01)
1.00
0.
70
0.00
1.
00
0.00
42
4 10
1 0
12
0 51
9 42
0 16
8 0
663
n/a
-0.0
31 (-
0.07
9, -0
.001
) 0.
70
0.85
0.
85
1.00
0.
00
297
123
48
12
0 36
3 29
4 20
4 23
5 66
3 n/
a -0
.031
(-0.
071,
-0.0
02)
1.00
0.
70
0.70
1.
00
0.00
42
4 10
1 39
12
0
519
420
168
193
663
n/a
-0.0
32 (-
0.07
6, -0
.001
) 0.
50
1.00
1.
00
1.00
0.
00
212
144
56
12
0 25
9 21
0 24
0 27
6 66
3 n/
a -0
.033
(-0.
077,
-0.0
03)
1.00
1.
00
0.00
1.
00
0.00
42
4 14
4 0
12
0 51
9 42
0 24
0 0
663
n/a
-0.0
34 (-
0.07
7, -0
.002
) 0.
85
0.85
0.
85
1.00
0.
00
360
123
48
12
0 44
1 35
7 20
4 23
5 66
3 n/
a -0
.035
(-0.
078,
-0.0
05)
0.85
0.
85
0.00
1.
00
0.00
36
0 12
3 0
12
0 44
1 35
7 20
4 0
663
n/a
-0.0
36 (-
0.08
4, -0
.004
) 0.
70
1.00
1.
00
1.00
0.
00
297
144
56
12
0 36
3 29
4 24
0 27
6 66
3 n/
a -0
.038
(-0.
084,
-0.0
08)
1.00
0.
85
0.85
1.
00
0.00
42
4 12
3 48
12
0
519
420
204
235
663
n/a
-0.0
39 (-
0.08
2, -0
.008
) 1.
00
0.85
0.
00
1.00
0.
00
424
123
0 12
0
519
420
204
0 66
3 n/
a -0
.04
(-0.
082,
-0.0
09)
0.85
1.
00
1.00
1.
00
0.00
36
0 14
4 56
12
0
441
357
240
276
663
n/a
-0.0
44 (-
0.08
8, -0
.014
)
2.00
1.
00
1.00
1.
00
0.00
84
8 14
4 56
12
0
1038
83
9 24
0 27
6 66
3 n/
a -0
.079
(-0.
124,
-0.0
5)
* R
epor
ted
catc
h; *
*Val
idat
ed c
atch
; ***
Estim
ated
cat
ch
† Tota
l rep
orte
d ef
fort
(‘00
0 ho
oks)
; †† R
epor
ted
effo
rt (‘
000
hook
s) b
etw
een
Nor
th W
est C
ape
(long
itude
114
°E) a
nd C
ape
Leve
que
(long
itude
120
°E);
††† V
alid
ated
eff
ort (
‘000
km
gill
net
hr);
††††
Day
s. *
CI =
con
fiden
ce in
terv
als,
(low
er, u
pper
)

Fisheries Research Report [Western Australia] No. 151, 2005 109
APPEN
DIX
III
AP
PE
ND
IX
III
Ta
ble
i.
R
esu
lts o
f d
em
og
rap
hic
an
aly
sis
of
the
We
ste
rn A
ustr
alia
n C
arc
ha
rhin
us o
bscu
rus p
op
ula
tio
n u
nd
er
ze
ro f
ish
ing
mo
rta
lity,
ba
se
d o
n a
re
pro
du
ctive
pe
rio
dic
ity o
f 2
ye
ars
. D
efin
itio
ns o
f d
em
og
rap
hic
pa
ram
ete
r sym
bo
ls a
re g
ive
n in
Ta
ble
5.2
2.
PM
R
0G
t x2
r
MM
ean
95
% C
I M
ean
95
% C
I M
ean
95
% C
I M
ean
9
5%
CI
Mea
n9
5%
CI
Pau
ly (
19
80
) 0
.06
6
(0.0
23
, 0
.14
9)
2.1
(0
.7, 6
.2)
31
.4
(29
.7, 3
3.5
) 2
5.1
(-
17
1.9
, 2
30
.6)
0.0
24
(-
0.0
10
, 0
.05
8)
Ho
enig
(1
98
3),
i
0.0
15
(0
.04
0, 0
.11
2)
2.3
(0
.8, 5
.3)
31
.5
(29
.7, 3
4.1
) 2
4.3
(-
10
2.8
, 1
66
.1)
0.0
27
(-
0.0
05
, 0
.05
3)
Ho
enig
(1
98
3),
ii
0.0
67
(0
.04
3, 0
.10
2)
2.3
(0
.9, 5
.4)
31
.4
(29
.7, 3
4.0
) 2
4.7
(-
10
6.2
, 1
94
.9)
0.0
27
(-
0.0
04
, 0
.05
3)
Ho
enig
(1
98
3),
iii
0
.06
7
(0.0
32
, 0
.09
1)
1.7
(0
.7, 4
.4)
31
.3
(29
.4, 3
3.7
) 2
9.1
(-
40
2.8
, 4
17
.4)
0.0
18
(-
0.0
10
, 0
.04
6)
Jen
sen
(1
99
6),
i
0.1
97
(0
.19
2, 0
.20
3)
7.6
(3
.2, 1
4.3
) 3
2.7
(3
0.6
, 3
5.5
) 1
0.8
(8
.2, 1
9.1
) 0
.06
4
(0.0
36
, 0
.08
4)
Jen
sen
(1
99
6),
ii
0.2
06
(0
.10
4, 0
.34
6)
7.6
(2
.8, 1
7.7
) 3
2.6
(3
0.7
, 3
5.7
) 1
0.9
(7
.7, 2
1.4
) 0
.06
4
(0.0
32
, 0
.09
0)
Jen
sen
(1
99
6),
iii
0
.18
4
(0.0
90
, 0
.32
4)
6.9
(2
.5, 1
6.1
) 3
2.5
(3
0.6
, 3
5.3
) 1
1.3
(7
.8, 2
4.2
) 0
.06
1
(0.0
29
, 0
.08
9)
Pet
erse
n &
Wro
ble
wsk
i (1
98
4)
0.1
31
(0
.11
3, 0
.14
6)
5.1
(2
.2, 9
.5)
33
.0
(30
.9, 3
5.7
) 1
3.7
(9
.9, 2
7.8
) 0
.05
1
(0.0
25
, 0
.07
0)
Ch
en &
Wata
nab
e (1
98
9)
0.0
64
(0
.04
2, 0
.09
1)
2.5
(1
.0, 5
.2)
32
.7
(30
.5, 3
5.7
) 2
4.1
(-
65
.8,
14
0.0
) 0
.02
8
(-0
.00
1,
0.0
50
)
Sto
chast
ic M
0.0
80
(0
.05
2, 0
.11
0)
2.8
(1
.1, 5
.7)
31
.9
(30
.0, 3
4.4
) 2
0.9
(1
1.4
, 9
6.8
) 0
.03
3
(0.0
04
, 0
.05
5)
Ta
ble
ii.
Re
su
lts o
f d
em
og
rap
hic
an
aly
sis
of
the
We
ste
rn A
ustr
alia
n C
arc
ha
rhin
us o
bscu
rus p
op
ula
tio
n u
nd
er
ze
ro f
ish
ing
mo
rta
lity,
ba
se
d o
n a
re
pro
du
ctive
pe
rio
dic
ity o
f 3
ye
ars
.
PM
R
0G
t x2
r
MM
ean
95
% C
I M
ean
95
% C
I M
ean
95
% C
I M
ean
9
5%
CI
Mea
n9
5%
CI
Pau
ly (
19
80
) 0
.06
3
(0.0
23
, 0
.13
5)
1.4
(0
.5, 3
.5)
31
.4
(29
.8, 3
3.5
) 3
1.2
(-
53
6.1
, 4
84
.0)
0.0
11
(-
0.0
22
, 0
.04
0)
Ho
enig
(1
98
3),
i
0.0
14
(0
.04
2, 0
.10
8)
1.5
(0
.6, 3
.6)
31
.5
(29
.8, 3
4.3
) 3
3.6
(-
33
2.3
, 6
61
.1)
0.0
13
(-
0.0
18
, 0
.03
9)
Ho
enig
(1
98
3),
ii
0.0
67
(0
.04
2, 0
.10
2)
1.5
(0
.6, 3
.4)
31
.5
(29
.7, 3
4.0
) 3
5.4
(-
52
3.8
, 5
62
.5)
0.0
13
(-
0.0
17
, 0
.03
8)
Ho
enig
(1
98
3),
iii
0
.06
6
(0.0
30
, 0
.08
8)
1.1
(0
.4, 2
.9)
31
.2
(29
.4, 3
3.7
) 3
0.6
(-
58
8.0
, 5
55
.0)
0.0
04
(-
0.0
30
, 0
.03
3)
Jen
sen
(1
99
6),
i
0.1
97
(0
.19
2, 0
.20
3)
5.0
(1
.9, 9
.6)
32
.7
(30
.7, 3
5.5
) 1
3.7
(9
.6, 3
1.3
) 0
.05
0
(0.0
20
, 0
.07
2)
Jen
sen
(1
99
6),
ii
0.2
07
(0
.10
2, 0
.35
2)
5.2
(1
.9, 1
1.8
) 3
2.7
(3
0.8
, 3
5.5
) 1
3.4
(8
.8, 3
2.8
) 0
.05
1
(0.0
20
, 0
.07
8)
Jen
sen
(1
99
6),
iii
0
.18
1
(0.0
87
, 0
.32
3)
4.4
(1
.8, 1
1.0
) 3
2.6
(3
0.6
, 3
5.3
) 1
5.0
(9
.2, 3
7.8
) 0
.04
6
(0.0
18
, 0
.07
5)
Pet
erse
n &
Wro
ble
wsk
i (1
98
4)
0.1
31
(0
.11
3, 0
.14
6)
3.4
(1
.4, 6
.5)
32
.9
(30
.9, 3
5.9
) 1
8.3
(1
1.6
, 5
8.3
) 0
.03
8
(0.0
11
, 0
.05
8)
Ch
en &
Wata
nab
e (1
98
9)
0.0
65
(0
.04
2, 0
.09
2)
1.6
(0
.7, 3
.3)
32
.7
(30
.5, 3
5.8
) 3
6.9
(-
35
5.7
, 3
63
.4)
0.0
15
(-
0.0
13
, 0
.03
7)
Sto
chast
ic M
0.0
80
(0
.05
2, 0
.10
9)
1.9
(0
.8, 3
.7)
31
.9
(30
.1, 3
4.5
) 3
0.8
(-
23
5.9
, 2
37
.2)
0.0
20
(-
0.0
08
, 0
.04
1)
Appendix III cont.

110 Fisheries Research Report [Western Australia] No. 151, 2005
Ta
ble
iii
.
Re
su
lts o
f d
em
og
rap
hic
an
aly
sis
of
the
We
ste
rn A
ustr
alia
n C
arc
ha
rhin
us o
bscu
rus p
op
ula
tio
n u
nd
er
ze
ro f
ish
ing
mo
rta
lity,
ba
se
d o
n a
re
pro
du
ctive
pe
rio
dic
ity o
f 4
ye
ars
.
PM
R
0G
t x2
r
MM
ean
95
% C
I M
ean
95
% C
I M
ean
95
% C
I M
ean
9
5%
CI
Mea
n9
5%
CI
Pau
ly (
19
80
) 0
.06
5
(0.0
25
, 0
.15
0)
1.0
(0
.4, 2
.8)
31
.4
(29
.7, 3
3.7
) 2
2.2
(-
67
5.5
, 6
89
.7)
0.0
01
(-
0.0
32
, 0
.03
3)
Ho
enig
(1
98
3),
i
0.0
14
(0
.04
0, 0
.10
8)
1.1
(0
.4, 2
.8)
31
.4
(29
.6, 3
4.2
) 3
1.2
(-
73
6.9
, 5
84
.1)
0.0
04
(-
0.0
27
, 0
.03
2)
Ho
enig
(1
98
3),
ii
0.0
65
(0
.04
2, 0
.10
3)
1.1
(0
.4, 2
.6)
31
.5
(29
.6, 3
4.1
) 3
6.1
(-
72
6.3
, 6
39
.3)
0.0
04
(-
0.0
27
, 0
.02
9)
Ho
enig
(1
98
3),
iii
0
.06
8
(0.0
33
, 0
.08
8)
0.9
(0
.3, 2
.0)
31
.3
(29
.5, 3
3.8
) -2
6.5
(-
74
5.1
, 7
16
.9)
-0.0
04
(-
0.0
39
, 0
.02
3)
Jen
sen
(1
99
6),
i
0.1
97
(0
.19
2, 0
.20
3)
3.7
(1
.7, 7
.5)
32
.7
(30
.8, 3
5.4
) 1
6.9
(1
1.0
, 4
2.6
) 0
.04
1
(0.0
16
, 0
.06
2)
Jen
sen
(1
99
6),
ii
0.1
98
(0
.10
3, 0
.34
8)
3.7
(1
.4, 8
.9)
32
.7
(30
.8, 3
5.8
) 1
7.0
(1
0.0
, 6
0.6
) 0
.04
0
(0.0
10
, 0
.06
8)
Jen
sen
(1
99
6),
iii
0
.18
1
(0.0
95
, 0
.31
3)
3.3
(1
.2, 7
.2)
32
.5
(30
.6, 3
5.1
) 1
8.4
(1
0.9
, 8
0.1
) 0
.03
7
(0.0
07
, 0
.06
2)
Pet
erse
n &
Wro
ble
wsk
i (1
98
4)
0.1
31
(0
.11
3, 0
.14
6)
2.5
(1
.1, 4
.8)
32
.9
(30
.9, 3
5.9
) 2
3.9
(1
3.0
, 1
10
.4)
0.0
28
(0
.00
2, 0
.04
8)
Ch
en &
Wata
nab
e (1
98
9)
0.0
64
(0
.04
1, 0
.09
2)
1.2
(0
.5, 2
.5)
32
.6
(30
.4, 3
5.8
) 4
2.8
(-
48
7.9
, 7
42
.7)
0.0
06
(-
0.0
22
, 0
.02
7)
Sto
chast
ic M
0.0
79
(0
.05
3, 0
.11
1)
1.4
(0
.6, 2
.8)
31
.8
(30
.0, 3
4.5
) 4
1.5
(-
36
9.6
, 6
84
.1)
0.0
10
(-
0.0
18
, 0
.03
2)
Ta
ble
iv
.
Re
su
lts o
f d
em
og
rap
hic
an
aly
sis
of
the
We
ste
rn A
ustr
alia
n C
arc
ha
rhin
us o
bscu
rus p
op
ula
tio
n u
nd
er
ze
ro f
ish
ing
mo
rta
lity,
ba
se
d o
n a
re
pro
du
ctive
pe
rio
dic
ity o
f 2
-4 y
ea
rs.
PM
R
0G
t x2
r
MM
ean
95
% C
I M
ean
95
% C
I M
ean
95
% C
I M
ean
9
5%
CI
Mea
n9
5%
CI
Pau
ly (
19
80
) 0
.06
3
(0.0
24
, 0
.14
7)
1.4
(0
.4, 4
.9)
31
.5
(29
.7, 3
3.6
) 2
7.2
(-
44
1.1
, 4
75
.0)
0.0
12
(-
0.0
26
, 0
.05
1)
Ho
enig
(1
98
3),
i
0.0
15
(0
.04
1, 0
.10
8)
1.5
(0
.5, 4
.5)
31
.5
(29
.6, 3
4.1
) 2
7.3
(-
46
1.2
, 3
83
.3)
0.0
14
(-
0.0
22
, 0
.04
8)
Ho
enig
(1
98
3),
ii
0.0
65
(0
.04
3, 0
.10
3)
1.5
(0
.5, 4
.3)
31
.4
(29
.7, 3
3.9
) 3
1.4
(-
51
3.4
, 4
07
.9)
0.0
13
(-
0.0
23
, 0
.04
6)
Ho
enig
(1
98
3),
iii
0
.06
6
(0.0
20
, 0
.05
9)
0.8
(0
.3, 2
.2)
31
.2
(29
.4, 3
3.6
) -2
5.8
(-
58
5.7
, 5
11
.8)
-0.0
08
(-
0.0
44
, 0
.02
5)
Jen
sen
(1
99
6),
i
0.1
28
(0
.12
5, 0
.13
2)
3.3
(1
.1, 7
.7)
32
.5
(30
.7, 3
5.3
) 1
8.4
(1
0.1
, 8
6.7
) 0
.03
7
(0.0
04
, 0
.06
4)
Jen
sen
(1
99
6),
ii
0.1
32
(0
.06
5, 0
.22
6)
3.4
(1
.0, 1
0.1
) 3
2.8
(3
0.8
, 3
5.7
) 1
7.9
(7
.8, 8
3.5
) 0
.03
7
(0.0
01
, 0
.07
1)
Jen
sen
(1
99
6),
iii
0
.11
7
(0.0
59
, 0
.20
9)
3.1
(0
.9, 8
.4)
32
.6
(30
.5, 3
5.3
) 1
9.3
(-
45
.8,
12
6.7
) 0
.03
5
(-0
.00
2,
0.0
67
)
Pet
erse
n &
Wro
ble
wsk
i (1
98
4)
0.0
85
(0
.07
3, 0
.09
5)
2.2
(0
.8, 5
.4)
32
.8
(30
.9, 3
5.9
) 2
6.6
(-
13
2.4
, 2
71
.8)
0.0
24
(-
0.0
05
, 0
.05
1)
Ch
en &
Wata
nab
e (1
98
9)
0.0
42
(0
.02
7, 0
.05
9)
1.1
(0
.4, 2
.7)
32
.6
(30
.7, 3
6.0
) 3
0.4
(-
61
8.4
, 6
10
.0)
0.0
03
(-
0.0
28
, 0
.03
0)
Sto
chast
ic M
0.0
52
(0
.03
3, 0
.07
1)
1.3
(0
.4, 3
.0)
31
.8
(30
.0, 3
4.2
) 3
6.5
(-
51
4.9
, 7
37
.7)
0.0
08
(-
0.0
27
, 0
.03
5)

Fisheries Research Report [Western Australia] No. 151, 2005 111
Ta
ble
v.
R
esu
lts o
f d
em
og
rap
hic
an
aly
sis
of
the
We
ste
rn A
ustr
alia
n C
arc
ha
rhin
us o
bscu
rus p
op
ula
tio
n u
nd
er
ze
ro f
ish
ing
mo
rta
lity,
ba
se
d o
n a
re
pro
du
ctive
pe
rio
dic
ity o
f 2
-3 y
ea
rs.
PM
R
0G
t x2
r
MM
ean
95
% C
I M
ean
95
% C
I M
ean
95
% C
I M
ean
9
5%
CI
Mea
n9
5%
CI
Pau
ly (
19
80
) 0
.06
3
(0.0
23
, 0
.13
9)
1.7
(0
.5, 4
.9)
31
.4
(29
.8, 3
3.4
) 2
7.3
(-
32
4.7
, 3
32
.9)
0.0
16
(-
0.0
20
, 0
.05
2)
Ho
enig
(1
98
3),
i
0.0
14
(0
.04
0, 0
.10
8)
1.8
(0
.6, 4
.8)
31
.4
(29
.7, 3
4.0
) 2
7.4
(-
28
2.6
, 3
21
.2)
0.0
20
(-
0.0
16
, 0
.05
0)
Ho
enig
(1
98
3),
ii
0.0
67
(0
.04
2, 0
.10
3)
1.9
(0
.6, 4
.6)
31
.4
(29
.7, 3
4.1
) 2
9.2
(-
46
2.1
, 3
42
.4)
0.0
20
(-
0.0
15
, 0
.04
8)
Ho
enig
(1
98
3),
iii
0
.06
7
(0.0
33
, 0
.09
1)
1.5
(0
.5, 4
.0)
31
.3
(29
.5, 3
3.9
) 2
8.7
(-
66
0.6
, 3
95
.7)
0.0
13
(-
0.0
23
, 0
.04
4)
Jen
sen
(1
99
6),
i
0.1
97
(0
.19
2, 0
.20
3)
6.1
(2
.2, 1
3.3
) 3
2.7
(3
0.7
, 3
5.6
) 1
2.2
(8
.6, 2
7.6
) 0
.05
7
(0.0
25
, 0
.08
1)
Jen
sen
(1
99
6),
ii
0.1
99
(0
.10
0, 0
.35
2)
6.0
(2
.1, 1
6.5
) 3
2.7
(3
0.7
, 3
5.6
) 1
2.2
(7
.8, 2
9.5
) 0
.05
7
(0.0
23
, 0
.08
8)
Jen
sen
(1
99
6),
iii
0
.18
3
(0.0
89
, 0
.32
0)
5.3
(1
.7, 1
3.4
) 3
2.5
(3
0.6
, 3
5.3
) 1
3.2
(8
.2, 3
3.7
) 0
.05
2
(0.0
17
, 0
.08
3)
Pet
erse
n &
Wro
ble
wsk
i (1
98
4)
0.1
31
(0
.11
3, 0
.14
6)
4.3
(1
.6, 8
.7)
32
.8
(30
.9, 3
5.8
) 1
5.4
(1
0.1
, 4
3.3
) 0
.04
5
(0.0
13
, 0
.06
8)
Ch
en &
Wata
nab
e (1
98
9)
0.0
64
(0
.04
2, 0
.09
2)
2.0
(0
.7, 4
.7)
32
.7
(30
.6, 3
6.0
) 2
8.8
(-
16
7.5
, 2
94
.5)
0.0
21
(-
0.0
14
, 0
.04
6)
Sto
chast
ic M
0.0
79
(0
.05
0, 0
.11
0)
2.2
(0
.8, 5
.2)
31
.9
(30
.2, 3
4.6
) 2
5.4
(-
15
0.0
, 2
44
.2)
0.0
25
(-
0.0
07
, 0
.05
2)
Ta
ble
vi.
Re
su
lts o
f d
em
og
rap
hic
an
aly
sis
of
the
We
ste
rn A
ustr
alia
n C
arc
ha
rhin
us o
bscu
rus p
op
ula
tio
n u
nd
er
the
ra
tes o
f a
ge
sp
ecific
fis
hin
g
mo
rta
lity e
stim
ate
d b
y S
imp
fen
do
rfe
r e
t a
l (1
99
9)
an
d S
imp
fen
do
rfe
r (1
99
9)
for
the
19
94
co
ho
rt, b
ase
d o
n a
re
pro
du
ctive
pe
rio
dic
ity o
f 2
ye
ars
.
PM
R
0G
t x2
r
MM
ean
95
% C
I M
ean
95
% C
I M
ean
95
% C
I M
ean
9
5%
CI
Mea
n9
5%
CI
Pau
ly (
19
80
) 0
.03
6
(0.0
13
, 0
.08
6)
1.2
(0
.4, 3
.4)
31
.4
(29
.7, 3
3.7
) 2
9.5
(-
41
4.9
, 6
02
.7)
0.0
06
(-
0.0
30
, 0
.03
9)
Ho
enig
(1
98
3),
i
0.0
09
(0
.02
6, 0
.06
8)
1.4
(0
.5, 3
.5)
31
.6
(29
.7, 3
4.2
) 3
3.4
(-
44
6.9
, 4
87
.5)
0.0
12
(-
0.0
22
, 0
.03
9)
Ho
enig
(1
98
3),
ii
0.0
42
(0
.02
7, 0
.06
7)
1.5
(0
.6, 3
.4)
31
.5
(29
.7, 3
4.0
) 3
5.6
(-
42
7.9
, 6
63
.6)
0.0
12
(-
0.0
18
, 0
.03
8)
Ho
enig
(1
98
3),
iii
0
.04
3
(0.0
21
, 0
.05
9)
1.1
(0
.4, 2
.8)
31
.2
(29
.5, 3
3.6
) 3
0.2
(-
65
7.4
, 9
06
.2)
0.0
04
(-
0.0
27
, 0
.03
2)
Jen
sen
(1
99
6),
i
0.1
28
(0
.12
5, 0
.13
2)
5.0
(2
.0, 9
.0)
32
.7
(30
.7, 3
5.4
) 1
3.8
(1
0.0
, 2
8.1
) 0
.05
0
(0.0
22
, 0
.06
9)
Jen
sen
(1
99
6),
ii
0.1
32
(0
.06
8, 0
.22
8)
4.9
(1
.9, 1
1.2
) 3
2.7
(3
0.7
, 3
5.7
) 1
3.9
(9
.1, 3
3.5
) 0
.05
0
(0.0
20
, 0
.07
6)
Jen
sen
(1
99
6),
iii
0
.11
9
(0.0
56
, 0
.20
6)
4.3
(1
.7, 1
0.2
) 3
2.5
(3
0.6
, 3
5.5
) 1
5.1
(9
.4, 3
8.1
) 0
.04
6
(0.0
17
, 0
.07
3)
Pet
erse
n &
Wro
ble
wsk
i (1
98
4)
0.0
85
(0
.07
3, 0
.09
5)
3.4
(1
.4, 6
.5)
33
.0
(30
.9, 3
5.9
) 1
8.5
(1
1.7
, 5
5.2
) 0
.03
7
(0.0
10
, 0
.05
7)
Ch
en &
Wata
nab
e (1
98
9)
0.0
42
(0
.02
7, 0
.06
0)
1.6
(0
.6, 3
.3)
32
.7
(30
.7, 3
5.9
) 3
7.0
(-
54
5.2
, 6
49
.8)
0.0
14
(-
0.0
14
, 0
.03
5)
Sto
chast
ic M
0.0
52
(0
.03
5, 0
.07
2)
1.9
(0
.8, 3
.8)
31
.9
(30
.1, 3
4.5
) 3
1.6
(-
21
3.2
, 2
74
.6)
0.0
20
(-
0.0
08
, 0
.04
2)
Appendix III cont.

112 Fisheries Research Report [Western Australia] No. 151, 2005
Ta
ble
vii
. R
esu
lts o
f d
em
og
rap
hic
an
aly
sis
of
the
We
ste
rn A
ustr
alia
n C
arc
ha
rhin
us o
bscu
rus p
op
ula
tio
n u
nd
er
the
ra
tes o
f a
ge
sp
ecific
fis
hin
g
mo
rta
lity e
stim
ate
d b
y S
imp
fen
do
rfe
r e
t a
l (1
99
9)
an
d S
imp
fen
do
rfe
r (1
99
9)
for
the
19
94
co
ho
rt, b
ase
d o
n a
re
pro
du
ctive
pe
rio
dic
ity o
f 3
ye
ars
.
PM
R
0G
t x2
r
MM
ean
95
% C
I M
ean
95
% C
I M
ean
95
% C
I M
ean
9
5%
CI
Mea
n9
5%
CI
Pau
ly (
19
80
) 0
.03
8
(0.0
14
, 0
.08
4)
0.8
(0
.3, 2
.4)
31
.4
(29
.7, 3
3.6
) -2
7.8
(-
63
5.9
, 6
42
.6)
-0.0
07
(-
0.0
44
, 0
.02
8)
Ho
enig
(1
98
3),
i
0.0
09
(0
.02
4, 0
.06
4)
0.9
(0
.3, 2
.2)
31
.4
(29
.6, 3
4.2
) -3
1.3
(-
71
1.4
, 5
81
.8)
-0.0
04
(-
0.0
37
, 0
.02
5)
Ho
enig
(1
98
3),
ii
0.0
38
(0
.02
5, 0
.06
2)
0.9
(0
.3, 2
.1)
31
.4
(29
.6, 3
4.1
) -2
8.9
(-
63
0.6
, 6
75
.9)
-0.0
03
(-
0.0
36
, 0
.02
3)
Ho
enig
(1
98
3),
iii
0
.03
9
(0.0
18
, 0
.05
3)
0.7
(0
.2, 1
.7)
31
.2
(29
.5, 3
3.7
) -3
2.1
(-
56
7.9
, 5
65
.6)
-0.0
12
(-
0.0
48
, 0
.01
6)
Jen
sen
(1
99
6),
i
0.1
16
(0
.11
3, 0
.11
9)
3.0
(1
.2, 5
.6)
32
.7
(30
.7, 3
5.6
) 2
0.2
(1
2.6
, 8
0.8
) 0
.03
4
(0.0
06
, 0
.05
4)
Jen
sen
(1
99
6),
ii
0.1
17
(0
.06
2, 0
.19
7)
2.9
(1
.1, 6
.5)
32
.6
(30
.8, 3
5.4
) 2
0.7
(1
1.4
, 1
06
.5)
0.0
33
(0
.00
4, 0
.05
8)
Jen
sen
(1
99
6),
iii
0
.10
8
(0.0
52
, 0
.18
8)
2.6
(1
.0, 6
.0)
32
.5
(30
.6, 3
5.4
) 2
2.4
(1
0.9
, 1
33
.4)
0.0
30
(0
.00
1, 0
.05
6)
Pet
erse
n &
Wro
ble
wsk
i (1
98
4)
0.0
77
(0
.06
6, 0
.08
5)
2.0
(0
.8, 3
.7)
32
.7
(30
.9, 3
5.7
) 3
1.2
(-
11
9.6
, 2
30
.3)
0.0
21
(-
0.0
08
, 0
.03
9)
Ch
en &
Wata
nab
e (1
98
9)
0.0
38
(0
.02
4, 0
.05
4)
1.0
(0
.4, 2
.0)
32
.6
(30
.6, 3
5.9
) -2
7.2
(-
91
5.3
, 9
10
.9)
-0.0
01
(-
0.0
27
, 0
.02
1)
Sto
chast
ic M
0.0
47
(0
.03
1, 0
.06
6)
1.1
(0
.5, 2
.4)
31
.9
(30
.1, 3
4.4
) 3
5.7
(-
1,0
59
.6,
68
8.8
) 0
.00
3
(-0
.02
5,
0.0
27
)
Ta
ble
vii
i.
Re
su
lts o
f d
em
og
rap
hic
an
aly
sis
of
the
We
ste
rn A
ustr
alia
n C
arc
ha
rhin
us o
bscu
rus p
op
ula
tio
n u
nd
er
the
ra
tes o
f a
ge
sp
ecific
fis
hin
g
mo
rta
lity e
stim
ate
d b
y S
imp
fen
do
rfe
r e
t a
l (1
99
9)
an
d S
imp
fen
do
rfe
r (1
99
9)
for
the
19
94
co
ho
rt, b
ase
d o
n a
re
pro
du
ctive
pe
rio
dic
ity o
f 4
ye
ars
.
PM
R
0G
t x2
r
MM
ean
95
% C
I M
ean
95
% C
I M
ean
95
% C
I M
ean
9
5%
CI
Mea
n9
5%
CI
Pau
ly (
19
80
) 0
.03
8
(0.0
14
, 0
.08
4)
0.6
(0
.2, 1
.7)
31
.3
(29
.6, 3
3.5
) -3
2.3
(-
41
2.8
, 4
02
.9)
-0.0
15
(-
0.0
47
, 0
.01
6)
Ho
enig
(1
98
3),
i
0.0
09
(0
.02
5, 0
.06
6)
0.7
(0
.2, 1
.6)
31
.4
(29
.6, 3
3.9
) -3
4.2
(-
44
5.9
, 4
72
.7)
-0.0
14
(-
0.0
45
, 0
.01
4)
Ho
enig
(1
98
3),
ii
0.0
38
(0
.02
6, 0
.06
0)
0.7
(0
.3, 1
.5)
31
.4
(29
.8, 3
4.0
) -3
5.7
(-
79
4.2
, 5
10
.0)
-0.0
13
(-
0.0
43
, 0
.01
4)
Ho
enig
(1
98
3),
iii
0
.03
9
(0.0
19
, 0
.05
4)
0.5
(0
.2, 1
.3)
31
.3
(29
.5, 3
3.8
) -2
7.8
(-
31
3.2
, 2
72
.3)
-0.0
21
(-
0.0
53
, 0
.00
8)
Jen
sen
(1
99
6),
i
0.1
16
(0
.11
3, 0
.11
9)
2.2
(0
.9, 4
.2)
32
.7
(30
.7, 3
5.6
) 2
7.0
(-
83
.9,
13
2.3
) 0
.02
5
(-0
.00
3,
0.0
45
)
Jen
sen
(1
99
6),
ii
0.1
18
(0
.05
8, 0
.20
6)
2.2
(0
.8, 5
.4)
32
.6
(30
.6, 3
5.5
) 2
5.6
(-
14
2.8
, 2
08
.7)
0.0
25
(-
0.0
06
, 0
.05
2)
Jen
sen
(1
99
6),
iii
0
.10
6
(0.0
51
, 0
.18
1)
2.0
(0
.8, 4
.5)
32
.6
(30
.7, 3
5.3
) 2
9.3
(-
35
9.5
, 2
73
.3)
0.0
21
(-
0.0
06
, 0
.04
7)
Pet
erse
n &
Wro
ble
wsk
i (1
98
4)
0.0
77
(0
.06
6, 0
.08
5)
1.5
(0
.6, 2
.7)
32
.9
(30
.9, 3
5.9
) 4
0.7
(-
35
8.8
, 3
92
.6)
0.0
13
(-
0.0
14
, 0
.03
1)
Ch
en &
Wata
nab
e (1
98
9)
0.0
39
(0
.02
5, 0
.05
4)
0.7
(0
.3, 1
.6)
32
.7
(30
.6, 3
5.9
) -3
9.5
(-
56
5.0
, 6
55
.3)
-0.0
10
(-
0.0
39
, 0
.01
3)
Sto
chast
ic M
0.0
47
(0
.02
9, 0
.06
6)
0.8
(0
.4, 1
.7)
31
.8
(30
.1, 3
4.5
) -3
8.8
(-
74
5.6
, 5
89
.2)
-0.0
06
(-
0.0
32
, 0
.01
7)

Fisheries Research Report [Western Australia] No. 151, 2005 11�
Ta
ble
ix
. R
esu
lts o
f d
em
og
rap
hic
an
aly
sis
of
the
We
ste
rn A
ustr
alia
n C
arc
ha
rhin
us o
bscu
rus p
op
ula
tio
n u
nd
er
the
ra
tes o
f a
ge
sp
ecific
fis
hin
g
mo
rta
lity e
stim
ate
d b
y S
imp
fen
do
rfe
r e
t a
l (1
99
9)
an
d S
imp
fen
do
rfe
r (1
99
9)
for
the
19
94
co
ho
rt, b
ase
d o
n a
re
pro
du
ctive
pe
rio
dic
ity o
f 2
-4 y
ea
rs.
PM
R
0G
t x2
r
MM
ean
95
% C
I M
ean
95
% C
I M
ean
95
% C
I M
ean
9
5%
CI
Mea
n9
5%
CI
Pau
ly (
19
80
) 0
.03
8
(0.0
14
, 0
.08
6)
0.9
(0
.2, 2
.9)
31
.4
(29
.7, 3
3.7
) -2
3.8
(-
54
0.7
, 4
16
.7)
-0.0
05
(-
0.0
44
, 0
.03
3)
Ho
enig
(1
98
3),
i
0.0
08
(0
.02
5, 0
.06
4)
0.9
(0
.3, 2
.7)
31
.5
(29
.7, 3
4.2
) -2
0.4
(-
51
5.4
, 4
88
.1)
-0.0
02
(-
0.0
38
, 0
.03
1)
Ho
enig
(1
98
3),
ii
0.0
39
(0
.02
5, 0
.06
0)
0.9
(0
.3, 2
.5)
31
.5
(29
.8, 3
3.9
) -2
3.3
(-
79
8.6
, 5
59
.9)
-0.0
03
(-
0.0
39
, 0
.02
9)
Ho
enig
(1
98
3),
iii
0
.03
8
(0.0
19
, 0
.05
1)
0.7
(0
.2, 2
.0)
31
.2
(29
.4, 3
3.6
) -2
7.4
(-
61
0.0
, 6
33
.7)
-0.0
12
(-
0.0
48
, 0
.02
2)
Jen
sen
(1
99
6),
i
0.1
16
(0
.11
3, 0
.11
9)
3.0
(1
.1, 7
.4)
32
.7
(30
.7, 3
5.4
) 1
9.7
(9
.8, 8
5.3
) 0
.03
4
(0.0
02
, 0
.06
2)
Jen
sen
(1
99
6),
ii
0.1
19
(0
.06
1, 0
.20
9)
3.0
(1
.0, 9
.5)
32
.8
(30
.8, 3
5.7
) 1
9.6
(-
35
.6,
10
6.4
) 0
.03
4
(-0
.00
1,
0.0
69
)
Jen
sen
(1
99
6),
iii
0
.10
8
(0.0
51
, 0
.19
3)
2.7
(0
.8, 7
.5)
32
.6
(30
.5, 3
5.3
) 2
1.1
(-
94
.0,
14
3.3
) 0
.03
1
(-0
.00
7,
0.0
64
)
Pet
erse
n &
Wro
ble
wsk
i (1
98
4)
0.0
77
(0
.06
6, 0
.08
5)
2.0
(0
.8, 4
.7)
32
.9
(31
.0, 3
5.8
) 2
8.8
(-
18
8.8
, 3
01
.2)
0.0
22
(-
0.0
06
, 0
.04
7)
Ch
en &
Wata
nab
e (1
98
9)
0.0
38
(0
.02
4, 0
.05
4)
1.0
(0
.3, 2
.4)
32
.7
(30
.6, 3
5.8
) 2
0.4
(-
1,3
58
.9,
83
5.8
) 0
.00
0
(-0
.03
5,
0.0
27
)
Sto
chast
ic M
0.0
46
(0
.02
9, 0
.06
5)
1.1
(0
.4, 2
.8)
31
.9
(30
.0, 3
4.6
) 3
0.0
(-
52
9.7
, 6
43
.9)
0.0
04
(-
0.0
27
, 0
.03
2)
Ta
ble
x.
Re
su
lts o
f d
em
og
rap
hic
an
aly
sis
of
the
We
ste
rn A
ustr
alia
n C
arc
ha
rhin
us o
bscu
rus p
op
ula
tio
n u
nd
er
the
ra
tes o
f a
ge
sp
ecific
fis
hin
g
mo
rta
lity e
stim
ate
d b
y S
imp
fen
do
rfe
r e
t a
l (1
99
9)
an
d S
imp
fen
do
rfe
r (1
99
9)
for
the
19
94
co
ho
rt, b
ase
d o
n a
re
pro
du
ctive
pe
rio
dic
ity o
f 2
-3 y
ea
rs.
PM
R
0G
t x2
r
MM
ean
95
% C
I M
ean
95
% C
I M
ean
95
% C
I M
ean
9
5%
CI
Mea
n9
5%
CI
Pau
ly (
19
80
) 0
.03
7
(0.0
14
, 0
.08
2)
1.0
(0
.3, 2
.9)
31
.4
(29
.7, 3
3.8
) -1
3.3
(-
58
6.6
, 6
93
.0)
0.0
00
(-
0.0
38
, 0
.03
4)
Ho
enig
(1
98
3),
i
0.0
08
(0
.02
4, 0
.06
6)
1.1
(0
.4, 2
.9)
31
.5
(29
.6, 3
4.1
) 2
6.4
(-
47
6.1
, 8
58
.1)
0.0
03
(-
0.0
31
, 0
.03
3)
Ho
enig
(1
98
3),
ii
0.0
39
(0
.02
5, 0
.06
0)
1.1
(0
.4, 2
.6)
31
.4
(29
.6, 3
3.8
) 2
5.7
(-
69
3.2
, 5
25
.6)
0.0
02
(-
0.0
30
, 0
.03
0)
Ho
enig
(1
98
3),
iii
0
.03
8
(0.0
19
, 0
.05
1)
0.8
(0
.3, 2
.3)
31
.2
(29
.6, 3
3.8
) -3
0.7
(-
45
3.3
, 5
29
.7)
-0.0
06
(-
0.0
39
, 0
.02
5)
Jen
sen
(1
99
6),
i
0.1
16
(0
.11
3, 0
.11
9)
3.6
(1
.4, 7
.6)
32
.7
(30
.7, 3
5.6
) 1
7.3
(1
0.8
, 6
2.9
) 0
.04
0
(0.0
11
, 0
.06
3)
Jen
sen
(1
99
6),
ii
0.1
19
(0
.06
2, 0
.20
3)
3.6
(1
.3, 9
.1)
32
.6
(30
.7, 3
5.6
) 1
7.1
(9
.6, 6
8.9
) 0
.04
0
(0.0
08
, 0
.06
9)
Jen
sen
(1
99
6),
iii
0
.10
5
(0.0
53
, 0
.18
3)
3.1
(1
.0, 7
.7)
32
.6
(30
.6, 3
5.5
) 1
8.8
(8
.8, 1
25
.1)
0.0
36
(0
.00
1, 0
.06
5)
Pet
erse
n &
Wro
ble
wsk
i (1
98
4)
0.0
77
(0
.06
6, 0
.08
5)
2.4
(0
.9, 4
.8)
32
.9
(30
.9, 3
5.7
) 2
4.7
(-
37
.8,
16
8.4
) 0
.02
7
(-0
.00
3,
0.0
48
)
Ch
en &
Wata
nab
e (1
98
9)
0.0
38
(0
.02
5, 0
.05
4)
1.2
(0
.4, 2
.8)
32
.7
(30
.6, 3
5.9
) 3
6.1
(-
88
9.6
, 6
51
.7)
0.0
06
(-
0.0
25
, 0
.03
1)
Sto
chast
ic M
0.0
47
(0
.03
0, 0
.06
5)
1.3
(0
.5, 3
.0)
31
.9
(30
.1, 3
4.4
) 3
4.6
(-
65
2.5
, 6
88
.5)
0.0
08
(-
0.0
22
, 0
.03
5)
Appendix III cont.

114 Fisheries Research Report [Western Australia] No. 151, 2005
Ta
ble
xi.
R
esu
lts o
f d
em
og
rap
hic
an
aly
sis
of
the
We
ste
rn A
ustr
alia
n C
arc
ha
rhin
us o
bscu
rus p
op
ula
tio
n u
nd
er
the
ra
tes o
f a
ge
sp
ecific
fis
hin
g
mo
rta
lity e
stim
ate
d b
y S
imp
fen
do
rfe
r e
t a
l (1
99
9)
an
d S
imp
fen
do
rfe
r (1
99
9)
for
the
19
95
co
ho
rt, b
ase
d o
n a
re
pro
du
ctive
pe
rio
dic
ity
of 2
ye
ars
.
PM
R
0G
t x2
r
MM
ean
95
% C
I M
ean
95
% C
I M
ean
95
% C
I M
ean
9
5%
CI
Mea
n9
5%
CI
Pau
ly (
19
80
) 0
.04
2
(0.0
16
, 0
.09
3)
1.4
(0
.5, 3
.6)
31
.5
(29
.8, 3
3.6
) 3
4.0
(-
56
5.7
, 5
24
.7)
0.0
10
(-
0.0
22
, 0
.04
0)
Ho
enig
(1
98
3),
i
0.0
09
(0
.02
9, 0
.10
4)
1.8
(0
.6, 4
.9)
31
.4
(29
.7, 3
4.0
) 2
8.6
(-
28
0.2
, 3
18
.6)
0.0
20
(-
0.0
16
, 0
.05
0)
Ho
enig
(1
98
3),
ii
0.0
57
(0
.04
5, 0
.10
2)
2.3
(0
.9, 5
.2)
31
.5
(29
.7, 3
3.9
) 2
4.4
(-
95
.1,
16
1.4
) 0
.02
7
(-0
.00
5,
0.0
53
)
Ho
enig
(1
98
3),
iii
0
.06
7
(0.0
32
, 0
.09
1)
1.7
(0
.6, 4
.3)
31
.3
(29
.5, 3
3.7
) 3
1.1
(-
30
3.9
, 4
47
.7)
0.0
18
(-
0.0
15
, 0
.04
6)
Jen
sen
(1
99
6),
i
0.1
97
(0
.19
2, 0
.20
3)
7.8
(3
.2, 1
4.3
) 3
2.6
(3
0.7
, 3
5.5
) 1
0.7
(8
.2, 1
9.1
) 0
.06
5
(0.0
36
, 0
.08
5)
Jen
sen
(1
99
6),
ii
0.2
04
(0
.10
0, 0
.35
7)
7.5
(2
.6, 1
7.7
) 3
2.7
(3
0.8
, 3
5.5
) 1
0.9
(7
.7, 2
3.1
) 0
.06
4
(0.0
30
, 0
.09
0)
Jen
sen
(1
99
6),
iii
0
.18
1
(0.0
83
, 0
.31
9)
6.5
(2
.4, 1
6.3
) 3
2.5
(3
0.6
, 3
5.3
) 1
1.7
(8
.0, 2
4.9
) 0
.05
9
(0.0
28
, 0
.08
7)
Pet
erse
n &
Wro
ble
wsk
i (1
98
4)
0.1
31
(0
.11
3, 0
.14
6)
5.1
(2
.1, 9
.6)
32
.9
(31
.0, 3
5.8
) 1
3.8
(9
.7, 2
8.8
) 0
.05
0
(0.0
24
, 0
.07
1)
Ch
en &
Wata
nab
e (1
98
9)
0.0
66
(0
.04
1, 0
.09
2)
2.5
(0
.9, 5
.3)
32
.7
(30
.6, 3
5.9
) 2
3.4
(-
38
.6,
11
6.6
) 0
.02
8
(-0
.00
3,
0.0
51
)
Sto
chast
ic M
0.0
79
(0
.05
2, 0
.11
0)
2.8
(1
.1, 5
.5)
31
.9
(30
.0, 3
4.5
) 2
1.2
(1
2.2
, 9
4.3
) 0
.03
2
(0.0
04
, 0
.05
4)
Ta
ble
xii
. R
esu
lts o
f d
em
og
rap
hic
an
aly
sis
of
the
We
ste
rn A
ustr
alia
n C
arc
ha
rhin
us o
bscu
rus p
op
ula
tio
n u
nd
er
the
ra
tes o
f a
ge
sp
ecific
fis
hin
g
mo
rta
lity e
stim
ate
d b
y S
imp
fen
do
rfe
r e
t a
l (1
99
9)
an
d S
imp
fen
do
rfe
r (1
99
9)
for
the
19
95
co
ho
rt, b
ase
d o
n a
re
pro
du
ctive
pe
rio
dic
ity
of 3
ye
ars
.
PM
R
0G
t x2
r
MM
ean
95
% C
I M
ean
95
% C
I M
ean
95
% C
I M
ean
9
5%
CI
Mea
n9
5%
CI
Pau
ly (
19
80
) 0
.04
1
(0.0
15
, 0
.09
3)
0.9
(0
.3, 2
.7)
31
.4
(29
.7, 3
3.6
) -2
4.0
(-
43
9.9
, 5
78
.6)
-0.0
03
(-
0.0
39
, 0
.03
1)
Ho
enig
(1
98
3),
i
0.0
09
(0
.02
6, 0
.07
0)
1.0
(0
.4, 2
.4)
31
.5
(29
.7, 3
4.1
) 2
0.0
(-
53
7.8
, 8
15
.0)
0.0
00
(-
0.0
31
, 0
.02
8)
Ho
enig
(1
98
3),
ii
0.0
44
(0
.02
7, 0
.06
7)
1.0
(0
.4, 2
.3)
31
.5
(29
.7, 3
3.9
) -2
0.0
(-
98
9.3
, 6
87
.3)
-0.0
01
(-
0.0
33
, 0
.02
5)
Ho
enig
(1
98
3),
iii
0
.04
3
(0.0
21
, 0
.05
9)
0.8
(0
.3, 1
.8)
31
.2
(29
.4, 3
3.5
) -3
3.1
(-
51
2.9
, 4
83
.8)
-0.0
09
(-
0.0
39
, 0
.01
8)
Jen
sen
(1
99
6),
i
0.1
28
(0
.12
5, 0
.13
2)
3.2
(1
.4, 6
.0)
32
.6
(30
.7, 3
5.4
) 1
8.9
(1
2.0
, 5
9.0
) 0
.03
6
(0.0
10
, 0
.05
6)
Jen
sen
(1
99
6),
ii
0.1
31
(0
.06
6, 0
.22
4)
3.2
(1
.1, 7
.6)
32
.6
(30
.8, 3
5.5
) 1
8.5
(1
0.4
, 1
00
.4)
0.0
37
(0
.00
4, 0
.06
3)
Jen
sen
(1
99
6),
iii
0
.11
8
(0.0
55
, 0
.20
8)
2.9
(1
.0, 6
.9)
32
.5
(30
.6, 3
5.5
) 2
0.3
(-
23
.1,
94
.9)
0.0
33
(-
0.0
01
, 0
.06
1)
Pet
erse
n &
Wro
ble
wsk
i (1
98
4)
0.0
85
(0
.07
3, 0
.09
5)
2.2
(0
.9, 4
.2)
32
.8
(30
.9, 3
5.8
) 2
6.8
(-
64
.0,
14
4.3
) 0
.02
5
(-0
.00
3,
0.0
43
)
Ch
en &
Wata
nab
e (1
98
9)
0.0
42
(0
.02
8, 0
.05
9)
1.0
(0
.4, 2
.3)
32
.6
(30
.7, 3
5.9
) 3
2.5
(-
98
7.5
, 8
77
.3)
0.0
01
(-
0.0
28
, 0
.02
4)
Sto
chast
ic M
0.0
52
(0
.03
2, 0
.07
3)
1.2
(0
.4, 2
.6)
31
.9
(30
.0, 3
4.4
) 4
0.8
(-
64
7.1
, 6
78
.9)
0.0
06
(-
0.0
27
, 0
.02
9)

Fisheries Research Report [Western Australia] No. 151, 2005 115
Ta
ble
xii
i.
Re
su
lts o
f d
em
og
rap
hic
an
aly
sis
of
the
We
ste
rn A
ustr
alia
n C
arc
ha
rhin
us o
bscu
rus p
op
ula
tio
n u
nd
er
the
ra
tes o
f a
ge
sp
ecific
fis
hin
g
mo
rta
lity e
stim
ate
d b
y S
imp
fen
do
rfe
r e
t a
l (1
99
9)
an
d S
imp
fen
do
rfe
r (1
99
9)
for
the
19
95
co
ho
rt, b
ase
d o
n a
re
pro
du
ctive
pe
rio
dic
ity
of 4
ye
ars
.
PM
R
0G
t x2
r
MM
ean
95
% C
I M
ean
95
% C
I M
ean
95
% C
I M
ean
9
5%
CI
Mea
n9
5%
CI
Pau
ly (
19
80
) 0
.04
3
(0.0
16
, 0
.09
5)
0.7
(0
.2, 1
.9)
31
.4
(29
.6, 3
3.6
) -2
9.5
(-
42
6.3
, 3
36
.0)
-0.0
12
(-
0.0
51
, 0
.02
1)
Ho
enig
(1
98
3),
i
0.0
09
(0
.02
8, 0
.07
0)
0.7
(0
.3, 1
.8)
31
.4
(29
.7, 3
4.2
) -3
3.2
(-
56
5.9
, 5
40
.0)
-0.0
10
(-
0.0
42
, 0
.01
9)
Ho
enig
(1
98
3),
ii
0.0
42
(0
.02
9, 0
.06
9)
0.7
(0
.3, 1
.7)
31
.4
(29
.7, 3
4.1
) -3
3.5
(-
52
7.5
, 7
81
.3)
-0.0
10
(-
0.0
42
, 0
.01
6)
Ho
enig
(1
98
3),
iii
0
.04
3
(0.0
20
, 0
.05
7)
0.6
(0
.2, 1
.4)
31
.2
(29
.5, 3
3.7
) -3
0.0
(-
33
8.1
, 3
70
.0)
-0.0
18
(-
0.0
48
, 0
.01
1)
Jen
sen
(1
99
6),
i
0.1
28
(0
.12
5, 0
.13
2)
2.4
(1
.0, 4
.6)
32
.7
(30
.7, 3
5.5
) 2
4.4
(-
20
.4,
11
9.5
) 0
.02
8
(-0
.00
1,
0.0
47
)
Jen
sen
(1
99
6),
ii
0.1
31
(0
.06
8, 0
.23
2)
2.5
(0
.9, 6
.0)
32
.7
(30
.7, 3
5.6
) 2
3.3
(-
70
.7,
17
8.6
) 0
.02
9
(-0
.00
3,
0.0
55
)
Jen
sen
(1
99
6),
iii
0
.11
8
(0.0
58
, 0
.20
1)
2.1
(0
.8, 5
.1)
32
.6
(30
.6, 3
5.4
) 2
6.7
(-
17
6.0
, 2
99
.1)
0.0
24
(-
0.0
06
, 0
.04
9)
Pet
erse
n &
Wro
ble
wsk
i (1
98
4)
0.0
85
(0
.07
3, 0
.09
5)
1.7
(0
.7, 3
.2)
33
.0
(30
.9, 3
6.0
) 3
6.5
(-
29
2.7
, 2
99
.6)
0.0
16
(-
0.0
11
, 0
.03
5)
Ch
en &
Wata
nab
e (1
98
9)
0.0
42
(0
.02
7, 0
.06
0)
0.8
(0
.3, 1
.6)
32
.6
(30
.5, 3
5.9
) -4
1.1
(-
87
9.1
, 6
65
.9)
-0.0
06
(-
0.0
34
, 0
.01
5)
Sto
chast
ic M
0.0
51
(0
.03
4, 0
.07
1)
0.9
(0
.3, 1
.9)
31
.9
(30
.0, 3
4.5
) -3
2.2
(-
70
6.5
, 7
89
.1)
-0.0
03
(-
0.0
33
, 0
.01
9)
Ta
ble
xiv
. R
esu
lts o
f d
em
og
rap
hic
an
aly
sis
of
the
We
ste
rn A
ustr
alia
n C
arc
ha
rhin
us o
bscu
rus p
op
ula
tio
n u
nd
er
the
ra
tes o
f a
ge
sp
ecific
fis
hin
g
mo
rta
lity e
stim
ate
d b
y S
imp
fen
do
rfe
r e
t a
l (1
99
9)
an
d S
imp
fen
do
rfe
r (1
99
9)
for
the
19
95
co
ho
rt, b
ase
d o
n a
re
pro
du
ctive
pe
rio
dic
ity
of 2
-4 y
ea
rs.
PM
R
0G
t x2
r
MM
ean
95
% C
I M
ean
95
% C
I M
ean
95
% C
I M
ean
9
5%
CI
Mea
n9
5%
CI
Pau
ly (
19
80
) 0
.04
1
(0.0
15
, 0
.09
2)
0.9
(0
.3, 3
.0)
31
.4
(29
.8, 3
3.7
) -1
9.2
(-
44
5.2
, 5
72
.8)
-0.0
02
(-
0.0
41
, 0
.03
5)
Ho
enig
(1
98
3),
i
0.0
10
(0
.02
8, 0
.07
1)
1.0
(0
.3, 3
.0)
31
.4
(29
.6, 3
4.0
) 1
5.7
(-
83
8.7
, 5
34
.9)
0.0
00
(-
0.0
34
, 0
.03
4)
Ho
enig
(1
98
3),
ii
0.0
42
(0
.02
9, 0
.06
7)
1.0
(0
.3, 2
.7)
31
.5
(29
.7, 3
4.1
) -1
2.7
(-
65
5.4
, 5
01
.0)
0.0
00
(-
0.0
35
, 0
.03
2)
Ho
enig
(1
98
3),
iii
0
.04
2
(0.0
21
, 0
.05
9)
0.8
(0
.2, 2
.3)
31
.2
(29
.5, 3
3.8
) -2
5.9
(-
50
8.0
, 4
40
.4)
-0.0
08
(-
0.0
49
, 0
.02
7)
Jen
sen
(1
99
6),
i
0.1
28
(0
.12
5, 0
.13
2)
3.3
(1
.4, 8
.0)
32
.6
(30
.7, 3
5.7
) 1
8.5
(1
0.5
, 6
6.1
) 0
.03
7
(0.0
09
, 0
.06
5)
Jen
sen
(1
99
6),
ii
0.1
35
(0
.06
8, 0
.22
6)
3.5
(1
.1, 9
.9)
32
.6
(30
.8, 3
5.7
) 1
7.5
(8
.5, 8
3.9
) 0
.03
9
(0.0
01
, 0
.07
2)
Jen
sen
(1
99
6),
iii
0
.11
5
(0.0
55
, 0
.21
0)
3.0
(1
.0, 8
.8)
32
.5
(30
.6, 3
5.2
) 1
9.7
(-
12
.5,
11
7.3
) 0
.03
4
(0.0
00
, 0
.06
7)
Pet
erse
n &
Wro
ble
wsk
i (1
98
4)
0.0
85
(0
.07
3, 0
.09
5)
2.3
(0
.9, 5
.6)
33
.0
(30
.9, 3
6.0
) 2
5.8
(-
13
5.9
, 1
89
.1)
0.0
25
(-
0.0
05
, 0
.05
2)
Ch
en &
Wata
nab
e (1
98
9)
0.0
43
(0
.02
7, 0
.06
0)
1.1
(0
.4, 2
.8)
32
.7
(30
.7, 3
5.7
) 3
0.0
(-
67
9.1
, 6
62
.3)
0.0
03
(-
0.0
31
, 0
.03
2)
Sto
chast
ic M
0.0
52
(0
.03
3, 0
.07
1)
1.2
(0
.4, 3
.3)
31
.8
(30
.1, 3
4.5
) 3
1.4
(-
62
6.1
, 8
64
.5)
0.0
06
(-
0.0
25
, 0
.03
7)
Appendix III cont.

116 Fisheries Research Report [Western Australia] No. 151, 2005
Ta
ble
xv
.
Re
su
lts o
f d
em
og
rap
hic
an
aly
sis
of
the
We
ste
rn A
ustr
alia
n C
arc
ha
rhin
us o
bscu
rus p
op
ula
tio
n u
nd
er
the
ra
tes o
f a
ge
sp
ecific
fis
hin
g
mo
rta
lity e
stim
ate
d b
y S
imp
fen
do
rfe
r e
t a
l (1
99
9)
an
d S
imp
fen
do
rfe
r (1
99
9)
for
the
19
95
co
ho
rt, b
ase
d o
n a
re
pro
du
ctive
pe
rio
dic
ity
of 2
-3 y
ea
rs.
PM
R
0G
t x2
r
MM
ean
95
% C
I M
ean
95
% C
I M
ean
95
% C
I M
ean
9
5%
CI
Mea
n9
5%
CI
Pau
ly (
19
80
) 0
.04
0
(0.0
15
, 0
.09
1)
1.1
(0
.3, 3
.2)
31
.4
(29
.8, 3
3.4
) 2
3.8
(-
67
8.2
, 5
22
.3)
0.0
03
(-
0.0
36
, 0
.03
7)
Ho
enig
(1
98
3),
i
0.0
09
(0
.02
8, 0
.07
3)
1.2
(0
.4, 3
.1)
31
.5
(29
.7, 3
4.1
) 3
0.0
(-
53
3.5
, 8
58
.1)
0.0
05
(-
0.0
28
, 0
.03
6)
Ho
enig
(1
98
3),
ii
0.0
43
(0
.02
9, 0
.06
9)
1.2
(0
.4, 3
.0)
31
.5
(29
.7, 3
4.0
) 3
2.4
(-
59
7.7
, 6
01
.0)
0.0
06
(-
0.0
27
, 0
.03
6)
Ho
enig
(1
98
3),
iii
0
.04
3
(0.0
20
, 0
.05
7)
0.9
(0
.3, 2
.6)
31
.1
(29
.4, 3
3.7
) -2
2.3
(-
49
8.2
, 5
92
.3)
-0.0
02
(-
0.0
35
, 0
.03
0)
Jen
sen
(1
99
6),
i
0.1
28
(0
.12
5, 0
.13
2)
3.9
(1
.6, 8
.1)
32
.6
(30
.7, 3
5.4
) 1
6.2
(1
0.6
, 4
4.7
) 0
.04
3
(0.0
16
, 0
.06
5)
Jen
sen
(1
99
6),
ii
0.1
31
(0
.06
6, 0
.22
3)
3.9
(1
.3, 1
0.0
) 3
2.6
(3
0.7
, 3
5.7
) 1
5.9
(9
.3, 6
4.7
) 0
.04
3
(0.0
08
, 0
.07
3)
Jen
sen
(1
99
6),
iii
0
.11
5
(0.0
56
, 0
.20
8)
3.5
(1
.1, 9
.2)
32
.5
(30
.6, 3
5.4
) 1
7.5
(9
.0, 8
9.0
) 0
.03
9
(0.0
03
, 0
.07
0)
Pet
erse
n &
Wro
ble
wsk
i (1
98
4)
0.0
85
(0
.07
3, 0
.09
5)
2.6
(1
.0, 5
.5)
32
.9
(30
.8, 3
6.0
) 2
2.8
(0
.3, 1
14
.3)
0.0
30
(0
.00
0, 0
.05
3)
Ch
en &
Wata
nab
e (1
98
9)
0.0
42
(0
.02
7, 0
.05
9)
1.3
(0
.5, 3
.0)
32
.7
(30
.7, 3
6.0
) 3
7.8
(-
86
3.6
, 4
58
.8)
0.0
08
(-
0.0
21
, 0
.03
3)
Sto
chast
ic M
0.0
52
(0
.03
2, 0
.07
2)
1.5
(0
.5, 3
.4)
31
.7
(30
.1, 3
4.6
) 3
6.0
(-
41
6.0
, 6
27
.3)
0.0
13
(-
0.0
19
, 0
.03
9)
Ta
ble
xv
i.
Re
su
lts o
f d
em
og
rap
hic
an
aly
sis
of
the
We
ste
rn A
ustr
alia
n C
arc
ha
rhin
us o
bscu
rus p
op
ula
tio
n u
nd
er
the
ra
tes o
f a
ge
sp
ecific
fis
hin
g
mo
rta
lity e
stim
ate
d in
th
e c
urr
en
t stu
dy f
or
the
19
94
co
ho
rt, b
ase
d o
n a
re
pro
du
ctive
pe
rio
dic
ity o
f 2
ye
ars
.
PM
R
0G
t x2
r
MM
ean
95
% C
I M
ean
95
% C
I M
ean
95
% C
I M
ean
9
5%
CI
Mea
n9
5%
CI
Pau
ly (
19
80
) 0
.03
8
(0.0
14
, 0
.08
7)
1.2
(0
.4, 3
.3)
31
.4
(29
.8, 3
3.6
) 2
9.8
(-
61
7.0
, 5
99
.9)
0.0
07
(-
0.0
26
, 0
.03
8)
Ho
enig
(1
98
3),
i
0.0
08
(0
.02
6, 0
.06
5)
1.4
(0
.5, 3
.2)
31
.5
(29
.7, 3
4.2
) 3
3.1
(-
53
9.5
, 5
46
.7)
0.0
10
(-
0.0
23
, 0
.03
6)
Ho
enig
(1
98
3),
ii
0.0
40
(0
.02
6, 0
.06
4)
1.3
(0
.5, 3
.1)
31
.4
(29
.7, 3
4.1
) 3
6.5
(-
70
1.9
, 5
92
.3)
0.0
09
(-
0.0
24
, 0
.03
6)
Ho
enig
(1
98
3),
iii
0
.03
9
(0.0
18
, 0
.05
3)
1.0
(0
.4, 2
.5)
31
.2
(29
.5, 3
3.8
) 2
2.0
(-
58
9.4
, 6
37
.5)
0.0
01
(-
0.0
30
, 0
.02
8)
Jen
sen
(1
99
6),
i
0.1
21
(0
.11
8, 0
.12
4)
4.6
(2
.0, 8
.7)
32
.7
(30
.7, 3
5.5
) 1
4.4
(1
0.1
, 3
3.4
) 0
.04
8
(0.0
21
, 0
.06
8)
Jen
sen
(1
99
6),
ii
0.1
23
(0
.06
3, 0
.21
3)
4.4
(1
.6, 1
0.5
) 3
2.6
(3
0.6
, 3
5.8
) 1
4.8
(9
.3, 4
7.1
) 0
.04
7
(0.0
13
, 0
.07
3)
Jen
sen
(1
99
6),
iii
0
.11
5
(0.0
54
, 0
.20
0)
4.2
(1
.4, 1
0.1
) 3
2.7
(3
0.6
, 3
5.4
) 1
5.1
(9
.1, 4
7.8
) 0
.04
5
(0.0
10
, 0
.07
2)
Pet
erse
n &
Wro
ble
wsk
i (1
98
4)
0.0
76
(0
.06
6, 0
.08
5)
2.9
(1
.3, 5
.6)
32
.8
(30
.9, 3
5.9
) 2
1.0
(1
2.5
, 7
0.5
) 0
.03
3
(0.0
07
, 0
.05
3)
Ch
en &
Wata
nab
e (1
98
9)
0.0
32
(0
.02
1, 0
.04
7)
1.2
(0
.5, 2
.5)
32
.7
(30
.5, 3
5.7
) 3
9.5
(-
94
3.7
, 7
30
.1)
0.0
06
(-
0.0
21
, 0
.02
7)
Sto
chast
ic M
0.0
45
(0
.02
9, 0
.06
3)
1.6
(0
.6, 3
.2)
31
.9
(30
.1, 3
4.6
) 3
5.6
(-
42
0.9
, 5
43
.0)
0.0
14
(-
0.0
14
, 0
.03
6)

Fisheries Research Report [Western Australia] No. 151, 2005 117
Ta
ble
xv
ii.
Re
su
lts o
f d
em
og
rap
hic
an
aly
sis
of
the
We
ste
rn A
ustr
alia
n C
arc
ha
rhin
us o
bscu
rus p
op
ula
tio
n u
nd
er
the
ra
tes o
f a
ge
sp
ecific
fis
hin
g
mo
rta
lity e
stim
ate
d in
th
e c
urr
en
t stu
dy f
or
the
19
94
co
ho
rt, b
ase
d o
n a
re
pro
du
ctive
pe
rio
dic
ity o
f 3
ye
ars
.
PM
R
0G
t x2
r
MM
ean
95
% C
I M
ean
95
% C
I M
ean
95
% C
I M
ean
9
5%
CI
Mea
n9
5%
CI
Pau
ly (
19
80
) 0
.03
8
(0.0
14
, 0
.08
7)
0.8
(0
.3, 2
.3)
31
.4
(29
.8, 3
3.5
) -2
8.2
(-
52
8.1
, 5
86
.3)
-0.0
06
(-
0.0
43
, 0
.02
6)
Ho
enig
(1
98
3),
i
0.0
08
(0
.02
6, 0
.06
5)
0.9
(0
.3, 2
.2)
31
.5
(29
.8, 3
4.1
) -2
6.2
(-
52
2.1
, 7
88
.5)
-0.0
04
(-
0.0
38
, 0
.02
4)
Ho
enig
(1
98
3),
ii
0.0
40
(0
.02
5, 0
.06
2)
0.9
(0
.3, 2
.0)
31
.5
(29
.7, 3
4.1
) -2
9.5
(-
84
3.5
, 5
82
.0)
-0.0
03
(-
0.0
36
, 0
.02
2)
Ho
enig
(1
98
3),
iii
0
.03
9
(0.0
19
, 0
.05
2)
0.7
(0
.2, 1
.6)
31
.2
(29
.5, 3
3.6
) -3
4.3
(-
50
6.3
, 5
27
.3)
-0.0
13
(-
0.0
46
, 0
.01
5)
Jen
sen
(1
99
6),
i
0.1
21
(0
.11
8, 0
.12
4)
3.2
(1
.3, 5
.8)
32
.6
(30
.6, 3
5.3
) 1
9.3
(1
2.3
, 6
6.8
) 0
.03
6
(0.0
09
, 0
.05
6)
Jen
sen
(1
99
6),
ii
0.1
22
(0
.06
0, 0
.21
3)
3.0
(1
.0, 7
.0)
32
.6
(30
.7, 3
5.5
) 1
9.5
(9
.9, 9
0.7
) 0
.03
5
(0.0
01
, 0
.06
1)
Jen
sen
(1
99
6),
iii
0
.11
3
(0.0
54
, 0
.19
6)
2.7
(1
.0, 6
.7)
32
.5
(30
.5, 3
5.4
) 2
1.3
(-
56
.2,
18
3.9
) 0
.03
1
(-0
.00
1,
0.0
60
)
Pet
erse
n &
Wro
ble
wsk
i (1
98
4)
0.0
76
(0
.06
6, 0
.08
5)
2.0
(0
.9, 3
.8)
32
.9
(30
.9, 3
5.9
) 3
0.4
(-
11
9.9
, 2
81
.6)
0.0
22
(-
0.0
03
, 0
.04
2)
Ch
en &
Wata
nab
e (1
98
9)
0.0
32
(0
.02
0, 0
.04
7)
0.8
(0
.3, 1
.7)
32
.7
(30
.5, 3
5.8
) -3
8.1
(-
64
0.6
, 8
84
.1)
-0.0
07
(-
0.0
35
, 0
.01
6)
Sto
chast
ic M
0.0
44
(0
.02
8, 0
.06
3)
1.0
(0
.4, 2
.2)
31
.8
(30
.1, 3
4.5
) 2
7.6
(-
65
2.1
, 6
76
.3)
0.0
01
(-
0.0
30
, 0
.02
5)
Ta
ble
xv
iii.
R
esu
lts o
f d
em
og
rap
hic
an
aly
sis
of
the
We
ste
rn A
ustr
alia
n C
arc
ha
rhin
us o
bscu
rus p
op
ula
tio
n u
nd
er
the
ra
tes o
f a
ge
sp
ecific
fis
hin
g
mo
rta
lity e
stim
ate
d in
th
e c
urr
en
t stu
dy f
or
the
19
94
co
ho
rt, b
ase
d o
n a
re
pro
du
ctive
pe
rio
dic
ity o
f 4
ye
ars
.
PM
R
0G
t x2
r
MM
ean
95
% C
I M
ean
95
% C
I M
ean
95
% C
I M
ean
9
5%
CI
Mea
n9
5%
CI
Pau
ly (
19
80
) 0
.03
6
(0.0
14
, 0
.08
4)
0.6
(0
.2, 1
.7)
31
.3
(29
.7, 3
3.7
) -2
8.2
(-
40
2.2
, 3
93
.3)
-0.0
16
(-
0.0
52
, 0
.01
6)
Ho
enig
(1
98
3),
i
0.0
08
(0
.02
5, 0
.06
5)
0.7
(0
.2, 1
.7)
31
.5
(29
.6, 3
4.2
) -3
0.0
(-
49
1.1
, 6
22
.1)
-0.0
12
(-
0.0
45
, 0
.01
7)
Ho
enig
(1
98
3),
ii
0.0
40
(0
.02
5, 0
.06
2)
0.7
(0
.2, 1
.6)
31
.5
(29
.7, 3
4.0
) -3
6.1
(-
51
3.7
, 5
26
.7)
-0.0
12
(-
0.0
46
, 0
.01
5)
Ho
enig
(1
98
3),
iii
0
.03
9
(0.0
19
, 0
.05
3)
0.5
(0
.2, 1
.3)
31
.2
(29
.5, 3
3.8
) -2
8.1
(-
37
0.6
, 2
12
.5)
-0.0
22
(-
0.0
56
, 0
.00
8)
Jen
sen
(1
99
6),
i
0.1
21
(0
.11
8, 0
.12
4)
2.3
(0
.9, 4
.4)
32
.7
(30
.7, 3
5.5
) 2
6.5
(-
29
.7,
13
8.5
) 0
.02
5
(-0
.00
2,
0.0
45
)
Jen
sen
(1
99
6),
ii
0.1
23
(0
.06
3, 0
.21
3)
2.3
(0
.8, 5
.2)
32
.8
(30
.7, 3
5.6
) 2
5.2
(-
14
1.3
, 1
91
.0)
0.0
26
(-
0.0
05
, 0
.05
1)
Jen
sen
(1
99
6),
iii
0
.10
9
(0.0
51
, 0
.19
6)
2.0
(0
.7, 4
.8)
32
.5
(30
.7, 3
5.3
) 2
8.0
(-
18
7.4
, 2
93
.2)
0.0
22
(-
0.0
09
, 0
.04
9)
Pet
erse
n &
Wro
ble
wsk
i (1
98
4)
0.0
76
(0
.06
6, 0
.08
5)
1.5
(0
.6, 3
.0)
32
.8
(30
.9, 3
5.8
) 4
3.0
(-
52
7.5
, 5
16
.1)
0.0
11
(-
0.0
15
, 0
.03
3)
Ch
en &
Wata
nab
e (1
98
9)
0.0
32
(0
.02
0, 0
.04
8)
0.6
(0
.2, 1
.2)
32
.7
(30
.7, 3
5.6
) -3
7.0
(-
39
6.6
, 5
39
.8)
-0.0
15
(-
0.0
47
, 0
.00
6)
Sto
chast
ic M
0.0
44
(0
.02
8, 0
.06
5)
0.8
(0
.3, 1
.6)
31
.8
(30
.0, 3
4.6
) -4
0.0
(-
71
5.2
, 9
17
.2)
-0.0
08
(-
0.0
38
, 0
.01
4)
Appendix III cont.

118 Fisheries Research Report [Western Australia] No. 151, 2005
Ta
ble
xix
. R
esu
lts o
f d
em
og
rap
hic
an
aly
sis
of
the
We
ste
rn A
ustr
alia
n C
arc
ha
rhin
us o
bscu
rus p
op
ula
tio
n u
nd
er
the
ra
tes o
f a
ge
sp
ecific
fis
hin
g
mo
rta
lity e
stim
ate
d in
th
e c
urr
en
t stu
dy f
or
the
19
94
co
ho
rt, b
ase
d o
n a
re
pro
du
ctive
pe
rio
dic
ity o
f 2
-4 y
ea
rs.
PM
R
0G
t x2
r
MM
ean
95
% C
I M
ean
95
% C
I M
ean
95
% C
I M
ean
9
5%
CI
Mea
n9
5%
CI
Pau
ly (
19
80
) 0
.03
7
(0.0
14
, 0
.08
0)
0.9
(0
.3, 2
.5)
31
.4
(29
.8, 3
3.6
) -2
3.0
(-
56
1.5
, 4
86
.1)
-0.0
04
(-
0.0
43
, 0
.02
9)
Ho
enig
(1
98
3),
i
0.0
08
(0
.02
4, 0
.06
7)
0.9
(0
.3, 2
.5)
31
.5
(29
.6, 3
4.0
) -2
3.7
(-
65
7.0
, 4
15
.5)
-0.0
03
(-
0.0
35
, 0
.02
9)
Ho
enig
(1
98
3),
ii
0.0
40
(0
.02
5, 0
.06
4)
1.0
(0
.3, 2
.6)
31
.5
(29
.7, 3
4.1
) -1
6.6
(-
46
3.9
, 7
06
.3)
-0.0
01
(-
0.0
40
, 0
.03
0)
Ho
enig
(1
98
3),
iii
0
.04
0
(0.0
18
, 0
.05
2)
0.7
(0
.3, 2
.1)
31
.2
(29
.5, 3
3.6
) -2
8.3
(-
45
9.8
, 3
65
.2)
-0.0
11
(-
0.0
45
, 0
.02
3)
Jen
sen
(1
99
6),
i
0.1
21
(0
.11
8, 0
.12
4)
3.1
(1
.2, 7
.4)
32
.7
(30
.7, 3
5.5
) 1
9.7
(1
0.7
, 7
4.7
) 0
.03
5
(0.0
07
, 0
.06
3)
Jen
sen
(1
99
6),
ii
0.1
24
(0
.06
1, 0
.21
8)
3.2
(1
.0, 1
0.1
) 3
2.7
(3
0.7
, 3
5.5
) 1
8.7
(-
41
.0,
11
0.2
) 0
.03
6
(-0
.00
1,
0.0
72
)
Jen
sen
(1
99
6),
iii
0
.10
8
(0.0
51
, 0
.19
6)
2.7
(0
.9, 7
.9)
32
.6
(30
.6, 3
5.3
) 2
1.2
(-
91
.3,
14
3.2
) 0
.03
1
(-0
.00
4,
0.0
65
)
Pet
erse
n &
Wro
ble
wsk
i (1
98
4)
0.0
76
(0
.06
6, 0
.08
5)
2.0
(0
.7, 4
.8)
32
.9
(30
.9, 3
5.9
) 2
8.3
(-
22
6.5
, 3
92
.5)
0.0
21
(-
0.0
11
, 0
.04
8)
Ch
en &
Wata
nab
e (1
98
9)
0.0
32
(0
.02
0, 0
.04
7)
0.8
(0
.3, 2
.2)
32
.7
(30
.6, 3
5.8
) -3
2.8
(-
66
7.4
, 5
94
.8)
-0.0
06
(-
0.0
38
, 0
.02
4)
Sto
chast
ic M
0.0
45
(0
.02
8, 0
.06
3)
1.1
(0
.4, 2
.7)
31
.9
(30
.0, 3
4.6
) 2
7.4
(-
50
0.2
, 7
77
.3)
0.0
02
(-
0.0
30
, 0
.03
1)
Ta
ble
xx
. R
esu
lts o
f d
em
og
rap
hic
an
aly
sis
of
the
We
ste
rn A
ustr
alia
n C
arc
ha
rhin
us o
bscu
rus p
op
ula
tio
n u
nd
er
the
ra
tes o
f a
ge
sp
ecific
fis
hin
g
mo
rta
lity e
stim
ate
d in
th
e c
urr
en
t stu
dy f
or
the
19
94
co
ho
rt, b
ase
d o
n a
re
pro
du
ctive
pe
rio
dic
ity o
f 2
-3 y
ea
rs.
PM
R
0G
t x2
r
MM
ean
95
% C
I M
ean
95
% C
I M
ean
95
% C
I M
ean
9
5%
CI
Mea
n9
5%
CI
Pau
ly (
19
80
) 0
.03
8
(0.0
14
, 0
.08
9)
1.0
(0
.3, 3
.0)
31
.4
(29
.8, 3
3.6
) 1
7.1
(-
95
3.8
, 7
98
.5)
0.0
00
(-
0.0
36
, 0
.03
5)
Ho
enig
(1
98
3),
i
0.0
09
(0
.02
6, 0
.06
8)
1.1
(0
.4, 2
.9)
31
.5
(29
.6, 3
4.3
) 2
6.2
(-
68
7.7
, 7
50
.2)
0.0
04
(-
0.0
32
, 0
.03
4)
Ho
enig
(1
98
3),
ii
0.0
40
(0
.02
5, 0
.06
4)
1.1
(0
.4, 2
.7)
31
.4
(29
.7, 3
4.0
) 2
7.1
(-
57
6.2
, 7
92
.8)
0.0
03
(-
0.0
28
, 0
.03
1)
Ho
enig
(1
98
3),
iii
0
.03
9
(0.0
19
, 0
.05
3)
0.8
(0
.3, 2
.2)
31
.2
(29
.5, 3
3.7
) -2
8.2
(-
72
3.6
, 6
94
.5)
-0.0
06
(-
0.0
43
, 0
.02
5)
Jen
sen
(1
99
6),
i
0.1
21
(0
.11
8, 0
.12
4)
3.7
(1
.4, 7
.9)
32
.6
(30
.7, 3
5.4
) 1
6.9
(1
0.6
, 6
0.7
) 0
.04
1
(0.0
10
, 0
.06
4)
Jen
sen
(1
99
6),
ii
0.1
23
(0
.06
0, 0
.21
4)
3.7
(1
.3, 9
.6)
32
.6
(30
.7, 3
5.5
) 1
6.8
(9
.5, 7
4.1
) 0
.04
1
(0.0
08
, 0
.07
0)
Jen
sen
(1
99
6),
iii
0
.11
1
(0.0
52
, 0
.19
8)
3.4
(1
.0, 9
.0)
32
.5
(30
.6, 3
5.6
) 1
7.8
(-
27
.1,
81
.1)
0.0
38
(0
.00
0, 0
.06
8)
Pet
erse
n &
Wro
ble
wsk
i (1
98
4)
0.0
76
(0
.06
6, 0
.08
5)
2.3
(0
.9, 5
.1)
32
.8
(30
.9, 3
5.9
) 2
5.4
(-
11
9.5
, 1
79
.3)
0.0
26
(-
0.0
02
, 0
.05
0)
Ch
en &
Wata
nab
e (1
98
9)
0.0
32
(0
.02
0, 0
.04
7)
1.0
(0
.4, 2
.3)
32
.7
(30
.5, 3
5.8
) -2
1.2
(-
73
1.2
, 7
62
.0)
-0.0
01
(-
0.0
32
, 0
.02
5)
Sto
chast
ic M
0.0
45
(0
.02
9, 0
.06
3)
1.2
(0
.5, 2
.9)
31
.8
(30
.1, 3
4.5
) 3
2.0
(-
54
9.8
, 5
77
.2)
0.0
07
(-
0.0
23
, 0
.03
4)

Fisheries Research Report [Western Australia] No. 151, 2005 119
Ta
ble
xx
i.
Re
su
lts o
f d
em
og
rap
hic
an
aly
sis
of
the
We
ste
rn A
ustr
alia
n C
arc
ha
rhin
us o
bscu
rus p
op
ula
tio
n u
nd
er
the
ra
tes o
f a
ge
sp
ecific
fis
hin
g
mo
rta
lity e
stim
ate
d in
th
e c
urr
en
t stu
dy f
or
the
19
95
co
ho
rt, b
ase
d o
n a
re
pro
du
ctive
pe
rio
dic
ity o
f 2
ye
ars
.
PM
R
0G
t x2
r
MM
ean
95
% C
I M
ean
95
% C
I M
ean
95
% C
I M
ean
9
5%
CI
Mea
n9
5%
CI
Pau
ly (
19
80
) 0
.04
5
(0.0
16
, 0
.10
3)
1.5
(0
.5, 4
.1)
31
.3
(29
.7, 3
3.6
) 3
1.7
(-
39
9.7
, 4
72
.7)
0.0
13
(-
0.0
22
, 0
.04
4)
Ho
enig
(1
98
3),
i
0.0
10
(0
.03
1, 0
.07
7)
1.6
(0
.6, 3
.8)
31
.5
(29
.7, 3
4.0
) 3
2.2
(-
38
2.0
, 3
64
.5)
0.0
15
(-
0.0
17
, 0
.04
2)
Ho
enig
(1
98
3),
ii
0.0
48
(0
.03
0, 0
.07
6)
1.6
(0
.6, 3
.8)
31
.4
(29
.7, 3
4.1
) 3
3.4
(-
42
1.6
, 4
04
.1)
0.0
15
(-
0.0
15
, 0
.04
2)
Ho
enig
(1
98
3),
iii
0
.04
6
(0.0
23
, 0
.06
2)
1.2
(0
.4, 3
.1)
31
.2
(29
.5, 3
3.8
) 3
1.4
(-
44
2.6
, 5
44
.8)
0.0
06
(-
0.0
28
, 0
.03
5)
Jen
sen
(1
99
6),
i
0.1
43
(0
.14
0, 0
.14
7)
5.5
(2
.2, 1
0.4
) 3
2.6
(3
0.7
, 3
5.4
) 1
3.0
(9
.4, 2
7.9
) 0
.05
3
(0.0
25
, 0
.07
4)
Jen
sen
(1
99
6),
ii
0.1
46
(0
.07
3, 0
.25
4)
5.5
(2
.0, 1
1.9
) 3
2.7
(3
0.8
, 3
5.5
) 1
3.0
(8
.9, 3
1.7
) 0
.05
3
(0.0
21
, 0
.07
7)
Jen
sen
(1
99
6),
iii
0
.13
4
(0.0
66
, 0
.22
8)
5.1
(1
.7, 1
1.7
) 3
2.6
(3
0.6
, 3
5.3
) 1
3.5
(9
.0, 3
9.9
) 0
.05
1
(0.0
17
, 0
.07
7)
Pet
erse
n &
Wro
ble
wsk
i (1
98
4)
0.0
92
(0
.07
9, 0
.10
2)
3.6
(1
.5, 6
.8)
32
.8
(30
.9, 3
5.9
) 1
7.3
(1
1.4
, 4
6.5
) 0
.04
0
(0.0
13
, 0
.06
0)
Ch
en &
Wata
nab
e (1
98
9)
0.0
42
(0
.02
6, 0
.05
9)
1.6
(0
.6, 3
.2)
32
.7
(30
.6, 3
5.9
) 3
8.8
(-
27
0.7
, 5
20
.4)
0.0
14
(-
0.0
15
, 0
.03
6)
Sto
chast
ic M
0.0
55
(0
.03
4, 0
.07
8)
1.9
(0
.8, 4
.0)
31
.9
(30
.1, 3
4.5
) 3
1.1
(-
20
6.9
, 2
66
.0)
0.0
20
(-
0.0
08
, 0
.04
3)
Ta
ble
xx
ii.
Re
su
lts o
f d
em
og
rap
hic
an
aly
sis
of
the
We
ste
rn A
ustr
alia
n C
arc
ha
rhin
us o
bscu
rus p
op
ula
tio
n u
nd
er
the
ra
tes o
f a
ge
sp
ecific
fis
hin
g
mo
rta
lity e
stim
ate
d in
th
e c
urr
en
t stu
dy f
or
the
19
95
co
ho
rt, b
ase
d o
n a
re
pro
du
ctive
pe
rio
dic
ity o
f 3
ye
ars
.
PM
R
0G
t x2
r
MM
ean
95
% C
I M
ean
95
% C
I M
ean
95
% C
I M
ean
9
5%
CI
Mea
n9
5%
CI
Pau
ly (
19
80
) 0
.04
6
(0.0
17
, 0
.10
0)
1.0
(0
.3, 2
.8)
31
.3
(29
.7, 3
3.5
) 1
5.4
(-
56
3.4
, 8
47
.2)
0.0
00
(-
0.0
40
, 0
.03
3)
Ho
enig
(1
98
3),
i
0.0
10
(0
.03
1, 0
.07
8)
1.1
(0
.4, 2
.6)
31
.6
(29
.6, 3
4.3
) 3
3.1
(-
65
4.3
, 4
93
.1)
0.0
04
(-
0.0
28
, 0
.03
0)
Ho
enig
(1
98
3),
ii
0.0
48
(0
.03
1, 0
.07
4)
1.1
(0
.4, 2
.6)
31
.5
(29
.7, 3
4.1
) 2
7.6
(-
1,1
62
.1,
67
6.3
) 0
.00
2
(-0
.03
2,
0.0
29
)
Ho
enig
(1
98
3),
iii
0
.04
7
(0.0
21
, 0
.06
5)
0.8
(0
.3, 1
.9)
31
.2
(29
.5, 3
3.7
) -3
0.8
(-
76
1.2
, 6
79
.2)
-0.0
06
(-
0.0
39
, 0
.02
0)
Jen
sen
(1
99
6),
i
0.1
43
(0
.14
0, 0
.14
7)
3.7
(1
.6, 6
.6)
32
.6
(30
.7, 3
5.4
) 1
7.0
(1
1.4
, 4
3.5
) 0
.04
1
(0.0
14
, 0
.06
0)
Jen
sen
(1
99
6),
ii
0.1
48
(0
.07
4, 0
.24
4)
3.7
(1
.3, 8
.5)
32
.7
(30
.7, 3
5.7
) 1
6.9
(1
0.2
, 7
2.5
) 0
.04
0
(0.0
08
, 0
.06
6)
Jen
sen
(1
99
6),
iii
0
.13
1
(0.0
62
, 0
.22
8)
3.1
(1
.2, 7
.8)
32
.6
(30
.6, 3
5.3
) 1
9.2
(1
0.2
, 7
7.2
) 0
.03
6
(0.0
06
, 0
.06
4)
Pet
erse
n &
Wro
ble
wsk
i (1
98
4)
0.0
92
(0
.07
9, 0
.10
2)
2.4
(1
.0, 4
.4)
33
.0
(30
.9, 3
5.9
) 2
4.7
(-
42
.4,
16
2.1
) 0
.02
7
(0.0
00
, 0
.04
6)
Ch
en &
Wata
nab
e (1
98
9)
0.0
42
(0
.02
6, 0
.06
1)
1.0
(0
.4, 2
.3)
32
.8
(30
.6, 3
5.8
) 3
1.1
(-
75
9.1
, 9
09
.5)
0.0
01
(-
0.0
27
, 0
.02
4)
Sto
chast
ic M
0.0
55
(0
.03
4, 0
.07
7)
1.3
(0
.5, 2
.7)
31
.8
(30
.1, 3
4.5
) 4
2.1
(-
61
8.9
, 8
10
.9)
0.0
08
(-
0.0
21
, 0
.03
0)
Appendix III cont.

120 Fisheries Research Report [Western Australia] No. 151, 2005
Ta
ble
xx
iii.
R
esu
lts o
f d
em
og
rap
hic
an
aly
sis
of
the
We
ste
rn A
ustr
alia
n C
arc
ha
rhin
us o
bscu
rus p
op
ula
tio
n u
nd
er
the
ra
tes o
f a
ge
sp
ecific
fis
hin
g
mo
rta
lity e
stim
ate
d in
th
e c
urr
en
t stu
dy f
or
the
19
95
co
ho
rt, b
ase
d o
n a
re
pro
du
ctive
pe
rio
dic
ity o
f 4
ye
ars
.
PM
R
0G
t x2
r
MM
ean
95
% C
I M
ean
95
% C
I M
ean
95
% C
I M
ean
9
5%
CI
Mea
n9
5%
CI
Pau
ly (
19
80
) 0
.04
5
(0.0
16
, 0
.10
3)
0.7
(0
.3, 2
.0)
31
.4
(29
.7, 3
3.5
) -3
1.4
(-
59
2.8
, 7
40
.5)
-0.0
09
(-
0.0
44
, 0
.02
2)
Ho
enig
(1
98
3),
i
0.0
10
(0
.03
1, 0
.07
7)
0.8
(0
.3, 2
.0)
31
.4
(29
.7, 3
4.3
) -3
2.8
(-
63
7.5
, 4
47
.5)
-0.0
08
(-
0.0
40
, 0
.02
2)
Ho
enig
(1
98
3),
ii
0.0
48
(0
.03
2, 0
.07
4)
0.8
(0
.3, 2
.0)
31
.6
(29
.7, 3
4.1
) -3
2.3
(-
70
0.5
, 5
89
.1)
-0.0
07
(-
0.0
37
, 0
.02
1)
Ho
enig
(1
98
3),
iii
0
.04
8
(0.0
23
, 0
.06
3)
0.6
(0
.2, 1
.6)
31
.2
(29
.5, 3
3.7
) -3
1.5
(-
44
6.0
, 3
73
.1)
-0.0
16
(-
0.0
45
, 0
.01
4)
Jen
sen
(1
99
6),
i
0.1
43
(0
.14
0, 0
.14
7)
2.8
(1
.2, 5
.2)
32
.8
(30
.8, 3
5.4
) 2
1.7
(1
3.2
, 8
8.5
) 0
.03
1
(0.0
07
, 0
.05
1)
Jen
sen
(1
99
6),
ii
0.1
48
(0
.07
6, 0
.25
1)
2.8
(1
.0, 6
.6)
32
.6
(30
.7, 3
5.7
) 2
1.1
(-
24
.4,
13
0.5
) 0
.03
2
(-0
.00
1,
0.0
58
)
Jen
sen
(1
99
6),
iii
0
.13
1
(0.0
62
, 0
.24
0)
2.4
(0
.9, 5
.8)
32
.6
(30
.6, 3
5.4
) 2
4.6
(-
97
.4,
18
8.6
) 0
.02
7
(-0
.00
4,
0.0
55
)
Pet
erse
n &
Wro
ble
wsk
i (1
98
4)
0.0
92
(0
.07
9, 0
.10
2)
1.8
(0
.7, 3
.4)
32
.8
(30
.9, 3
5.7
) 3
4.5
(-
30
8.6
, 3
21
.1)
0.0
18
(-
0.0
09
, 0
.03
8)
Ch
en &
Wata
nab
e (1
98
9)
0.0
41
(0
.02
6, 0
.05
9)
0.8
(0
.3, 1
.7)
32
.7
(30
.7, 3
5.7
) -3
9.2
(-
91
6.2
, 7
55
.3)
-0.0
07
(-
0.0
36
, 0
.01
5)
Sto
chast
ic M
0.0
55
(0
.03
6, 0
.07
5)
1.0
(0
.4, 1
.9)
31
.9
(30
.1, 3
4.7
) -2
4.1
(-
86
3.6
, 9
56
.6)
-0.0
01
(-
0.0
30
, 0
.02
0)
Ta
ble
xx
iv.
Re
su
lts o
f d
em
og
rap
hic
an
aly
sis
of
the
We
ste
rn A
ustr
alia
n C
arc
ha
rhin
us o
bscu
rus p
op
ula
tio
n u
nd
er
the
ra
tes o
f a
ge
sp
ecific
fis
hin
g
mo
rta
lity e
stim
ate
d in
th
e c
urr
en
t stu
dy f
or
the
19
95
co
ho
rt, b
ase
d o
n a
re
pro
du
ctive
pe
rio
dic
ity o
f 2
-4 y
ea
rs.
PM
R
0G
t x2
r
MM
ean
95
% C
I M
ean
95
% C
I M
ean
95
% C
I M
ean
9
5%
CI
Mea
n9
5%
CI
Pau
ly (
19
80
) 0
.04
4
(0.0
16
, 0
.10
3)
1.0
(0
.3, 3
.2)
31
.3
(29
.6, 3
3.5
) -1
1.2
(-
46
3.3
, 5
42
.9)
-0.0
01
(-
0.0
42
, 0
.03
7)
Ho
enig
(1
98
3),
i
0.0
10
(0
.02
8, 0
.07
8)
1.1
(0
.4, 3
.2)
31
.5
(29
.6, 3
4.2
) 2
1.9
(-
59
5.2
, 5
71
.1)
0.0
03
(-
0.0
31
, 0
.03
7)
Ho
enig
(1
98
3),
ii
0.0
48
(0
.03
0, 0
.07
6)
1.1
(0
.4, 3
.2)
31
.6
(29
.8, 3
4.1
) 2
6.5
(-
69
0.8
, 6
63
.5)
0.0
04
(-
0.0
31
, 0
.03
7)
Ho
enig
(1
98
3),
iii
0
.04
8
(0.0
23
, 0
.06
5)
0.9
(0
.3, 2
.7)
31
.2
(29
.4, 3
3.8
) -2
3.1
(-
41
5.8
, 4
71
.8)
-0.0
05
(-
0.0
43
, 0
.03
1)
Jen
sen
(1
99
6),
i
0.1
43
(0
.14
0, 0
.14
7)
3.7
(1
.4, 8
.5)
32
.7
(30
.8, 3
5.5
) 1
6.9
(1
0.0
, 6
1.5
) 0
.04
1
(0.0
09
, 0
.06
8)
Jen
sen
(1
99
6),
ii
0.1
47
(0
.07
4, 0
.25
4)
3.9
(1
.2, 1
0.2
) 3
2.7
(3
0.7
, 3
5.5
) 1
6.4
(9
.2, 8
0.9
) 0
.04
2
(0.0
07
, 0
.07
3)
Jen
sen
(1
99
6),
iii
0
.12
8
(0.0
64
, 0
.23
2)
3.3
(1
.1, 9
.6)
32
.6
(30
.6, 3
5.3
) 1
8.2
(8
.8, 1
20
.5)
0.0
37
(0
.00
3, 0
.07
1)
Pet
erse
n &
Wro
ble
wsk
i (1
98
4)
0.0
92
(0
.07
9, 0
.10
2)
2.5
(1
.0, 5
.8)
32
.9
(30
.9, 3
5.9
) 2
3.9
(-
50
.4,
14
1.1
) 0
.02
8
(-0
.00
1,
0.0
54
)
Ch
en &
Wata
nab
e (1
98
9)
0.0
41
(0
.02
7, 0
.05
9)
1.1
(0
.4, 2
.8)
32
.7
(30
.7, 3
5.8
) 2
5.0
(-
60
1.9
, 6
55
.6)
0.0
02
(-
0.0
30
, 0
.03
2)
Sto
chast
ic M
0.0
54
(0
.03
6, 0
.07
7)
1.3
(0
.4, 3
.4)
31
.9
(30
.1, 3
4.7
) 3
0.8
(-
44
4.5
, 5
99
.5)
0.0
08
(-
0.0
27
, 0
.03
8)

Fisheries Research Report [Western Australia] No. 151, 2005 121
Ta
ble
xx
v.
Re
su
lts o
f d
em
og
rap
hic
an
aly
sis
of
the
We
ste
rn A
ustr
alia
n C
arc
ha
rhin
us o
bscu
rus p
op
ula
tio
n u
nd
er
the
ra
tes o
f a
ge
sp
ecific
fis
hin
g
mo
rta
lity e
stim
ate
d in
th
e c
urr
en
t stu
dy f
or
the
19
95
co
ho
rt,
ba
se
d o
n a
re
pro
du
ctive
pe
rio
dic
ity o
f 2
-3 y
ea
rs.
PM
R
0G
t x2
r
MM
ean
95
% C
I M
ean
95
% C
I M
ean
95
% C
I M
ean
9
5%
CI
Mea
n9
5%
CI
Pau
ly (
19
80
) 0
.04
7
(0.0
17
, 0
.10
4)
1.3
(0
.4, 3
.6)
31
.4
(29
.7, 3
3.7
) 2
8.9
(-
51
4.2
, 6
52
.0)
0.0
08
(-
0.0
31
, 0
.04
0)
Ho
enig
(1
98
3),
i
0.0
10
(0
.03
0, 0
.07
7)
1.3
(0
.5, 3
.4)
31
.4
(29
.6, 3
3.9
) 2
9.9
(-
45
0.1
, 4
81
.8)
0.0
09
(-
0.0
24
, 0
.03
9)
Ho
enig
(1
98
3),
ii
0.0
46
(0
.03
2, 0
.07
6)
1.3
(0
.5, 3
.3)
31
.4
(29
.7, 3
4.0
) 3
4.6
(-
82
9.6
, 5
42
.5)
0.0
09
(-
0.0
23
, 0
.03
8)
Ho
enig
(1
98
3),
iii
0
.04
7
(0.0
23
, 0
.06
5)
1.0
(0
.3, 2
.7)
31
.3
(29
.5, 3
3.8
) 2
0.1
(-
79
3.5
, 1
,01
0.8
) 0
.00
0
(-0
.03
6,
0.0
31
)
Jen
sen
(1
99
6),
i
0.1
43
(0
.14
0, 0
.14
7)
4.5
(1
.8, 9
.4)
32
.7
(30
.7, 3
5.5
) 1
4.6
(9
.8, 3
6.4
) 0
.04
7
(0.0
18
, 0
.07
0)
Jen
sen
(1
99
6),
ii
0.1
49
(0
.07
5, 0
.25
4)
4.5
(1
.5, 1
2.3
) 3
2.9
(3
0.7
, 3
5.7
) 1
4.7
(8
.7, 4
8.6
) 0
.04
7
(0.0
14
, 0
.07
7)
Jen
sen
(1
99
6),
iii
0
.13
1
(0.0
62
, 0
.23
1)
3.9
(1
.3, 1
0.1
) 3
2.5
(3
0.5
, 3
5.4
) 1
6.0
(9
.3, 5
5.9
) 0
.04
3
(0.0
07
, 0
.07
2)
Pet
erse
n &
Wro
ble
wsk
i (1
98
4)
0.0
92
(0
.07
9, 0
.10
2)
3.0
(1
.2, 6
.3)
32
.9
(30
.8, 3
6.0
) 2
0.1
(1
1.6
, 9
7.0
) 0
.03
4
(0.0
05
, 0
.05
7)
Ch
en &
Wata
nab
e (1
98
9)
0.0
42
(0
.02
6, 0
.06
0)
1.3
(0
.5, 3
.0)
32
.6
(30
.5, 3
5.8
) 3
6.4
(-
51
9.7
, 5
15
.0)
0.0
08
(-
0.0
24
, 0
.03
4)
Sto
chast
ic M
0.0
55
(0
.03
5, 0
.07
9)
1.5
(0
.6, 3
.6)
31
.9
(30
.1, 3
4.5
) 3
5.2
(-
57
0.7
, 5
15
.5)
0.0
13
(-
0.0
18
, 0
.03
9)

122 Fisheries Research Report [Western Australia] No. 151, 2005
APPENDIX IV
SuiTaBle for PuBlic releaSe
Summary of New maNagemeNT Package for The NorTherN Shark fiSherieS
wa NorTh coaST Shark fiSheryaNd
joiNT auThoriTy NorTherN Shark fiShery
june 2005
wa NorTh coaST Shark fiShery (waNcSf)
An indefinite (minimally 20-year) spatial closure to shark-fishing gear (shark longline and shark dropline) between North West Cape and Broome will come into effect on 1 July 2005. Industry has agreed to this timeframe and will cease fishing at this time in the closed area. The closure will be implemented by amending North Coast Shark Fishing (Professional) Notice 1993 (Notice 602) by removing Schedule 1.
A Ministerial Exemption(i.e.subjecttoMinisterialapproval)will be drafted for the boats that will be fishing between Broome and Koolan Island, with conditions that implement the following
management package (or similar) -
• Area between Broome (not including Roebuck Bay) and Koolan Island to remain open. This area will be split into two zones (one southern and one northern zone) with the line (latitudinal) at Cape Leveque (16o 2�’ S latitude).
• Open area will be set out as: from Broome, westerly along the latitude of 18o S to the intersection of 120o E longitude, then north to the intersection of the AFZ, then east to the intersection of 12�o 45’ E longitude, then south to Koolan Island. See map.
• Fishing season to begin on 1 August 2005, all year round in the northern zone (Cape Leveque to Koolan Island) and between 1 October and �1 January in southern zone (Broome to Cape Leveque).
• Effort controls with maximum of 100 demersal longline days and 200 pelagic gillnet days between Broome and Koolan Island.
• Of the total �00 fishing days, a maximum of 100 fishing days with either gear type will only be permitted to be used in the southern zone (Broome and Cape Leveque) between 1 October and �1 January.
• Closure of King Sound to shark fishing using demersal longlines and pelagic gillnets.
• Implementation of VMS to monitor closed areas and fishing of effort days.
• Introduction of a fillet to fin ratio of 9.1kg of shark : 1 kg of fin and a trunk to fin ratio of 18.2kg of trunk : 1 kg of fin in the northern zone (Cape Leveque to Koolan Island).
• Maintain the existing finning and filleting prohibitions for sharks landed in the southern zone (Broome to Cape Leveque). Sharks will need to be landed in a whole, headed and/or gutted condition with the associated fins.

Fisheries Research Report [Western Australia] No. 151, 2005 12�
• Implementation of 10% at-sea observer coverage provided by Department Research staff. Initially, at sea observer focus will aim to verify shark catches (specifically sandbar sharks) in the southern zone (Broome to Cape Leveque) and will be complemented by 70% observer coverage of southern zone landings.
• A requirement for all catch within the southern zone (Broome to Cape Leveque) to be landed in Broome for observer purposes.
• Maximum length of pelagic gillnets of 2,000 metres with a mesh size of 6.� – 7.� inches (160 – 185 mm mesh) with a maximum drop of 100 meshes.
• Demersal longlines to have no more than 1,000 hooks attached. Use of wire traces will be permitted.
• Allow WANCSF operators to land mackerel with pelagic gillnets provided they hold mackerel quota in the Pilbara zone of the Mackerel Interim Managed Fishery. Need to distinguish grey and Spanish mackerel quota.
• Bycatch arrangements to be developed for those operators not holding mackerel quota.
• WANCSF operators fishing in the northern zone (north of Cape Leveque, 16° 2�’ S latitude) may fish in the JANSF within the same trip, but may not fish in the NT fishery prior to unloading the JANSF/northern zone WANCSF trip catch.
• No hooks to be attached to gillnets or related fishing gear (i.e. hooks only be used on approved longline gear).
• No automated baiting devices to be used on demersal longlines.
• Pelagic gillnets not to be used within � nautical miles of the high water mark.
• Pelagic gillnets and demersal longlines cannot be carried on a fishing boat at the same time.
Appendix IV cont.

124 Fisheries Research Report [Western Australia] No. 151, 2005
waNcSf Shark gear SPaTial cloSure 1 july 2005 WANCSF SHARK GEAR SPATIAL CLOSURE 1 JULY 2005

Fisheries Research Report [Western Australia] No. 151, 2005 125
joiNT auThoriTy NorTherN Shark fiShery (jaNSf)
The package will be as follows-
• Effort controls with maximum of 200 demersal longline days and 400 pelagic gillnet days in the JANSF (i.e. east of Koolan Island).
• Implementation of VMS.
• Introduction of a fillet to fin ratio of 9.1kg flesh : 1 kg of fin and a trunk to fin ratio of 18.2kg of trunk : 1 kg of fin.
• Maximum length of pelagic gillnets of 2,000 metres with a mesh size of 6.� to 7.� inches (160mm-185mm) with a maximum drop of 100 meshes.
• Demersal longlines to have no more than 1000 hooks attached. Wire traces will be permitted.
• JANSF operators may fish in the northern zone of the WANCSF (north of Cape Leveque, 16° 2�’S) within the same trip, but may not fish in the NT fishery prior to unloading the JANSF/northern zone WANCSF trip catch.
• Implementation of an observer program (but initially a lower priority than observer coverage in the southern zone (Broome to Cape Leveque) of the WANCSF.
• Allow JANSF operators to land mackerel with pelagic gillnets provided they hold mackerel quota in the Kimberley zone of the Mackerel Interim Managed Fishery. Need to distinguish grey and Spanish mackerel quota.
• Bycatch arrangements to be developed for those operators not holding mackerel quota.
• No hooks to be attached to gillnets or related fishing gear (i.e. hooks only be used on approved longline gear).
• No automated baiting devices to be used on demersal longlines.
• Pelagic gillnets not to be used within � nautical miles of the high water mark.
• Pelagic gillnets and demersal longlines cannot be carried on a fishing boat at the same time.
Appendix IV cont.

126 Fisheries Research Report [Western Australia] No. 151, 2005
STaTewide Shark maNagemeNT arraNgemeNTS wiTh legiSlaTive imPlicaTioNS for commercial Shark fiShiNg iN NorTherN wa
• The drafting of prohibition orders under section 4� of the Fish Resources Management Act 1994 (FRMA) that would give effect to -
(a) a prohibition on the use of wire traces in all WA commercial fisheries under State jurisdiction, with the exception of the Mackerel Interim Managed Fishery (and in the WANCSF and the JANSF under exemption);
(b) a prohibition on the use of longlines in all commercial fisheries under State jurisdiction, excepting those fisheries where this is provided for by the management plan; and
(c) a prohibition on the use of both hand hauled and power hauled pelagic or demersal gillnets, fishing net drums, Puretic power blocks and any similar device for hauling a fishing net in all commercial fisheries under State jurisdiction, excepting those fisheries where this is provided for by the management plan.
• sharks and rays becoming commercially protected fish, with the following exceptions-
(i) sharks and rays (other than sawfish of the genus Pristis and dusky sharks with an interdorsal fin measurement of over 70 cm) taken under the authority of an authorisation that provides for the use of demersal gillnet, demersal longline or pelagic gillnet;
(ii) sharks and rays (other than sawfish of the genus Pristis and dusky sharks) were taken under the authority of a managed fishery licence in the following managed fisheries-
• the Marine Aquarium Fish Fishery (taken in accordance with the management plan);
• the Kimberley Gillnet and Barramundi Managed Fishery; and
• any other managed fishery where the take of sharks and rays is specifically provided for in the management plan (e.g. Northern Demersal Scalefish Managed Fishery); and
(iii) Persons who possess sharks or rays taken in accordance with an authorisation as provided for under Commonwealth law;
• Shark fishers (only) permitted to possess dusky sharks with an interdorsal fin measurement of 70cm or less (1.5 metres fork length) and to be landed in a whole, headed and/or gutted condition with the dorsal fins intact.
• Both sharks and rays to be listed as Category 1 fish.
• Significantly increasing the penalties for illegal possession of sharks and rays, including increases to the prescribed value for sharks and rays as follows-
(i) Fins-value per kg = $120value per fin = $24
(ii) Whole shark or trunk (or part other than fins)- value per kg = $8 value per fish = $120.

Fisheries Research Report [Western Australia] No. 151, 2005 127
APPENDIX V
genetic Population Structure of western australian sandbar shark (Carcharhinus plumbeus) based on nuclear dNa
microsatellite loci.
Technical Report
To
WA Marine Research Laboratory PO Box 20, North Beach
WA 6920 Australia
By Edward J. Heist
Fisheries and Illinois Aquaculture Center Southern Illinois University, Carbondale, IL 62901-6511
USA
Sep 5, 2005
introduction
Molecular markers including nuclear DNA microsatellite loci have been widely applied to study genetic stock structure of fishes, including sharks (Heist 2004). When a species is divided into multiple reproductively isolated demes, genetic drift within demes results in allele frequency differences among demes. Various estimators of Wright’s (1969) FST can be used to quantify the variance in allele frequencies among populations and a wide variety of statistical tests can be employed to test the null hypothesis that FST = 0 (i.e. allele frequencies are identical across the sampled region). Fishes that exhibit allele frequency differences across their range are likely composed of distinct fishery stocks that may best be managed as multiple independent units provided the spatial (and perhaps temporal) boundaries of stocks can be identified. In coastal sharks that utilize inshore nursery areas, the best management may be the protection of nursery areas owing to the critical role these habitats play in recruitment (Hueter et al. 2004).
While freshwater fish populations tend to be highly structured because of barriers to movement, marine fishes exhibit far less genetic structure (Ward 2000) and may require large sample sizes and multiple marker types to adequately resolve stock structure. Several studies of shark population structure reveal little or no stocks structure across considerable geographic scales. Heist et al. (1995) found no significant differences in allozymes or mtDNA haplotype frequencies in sandbar sharks from the Gulf of Mexico and the Atlantic
Appendix V cont.

128 Fisheries Research Report [Western Australia] No. 151, 2005
coast of the USA. Heist and Gold (1999) found no differences in microsatellite allele frequencies across in the same regions. Feldheim et al. (2001) found small but statistically significant FST values in lemon sharks (Negaprion brevirostris) from Florida, the Bahamas, and Brazil, but concluded that the magnitude of FST was so small that it was probably not “biologically significant”. Keeney et al. (2005) found small but significant FST values for microsatellite loci between the US Atlantic, Gulf of Mexico, and Caribbean (Belize) and much larger FST values for mtDNA haplotypes across a similar range. Conversely, Gardner and Ward (1998) found significant heterogeneity in allele frequencies in gummy sharks (Mustelus antarcticus) from southern Australia.
The purpose of this study is to employ DNA microsatellite markers to determine whether sandbar sharks collected from three regions of western Australia possess different allele frequencies and hence comprise multiple fishery stocks. Microsatellite markers are highly polymorphic regions of nuclear DNA that are scored using the polymerase chain reaction (PCR) and polyacrylamide gel electrophoresis (O’Connell & Wright 1997). Microsatellites are comprised of very short repetitive elements that are non-coding and thus alleles, which differ by size due to variable numbers of copies of the repeat motif, are presumed to be selectively equivalent meaning that allele frequency differences reflect a lack of interbreeding among populations and not the effects of adaptation to local conditions. Sandbar sharks from the western North Atlantic exhibit low levels of allozyme and mtDNA variation (Heist et al. 1995) and thus microsatellites, which are typically very polymorphic, are likely to be efficient markers for investigating genetic stock structure of sandbar sharks in Australia.
maTerialS aNd meThodS
Fin clips of sandbar sharks stored in 95% ethanol were provided by Rory McCauley of the WA Marine Research Laboratory. Samples were collected from three regions: Cape Leeuwin (“Southwest”, n=�4), Abrolhos (“Midwest”, n=�2), and Port Hedlan (“North Coast”, n=�6). Genomic DNA was isolated from fin clips using the QIAGEN DNeasy tissue kit (Quiagen Inc.) and stored at –20°C. In each individual four microsatellite loci were amplified using primers described in Keeney and Heist (200�). PCR reactions contained approximately 1-10 ng genomic DNA, 0.1 units Taq DNA polymerase, 0.5 µM each primer, 200 µM each dNTP, 2 mM MgCl2, and 1X Taq buffer (50 mM KCl, 10 mM Tris, 0.1% Triton X-100, pH 9.0). One primer was radiolabeled with γ�2P using T4 polynucleotide kinase prior to amplification. Amplification consisted of a two-minute denaturation step at 94°C, �5 cycles of 94°C for �0 s, 56-60°C for �0 s, and 72°C for �0 s, followed by a single five-minute extension step at 72°C. Alleles at individual loci were separated on denaturing polyacrylamide gels and visualized via autoradiography using a cloned C. limbatus allele of known length as a size standard.
Data were analyzed using the Genepop �.� software package (Raymond & Rousset 1995) and the Genetic Data Analysis (GDA) program of Lewis and Zaykin (2001). Each combination of locus and sample was tested for deviations from Hardy-Weinberg expectations using Genepop. This provides a useful check on the presence of artifacts (e.g. null alleles) that can lead to spurious conclusions. Samples were tested for significant genic (allelic) differentiation at each locus and across all loci using Genepop. Estimates of Weir and Cockerham’s θ (1984), an unbiased estimator of Wright’s (1969) FST were computed using Genepop. Summary statistics (numbers of alleles, expected and observed heterozygosity) were calculated using GDA

Fisheries Research Report [Western Australia] No. 151, 2005 129
reSulTS aNd diScuSSioN
All four microsatellite loci were highly polymorphic in western Australian sandbar shark producing between 9 and 17 alleles and observed heterozygosity ranging from 4� to 97% (Table 1). Two of twelve tests for deviations from Hardy Weinberg equilibrium, both involving locus Cli-106, were nominally significant for deviations from Hardy-Weinberg equilibrium but neither would be considered significant following Bonferroni correction for multiple testing (Rice 1989).
Estimates of FST across all loci were nonsignificant for comparisons between NC and MW and for comparisons between NC and SW (Table 2). Two of twelve single locus estimates of FST were nominally significant, one of which (locus Cli-12 between MW and SW) remained significant after correction for multiple testing (Table 2). The comparison between NC and SW across all loci was not significant (p = 0.054) but the comparison between MW and SW was significant (p = 0.018) largely due to the effects of locus Cli-12. Unbiased estimates of FST are small (and some even negative) for two loci (Cli-10� and Cli-106) while estimates for the other loci and for all loci combined tend to be positive (Table �).
The results of this study indicate no evidence of stock structure in sandbar shark between NC and MW but perhaps the presence of stock structure between (NC + MW) and SW. While failure to reject the null hypothesis that allele frequencies are identical between NC and MW should not be taken as proof that no stock structure exists between these regions, the allele frequencies are so similar that much larger sample sizes and/or examination of mtDNA (see below) would be needed to detect genetic heterogeneity among these regions, if it exists.
It is difficult to ascertain whether the statistically significant results involving SW are valid given the relatively low sample sizes employed in the study and the fact that two of the four loci detected no significant results. Suggested improvements for future studies include increasing the sample sizes (both in terms of the numbers of individuals and the number of microsatellite loci), examination of mtDNA diversity, and nursery ground characterization and sampling. Larger numbers of individuals will permit more refined estimates of FST among regions and will allow smaller but statistically significant values of FST to be detected. Additional loci would refine the estimate of FST across loci and would allow for the detection of individual loci that gave outlying, and hence suspect, results. Recent studies (Pardini et al. 2001, Keeney et al. 2005) indicate that maternally-inherited mtDNA can indicate much higher levels of stock structure in sharks than nuclear markers such as microsatellites. The discrepancy is presumably due to a tendency for female sharks to be philopatric for parturition location, thus allowing mtDNA haplotype frequencies to drift among regions in the presence of higher levels of male-mediated gene flow in nuclear markers. Furthermore, sampling neonates in nursery areas may be useful to detect the presence of stocks that segregate for reproduction even when these stocks overlap at other time of the year (Keeney et al. 2005).
liTeraTure ciTed
Feldheim, K.A., S.H. Gruber & M.V. Ashley. 2001. Population genetic structure of the lemon shark (Negaprion brevirostris) in the western Atlantic: DNA microsatellite variation. Molecular Ecology 10: 295-�0�.
Gardner, M.G. & R.D. Ward. 1998. Population structure of the Australian gummy shark (Mustelus antarcticus Gunther) inferred from allozymes, mitochondrial DNA and vertebrae counts. Marine and Freshwater Research 49: 7��-745.
Appendix V cont.

1�0 Fisheries Research Report [Western Australia] No. 151, 2005
Heist, E.J. 2004. Genetics of Sharks, Skates, and Rays. In: J.C. Carrier, J.A. Musick & M.R. Heithaus (ed.) Biology of Sharks, Skates, and Rays, CRC Press, Boca Raton, FL. Heist, E.J. & J.R. Gold. 1999. Microsatellite DNA variation in sandbar sharks (Carcharhinus plumbeus) from the Gulf of Mexico and mid-Atlantic Bight. Copeia 5: 182-186.
Heist, E.J., J.E. Graves & J.A. Musick. 1995. Population genetics of the sandbar shark (Carcharhinus plumbeus) in the Gulf of Mexico and Mid-Atlantic Bight. Copeia 18: 555-562.
Hueter, R.E., M.R. Heupel, E.J. Heist & D.B. Keeney. 2004. The implications of philopatry in sharks for the management of shark fisheries. Journal of Northwest Atlantic Fishery Science in press.
Keeney, D.B. & E.J. Heist. 200�. Characterization of microsatellite loci isolated from the blacktip shark and their utility in requiem and hammerhead sharks. Molecular Ecology Notes �: 501-504.
Keeney, D.B., M.R. Heupel, R.E. Hueter & E.J. Heist. 2005. The genetic structure of blacktip shark (Carcharhinus limbatus) nurseries in the western Atlantic, Gulf of Mexico, and Caribbean Sea inferred from control region sequences and microsatellites. Molecular Ecology 14: 1911-192�.
Lewis, P.O. & D. Zaykin. 2001. Genetic Data Analysis: Computer program for the analysis of allelic data. Version 1.0 (d16c). Free program distributed by the authors over the internet from http://lewis.eeb.uconn.edu/lewishome/software.html.
O’Connell, M. & J.M. Wright. 1997. Microsatellite DNA in fishes. Reviews in Fish Biology & Fisheries 7: ��1-�6�.
Pardini, A.T., C.S. Jones, L.R. Noble, B. Kreiser, H. Malcolm, B.D. Bruce, J.D. Stevens, G. Cliff, M.C. Scholl, M. Francis, C.A.J. Duffy & A.P. Martin. 2001. Sex-biased dispersal of great white sharks - In some respects, these sharks behave more like whales and dolphins than other fish. Nature 412: 1�9-140.
Raymond, M. & F. Rousset. 1995. GENEPOP (version 1.2): population genetics software for exact tests and ecumenicism. Journal of Heredity 86: 248-249.
Rice, W.R. 1989. Analyzing tables of statistical tests. Evolution 4�: 22�-225.
Ward, R.D. 2000. Genetics in fisheries management. Hydrobiologia 420: 191-201.
Weir, B.S. & C.C. Cockerham. 1984. Estimating F-statistics for the analysis of population structure. Evolution �8: 1�58-1�70.
Wright, S. 1969. Evolution and the Genetics of Populations. Volume 2, The Theory of Gene Frequencies. University of Chicago Press, Chicago. 511 pp.

Fisheries Research Report [Western Australia] No. 151, 2005 1�1
Table 1. Numberofindividualssurveyed(n),numberofalleles(A),expectedheterozygosity (He),observedheterozygosity(Ho),andp-values(p)fortestsofdeviationsfrom Hardy-WeinbergequilibriumforfourmicrosatellitelociinwesternAustralia sandbarsharks.Deviationsnominallysignificantatthep<0.05levelareinbold.
Locus Population n A He Ho p
Cli-12 NC 36 8 0.719092 0.694444 0.368Cli-12 MW 32 9 0.512897 0.437500 0.528Cli-12 SW 33 10 0.852214 0.878788 0.735Cli-103 NC 33 16 0.917016 0.878788 0.259Cli-103 MW 29 13 0.883243 0.965517 0.140Cli-103 SW 28 15 0.892857 0.892857 0.149Cli-106 NC 35 8 0.812836 0.742857 0.343Cli-106 MW 32 8 0.815972 0.687500 0.012Cli-106 SW 33 9 0.851748 0.727273 0.012Cli-108 NC 35 10 0.536232 0.428571 0.155Cli-108 MW 32 10 0.729663 0.687500 0.100Cli-108 SW 32 10 0.758929 0.625000 0.071
Table 2. Significancevalues(andstandarddeviations)fortestsofgenicdifferentiationamong sampledlocations.Comparisonsnominallysignificantatthep<0.05levelarein bold.
Locus NC and MW NC and SW MW and SW
Cli-12 0.2�4 (0.008) 0.190 (0.007) 0.001 (<0.001) Cli-10� 0.861 (0.006) 0.702 (0.010) 0.6�8 (0.009) Cli-106 0.�88 (0.008) 0.�80 (0.010) 0.241 (0.007) Cli-108 0.141 (0.008) 0.009 (0.002) 0.7�9 (0.008) Combined 0.�41 0.054 0.018
Table 3. Weir and Cockerham’s (1984) unbiased estimators of FST among sampled locations. Negative values are not significantly different fro zero. See Table 2 for tests
ofsignificance.
Locus NC and MW NC and SW MW and SW
Cli-12 0.022 0.018 0.098 Cli-10� -0.005 -0.006 -0.006 Cli-106 -0.005 -0.001 0.004 Cli-108 0.021 0.0�5 -0.011 Combined 0.007 0.010 0.021
Appendix V cont.

1�2 Fisheries Research Report [Western Australia] No. 151, 2005
appendix 1. Allele frequencies by locus and sample location.
Cli -12
allele Nc mw Sw
211 0.00 0.00 � .0� 21� 4.17 1.56 12.12 215 8.�� �.1� 7 .58 217 8.�� 1.56 6 .06 219 4.17 �.1� 4 .55 221 0.00 0.00 4 .55 22� 9.72 12.50 15.15 225 50.00 68.75 �0.�0 227 11.11 6.25 12.12 229 4.17 1.56 4 .55 2�5 0.00 1.56 0.00
cli-103 Nc mw Sw
108 0.00 0.00 1 .79 112 �.0� 1.72 1 .79 116 9.09 8.62 7 .14 118 12.12 10.�4 14.29 120 6.06 10.�4 � .57 122 �.0� 0.00 � .57 124 7.58 �.45 1 .79 126 18.18 25.86 21.4� 128 1�.64 12.07 16.07 1�0 4.55 5.17 1 .79 1�2 4.55 12.07 12.50 1�4 �.0� 0.00 5 .�6 1�6 6.06 �.45 0 .00 1�8 �.0� 1.72 1 .79 140 1.52 �.45 1 .79 142 �.0� 1.72 5 .�6 144 1.52 0.00 0.00
cli-106 Nc mw Sw
174 1.4� 4.69 � .0� 176 12.86 17.19 18.18 178 0.00 0.00 � .0� 180 22.86 20.�1 9 .09 182 �0.00 �2.81 25 7.6 184 7.14 4.69 9 .09 186 17.14 6.25 18.18 188 7.14 7.81 9 .09 190 1.4� 6.25 4.55
cli-108 Nc mw Sw
116 0.00 0.00 1 .56 118 0.00 0.00 1 .56 120 0.00 1.56 0 .00 122 67.14 48.44 45.�1 124 11.4� 17.19 12.50 126 0.00 �.1� 4 .69 128 5.71 0.00 0 .00 1�0 2.86 7.81 9 .�8 1�2 1.4� 4.69 4 .69 1�4 4.29 6.25 10.94 1�6 1.4� 4.69 7 .81 140 2.86 �.1� 0 .00 142 1.4� 0.00 0 .00 144 0.00 0.00 1.56 160 1.4� �.1� 0.00