fish passage solutions a perspective from the … · every dam environments is different ... weir...
TRANSCRIPT

Fish Passage Solutions A Perspective from the
Northwestern U.S.
Peter Christensen, P.E.
R2 Resource
Consultants, Inc.

Northwestern United States
Washington
Oregon
British Columbia
Idaho

Existing Dams in Washington & Oregon States
Washington
Oregon
Pacific Ocean

There is No Single ‘Correct’ Fish Passage Solution
Every Dam Environments is Different – Dam Height
– Flow Rate
– Reservoir Size
– Current Patterns
– Operations
Every River Basin is Different – Number of Dams
– Available Habitat
– Fish Species
– Restoration Goals

Best Designs Incorporate Project Features
Unique Project Features Can Provide Both Complications and Opportunities
Fish Behave Differently at Different Projects –
Incorporate Local Behavior into Design

Major Anadromous Species
of the Pacific Northwest
Chinook Salmon
Coho Salmon
Sockeye Salmon
Chum Salmon
Pink Salmon
Steelhead Trout
Pacific Lamprey

Major Resident Freshwater Species
of the Pacific Northwest
Bull Trout
Rainbow Trout
Cutthroat Trout
Mountain Whitefish
Kokanee

Passage Strategies Volitional Passage
Trap & Haul
Upstream Fish Ladder
Downstream Bypass Discharge
Fish Transport Truck

Baker River
Lewis River
Clackamas River
Will Provide Three River-Basin Passage Examples

Clackamas River Hydroelectric Project
Timothy Lake
Faraday Powerhouse
River Mill Dam & Powerhouse North Fork Dam & Powerhouse
Oak Grove Powerhouse
Frog Lake
Harriet Lake
Willamette
River Mainstem Clackamas Tributaries Dam Reservoir
Estacada
Oregon City
Faraday Diversion Dam
North
Fish Hatchery
• Three Mainstem Dams • Four Hydroelectric Stations • 173 MW Total Capacity • Target Passage Species
Chinook Salmon Coho Salmon Steelhead Trout Pacific Lamprey
• Recreational Fishing below North Fork • ESA Protected Watershed above North Fork
Oregon
Clackamas River

Clackamas River Fish Passage Routes
Upstream Passage • Fish Ladder Around River Mill Dam
• Single Fish Ladder Around Faraday Dam and North Fork Dam (2.7 km)
Downstream Passage • 2 Collectors at North Fork Dam with 11 km
Bypass Pipeline to below River Mill
• Collector & Bypass at River Mill Dam
• Other Routes include Spillways, Turbines, and Fish Ladders (small usage)
Fish
Lad
de
r
Fish
Lad
de
r
Byp
ass
Pip
elin
e

River Mill Dam
• First Dam Encountered from Pacific
• Original Construction 1911-1912
• 5 Units with Combined Flow of 141 m3/s
• Approximately 26.5 Meters Head
Upstream Passage on Clackamas River
Lake Estacada

Original 1912 River Mill Fish Ladder
Low Flow Rate (0.17 m3/s) – Steep Slope (1:6) – Aging Concrete (1912-2005)

New River Mill Fish Ladder Completed 2006
Increased Flow Rate (0.57 m3/s) – Reduced Slope (1:10) – 305 Meters Long

Beneficial Use of Existing Features and Operations
Unit 4 Unit 5
Fish Entrance
Fish Entrance below Unit 5 Discharge
• Same Location as Original Entrance
• Reuse of Attraction Flow Piping
• Minimizing Attraction Flow Pumping
• Future Use of Unit 5 as First-On/Last-Off
• Reuse of Entrance Channel
Wing Wall Upstream of Entrance
• Deflects the Unit 5 Draft Tube Discharge away from the Fish Entrance Flow
• Creates a Flow Shear that Attracts Fish
• Increases the Ability for Fish to Find the Attraction Flow
Wing Wall

Ladder Features Screening of Pumped Attraction Flow
Cylindrical T-Screens Three T-Screens being Installed
T-Screens Installed Air-Burst Cleaning Cycle

Ladder Features 8 Adjustable Baffle Weirs to Track Lake Level Changes

Observations of Improvement in Passage:
• Population Increases for All Target Species.
• Whitefish Observed above River Mill Dam.
• Rainbow Trout Passage Greatly Increased.
• Hatchery Chinook above Dam.
• Larger Wild Chinook Individuals.
• Pacific Lamprey Passage Greatly Increased.
River Mill Ladder Passage Results

Faraday/North Fork Fish Ladder (1957) Longest (2.7 km) and Tallest (85 m) Fish Ladder in the World
Faraday Diversion Dam (1907) and Fish Ladder to Above North Fork Dam (1957)
Fish Ladder Entrance Adjacent to the Base of the Dam
Typically all Flow Below the Dam is Discharging from the Fish Ladder (except during High-Flow Spill Events
Ladder Entrance Channel Some Pools almost 100 Meters Long

Faraday/North Fork Fish Ladder Upstream End at North Fork
Ladder Exit in North Fork Reservoir Originally Designed for Reservoir Surface Fluctuations up to 6 Meters
Current Licensed Operations Limited to 1.5 Meters, and Typically Operated within 1 Meter
Ladder Exit is Combined with a Downstream Migrant Collector & Bypass System
Ladder is Operated as Designed in 1957 With Three Changes:
• Increased Attraction Flow from 5.1 m3/s to 7.6 m3/s
• A new Adult Trapping & Sorting Facility added to Separate out the Hatchery fish and Truck them back to the Hatchery
• Modifications made at the Faraday Entrance to Enhance the Successful Entry of Pacific Lamprey

Existing Downstream Passage Improvements Extended Bypass Pipe To North Fork Dam
Fish Ladder at North Fork Prior to Extension
Diversion Box and Pipeline Mounted above Fish Ladder (2011)
• Fish Ladder Served as Downstream Migrant Conduit for Initial 2.4 km
• Then Diverted into 8.6 km Pipeline to River Mill Tailrace
• Downstream Migrants now Diverted Directly into Pipeline from Collector
• Pipeline 11 km to River Mill Tailrace

Old Bypass Discharge (1957)
• Located in the River Mill Tailrace
• Flow Separated & Plunged up to 6 Meters
• New Ladder Required Removal of Pipe
New Hinged Adjustable Discharge (2005)
• Flexible Hose Section in Pipeline
• Final Section Raised & Lowered Automatically
• Discharge Remains 0.5 Meters above Tailwater over 7.6 Meter Range
Existing Downstream Passage Improvements Improvement of North Fork Bypass Discharge
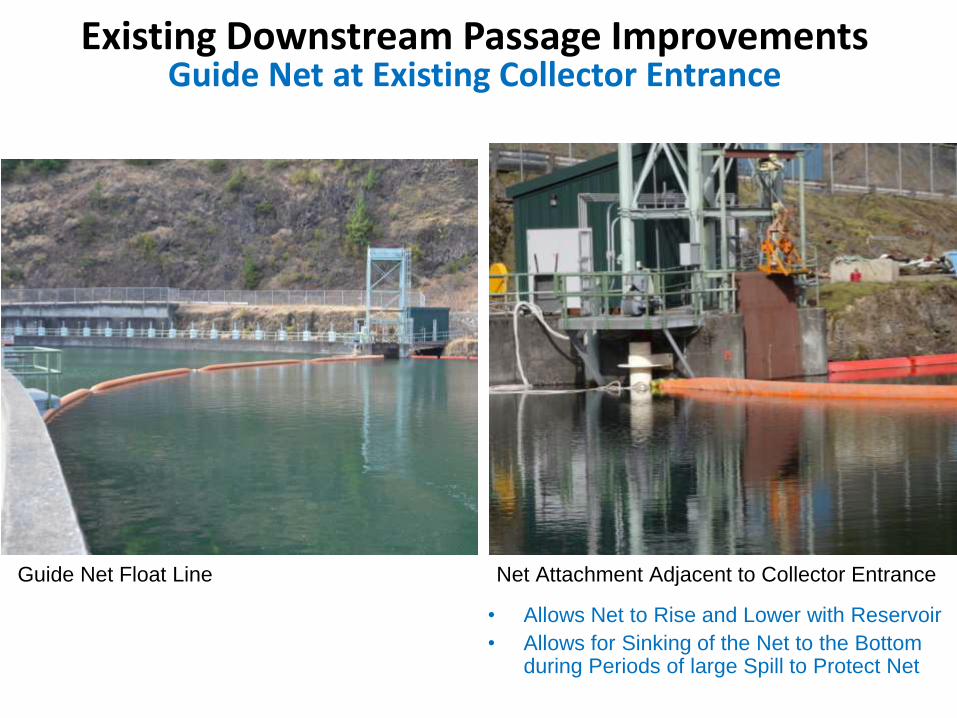
Guide Net Float Line Net Attachment Adjacent to Collector Entrance
• Allows Net to Rise and Lower with Reservoir
• Allows for Sinking of the Net to the Bottom during Periods of large Spill to Protect Net
Existing Downstream Passage Improvements Guide Net at Existing Collector Entrance

North Fork Floating Surface Collector - FSC Aerial View of North Fork Dam (Prior to FSC)
Existing Ladder Exit & Bypass Entrance
Dam 63 M High
Powerhouse 170 m3/s Max. Flow Intakes 38 M Deep
Fish Ladder
Tailrace
Spillway
Bypass Pipe to River Mill Tailrace
Reservoir 1.5 M Fluctuation

North Fork Dam Prior to FSC

North Fork Dam with FSC

Overall Plan View of North Fork FSC Project

Isometric Drawing of FSC Installed

Isometric Drawing of FSC
(with view of below water components)
Guide Net 23 M Deep
Fish Entrance
Submerged Fish Transport Hose

2001 Acoustic Tag Study Results
Red Areas Represent the Highest Concentration of
Detections

Forebay Plan (with Fish Concentration Highlighted)

FSC Entrance Located at Natural Fish Concentration

Plan View of the FSC Upper Deck
28 m3/s
45 Meters
18
Met
ers
0.2-0.3 m3/s
18 Submersible Attraction Flow Pumps (Flygt PP4680)
Fish Screen Channel (28.0 m3/s to 0.2-0.3 m3/s)

Centerline Profile of the FSC Fish Screen Channel

Fish Screen Channel

Transition Channel
Positioned at Downstream End of FSC between the End
of the Screen Channel and the Fish Discharge to the
Transport Hose
Includes Three Half Racks to Remove Debris from the Fish
Flow

FSC Dry Construction and Launching

FSC and Submerged Transport Hose Floats

Design Features of Submerged Transport Hose
Hose Connection in Operating Position
Hose Connection in Raised FSC Position
Hose Sections and Floats
Dam Penetration

Fish Transport Pipe
Transport Pipe Along Dam Face
Transport Flow Control

Fish Transport Pipes Along North Bank
Transport Pipe from North Bank Collector
Transport Pipe from FSC
Tertiary Dewatering Structure (TSS)

Tertiary Screen Structure During Construction Right Bank Collector Flow Operating

Tertiary Screen Structure (detail photos)
Fish Discharge from Transport Pipes Traveling Screens and Trashrack
Debris Trough Discharge

Preliminary Test Results
FSC Completed in September 2015 (ahead of schedule).
Formal Testing of Fish Passage Effectiveness in Spring 2016.
Results are Preliminary (2015) and Initial Formal (2016) Tests.
Release Groups Passage Guidance Rate % Thru FSC
Species # Groups1 # Released # Detected Min Mean Max Mean
Coho2 4 401 379 93% 95% 96% 69%
Steelhead 6 515 492 93% 96% 99% 56%
Chinook3 1 55 48 NA 87% NA 92%
1. Pooled head-of-reservoir and forebay release groups. Guidance rates from two locations were not statistically different.
2. Two groups excluded due to anomalously low guidance performance (53 - 75%). Inclusion in final estimates TBD.
3. Chinook test performed in the fall on 2015, prior to the start of formal biological testing.

Fish-Friendly Spillway Chute
Non-Overflow Dam Section
Project Spillways
Original River Mill Project Layout (2005)

Experimental Test Channel (2007)

Integrated Collector & Bypass (2013)

Collector Entrance
Powerhouse Intake
Forebay Fish Collector Entrance
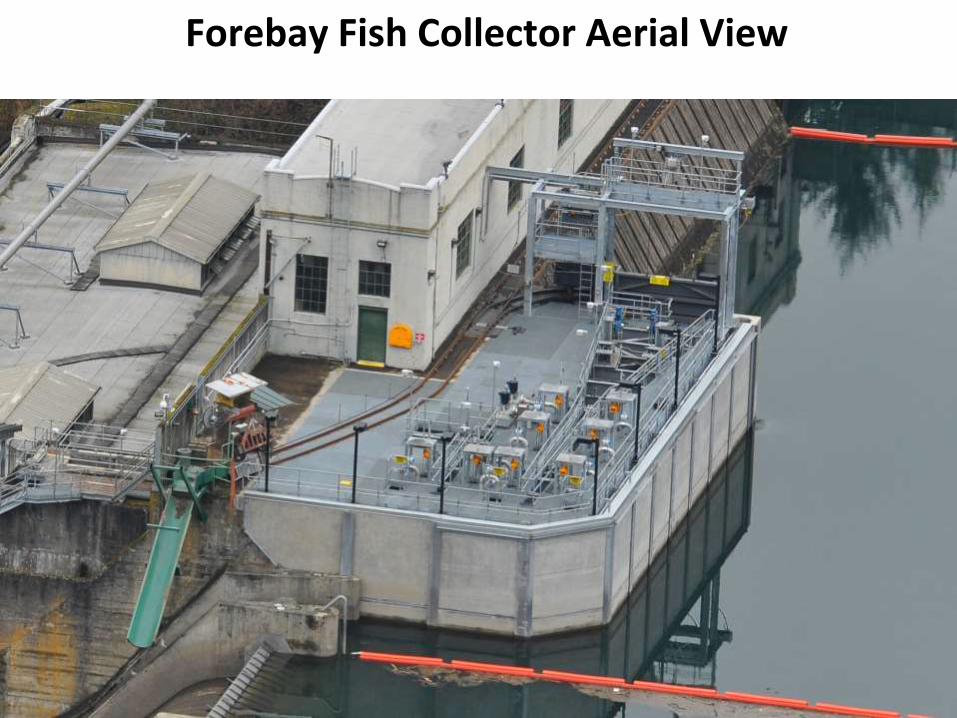
Forebay Fish Collector Aerial View

Screen Channel Profiles

Fish Sampling Station Plan
• Fish flow is dewatered from 0.2 to 0.06 m3/s
• Smaller juvenile fish are separated from larger adult fish.
• Juvenile fish are held for sampling.
• Adult fish pass into adult pool and then directly into the downstream bypass pipe.

Fish Sampling Station on Downstream Side of
Dam

Bypass Pipe across Powerhouse Roof

Biological Monitoring Results
Based on PIT Tag Studies in 2013 and 2014
Collector Fish Guidance Efficiency Chinook Salmon 98%
Coho Salmon 99%
Steelhead 96%
Lake Survival Chinook Salmon 99%
Coho Salmon 96%
Steelhead 96%
Injury Rates were consistently below 2%

Merwin Dam (1931)
Yale Dam (1953)
Swift Dam & No.1 (1958)
Mt. St. Helens
Woodland
16 Kilometers
N
Swift No. 2 (1959)
• Three Dams • Four Hydroelectric Stations • 577 MW Total Capacity • Target Species
Chinook Salmon Coho Salmon Winter Steelhead Trout
• Fish Restoration Project Downstream Migrant Floating Surface Collector
Upstream Migrant Trap & Haul Collector
Lewis River Hydroelectric Project
Washington
Lewis River

Upstream Passage on Lewis River
Merwin Dam (Pre-Project) With New Trap & Haul Facility (2014)
• First Dam Encountered from Pacific • Original Construction 1931 • 3 Turbine Units (Constructed with a 4th Future Turbine Bay) • Originally Trapped and Trucked Fish Upstream but Unsuccessful – Abandoned in 1940’s • New Trap & Haul Facility to Restore Upstream Stocking and Wild Fish Restoration
Attraction Water
Header Pipe
Fish Ladder
Hopper Tower
Fish Conveyance Pipe Presort Pool
Fish Handling–
Truck Loading

Fish Attraction Water Supply
Two Turbine-Driven
Pumps (11.3 m3/s)
One Turbine-Driven
Pump (17.0 m3/s)
Energy Dissipation
Valve (22.65 m3/s)
2.75-M Diameter Header
Pipe to Fish Ladder
Two Installed Turbine-Driven Pumps
• Took Advantage of the 4th Empty Turbine Bay to House the Turbine-Driven Pumps • Quantity of Attraction Flow Tested in 3 Phases
Phase 1: 11.3 m3/s Phase 2: 17.0 m3/s Phase 3: 22.65 m3/s

Fish Ladder and Conveyance System
Merwin Dam
Tailrace
Fish Ladder Entrance
Weir
Weir Weir
& Fish Counter
Fish Hopper &
Elevator
Fish Conveyance
Pipe
To Presort Pond Pool No. 1
Pool No. 2
Pool No. 3
Pool No. 4

Fish Lift Hopper
Hopper Lift Tower
Fabricated Fish Hopper
Hopper at Top of Tower Discharging
to Conveyance Pipe

Fish Conveyance Pipe & Presort Pool
16” diameter pipe 8 cfs flow

Fish Sorting & Handling Facility
Entry Flume from Presort Pool
Fish Sorting & Handling Table

Fish Transfer Tanks & Truck Loading
3,000 gallon tanks (shown) 250 gallon portable tanks (not shown)
Fish Holding Tanks for Transfer to Transport Trucks
Water-to-Water Transfer of Fish to Truck Tank

Downstream Passage on Lewis River Swift Reservoir Floating Surface Collector (FSC) 2012
Swift Reservoir FSC
• Dam Height 156 Meters
• Reservoir Fluctuation up to 30.5 Meters
• FSC Attraction Flow 17.0 m3/s
• Fish Sorted Onboard into 3 Sizes

Varying Reservoir Level
Near Full Pool Elevation
Down Approximately 21 Meters

14 Submersible Attraction Flow Pumps (Flygt PP4680)
Fish Screen Channel Similar to the North Fork FSC
(17.0 m3/s to 0.11 m3/s)
Fish Sorting & Handling Facilities
Fish Lift Hopper
FSC Plan View Layout of Facilities

Fish Sorting & Holding Facilities
Birds eye view of separation and holding level
Fry
Smolt
Adult

Fry and Smolt Separators
Sorting & Handling Details
Fry Switch Gate and Holding Tank Smolt Holding &
Sample Tanks
Smolt Sample Tanks Raised to Sampling
Facilities Above

Fish Transfer Hopper
Being Raised out of FSC Being Lifted to Loading Bay
Transfer of Fish to Truck
Transport Truck in Loading Bay

Restricted Choice of Location
Blue Area shows Low Fish Concentration
Green Area shows Moderate Fish Concentration
Pink Area shows High Fish Concentration
Results of 3-D Radio Tagging Smolt Study
Intake Area during Extreme Low Pool
Location of FSC Mooring Tower

Exclusion Net
Full Exclusion Netting Shore-to-Shore
Surface-to-Bottom
Poor Collection Efficiency in First Few Seasons of Collection

Lead Net
Lead Net Added (2015) Deflects Fish Wandering Forebay toward FSC
Tested in 2016 More than Doubled the Collection Efficiency
Plan View Layout of Lead Net
Installed Lead Net
Dam
FSC
Power Intake & Spillways
Exclusion Net
New Lead Net
Anchors (typ)

Baker River Hydroelectric
Project
• Three Dams
• Two Hydroelectric Stations
• 170 MW Total Capacity
• Target Passage Species
Sockeye Salmon
Coho Salmon
Bull Trout
• Success of New Passage
Projects has Resulted in
Recreational Sockeye
Fishery in Both Reservoirs
Baker River
Washington
Lower Baker Dam (1925)
Upper Baker Dam (1959)
Baker Lake
Lake Shannon
Barrier Dam

Barrier Dam
• First Dam Encountered from Pacific • Constructed with Lower Baker Dam to Trap Fish • Original Fish Trap Entrance on Right • 1925 to 1959 Lifted Fish Above Lower Baker with Gondola Baskets • 1959 to 2010 Trucked Fish Unsorted above Both Dams

Upstream Passage on Baker River
Old Hopper Lift Facility (1959)
New Fish Lock Facility (2010)

Entrances to Fish Lock Trap
Flow Nappe over Barrier Dam
New Fish Lock Facility from Downstream
Main Fish Entrance
Second Fish Entrance
Reuses the Existing Entrance with Increased Flow Fish Jump at Barrier and Get Behind Nappe Second Entrance Attracts Fish Behind Nappe

Visual Species Sort of Fish from Lock
Fish Passed One at a Time from the Lock into a Sorting Flume

Multiple Holding Tanks
Separate Holding Tanks based on Species and Release Destinations

Fish Sampling & Tagging Station
Fish are Sampled & Tagged then Placed into Appropriate Holding Tanks

Transport Truck Loading
Fish Crowded to Loading Tank above for Water-to-Water Truck Loading

Downstream Passage on Baker River
Lower Baker Dam (87 M High) FSC in Distance Upstream
Upper Baker Dam (95 M High) FSC Directly above Dam
Screen Channels Similar to Other FSCs Presented Holding Tanks Onboard the FSCs Fish Sorting Performed Manually Prior to Transport

FSC in Ballasted Operating Position
FSC in Un-Ballasted Maintenance Position
Upper Baker FSC

FSC in Ballasted Operating Position
FSC in Un-Ballasted Maintenance Position
Lower Baker FSC

Fish Sorting & Handling
Fish Holding Tanks at End of Screen Channel
Fish Sorting Station on FSC

Fish Transport
Fish Placed in Transport Tanks on FSC
Tanks Barged to Dam for Lifting up to Trucks

Conclusions
• Consider Local Project Conditions in Design
• Establish Pre-Knowledge of Fish Behavior
• Choose Alternatives to Meet Biological Goals
• Be Prepared to Make Modifications
Peter Christensen, P.E.
Email: [email protected] Phone: +1-425-556-1288
R2 Resource
Consultants, Inc.