fish consumption report - wa
TRANSCRIPT
Fish Consumption Rates
Technical Support Document
A Review of Data and Information about Fish Consumption in Washington
Version 2.0
Final January 2013 Publication No. 12-09-058
Publication and Contact Information
This report is available on the Department of Ecology’s website at www.ecy.wa.gov/biblio/1209058.html For more information contact: Toxics Cleanup Program P.O. Box 47600 Olympia, WA 98504-7600
Phone: 360-407-7170
Washington State Department of Ecology - www.ecy.wa.gov
o Headquarters, Olympia 360-407-6000
o Northwest Regional Office, Bellevue 425-649-7000
o Southwest Regional Office, Olympia 360-407-6300
o Central Regional Office, Yakima 509-575-2490
o Eastern Regional Office, Spokane 509-329-3400 If you need this document in a format for the visually impaired, call the Toxics Cleanup Program at 360-407-7170. Persons with hearing loss can call 711 for Washington Relay Service. Persons with a speech disability can call 877-833-6341. To request information about this report in another language please contact the Department of Ecology Toxics Cleanup Program – Headquarters, Lacey Washington at (360) 407-7170.
Fish Consumption Rates
Technical Support Document
A Review of Data and Information about Fish Consumption in Washington
Version 2.0
Final
Toxics Cleanup Program Washington State Department of Ecology
Olympia, Washington

This page purposely left blank for duplicate printing.
Fish Consumption Rates Page i
Technical Support Document, Version 2.0 FINAL
Table of Contents
Page
List of Tables and Figures.............................................................................................................. iii Tables .......................................................................................................................... iii Figures .......................................................................................................................... vi
Acronyms and Abbreviations ....................................................................................................... vii
Acknowledgments.......................................................................................................................... ix
Preface to Version 2.0 .................................................................................................................... xi
Executive Summary ..................................................................................................................... xiii
Chapter 1 : Introduction and Purpose .............................................................................................1 1.1 Introduction .......................................................................................................................1
1.2 Intended audience .............................................................................................................2 1.3 Purpose of this document ..................................................................................................4
1.4 Document history ..............................................................................................................4 1.5 Organization of this document ..........................................................................................6
Chapter 2 : Washington Fish Resources and Fish-Consuming Populations ...................................7
2.1 Introduction .......................................................................................................................7 2.2 Washington fish resources ................................................................................................7
2.2.1 Washington’s commercial fisheries ...................................................................8 2.2.2 Washington’s recreational fisheries ...................................................................9
2.3 Washington fish-consuming population .........................................................................11 2.3.1 Estimated number of fish consumers in Washington ......................................12
2.3.2 Estimated number of high fish-consuming adults ...........................................14 2.3.3 Assumptions .....................................................................................................16 2.3.4 Estimated number of high fish-consuming children ........................................17
2.4 High fish-consuming populations ...................................................................................18
2.4.1 Washington Native American Tribes ...............................................................18 2.4.2 Asian and Pacific Islanders ..............................................................................19 2.4.3 Subsistence and recreational fishers ................................................................19
2.5 Sources of Fish Consumed..............................................................................................20 2.6 Summary .........................................................................................................................20
Chapter 3 : Methodology for Assessing Fish Consumption Rate Information .............................23
3.1 Introduction .....................................................................................................................23
3.2 Surveys and other approaches used to estimate fish consumption .................................24 3.2.1 Creel surveys ....................................................................................................25 3.2.2 Personal interviews ..........................................................................................27 3.2.3 Diary surveys ...................................................................................................28 3.2.4 Telephone surveys ...........................................................................................28
3.2.5 Recall mail surveys ..........................................................................................29 3.3 Survey selection criteria ..................................................................................................29
Page ii Fish Consumption Rates
FINAL Technical Support Document, Version 2.0
3.4 Evaluating survey vehicles .............................................................................................31
3.4.1 General survey design ......................................................................................31 3.4.2 Survey questions ..............................................................................................32 3.4.3 Population surveyed .........................................................................................33
3.4.4 Description of water body ................................................................................33 3.4.5 Survey results ...................................................................................................33 3.4.6 Factors to consider ...........................................................................................33
3.5 Measures of technical defensibility ................................................................................34 3.6 Custody of fish dietary survey data ................................................................................37
Chapter 4 : Fish Consumption Survey Data that Apply to Washington Fish Consumers ............39 4.1 Introduction .....................................................................................................................39 4.2 General population data ..................................................................................................40
4.2.1 Continuing Survey of Food Intakes by Individuals .........................................40
4.2.2 National Health and Nutrition Examination Survey, 2003 to 2006 .................42 4.3 Pacific Northwest Native American fish consumption data ...........................................46
4.3.1 Columbia River Inter-Tribal Fish Commission survey: the Umatilla,
Nez Perce, Yakama, and Warm Springs Tribes of the Columbia River
Basin ................................................................................................................47 4.3.2 Tulalip and Squaxin Island Tribes of the Puget Sound Region .......................53 4.3.3 Suquamish Tribe ..............................................................................................59
4.4 Asian and Pacific Islanders .............................................................................................64 4.4.1 Reanalysis by EPA Region 10 .........................................................................67
4.5 Recreational fishers .........................................................................................................70 4.6 Additional fish consumption rate information evaluated by Ecology ............................71 4.7 Key Findings ...................................................................................................................74
Chapter 5 : Sources of Uncertainty and Variability ......................................................................79
5.1 Survey methodology .......................................................................................................80 5.1.1 Differences due to survey design, terminology, and definitions .....................81 5.1.2 Types of data and methods of collection .........................................................81
5.1.3 Cooked and uncooked tissue weights ..............................................................82 5.1.4 Variability within a population ........................................................................82
5.1.5 Data analysis and statistical considerations .....................................................82 5.1.6 Target populations and characteristics of populations .....................................84
5.2 Geographic differences ...................................................................................................85 5.2.1 Variation and uncertainty associated with regional differences ......................85 5.2.2 Uncertainty associated with extrapolating survey results to different
population groups and different locations........................................................86 5.2.3 Availability of finfish and shellfish .................................................................87
5.3 Temporal uncertainty and variability ..............................................................................88 5.3.1 Using short-term data to estimate long-term exposure ....................................88
5.3.2 Temporal factors biasing estimates of fish consumption .................................89 5.3.3 Issues using currently suppressed fish consumption data to predict
future fish consumption ...................................................................................90 5.4 Uncertainty in Pacific Northwest fish-consuming populations ......................................91
Fish Consumption Rates Page iii
Technical Support Document, Version 2.0 FINAL
Chapter 6 : Using Scientific Data to Support Regulatory Decisions ............................................93
6.1 Population groups ...........................................................................................................94 6.2 Individual variability in fish consumption rates .............................................................95 6.3 Geographic variability ....................................................................................................97
6.4 Salmon 98 6.5 Sources of finfish/shellfish .............................................................................................99 6.6 Consumer vs. per capita ................................................................................................100 6.7 Other exposure variables...............................................................................................101 6.8 Acceptable risk levels ...................................................................................................103
6.9 Summary .......................................................................................................................103
Appendices .................................................................................................................................. A-1 Appendix A Information on Bioaccumulation, Fish Consumption by Children, and
Species Consumed ....................................................................................................... A-1
Appendix B Additional Fish Consumption Studies ...........................................................B-1 Appendix C The Question of Salmon ................................................................................C-1
Appendix D Glossary ........................................................................................................ D-1 Appendix E References ...................................................................................................... E-1
List of Tables and Figures
Tables
Page
Table 1. Summary of Fish Consumption Data, All Finfish and Shellfish (g/day) ................ xvi
Table 2. Different Metrics Used to Describe Fish Consumption Rates ....................................3
Table 3. Commercial Fish Landings from Washington Non-treaty Fisheries in 2006 .............9
Table 4. Number of Recreational Finfish Caught in Washington Waters in 2006 by
Species and Region ...................................................................................................10
Table 5. Pounds of Shellfish Taken Recreationally From Washington Waters in
2006, by Species and Region ....................................................................................11
Table 6. Estimated Washington Fish Consumers Based on Washington DOH Survey
Data ...........................................................................................................................14
Table 7. Estimated Number of Fish Consumers among the General Washington
Adult Population .......................................................................................................17
Table 8. Estimated Number of Child Fish Consumers among the General Washington
Population .................................................................................................................18
Table 9. Strengths and Weaknesses of Creel Surveys ............................................................26
Table 10. Strengths and Weaknesses of Personal Interviews ...................................................27
Table 11. Strengths and Weaknesses of the Diary Method ......................................................28
Page iv Fish Consumption Rates
FINAL Technical Support Document, Version 2.0
Table 12. Strengths and Weaknesses of Telephone Surveys ....................................................28
Table 13. Strengths and Weaknesses of Recall Mail Surveys ..................................................29
Table 14. Comparison of Five Consumption Survey Methodologies Using EPA’s
Selection Criteria ......................................................................................................30
Table 15. Survey Design Evaluation Criteria ...........................................................................31
Table 16. Measures of Technical Defensibility ........................................................................36
Table 17. General Population: Adult Respondents, Consumers Only, Based on CSFII
1994 to 1996 .............................................................................................................42
Table 18. General Population: Adult Respondents, Consumers Only, Based on
NHANES 2003–2006, Using Standard Statistical Survey Methodology .................43
Table 19. General Population: Adult Respondents, Consumers Only, Based on
NHANES 2003–2006, Using NCI Statistical Survey Methodology ........................44
Table 20. Technical Defensibility of National (General Population) Fish Dietary
Information ...............................................................................................................45
Table 21. CRITFC Adult Fish Consumption Rates by Species Group and Source,
Consumers Only........................................................................................................48
Table 22. Columbia River Inter-Tribal Fish Commission Consumption Survey .....................50
Table 23. Tulalip Tribal Adult Fish Consumption Rates by Species Group and Source .........55
Table 24. Squaxin Island Tribal Adult Fish Consumption Rates by Species Group and
Source .......................................................................................................................56
Table 25. Fish Consumption Survey of the Tulalip and Squaxin Island Tribes of the
Puget Sound Region ..................................................................................................58
Table 26. Suquamish Tribal Adult Fish Consumption Rates by Species Group and
Source .......................................................................................................................61
Table 27. Fish Consumption Survey of the Suquamish Indian Tribe of the Port
Madison Indian Reservation, Puget Sound Region ..................................................62
Table 28. Adult Respondents to the Asian and Pacific Islander Survey...................................65
Table 29. Asian and Pacific Islander Seafood Consumption Study .........................................66
Table 30. API Adult Seafood Consumption Rates by Species Group and Source ...................69
Table 31. API Seafood Consumption Rates Adjusted for Cooking Loss .................................69
Table 32. Fish Consumption Information Relevant to Washington and Considered by
Ecology .....................................................................................................................72
Table 33. Summary of Fish Consumption Rates from Studies Meeting the Measures of
Technical Defensibility, All Finfish and Shellfish (g/day) .......................................75
Table 34. Percent of Tribal Fish Consumption Rate (All Sources) that is Locally
Harvested ..................................................................................................................77
Fish Consumption Rates Page v
Technical Support Document, Version 2.0 FINAL
Table 35. Percent of Tribal Anadromous Fish Consumption Rate (All Sources) that is
Locally Harvested .....................................................................................................77
Table 36. Percent of Tribal Shellfish Consumption (All Sources) that is Locally
Harvested ..................................................................................................................78
Table 37. Summary of Fish Consumption Rates, All Finfish and Shellfish .............................95
Table A-1. Fish Consumption Rates of Native American Children 5 or 6 Years of Age
or Less .................................................................................................................... A-4
Table A-2. Tribal Fish Consumption Rates ............................................................................. A-5
Table A-3. Fish Consumption Rate Data for Asian and Pacific Islanders ............................... A-5
Table A-4. EPA Data on Children’s Finfish and Shellfish Consumption Rates for the
U.S. General Population ........................................................................................ A-6
Table A-5. Seafood Consumed by Adult Members of the Tulalip Tribes ............................... A-6
Table A-6. Seafood Consumed by Adult Members of the Suquamish Tribe .......................... A-7
Table A-7. Seafood Consumed by Adult Asian-Pacific Islanders (API) ................................. A-7
Table B-1. Fish Consumption Rates for Japanese and Korean Washington Populations ........B-3
Table B-2. Percent of Households Using Subsistence Resources during 1997–1998 ..............B-5
Table B-3. Makah Indian Tribe Per Capita Harvest and Consumption of Subsistence
Fish (pounds) ..........................................................................................................B-6
Table B-4. Summary of Fish Type Consumed, Percentage of Population that Consumed
Fish Type, and Percentage Harvest Source from Local Areas by Colville
Reservation Residents .............................................................................................B-9
Table B-5. Cumulative Risks to Swinomish Tribal Finfish- and Shellfish-Consuming
Populations ............................................................................................................B-14
Table C-1. Pacific Salmon Life Cycle ......................................................................................C-5
Table C-2. Average PCB Concentrations for Coho and Chinook Salmon from In-River
and Marine Locations, Puget Sound (µg/kg) ..........................................................C-6
Table C-3. Status of Washington Salmon Stocks as of 1992....................................................C-9
Table C-4. Status of Puget Sound Salmon Stock as of 1992 ....................................................C-9
Table C-5. 2002 By-Species Summary Update of WDFW’s Salmonid Stock Inventory
(SaSI) Status for Washington State Salmon and Steelhead Stock
Classifications. ......................................................................................................C-10
Table C-6. Life Histories of Pacific Coast Salmonids ............................................................C-18
Table C-7. Biological Variability in Life Histories of Pacific Salmonids ..............................C-19
Table C-8. 2001–2002 Freshwater Salmon Sport Catch for Puget Sound River Systems .....C-20
Table C-9. 2001–2002 Sport Salmon Catch for East Juan de Fuca (Port Angeles Areas) .....C-20
Table C-10. 2002–2003 Freshwater Salmon Sport Catch for Puget Sound River Systems .....C-20
Page vi Fish Consumption Rates
FINAL Technical Support Document, Version 2.0
Table C-11. 2002–2003 Sport Salmon Catch for East Juan de Fuca (Port Angeles Areas) .....C-20
Table C-12. Salmonid Stock Inventory for the Port Angeles Harbor and Adjacent Areas ......C-21
Table C-13. Salmonid Stock Inventory for The Port Angeles Harbor and Adjacent Areas .....C-22
Table C-14. Salmonid Stock Inventory for the Port Angeles Harbor and Adjacent Areas ......C-22
Figures
Page
Figure 1. General Population Adult Fish Consumption Rates, Consumers Only,
NHANES 2003–2006, Using Standard Statistical Survey Methodology .................44
Figure 2. General Population Adult Fish Consumption Rates, Consumers Only,
NHANES 2003–2006, Using NCI Statistical Survey Methodology ........................45
Figure 3. CRITFC Adult Fish Consumption Rates, Harvested from All Sources ...................49
Figure 4. CRITFC Adult Fish Consumption Rates, Harvested from Columbia River
Basin .........................................................................................................................49
Figure 5. Tulalip Tribal Adult Fish Consumption Rates, Harvested from All Sources ...........55
Figure 6. Tulalip Tribal Adult Fish Consumption Rates, Harvested from Puget Sound .........56
Figure 7. Squaxin Island Tribal Adult Fish Consumption Rates, Harvested from All
Sources ......................................................................................................................57
Figure 8. Squaxin Island Tribal Adult Fish Consumption Rates, Harvested from Puget
Sound ........................................................................................................................57
Figure 9. Suquamish Tribal Adult Fish Consumption Rates, Harvested from All
Sources ......................................................................................................................61
Figure 10. Suquamish Tribal Adult Fish Consumption Rates, Harvested from Puget
Sound ........................................................................................................................62
Figure 11. API Adult Fish Consumption Rates, Harvested from King County (KC) and
Other Sources, Adjusted for Cooking Loss ..............................................................70
Figure 12. Regional-specific Adult Fish Consumption Rates, Harvested from All
Sources ......................................................................................................................76
Figure 13. Regional-specific Adult Fish Consumption Rates, Harvested from Local
Sources ......................................................................................................................76
Figure 14. Density function for a positively skewed lognormal distribution .............................84
Figure 15. MTCA Surface Water Cleanup Standards Equation (Non-Carcinogenic
Hazards) ..................................................................................................................102
Figure 16. MTCA Surface Water Cleanup Standards Equation (Carcinogenic Risk) .............102
Fish Consumption Rates Page vii
Technical Support Document, Version 2.0 FINAL
Acronyms and Abbreviations
API Asian and Pacific Islander
ATSDR Agency for Toxic Substances and Disease Registry
BAF bioaccumulation factor
BCF bioconcentration factor
bw body weight
BRFSS Behavioral Risk Factor Surveillance System
CDC Centers for Disease Control and Prevention
CERCLA Comprehensive Environmental Response, Compensation, and Liability Act
CRITFC Columbia River Inter-Tribal Fish Commission
CSFII Continuing Survey of Food Intakes by Individuals
CWA Clean Water Act
DDT dichlorodiphenyltrichloroethane
DOH Washington State Department of Health
Ecology Washington State Department of Ecology
EPA U.S. Environmental Protection Agency
g/day grams per day
g/kg grams per kilogram
IHS Indian Health Service
µg/kg micrograms per kilogram
µg/L micrograms per liter
µg/mg micrograms per milligram
MTCA Model Toxics Control Act
NCI National Cancer Institute
NHANES National Health and Nutrition Examination Survey
NOAA National Oceanic and Atmospheric Administration
Oregon DEQ Oregon Department of Environmental Quality
OFM Office of Financial Management
PAH polycyclic aromatic hydrocarbon
PBDE polybrominated diphenyl ether
PBT persistent bioaccumulative toxic
PCB polychlorinated biphenyl
POP persistent organic pollutant
QA/QC quality assurance/quality control
RCRA Resource Conservation and Recovery Act
RME reasonable maximum exposure
SaSI Salmonid Stock Inventory
SMS Sediment Management Standards
U.S. United States
Page viii Fish Consumption Rates
FINAL Technical Support Document, Version 2.0
USDA U.S. Department of Agriculture
WAC Washington Administrative Code
WDF Washington Department of Fisheries
WDFW Washington Department of Fish and Wildlife
WRIA Water Resource Inventory Area
Fish Consumption Rates Page ix
Technical Support Document, Version 2.0 FINAL
Acknowledgments
The Washington State Department of Ecology wishes to thank the many people who have
participated in the ongoing dialogue on fish consumption rates. There have been many
conversations through the years, with a great many people providing insight and input,
answering questions, reviewing draft documents, and clarifying various issues. In particular,
Ecology wishes to acknowledge the following people. Persons listed here provided constructive
input and feedback; they were not, however, asked to endorse the final product, and did not see
the final report before its release.
University of Washington
Dr. William (Bill) Daniell, Associate Professor, Environmental and Occupational Health
Sciences
Dr. Elaine Faustman, Professor, Environmental Health
Dr. William (Bill) Griffith, Principal Research Scientist and Director of the Risk
Assessment Core of the Institute for Risk Analysis and Risk Communication
Alison Scherer, Research Scientist, Environmental and Occupational Health Sciences
Anna Schmidt, Graduate Student, Environmental and Occupational Health Sciences
Dr. Thomas M. Burbacher, Professor, Environmental Health
Dr. Vincent F. Gallucci, Professor, Aquatic and Fishery Sciences
Verna Blackhurst, School of Aquatic and Fishery Sciences
Seattle University School of Law
Catherine A. O’Neill, Professor of Law
Doug Nash, Professor of Law and member of Nez Perce Tribe
Washington State Department of Health (DOH)
Maria C. Gardipee
Dr. Joan Hardy
David McBride
Dr. Jim W. White
Selected Tribal Representatives
Larry Dunn, Lower Elwha Klallam Tribe
Don Hurst and Patti Bailey, Confederated Tribes of the Colville Reservation
Fran Wilshusen, Northwest Indian Fisheries Commission
Denice Taylor, Suquamish Tribe
Page x Fish Consumption Rates
FINAL Technical Support Document, Version 2.0
Dianne C. Barton and Aja DeCoteau, Columbia River Inter-Tribal Fish Commission
(CRITFC)
Washington State Office of Financial Management
Yi Zhao, Chief Demographer
Washington Department of Fish and Wildlife
James E. West
National Oceanic and Atmospheric Administration
Thomas Hooper
Sandra O’Neill
U.S. Environmental Protection Agency, Headquarters, Washington, D.C.
Dr. Jacqueline Moya
David J. Miller
David Hardy
Bayazid Sarkar
Aaron Niman
U.S. Environmental Protection Agency, Region 10, Seattle
Lon Kissinger, Senior Toxicologist
Selected members of the Human Health Focus Group, Oregon Dept of Environmental Quality
Dr. Patricia Cirone (Affiliate Professor, University of Washington)
Dr. Bruce Hope, Senior Toxicologist
DOH personnel identified above
Statisticians
Dr. Nayak Polissar, The Mountain-Whisper-Light Statistics
Dr. Moni Blazej Neradilek, The Mountain-Whisper-Light Statistics
Dr. Sasha Aravkin, The Mountain-Whisper-Light Statistics
Dr. Shiquan Liao, King County
Preface to Version 2.0
Fish Consumption Rates Page xi
Technical Support Document, Version 2.0 FINAL
Preface to Version 2.0
Washington’s marine and fresh waters are home to rich stocks of finfish and shellfish, and these
resources are vital to the well-being of the peoples of our state.1 Several years ago the
Washington State Department of Ecology (Ecology) began work reviewing fish consumption
rates as part of updating environmental cleanup regulations, and subsequently produced a draft
Technical Support Document. The evaluations presented in that document followed similar
evaluations done in Oregon. Ecology received several hundred comments on the draft document
and has made revisions based on input received. Additional analyses were performed and
supplemental information was gathered to support preparation of this revised version.
Regulatory context plays a role in this topic, and Ecology will be addressing both the scientific
and policy questions associated with fish consumption rates. This Technical Support Document,
however, does not address the policy questions. It focuses quite specifically on the issue of how
much and what types of fish are consumed by the people of Washington, and what data are
available about fish consumption rates.
It is appropriate and necessary to review and, if needed, update exposure parameters used in
various regulatory contexts, and this document is offered as one part of the effort to consider fish
consumption rates. Readers may notice that this document has evolved. Ecology produced the
Fish Consumption Rates Technical Support Document: A Review of Data and Information about
Fish Consumption in Washington, Version 1.0 to support dialogue related to updating the default
fish consumption rates used in Washington environmental regulations. At that time, Ecology was
focused on updating the Sediment Management Standards, with updates to water quality
standards to follow at a later time. It was a draft document that posed several questions and was
distributed for public review and input in October 2011. Although scheduled to end December
31, 2011, the comment period was extended until January 18, 2012.2
In Version 1.0 of the Technical Support Document, Ecology collected data about fish consumers
in Washington and looked at national data about fish consumption in the United States. We
reviewed this information as a first step in addressing how to establish a fish consumption rate
for use in Washington. Ecology then considered how to systematically and scientifically
determine a default rate appropriate for use in a regulatory context. Multiple questions arose,
including: How should the data be combined in a statistically correct manner? Is it appropriate to
establish a single default rate for use in multiple settings? How should salmon be included in the
default fish consumption rate?
1 In most places in this document, unless noted otherwise, fish refers to both finfish and shellfish.
2 Due to a winter storm that caused statewide power outages during that week, Ecology accepted all late comments.
Preface to Version 2.0
Page xii Fish Consumption Rates
FINAL Technical Support Document, Version 2.0
Ecology received over 300 comments on Version 1.0 of the Technical Support Document.
Comments were posted on the Ecology website in the order in which they were received.
Ecology announced that a response to comments would be prepared.
In order to respond to comments and to update the document based on public input, Ecology
performed a number of additional analyses. The additional work in response to comments falls
generally into the following categories:
Technical analyses to more accurately characterize fish-consuming populations,
including statistical review of data and methodologies.
Research of relevant supporting information (for example, regarding recreational fish
consumption, health benefits and risks from eating finfish and shellfish, and life strategies
for different fish species).
Purpose
The purpose of this Technical Support Document (Version 2.0) is to compile and evaluate
available information on fish consumption in Washington State. It is a technical document, and is
not designed to resolve policy issues associated with using that information to make regulatory
decisions. Those issues will be dealt with in separate rulemaking documents and processes.
However, in order to assist readers, this document does provide a certain amount of context and
identifies some of the policy questions that are relevant to the topic of fish consumption rates.
This document is narrower in scope than Version 1.0 of the Technical Support Document
(distributed in October 2011). At that time, Ecology planned to adopt a default fish consumption
rate in the Sediment Management Standards (SMS) rule. One purpose of the Technical Support
Document (Version 1.0) was to identify a recommended range of fish consumption rates for
consideration in the SMS rule revision process. Since that time, Ecology has decided not to
propose a default fish consumption rate in the SMS rule. Instead Ecology is proposing to use a
reasonable maximum exposure as the sediment cleanup standard for protecting fish consumers.
Ecology is also beginning the process to revise the Water Quality Standards for Surface Waters
and adopt human health criteria.
Instead of identifying a fish consumption rate appropriate for use in a particular regulatory
context, this document compiles relevant data and information. Ecology acknowledges the
complexity of this topic and offers this Technical Support Document to provide a thorough,
rigorous, and comprehensive review of the available technical information about fish and fish
consumers in Washington.
Executive Summary
Fish Consumption Rates Page xiii
Technical Support Document, Version 2.0 FINAL
Executive Summary
Problem statement
Washington’s aquatic resources provide tremendous benefit to the people of the state. Large
quantities of finfish and shellfish are caught each year, both recreationally and commercially,
and many residents eat seafood harvested from our waters. In addition, tribal populations enjoy
treaty fishing rights, and harvesting and eating seafood plays a significant role in their cultures.
Finfish and shellfish are important parts of a healthy diet.
Polychlorinated biphenyls (PCBs), dioxins, mercury, and other persistent chemicals can
accumulate in fish tissue and harm the health of people who consume fish. Those who may be
particularly vulnerable include adults who eat large amounts of finfish or shellfish, as well as
children and other sensitive populations. Current fish consumption rates used by Ecology to
make regulatory decisions are not consistent with data about fish consumption by Washington
populations for which fish consumption survey information is available.3
Ecology currently identifies two separate default fish consumption rates that have been used to
establish regulatory requirements:
Washington’s Model Toxics Control Act (MTCA) Cleanup Regulation includes a default
fish consumption rate of 54 grams (1.9 ounces) per day. This value was established in
1991. It is based on information from a survey of Washington recreational anglers in
Commencement Bay (Pierce et al., 1981).
Washington is covered under a federal regulation – the National Toxics Rule.
Washington’s Water Quality Standards for Surface Waters currently rely on the 1992
National Toxics Rule (57 Fed. Reg. 60848-60923 codified at 40 CFR 131.36), which
includes Water Quality Standards for human health protection based on a fish
consumption rate of 6.5 grams (0.22 ounce) per day.
There have been many scientific and regulatory developments related to fish consumption rates
over the past 20 years. The review of Washington fish consumption in this Technical Support
Document is offered to provide data and information pertinent to ongoing public dialogue
concerning regulatory issues. This report reviews recent scientific data, noting the uncertainty and
variability associated with those data.
3 Ecology has the ability to make site-specific decisions and use site-specific information, including fish consumption rates protective of tribal populations.
Executive Summary
Page xiv Fish Consumption Rates
FINAL Technical Support Document, Version 2.0
The aquatic environment challenge
Many different species of finfish and shellfish are harvested from Washington waters. Each
species has a unique life history and preferred habitat. Some finfish and shellfish are exposed to
contaminants, but determining how much or where that exposure occurs is difficult. In an aquatic
environment, contaminants move between water and sediment and from one location to another.
In addition, the various salmon species, like other anadromous fish, migrate between river and
open ocean environments, spending only a portion of their life cycle near shore.
The issues surrounding salmon life history are particularly complex. Most salmon leave
freshwater streams when they are juveniles, only a couple of inches long, and spend varying
amounts of time in coastal waters. Salmon spend most of their life cycle in the open ocean, and
return to Washington waters at the end of their life cycle. Salmon are the most frequently
consumed fish in Washington, but how to account for the complexity they present when
considering questions related to water and sediment quality is a challenge. This document does
not resolve these questions. Instead it offers information that will be useful as readers think
through various options.
Washington fish resources
A large variety of fish and shellfish are available for harvesting in Washington, including more
than 50 species of edible freshwater fish and almost as many in marine waters (WDFW, 2010).
Commercial fish landings from Washington non-treaty fisheries totaled over 109 million pounds
of finfish and shellfish in 2006, including over 25 million pounds of shellfish and over 11 million
pounds of salmon.
Recreationally caught finfish in Washington include albacore, bottomfish, Pacific halibut,
salmon, steelhead, and sturgeon, with the 2006 catch totaling over 840,000 fish. Over 113,000
pounds of shellfish were collected from Washington waters in 2006, primarily Dungeness crab
and razor clams.
Washington fish consumers
Ecology estimates that between 1.4 and 3.8 million Washington adults and 290,000 children
consume some amount of fish as part of their diet.4
4 The term fish in this document may refer to finfish or to both finfish and shellfish. The term fish consumption usually refers to consumption of both finfish and shellfish. The intent should be clear from the context; where appropriate the distinction is noted.
Executive Summary
Fish Consumption Rates Page xv
Technical Support Document, Version 2.0 FINAL
Recreational fishers may consume more fish than the general Washington population. Some
population groups consume especially large amounts of finfish and shellfish as part of
traditionally influenced diets. These include Native Americans and Asian and Pacific Islanders.
Fish consumption surveys
Information about fish consumption can be collected in a variety of ways. This document
describes the different methodologies used to collect information about fish consumption. To
identify robust and defensible surveys relevant to Washington, Ecology reviewed survey
methodologies and survey results by considering measures of technical defensibility.
Ecology reviewed general population data from national surveys. Statistical methodology used
by the National Cancer Institute (NCI) was applied to the national survey data to better estimate
long-term consumption rates using short-term dietary records.
Ecology reviewed available information on fish consumption in Washington. Certain dietary
recall surveys are identified as well-designed and well-conducted. The following studies meet
measures of technical defensibility and contain data directly applicable to Washington
population groups:
A Fish Consumption Survey of the Umatilla, Nez Perce, Yakama, and Warm Springs
Tribes of the Columbia River Basin (CRITFC, 1994).
A Fish Consumption Survey of the Tulalip and Squaxin Island Tribes of the Puget Sound
Region (Toy et al., 1996).
Fish Consumption Survey of the Suquamish Indian Tribe of the Port Madison Indian
Reservations, Puget Sound Region (The Suquamish Tribe, 2000).
The Asian and Pacific Islander Seafood Consumption Study (Sechena et al., 1999, including
EPA’s 2005 re-evaluation) is a well-designed and conducted study, but it represents a very small
sample of each of the Asian and Pacific Islander populations surveyed, and statewide populations
may differ.
Data on recreational fishing provide another piece of information about fish consumers in
Washington. However, this information is collected from creel surveys and is therefore less
useful than dietary recall surveys for estimating consumption rates for a population. (The data
are included with the table below for convenience only.)
Survey information for the general population, Pacific Northwest populations, and recreational
fishers is summarized in Table 1.
Executive Summary
Page xvi Fish Consumption Rates
FINAL Technical Support Document, Version 2.0
In response to public review comments received by Ecology on Version 1.0 of this Technical Support Document, supplementary information (provided as separate Technical Issue Papers) has been prepared to provide additional detail on topics of specific relevance to the evaluation of fish consumption rates. These topics include:
Estimating annual fish consumption rates using data from short-term surveys.
Recreational fish consumption rates.
Health benefits and risks of consuming finfish and shellfish.
Chemical contaminants in dietary protein sources.
Salmon life history and body burdens. These Technical Issue Papers are provided in Ecology, 2012 (Supplemental Information to Support the Fish Consumption
Rates Technical Support Document).
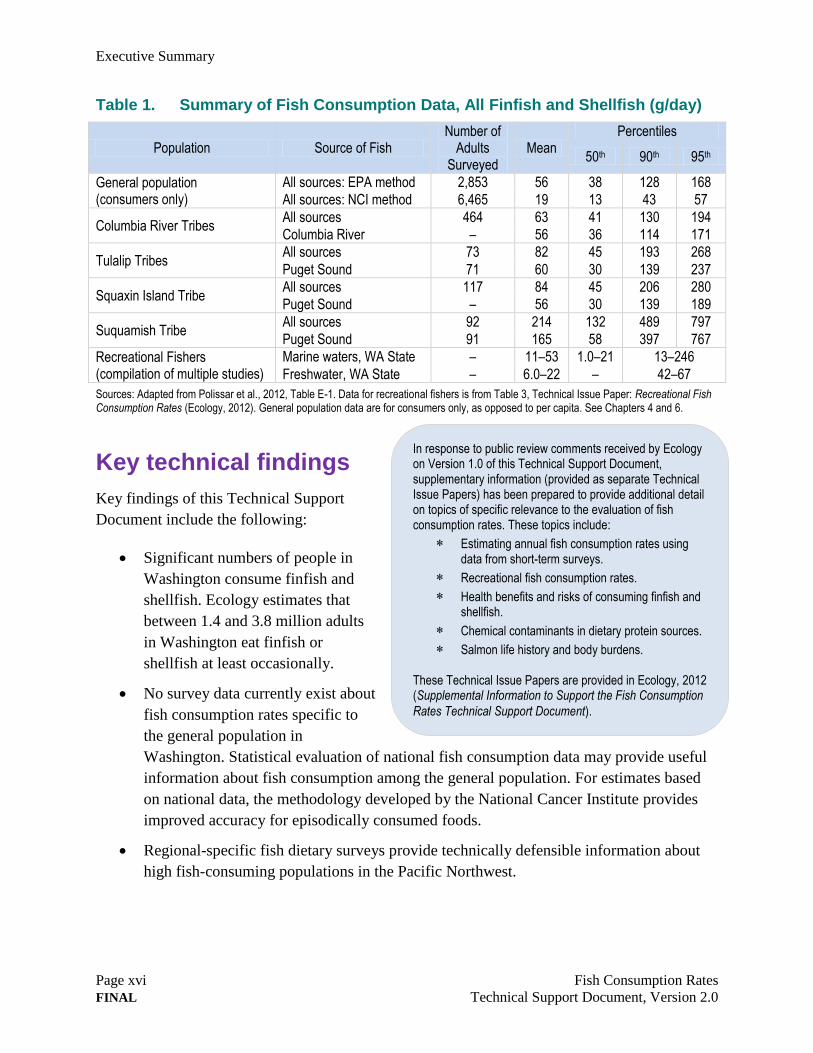
Table 1. Summary of Fish Consumption Data, All Finfish and Shellfish (g/day)
Population Source of Fish Number of
Adults Surveyed
Mean Percentiles
50th 90th 95th
General population (consumers only)
All sources: EPA method 2,853 56 38 128 168
All sources: NCI method 6,465 19 13 43 57
Columbia River Tribes All sources 464 63 41 130 194
Columbia River – 56 36 114 171
Tulalip Tribes All sources 73 82 45 193 268
Puget Sound 71 60 30 139 237
Squaxin Island Tribe All sources 117 84 45 206 280
Puget Sound – 56 30 139 189
Suquamish Tribe All sources 92 214 132 489 797
Puget Sound 91 165 58 397 767
Recreational Fishers (compilation of multiple studies)
Marine waters, WA State – 11–53 1.0–21 13–246
Freshwater, WA State – 6.0–22 – 42–67
Sources: Adapted from Polissar et al., 2012, Table E-1. Data for recreational fishers is from Table 3, Technical Issue Paper: Recreational Fish Consumption Rates (Ecology, 2012). General population data are for consumers only, as opposed to per capita. See Chapters 4 and 6.
Key technical findings
Key findings of this Technical Support
Document include the following:
Significant numbers of people in
Washington consume finfish and
shellfish. Ecology estimates that
between 1.4 and 3.8 million adults
in Washington eat finfish or
shellfish at least occasionally.
No survey data currently exist about
fish consumption rates specific to
the general population in
Washington. Statistical evaluation of national fish consumption data may provide useful
information about fish consumption among the general population. For estimates based
on national data, the methodology developed by the National Cancer Institute provides
improved accuracy for episodically consumed foods.
Regional-specific fish dietary surveys provide technically defensible information about
high fish-consuming populations in the Pacific Northwest.
Executive Summary
Fish Consumption Rates Page xvii
Technical Support Document, Version 2.0 FINAL
Supporting information
In addition to the key findings, this document includes information that allows a more
comprehensive understanding of fish consumption patterns in Washington. This information,
taken collectively, provides multiple lines of evidence about fish consumption in Washington.
For example, water body-specific evaluations, predominantly creel surveys, do provide
additional information about fish consumption.
In addition, this document looks at identifying species that are locally harvested5 and consumed.
About 68 percent of total fish consumed by the Squaxin Island tribal population is locally
harvested. The percentage of total fish consumed that is locally harvested is somewhat
higher for the other tribal populations surveyed: approximately 88 percent for the
Columbia River Tribes, 72 to 88 percent for the Tulalip Tribes, and 81 to 96 percent for
the Suquamish tribe.
Where possible, data on types of fish consumed and where the fish were obtained are
provided, allowing a regional look at fish consumption patterns.
About 62 percent of shellfish consumed by Squaxin Island tribal populations are locally
harvested. The percentage of shellfish that is locally harvested is somewhat higher for the
Suquamish Tribe (81 percent), and highest for the Tulalip Tribes (98 percent or higher).
5 The term locally harvested is used to identify the source of fish. It is used to distinguish fish harvested locally from fish purchased and coming from unknown and potentially non-local (out of state) sources.

Executive Summary
Page xviii Fish Consumption Rates
FINAL Technical Support Document, Version 2.0
This page purposely left blank for duplicate printing.
Chapter 1: Introduction and Purpose
Fish Consumption Rates Page 1
Technical Support Document, Version 2.0 FINAL
Chapter 1: Introduction and Purpose
1.1 Introduction
This report addresses fish consumption among Washington fish consumers, including the general
population, tribal populations, and other groups, such as Asian and Pacific Islanders and
recreational anglers, who are known to eat large amounts of fish.6
The Washington State Department of Ecology (Ecology) currently recognizes two separate
default fish consumption rates used to establish regulatory requirements:
Washington’s Model Toxics Control Act (MTCA) Cleanup Regulation includes a default
fish consumption rate of 54 grams (1.9 ounces) per day. This value was established in
1991. It is based on information from a survey of Washington recreational anglers in
Commencement Bay (Pierce et al., 1981).
Washington is covered under a federal regulation – the National Toxics Rule.
Washington’s Water Quality Standards for Surface Waters currently rely on the 1992
National Toxics Rule (57 Fed. Reg. 60848-60923 codified at 40 CFR 131.36), which
includes Water Quality Standards for human health protection based on a fish consumption
rate of 6.5 grams (0.22 ounce) per day.7 This value is based on technical evaluations
completed by the U.S. Environmental Protection Agency (EPA) in the mid-1980s. It
represents the low estimate of national average per capita consumption of fish and shellfish
from estuarine and fresh waters (45 Fed. Reg. 79348; U.S. EPA, 1980).8
The methods used to develop these two rates included a number of differing assumptions about
exposures. The MTCA fish consumption rate of 54 grams per day (g/day) is a recreational rate
based on a creel survey from Commencement Bay. The Water Quality Standards default fish
consumption rate of 6.5 g/day is the average per capita consumption rate of all (contaminated and
non-contaminated) freshwater and estuarine fish for the U.S. population (57 Fed. Reg. 60848-
60923 codified at 40 CFR 131.36). This average includes people who never eat fish.
To estimate the average per capita intake of a pollutant due to consumption of contaminated fish
and shellfish, the results of an early 1980s seafood dietary survey (U.S. EPA, 1980) were
analyzed to calculate the average consumption of freshwater and estuarine fish and shellfish (45
6 For the purposes of this report, fish consumers include all people in Washington who eat finfish or shellfish. While there is variability among how much fish is consumed by—both within and among—various population groups, some people never include fish in their diets. These people are considered non-consumers.
7 The 6.5 grams per day contaminated fish consumption value is equivalent to the average per-capita consumption rate of all (contaminated and non-contaminated) freshwater and estuarine fish for the U.S. population (57 Fed. Reg. 60863).
8 Moderate and high average fish consumption estimates for the U.S. national population were based on the consumption of fish and shellfish from fresh, estuarine, and marine waters (U.S. EPA, 1989a).
Chapter 1: Introduction and Purpose
Page 2 Fish Consumption Rates
FINAL Technical Support Document, Version 2.0
Fed. Reg. 79348). In the absence of estimates of fish dietary information from local fish-
consuming populations, an EPA companion guidance document to the National Toxics Rule
proposed the following average consumption rates:
6.5 g/day to represent a low estimate of average consumption of fish and shellfish from
estuarine and fresh waters by the U.S. population.
20 g/day to represent a moderate estimate of the average consumption of fish and
shellfish from marine, estuarine, and fresh waters by the U.S. population.
165 g/day to represent a high estimate of the average consumption of fish and shellfish
from marine, estuarine, and fresh waters by the 99.9th
percentile of the U.S. population.
In contrast to the low average estimate, the moderate and high average fish consumption estimates
for the U.S. population is based on the consumption of fish and shellfish not only from fresh and
estuarine waters but also from marine waters (U.S. EPA, 1989a, page 58 and Table 7, page 71).
There have been many scientific and regulatory developments related to fish consumption rates
over the past 20 years. These include:
Acquisition of recent scientific data on finfish and shellfish consumption rates for
different population groups.
Updated approaches used by other state and federal agencies.
Analysis of uncertainty and variability in finfish and shellfish consumption rates for
different population groups and individuals within those groups.
Analysis of current and potential future exposures resulting from finfish and shellfish
consumption.
Revision of state laws and policies, including MTCA and the Water Pollution Control Act.
Assertion of tribal fishing rights by tribes.
1.2 Intended audience
Ecology will use this document to engage multiple audiences in discussions on issues related to
fish consumption rates.9 This report is meant to facilitate discussions with interested parties and
persons throughout Washington.
To facilitate these discussions, it is important to understand the different ways we express fish
consumption rates in this Technical Support Document. In general, a fish consumption rate is
presented as grams of fish consumed per day (g/day). For many readers, it is easier to understand
a fish consumption rate expressed in ounces per day, or number of 8-ounce meals per week. (An
9 The term fish includes all types of finfish and shellfish. When discussing the species that are consumed, fish are categorized by species groupings.
Chapter 1: Introduction and Purpose
Fish Consumption Rates Page 3
Technical Support Document, Version 2.0 FINAL
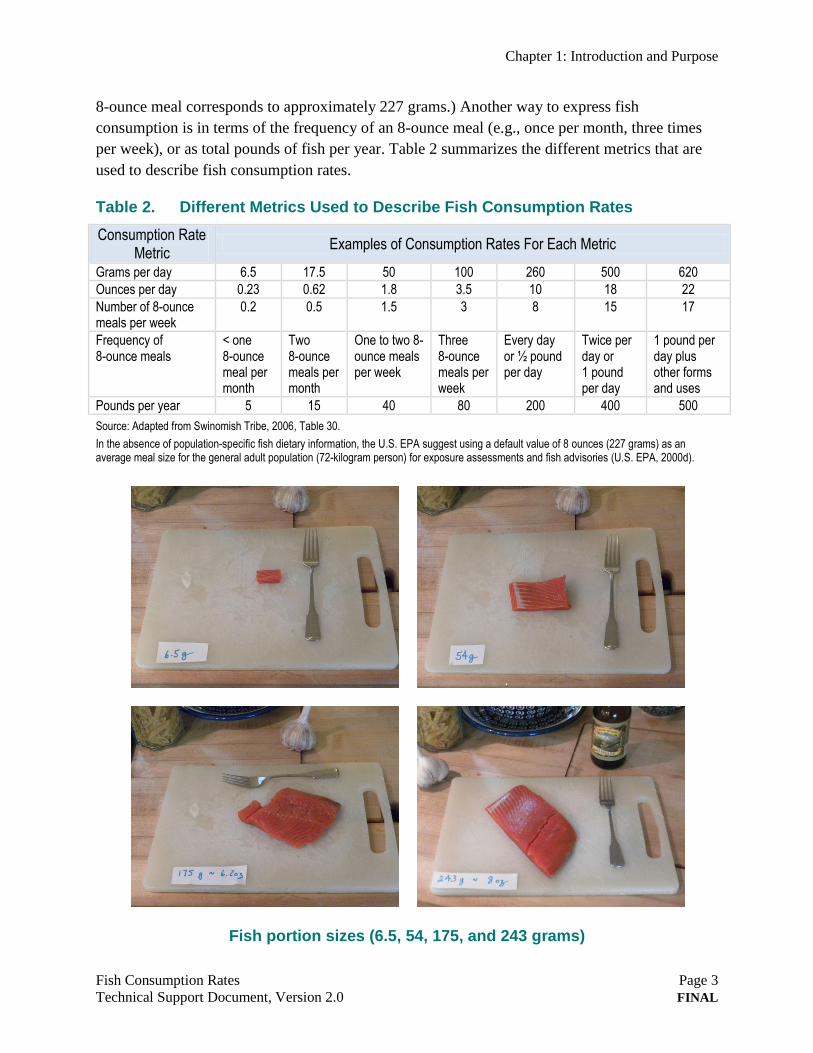
8-ounce meal corresponds to approximately 227 grams.) Another way to express fish
consumption is in terms of the frequency of an 8-ounce meal (e.g., once per month, three times
per week), or as total pounds of fish per year. Table 2 summarizes the different metrics that are
used to describe fish consumption rates.
Table 2. Different Metrics Used to Describe Fish Consumption Rates
Consumption Rate Metric
Examples of Consumption Rates For Each Metric
Grams per day 6.5 17.5 50 100 260 500 620
Ounces per day 0.23 0.62 1.8 3.5 10 18 22
Number of 8-ounce meals per week
0.2 0.5 1.5 3 8 15 17
Frequency of 8-ounce meals
< one 8-ounce meal per month
Two 8-ounce meals per month
One to two 8-ounce meals per week
Three 8-ounce meals per week
Every day or ½ pound per day
Twice per day or 1 pound per day
1 pound per day plus other forms and uses
Pounds per year 5 15 40 80 200 400 500
Source: Adapted from Swinomish Tribe, 2006, Table 30.
In the absence of population-specific fish dietary information, the U.S. EPA suggest using a default value of 8 ounces (227 grams) as an average meal size for the general adult population (72-kilogram person) for exposure assessments and fish advisories (U.S. EPA, 2000d).
Fish portion sizes (6.5, 54, 175, and 243 grams)
Chapter 1: Introduction and Purpose
Page 4 Fish Consumption Rates
FINAL Technical Support Document, Version 2.0
1.3 Purpose of this document
The purpose of this Technical Support Document (Version 2.0) is to compile and evaluate
existing data on fish consumption in Washington State. It is a technical document, and is not
designed to resolve policy issues associated with using that information to make regulatory
decisions. Those issues will be dealt with in separate rulemaking documents and processes.
This Technical Support Document provides useful background information for discussions related
to finfish and shellfish consumption rates. The primary question addressed in this document is:
What is currently known about fish consumption habits and rates for people in Washington?
Specifically, what types of data are available, how much fish do people in various population
groups eat, what kinds of fish do they eat, and where do they obtain the fish?
Ecology recognizes that many other considerations factor into calculating protective standards,
including acceptable risk levels and exposure parameters (such as exposure duration). These
considerations may be relevant to various regulatory discussions. This particular document,
however, focuses primarily on technical information related to fish consumption rates.
1.4 Document history
Ecology distributed the Fish Consumption Rates Technical Support Document, Version 1.0, for
public review in September 2011. The document was prepared to support discussion on whether
and how to revise the fish consumption rates in the Sediment Management Standards (SMS) rule.
Ecology held several public workshops to discuss the draft report and regulatory implications.
Ecology received several hundred written comments on the draft report. Ecology has reviewed
those comments and prepared written responses that are compiled in a separate document. As
part of that review, Ecology also performed additional technical analyses to address several
issues raised during the public comment period.
Ecology has considered the comments and analyses when revising this Technical Support
Document. Significant revisions include the following:
General population studies. Several people recommended that Ecology provide
information on fish consumption rates for the general population. Ecology has worked
with the University of Washington to review national dietary surveys that provide
information on fish consumption rates for the general population, and has included the
results of that review in the revised document.
Recreational fisher studies. Several people recommended that Ecology provide
information on fish consumption rates for recreational fishers. Ecology reviewed
available studies on recreational fishers. Based on that review, Ecology has conducted an
Chapter 1: Introduction and Purpose
Fish Consumption Rates Page 5
Technical Support Document, Version 2.0 FINAL
independent assessment, provided in a separate Technical Issue Paper (Ecology, 2012),
that details recreational fish consumption studies conducted in Washington. Ecology has
incorporated the results of that review into this revised Technical Support Document.
Asian Pacific Islander (API) studies. Several people recommended that Ecology consider
additional information on the fish dietary habits of API populations. Ecology has
incorporated additional information on API populations into this revised Technical
Support Document.
Estimating long-term consumption rates. Several people expressed concerns about using
the results from short-term episodic dietary studies to estimate long-term upper percentile
fish consumption rates. Ecology has reviewed and evaluated methods for adjusting short-
term episodic dietary information to provide fish consumption estimates and percentiles.
These statistical corrections were used to estimate annual fish consumption rates for the
general population from 2-day national survey data.
Salmon. Ecology received a wide range of comments on salmon, their life cycles and
survival strategies, and salmon contaminant body burdens. This document provides fish
consumption estimates with and without salmon from several fish dietary surveys of
Pacific Northwest populations. Where available, fish consumption estimates are tabulated
for anadromous and non-anadromous species. Additional information on salmon
contaminant body burdens is provided in Appendix C and in the Technical Issue Paper,
Salmon Life History and Contaminant Body Burdens (Ecology, 2012).
Analysis of regional fish dietary information. In Version 1.0 of this Technical Support
Document, Ecology provided the results of a statistical evaluation from fish dietary surveys
of Pacific Northwest populations. Ecology’s evaluation provided fish consumption
estimates between the 80th
and 95th
percentiles of the fish consumption distribution. Several
people provided comments regarding policy choices embedded in this evaluation. Ecology
has reviewed these comments, and in order to facilitate broad consideration in the process
of revising the Water Quality Standards for Surface Waters, this version of the Technical
Support Document does not provide a recommended range for fish consumption rates.
Discussion is provided in Chapter 4.
Policy statements and recommendations. This Technical Support Document is focused
on finfish and shellfish resources in the Pacific Northwest, and Washington State fish-
consuming populations. It includes information from fish dietary surveys of Pacific
Northwest populations and national general population data. Ecology acknowledges that
there are many policy decisions associated with estimating fish consumption rates for
Washington State fish-consuming populations. Some of these policy issues are noted in
Chapter 6. This document, however, does not provide a thorough discussion of policy
choices. The issues are identified only to assist readers in a broader understanding of the
context in which fish consumption rates are considered.
Chapter 1: Introduction and Purpose
Page 6 Fish Consumption Rates
FINAL Technical Support Document, Version 2.0
1.5 Organization of this document
The remainder of this document is organized as follows.
Chapter 2: Washington Fish Resources and Fish-Consuming Populations
Available information indicates that some Washington residents consume locally harvested
finfish and/or shellfish. In addition, several population subgroups (including Native Americans
and Asian and Pacific Islanders) consume large amounts of finfish and shellfish. This chapter
summarizes available information on state water resources that support fishing practices.
Regional differences are acknowledged and the size and demographic characteristics of
Washington finfish and shellfish consumers and consuming populations are identified.
Chapter 3: Methodology for Assessing Fish Consumption Rate Information
Several approaches are available for developing estimates of finfish and shellfish consumption.
Although surveys are generally considered to be the best approach for developing these
estimates, a number of design features determine whether a particular survey provides a
technically defensible basis for agency decision making. This chapter reviews those design
features and outlines the factors considered when evaluating studies.
Chapter 4: Fish Consumption Survey Data that Apply to Washington Fish Consumers
This chapter reviews and analyzes available fish consumption survey data for the general
population, Pacific Northwest Native American tribes, Asian and Pacific Islanders, and
recreational fishers. It includes a discussion of variability and uncertainty in the survey data, and
summarizes key findings.
Chapter 5: Sources of Uncertainty and Variability
When making regulatory decisions, it is important to consider the uncertainties associated with
available data and the variability across individuals, fish species, and geographic areas. This
chapter provides a high-level summary of important sources of uncertainty and variability in fish
consumption surveys used to estimate finfish and shellfish consumption rates.
Chapter 6: Using Scientific Data to Support Regulatory Decisions
This chapter highlights some of the policy choices that will be needed when using fish consumption
rates to support regulatory decisions. The discussion includes brief descriptions of particular
regulatory issues and a range of examples to illustrate how agencies have resolved each issue.
Appendices
Included here is other fish consumption information used for regulatory decision making
including fish species found in Washington, information on additional tribal studies,
correspondence from the Columbia River Inter-Tribal Fish Commission and University of
Washington, further discussion on the challenges of risk assessment and salmon consumption, a
glossary of terms, and a complete list of reference citations presented alphabetically by author.
Chapter 2: Washington Fish Resources
and Fish-Consuming Populations
Fish Consumption Rates Page 7
Technical Support Document, Version 2.0 FINAL
Chapter 2: Washington Fish Resources and Fish-Consuming Populations
2.1 Introduction
Washington is home to a wide range of water resources that support commercial, recreational,
and subsistence fishing and harvesting. Many Washington residents consume some local finfish
or shellfish. Several population groups consume larger amounts of finfish and shellfish than the
general population. These include members of Native American tribal nations, Asian and Pacific
Islanders, and people who fish recreationally (recreational fishers).
Ecology’s review of available data on fish harvests identified the commercial, tribal, and
recreational harvesting of multiple species, including groundfish, Pacific halibut, coastal pelagic
species, highly migratory species, salmon, other anadromous species and eggs, and shellfish.
Similarly, recreational sport fishing is structured around a multispecies fishery, and hundreds of
thousands of sport anglers harvest fish throughout Washington.
Salmon are of particular importance in Washington, and questions about salmon are discussed at
several points in this report. Salmon are harvested from both fresh and marine waters. The Puget
Sound basin and the Columbia River basin dominate the areas of harvest. Steelhead and salmon
(from both fresh and marine waters) accounted for about half of the recreational sport harvest
(close to 400,000 fish) in 2006.
This chapter is organized into the following sections:
Fish resources. A summary of finfish and shellfish resources in Washington.
Estimated number of Washington fish consumers. This section provides rough estimates
on the number of adults and children in Washington who regularly eat finfish and/or
shellfish.
High fish-consuming populations. This section defines high fish consumers and identifies
and describes subpopulations in Washington generally known to be high fish consumers.
Washington waters support large finfish and shellfish populations and commercial, tribal, and
recreational harvests.
2.2 Washington fish resources
Washington has more than 500 miles of Pacific coast shoreline and over 2,000 combined miles
of Puget Sound, San Juan Islands, Strait of Juan de Fuca, and Hood Canal shoreline. This
shoreline provides habitat for marine finfish and shellfish. In addition, the state has 4,000 rivers
Chapter 2: Washington Fish Resources
and Fish-Consuming Populations
Page 8 Fish Consumption Rates
FINAL Technical Support Document, Version 2.0
and streams, stretching over 50,000 miles. Many streams and rivers have seasonal salmon and
steelhead runs. State waters also include more than 7,000 lakes, with over 2,500 lakes at alpine
elevations, and more than 200 reservoirs that provide additional fishing opportunities. Many
freshwater areas are open for fishing year-round (WDFW, 2010).
A large variety of finfish and shellfish are available for harvesting in Washington (WDFW,
2010, p. 17–30). The Washington Department of Fish and Wildlife (WDFW) has identified more
than 50 species of edible freshwater fish and almost as many in marine waters (WDFW, 2010, p.
17–30). (See Appendix C for information on finfish and shellfish species harvested in
Washington.)
A study to summarize the economic benefits of Washington’s non-treaty commercial and
recreational fisheries provides information on the valuation and numbers of commercial and
recreational finfish and shellfish harvested throughout Washington. In 2006, commercial fish
landings from non-treaty fisheries totaled more than 109 million pounds. The Washington
coastal area is the largest contributor to commercial fish harvesting, accounting for 85 percent of
total pounds landed (WDFW, 2008a).
The fish consumption rate tabulations in this technical support document are derived from
national fish dietary data and from fish dietary surveys from the Pacific Northwest. The tribal
fish dietary surveys from the Pacific Northwest document fish locally harvested and consumed.
Independent and separate documentation from three different Washington State agencies
(WDFW, Washington State Department of Health [DOH], and Ecology) document the harvest
and consumption of local aquatic resources, including finfish and shellfish. However, data gaps
remain regarding the exact locations of where fish and shellfish are harvested in Washington and
how the fish are then made commercially available for consumption.
2.2.1 Washington’s commercial fisheries
Washington’s commercial fisheries include harvest of groundfish, Pacific halibut, coastal pelagic
species, highly migratory species, salmon (including eggs), other anadromous species, and
shellfish. In 2006, nontribal commercial fish landings from Washington fisheries totaled
approximately 109.4 million pounds.
In 2006, groundfish (bottom-dwelling fish or bottomfish) composed the state’s largest
commercial fishery. Groundfish accounted for 54 percent of the commercial catch from
Washington waters, with approximately 59.2 million pounds landed. Shellfish landings
represented the state’s second-largest commercial fishery, accounting for almost 25 percent of
the commercial catch, with approximately 25.8 million pounds landed in 2006.
Chapter 2: Washington Fish Resources
and Fish-Consuming Populations
Fish Consumption Rates Page 9
Technical Support Document, Version 2.0 FINAL
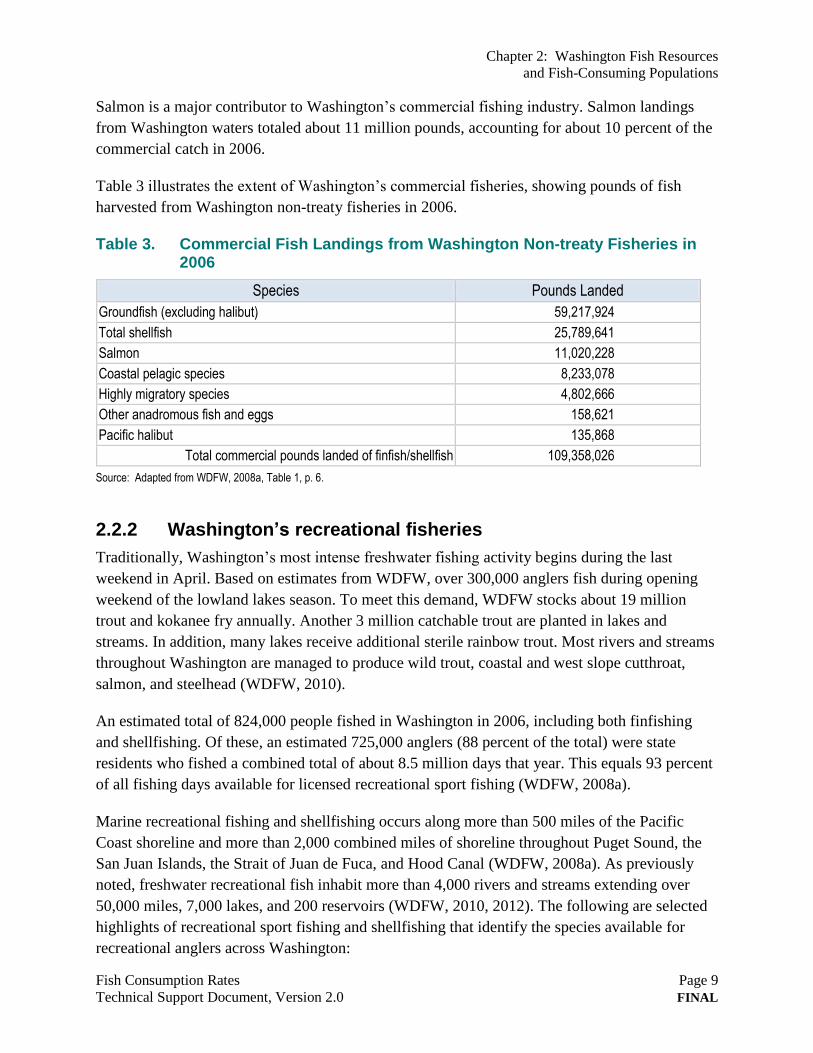
Salmon is a major contributor to Washington’s commercial fishing industry. Salmon landings
from Washington waters totaled about 11 million pounds, accounting for about 10 percent of the
commercial catch in 2006.
Table 3 illustrates the extent of Washington’s commercial fisheries, showing pounds of fish
harvested from Washington non-treaty fisheries in 2006.
Table 3. Commercial Fish Landings from Washington Non-treaty Fisheries in 2006
Species Pounds Landed
Groundfish (excluding halibut) 59,217,924
Total shellfish 25,789,641
Salmon 11,020,228
Coastal pelagic species 8,233,078
Highly migratory species 4,802,666
Other anadromous fish and eggs 158,621
Pacific halibut 135,868
Total commercial pounds landed of finfish/shellfish 109,358,026
Source: Adapted from WDFW, 2008a, Table 1, p. 6.
2.2.2 Washington’s recreational fisheries
Traditionally, Washington’s most intense freshwater fishing activity begins during the last
weekend in April. Based on estimates from WDFW, over 300,000 anglers fish during opening
weekend of the lowland lakes season. To meet this demand, WDFW stocks about 19 million
trout and kokanee fry annually. Another 3 million catchable trout are planted in lakes and
streams. In addition, many lakes receive additional sterile rainbow trout. Most rivers and streams
throughout Washington are managed to produce wild trout, coastal and west slope cutthroat,
salmon, and steelhead (WDFW, 2010).
An estimated total of 824,000 people fished in Washington in 2006, including both finfishing
and shellfishing. Of these, an estimated 725,000 anglers (88 percent of the total) were state
residents who fished a combined total of about 8.5 million days that year. This equals 93 percent
of all fishing days available for licensed recreational sport fishing (WDFW, 2008a).
Marine recreational fishing and shellfishing occurs along more than 500 miles of the Pacific
Coast shoreline and more than 2,000 combined miles of shoreline throughout Puget Sound, the
San Juan Islands, the Strait of Juan de Fuca, and Hood Canal (WDFW, 2008a). As previously
noted, freshwater recreational fish inhabit more than 4,000 rivers and streams extending over
50,000 miles, 7,000 lakes, and 200 reservoirs (WDFW, 2010, 2012). The following are selected
highlights of recreational sport fishing and shellfishing that identify the species available for
recreational anglers across Washington:
Chapter 2: Washington Fish Resources
and Fish-Consuming Populations
Page 10 Fish Consumption Rates
FINAL Technical Support Document, Version 2.0
Recreational fishing for shad on the Columbia River with several million shad passing
through Bonneville Dam annually.
WDFW lists state record catches for more than 50 freshwater species of fish (e.g.,
rainbow trout, Beardslee rainbow trout, brown trout, and numerous other trout species).
Recreational sturgeon fishing on the Columbia River.
Marine recreational seasonal fishing for lingcod, halibut, and rockfish as well as other
marine bottomfish.
Recreational shellfishing for oysters, clams, shrimp, and crab throughout Puget Sound,
Hood Canal, the San Juan Islands, and the Strait of Juan de Fuca.
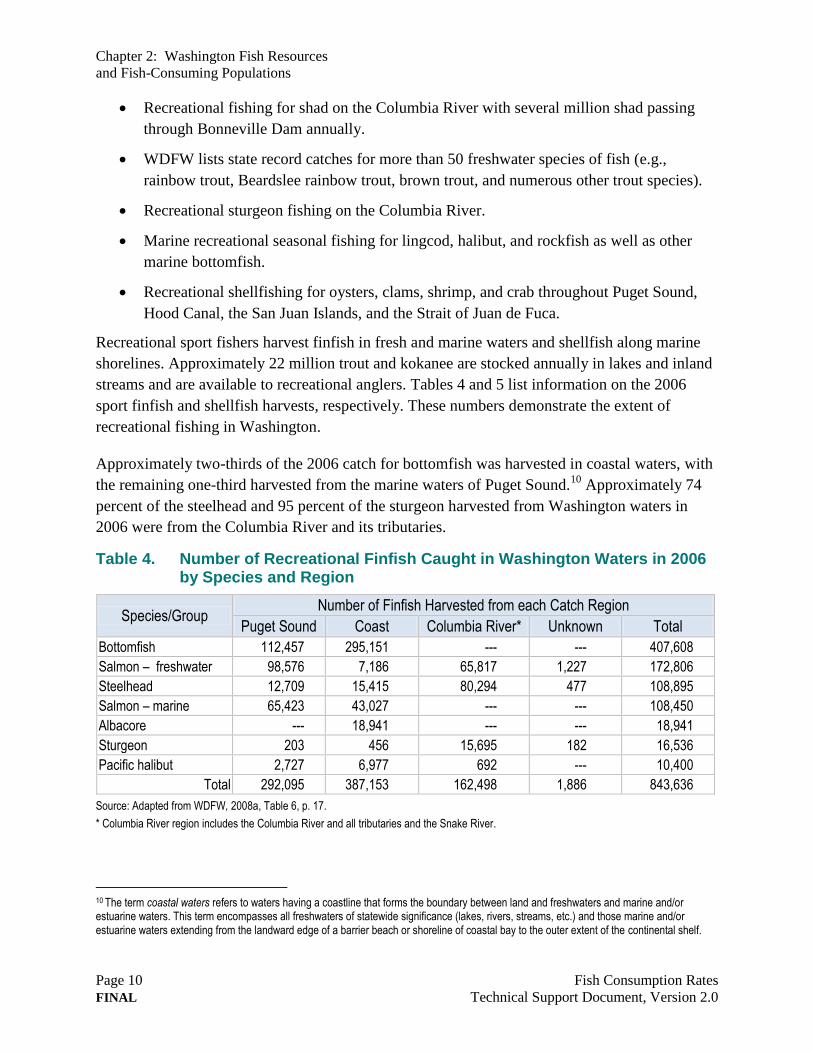
Recreational sport fishers harvest finfish in fresh and marine waters and shellfish along marine
shorelines. Approximately 22 million trout and kokanee are stocked annually in lakes and inland
streams and are available to recreational anglers. Tables 4 and 5 list information on the 2006
sport finfish and shellfish harvests, respectively. These numbers demonstrate the extent of
recreational fishing in Washington.
Approximately two-thirds of the 2006 catch for bottomfish was harvested in coastal waters, with
the remaining one-third harvested from the marine waters of Puget Sound.10
Approximately 74
percent of the steelhead and 95 percent of the sturgeon harvested from Washington waters in
2006 were from the Columbia River and its tributaries.
Table 4. Number of Recreational Finfish Caught in Washington Waters in 2006 by Species and Region
Species/Group Number of Finfish Harvested from each Catch Region
Puget Sound Coast Columbia River* Unknown Total
Bottomfish 112,457 295,151 --- --- 407,608
Salmon – freshwater 98,576 7,186 65,817 1,227 172,806
Steelhead 12,709 15,415 80,294 477 108,895
Salmon – marine 65,423 43,027 --- --- 108,450
Albacore --- 18,941 --- --- 18,941
Sturgeon 203 456 15,695 182 16,536
Pacific halibut 2,727 6,977 692 --- 10,400
Total 292,095 387,153 162,498 1,886 843,636
Source: Adapted from WDFW, 2008a, Table 6, p. 17.
* Columbia River region includes the Columbia River and all tributaries and the Snake River.
10 The term coastal waters refers to waters having a coastline that forms the boundary between land and freshwaters and marine and/or estuarine waters. This term encompasses all freshwaters of statewide significance (lakes, rivers, streams, etc.) and those marine and/or estuarine waters extending from the landward edge of a barrier beach or shoreline of coastal bay to the outer extent of the continental shelf.
Chapter 2: Washington Fish Resources
and Fish-Consuming Populations
Fish Consumption Rates Page 11
Technical Support Document, Version 2.0 FINAL
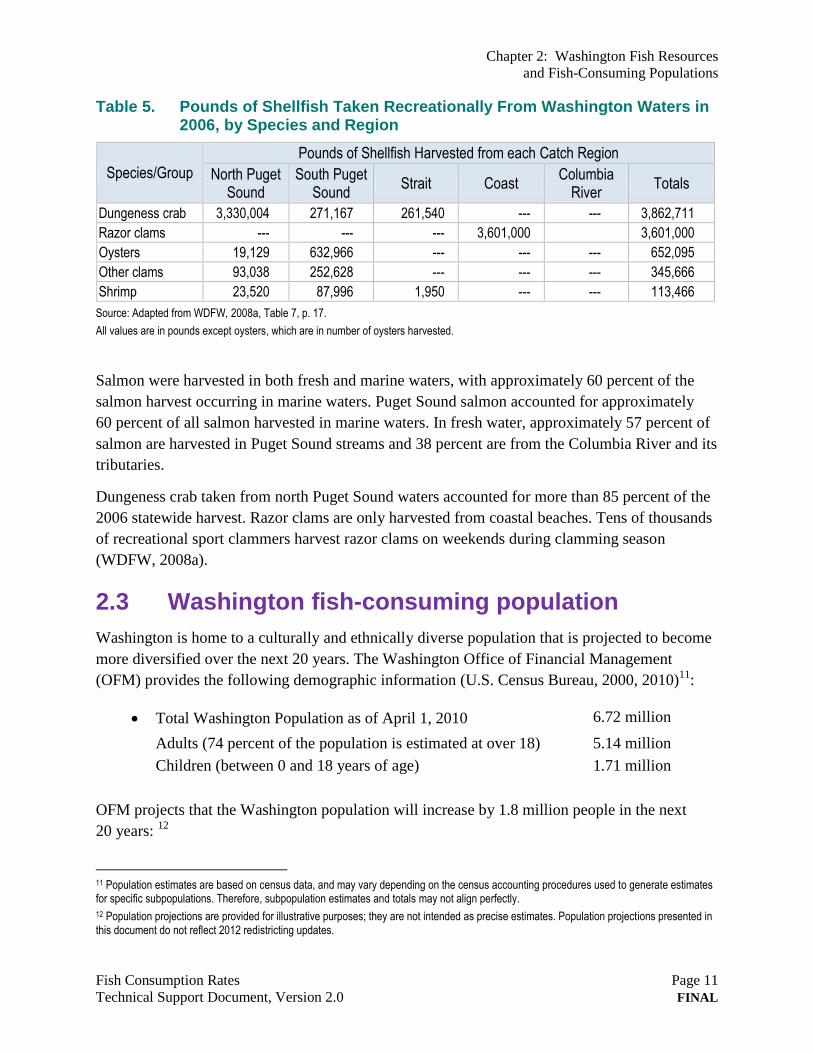
Table 5. Pounds of Shellfish Taken Recreationally From Washington Waters in 2006, by Species and Region
Species/Group
Pounds of Shellfish Harvested from each Catch Region
North Puget Sound
South Puget Sound
Strait Coast Columbia
River Totals
Dungeness crab 3,330,004 271,167 261,540 --- --- 3,862,711
Razor clams --- --- --- 3,601,000 3,601,000
Oysters 19,129 632,966 --- --- --- 652,095
Other clams 93,038 252,628 --- --- --- 345,666
Shrimp 23,520 87,996 1,950 --- --- 113,466
Source: Adapted from WDFW, 2008a, Table 7, p. 17.
All values are in pounds except oysters, which are in number of oysters harvested.
Salmon were harvested in both fresh and marine waters, with approximately 60 percent of the
salmon harvest occurring in marine waters. Puget Sound salmon accounted for approximately
60 percent of all salmon harvested in marine waters. In fresh water, approximately 57 percent of
salmon are harvested in Puget Sound streams and 38 percent are from the Columbia River and its
tributaries.
Dungeness crab taken from north Puget Sound waters accounted for more than 85 percent of the
2006 statewide harvest. Razor clams are only harvested from coastal beaches. Tens of thousands
of recreational sport clammers harvest razor clams on weekends during clamming season
(WDFW, 2008a).
2.3 Washington fish-consuming population
Washington is home to a culturally and ethnically diverse population that is projected to become
more diversified over the next 20 years. The Washington Office of Financial Management
(OFM) provides the following demographic information (U.S. Census Bureau, 2000, 2010)11
:
Total Washington Population as of April 1, 2010 6.72 million
Adults (74 percent of the population is estimated at over 18) 5.14 million
Children (between 0 and 18 years of age) 1.71 million
OFM projects that the Washington population will increase by 1.8 million people in the next
20 years: 12
11 Population estimates are based on census data, and may vary depending on the census accounting procedures used to generate estimates for specific subpopulations. Therefore, subpopulation estimates and totals may not align perfectly.
12 Population projections are provided for illustrative purposes; they are not intended as precise estimates. Population projections presented in this document do not reflect 2012 redistricting updates.
Chapter 2: Washington Fish Resources
and Fish-Consuming Populations
Page 12 Fish Consumption Rates
FINAL Technical Support Document, Version 2.0
Projected Total Washington Population, 2030 8.54 million
Projected children (between 0 and 18 years of age) 2030 2.06 million
2.3.1 Estimated number of fish consumers in Washington
The general population is made up of people with a variety of dietary preferences. Some
consume fish frequently, some infrequently, and some potentially never. (However, even people
who report they don’t eat fish may consume some fish in processed foods like salad dressing,
Worcestershire sauce, and cheese spread.) Per capita rates that take into account the entire
population will differ from rates derived from consideration of so-called consumer only data. For
protection of people who eat fish, the population of interest is generally considered to be fish
consumers (CalEPA 2001, page 13; Oregon DEQ 2008; U.S.EPA 2002b).
People consume finfish and shellfish obtained from a variety of sources. Information about fish
consumed by the general Washington population is available only through estimates.13
While
there are uncertainties associated with these estimates, they are useful in providing context to the
discussion about fish consumption rates.
First, the total number of fish consumers was estimated. A fish consumer is someone who eats
finfish or shellfish at least occasionally. Then a definition of high fish consumer was used to
suggest the number of people in the general population at the high end of the exposure
distribution. These estimates provide only a rough number of fish consumers and no information
about the source of the fish. Ecology also reviewed available information on certain ethnic
groups that consume fish from local waters.
To estimate the number of fish consumers in Washington, and how much fish they consume,
Ecology considered multiple estimation methods. This is consistent with the approach taken by
the Oregon Department of Environmental Quality (Oregon DEQ) Human Health Focus Group.
Using 2010 demographic information provided by the Washington OFM, Ecology estimates that
between 1.4 and 3.8 million Washington adults (and approximately 290,000 Washington children
0 to 18 years old) are fish consumers. These upper and lower estimates were developed using two
different methods, as described below:
Low Estimate: Based on national survey data. The first approach resulted in the lower of
the two estimates. It was developed using Washington population data and information
on the percentage of fish consumers reported in Estimated Per Capita Fish Consumption
13 These estimates use the EPA 2002 data and are consistent with the methodology used by the Oregon Human Health Focus Group. They do not use the National Health and Nutrition Examination Survey (NHANES) results because these estimates were developed before that work was complete.
Chapter 2: Washington Fish Resources
and Fish-Consuming Populations
Fish Consumption Rates Page 13
Technical Support Document, Version 2.0 FINAL
Washington State Behavioral Risk Factor Surveillance System
The BRFSS telephone survey is a valuable health management tool used by DOH to collect health-based information and monitor the public’s behavioral risk factors that may contribute to a person’s health. The BRFSS primarily collects data on chronic diseases, injuries, infectious illnesses, and the behavioral factors underlying these conditions.
in the United States (U.S. EPA, 2002a).14
For this estimate of fish consumers in
Washington, Ecology assumed that Washington dietary habits are similar to those for the
United States as a whole. The Oregon DEQ Human Health Focus Group used this
approach to prepare estimates of fish consumers in Oregon.15
(See Chapter 4 for
additional information on estimated United States per capita fish consumption.)
o Adults. EPA found that 28 percent of adults interviewed in the national survey
were fish consumers (U.S. EPA, 2002a, Section 5.1.1.1, Table 4). Assuming that
a similar percentage of Washington’s 5.1 million adults also consume fish,
Ecology estimates that approximately 1.4 million adults in Washington currently
eat some amount of fish.
o Children. EPA found that 16 to 19 percent of children (ages 0 to 18) included in
the national survey were fish consumers (Moya, 2011, personal
communication).16
Assuming that 17 percent of Washington’s 1.7 million
children also consume fish, Ecology estimates that there are approximately
290,000 children in Washington who currently eat some amount of fish.
High Estimate: Based on Washington State
Department of Health survey. The second approach
resulted in the higher estimate. It was developed using
Washington population data and information compiled
by the DOH. DOH used the Behavioral Risk Factor
Surveillance System (BRFSS) to compile information
on fish consumption habits of randomly selected
Washington residents.17
This work was done over a 4-
year period; it was designed to improve DOH’s
understanding of the percent of the Washington
population that consumes fish.
14 This percent value may underestimate the fraction of fish consumers in Washington State because other parts of the United States do not have the fisheries resources available in Washington State.
15 Ecology acknowledges the limitations of the national fish dietary data; this approach employed a 2-day dietary recall survey methodology where respondents who did not report eating fish on one of the two survey days were counted as non-consumers and averaged with consumers as a zero. As noted by the EPA 2011 Exposure Factors Handbook, p. 10-16, “… short-term consumption data may not accurately reflect long-term eating patterns and may under-represent infrequent consumers of a given fish species. This is particularly true for the tails (extremes) of the distribution of food intake. Because these are 2-day averages, consumption estimates at the upper end of the intake distribution may be underestimated are used to assess acute (i.e., short-term) exposures.”
16 Approximately 18 percent of the U.S. general population ages 16 – 21 are fish consumers; approximately 31 percent of the U.S. general population ages 20 – 50 are fish consumers. Information is based on EPA’s reexamination of the National Health and Nutrition Examination Survey (NHANES) and the 2002 per capita fish consumption report.
17 The BRFSS is sponsored by the U.S. Centers for Disease Control and Prevention (CDC) and is a probability-based telephone survey of non-institutionalized adults, ages 18 years and over.
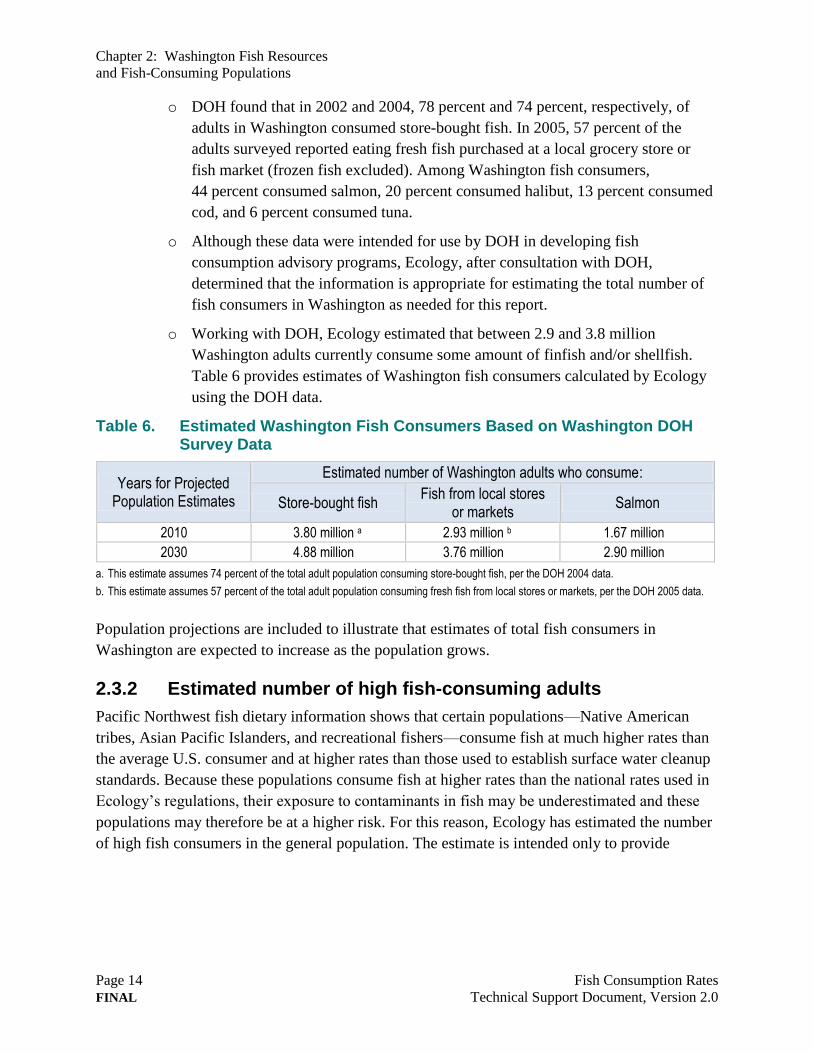
Chapter 2: Washington Fish Resources
and Fish-Consuming Populations
Page 14 Fish Consumption Rates
FINAL Technical Support Document, Version 2.0
o DOH found that in 2002 and 2004, 78 percent and 74 percent, respectively, of
adults in Washington consumed store-bought fish. In 2005, 57 percent of the
adults surveyed reported eating fresh fish purchased at a local grocery store or
fish market (frozen fish excluded). Among Washington fish consumers,
44 percent consumed salmon, 20 percent consumed halibut, 13 percent consumed
cod, and 6 percent consumed tuna.
o Although these data were intended for use by DOH in developing fish
consumption advisory programs, Ecology, after consultation with DOH,
determined that the information is appropriate for estimating the total number of
fish consumers in Washington as needed for this report.
o Working with DOH, Ecology estimated that between 2.9 and 3.8 million
Washington adults currently consume some amount of finfish and/or shellfish.
Table 6 provides estimates of Washington fish consumers calculated by Ecology
using the DOH data.
Table 6. Estimated Washington Fish Consumers Based on Washington DOH Survey Data
Years for Projected Population Estimates
Estimated number of Washington adults who consume:
Store-bought fish Fish from local stores
or markets Salmon
2010 3.80 million a 2.93 million b 1.67 million
2030 4.88 million 3.76 million 2.90 million
a. This estimate assumes 74 percent of the total adult population consuming store-bought fish, per the DOH 2004 data.
b. This estimate assumes 57 percent of the total adult population consuming fresh fish from local stores or markets, per the DOH 2005 data.
Population projections are included to illustrate that estimates of total fish consumers in
Washington are expected to increase as the population grows.
2.3.2 Estimated number of high fish-consuming adults
Pacific Northwest fish dietary information shows that certain populations—Native American
tribes, Asian Pacific Islanders, and recreational fishers—consume fish at much higher rates than
the average U.S. consumer and at higher rates than those used to establish surface water cleanup
standards. Because these populations consume fish at higher rates than the national rates used in
Ecology’s regulations, their exposure to contaminants in fish may be underestimated and these
populations may therefore be at a higher risk. For this reason, Ecology has estimated the number
of high fish consumers in the general population. The estimate is intended only to provide
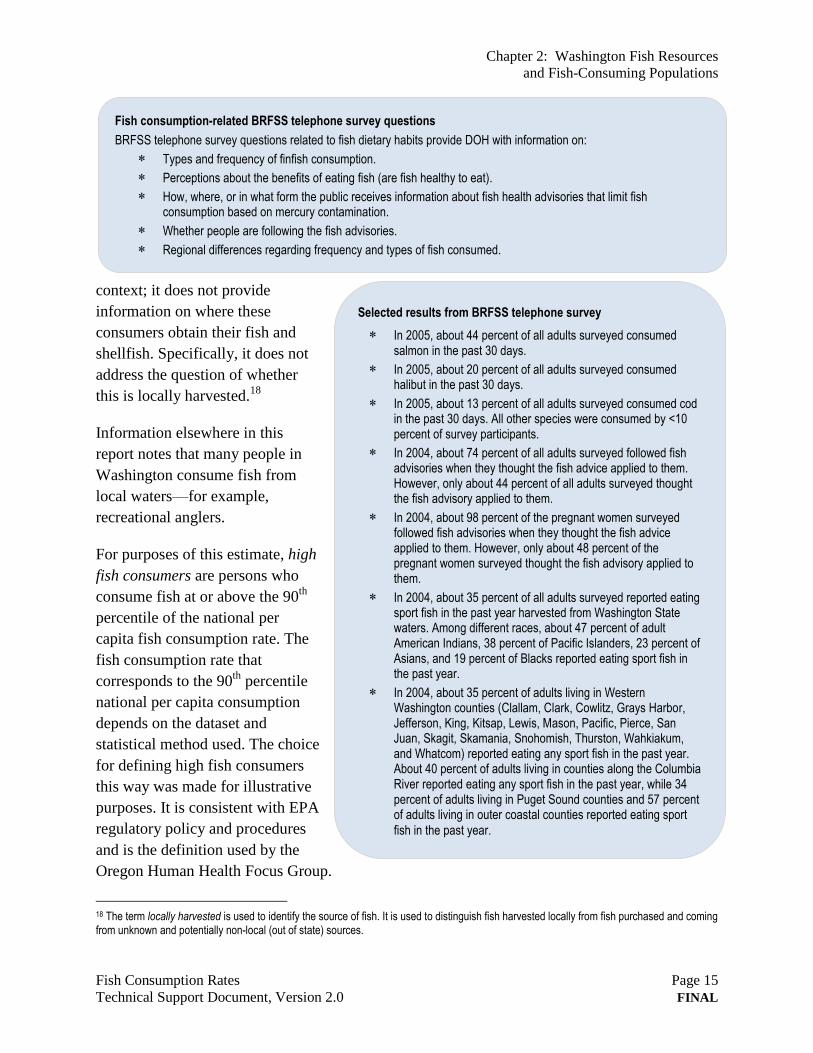
Chapter 2: Washington Fish Resources
and Fish-Consuming Populations
Fish Consumption Rates Page 15
Technical Support Document, Version 2.0 FINAL
Selected results from BRFSS telephone survey
In 2005, about 44 percent of all adults surveyed consumed salmon in the past 30 days.
In 2005, about 20 percent of all adults surveyed consumed halibut in the past 30 days.
In 2005, about 13 percent of all adults surveyed consumed cod in the past 30 days. All other species were consumed by <10 percent of survey participants.
In 2004, about 74 percent of all adults surveyed followed fish advisories when they thought the fish advice applied to them. However, only about 44 percent of all adults surveyed thought the fish advisory applied to them.
In 2004, about 98 percent of the pregnant women surveyed followed fish advisories when they thought the fish advice applied to them. However, only about 48 percent of the pregnant women surveyed thought the fish advisory applied to them.
In 2004, about 35 percent of all adults surveyed reported eating sport fish in the past year harvested from Washington State waters. Among different races, about 47 percent of adult American Indians, 38 percent of Pacific Islanders, 23 percent of Asians, and 19 percent of Blacks reported eating sport fish in the past year.
In 2004, about 35 percent of adults living in Western Washington counties (Clallam, Clark, Cowlitz, Grays Harbor, Jefferson, King, Kitsap, Lewis, Mason, Pacific, Pierce, San Juan, Skagit, Skamania, Snohomish, Thurston, Wahkiakum, and Whatcom) reported eating any sport fish in the past year. About 40 percent of adults living in counties along the Columbia River reported eating any sport fish in the past year, while 34 percent of adults living in Puget Sound counties and 57 percent of adults living in outer coastal counties reported eating sport
fish in the past year.
Fish consumption-related BRFSS telephone survey questions
BRFSS telephone survey questions related to fish dietary habits provide DOH with information on:
Types and frequency of finfish consumption.
Perceptions about the benefits of eating fish (are fish healthy to eat).
How, where, or in what form the public receives information about fish health advisories that limit fish consumption based on mercury contamination.
Whether people are following the fish advisories.
Regional differences regarding frequency and types of fish consumed.
context; it does not provide
information on where these
consumers obtain their fish and
shellfish. Specifically, it does not
address the question of whether
this is locally harvested.18
Information elsewhere in this
report notes that many people in
Washington consume fish from
local waters—for example,
recreational anglers.
For purposes of this estimate, high
fish consumers are persons who
consume fish at or above the 90th
percentile of the national per
capita fish consumption rate. The
fish consumption rate that
corresponds to the 90th
percentile
national per capita consumption
depends on the dataset and
statistical method used. The choice
for defining high fish consumers
this way was made for illustrative
purposes. It is consistent with EPA
regulatory policy and procedures
and is the definition used by the
Oregon Human Health Focus Group.
18 The term locally harvested is used to identify the source of fish. It is used to distinguish fish harvested locally from fish purchased and coming from unknown and potentially non-local (out of state) sources.
Chapter 2: Washington Fish Resources
and Fish-Consuming Populations
Page 16 Fish Consumption Rates
FINAL Technical Support Document, Version 2.0
Based on EPA’s Estimated Per Capita Fish Consumption in the United States, the 90th
percentile
of the estimated national fish consumption rate for adult fish consumers only corresponds to 250
g/day (U.S. EPA, 2002a).19
(250 grams is approximately 0.55 pound or 8.8 ounces.) This value is
used to define high fish-consuming adults in this Technical Support Document. (See Chapter 6
for a discussion of per capita vs. consumer-only fish consumption rates.)
Ecology has also evaluated national fish dietary information using data from the U.S.
Department of Agriculture’s National Health and Nutrition Examination Survey (NHANES),
2003–2006. This analysis is discussed in Chapter 4. Based on this evaluation, the 90th
percentile
of the estimated national per capita fish consumption for adult consumers is in the range of 42.5
g/day to 128 g/day, depending on the statistical method used.
Ecology estimates that between approximately 140,000 and 380,000 Washington adults are high
fish consumers (Table 7). Based on OFM population projections, this number could increase by
27 percent over the next 20 years.
2.3.3 Assumptions
This estimate is based on a number of assumptions that Ecology believes to be reasonable:
Between approximately 1.4 million and 3.8 million Washington adults consume some
amount of fish on a regular basis. As described in the previous sections, this range is
based on current population data and estimates indicating that between 28 and 74 percent
of Washington adults regularly consume fish.20
High fish consumers are defined as people who consume more than the 90th
percentile
estimate of finfish and/or shellfish per day.21
The 90th
percentile of the fish consumption
distribution may be based on national data as evaluated by EPA in 2002 or by Ecology in
2012 using the 2003–2006 NHANES data. Estimates of adult fish consumption rates vary
depending on the statistical methodology used to evaluate the data.
The dietary habits and patterns for Washington fish consumers are similar to those
reported for the United States fish consumers.22
19 Corresponds to the 90th percentile intake of finfish and shellfish for adult consumers only, based on uncooked fish weight. See U.S. EPA, 2002a, Section 5.2.1.1, Table 4.
20 The 2003 – 2006 NHANES dietary information provides reasonably comparable low end percent estimates of fish consumers as evaluated in EPA, 2002, and Polissar et al., 2012.
21 Unless otherwise noted, in this document the term fish consumption rate refers to consumption of both finfish and shellfish.
22 This assumption is discussed further in the conclusions to this chapter.
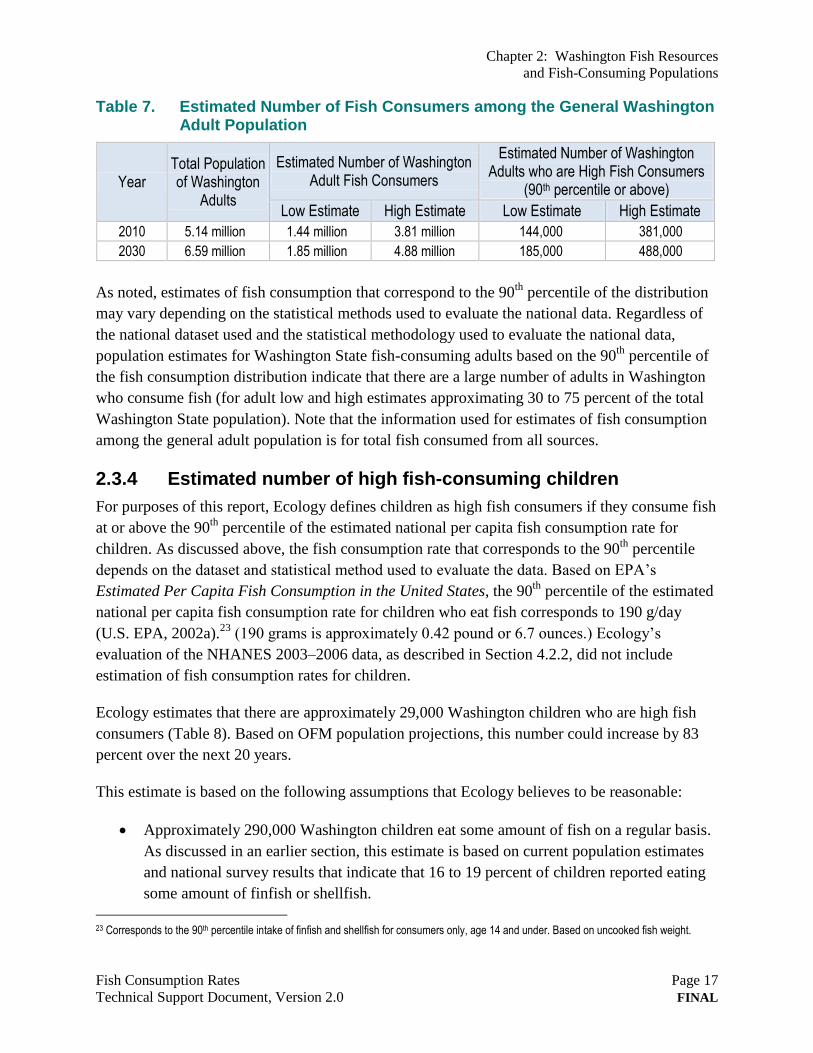
Chapter 2: Washington Fish Resources
and Fish-Consuming Populations
Fish Consumption Rates Page 17
Technical Support Document, Version 2.0 FINAL
Table 7. Estimated Number of Fish Consumers among the General Washington Adult Population
Year Total Population of Washington
Adults
Estimated Number of Washington Adult Fish Consumers
Estimated Number of Washington Adults who are High Fish Consumers
(90th percentile or above)
Low Estimate High Estimate Low Estimate High Estimate
2010 5.14 million 1.44 million 3.81 million 144,000 381,000
2030 6.59 million 1.85 million 4.88 million 185,000 488,000
As noted, estimates of fish consumption that correspond to the 90th
percentile of the distribution
may vary depending on the statistical methods used to evaluate the national data. Regardless of
the national dataset used and the statistical methodology used to evaluate the national data,
population estimates for Washington State fish-consuming adults based on the 90th
percentile of
the fish consumption distribution indicate that there are a large number of adults in Washington
who consume fish (for adult low and high estimates approximating 30 to 75 percent of the total
Washington State population). Note that the information used for estimates of fish consumption
among the general adult population is for total fish consumed from all sources.
2.3.4 Estimated number of high fish-consuming children
For purposes of this report, Ecology defines children as high fish consumers if they consume fish
at or above the 90th
percentile of the estimated national per capita fish consumption rate for
children. As discussed above, the fish consumption rate that corresponds to the 90th
percentile
depends on the dataset and statistical method used to evaluate the data. Based on EPA’s
Estimated Per Capita Fish Consumption in the United States, the 90th
percentile of the estimated
national per capita fish consumption rate for children who eat fish corresponds to 190 g/day
(U.S. EPA, 2002a).23
(190 grams is approximately 0.42 pound or 6.7 ounces.) Ecology’s
evaluation of the NHANES 2003–2006 data, as described in Section 4.2.2, did not include
estimation of fish consumption rates for children.
Ecology estimates that there are approximately 29,000 Washington children who are high fish
consumers (Table 8). Based on OFM population projections, this number could increase by 83
percent over the next 20 years.
This estimate is based on the following assumptions that Ecology believes to be reasonable:
Approximately 290,000 Washington children eat some amount of fish on a regular basis.
As discussed in an earlier section, this estimate is based on current population estimates
and national survey results that indicate that 16 to 19 percent of children reported eating
some amount of finfish or shellfish.
23 Corresponds to the 90th percentile intake of finfish and shellfish for consumers only, age 14 and under. Based on uncooked fish weight.
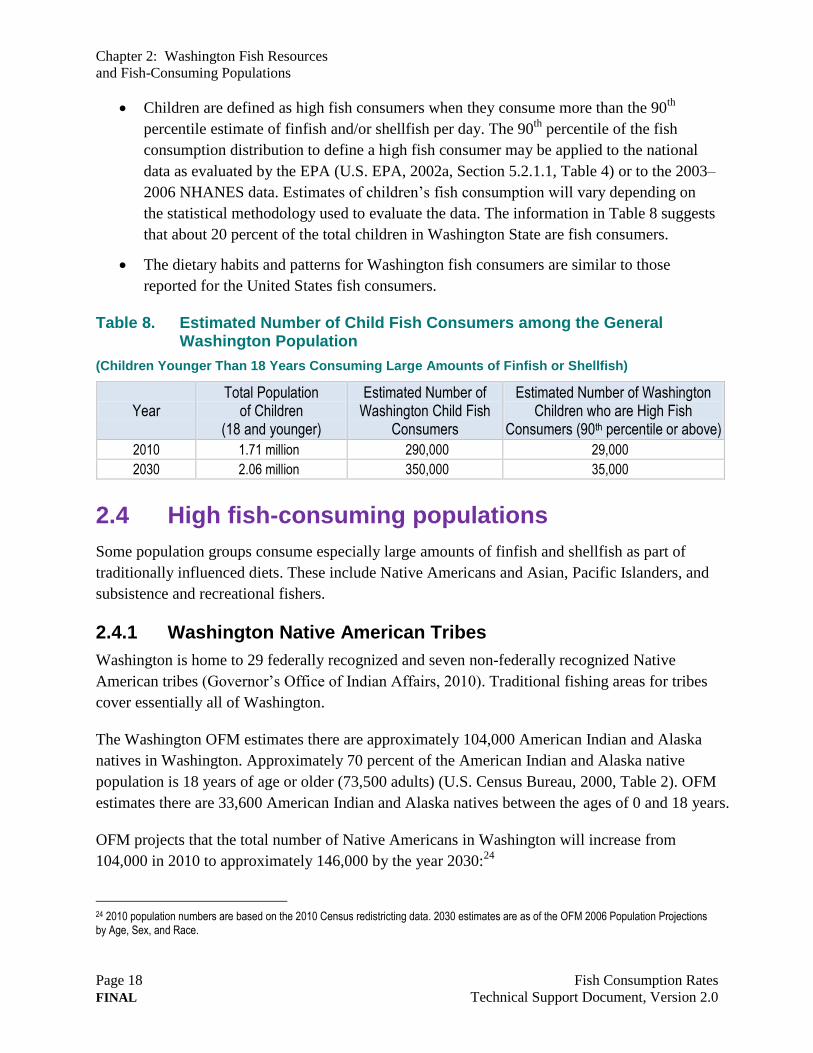
Chapter 2: Washington Fish Resources
and Fish-Consuming Populations
Page 18 Fish Consumption Rates
FINAL Technical Support Document, Version 2.0
Children are defined as high fish consumers when they consume more than the 90th
percentile estimate of finfish and/or shellfish per day. The 90th
percentile of the fish
consumption distribution to define a high fish consumer may be applied to the national
data as evaluated by the EPA (U.S. EPA, 2002a, Section 5.2.1.1, Table 4) or to the 2003–
2006 NHANES data. Estimates of children’s fish consumption will vary depending on
the statistical methodology used to evaluate the data. The information in Table 8 suggests
that about 20 percent of the total children in Washington State are fish consumers.
The dietary habits and patterns for Washington fish consumers are similar to those
reported for the United States fish consumers.
Table 8. Estimated Number of Child Fish Consumers among the General Washington Population
(Children Younger Than 18 Years Consuming Large Amounts of Finfish or Shellfish)
Year Total Population
of Children (18 and younger)
Estimated Number of Washington Child Fish
Consumers
Estimated Number of Washington Children who are High Fish
Consumers (90th percentile or above)
2010 1.71 million 290,000 29,000
2030 2.06 million 350,000 35,000
2.4 High fish-consuming populations
Some population groups consume especially large amounts of finfish and shellfish as part of
traditionally influenced diets. These include Native Americans and Asian, Pacific Islanders, and
subsistence and recreational fishers.
2.4.1 Washington Native American Tribes
Washington is home to 29 federally recognized and seven non-federally recognized Native
American tribes (Governor’s Office of Indian Affairs, 2010). Traditional fishing areas for tribes
cover essentially all of Washington.
The Washington OFM estimates there are approximately 104,000 American Indian and Alaska
natives in Washington. Approximately 70 percent of the American Indian and Alaska native
population is 18 years of age or older (73,500 adults) (U.S. Census Bureau, 2000, Table 2). OFM
estimates there are 33,600 American Indian and Alaska natives between the ages of 0 and 18 years.
OFM projects that the total number of Native Americans in Washington will increase from
104,000 in 2010 to approximately 146,000 by the year 2030:24
24 2010 population numbers are based on the 2010 Census redistricting data. 2030 estimates are as of the OFM 2006 Population Projections by Age, Sex, and Race.
Chapter 2: Washington Fish Resources
and Fish-Consuming Populations
Fish Consumption Rates Page 19
Technical Support Document, Version 2.0 FINAL
Population of American Indian and Alaska natives in Washington 104,000
Adults (70 percent of population is estimated at over 18) 73,500
Children (between 0 and 18 years of age) 33,600
2030 Population Projection 146,000
2.4.2 Asian and Pacific Islanders
Asian and Pacific Islander (API) populations include Native Hawaiians and peoples from other
Pacific islands. The Washington OFM estimates there are approximately 522,000 Asian and
Pacific Islanders currently residing in Washington (U.S. Census Bureau, 2000, Table 2). Finfish
and shellfish consumption among this population in Washington has been documented.
Approximately 75 percent of the current API population is 18 years of age or older (405,000
adults) (Sechena et al., 1999). There are 138,000 Asian and Pacific Islanders between the ages of
0 and 18 years.
OFM projects that the total number of Asian and Pacific Islanders in Washington will increase
from 522,000 in 2010 to approximately 825,000 by the year 2030:25
Population of Asian and Pacific Islanders in Washington 522,000
Adults (75 percent of the population is estimated at over 18) 405,000
Children (between 0 and 18 years of age) 138,000
2030 API Population Projection 825,000
2.4.3 Subsistence and recreational fishers
Approximately 824,000 people fished in Washington State during 2006; of these, 725,000 were
Washington residents and 99,000 were nonresidents. Washington residents fished a total of 8.5
million days in 2006, an average of 12 days per angler (U.S. Department of the Interior and U.S.
Department of Commerce, 2008).
Washington is home to some number of persons engaged in a subsistence lifestyle.
Considerations related to subsistence fishing for Native American tribes in the Pacific Northwest
have been identified (Donatuto and Harper, 2008; Harper and Harris, 2008). However, due to a
lack of data, at this time Ecology is unable to estimate the number of subsistence fishers in
Washington.
25 2010 population numbers are based on the 2010 Census redistricting data. 2030 estimates are as of the OFM 2006 Population Projections by Age, Sex, and Race.
Chapter 2: Washington Fish Resources
and Fish-Consuming Populations
Page 20 Fish Consumption Rates
FINAL Technical Support Document, Version 2.0
2.5 Sources of Fish Consumed
Fish consumption rate tabulations in this technical support document are derived from national
fish dietary data and fish dietary surveys from the Pacific Northwest. The tribal fish dietary
surveys from the Pacific Northwest provide information about the types of fish that are locally
harvested and consumed. These tribal fish dietary surveys document locally harvested fish from
usual and accustomed tribal treaty areas throughout the Columbia River basin and throughout
Puget Sound.
For example, the 1994 Columbia River Inter-Tribal Fish Consumption Survey reflects fish
harvest rates throughout the Columbia River basin for over 80% of the respondents.
Independent and separate documentation from three different Washington State agencies
(WDFW, DOH, and Ecology) document the harvest and consumption of local abundant aquatic
resources, including finfish and shellfish. For example, WDFW has documented the amounts of
different shellfish harvested from various regions in Washington State (see Table 5).
Data gaps remain regarding exact locations where fish and shellfish are harvested in Washington
State, and information about their commercial availability in state-wide grocery stores and local
food markets.
2.6 Summary
From current demographic information, Ecology has estimated the total number of Washington
fish consumers. Ecology reached its estimate after working with OFM to use census data and
applying national and Washington fish consumption rate estimates to the general Washington
population. There may be some variation in the adult and child fish-consuming population
estimates for Washington State depending on the dataset and statistical methods used to evaluate
national fish dietary information. Adult and child fish-consuming population estimates presented
in this report are based on a similar analysis conducted by the 2008 Oregon DEQ Human Health
Focus Group Report (Oregon DEQ, 2008).
Ecology believes that the population estimates for Washington State adult and child fish
consumers provided in this report are reasonable estimates that help gauge and approximate the
number of fish consumers. There are a large number of adults and children in Washington State
who routinely consume finfish and shellfish.
According to Ecology’s analysis, there are between 1.4 and 3.8 million Washington adults
(18 years of age or older) who are fish consumers.26
The number of adult fish consumers is
26 This includes a large number of recreational anglers. For example, the Washington Department of Fish and Wildlife estimates there were 824,000 recreational anglers (both finfishing and shellfishing) in Washington in 2006.
Chapter 2: Washington Fish Resources
and Fish-Consuming Populations
Fish Consumption Rates Page 21
Technical Support Document, Version 2.0 FINAL
projected to increase by up to 27 percent as Washington’s population grows over the next
20 years.
Ecology estimates that approximately 290,000 Washington children (0 to 18 years of age)
consume fish. It should be noted that this estimate was developed using national survey data for
the general population. Studies have shown that people living in coastal states tend to consume
finfish and shellfish at a higher frequency and higher rates than inland states (Moya, 2004).27
Ecology is not aware of Washington surveys that have examined child fish consumption
frequency for the general population. The number of Washington children who eat some type of
fish is also projected to increase as Washington’s population grows over the next 20 years.
For this report, Ecology defined high fish consumers as all Washington adults and children who
consume finfish and/or shellfish at or above the 90th
percentile estimates from surveys of
national per capita consumption. Based on data presented by the EPA (U.S. EPA, 2002a), these
estimates correspond to 250 g/day and 190 g/day for adults and children, respectively.
Ecology estimates that there are between 140,000 and 380,000 Washington adults who
are high fish consumers. Ecology believes that the high end of this range provides a
reasonable estimate of the number of high fish consumers in Washington. The high end
of the range is based on information collected by the Department of Health on fish
consumption habits of Washington residents.
Ecology estimates that there are approximately 29,000 Washington children who are high
fish consumers.
Certain population groups, including Native Americans and Asian and Pacific Islanders,
consume large amounts of finfish and shellfish.28
According to OFM estimates, there are approximately 104,000 Native American and
Alaska natives in Washington.
According to OFM estimates, approximately 522,000 Asian and Pacific Islanders live in
Washington.
In summary, considerable quantities of finfish and shellfish are harvested for consumption in
Washington, both recreationally and commercially. Many Washington residents harvest and
presumably consume finfish and shellfish from local waters (WDFW, 2008a, 2012). High fish
consumers include several population groups known to consume larger amounts of finfish and
shellfish than the general population.
27 National fish consumption studies are typically carried out over a broad geographical area, including multiple states. Consequently, national studies may underestimate the rates and frequencies for states like Washington.
28 Chapter 4 discusses further the consumption rates, patterns, and species consumed by Native Americans and Asian and Pacific Islanders.
Chapter 2: Washington Fish Resources
and Fish-Consuming Populations
Page 22 Fish Consumption Rates
FINAL Technical Support Document, Version 2.0
This page purposely left blank for duplicate printing.
Chapter 3: Methodology for Assessing
Fish Consumption Rate Information
Fish Consumption Rates Page 23
Technical Support Document, Version 2.0 FINAL
Chapter 3: Methodology for Assessing Fish Consumption Rate Information
3.1 Introduction
Researchers use a variety of methods for estimating the amount of finfish and shellfish
consumed. Surveys are generally considered to be the best approach for collecting data;
however, a number of design features determine whether a particular survey will provide a
technically defensible basis for agency decision making. Technical defensibility means that the
survey stands up to technical and scientific scrutiny and provides a solid technical basis for
regulatory decisions. Among other factors, a survey that is technically defensible: (1) uses sound
scientific methods and survey methods that have been peer reviewed and tested; (2) employs
interviewers who are trained and/or questionnaires that follow accepted guidance; (3) presents
clear reporting and conclusions that are supported by the data; (4) studies sample populations
that represent the population of concern and consider temporal, geographic, and cultural aspects
of fish consumption; (5) uses current information; and (6) provides results that can be used to
support regulatory decision making. The measures of technical defensibility are described in
more detail at the end of this chapter.
Different surveys are designed for different purposes. This chapter reviews the design features of
various methods for collecting information about finfish and shellfish consumption. The purpose
of this review is to identify the specific factors that Ecology considered when evaluating fish
consumption surveys.
Regional-specific dietary information about people who eat finfish and shellfish is useful in
providing a weight of evidence for evaluating the fish-consuming habits and patterns of fish
consumers in Washington. Fish dietary information from the Pacific Northwest indicates that
Washington State’s fish-consuming populations eat more fish than what is reflected in the rates
used to establish regulatory standards.
To provide more information when making risk management decisions, Ecology understands
that it would be desirable to have statewide fish dietary data and information regarding the fish
consumption habits and patterns of all Washington State fish consumers. However, in the
absence of a statewide fish dietary survey, Ecology believes that the fish dietary information
from Pacific Northwest fish-consuming populations such as tribal populations is useful and
relevant for making sound risk management decisions that protect Washington State’s residents.
Ecology believes that there is sufficient credible fish dietary information to provide fish
consumption estimates for fish-consuming populations in Washington State. If the assumption is
made that the fish consumption habits and patterns among the Washington State general fish-
consuming population are similar to those of the U.S. general population of fish consumers, then
Chapter 3: Methodology for Assessing
Fish Consumption Rate Information
Page 24 Fish Consumption Rates
FINAL Technical Support Document, Version 2.0
the fish dietary estimates for the U.S. general population may be used to provide estimates for
the Washington general population. Ecology notes that differences between the Washington
population and the U.S. general population do exist: for example, status as a coastal state has the
possibility of affecting fish consumption patterns.
The Pacific Northwest surveys have all followed a similar design: dietary recall complemented
by food frequency questionnaires; they have been scientifically peer-reviewed (CRITFC, 2012;
University of Washington, 2012), and have included reviews of study design and analysis of the
results of the dietary surveys. The surveys have been considered and utilized by EPA on both a
regional and national basis for environmental regulation as well as by the State of Oregon. These
fish dietary surveys, together with other dietary information, provide a reasonable and
technically sound basis to estimate the fish consumption habits and patterns for Washington
State fish consumers.
This chapter is organized into three sections:
Surveys and other approaches used to estimate fish consumption. This section reviews
the various methods that have been used or are available for collecting data about dietary
habits and patterns surrounding fish consumption.
Factors to consider when evaluating survey results. This section identifies key design or
implementation features that impact the quality of individual surveys.
Establishing technical defensibility. This section describes the methodology Ecology
used in assessing the technical defensibility of fish consumption survey information and
results. The methodology explained here is then applied in the next chapter to surveys
pertinent to Washington.
3.2 Surveys and other approaches used to estimate fish consumption
The various approaches to collecting information on finfish/shellfish dietary habits and patterns
include telephone surveys, mail surveys, food diaries, personal interviews, and creel surveys
(U.S. EPA, 1992). Each method has certain limitations, including bias, error, and variability
(U.S. EPA, 1992; Moya et al., 2008). Ecology thoroughly examined the methodology used in
fish consumption surveys. To determine quality and ensure utility for each survey examined,
Ecology evaluated experimental design, target population, sample size, location, and potential
bias (Ecology, 1999). This analysis aids general understanding and identifies the limitations and
utility of the available data.
Fish dietary survey methodologies and limitations, as described in this report, are consistent with
EPA guidance for conducting fish consumption surveys (U.S. EPA, 1992, 1998). Another
approach, a dietary market basket survey, is used by EPA’s Office of Pesticide Programs to
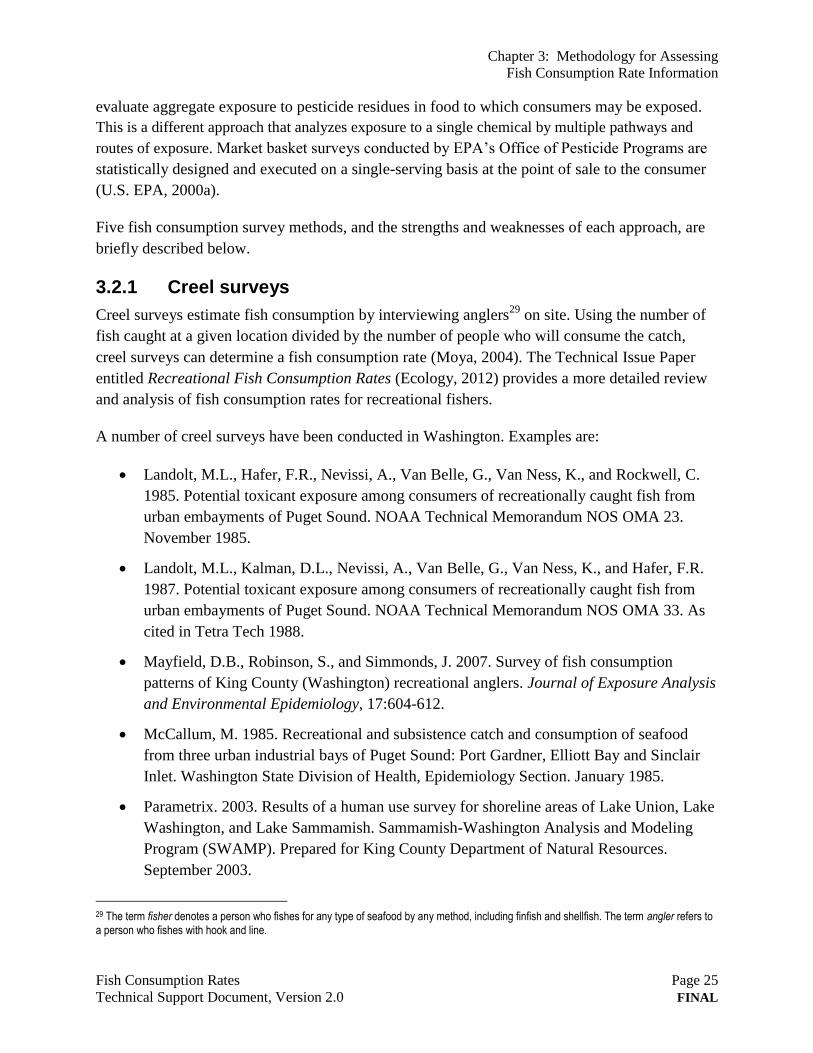
Chapter 3: Methodology for Assessing
Fish Consumption Rate Information
Fish Consumption Rates Page 25
Technical Support Document, Version 2.0 FINAL
evaluate aggregate exposure to pesticide residues in food to which consumers may be exposed.
This is a different approach that analyzes exposure to a single chemical by multiple pathways and
routes of exposure. Market basket surveys conducted by EPA’s Office of Pesticide Programs are
statistically designed and executed on a single-serving basis at the point of sale to the consumer
(U.S. EPA, 2000a).
Five fish consumption survey methods, and the strengths and weaknesses of each approach, are
briefly described below.
3.2.1 Creel surveys
Creel surveys estimate fish consumption by interviewing anglers29
on site. Using the number of
fish caught at a given location divided by the number of people who will consume the catch,
creel surveys can determine a fish consumption rate (Moya, 2004). The Technical Issue Paper
entitled Recreational Fish Consumption Rates (Ecology, 2012) provides a more detailed review
and analysis of fish consumption rates for recreational fishers.
A number of creel surveys have been conducted in Washington. Examples are:
Landolt, M.L., Hafer, F.R., Nevissi, A., Van Belle, G., Van Ness, K., and Rockwell, C.
1985. Potential toxicant exposure among consumers of recreationally caught fish from
urban embayments of Puget Sound. NOAA Technical Memorandum NOS OMA 23.
November 1985.
Landolt, M.L., Kalman, D.L., Nevissi, A., Van Belle, G., Van Ness, K., and Hafer, F.R.
1987. Potential toxicant exposure among consumers of recreationally caught fish from
urban embayments of Puget Sound. NOAA Technical Memorandum NOS OMA 33. As
cited in Tetra Tech 1988.
Mayfield, D.B., Robinson, S., and Simmonds, J. 2007. Survey of fish consumption
patterns of King County (Washington) recreational anglers. Journal of Exposure Analysis
and Environmental Epidemiology, 17:604-612.
McCallum, M. 1985. Recreational and subsistence catch and consumption of seafood
from three urban industrial bays of Puget Sound: Port Gardner, Elliott Bay and Sinclair
Inlet. Washington State Division of Health, Epidemiology Section. January 1985.
Parametrix. 2003. Results of a human use survey for shoreline areas of Lake Union, Lake
Washington, and Lake Sammamish. Sammamish-Washington Analysis and Modeling
Program (SWAMP). Prepared for King County Department of Natural Resources.
September 2003.
29 The term fisher denotes a person who fishes for any type of seafood by any method, including finfish and shellfish. The term angler refers to a person who fishes with hook and line.
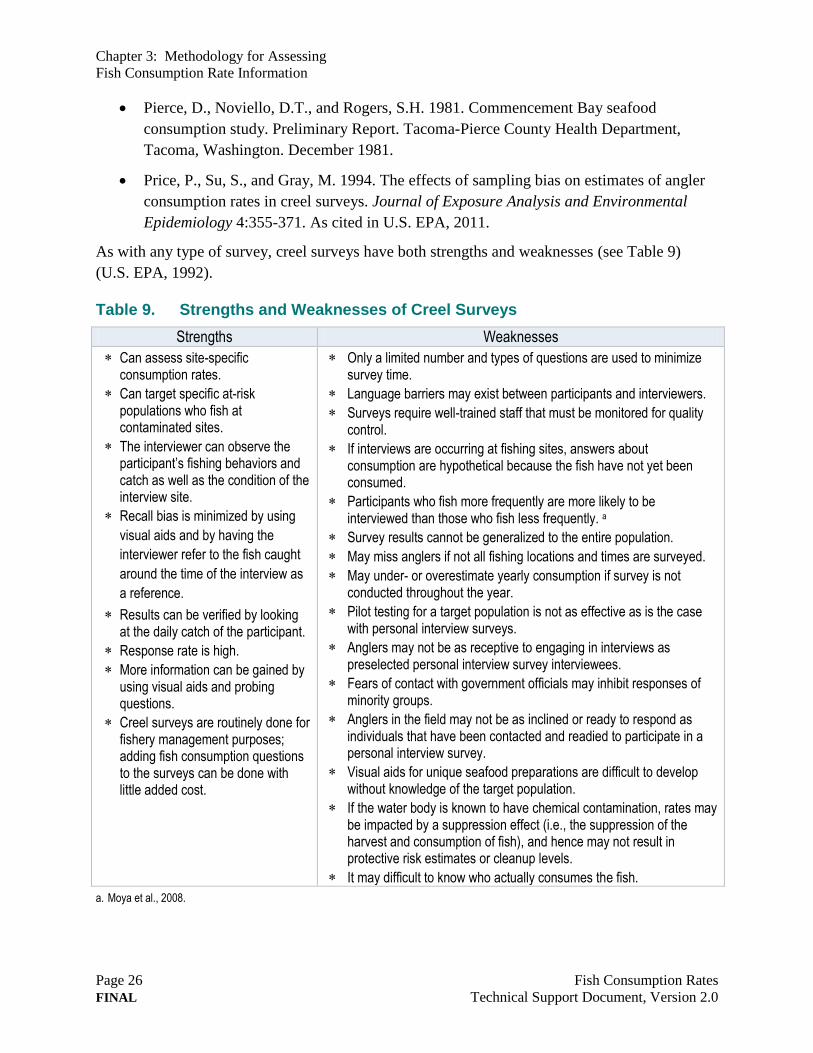
Chapter 3: Methodology for Assessing
Fish Consumption Rate Information
Page 26 Fish Consumption Rates
FINAL Technical Support Document, Version 2.0
Pierce, D., Noviello, D.T., and Rogers, S.H. 1981. Commencement Bay seafood
consumption study. Preliminary Report. Tacoma-Pierce County Health Department,
Tacoma, Washington. December 1981.
Price, P., Su, S., and Gray, M. 1994. The effects of sampling bias on estimates of angler
consumption rates in creel surveys. Journal of Exposure Analysis and Environmental
Epidemiology 4:355-371. As cited in U.S. EPA, 2011.
As with any type of survey, creel surveys have both strengths and weaknesses (see Table 9)
(U.S. EPA, 1992).
Table 9. Strengths and Weaknesses of Creel Surveys
Strengths Weaknesses
Can assess site-specific consumption rates.
Can target specific at-risk populations who fish at contaminated sites.
The interviewer can observe the participant’s fishing behaviors and catch as well as the condition of the interview site.
Recall bias is minimized by using
visual aids and by having the
interviewer refer to the fish caught
around the time of the interview as
a reference.
Results can be verified by looking at the daily catch of the participant.
Response rate is high.
More information can be gained by using visual aids and probing questions.
Creel surveys are routinely done for fishery management purposes; adding fish consumption questions to the surveys can be done with little added cost.
Only a limited number and types of questions are used to minimize survey time.
Language barriers may exist between participants and interviewers.
Surveys require well-trained staff that must be monitored for quality control.
If interviews are occurring at fishing sites, answers about consumption are hypothetical because the fish have not yet been consumed.
Participants who fish more frequently are more likely to be interviewed than those who fish less frequently. a
Survey results cannot be generalized to the entire population.
May miss anglers if not all fishing locations and times are surveyed.
May under- or overestimate yearly consumption if survey is not conducted throughout the year.
Pilot testing for a target population is not as effective as is the case with personal interview surveys.
Anglers may not be as receptive to engaging in interviews as preselected personal interview survey interviewees.
Fears of contact with government officials may inhibit responses of minority groups.
Anglers in the field may not be as inclined or ready to respond as individuals that have been contacted and readied to participate in a personal interview survey.
Visual aids for unique seafood preparations are difficult to develop without knowledge of the target population.
If the water body is known to have chemical contamination, rates may be impacted by a suppression effect (i.e., the suppression of the harvest and consumption of fish), and hence may not result in protective risk estimates or cleanup levels.
It may difficult to know who actually consumes the fish.
a. Moya et al., 2008.
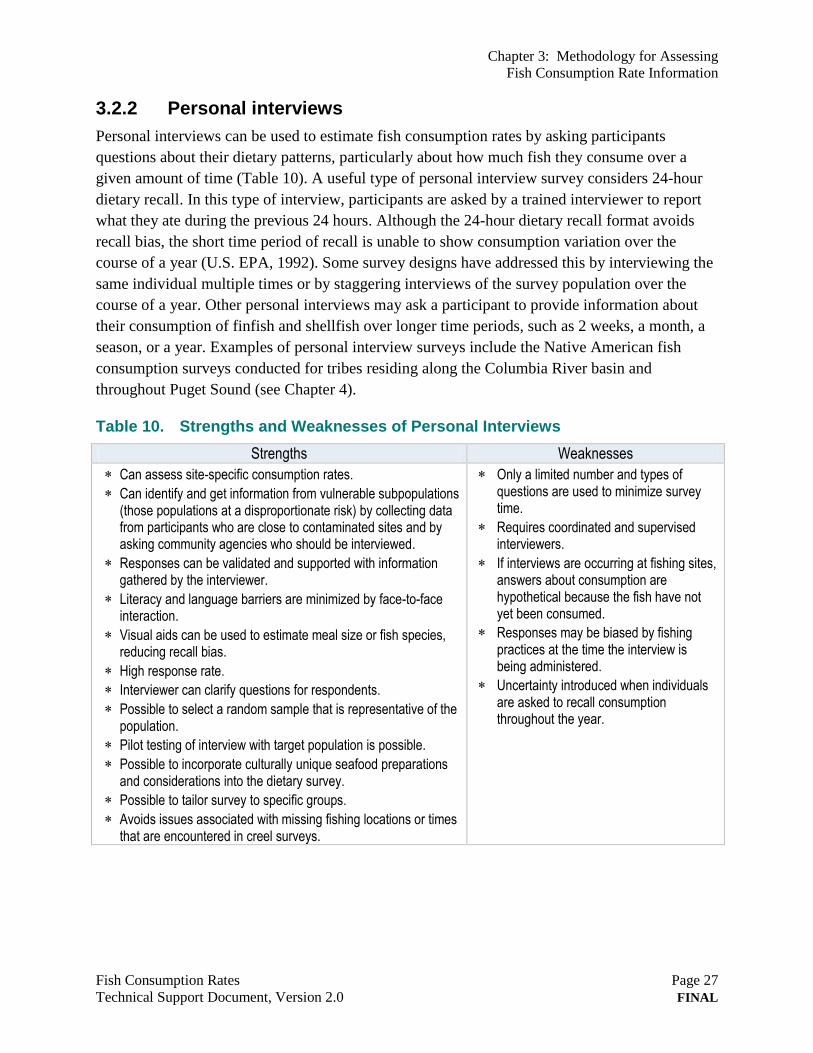
Chapter 3: Methodology for Assessing
Fish Consumption Rate Information
Fish Consumption Rates Page 27
Technical Support Document, Version 2.0 FINAL
3.2.2 Personal interviews
Personal interviews can be used to estimate fish consumption rates by asking participants
questions about their dietary patterns, particularly about how much fish they consume over a
given amount of time (Table 10). A useful type of personal interview survey considers 24-hour
dietary recall. In this type of interview, participants are asked by a trained interviewer to report
what they ate during the previous 24 hours. Although the 24-hour dietary recall format avoids
recall bias, the short time period of recall is unable to show consumption variation over the
course of a year (U.S. EPA, 1992). Some survey designs have addressed this by interviewing the
same individual multiple times or by staggering interviews of the survey population over the
course of a year. Other personal interviews may ask a participant to provide information about
their consumption of finfish and shellfish over longer time periods, such as 2 weeks, a month, a
season, or a year. Examples of personal interview surveys include the Native American fish
consumption surveys conducted for tribes residing along the Columbia River basin and
throughout Puget Sound (see Chapter 4).
Table 10. Strengths and Weaknesses of Personal Interviews
Strengths Weaknesses
Can assess site-specific consumption rates.
Can identify and get information from vulnerable subpopulations (those populations at a disproportionate risk) by collecting data from participants who are close to contaminated sites and by asking community agencies who should be interviewed.
Responses can be validated and supported with information gathered by the interviewer.
Literacy and language barriers are minimized by face-to-face interaction.
Visual aids can be used to estimate meal size or fish species, reducing recall bias.
High response rate.
Interviewer can clarify questions for respondents.
Possible to select a random sample that is representative of the population.
Pilot testing of interview with target population is possible.
Possible to incorporate culturally unique seafood preparations and considerations into the dietary survey.
Possible to tailor survey to specific groups.
Avoids issues associated with missing fishing locations or times that are encountered in creel surveys.
Only a limited number and types of questions are used to minimize survey time.
Requires coordinated and supervised interviewers.
If interviews are occurring at fishing sites, answers about consumption are hypothetical because the fish have not yet been consumed.
Responses may be biased by fishing practices at the time the interview is being administered.
Uncertainty introduced when individuals are asked to recall consumption throughout the year.
Chapter 3: Methodology for Assessing
Fish Consumption Rate Information
Page 28 Fish Consumption Rates
FINAL Technical Support Document, Version 2.0
3.2.3 Diary surveys
Diary surveys use questionnaires, in the form of logbooks, diaries, or catch cards, to record fish
consumption over time. Information is filled out by the participant ideally at the end of a fishing
day or at the time of consumption, to minimize possible recall bias (Table 11).
The Connecticut Department of Environmental Protection used diary surveys to find out about
fish meals and portion sizes eaten by Connecticut families. The families received the surveys in
the mail (U.S. EPA, 1992; Moya et al., 2008).
Table 11. Strengths and Weaknesses of the Diary Method
Strengths Weaknesses
Can assess site-specific consumption rates.
Information collected over long periods of time.
Less expensive than personal interviews.
Large numbers of participants possible.
Recall bias is reduced.
Visual aids can be used to improve accuracy of answers.
Respondents must be taught how to complete the survey by a trained interviewer.
Participants must be literate.
Participants must be monitored during the study to maintain consistency.
Keeping a dietary record may change a participant’s dietary practices.
Participants may not maintain daily record keeping.
Language barriers may affect how participants are recruited and how their diary responses are interpreted.
Questionnaire design is more complicated than other types of surveys.
3.2.4 Telephone surveys
Telephone interview surveys estimate recent fish consumption or information about recent
fishing trips. Answers are recorded on preprinted questionnaires (Table 12) (U.S. EPA, 1992).
Table 12. Strengths and Weaknesses of Telephone Surveys
Strengths Weaknesses
Can assess region-specific consumption rates.
Can target and identify specific subpopulations of concern.
Less expensive and time-consuming than personal interviews.
High rate of success for completion of interviews.
Sensitive information may be obtained more easily.
Provides immediate response to questions.
Interviewers cannot reach people who do not have phones.
Interviews are limited in scope and length.
Difficult to verify information.
Cannot use visual aids.
Inability to reach people by phone may be of concern for low-income individuals who harvest more fish than more affluent people.
Language barriers may pose limitations.
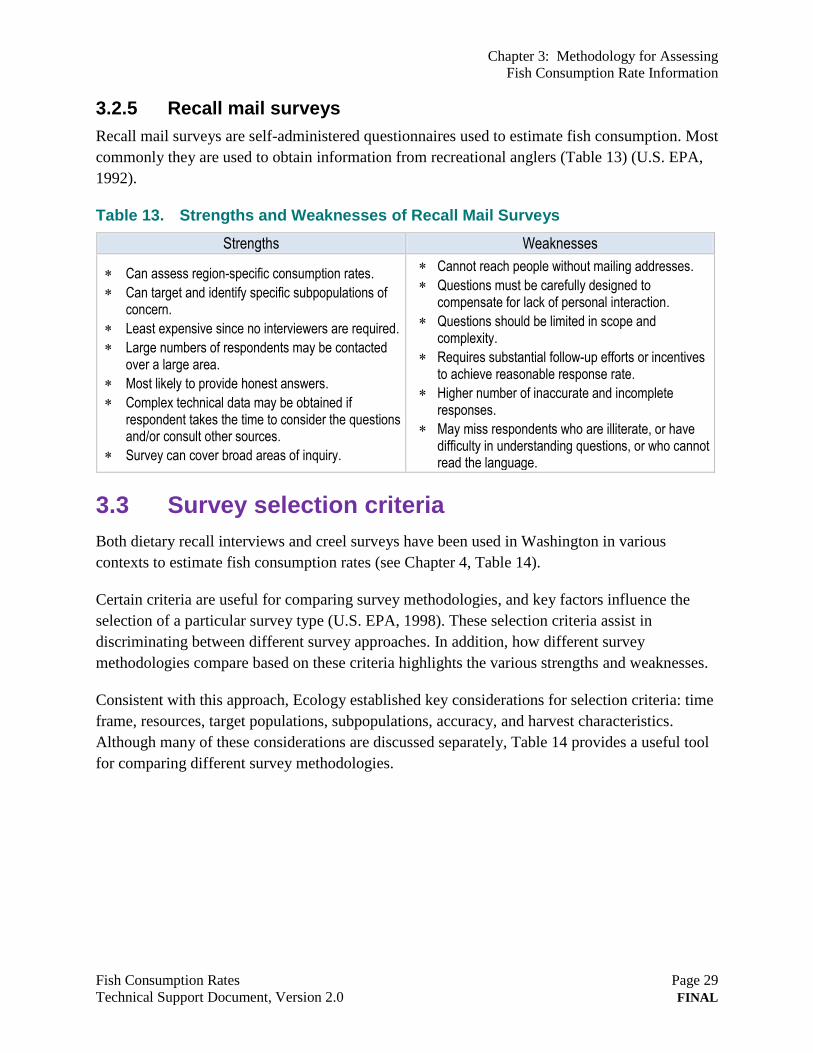
Chapter 3: Methodology for Assessing
Fish Consumption Rate Information
Fish Consumption Rates Page 29
Technical Support Document, Version 2.0 FINAL
3.2.5 Recall mail surveys
Recall mail surveys are self-administered questionnaires used to estimate fish consumption. Most
commonly they are used to obtain information from recreational anglers (Table 13) (U.S. EPA,
1992).
Table 13. Strengths and Weaknesses of Recall Mail Surveys
Strengths Weaknesses
Can assess region-specific consumption rates.
Can target and identify specific subpopulations of concern.
Least expensive since no interviewers are required.
Large numbers of respondents may be contacted over a large area.
Most likely to provide honest answers.
Complex technical data may be obtained if respondent takes the time to consider the questions and/or consult other sources.
Survey can cover broad areas of inquiry.
Cannot reach people without mailing addresses.
Questions must be carefully designed to compensate for lack of personal interaction.
Questions should be limited in scope and complexity.
Requires substantial follow-up efforts or incentives to achieve reasonable response rate.
Higher number of inaccurate and incomplete responses.
May miss respondents who are illiterate, or have difficulty in understanding questions, or who cannot read the language.
3.3 Survey selection criteria
Both dietary recall interviews and creel surveys have been used in Washington in various
contexts to estimate fish consumption rates (see Chapter 4, Table 14).
Certain criteria are useful for comparing survey methodologies, and key factors influence the
selection of a particular survey type (U.S. EPA, 1998). These selection criteria assist in
discriminating between different survey approaches. In addition, how different survey
methodologies compare based on these criteria highlights the various strengths and weaknesses.
Consistent with this approach, Ecology established key considerations for selection criteria: time
frame, resources, target populations, subpopulations, accuracy, and harvest characteristics.
Although many of these considerations are discussed separately, Table 14 provides a useful tool
for comparing different survey methodologies.
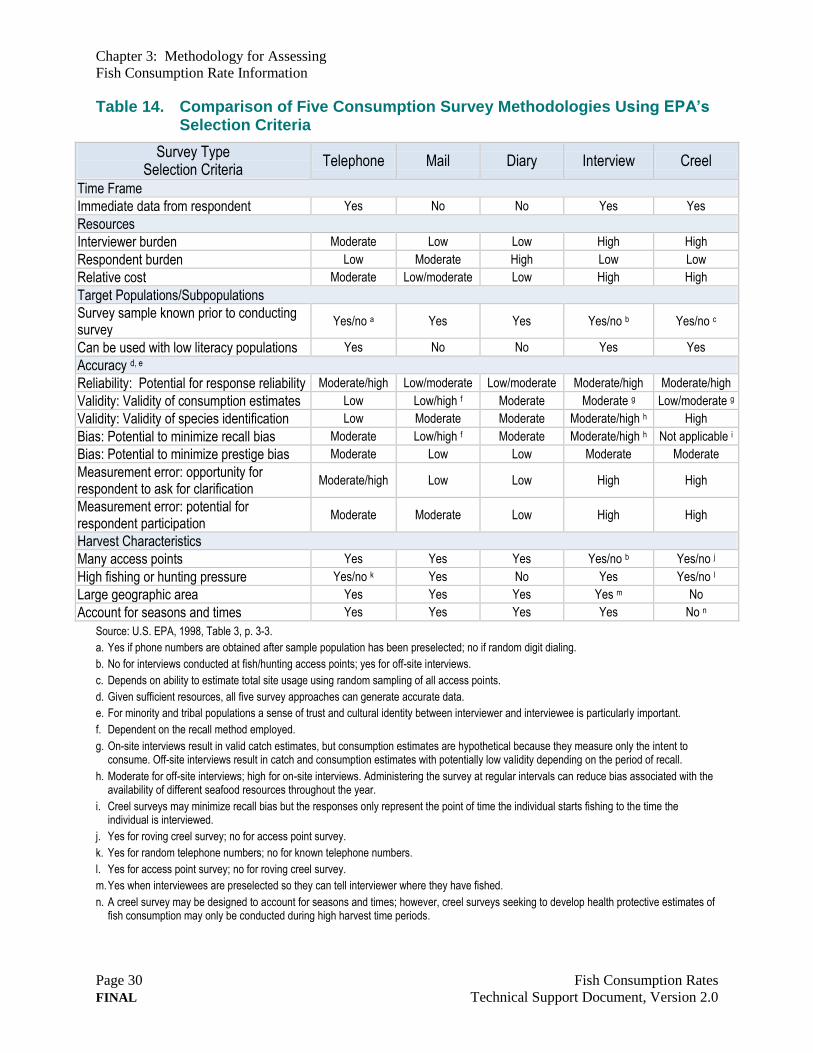
Chapter 3: Methodology for Assessing
Fish Consumption Rate Information
Page 30 Fish Consumption Rates
FINAL Technical Support Document, Version 2.0
Table 14. Comparison of Five Consumption Survey Methodologies Using EPA’s Selection Criteria
Survey Type Selection Criteria
Telephone Mail Diary Interview Creel
Time Frame
Immediate data from respondent Yes No No Yes Yes
Resources
Interviewer burden Moderate Low Low High High
Respondent burden Low Moderate High Low Low
Relative cost Moderate Low/moderate Low High High
Target Populations/Subpopulations
Survey sample known prior to conducting survey
Yes/no a Yes Yes Yes/no b Yes/no c
Can be used with low literacy populations Yes No No Yes Yes
Accuracy d, e
Reliability: Potential for response reliability Moderate/high Low/moderate Low/moderate Moderate/high Moderate/high
Validity: Validity of consumption estimates Low Low/high f Moderate Moderate g Low/moderate g
Validity: Validity of species identification Low Moderate Moderate Moderate/high h High
Bias: Potential to minimize recall bias Moderate Low/high f Moderate Moderate/high h Not applicable i
Bias: Potential to minimize prestige bias Moderate Low Low Moderate Moderate
Measurement error: opportunity for respondent to ask for clarification
Moderate/high Low Low High High
Measurement error: potential for respondent participation
Moderate Moderate Low High High
Harvest Characteristics
Many access points Yes Yes Yes Yes/no b Yes/no j
High fishing or hunting pressure Yes/no k Yes No Yes Yes/no l
Large geographic area Yes Yes Yes Yes m No
Account for seasons and times Yes Yes Yes Yes No n
Source: U.S. EPA, 1998, Table 3, p. 3-3.
a. Yes if phone numbers are obtained after sample population has been preselected; no if random digit dialing.
b. No for interviews conducted at fish/hunting access points; yes for off-site interviews.
c. Depends on ability to estimate total site usage using random sampling of all access points.
d. Given sufficient resources, all five survey approaches can generate accurate data.
e. For minority and tribal populations a sense of trust and cultural identity between interviewer and interviewee is particularly important.
f. Dependent on the recall method employed.
g. On-site interviews result in valid catch estimates, but consumption estimates are hypothetical because they measure only the intent to consume. Off-site interviews result in catch and consumption estimates with potentially low validity depending on the period of recall.
h. Moderate for off-site interviews; high for on-site interviews. Administering the survey at regular intervals can reduce bias associated with the availability of different seafood resources throughout the year.
i. Creel surveys may minimize recall bias but the responses only represent the point of time the individual starts fishing to the time the individual is interviewed.
j. Yes for roving creel survey; no for access point survey.
k. Yes for random telephone numbers; no for known telephone numbers.
l. Yes for access point survey; no for roving creel survey.
m. Yes when interviewees are preselected so they can tell interviewer where they have fished.
n. A creel survey may be designed to account for seasons and times; however, creel surveys seeking to develop health protective estimates of fish consumption may only be conducted during high harvest time periods.
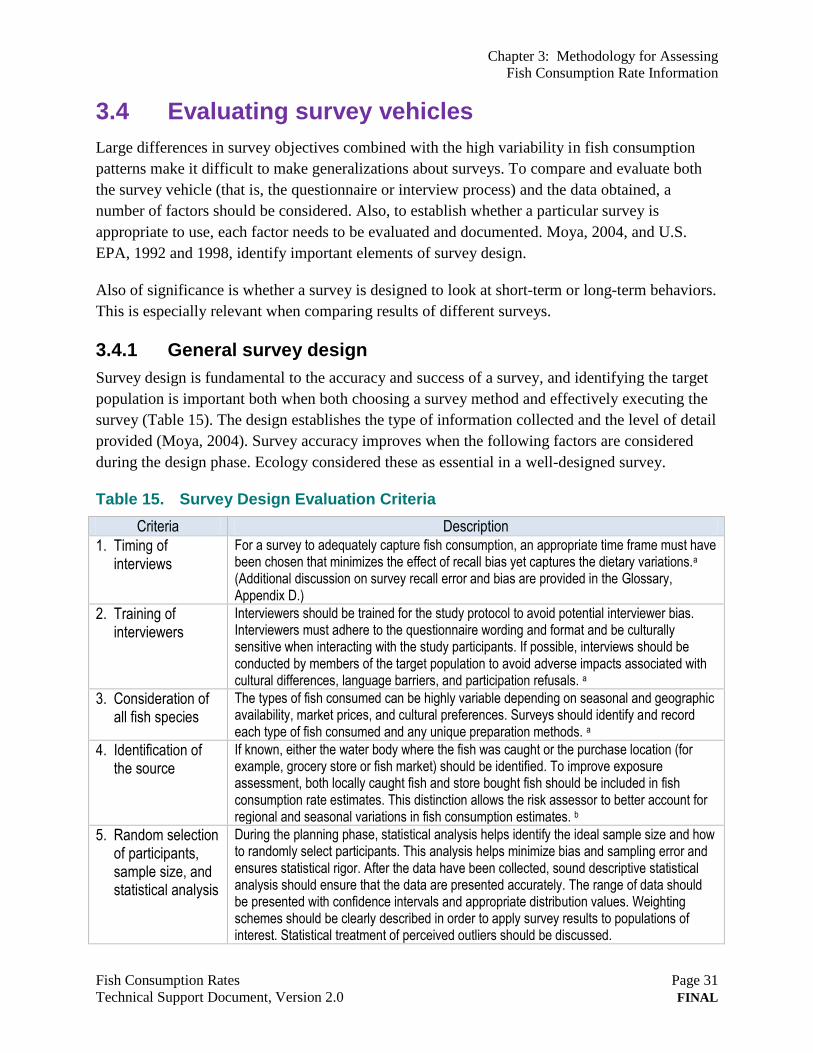
Chapter 3: Methodology for Assessing
Fish Consumption Rate Information
Fish Consumption Rates Page 31
Technical Support Document, Version 2.0 FINAL
3.4 Evaluating survey vehicles
Large differences in survey objectives combined with the high variability in fish consumption
patterns make it difficult to make generalizations about surveys. To compare and evaluate both
the survey vehicle (that is, the questionnaire or interview process) and the data obtained, a
number of factors should be considered. Also, to establish whether a particular survey is
appropriate to use, each factor needs to be evaluated and documented. Moya, 2004, and U.S.
EPA, 1992 and 1998, identify important elements of survey design.
Also of significance is whether a survey is designed to look at short-term or long-term behaviors.
This is especially relevant when comparing results of different surveys.
3.4.1 General survey design
Survey design is fundamental to the accuracy and success of a survey, and identifying the target
population is important both when both choosing a survey method and effectively executing the
survey (Table 15). The design establishes the type of information collected and the level of detail
provided (Moya, 2004). Survey accuracy improves when the following factors are considered
during the design phase. Ecology considered these as essential in a well-designed survey.
Table 15. Survey Design Evaluation Criteria
Criteria Description
1. Timing of interviews
For a survey to adequately capture fish consumption, an appropriate time frame must have been chosen that minimizes the effect of recall bias yet captures the dietary variations.a (Additional discussion on survey recall error and bias are provided in the Glossary, Appendix D.)
2. Training of interviewers
Interviewers should be trained for the study protocol to avoid potential interviewer bias. Interviewers must adhere to the questionnaire wording and format and be culturally sensitive when interacting with the study participants. If possible, interviews should be conducted by members of the target population to avoid adverse impacts associated with cultural differences, language barriers, and participation refusals. a
3. Consideration of all fish species
The types of fish consumed can be highly variable depending on seasonal and geographic availability, market prices, and cultural preferences. Surveys should identify and record each type of fish consumed and any unique preparation methods. a
4. Identification of the source
If known, either the water body where the fish was caught or the purchase location (for example, grocery store or fish market) should be identified. To improve exposure assessment, both locally caught fish and store bought fish should be included in fish consumption rate estimates. This distinction allows the risk assessor to better account for regional and seasonal variations in fish consumption estimates. b
5. Random selection of participants, sample size, and statistical analysis
During the planning phase, statistical analysis helps identify the ideal sample size and how to randomly select participants. This analysis helps minimize bias and sampling error and ensures statistical rigor. After the data have been collected, sound descriptive statistical analysis should ensure that the data are presented accurately. The range of data should be presented with confidence intervals and appropriate distribution values. Weighting schemes should be clearly described in order to apply survey results to populations of interest. Statistical treatment of perceived outliers should be discussed.
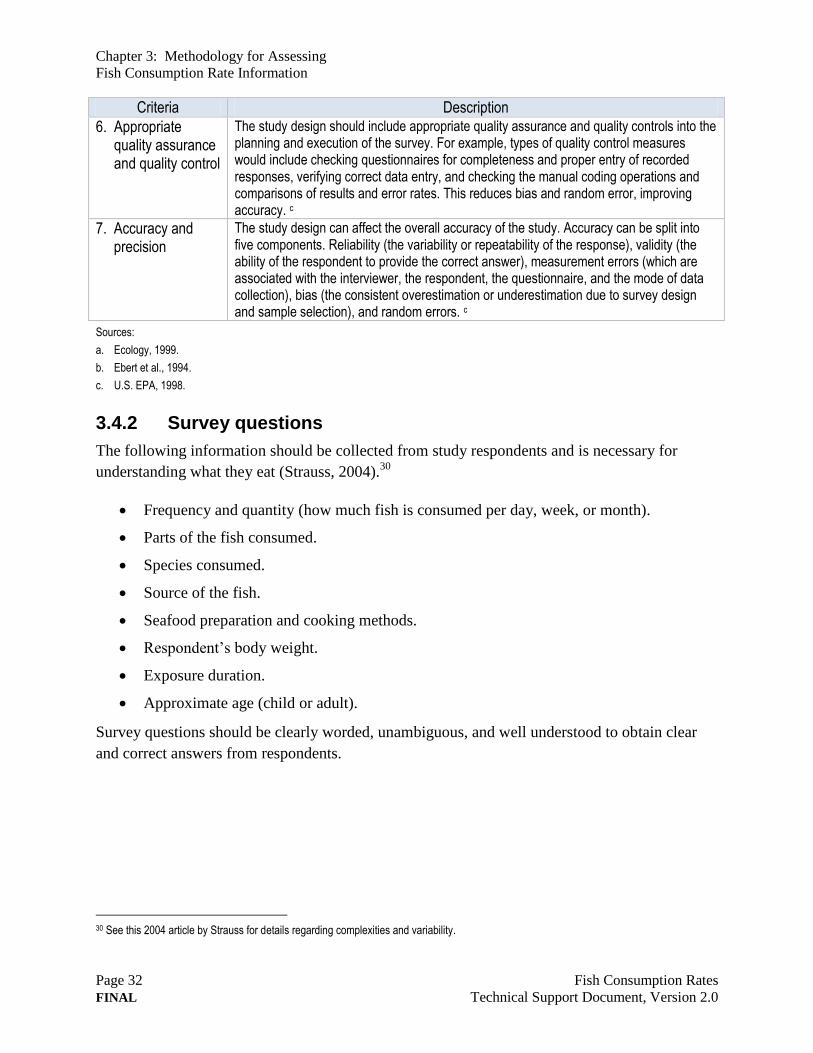
Chapter 3: Methodology for Assessing
Fish Consumption Rate Information
Page 32 Fish Consumption Rates
FINAL Technical Support Document, Version 2.0
Criteria Description
6. Appropriate quality assurance and quality control
The study design should include appropriate quality assurance and quality controls into the planning and execution of the survey. For example, types of quality control measures would include checking questionnaires for completeness and proper entry of recorded responses, verifying correct data entry, and checking the manual coding operations and comparisons of results and error rates. This reduces bias and random error, improving accuracy. c
7. Accuracy and precision
The study design can affect the overall accuracy of the study. Accuracy can be split into five components. Reliability (the variability or repeatability of the response), validity (the ability of the respondent to provide the correct answer), measurement errors (which are associated with the interviewer, the respondent, the questionnaire, and the mode of data collection), bias (the consistent overestimation or underestimation due to survey design and sample selection), and random errors. c
Sources:
a. Ecology, 1999.
b. Ebert et al., 1994.
c. U.S. EPA, 1998.
3.4.2 Survey questions
The following information should be collected from study respondents and is necessary for
understanding what they eat (Strauss, 2004).30
Frequency and quantity (how much fish is consumed per day, week, or month).
Parts of the fish consumed.
Species consumed.
Source of the fish.
Seafood preparation and cooking methods.
Respondent’s body weight.
Exposure duration.
Approximate age (child or adult).
Survey questions should be clearly worded, unambiguous, and well understood to obtain clear
and correct answers from respondents.
30 See this 2004 article by Strauss for details regarding complexities and variability.
Chapter 3: Methodology for Assessing
Fish Consumption Rate Information
Fish Consumption Rates Page 33
Technical Support Document, Version 2.0 FINAL
3.4.3 Population surveyed
The sample population must represent the target population. This is particularly important
because fish consumption rates may be affected by the socio-demographic characteristics of a
population. Furthermore, the type of survey used may influence or determine a number of things,
including what population will respond to the survey, the response rates, and the level of detail
obtained (Moya, 2004).
3.4.4 Description of water body
The survey must identify and understand the characteristics of all relevant water bodies,
including location, size, species inhabiting the water, and fish advisory status. These
characteristics influence the quantity of fish available. In addition, this information is critical to
producing results that can be used to compare with or extrapolate to other populations (Moya,
2004).
3.4.5 Survey results
Ecology considered it important to evaluate how the survey results are presented and what they
are meant to represent. This included identifying and considering goals of the survey.
Estimating the size of a meal is subject to error, especially when a survey vehicle (questionnaire
or interview) does not include visual aids. Also, quantities of seafood may be part of stews,
soups, and other recipes that may or may not be accounted for in fish dietary survey design.
Sound descriptive statistical analysis is required to ensure that the data are presented accurately.
The range of data should be presented with confidence intervals and appropriate distribution
values (Moya, 2004). Weighting schemes should be clearly described in order to apply survey
results to populations of interest. Statistical treatment of perceived outliers should be discussed.
3.4.6 Factors to consider
Ecology identified the following factors as appropriate and necessary when evaluating survey results:
Cultural factors. Does the population group of interest (for example, Native Americans
or Asian and Pacific Islanders) have cultural characteristics that should be considered
when designing a fish consumption survey? Native American ways of life may influence
fish consumption habits and patterns; salmon is of particular significance in the diet of
Northwest Pacific Native American tribal peoples. Asian and Pacific Islanders may
consume parts of organisms that differ from those preferred by other populations. Also, is
the survey designed to identify subsistence fishing practices?
Chapter 3: Methodology for Assessing
Fish Consumption Rate Information
Page 34 Fish Consumption Rates
FINAL Technical Support Document, Version 2.0
Fish diet fraction (the portion of fish consumed that comes from the site). Have sources of
fish tissue contamination been considered in the design and/or evaluation of the survey?
Are the fish consumed harvested from local waters? Does the survey distinguish between
store-bought fish or fish consumed in restaurants and fish harvested from local waters?
Types of seafood (finfish and shellfish) consumed from marine, freshwater, and estuarine
habitats. This information may be useful in characterizing risks for consumption of
aquatic biota that have different contaminant levels as a result of their feeding behaviors
(for example, bottom feeding fish or top predator species). Has the fish consumption
survey considered both the range of types of finfish/shellfish consumed and where they
are harvested?
Cooking methods. Use of cooked weights or uncooked weights to measure fish consumed
must be standardized. Generally, uncooked weights are preferred because environmental
contaminants are usually analytically determined for wet weight. Cooking fish can reduce
the weight of a fillet by 20 percent or more (U.S. EPA, 1998). Have the methods of food
preparation and cooking been considered in the fish consumption survey design and/or
evaluating the survey?
Are there historical and traditional fishing areas and practices that should be identified?
Environmental justice. How have historically underrepresented populations and
disproportionately impacted communities been considered in the design and evaluation of
fish consumption surveys?
3.5 Measures of technical defensibility
For purposes of this report, Ecology developed several measures of technical defensibility to help
guide the evaluation of individual surveys. These measures of technical defensibility ensure that
a survey can stand up to technical and scientific scrutiny and are described in Table 16. They
represent an expansion of the two selection criterion used by the June 2008 Oregon Human
Health Focus Group-Oregon Fish and Shellfish Consumption Rate Project
Collectively, these measures of technical defensibility provide an assessment of overall technical
suitability to support regulatory decision making (for example, they provide information about
whether the survey results are suitable and appropriate in a regulatory context for establishing
risk-based standards).
Chapter 3: Methodology for Assessing
Fish Consumption Rate Information
Fish Consumption Rates Page 35
Technical Support Document, Version 2.0 FINAL
The measures of technical defensibility are based on:
EPA Exposure Factors Handbook, 2009 Update (U.S. EPA, 2009a).
EPA Exposure Factors Handbook, 2011 Edition (U.S. EPA, 2011a).
EPA Guidance for Conducting Fish and Wildlife Consumption Surveys (U.S. EPA, 1992,
1998).
Consultations with the University of Washington, Environmental and Occupational
Health Sciences.31
Ecology applied these measures of technical defensibility to selected fish dietary surveys
performed in Washington State. Ecology has not applied these measures of technical
defensibility to all surveys conducted in Washington; many of these surveys were conducted for
specific water bodies to help support fish advisories, or were used to assess risks to specific
ethnic populations.
Water body-specific fish dietary surveys are limited in scope because they evaluate very specific
populations, usually recreational anglers and specific ethnic groups, which harvest and consume
fish from a particular water body within a specific county or jurisdiction in Washington State.
Each serves a useful purpose to help evaluate and assess potential health risks from consuming
contaminated finfish and shellfish; however, their methodology does not allow for the projection
of longer term estimates of fish consumption.
The additional fish dietary information provided in Table 32 and Appendix B, although not
meeting the measures of technical defensibility described in this chapter, provides support, using
a weight-of-evidence approach, to the idea that people in Washington State harvest and consume
considerable amounts of fish.
31 Ecology acknowledges input from the University of Washington, Seattle, Environmental and Occupational Health Sciences and Departments of Medicine and Internal Medicine.
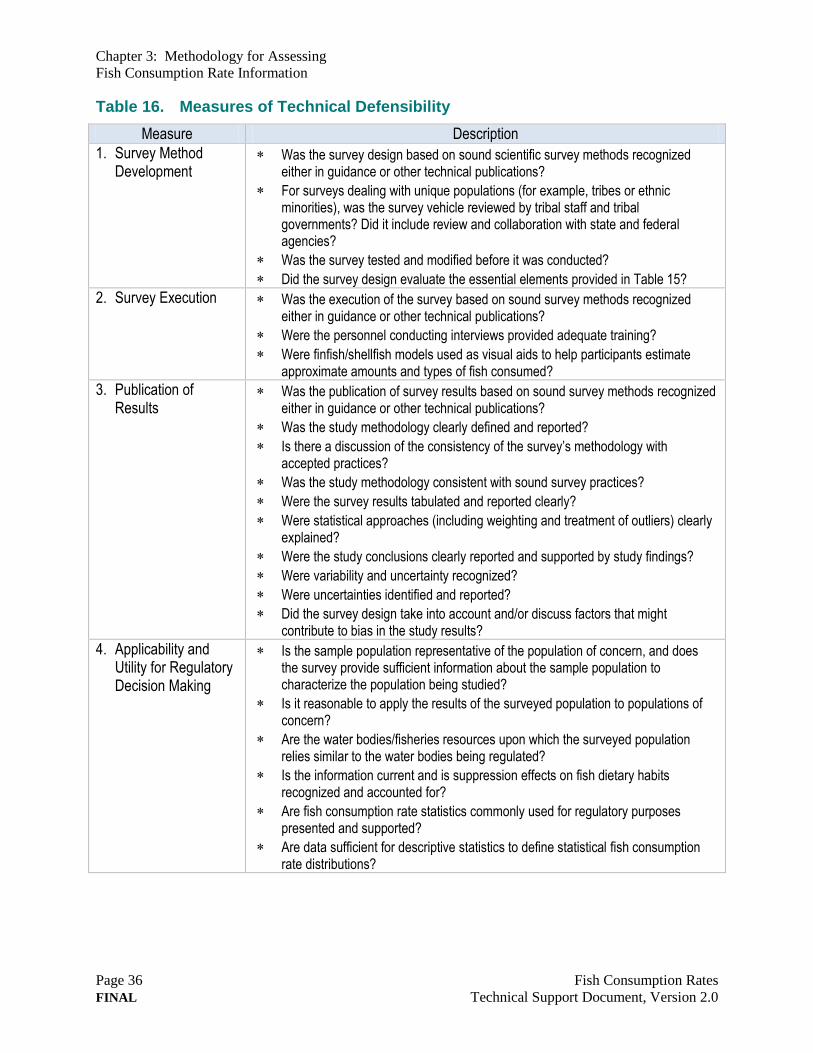
Chapter 3: Methodology for Assessing
Fish Consumption Rate Information
Page 36 Fish Consumption Rates
FINAL Technical Support Document, Version 2.0
Table 16. Measures of Technical Defensibility
Measure Description
1. Survey Method Development
Was the survey design based on sound scientific survey methods recognized either in guidance or other technical publications?
For surveys dealing with unique populations (for example, tribes or ethnic minorities), was the survey vehicle reviewed by tribal staff and tribal governments? Did it include review and collaboration with state and federal agencies?
Was the survey tested and modified before it was conducted?
Did the survey design evaluate the essential elements provided in Table 15?
2. Survey Execution
Was the execution of the survey based on sound survey methods recognized either in guidance or other technical publications?
Were the personnel conducting interviews provided adequate training?
Were finfish/shellfish models used as visual aids to help participants estimate approximate amounts and types of fish consumed?
3. Publication of Results
Was the publication of survey results based on sound survey methods recognized either in guidance or other technical publications?
Was the study methodology clearly defined and reported?
Is there a discussion of the consistency of the survey’s methodology with accepted practices?
Was the study methodology consistent with sound survey practices?
Were the survey results tabulated and reported clearly?
Were statistical approaches (including weighting and treatment of outliers) clearly explained?
Were the study conclusions clearly reported and supported by study findings?
Were variability and uncertainty recognized?
Were uncertainties identified and reported?
Did the survey design take into account and/or discuss factors that might contribute to bias in the study results?
4. Applicability and Utility for Regulatory Decision Making
Is the sample population representative of the population of concern, and does the survey provide sufficient information about the sample population to characterize the population being studied?
Is it reasonable to apply the results of the surveyed population to populations of concern?
Are the water bodies/fisheries resources upon which the surveyed population relies similar to the water bodies being regulated?
Is the information current and is suppression effects on fish dietary habits recognized and accounted for?
Are fish consumption rate statistics commonly used for regulatory purposes presented and supported?
Are data sufficient for descriptive statistics to define statistical fish consumption rate distributions?
Chapter 3: Methodology for Assessing
Fish Consumption Rate Information
Fish Consumption Rates Page 37
Technical Support Document, Version 2.0 FINAL
3.6 Custody of fish dietary survey data
Most fish dietary surveys that address the habits and patterns of ethnic groups (Asian and Pacific
Islanders, Native American populations) are funded either through state or federal cooperative
agreements or grants. Survey questionnaires are generally developed in close collaboration with
an organization that represents the ethnic group or technical personnel associated with the tribal
governments or tribal natural resource offices. Surveys are conducted by trained tribal personnel
or people representative of the ethnic population being surveyed. The resulting data may be
owned by the tribal government or the ethnic group that collaborated on the survey. The survey
design and methodology are generally reviewed by the funding organization (federal or state)
and technical personnel or representatives from the tribe or ethnic group.
The custody of survey data by tribal governments is related to their concerns with maintaining and
sustaining tribal sovereignty and honoring confidentiality agreements with individual participants
surveyed. The tribal governments have employed various methods to establish data quality without
releasing individual response data to entities other than tribal governments. Ecology acknowledges
that further evaluations would be possible using individual level response data.
Pacific Northwest Native American fish consumption surveys are designed and executed as
government-to-government collaboration with state and federal governments. They are generally
published under the authority of the tribal governments.
There are a number of ways to establish the defensibility of data. Scientific journals use peer
review to establish scientific defensibility of reported results. A recent Science Magazine
editorial (Hanson et al., 2011) noted the importance of making data available for scrutiny so that
other researchers can verify results and test conclusions. Using independent statisticians for
review and analysis may circumvent the need to release the raw data.
Many Pacific Northwest tribal organizations or tribal governments do not provide their raw seafood
dietary data to researchers outside of their sovereign tribal government or organizations. They may
consider survey data as confidential and not allow independent evaluations. Data evaluation
typically occurs through government-to-government agreements or tribal technical personnel.
For example, the fish consumption survey of the four tribes that reside throughout the Columbia
River basin was initiated through a cooperative agreement between EPA and the CRITFC. The
development, design, and execution of the CRITFC fish consumption survey vehicle were
conducted through the respective tribal governments that compose CRITFC. The fish
consumption data were collected and evaluated by tribal members and technical staff and are
retained by CRITFC. Other Pacific Northwest Indian tribes follow a similar pattern where the
data are retained by tribal governments or Pacific Northwest Indian commissions.
Chapter 3: Methodology for Assessing
Fish Consumption Rate Information
Page 38 Fish Consumption Rates
FINAL Technical Support Document, Version 2.0
Ecology evaluated the Native American fish consumption surveys, as well as other available
surveys conducted in the Pacific Northwest, based on the measures of technical defensibility
discussed above. That evaluation is described in the following chapter.
Chapter 4: Fish Consumption Survey Data
that Apply to Washington Fish Consumers
Fish Consumption Rates Page 39
Technical Support Document, Version 2.0 FINAL
Chapter 4: Fish Consumption Survey Data that Apply to Washington Fish Consumers
4.1 Introduction
Over the last several years, Ecology has evaluated available fish consumption surveys to support
site-specific regulatory decisions.
Fish consumption survey data are identified, discussed, and evaluated against the measures of
technical defensibility presented in Chapter 3. The purpose of this chapter is to identify those
surveys that are most appropriate for assessing fish consumption rates in Washington. A word of
caution is appropriate. Many sources of data are available and provide information that may be
appropriate for answering particular questions. The question being considered in this chapter is
identification of data appropriate for use in a regulatory context to characterize fish-consuming
populations across Washington State.
Ecology considered a range of information that describes fish consumption rates and patterns for
fish consumers in Washington. In general, Ecology examined:
General population surveys conducted at the national level.
Dietary surveys of Washington Native American populations.
A dietary survey of Asian and Pacific Islander populations in King County.
Washington water body-specific evaluations, assessments, or health advisories issued by
DOH.32
Technical publications, assessments, and/or evaluations of fish consumption specific to
the Pacific Northwest.
Various evaluations or assessments used to make regulatory decisions. For example, the
baseline human health risk assessment performed for the Lower Duwamish Waterway,
which refers to the EPA Region 10 Framework and Kissinger re-evaluation (Windward
Environmental, 2007; U.S. EPA, 2007b; Kissinger, 2005).33
32 Washington State Department of Health fish consumption advisories by water body located at the following web link: http://www.doh.wa.gov/CommunityandEnvironment/Food/Fish/Advisories.aspx, and Port Angeles: http://www.ecy.wa.gov/news/2012/052.html
33 Besides the Lower Duwamish Waterway Remedial Investigation Report, Ecology also considered the Port Angeles and Port Gamble sediment cleanup:
Port Angeles: http://www.ecy.wa.gov/programs/tcp/sites_brochure/portAngelesHarborSed/paSed_hp.htm
Port Gamble: http://www.ecy.wa.gov/programs/tcp/sites_brochure/psi/portGamble/psi_portGamble.html
Chapter 4: Fish Consumption Survey Data
that Apply to Washington Fish Consumers
Page 40 Fish Consumption Rates
FINAL Technical Support Document, Version 2.0
These data were examined and assessed to identify technically defensible studies appropriate for
use in characterizing fish-consuming populations in Washington.
To provide a more detailed look at fish consumption patterns across the state, where possible,
fish consumption data and descriptive statistics have been tabulated for both locally harvested
fish, and for fish consumed from all sources including stores and restaurants. Where available,
additional fish consumption estimates from Pacific Northwest fish dietary surveys are included
for groups of fish species, such as finfish, shellfish, anadromous finish, and non-anadromous
finfish.
4.2 General population data
Currently, there are no fish dietary data available for the general fish-consuming populations in
Washington State. That is, there is not a survey of fish consumption of the entire population of
Washington State. Ecology examined information on fish consumption among the U.S. national
general population.
Ecology notes that national data show that people who live in coastal areas consume fish at
higher rates than those living in other areas (Moya, 2004) and that EPA recommends using
regional-specific data, when available (U.S. EPA, 2000b, 2007b, 2011a).
4.2.1 Continuing Survey of Food Intakes by Individuals
In 2000, the EPA developed national estimates of fish consumption based on an analysis of the
U.S. Department of Agriculture’s (USDA) 1994–1996 Continuing Survey of Food Intakes by
Individuals (CSFII) and its 1998 Children’s Supplement (U.S. EPA, 2002a). (These USDA
reports are collectively referred to as CSFII 1994–1996, 1998).
The USDA surveys were designed to provide estimates of food consumption across the United
States and were conducted in all 50 states and Washington, D.C. They include fish consumers
and non-consumers, and provide data for federal activities related to the nutritional status of the
U.S. population.34
The national fish dietary information is not representative of some
Washington State fish-consuming populations, such as Asian-Pacific Islanders and Native
Americans.
Over 20,000 survey participants each provided dietary information during two non-consecutive
24-hour periods. The survey was designed so that the second interview occurred 3 to 10 days
after the first interview but not on the same day of the week. The dietary recall surveys were
administered over a period of 4 years.
34 By definition, per capita fish consumption includes consumers and non-consumers of fish. The per capita survey methodology is different than the Pacific Northwest fish dietary recall studies and is discussed below.
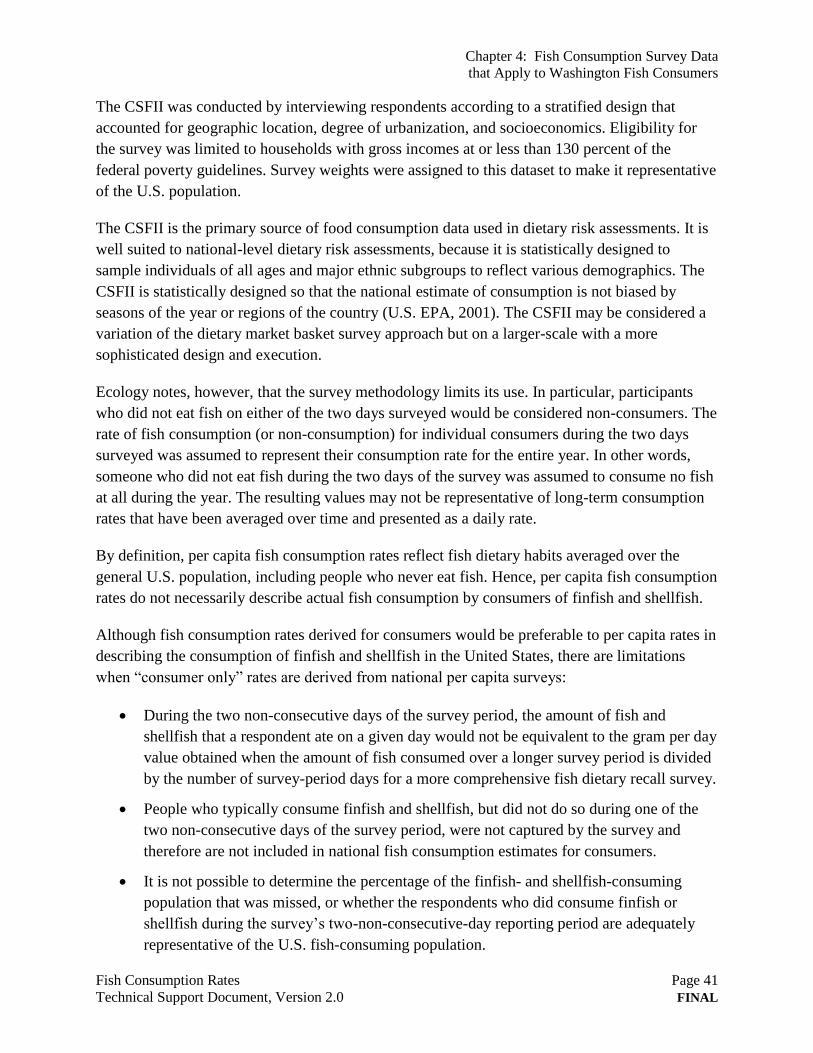
Chapter 4: Fish Consumption Survey Data
that Apply to Washington Fish Consumers
Fish Consumption Rates Page 41
Technical Support Document, Version 2.0 FINAL
The CSFII was conducted by interviewing respondents according to a stratified design that
accounted for geographic location, degree of urbanization, and socioeconomics. Eligibility for
the survey was limited to households with gross incomes at or less than 130 percent of the
federal poverty guidelines. Survey weights were assigned to this dataset to make it representative
of the U.S. population.
The CSFII is the primary source of food consumption data used in dietary risk assessments. It is
well suited to national-level dietary risk assessments, because it is statistically designed to
sample individuals of all ages and major ethnic subgroups to reflect various demographics. The
CSFII is statistically designed so that the national estimate of consumption is not biased by
seasons of the year or regions of the country (U.S. EPA, 2001). The CSFII may be considered a
variation of the dietary market basket survey approach but on a larger-scale with a more
sophisticated design and execution.
Ecology notes, however, that the survey methodology limits its use. In particular, participants
who did not eat fish on either of the two days surveyed would be considered non-consumers. The
rate of fish consumption (or non-consumption) for individual consumers during the two days
surveyed was assumed to represent their consumption rate for the entire year. In other words,
someone who did not eat fish during the two days of the survey was assumed to consume no fish
at all during the year. The resulting values may not be representative of long-term consumption
rates that have been averaged over time and presented as a daily rate.
By definition, per capita fish consumption rates reflect fish dietary habits averaged over the
general U.S. population, including people who never eat fish. Hence, per capita fish consumption
rates do not necessarily describe actual fish consumption by consumers of finfish and shellfish.
Although fish consumption rates derived for consumers would be preferable to per capita rates in
describing the consumption of finfish and shellfish in the United States, there are limitations
when “consumer only” rates are derived from national per capita surveys:
During the two non-consecutive days of the survey period, the amount of fish and
shellfish that a respondent ate on a given day would not be equivalent to the gram per day
value obtained when the amount of fish consumed over a longer survey period is divided
by the number of survey-period days for a more comprehensive fish dietary recall survey.
People who typically consume finfish and shellfish, but did not do so during one of the
two non-consecutive days of the survey period, were not captured by the survey and
therefore are not included in national fish consumption estimates for consumers.
It is not possible to determine the percentage of the finfish- and shellfish-consuming
population that was missed, or whether the respondents who did consume finfish or
shellfish during the survey’s two-non-consecutive-day reporting period are adequately
representative of the U.S. fish-consuming population.
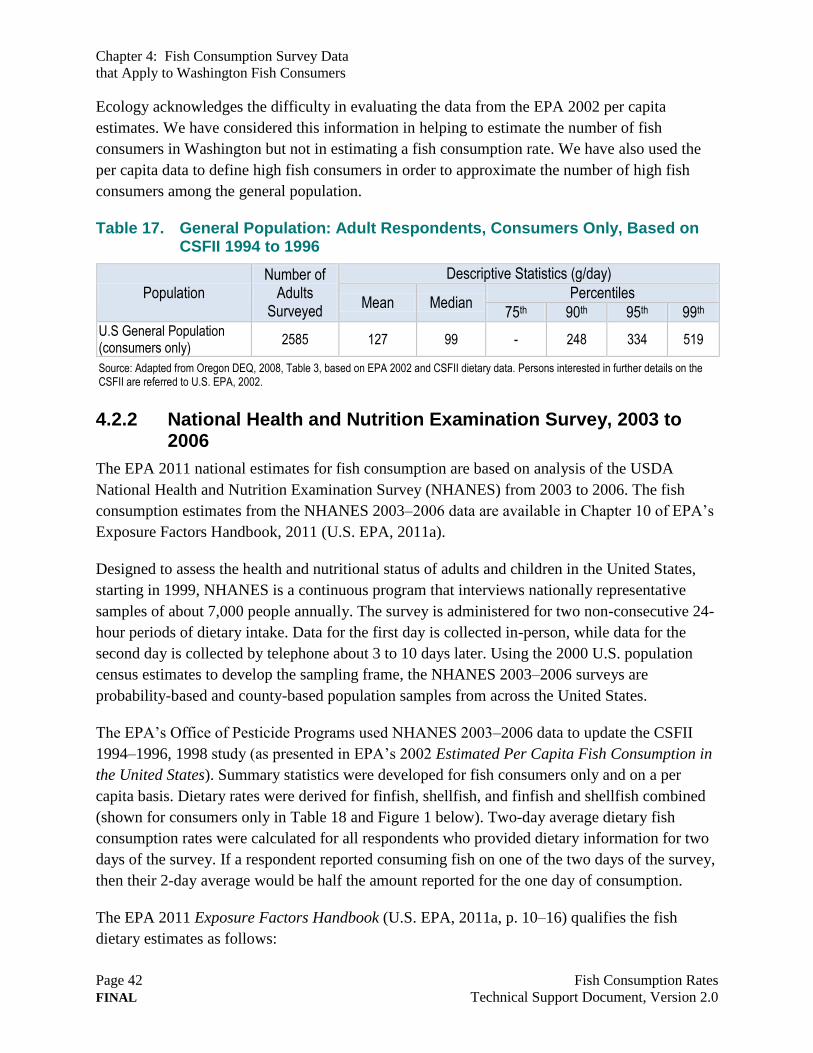
Chapter 4: Fish Consumption Survey Data
that Apply to Washington Fish Consumers
Page 42 Fish Consumption Rates
FINAL Technical Support Document, Version 2.0
Ecology acknowledges the difficulty in evaluating the data from the EPA 2002 per capita
estimates. We have considered this information in helping to estimate the number of fish
consumers in Washington but not in estimating a fish consumption rate. We have also used the
per capita data to define high fish consumers in order to approximate the number of high fish
consumers among the general population.
Table 17. General Population: Adult Respondents, Consumers Only, Based on CSFII 1994 to 1996
Population Number of
Adults Surveyed
Descriptive Statistics (g/day)
Mean Median Percentiles
75th 90th 95th 99th U.S General Population (consumers only)
2585 127 99 - 248 334 519
Source: Adapted from Oregon DEQ, 2008, Table 3, based on EPA 2002 and CSFII dietary data. Persons interested in further details on the CSFII are referred to U.S. EPA, 2002.
4.2.2 National Health and Nutrition Examination Survey, 2003 to 2006
The EPA 2011 national estimates for fish consumption are based on analysis of the USDA
National Health and Nutrition Examination Survey (NHANES) from 2003 to 2006. The fish
consumption estimates from the NHANES 2003–2006 data are available in Chapter 10 of EPA’s
Exposure Factors Handbook, 2011 (U.S. EPA, 2011a).
Designed to assess the health and nutritional status of adults and children in the United States,
starting in 1999, NHANES is a continuous program that interviews nationally representative
samples of about 7,000 people annually. The survey is administered for two non-consecutive 24-
hour periods of dietary intake. Data for the first day is collected in-person, while data for the
second day is collected by telephone about 3 to 10 days later. Using the 2000 U.S. population
census estimates to develop the sampling frame, the NHANES 2003–2006 surveys are
probability-based and county-based population samples from across the United States.
The EPA’s Office of Pesticide Programs used NHANES 2003–2006 data to update the CSFII
1994–1996, 1998 study (as presented in EPA’s 2002 Estimated Per Capita Fish Consumption in
the United States). Summary statistics were developed for fish consumers only and on a per
capita basis. Dietary rates were derived for finfish, shellfish, and finfish and shellfish combined
(shown for consumers only in Table 18 and Figure 1 below). Two-day average dietary fish
consumption rates were calculated for all respondents who provided dietary information for two
days of the survey. If a respondent reported consuming fish on one of the two days of the survey,
then their 2-day average would be half the amount reported for the one day of consumption.
The EPA 2011 Exposure Factors Handbook (U.S. EPA, 2011a, p. 10–16) qualifies the fish
dietary estimates as follows:
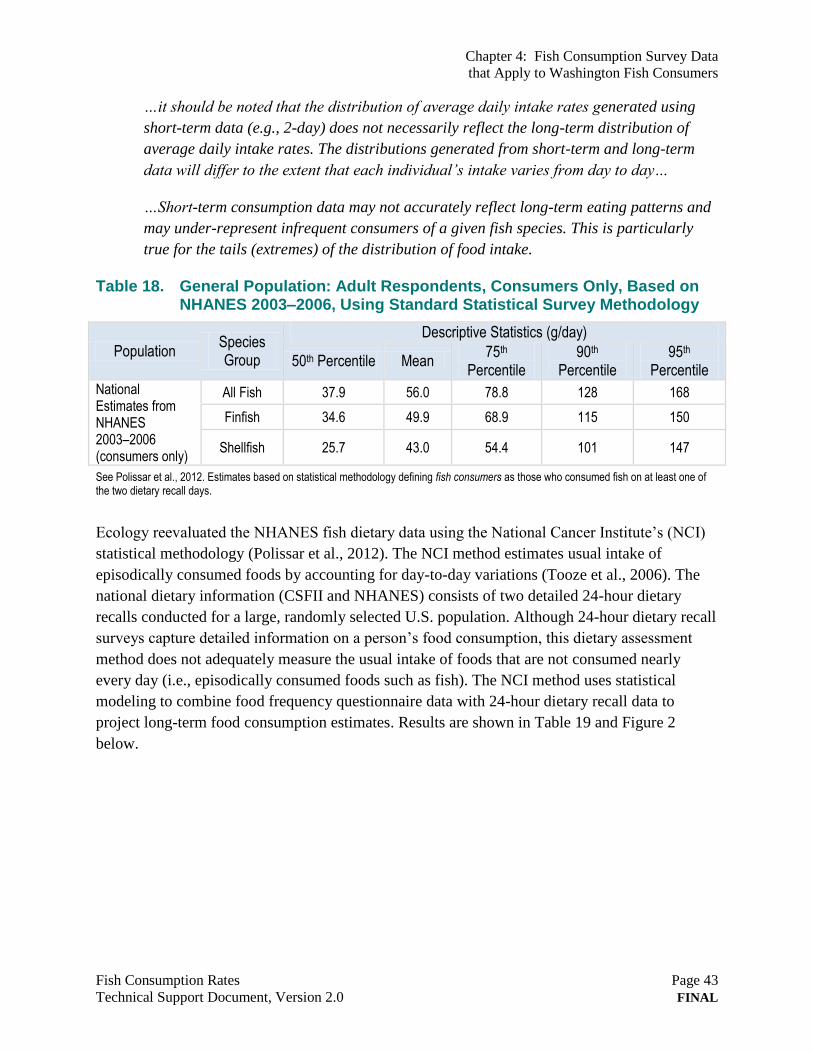
Chapter 4: Fish Consumption Survey Data
that Apply to Washington Fish Consumers
Fish Consumption Rates Page 43
Technical Support Document, Version 2.0 FINAL
…it should be noted that the distribution of average daily intake rates generated using
short-term data (e.g., 2-day) does not necessarily reflect the long-term distribution of
average daily intake rates. The distributions generated from short-term and long-term
data will differ to the extent that each individual’s intake varies from day to day…
…Short-term consumption data may not accurately reflect long-term eating patterns and
may under-represent infrequent consumers of a given fish species. This is particularly
true for the tails (extremes) of the distribution of food intake.
Table 18. General Population: Adult Respondents, Consumers Only, Based on NHANES 2003–2006, Using Standard Statistical Survey Methodology
Population Species Group
Descriptive Statistics (g/day)
50th Percentile Mean 75th
Percentile
90th Percentile
95th Percentile
National Estimates from NHANES 2003–2006 (consumers only)
All Fish 37.9 56.0 78.8 128 168
Finfish 34.6 49.9 68.9 115 150
Shellfish 25.7 43.0 54.4 101 147
See Polissar et al., 2012. Estimates based on statistical methodology defining fish consumers as those who consumed fish on at least one of the two dietary recall days.
Ecology reevaluated the NHANES fish dietary data using the National Cancer Institute’s (NCI)
statistical methodology (Polissar et al., 2012). The NCI method estimates usual intake of
episodically consumed foods by accounting for day-to-day variations (Tooze et al., 2006). The
national dietary information (CSFII and NHANES) consists of two detailed 24-hour dietary
recalls conducted for a large, randomly selected U.S. population. Although 24-hour dietary recall
surveys capture detailed information on a person’s food consumption, this dietary assessment
method does not adequately measure the usual intake of foods that are not consumed nearly
every day (i.e., episodically consumed foods such as fish). The NCI method uses statistical
modeling to combine food frequency questionnaire data with 24-hour dietary recall data to
project long-term food consumption estimates. Results are shown in Table 19 and Figure 2
below.
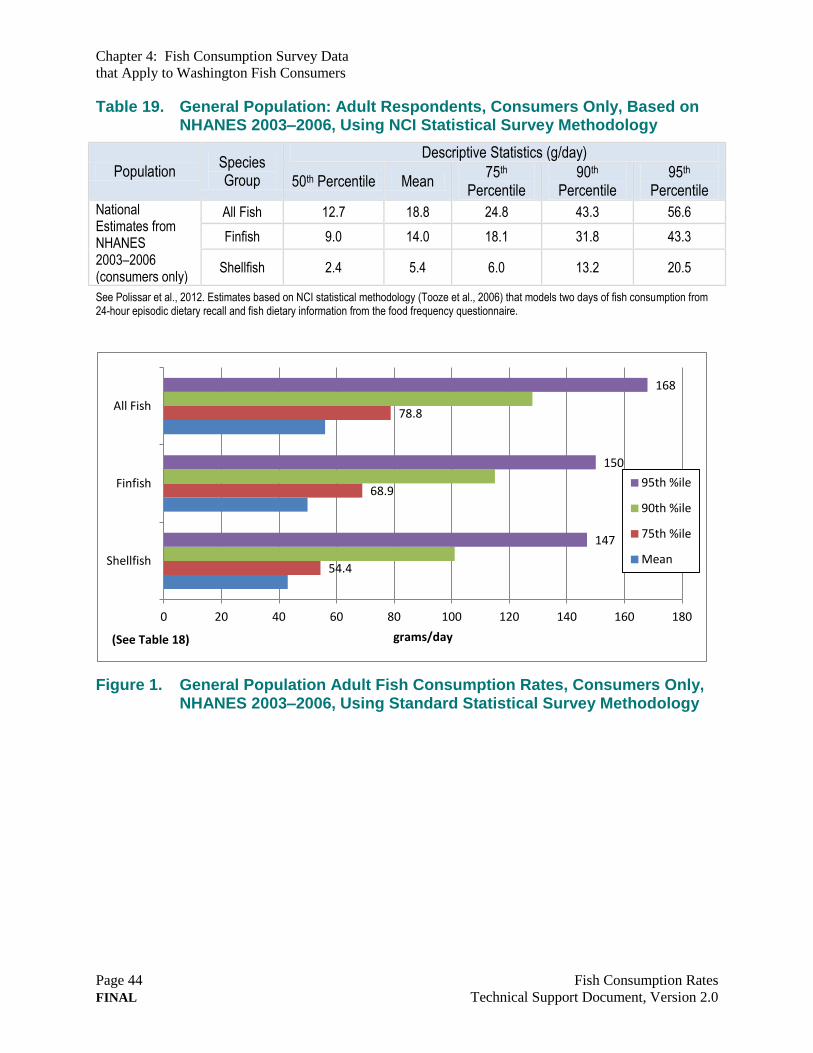
Chapter 4: Fish Consumption Survey Data
that Apply to Washington Fish Consumers
Page 44 Fish Consumption Rates
FINAL Technical Support Document, Version 2.0
Table 19. General Population: Adult Respondents, Consumers Only, Based on NHANES 2003–2006, Using NCI Statistical Survey Methodology
Population Species Group
Descriptive Statistics (g/day)
50th Percentile Mean 75th
Percentile
90th Percentile
95th Percentile
National Estimates from NHANES 2003–2006 (consumers only)
All Fish 12.7 18.8 24.8 43.3 56.6
Finfish 9.0 14.0 18.1 31.8 43.3
Shellfish 2.4 5.4 6.0 13.2 20.5
See Polissar et al., 2012. Estimates based on NCI statistical methodology (Tooze et al., 2006) that models two days of fish consumption from 24-hour episodic dietary recall and fish dietary information from the food frequency questionnaire.
Figure 1. General Population Adult Fish Consumption Rates, Consumers Only, NHANES 2003–2006, Using Standard Statistical Survey Methodology
54.4
68.9
78.8
147
150
168
0 20 40 60 80 100 120 140 160 180
Shellfish
Finfish
All Fish
grams/day
95th %ile
90th %ile
75th %ile
Mean
(See Table 18)
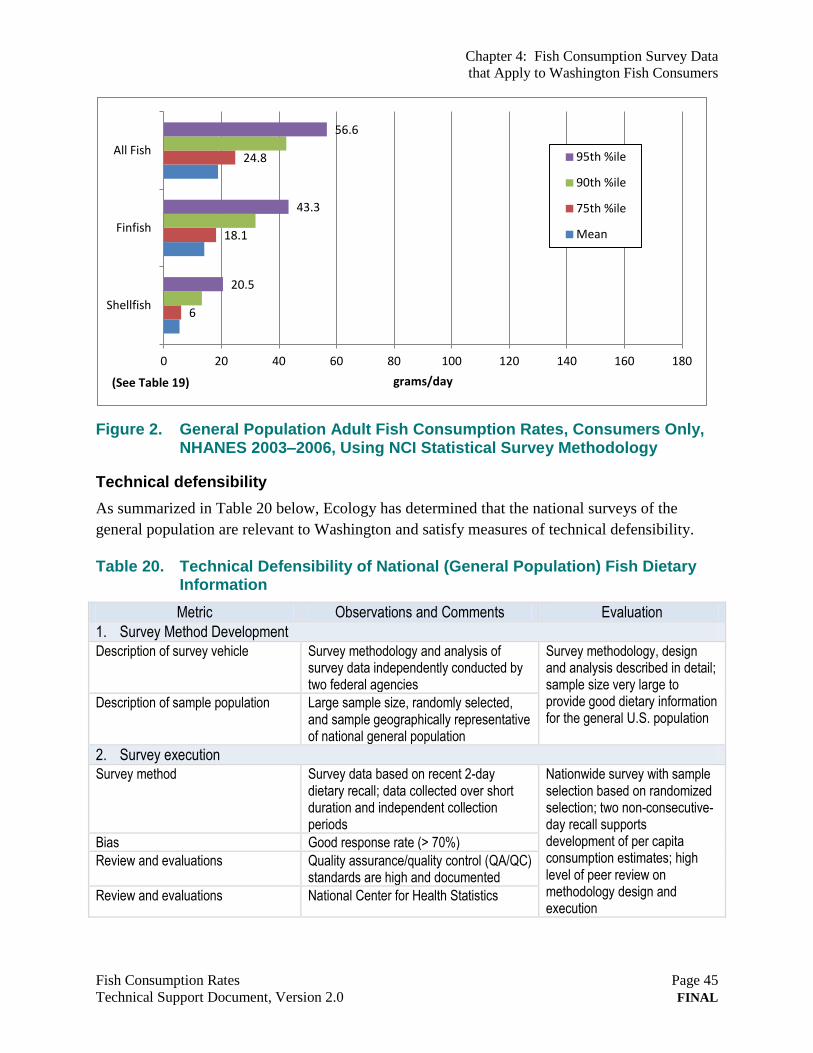
Chapter 4: Fish Consumption Survey Data
that Apply to Washington Fish Consumers
Fish Consumption Rates Page 45
Technical Support Document, Version 2.0 FINAL
Figure 2. General Population Adult Fish Consumption Rates, Consumers Only, NHANES 2003–2006, Using NCI Statistical Survey Methodology
Technical defensibility
As summarized in Table 20 below, Ecology has determined that the national surveys of the
general population are relevant to Washington and satisfy measures of technical defensibility.
Table 20. Technical Defensibility of National (General Population) Fish Dietary Information
Metric Observations and Comments Evaluation
1. Survey Method Development
Description of survey vehicle Survey methodology and analysis of survey data independently conducted by two federal agencies
Survey methodology, design and analysis described in detail; sample size very large to provide good dietary information for the general U.S. population
Description of sample population Large sample size, randomly selected, and sample geographically representative of national general population
2. Survey execution Survey method Survey data based on recent 2-day
dietary recall; data collected over short duration and independent collection periods
Nationwide survey with sample selection based on randomized selection; two non-consecutive-day recall supports development of per capita consumption estimates; high level of peer review on methodology design and execution
Bias Good response rate (> 70%)
Review and evaluations Quality assurance/quality control (QA/QC) standards are high and documented
Review and evaluations National Center for Health Statistics
6
18.1
24.8
20.5
43.3
56.6
0 20 40 60 80 100 120 140 160 180
Shellfish
Finfish
All Fish
grams/day
95th %ile
90th %ile
75th %ile
Mean
(See Table 19)
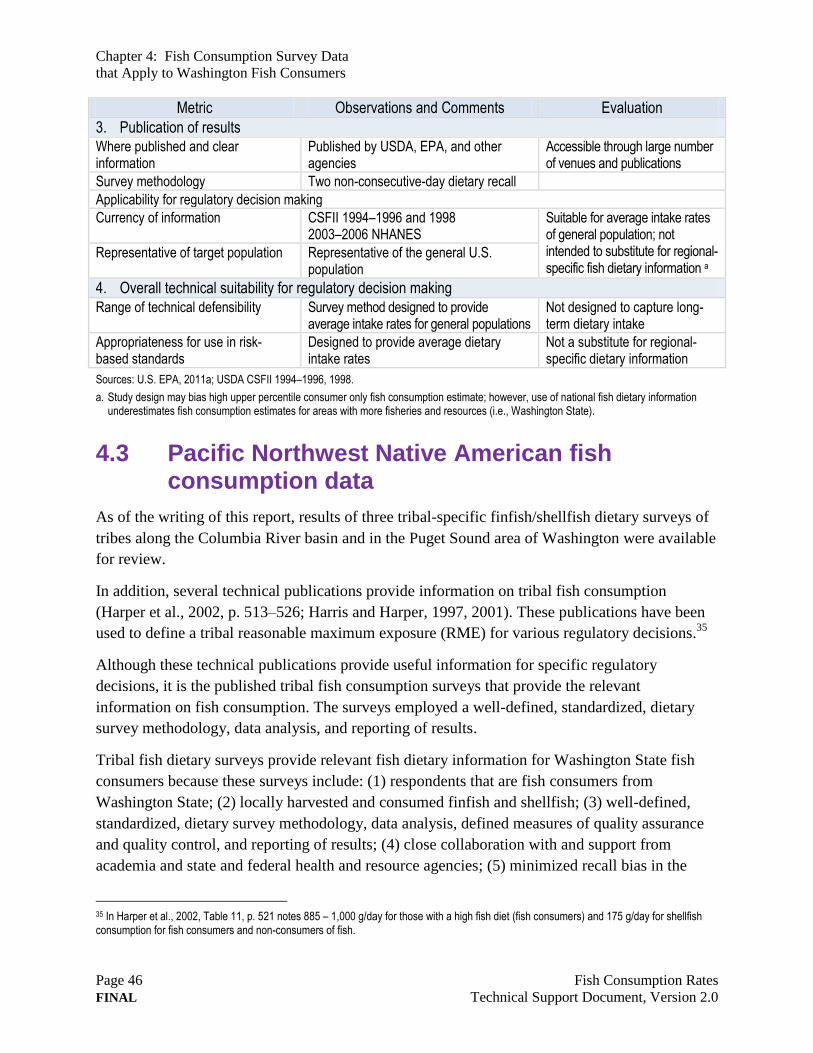
Chapter 4: Fish Consumption Survey Data
that Apply to Washington Fish Consumers
Page 46 Fish Consumption Rates
FINAL Technical Support Document, Version 2.0
Metric Observations and Comments Evaluation
3. Publication of results Where published and clear information
Published by USDA, EPA, and other agencies
Accessible through large number of venues and publications
Survey methodology Two non-consecutive-day dietary recall
Applicability for regulatory decision making
Currency of information CSFII 1994–1996 and 1998 2003–2006 NHANES
Suitable for average intake rates of general population; not intended to substitute for regional-specific fish dietary information a
Representative of target population Representative of the general U.S. population
4. Overall technical suitability for regulatory decision making
Range of technical defensibility Survey method designed to provide average intake rates for general populations
Not designed to capture long-term dietary intake
Appropriateness for use in risk-based standards
Designed to provide average dietary intake rates
Not a substitute for regional-specific dietary information
Sources: U.S. EPA, 2011a; USDA CSFII 1994–1996, 1998.
a. Study design may bias high upper percentile consumer only fish consumption estimate; however, use of national fish dietary information underestimates fish consumption estimates for areas with more fisheries and resources (i.e., Washington State).
4.3 Pacific Northwest Native American fish consumption data
As of the writing of this report, results of three tribal-specific finfish/shellfish dietary surveys of
tribes along the Columbia River basin and in the Puget Sound area of Washington were available
for review.
In addition, several technical publications provide information on tribal fish consumption
(Harper et al., 2002, p. 513–526; Harris and Harper, 1997, 2001). These publications have been
used to define a tribal reasonable maximum exposure (RME) for various regulatory decisions.35
Although these technical publications provide useful information for specific regulatory
decisions, it is the published tribal fish consumption surveys that provide the relevant
information on fish consumption. The surveys employed a well-defined, standardized, dietary
survey methodology, data analysis, and reporting of results.
Tribal fish dietary surveys provide relevant fish dietary information for Washington State fish
consumers because these surveys include: (1) respondents that are fish consumers from
Washington State; (2) locally harvested and consumed finfish and shellfish; (3) well-defined,
standardized, dietary survey methodology, data analysis, defined measures of quality assurance
and quality control, and reporting of results; (4) close collaboration with and support from
academia and state and federal health and resource agencies; (5) minimized recall bias in the
35 In Harper et al., 2002, Table 11, p. 521 notes 885 – 1,000 g/day for those with a high fish diet (fish consumers) and 175 g/day for shellfish consumption for fish consumers and non-consumers of fish.
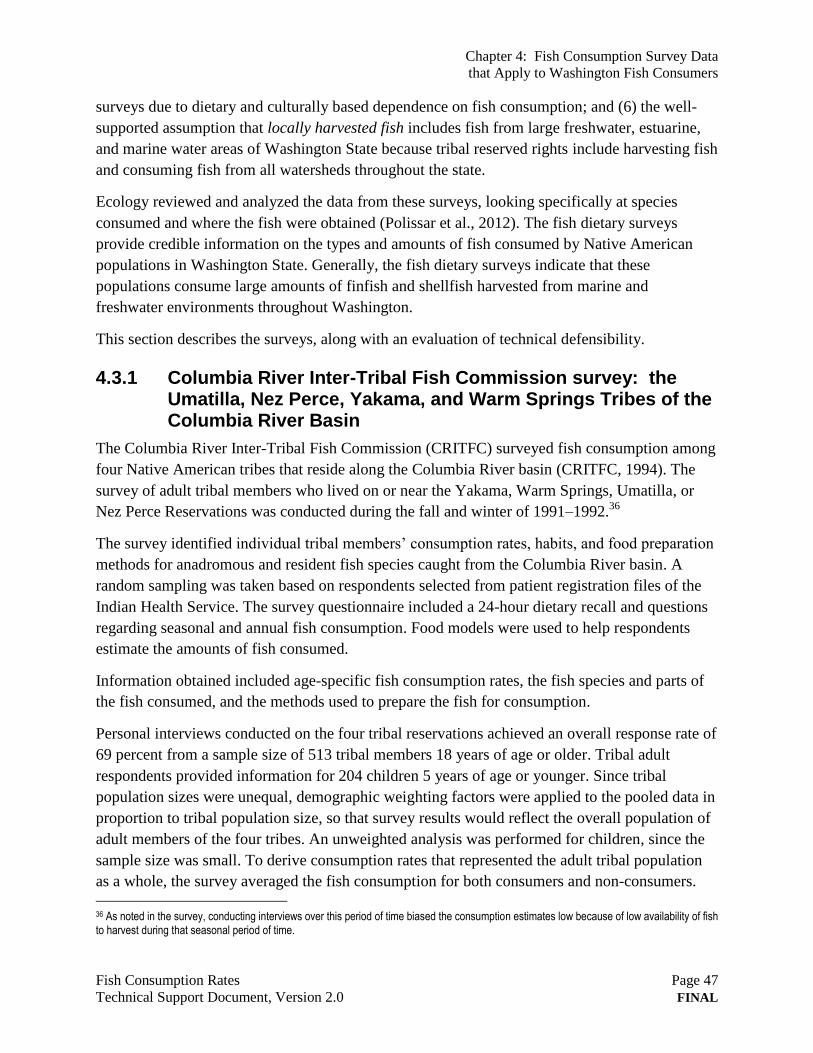
Chapter 4: Fish Consumption Survey Data
that Apply to Washington Fish Consumers
Fish Consumption Rates Page 47
Technical Support Document, Version 2.0 FINAL
surveys due to dietary and culturally based dependence on fish consumption; and (6) the well-
supported assumption that locally harvested fish includes fish from large freshwater, estuarine,
and marine water areas of Washington State because tribal reserved rights include harvesting fish
and consuming fish from all watersheds throughout the state.
Ecology reviewed and analyzed the data from these surveys, looking specifically at species
consumed and where the fish were obtained (Polissar et al., 2012). The fish dietary surveys
provide credible information on the types and amounts of fish consumed by Native American
populations in Washington State. Generally, the fish dietary surveys indicate that these
populations consume large amounts of finfish and shellfish harvested from marine and
freshwater environments throughout Washington.
This section describes the surveys, along with an evaluation of technical defensibility.
4.3.1 Columbia River Inter-Tribal Fish Commission survey: the Umatilla, Nez Perce, Yakama, and Warm Springs Tribes of the Columbia River Basin
The Columbia River Inter-Tribal Fish Commission (CRITFC) surveyed fish consumption among
four Native American tribes that reside along the Columbia River basin (CRITFC, 1994). The
survey of adult tribal members who lived on or near the Yakama, Warm Springs, Umatilla, or
Nez Perce Reservations was conducted during the fall and winter of 1991–1992.36
The survey identified individual tribal members’ consumption rates, habits, and food preparation
methods for anadromous and resident fish species caught from the Columbia River basin. A
random sampling was taken based on respondents selected from patient registration files of the
Indian Health Service. The survey questionnaire included a 24-hour dietary recall and questions
regarding seasonal and annual fish consumption. Food models were used to help respondents
estimate the amounts of fish consumed.
Information obtained included age-specific fish consumption rates, the fish species and parts of
the fish consumed, and the methods used to prepare the fish for consumption.
Personal interviews conducted on the four tribal reservations achieved an overall response rate of
69 percent from a sample size of 513 tribal members 18 years of age or older. Tribal adult
respondents provided information for 204 children 5 years of age or younger. Since tribal
population sizes were unequal, demographic weighting factors were applied to the pooled data in
proportion to tribal population size, so that survey results would reflect the overall population of
adult members of the four tribes. An unweighted analysis was performed for children, since the
sample size was small. To derive consumption rates that represented the adult tribal population
as a whole, the survey averaged the fish consumption for both consumers and non-consumers.
36 As noted in the survey, conducting interviews over this period of time biased the consumption estimates low because of low availability of fish to harvest during that seasonal period of time.
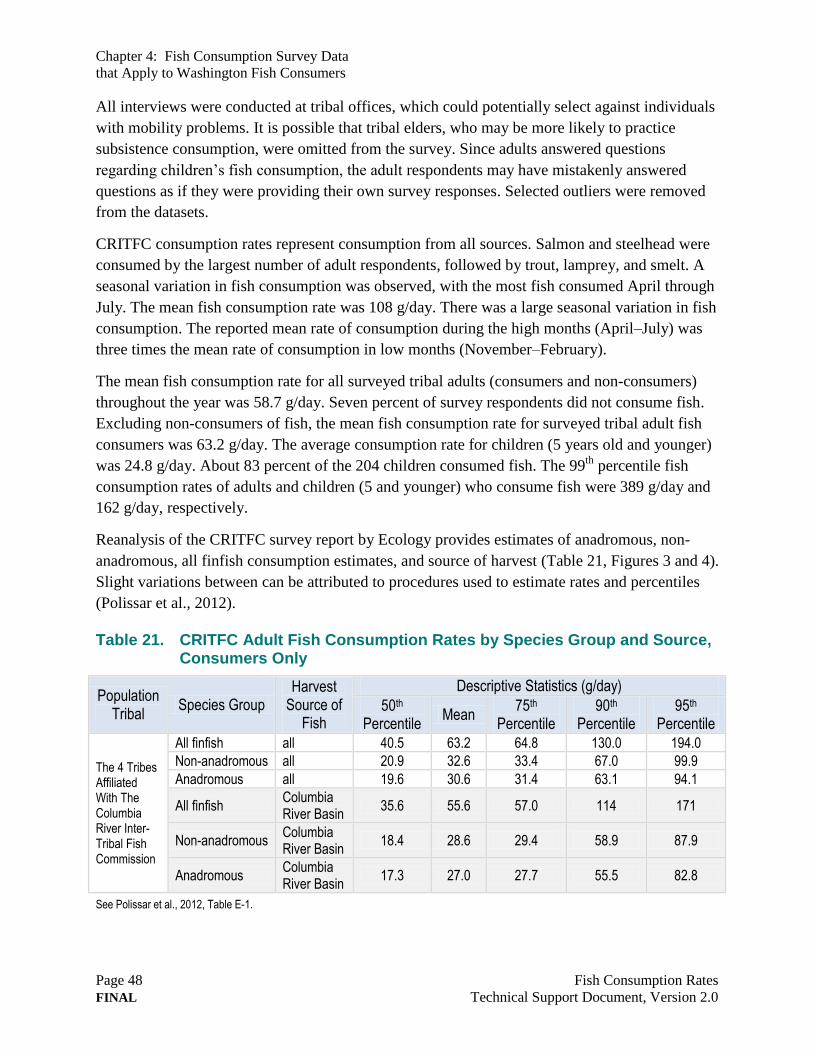
Chapter 4: Fish Consumption Survey Data
that Apply to Washington Fish Consumers
Page 48 Fish Consumption Rates
FINAL Technical Support Document, Version 2.0
All interviews were conducted at tribal offices, which could potentially select against individuals
with mobility problems. It is possible that tribal elders, who may be more likely to practice
subsistence consumption, were omitted from the survey. Since adults answered questions
regarding children’s fish consumption, the adult respondents may have mistakenly answered
questions as if they were providing their own survey responses. Selected outliers were removed
from the datasets.
CRITFC consumption rates represent consumption from all sources. Salmon and steelhead were
consumed by the largest number of adult respondents, followed by trout, lamprey, and smelt. A
seasonal variation in fish consumption was observed, with the most fish consumed April through
July. The mean fish consumption rate was 108 g/day. There was a large seasonal variation in fish
consumption. The reported mean rate of consumption during the high months (April–July) was
three times the mean rate of consumption in low months (November–February).
The mean fish consumption rate for all surveyed tribal adults (consumers and non-consumers)
throughout the year was 58.7 g/day. Seven percent of survey respondents did not consume fish.
Excluding non-consumers of fish, the mean fish consumption rate for surveyed tribal adult fish
consumers was 63.2 g/day. The average consumption rate for children (5 years old and younger)
was 24.8 g/day. About 83 percent of the 204 children consumed fish. The 99th
percentile fish
consumption rates of adults and children (5 and younger) who consume fish were 389 g/day and
162 g/day, respectively.
Reanalysis of the CRITFC survey report by Ecology provides estimates of anadromous, non-
anadromous, all finfish consumption estimates, and source of harvest (Table 21, Figures 3 and 4).
Slight variations between can be attributed to procedures used to estimate rates and percentiles
(Polissar et al., 2012).
Table 21. CRITFC Adult Fish Consumption Rates by Species Group and Source, Consumers Only
Population Tribal
Species Group Harvest
Source of Fish
Descriptive Statistics (g/day)
50th Percentile
Mean 75th
Percentile 90th
Percentile 95th
Percentile
The 4 Tribes Affiliated With The Columbia River Inter-Tribal Fish Commission
All finfish all 40.5 63.2 64.8 130.0 194.0
Non-anadromous all 20.9 32.6 33.4 67.0 99.9
Anadromous all 19.6 30.6 31.4 63.1 94.1
All finfish Columbia River Basin
35.6 55.6 57.0 114 171
Non-anadromous Columbia River Basin
18.4 28.6 29.4 58.9 87.9
Anadromous Columbia River Basin
17.3 27.0 27.7 55.5 82.8
See Polissar et al., 2012, Table E-1.
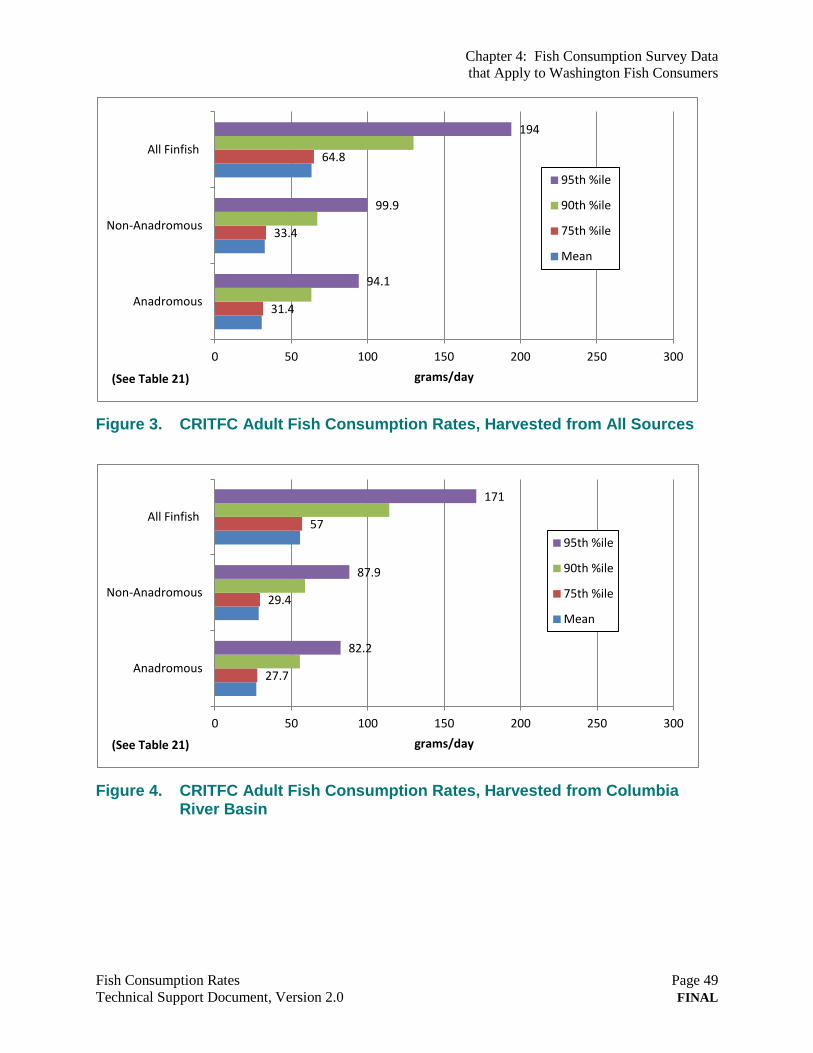
Chapter 4: Fish Consumption Survey Data
that Apply to Washington Fish Consumers
Fish Consumption Rates Page 49
Technical Support Document, Version 2.0 FINAL
Figure 3. CRITFC Adult Fish Consumption Rates, Harvested from All Sources
Figure 4. CRITFC Adult Fish Consumption Rates, Harvested from Columbia River Basin
31.4
33.4
64.8
94.1
99.9
194
0 50 100 150 200 250 300
Anadromous
Non-Anadromous
All Finfish
grams/day
95th %ile
90th %ile
75th %ile
Mean
27.7
29.4
57
82.2
87.9
171
0 50 100 150 200 250 300
Anadromous
Non-Anadromous
All Finfish
grams/day
95th %ile
90th %ile
75th %ile
Mean
(See Table 21)
(See Table 21)
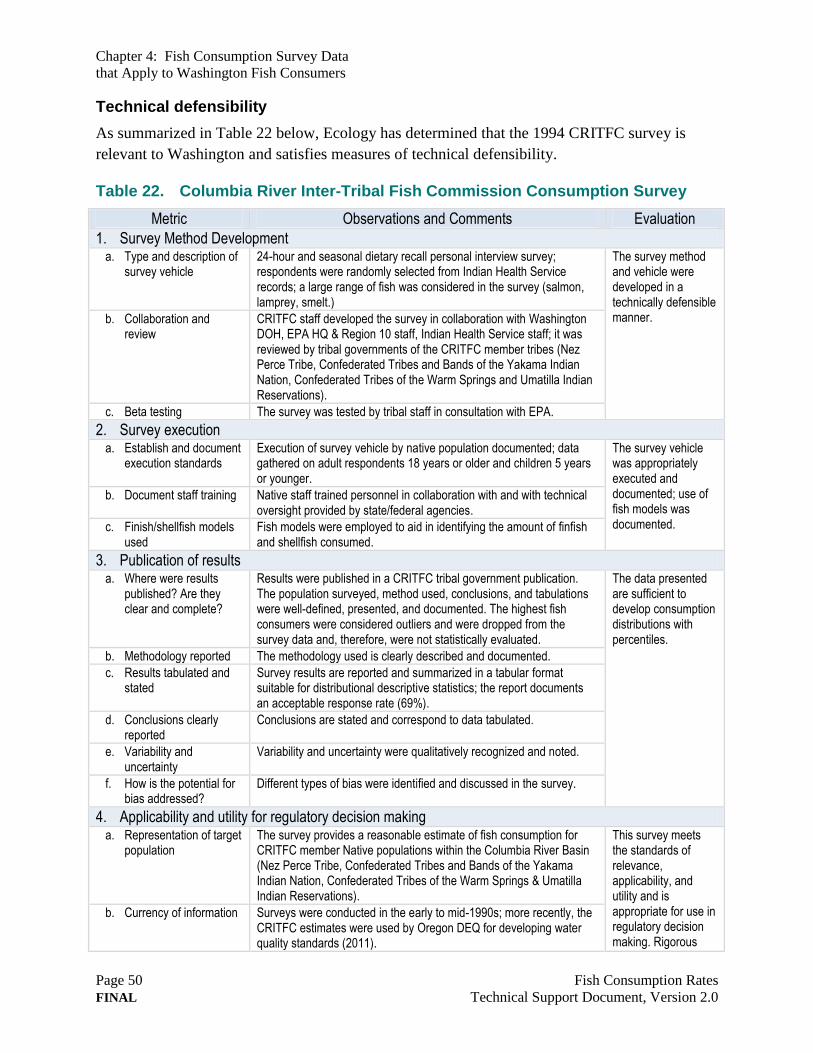
Chapter 4: Fish Consumption Survey Data
that Apply to Washington Fish Consumers
Page 50 Fish Consumption Rates
FINAL Technical Support Document, Version 2.0
Technical defensibility
As summarized in Table 22 below, Ecology has determined that the 1994 CRITFC survey is
relevant to Washington and satisfies measures of technical defensibility.
Table 22. Columbia River Inter-Tribal Fish Commission Consumption Survey
Metric Observations and Comments Evaluation
1. Survey Method Development a. Type and description of
survey vehicle 24-hour and seasonal dietary recall personal interview survey; respondents were randomly selected from Indian Health Service records; a large range of fish was considered in the survey (salmon, lamprey, smelt.)
The survey method and vehicle were developed in a technically defensible manner. b. Collaboration and
review CRITFC staff developed the survey in collaboration with Washington DOH, EPA HQ & Region 10 staff, Indian Health Service staff; it was reviewed by tribal governments of the CRITFC member tribes (Nez Perce Tribe, Confederated Tribes and Bands of the Yakama Indian Nation, Confederated Tribes of the Warm Springs and Umatilla Indian Reservations).
c. Beta testing The survey was tested by tribal staff in consultation with EPA.
2. Survey execution a. Establish and document
execution standards Execution of survey vehicle by native population documented; data gathered on adult respondents 18 years or older and children 5 years or younger.
The survey vehicle was appropriately executed and documented; use of fish models was documented.
b. Document staff training Native staff trained personnel in collaboration with and with technical oversight provided by state/federal agencies.
c. Finish/shellfish models used
Fish models were employed to aid in identifying the amount of finfish and shellfish consumed.
3. Publication of results a. Where were results
published? Are they clear and complete?
Results were published in a CRITFC tribal government publication. The population surveyed, method used, conclusions, and tabulations were well-defined, presented, and documented. The highest fish consumers were considered outliers and were dropped from the survey data and, therefore, were not statistically evaluated.
The data presented are sufficient to develop consumption distributions with percentiles.
b. Methodology reported The methodology used is clearly described and documented.
c. Results tabulated and stated
Survey results are reported and summarized in a tabular format suitable for distributional descriptive statistics; the report documents an acceptable response rate (69%).
d. Conclusions clearly reported
Conclusions are stated and correspond to data tabulated.
e. Variability and uncertainty
Variability and uncertainty were qualitatively recognized and noted.
f. How is the potential for bias addressed?
Different types of bias were identified and discussed in the survey.
4. Applicability and utility for regulatory decision making a. Representation of target
population The survey provides a reasonable estimate of fish consumption for CRITFC member Native populations within the Columbia River Basin (Nez Perce Tribe, Confederated Tribes and Bands of the Yakama Indian Nation, Confederated Tribes of the Warm Springs & Umatilla Indian Reservations).
This survey meets the standards of relevance, applicability, and utility and is appropriate for use in regulatory decision making. Rigorous review of survey design, execution, data analysis, and conclusions.
b. Currency of information Surveys were conducted in the early to mid-1990s; more recently, the CRITFC estimates were used by Oregon DEQ for developing water quality standards (2011).
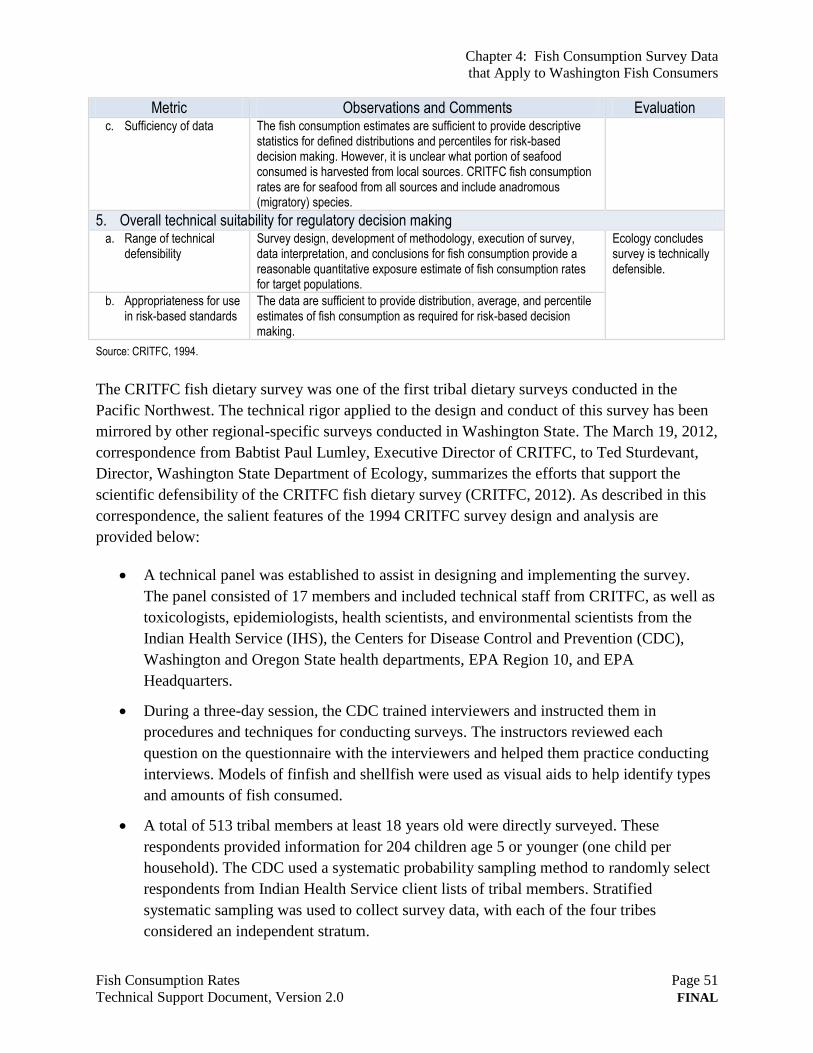
Chapter 4: Fish Consumption Survey Data
that Apply to Washington Fish Consumers
Fish Consumption Rates Page 51
Technical Support Document, Version 2.0 FINAL
Metric Observations and Comments Evaluation c. Sufficiency of data The fish consumption estimates are sufficient to provide descriptive
statistics for defined distributions and percentiles for risk-based decision making. However, it is unclear what portion of seafood consumed is harvested from local sources. CRITFC fish consumption rates are for seafood from all sources and include anadromous (migratory) species.
5. Overall technical suitability for regulatory decision making a. Range of technical
defensibility Survey design, development of methodology, execution of survey, data interpretation, and conclusions for fish consumption provide a reasonable quantitative exposure estimate of fish consumption rates for target populations.
Ecology concludes survey is technically defensible.
b. Appropriateness for use in risk-based standards
The data are sufficient to provide distribution, average, and percentile estimates of fish consumption as required for risk-based decision making.
Source: CRITFC, 1994.
The CRITFC fish dietary survey was one of the first tribal dietary surveys conducted in the
Pacific Northwest. The technical rigor applied to the design and conduct of this survey has been
mirrored by other regional-specific surveys conducted in Washington State. The March 19, 2012,
correspondence from Babtist Paul Lumley, Executive Director of CRITFC, to Ted Sturdevant,
Director, Washington State Department of Ecology, summarizes the efforts that support the
scientific defensibility of the CRITFC fish dietary survey (CRITFC, 2012). As described in this
correspondence, the salient features of the 1994 CRITFC survey design and analysis are
provided below:
A technical panel was established to assist in designing and implementing the survey.
The panel consisted of 17 members and included technical staff from CRITFC, as well as
toxicologists, epidemiologists, health scientists, and environmental scientists from the
Indian Health Service (IHS), the Centers for Disease Control and Prevention (CDC),
Washington and Oregon State health departments, EPA Region 10, and EPA
Headquarters.
During a three-day session, the CDC trained interviewers and instructed them in
procedures and techniques for conducting surveys. The instructors reviewed each
question on the questionnaire with the interviewers and helped them practice conducting
interviews. Models of finfish and shellfish were used as visual aids to help identify types
and amounts of fish consumed.
A total of 513 tribal members at least 18 years old were directly surveyed. These
respondents provided information for 204 children age 5 or younger (one child per
household). The CDC used a systematic probability sampling method to randomly select
respondents from Indian Health Service client lists of tribal members. Stratified
systematic sampling was used to collect survey data, with each of the four tribes
considered an independent stratum.
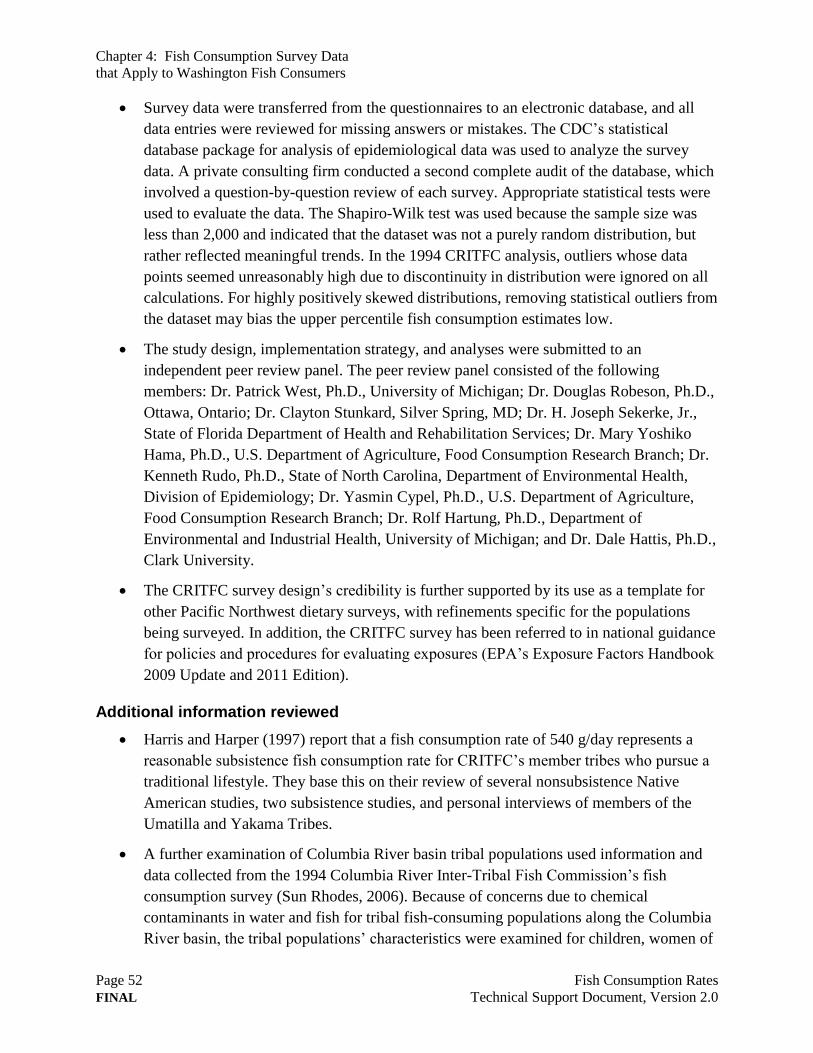
Chapter 4: Fish Consumption Survey Data
that Apply to Washington Fish Consumers
Page 52 Fish Consumption Rates
FINAL Technical Support Document, Version 2.0
Survey data were transferred from the questionnaires to an electronic database, and all
data entries were reviewed for missing answers or mistakes. The CDC’s statistical
database package for analysis of epidemiological data was used to analyze the survey
data. A private consulting firm conducted a second complete audit of the database, which
involved a question-by-question review of each survey. Appropriate statistical tests were
used to evaluate the data. The Shapiro-Wilk test was used because the sample size was
less than 2,000 and indicated that the dataset was not a purely random distribution, but
rather reflected meaningful trends. In the 1994 CRITFC analysis, outliers whose data
points seemed unreasonably high due to discontinuity in distribution were ignored on all
calculations. For highly positively skewed distributions, removing statistical outliers from
the dataset may bias the upper percentile fish consumption estimates low.
The study design, implementation strategy, and analyses were submitted to an
independent peer review panel. The peer review panel consisted of the following
members: Dr. Patrick West, Ph.D., University of Michigan; Dr. Douglas Robeson, Ph.D.,
Ottawa, Ontario; Dr. Clayton Stunkard, Silver Spring, MD; Dr. H. Joseph Sekerke, Jr.,
State of Florida Department of Health and Rehabilitation Services; Dr. Mary Yoshiko
Hama, Ph.D., U.S. Department of Agriculture, Food Consumption Research Branch; Dr.
Kenneth Rudo, Ph.D., State of North Carolina, Department of Environmental Health,
Division of Epidemiology; Dr. Yasmin Cypel, Ph.D., U.S. Department of Agriculture,
Food Consumption Research Branch; Dr. Rolf Hartung, Ph.D., Department of
Environmental and Industrial Health, University of Michigan; and Dr. Dale Hattis, Ph.D.,
Clark University.
The CRITFC survey design’s credibility is further supported by its use as a template for
other Pacific Northwest dietary surveys, with refinements specific for the populations
being surveyed. In addition, the CRITFC survey has been referred to in national guidance
for policies and procedures for evaluating exposures (EPA’s Exposure Factors Handbook
2009 Update and 2011 Edition).
Additional information reviewed
Harris and Harper (1997) report that a fish consumption rate of 540 g/day represents a
reasonable subsistence fish consumption rate for CRITFC’s member tribes who pursue a
traditional lifestyle. They base this on their review of several nonsubsistence Native
American studies, two subsistence studies, and personal interviews of members of the
Umatilla and Yakama Tribes.
A further examination of Columbia River basin tribal populations used information and
data collected from the 1994 Columbia River Inter-Tribal Fish Commission’s fish
consumption survey (Sun Rhodes, 2006). Because of concerns due to chemical
contaminants in water and fish for tribal fish-consuming populations along the Columbia
River basin, the tribal populations’ characteristics were examined for children, women of
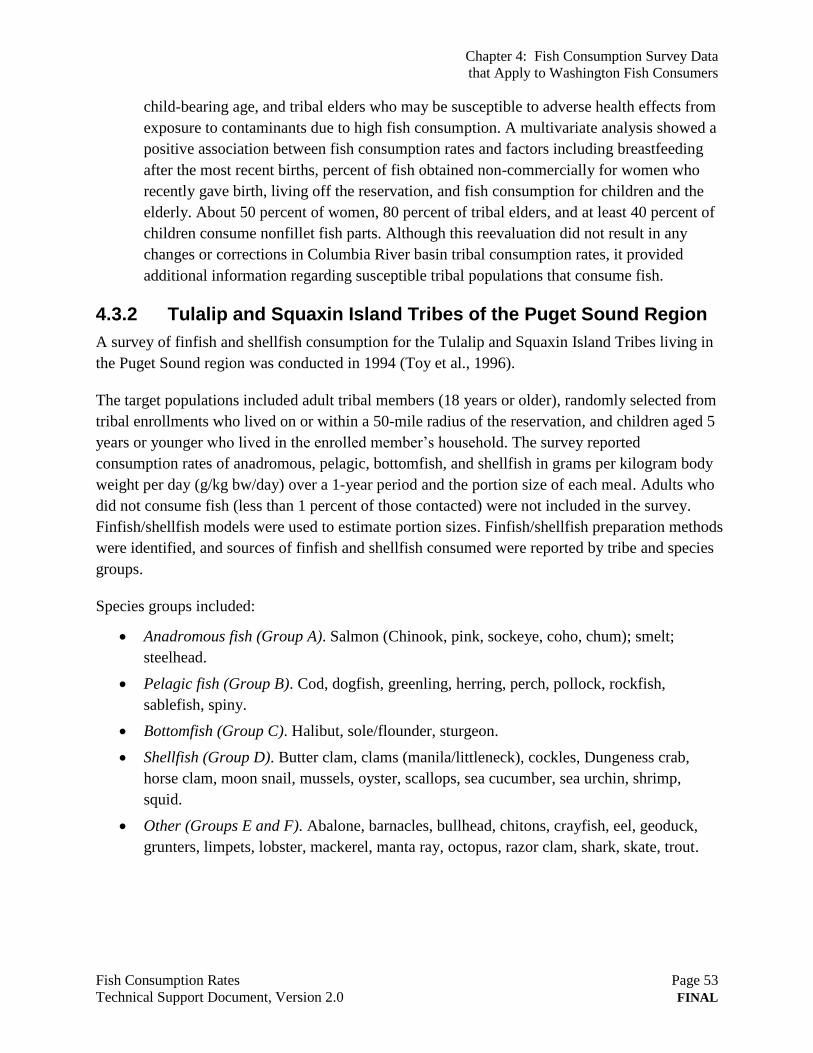
Chapter 4: Fish Consumption Survey Data
that Apply to Washington Fish Consumers
Fish Consumption Rates Page 53
Technical Support Document, Version 2.0 FINAL
child-bearing age, and tribal elders who may be susceptible to adverse health effects from
exposure to contaminants due to high fish consumption. A multivariate analysis showed a
positive association between fish consumption rates and factors including breastfeeding
after the most recent births, percent of fish obtained non-commercially for women who
recently gave birth, living off the reservation, and fish consumption for children and the
elderly. About 50 percent of women, 80 percent of tribal elders, and at least 40 percent of
children consume nonfillet fish parts. Although this reevaluation did not result in any
changes or corrections in Columbia River basin tribal consumption rates, it provided
additional information regarding susceptible tribal populations that consume fish.
4.3.2 Tulalip and Squaxin Island Tribes of the Puget Sound Region
A survey of finfish and shellfish consumption for the Tulalip and Squaxin Island Tribes living in
the Puget Sound region was conducted in 1994 (Toy et al., 1996).
The target populations included adult tribal members (18 years or older), randomly selected from
tribal enrollments who lived on or within a 50-mile radius of the reservation, and children aged 5
years or younger who lived in the enrolled member’s household. The survey reported
consumption rates of anadromous, pelagic, bottomfish, and shellfish in grams per kilogram body
weight per day (g/kg bw/day) over a 1-year period and the portion size of each meal. Adults who
did not consume fish (less than 1 percent of those contacted) were not included in the survey.
Finfish/shellfish models were used to estimate portion sizes. Finfish/shellfish preparation methods
were identified, and sources of finfish and shellfish consumed were reported by tribe and species
groups.
Species groups included:
Anadromous fish (Group A). Salmon (Chinook, pink, sockeye, coho, chum); smelt;
steelhead.
Pelagic fish (Group B). Cod, dogfish, greenling, herring, perch, pollock, rockfish,
sablefish, spiny.
Bottomfish (Group C). Halibut, sole/flounder, sturgeon.
Shellfish (Group D). Butter clam, clams (manila/littleneck), cockles, Dungeness crab,
horse clam, moon snail, mussels, oyster, scallops, sea cucumber, sea urchin, shrimp,
squid.
Other (Groups E and F). Abalone, barnacles, bullhead, chitons, crayfish, eel, geoduck,
grunters, limpets, lobster, mackerel, manta ray, octopus, razor clam, shark, skate, trout.
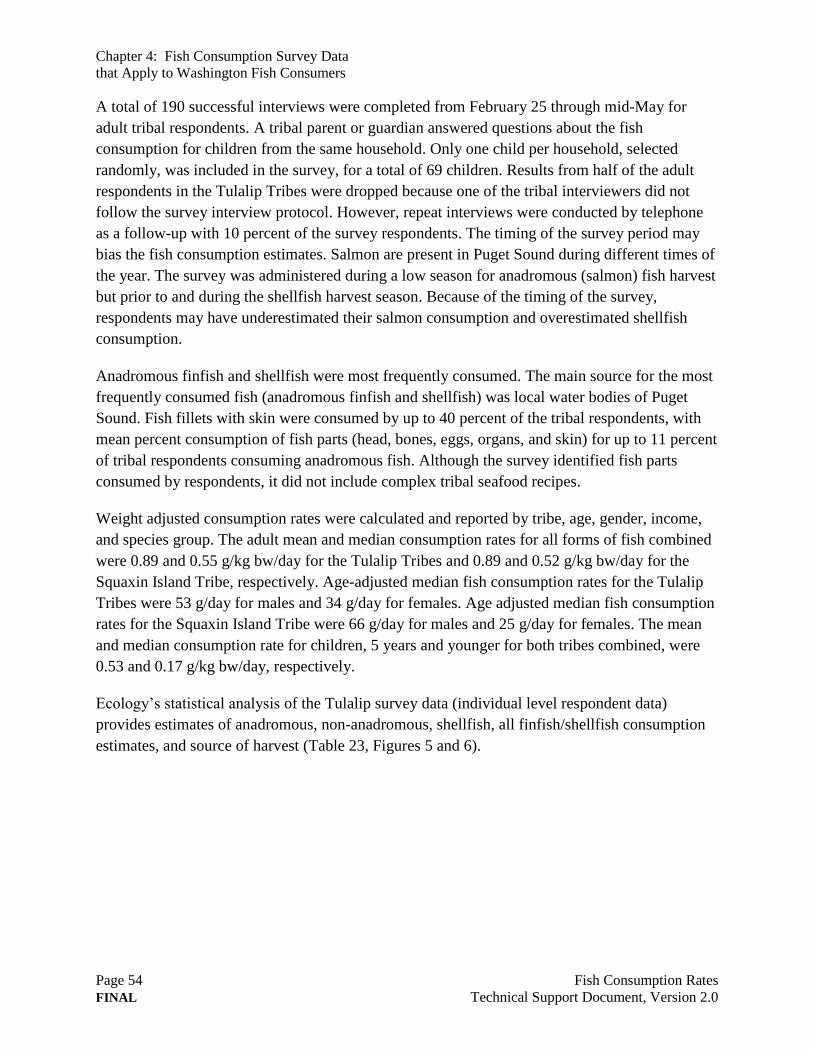
Chapter 4: Fish Consumption Survey Data
that Apply to Washington Fish Consumers
Page 54 Fish Consumption Rates
FINAL Technical Support Document, Version 2.0
A total of 190 successful interviews were completed from February 25 through mid-May for
adult tribal respondents. A tribal parent or guardian answered questions about the fish
consumption for children from the same household. Only one child per household, selected
randomly, was included in the survey, for a total of 69 children. Results from half of the adult
respondents in the Tulalip Tribes were dropped because one of the tribal interviewers did not
follow the survey interview protocol. However, repeat interviews were conducted by telephone
as a follow-up with 10 percent of the survey respondents. The timing of the survey period may
bias the fish consumption estimates. Salmon are present in Puget Sound during different times of
the year. The survey was administered during a low season for anadromous (salmon) fish harvest
but prior to and during the shellfish harvest season. Because of the timing of the survey,
respondents may have underestimated their salmon consumption and overestimated shellfish
consumption.
Anadromous finfish and shellfish were most frequently consumed. The main source for the most
frequently consumed fish (anadromous finfish and shellfish) was local water bodies of Puget
Sound. Fish fillets with skin were consumed by up to 40 percent of the tribal respondents, with
mean percent consumption of fish parts (head, bones, eggs, organs, and skin) for up to 11 percent
of tribal respondents consuming anadromous fish. Although the survey identified fish parts
consumed by respondents, it did not include complex tribal seafood recipes.
Weight adjusted consumption rates were calculated and reported by tribe, age, gender, income,
and species group. The adult mean and median consumption rates for all forms of fish combined
were 0.89 and 0.55 g/kg bw/day for the Tulalip Tribes and 0.89 and 0.52 g/kg bw/day for the
Squaxin Island Tribe, respectively. Age-adjusted median fish consumption rates for the Tulalip
Tribes were 53 g/day for males and 34 g/day for females. Age adjusted median fish consumption
rates for the Squaxin Island Tribe were 66 g/day for males and 25 g/day for females. The mean
and median consumption rate for children, 5 years and younger for both tribes combined, were
0.53 and 0.17 g/kg bw/day, respectively.
Ecology’s statistical analysis of the Tulalip survey data (individual level respondent data)
provides estimates of anadromous, non-anadromous, shellfish, all finfish/shellfish consumption
estimates, and source of harvest (Table 23, Figures 5 and 6).
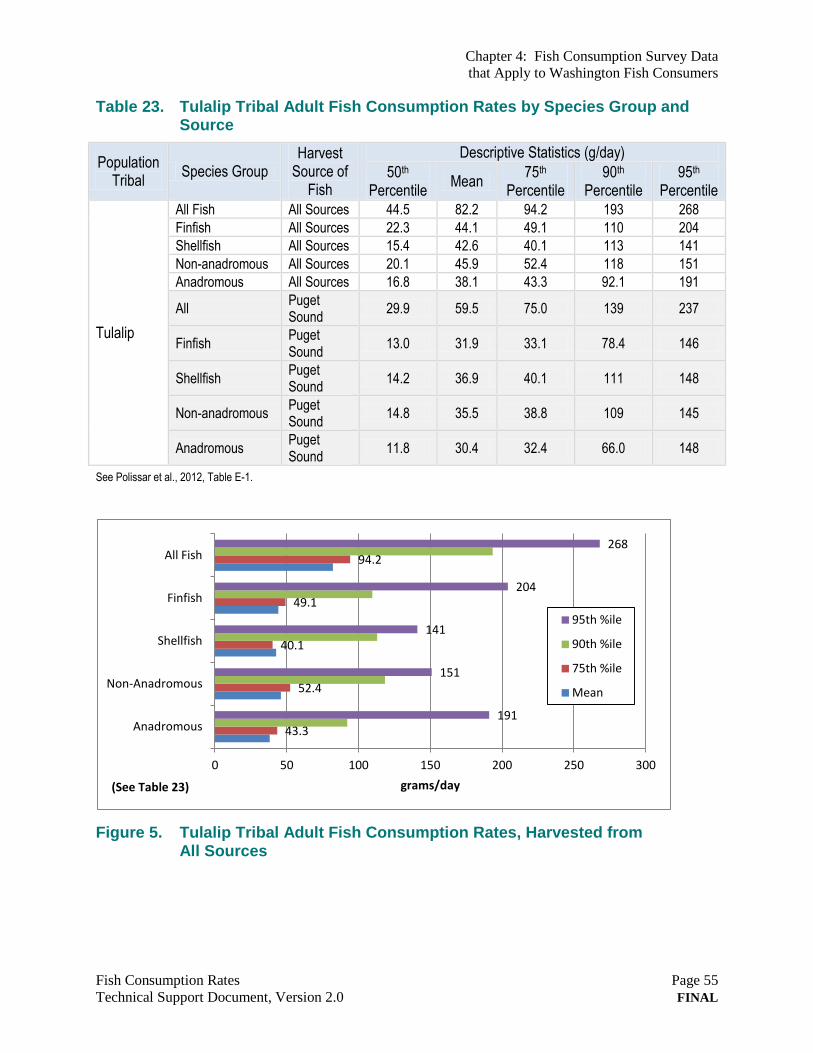
Chapter 4: Fish Consumption Survey Data
that Apply to Washington Fish Consumers
Fish Consumption Rates Page 55
Technical Support Document, Version 2.0 FINAL
Table 23. Tulalip Tribal Adult Fish Consumption Rates by Species Group and Source
Population Tribal
Species Group
Harvest Source of
Fish
Descriptive Statistics (g/day)
50th Percentile
Mean 75th
Percentile
90th Percentile
95th Percentile
Tulalip
All Fish All Sources 44.5 82.2 94.2 193 268
Finfish All Sources 22.3 44.1 49.1 110 204
Shellfish All Sources 15.4 42.6 40.1 113 141
Non-anadromous All Sources 20.1 45.9 52.4 118 151
Anadromous All Sources 16.8 38.1 43.3 92.1 191
All Puget Sound
29.9 59.5 75.0 139 237
Finfish Puget Sound
13.0 31.9 33.1 78.4 146
Shellfish Puget Sound
14.2 36.9 40.1 111 148
Non-anadromous Puget Sound
14.8 35.5 38.8 109 145
Anadromous Puget Sound
11.8 30.4 32.4 66.0 148
See Polissar et al., 2012, Table E-1.
Figure 5. Tulalip Tribal Adult Fish Consumption Rates, Harvested from All Sources
43.3
52.4
40.1
49.1
94.2
191
151
141
204
268
0 50 100 150 200 250 300
Anadromous
Non-Anadromous
Shellfish
Finfish
All Fish
grams/day
95th %ile
90th %ile
75th %ile
Mean
(See Table 23)
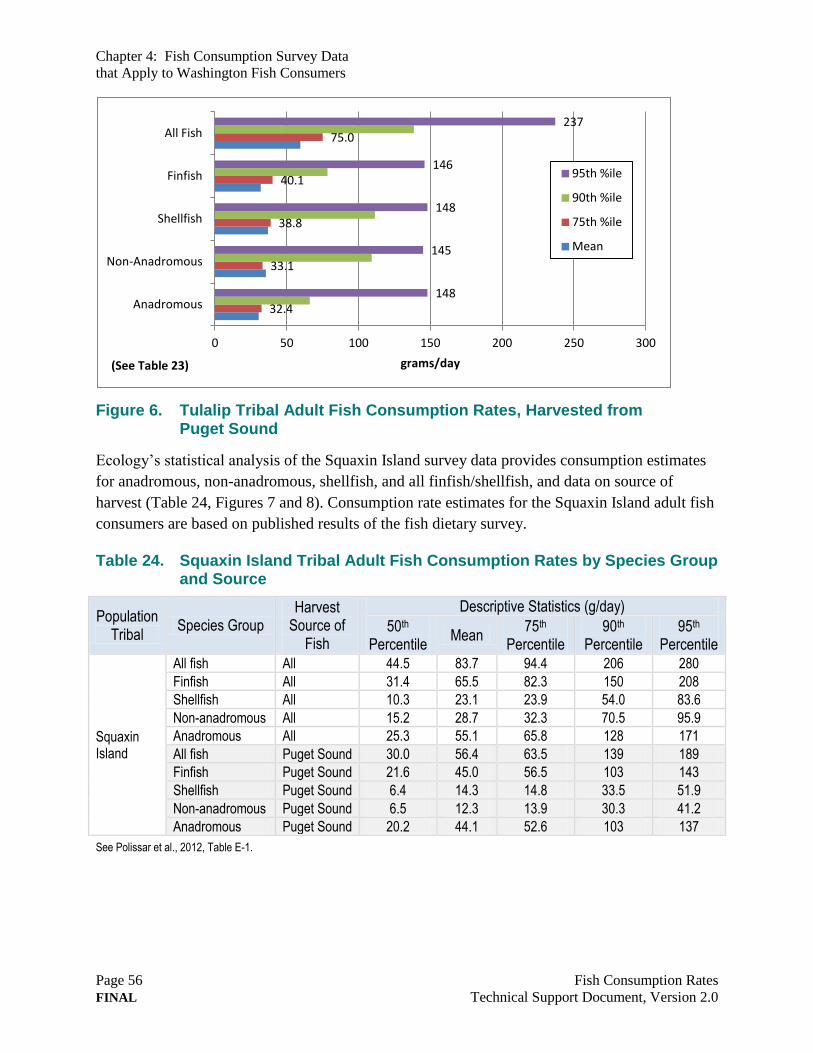
Chapter 4: Fish Consumption Survey Data
that Apply to Washington Fish Consumers
Page 56 Fish Consumption Rates
FINAL Technical Support Document, Version 2.0
Figure 6. Tulalip Tribal Adult Fish Consumption Rates, Harvested from Puget Sound
Ecology’s statistical analysis of the Squaxin Island survey data provides consumption estimates
for anadromous, non-anadromous, shellfish, and all finfish/shellfish, and data on source of
harvest (Table 24, Figures 7 and 8). Consumption rate estimates for the Squaxin Island adult fish
consumers are based on published results of the fish dietary survey.
Table 24. Squaxin Island Tribal Adult Fish Consumption Rates by Species Group and Source
Population Tribal
Species Group Harvest
Source of Fish
Descriptive Statistics (g/day)
50th Percentile
Mean 75th
Percentile 90th
Percentile 95th
Percentile
Squaxin Island
All fish All 44.5 83.7 94.4 206 280
Finfish All 31.4 65.5 82.3 150 208
Shellfish All 10.3 23.1 23.9 54.0 83.6
Non-anadromous All 15.2 28.7 32.3 70.5 95.9
Anadromous All 25.3 55.1 65.8 128 171
All fish Puget Sound 30.0 56.4 63.5 139 189
Finfish Puget Sound 21.6 45.0 56.5 103 143
Shellfish Puget Sound 6.4 14.3 14.8 33.5 51.9
Non-anadromous Puget Sound 6.5 12.3 13.9 30.3 41.2
Anadromous Puget Sound 20.2 44.1 52.6 103 137
See Polissar et al., 2012, Table E-1.
32.4
33.1
38.8
40.1
75.0
148
145
148
146
237
0 50 100 150 200 250 300
Anadromous
Non-Anadromous
Shellfish
Finfish
All Fish
grams/day
95th %ile
90th %ile
75th %ile
Mean
(See Table 23)
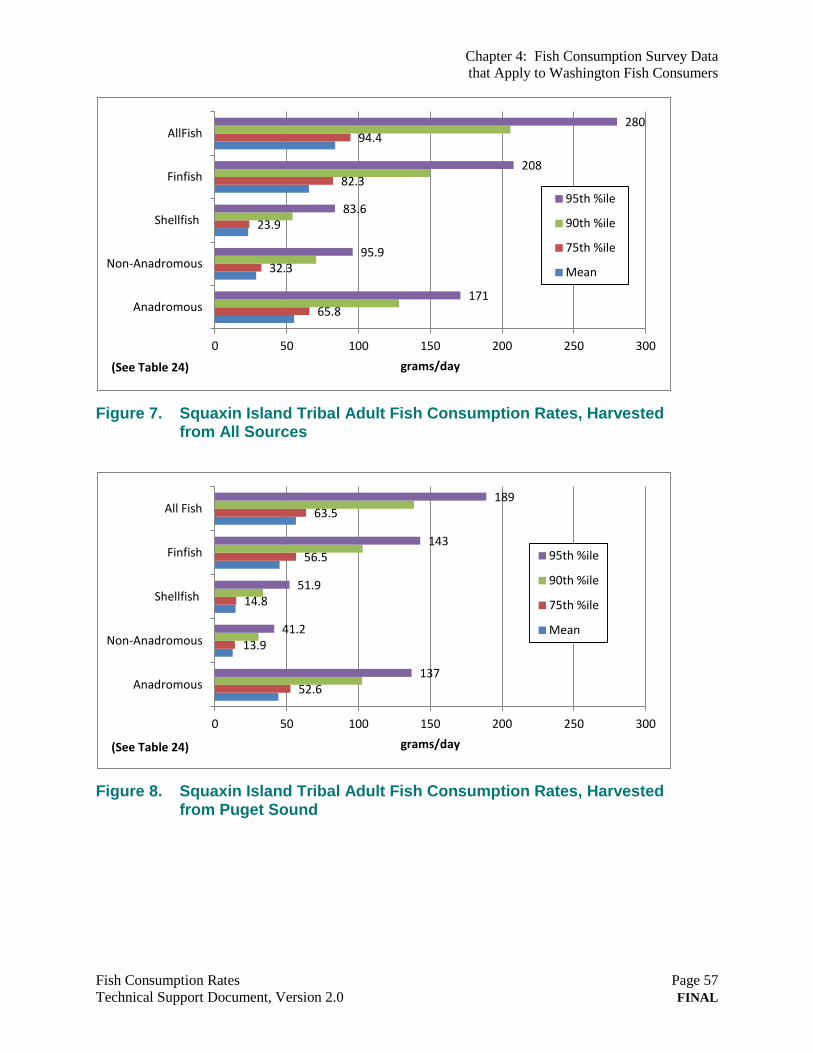
Chapter 4: Fish Consumption Survey Data
that Apply to Washington Fish Consumers
Fish Consumption Rates Page 57
Technical Support Document, Version 2.0 FINAL
Figure 7. Squaxin Island Tribal Adult Fish Consumption Rates, Harvested from All Sources
Figure 8. Squaxin Island Tribal Adult Fish Consumption Rates, Harvested from Puget Sound
65.8
32.3
23.9
82.3
94.4
171
95.9
83.6
208
280
0 50 100 150 200 250 300
Anadromous
Non-Anadromous
Shellfish
Finfish
AllFish
grams/day
95th %ile
90th %ile
75th %ile
Mean
52.6
13.9
14.8
56.5
63.5
137
41.2
51.9
143
189
0 50 100 150 200 250 300
Anadromous
Non-Anadromous
Shellfish
Finfish
All Fish
grams/day
95th %ile
90th %ile
75th %ile
Mean
(See Table 24)
(See Table 24)
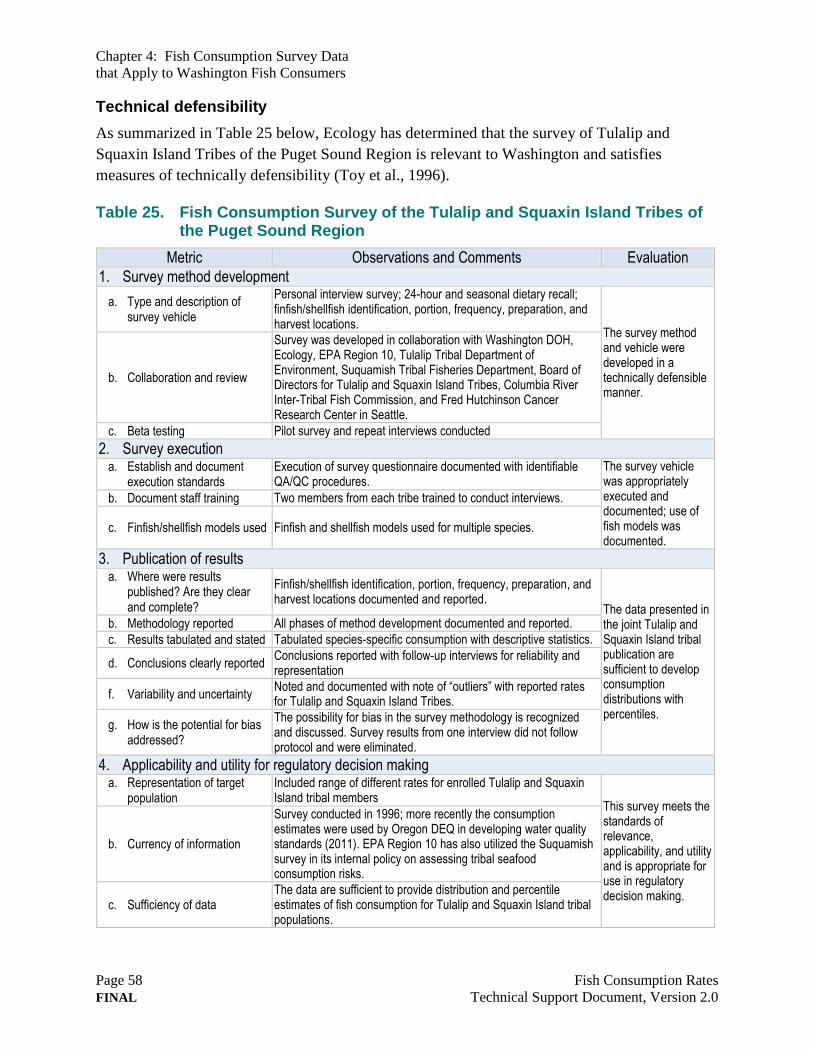
Chapter 4: Fish Consumption Survey Data
that Apply to Washington Fish Consumers
Page 58 Fish Consumption Rates
FINAL Technical Support Document, Version 2.0
Technical defensibility
As summarized in Table 25 below, Ecology has determined that the survey of Tulalip and
Squaxin Island Tribes of the Puget Sound Region is relevant to Washington and satisfies
measures of technically defensibility (Toy et al., 1996).
Table 25. Fish Consumption Survey of the Tulalip and Squaxin Island Tribes of the Puget Sound Region
Metric Observations and Comments Evaluation
1. Survey method development
a. Type and description of survey vehicle
Personal interview survey; 24-hour and seasonal dietary recall; finfish/shellfish identification, portion, frequency, preparation, and harvest locations.
The survey method and vehicle were developed in a technically defensible manner.
b. Collaboration and review
Survey was developed in collaboration with Washington DOH, Ecology, EPA Region 10, Tulalip Tribal Department of Environment, Suquamish Tribal Fisheries Department, Board of Directors for Tulalip and Squaxin Island Tribes, Columbia River Inter-Tribal Fish Commission, and Fred Hutchinson Cancer Research Center in Seattle.
c. Beta testing Pilot survey and repeat interviews conducted
2. Survey execution a. Establish and document
execution standards Execution of survey questionnaire documented with identifiable QA/QC procedures.
The survey vehicle was appropriately executed and documented; use of fish models was documented.
b. Document staff training Two members from each tribe trained to conduct interviews.
c. Finfish/shellfish models used Finfish and shellfish models used for multiple species.
3. Publication of results a. Where were results
published? Are they clear and complete?
Finfish/shellfish identification, portion, frequency, preparation, and harvest locations documented and reported.
The data presented in the joint Tulalip and Squaxin Island tribal publication are sufficient to develop consumption distributions with percentiles.
b. Methodology reported All phases of method development documented and reported.
c. Results tabulated and stated Tabulated species-specific consumption with descriptive statistics.
d. Conclusions clearly reported Conclusions reported with follow-up interviews for reliability and representation
f. Variability and uncertainty Noted and documented with note of “outliers” with reported rates for Tulalip and Squaxin Island Tribes.
g. How is the potential for bias addressed?
The possibility for bias in the survey methodology is recognized and discussed. Survey results from one interview did not follow protocol and were eliminated.
4. Applicability and utility for regulatory decision making a. Representation of target
population Included range of different rates for enrolled Tulalip and Squaxin Island tribal members
This survey meets the standards of relevance, applicability, and utility and is appropriate for use in regulatory decision making.
b. Currency of information
Survey conducted in 1996; more recently the consumption estimates were used by Oregon DEQ in developing water quality standards (2011). EPA Region 10 has also utilized the Suquamish survey in its internal policy on assessing tribal seafood consumption risks.
c. Sufficiency of data The data are sufficient to provide distribution and percentile estimates of fish consumption for Tulalip and Squaxin Island tribal populations.
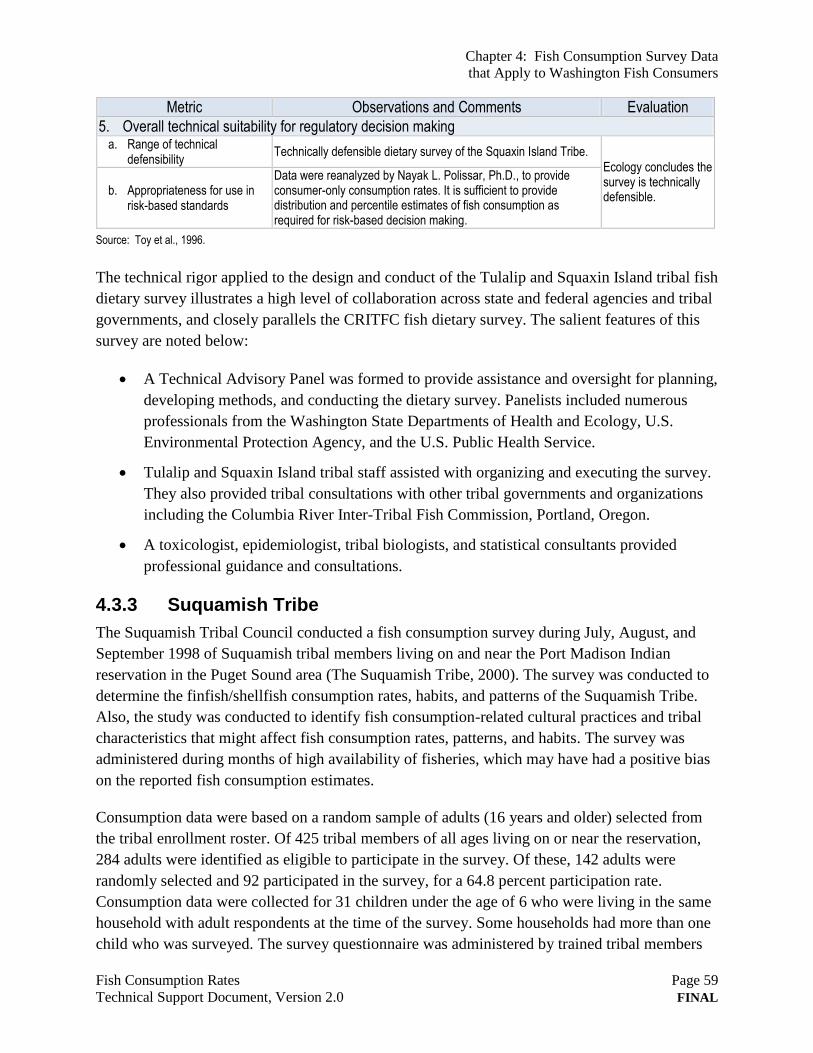
Chapter 4: Fish Consumption Survey Data
that Apply to Washington Fish Consumers
Fish Consumption Rates Page 59
Technical Support Document, Version 2.0 FINAL
Metric Observations and Comments Evaluation
5. Overall technical suitability for regulatory decision making a. Range of technical
defensibility Technically defensible dietary survey of the Squaxin Island Tribe.
Ecology concludes the survey is technically defensible.
b. Appropriateness for use in risk-based standards
Data were reanalyzed by Nayak L. Polissar, Ph.D., to provide consumer-only consumption rates. It is sufficient to provide distribution and percentile estimates of fish consumption as required for risk-based decision making.
Source: Toy et al., 1996.
The technical rigor applied to the design and conduct of the Tulalip and Squaxin Island tribal fish
dietary survey illustrates a high level of collaboration across state and federal agencies and tribal
governments, and closely parallels the CRITFC fish dietary survey. The salient features of this
survey are noted below:
A Technical Advisory Panel was formed to provide assistance and oversight for planning,
developing methods, and conducting the dietary survey. Panelists included numerous
professionals from the Washington State Departments of Health and Ecology, U.S.
Environmental Protection Agency, and the U.S. Public Health Service.
Tulalip and Squaxin Island tribal staff assisted with organizing and executing the survey.
They also provided tribal consultations with other tribal governments and organizations
including the Columbia River Inter-Tribal Fish Commission, Portland, Oregon.
A toxicologist, epidemiologist, tribal biologists, and statistical consultants provided
professional guidance and consultations.
4.3.3 Suquamish Tribe
The Suquamish Tribal Council conducted a fish consumption survey during July, August, and
September 1998 of Suquamish tribal members living on and near the Port Madison Indian
reservation in the Puget Sound area (The Suquamish Tribe, 2000). The survey was conducted to
determine the finfish/shellfish consumption rates, habits, and patterns of the Suquamish Tribe.
Also, the study was conducted to identify fish consumption-related cultural practices and tribal
characteristics that might affect fish consumption rates, patterns, and habits. The survey was
administered during months of high availability of fisheries, which may have had a positive bias
on the reported fish consumption estimates.
Consumption data were based on a random sample of adults (16 years and older) selected from
the tribal enrollment roster. Of 425 tribal members of all ages living on or near the reservation,
284 adults were identified as eligible to participate in the survey. Of these, 142 adults were
randomly selected and 92 participated in the survey, for a 64.8 percent participation rate.
Consumption data were collected for 31 children under the age of 6 who were living in the same
household with adult respondents at the time of the survey. Some households had more than one
child who was surveyed. The survey questionnaire was administered by trained tribal members
Chapter 4: Fish Consumption Survey Data
that Apply to Washington Fish Consumers
Page 60 Fish Consumption Rates
FINAL Technical Support Document, Version 2.0
using personal interviews and included two parts: a 24-hour dietary recall, and an assessment of
fish consumption over the course of a year.37
In addition, the survey included information on:
Fish species identification, portion sizes, frequency of consumption, methods of
preparation, harvest locations.
Shellfish consumption, methods of preparation, harvest location.
Changes in consumption over time, cultural information, physical information, and
socioeconomic information.
Finfish/shellfish models were used to assist tribal respondents regarding amounts and types
consumed. Booklets were used to assist in identifying harvest locations of seafood consumed.
Finfish/shellfish were grouped into categories based on similarities in life history and practices
of tribal members who fish for subsistence, ceremonial, and commercial purposes. The majority
of finfish/shellfish consumed by the Suquamish Tribe was harvested from Puget Sound, with
Pacific salmon and shellfish consumed more than other fish.
All 92 adult tribal respondents reported consuming some type of fish; hence, no non-consumers
of fish were surveyed. Survey results were recorded as grams per kilogram per day (g/kg/day)
along with the respondent’s body weight. Adult respondents reported a mean consumption rate
of all finfish and shellfish consumption rate of 2.71 g/kg/day. For children under 6 years old, the
mean consumption of all finfish and shellfish was 1.48 g/kg/day. Below are weight-adjusted
survey results for Suquamish adult fish consumers.
Ecology’s statistical analysis of the Suquamish dietary data for Suquamish tribal adult fish
consumers provides finfish, shellfish, and non-anadromous consumption rates by species groups
and sources of fish consumed (Table 26, Figures 9 and 10).
37 Estimates of maximum amounts of fish consumed, either as a rate or portion size, from a highly positively skewed dataset can be very large with estimates of several pounds of fish consumed. These maximum fish consumption estimates reflect the maximum amount of fish consumed by a subset of fish consumers within a larger indigenous fish-consuming population. Harper, Harris, and Donatuto have indicated that these very high fish consumers are true subsistence populations (fish consumption rate exceeding 454 g/day or 1 pound/day) within the larger indigenous fish-consuming populations (Harris and Harper, 1997; Harper and Harris, 2008; Donatuto and Harper, 2008).
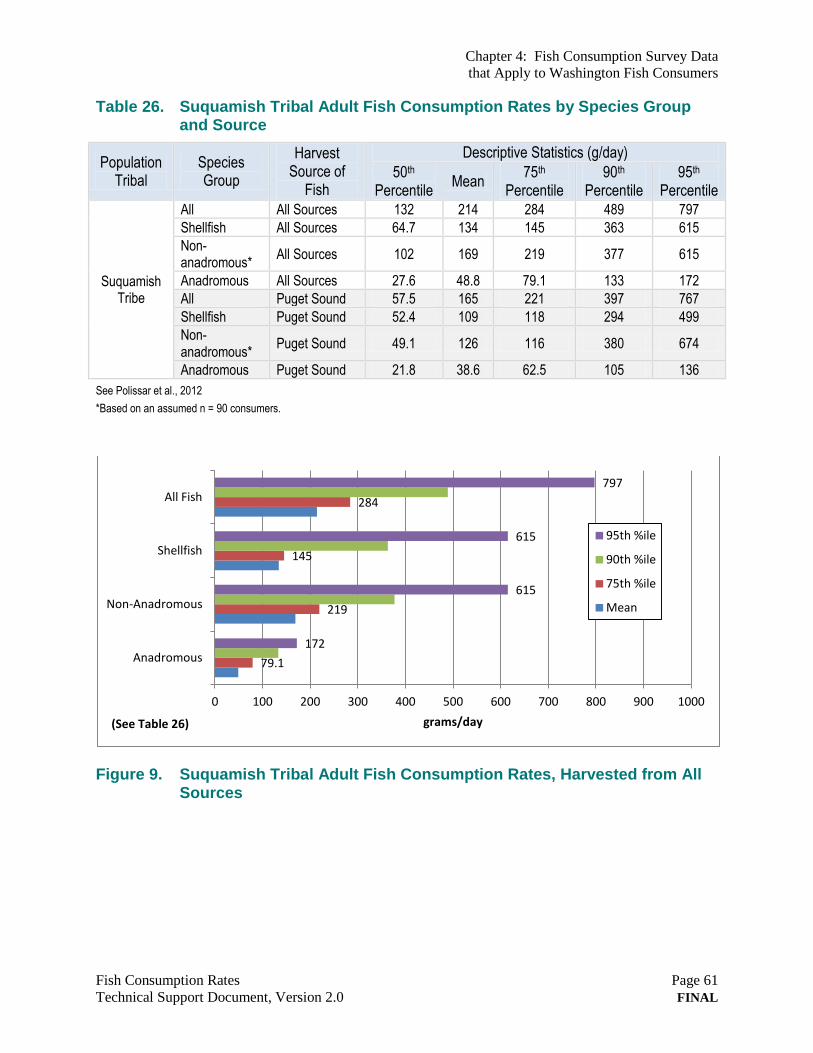
Chapter 4: Fish Consumption Survey Data
that Apply to Washington Fish Consumers
Fish Consumption Rates Page 61
Technical Support Document, Version 2.0 FINAL
Table 26. Suquamish Tribal Adult Fish Consumption Rates by Species Group and Source
Population Tribal
Species Group
Harvest Source of
Fish
Descriptive Statistics (g/day)
50th Percentile
Mean 75th
Percentile 90th
Percentile 95th
Percentile
Suquamish Tribe
All All Sources 132 214 284 489 797
Shellfish All Sources 64.7 134 145 363 615
Non- anadromous*
All Sources 102 169 219 377 615
Anadromous All Sources 27.6 48.8 79.1 133 172
All Puget Sound 57.5 165 221 397 767
Shellfish Puget Sound 52.4 109 118 294 499
Non- anadromous*
Puget Sound 49.1 126 116 380 674
Anadromous Puget Sound 21.8 38.6 62.5 105 136
See Polissar et al., 2012
*Based on an assumed n = 90 consumers.
Figure 9. Suquamish Tribal Adult Fish Consumption Rates, Harvested from All Sources
79.1
219
145
284
172
615
615
797
0 100 200 300 400 500 600 700 800 900 1000
Anadromous
Non-Anadromous
Shellfish
All Fish
grams/day
95th %ile
90th %ile
75th %ile
Mean
(See Table 26)
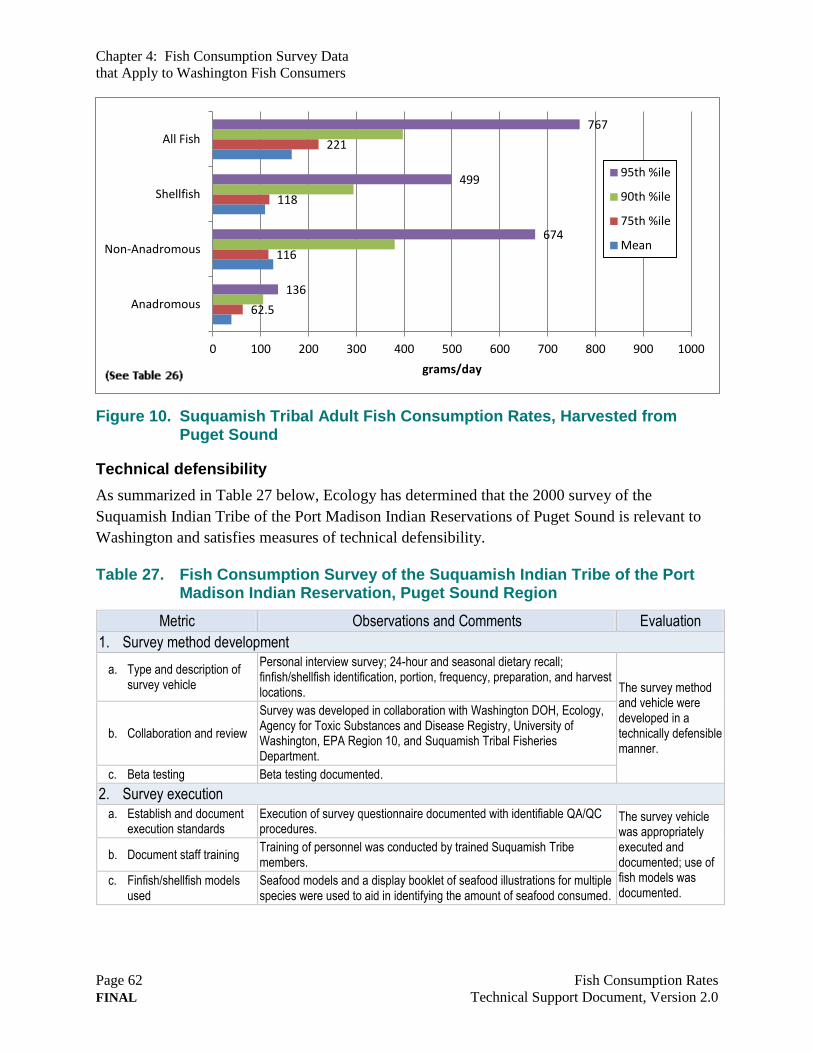
Chapter 4: Fish Consumption Survey Data
that Apply to Washington Fish Consumers
Page 62 Fish Consumption Rates
FINAL Technical Support Document, Version 2.0
Figure 10. Suquamish Tribal Adult Fish Consumption Rates, Harvested from Puget Sound
Technical defensibility
As summarized in Table 27 below, Ecology has determined that the 2000 survey of the
Suquamish Indian Tribe of the Port Madison Indian Reservations of Puget Sound is relevant to
Washington and satisfies measures of technical defensibility.
Table 27. Fish Consumption Survey of the Suquamish Indian Tribe of the Port Madison Indian Reservation, Puget Sound Region
Metric Observations and Comments Evaluation
1. Survey method development
a. Type and description of survey vehicle
Personal interview survey; 24-hour and seasonal dietary recall; finfish/shellfish identification, portion, frequency, preparation, and harvest locations. The survey method
and vehicle were developed in a technically defensible manner.
b. Collaboration and review
Survey was developed in collaboration with Washington DOH, Ecology, Agency for Toxic Substances and Disease Registry, University of Washington, EPA Region 10, and Suquamish Tribal Fisheries Department.
c. Beta testing Beta testing documented.
2. Survey execution
a. Establish and document execution standards
Execution of survey questionnaire documented with identifiable QA/QC procedures.
The survey vehicle was appropriately executed and documented; use of fish models was documented.
b. Document staff training Training of personnel was conducted by trained Suquamish Tribe members.
c. Finfish/shellfish models used
Seafood models and a display booklet of seafood illustrations for multiple species were used to aid in identifying the amount of seafood consumed.
62.5
116
118
221
136
674
499
767
0 100 200 300 400 500 600 700 800 900 1000
Anadromous
Non-Anadromous
Shellfish
All Fish
grams/day
95th %ile
90th %ile
75th %ile
Mean
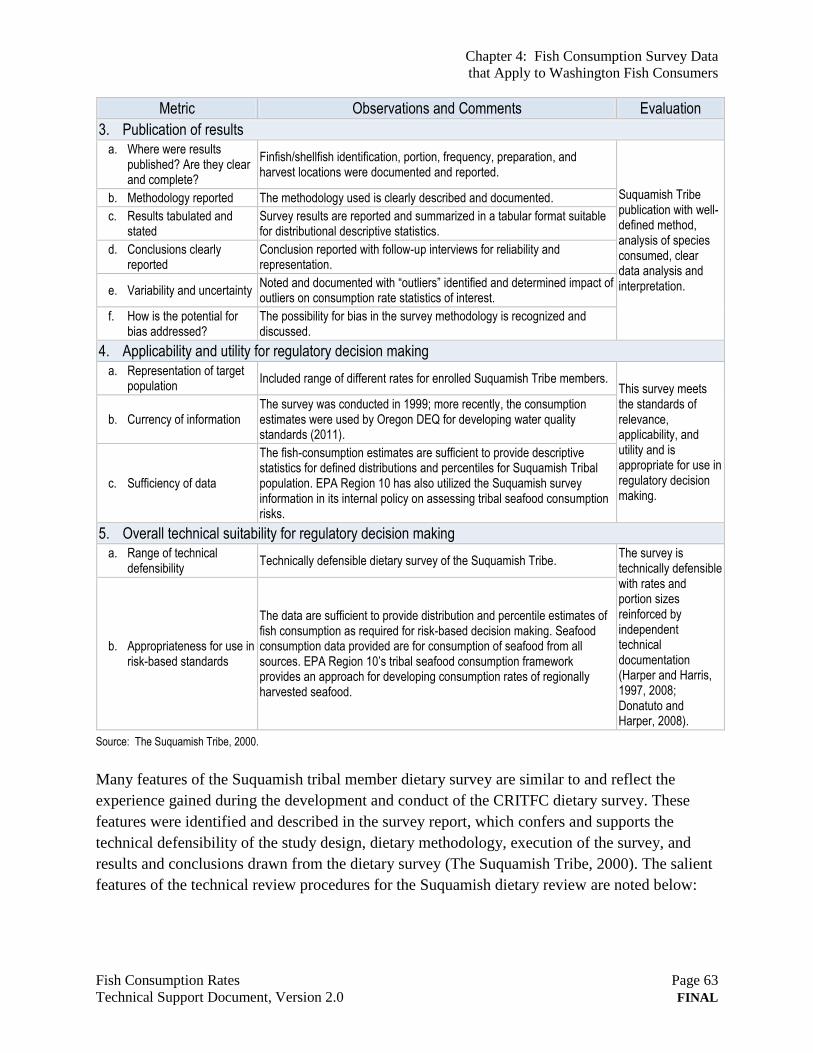
Chapter 4: Fish Consumption Survey Data
that Apply to Washington Fish Consumers
Fish Consumption Rates Page 63
Technical Support Document, Version 2.0 FINAL
Metric Observations and Comments Evaluation
3. Publication of results a. Where were results
published? Are they clear and complete?
Finfish/shellfish identification, portion, frequency, preparation, and harvest locations were documented and reported.
Suquamish Tribe publication with well-defined method, analysis of species consumed, clear data analysis and interpretation.
b. Methodology reported The methodology used is clearly described and documented.
c. Results tabulated and stated
Survey results are reported and summarized in a tabular format suitable for distributional descriptive statistics.
d. Conclusions clearly reported
Conclusion reported with follow-up interviews for reliability and representation.
e. Variability and uncertainty Noted and documented with “outliers” identified and determined impact of outliers on consumption rate statistics of interest.
f. How is the potential for bias addressed?
The possibility for bias in the survey methodology is recognized and discussed.
4. Applicability and utility for regulatory decision making
a. Representation of target population
Included range of different rates for enrolled Suquamish Tribe members. This survey meets the standards of relevance, applicability, and utility and is appropriate for use in regulatory decision making.
b. Currency of information The survey was conducted in 1999; more recently, the consumption estimates were used by Oregon DEQ for developing water quality standards (2011).
c. Sufficiency of data
The fish-consumption estimates are sufficient to provide descriptive statistics for defined distributions and percentiles for Suquamish Tribal population. EPA Region 10 has also utilized the Suquamish survey information in its internal policy on assessing tribal seafood consumption risks.
5. Overall technical suitability for regulatory decision making a. Range of technical
defensibility Technically defensible dietary survey of the Suquamish Tribe.
The survey is technically defensible with rates and portion sizes reinforced by independent technical documentation (Harper and Harris, 1997, 2008; Donatuto and Harper, 2008).
b. Appropriateness for use in risk-based standards
The data are sufficient to provide distribution and percentile estimates of fish consumption as required for risk-based decision making. Seafood consumption data provided are for consumption of seafood from all sources. EPA Region 10’s tribal seafood consumption framework provides an approach for developing consumption rates of regionally harvested seafood.
Source: The Suquamish Tribe, 2000.
Many features of the Suquamish tribal member dietary survey are similar to and reflect the
experience gained during the development and conduct of the CRITFC dietary survey. These
features were identified and described in the survey report, which confers and supports the
technical defensibility of the study design, dietary methodology, execution of the survey, and
results and conclusions drawn from the dietary survey (The Suquamish Tribe, 2000). The salient
features of the technical review procedures for the Suquamish dietary review are noted below:
Chapter 4: Fish Consumption Survey Data
that Apply to Washington Fish Consumers
Page 64 Fish Consumption Rates
FINAL Technical Support Document, Version 2.0
The survey was funded through the Agency for Toxic Substances and Disease Registry
(ATSDR), U.S. Department of Health and Human Services, and Washington State
Department of Health with collaboration regarding the survey questionnaire design to
elicit useful dietary information from tribal respondents.
Technical review and oversight of the planning, design, execution, and evaluation of the
data included biologists, epidemiologists, toxicologists, and statisticians from multiple
agencies.
The Suquamish Tribal staff included interviewers, biologists, and a principle investigator.
Technical collaboration, consultations, and reviews were conducted by the Washington
Departments of Ecology and Health, University of Washington, U.S. Department of
Health and Human Services, Fred Hutchinson Cancer Research Institute, and the U.S.
Environmental Protection Agency.
Data analysis and review were conducted by two Seattle statistical consulting firms,
Mountain-Whisper-Light Statistics and StatPro Consultants.
4.4 Asian and Pacific Islanders
An Asian and Pacific Islander (API) seafood consumption study was conducted during the spring
and summer of 1997 in King County, Washington, to obtain information on consumption rates,
species and seafood parts consumed, and preparation methods for first- or second-generation
members of the API community (Sechena et al., 1999). Survey participants were API seafood
consumers 18 years or older. The study was conducted in three phases:
Phase I: Identify target API ethnic groups and develop appropriate questionnaires in the
language required to administer the questionnaire to each API ethnic group.
Phase II: Characterize seafood consumption for 10 API ethnic groups within the King
County study area.38
Phase III: Develop culturally appropriate health messages on risks related to seafood
consumption and disseminate to API community.
Of the 202 respondents, 89 percent were first API generation (born outside the United States).
API participants were interviewed by trained representatives from each of the 10 API ethnic
communities represented and asked to report on the number of annual servings and portion size
of the servings. Participants reported their own body weights. Fish consumption rate results were
reported as grams per kilogram per day. Because the survey was based on dietary recall, the
authors selected 20 API respondents to interview a second time, to assess the reliability of the
38 The 10 API ethnic groups are Cambodian, Chinese, Filipino, Hmong, Japanese, Korean, Laotian, Mien, Samoan, and Vietnamese.
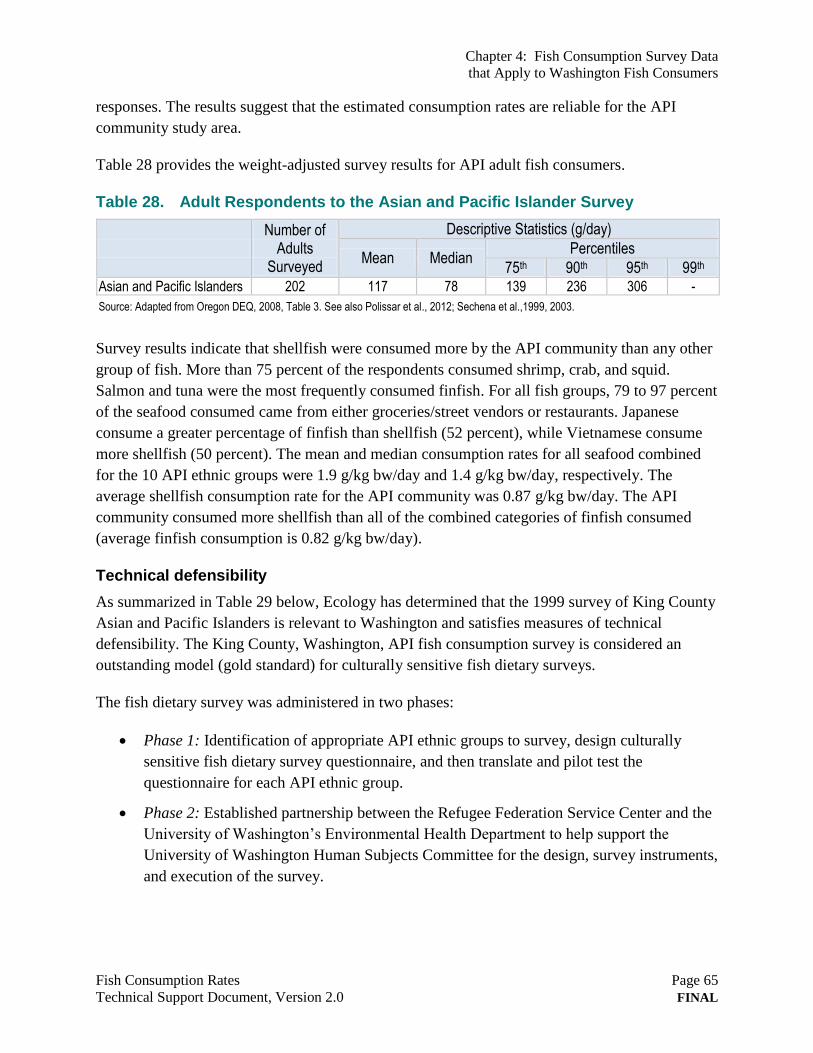
Chapter 4: Fish Consumption Survey Data
that Apply to Washington Fish Consumers
Fish Consumption Rates Page 65
Technical Support Document, Version 2.0 FINAL
responses. The results suggest that the estimated consumption rates are reliable for the API
community study area.
Table 28 provides the weight-adjusted survey results for API adult fish consumers.
Table 28. Adult Respondents to the Asian and Pacific Islander Survey
Number of
Adults Surveyed
Descriptive Statistics (g/day)
Mean Median Percentiles
75th 90th 95th 99th Asian and Pacific Islanders 202 117 78 139 236 306 -
Source: Adapted from Oregon DEQ, 2008, Table 3. See also Polissar et al., 2012; Sechena et al.,1999, 2003.
Survey results indicate that shellfish were consumed more by the API community than any other
group of fish. More than 75 percent of the respondents consumed shrimp, crab, and squid.
Salmon and tuna were the most frequently consumed finfish. For all fish groups, 79 to 97 percent
of the seafood consumed came from either groceries/street vendors or restaurants. Japanese
consume a greater percentage of finfish than shellfish (52 percent), while Vietnamese consume
more shellfish (50 percent). The mean and median consumption rates for all seafood combined
for the 10 API ethnic groups were 1.9 g/kg bw/day and 1.4 g/kg bw/day, respectively. The
average shellfish consumption rate for the API community was 0.87 g/kg bw/day. The API
community consumed more shellfish than all of the combined categories of finfish consumed
(average finfish consumption is 0.82 g/kg bw/day).
Technical defensibility
As summarized in Table 29 below, Ecology has determined that the 1999 survey of King County
Asian and Pacific Islanders is relevant to Washington and satisfies measures of technical
defensibility. The King County, Washington, API fish consumption survey is considered an
outstanding model (gold standard) for culturally sensitive fish dietary surveys.
The fish dietary survey was administered in two phases:
Phase 1: Identification of appropriate API ethnic groups to survey, design culturally
sensitive fish dietary survey questionnaire, and then translate and pilot test the
questionnaire for each API ethnic group.
Phase 2: Established partnership between the Refugee Federation Service Center and the
University of Washington’s Environmental Health Department to help support the
University of Washington Human Subjects Committee for the design, survey instruments,
and execution of the survey.
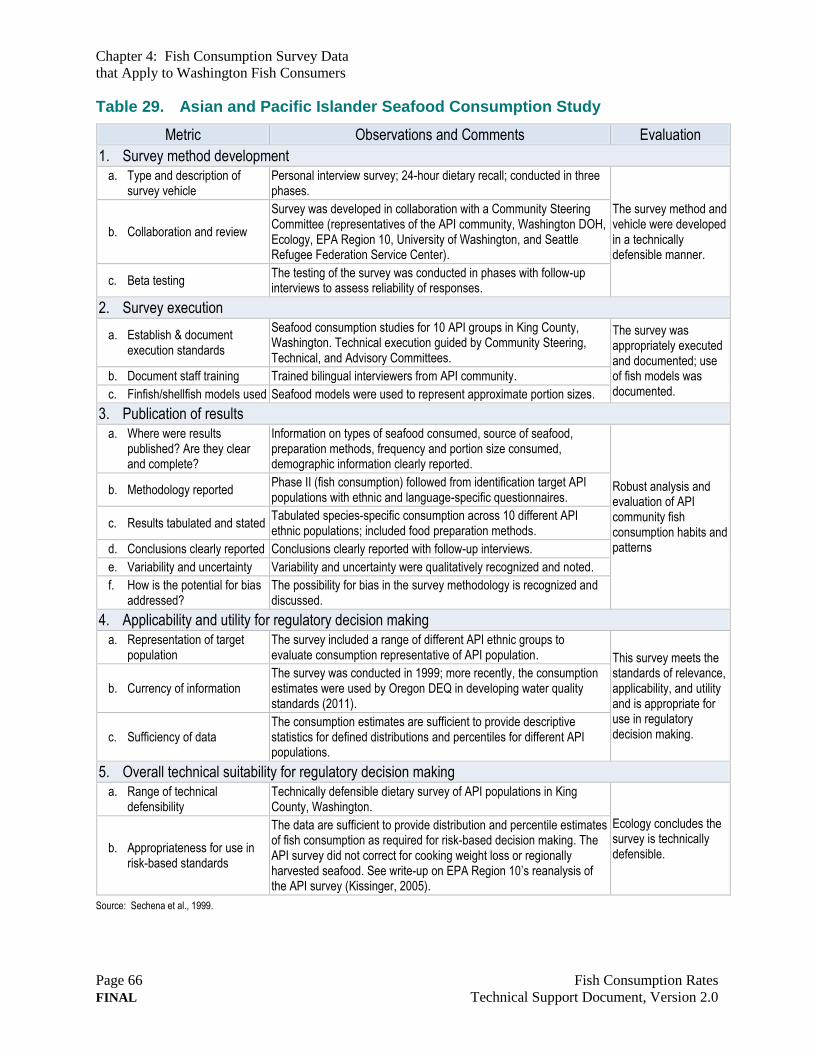
Chapter 4: Fish Consumption Survey Data
that Apply to Washington Fish Consumers
Page 66 Fish Consumption Rates
FINAL Technical Support Document, Version 2.0
Table 29. Asian and Pacific Islander Seafood Consumption Study
Metric Observations and Comments Evaluation
1. Survey method development a. Type and description of
survey vehicle Personal interview survey; 24-hour dietary recall; conducted in three phases.
The survey method and vehicle were developed in a technically defensible manner.
b. Collaboration and review
Survey was developed in collaboration with a Community Steering Committee (representatives of the API community, Washington DOH, Ecology, EPA Region 10, University of Washington, and Seattle Refugee Federation Service Center).
c. Beta testing The testing of the survey was conducted in phases with follow-up interviews to assess reliability of responses.
2. Survey execution
a. Establish & document execution standards
Seafood consumption studies for 10 API groups in King County, Washington. Technical execution guided by Community Steering, Technical, and Advisory Committees.
The survey was appropriately executed and documented; use of fish models was documented.
b. Document staff training Trained bilingual interviewers from API community.
c. Finfish/shellfish models used Seafood models were used to represent approximate portion sizes.
3. Publication of results
a. Where were results published? Are they clear and complete?
Information on types of seafood consumed, source of seafood, preparation methods, frequency and portion size consumed, demographic information clearly reported.
Robust analysis and evaluation of API community fish consumption habits and patterns
b. Methodology reported Phase II (fish consumption) followed from identification target API populations with ethnic and language-specific questionnaires.
c. Results tabulated and stated Tabulated species-specific consumption across 10 different API ethnic populations; included food preparation methods.
d. Conclusions clearly reported Conclusions clearly reported with follow-up interviews.
e. Variability and uncertainty Variability and uncertainty were qualitatively recognized and noted.
f. How is the potential for bias addressed?
The possibility for bias in the survey methodology is recognized and discussed.
4. Applicability and utility for regulatory decision making
a. Representation of target population
The survey included a range of different API ethnic groups to evaluate consumption representative of API population. This survey meets the
standards of relevance, applicability, and utility and is appropriate for use in regulatory decision making.
b. Currency of information The survey was conducted in 1999; more recently, the consumption estimates were used by Oregon DEQ in developing water quality standards (2011).
c. Sufficiency of data The consumption estimates are sufficient to provide descriptive statistics for defined distributions and percentiles for different API populations.
5. Overall technical suitability for regulatory decision making a. Range of technical
defensibility Technically defensible dietary survey of API populations in King County, Washington.
Ecology concludes the survey is technically defensible.
b. Appropriateness for use in risk-based standards
The data are sufficient to provide distribution and percentile estimates of fish consumption as required for risk-based decision making. The API survey did not correct for cooking weight loss or regionally harvested seafood. See write-up on EPA Region 10’s reanalysis of the API survey (Kissinger, 2005).
Source: Sechena et al., 1999.
Chapter 4: Fish Consumption Survey Data
that Apply to Washington Fish Consumers
Fish Consumption Rates Page 67
Technical Support Document, Version 2.0 FINAL
Sechena et al., 2003 provides a detailed description of the API fish dietary survey. Detailed
descriptions of the survey methodology include:
A methodology overview.
Survey instruments.
Sampling strategy including respondent selection criteria, API ethnic representation and
recruitment, questionnaire administration, data analyses.
Statistical methods used to derive fish consumption rates, treatment of outliers,
hypothesis testing, and statistical significance and descriptive statistics.
Results and discussion with tabulated results in g/kg/day for upper percentile estimates.
4.4.1 Reanalysis by EPA Region 10
EPA Region 10 reanalyzed the API data to correct for cooking weight loss, regional seafood
harvest, and extrapolation from the survey to King County API populations (Kissinger, 2005).
This reanalysis was used to establish cleanup levels in the Lower Duwamish Waterway
(Windward Environmental, 2007). The EPA Region 10 reanalysis of the API 1999 survey
included only data for individuals consuming seafood from King County. Weighting factors for
King County consumers for various ethnic groups were a function of the percentage of that
ethnic group as determined in the census and the number of individuals in that ethnic group that
consumed seafood from King County. The 95th
percentile ingestion rate (defined as the
reasonable maximum exposure [RME] scenario) was developed from the consumer-only dataset
of weighted ingestion rates. Adjustments were made to account for some of the shellfish
consumption reported on a cooked-weight basis rather than on a wet-weight basis. Revised
estimates of average raw shellfish consumption were made by using 25 and 50 percent cooking
loss correction factors for those shellfish species for which consumption was reported on a
cooked-weight basis. EPA calculated demographically weighted mean ingestion rates for each
seafood category for individuals who consumed some seafood caught in King County.
Demographically weighted mean ingestion rates were used to derive the percentage of
consumption of each seafood category. These percentages were then applied to the total
consumption rate (95th
percentile of total King County API seafood consumption of 57.1 g/day)
to derive consumption rates for each seafood category.
Anadromous fish were not included in the fish consumption scenario because it is problematic to
apportion salmon (anadromous fish) contaminant body burden to site-specific chemical
contaminants. To estimate the API central tendency consumption rate, the 50th
percentile of total
King County API consumption was multiplied by the percentage of consumption for the various
seafood categories. Total non-anadromous seafood consumption for the API exposure scenarios
was 51.1 g/day and 5.3 g/day for the RME and central tendency estimates, respectively.
Chapter 4: Fish Consumption Survey Data
that Apply to Washington Fish Consumers
Page 68 Fish Consumption Rates
FINAL Technical Support Document, Version 2.0
Reanalysis of the consumption of shellfish (mussels, crabs, and clams) for the API exposures
used average demographically weighted consumption of these shellfish species harvested only
from King County. These shellfish consumption estimates were used to calculate the percentage
of each shellfish type consumed. The demographic weighting factor was used to estimate the
consumption of clams, mussels, and crabs. The crab consumption rates were apportioned among
crab whole body and edible meat, and the benthic (demersal) fish consumption rates were
apportioned among benthic fish fillet and whole body. EPA Region 10 provided
demographically weighted average percentages of crab whole-body and crab edible-meat
consumption by API populations consuming at least some King County seafood. Also, EPA
Region 10 provided average demographically weighted percentages of whole-body and fillet
consumption by API members consuming at least some King County seafood.
Technical defensibility
Ecology has determined that the EPA Region 10 reanalysis of the 1999 API survey is a relevant
and technically defensible approach for a site-specific evaluation (Lower Duwamish Waterway).
Reanalysis of the API data by EPA Region 10 for King County API adult consumers provided
central and upper bound estimates of fish consumption (Table 30). The reported consumption
estimates include no adjustment for cooking and may be slightly biased low (i.e.,
underestimated).
The Kissinger (2005) demographic weighting methodology is not recommended for projecting
fish dietary patterns for API populations beyond King County. Because of the small number of
respondents for each API ethnic group, there would be a high level of uncertainty in projecting
statewide API fish dietary patterns from King County API fish dietary information.
It should be noted that Asian and Pacific Islanders include a broad range of ethnicities39
and that
the Kissinger (2005) analysis presents fish consumption estimates determined from aggregating
fish consumption data for small numbers of individuals from these varied ethnic groups. Future
fish consumption survey efforts should consider more comprehensive analysis of quantitative
fish consumption and cultural factors associated with fish consumption by individual ethnic
groups.
39 For the ethnicities listed here, the first number is the number of respondents from that ethnic group; the second number is the percentage of the total number of respondents represented by that group (Sechena et al., 2003, Table 1).
Cambodian 20/≈10% Mien 10/≈5% Chinese 30/≈14% Hmong 5/≈2% Filipino 30/≈14% Samoan 10/≈5% Japanese 29/≈14% Vietnamese 26/≈13% Korean 22/≈10% All API Ethnicity 202 Laotian 20/≈10%
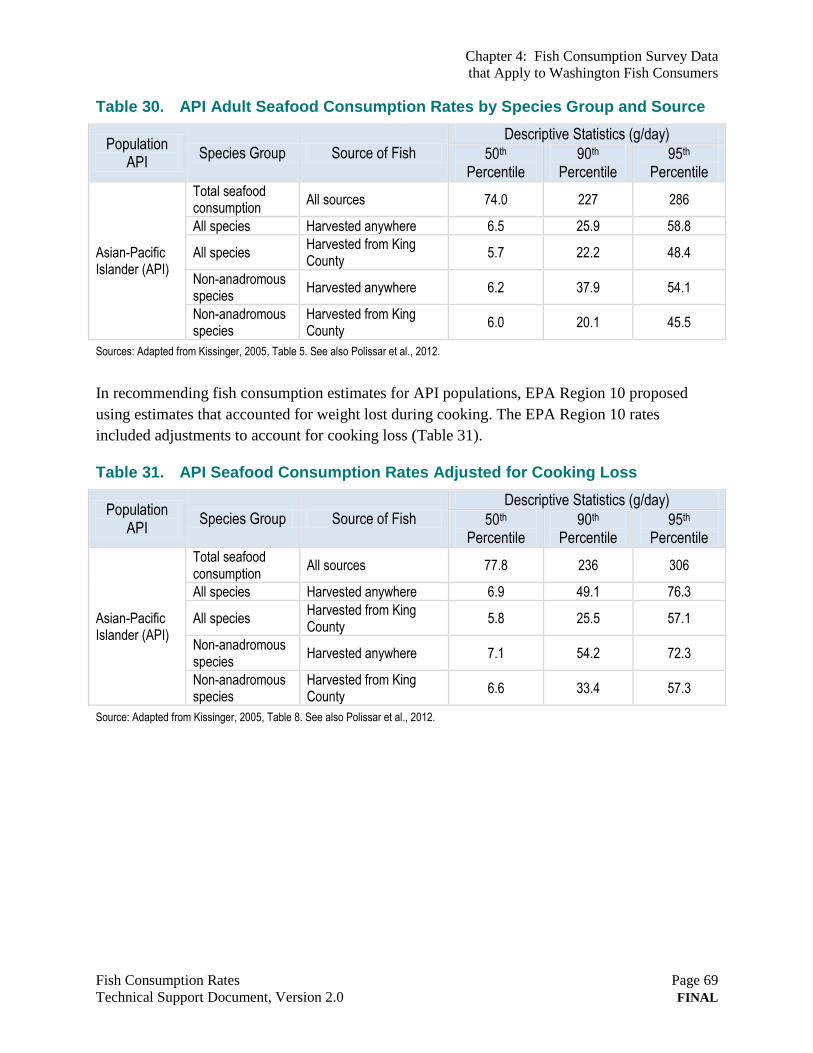
Chapter 4: Fish Consumption Survey Data
that Apply to Washington Fish Consumers
Fish Consumption Rates Page 69
Technical Support Document, Version 2.0 FINAL
Table 30. API Adult Seafood Consumption Rates by Species Group and Source
Population API
Species Group Source of Fish
Descriptive Statistics (g/day)
50th Percentile
90th Percentile
95th Percentile
Asian-Pacific Islander (API)
Total seafood consumption
All sources 74.0 227 286
All species Harvested anywhere 6.5 25.9 58.8
All species Harvested from King County
5.7 22.2 48.4
Non-anadromous species
Harvested anywhere 6.2 37.9 54.1
Non-anadromous species
Harvested from King County
6.0 20.1 45.5
Sources: Adapted from Kissinger, 2005, Table 5. See also Polissar et al., 2012.
In recommending fish consumption estimates for API populations, EPA Region 10 proposed
using estimates that accounted for weight lost during cooking. The EPA Region 10 rates
included adjustments to account for cooking loss (Table 31).
Table 31. API Seafood Consumption Rates Adjusted for Cooking Loss
Population API
Species Group Source of Fish
Descriptive Statistics (g/day)
50th Percentile
90th Percentile
95th Percentile
Asian-Pacific Islander (API)
Total seafood consumption
All sources 77.8 236 306
All species Harvested anywhere 6.9 49.1 76.3
All species Harvested from King County
5.8 25.5 57.1
Non-anadromous species
Harvested anywhere 7.1 54.2 72.3
Non-anadromous species
Harvested from King County
6.6 33.4 57.3
Source: Adapted from Kissinger, 2005, Table 8. See also Polissar et al., 2012.
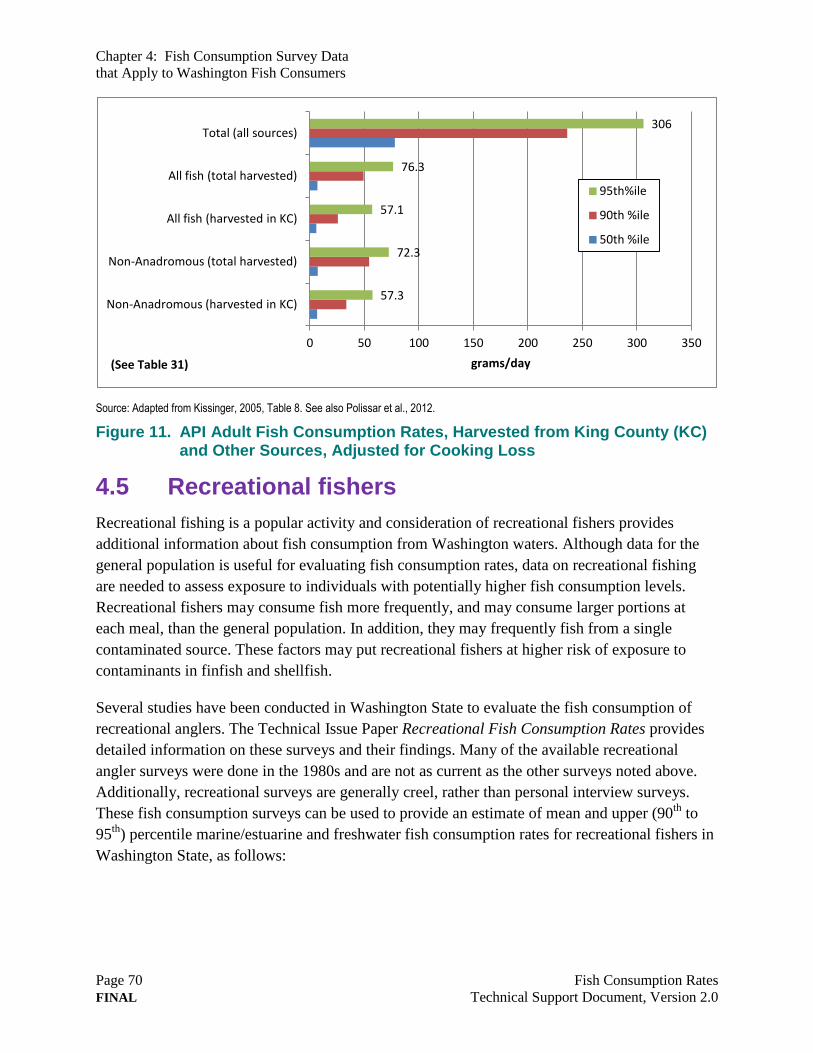
Chapter 4: Fish Consumption Survey Data
that Apply to Washington Fish Consumers
Page 70 Fish Consumption Rates
FINAL Technical Support Document, Version 2.0
Source: Adapted from Kissinger, 2005, Table 8. See also Polissar et al., 2012.
Figure 11. API Adult Fish Consumption Rates, Harvested from King County (KC) and Other Sources, Adjusted for Cooking Loss
4.5 Recreational fishers
Recreational fishing is a popular activity and consideration of recreational fishers provides
additional information about fish consumption from Washington waters. Although data for the
general population is useful for evaluating fish consumption rates, data on recreational fishing
are needed to assess exposure to individuals with potentially higher fish consumption levels.
Recreational fishers may consume fish more frequently, and may consume larger portions at
each meal, than the general population. In addition, they may frequently fish from a single
contaminated source. These factors may put recreational fishers at higher risk of exposure to
contaminants in finfish and shellfish.
Several studies have been conducted in Washington State to evaluate the fish consumption of
recreational anglers. The Technical Issue Paper Recreational Fish Consumption Rates provides
detailed information on these surveys and their findings. Many of the available recreational
angler surveys were done in the 1980s and are not as current as the other surveys noted above.
Additionally, recreational surveys are generally creel, rather than personal interview surveys.
These fish consumption surveys can be used to provide an estimate of mean and upper (90th
to
95th
) percentile marine/estuarine and freshwater fish consumption rates for recreational fishers in
Washington State, as follows:
57.3
72.3
57.1
76.3
306
0 50 100 150 200 250 300 350
Non-Anadromous (harvested in KC)
Non-Anadromous (total harvested)
All fish (harvested in KC)
All fish (total harvested)
Total (all sources)
grams/day
95th%ile
90th %ile
50th %ile
(See Table 31)
Chapter 4: Fish Consumption Survey Data
that Apply to Washington Fish Consumers
Fish Consumption Rates Page 71
Technical Support Document, Version 2.0 FINAL
Mean consumption rates for both freshwater and marine/estuarine finfish and shellfish
are in the range of 20 to 60 g/day.
Upper percentile consumption rates are in the range of 200 to 250 g/day for marine/
estuarine finfish and shellfish, and in the range of 100 to 150 g/day for freshwater fish.
Ecology believes that recreational angler surveys employing a creel methodology are far less
appropriate for regulatory use than surveys that utilize a personal interview approach (see Tables
9 and 10).
4.6 Additional fish consumption rate information evaluated by Ecology
In addition to the studies summarized in Section 4.1 to 4.5 above, Ecology considered a range of
other sources of information about fish consumption in Washington, as listed in Table 32. These
sources provide information on resource use and historical information about fish consumption,
which provides a larger and more complete view of finfish and shellfish harvest and
consumption in Washington. Appendix B provides a summary of additional tribal fish
consumption evaluations reviewed during preparation of this Technical Support Document.
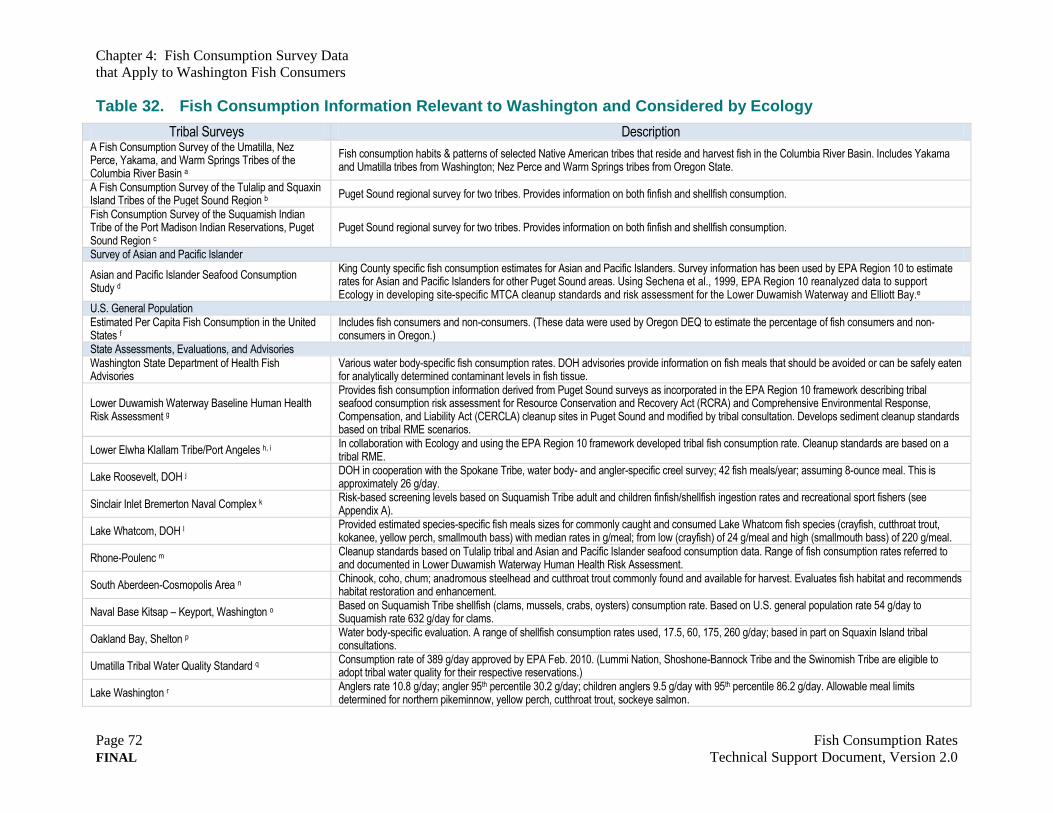
Chapter 4: Fish Consumption Survey Data
that Apply to Washington Fish Consumers
Page 72 Fish Consumption Rates
FINAL Technical Support Document, Version 2.0
Table 32. Fish Consumption Information Relevant to Washington and Considered by Ecology
Tribal Surveys Description A Fish Consumption Survey of the Umatilla, Nez Perce, Yakama, and Warm Springs Tribes of the Columbia River Basin a
Fish consumption habits & patterns of selected Native American tribes that reside and harvest fish in the Columbia River Basin. Includes Yakama and Umatilla tribes from Washington; Nez Perce and Warm Springs tribes from Oregon State.
A Fish Consumption Survey of the Tulalip and Squaxin Island Tribes of the Puget Sound Region b
Puget Sound regional survey for two tribes. Provides information on both finfish and shellfish consumption.
Fish Consumption Survey of the Suquamish Indian Tribe of the Port Madison Indian Reservations, Puget Sound Region c
Puget Sound regional survey for two tribes. Provides information on both finfish and shellfish consumption.
Survey of Asian and Pacific Islander
Asian and Pacific Islander Seafood Consumption Study d
King County specific fish consumption estimates for Asian and Pacific Islanders. Survey information has been used by EPA Region 10 to estimate rates for Asian and Pacific Islanders for other Puget Sound areas. Using Sechena et al., 1999, EPA Region 10 reanalyzed data to support Ecology in developing site-specific MTCA cleanup standards and risk assessment for the Lower Duwamish Waterway and Elliott Bay.e
U.S. General Population Estimated Per Capita Fish Consumption in the United States f
Includes fish consumers and non-consumers. (These data were used by Oregon DEQ to estimate the percentage of fish consumers and non-consumers in Oregon.)
State Assessments, Evaluations, and Advisories Washington State Department of Health Fish Advisories
Various water body-specific fish consumption rates. DOH advisories provide information on fish meals that should be avoided or can be safely eaten for analytically determined contaminant levels in fish tissue.
Lower Duwamish Waterway Baseline Human Health Risk Assessment g
Provides fish consumption information derived from Puget Sound surveys as incorporated in the EPA Region 10 framework describing tribal seafood consumption risk assessment for Resource Conservation and Recovery Act (RCRA) and Comprehensive Environmental Response, Compensation, and Liability Act (CERCLA) cleanup sites in Puget Sound and modified by tribal consultation. Develops sediment cleanup standards based on tribal RME scenarios.
Lower Elwha Klallam Tribe/Port Angeles h, i In collaboration with Ecology and using the EPA Region 10 framework developed tribal fish consumption rate. Cleanup standards are based on a tribal RME.
Lake Roosevelt, DOH j DOH in cooperation with the Spokane Tribe, water body- and angler-specific creel survey; 42 fish meals/year; assuming 8-ounce meal. This is approximately 26 g/day.
Sinclair Inlet Bremerton Naval Complex k Risk-based screening levels based on Suquamish Tribe adult and children finfish/shellfish ingestion rates and recreational sport fishers (see Appendix A).
Lake Whatcom, DOH l Provided estimated species-specific fish meals sizes for commonly caught and consumed Lake Whatcom fish species (crayfish, cutthroat trout, kokanee, yellow perch, smallmouth bass) with median rates in g/meal; from low (crayfish) of 24 g/meal and high (smallmouth bass) of 220 g/meal.
Rhone-Poulenc m Cleanup standards based on Tulalip tribal and Asian and Pacific Islander seafood consumption data. Range of fish consumption rates referred to and documented in Lower Duwamish Waterway Human Health Risk Assessment.
South Aberdeen-Cosmopolis Area n Chinook, coho, chum; anadromous steelhead and cutthroat trout commonly found and available for harvest. Evaluates fish habitat and recommends habitat restoration and enhancement.
Naval Base Kitsap – Keyport, Washington o Based on Suquamish Tribe shellfish (clams, mussels, crabs, oysters) consumption rate. Based on U.S. general population rate 54 g/day to Suquamish rate 632 g/day for clams.
Oakland Bay, Shelton p Water body-specific evaluation. A range of shellfish consumption rates used, 17.5, 60, 175, 260 g/day; based in part on Squaxin Island tribal consultations.
Umatilla Tribal Water Quality Standard q Consumption rate of 389 g/day approved by EPA Feb. 2010. (Lummi Nation, Shoshone-Bannock Tribe and the Swinomish Tribe are eligible to adopt tribal water quality for their respective reservations.)
Lake Washington r Anglers rate 10.8 g/day; angler 95th percentile 30.2 g/day; children anglers 9.5 g/day with 95th percentile 86.2 g/day. Allowable meal limits determined for northern pikeminnow, yellow perch, cutthroat trout, sockeye salmon.
Chapter 4: Fish Consumption Survey Data
that Apply to Washington Fish Consumers
Fish Consumption Rates Page 73
Technical Support Document, Version 2.0 FINAL
Table Sources:
a. CRITFC, 1994.
b. Toy et al., 1996.
c. The Suquamish Tribe, 2000.
d. Sechena et al., 1999.
e. Kissinger, 2005.
f. U.S. EPA, 2002a.
g. Windward Environmental, 2007.
h. Lower Elwha Klallam Tribe, 2007.
i. Lower Elwha Klallam Tribe, 2008.
j. Washington DOH, 1997.
k. Naval Facilities Engineering Command Northwest, 2010.
l. Washington DOH, 2001.
m. U.S. EPA, 2006.
n. U.S. Department of the Interior, Fish and Wildlife Service, 1994.
o. ATSDR, 2009.
p. Washington DOH, 2010.
q. U.S. EPA, 2011b.
r. Washington DOH, 2004.
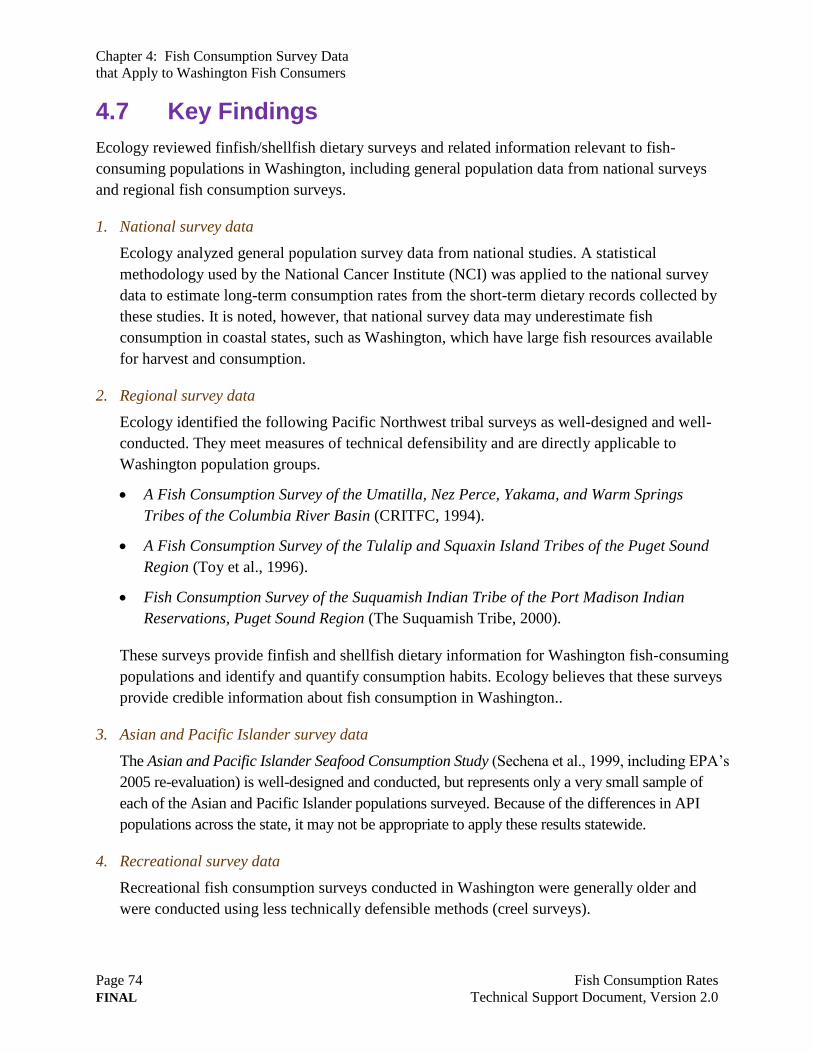
Chapter 4: Fish Consumption Survey Data
that Apply to Washington Fish Consumers
Page 74 Fish Consumption Rates
FINAL Technical Support Document, Version 2.0
4.7 Key Findings
Ecology reviewed finfish/shellfish dietary surveys and related information relevant to fish-
consuming populations in Washington, including general population data from national surveys
and regional fish consumption surveys.
1. National survey data
Ecology analyzed general population survey data from national studies. A statistical
methodology used by the National Cancer Institute (NCI) was applied to the national survey
data to estimate long-term consumption rates from the short-term dietary records collected by
these studies. It is noted, however, that national survey data may underestimate fish
consumption in coastal states, such as Washington, which have large fish resources available
for harvest and consumption.
2. Regional survey data
Ecology identified the following Pacific Northwest tribal surveys as well-designed and well-
conducted. They meet measures of technical defensibility and are directly applicable to
Washington population groups.
A Fish Consumption Survey of the Umatilla, Nez Perce, Yakama, and Warm Springs
Tribes of the Columbia River Basin (CRITFC, 1994).
A Fish Consumption Survey of the Tulalip and Squaxin Island Tribes of the Puget Sound
Region (Toy et al., 1996).
Fish Consumption Survey of the Suquamish Indian Tribe of the Port Madison Indian
Reservations, Puget Sound Region (The Suquamish Tribe, 2000).
These surveys provide finfish and shellfish dietary information for Washington fish-consuming
populations and identify and quantify consumption habits. Ecology believes that these surveys
provide credible information about fish consumption in Washington..
3. Asian and Pacific Islander survey data
The Asian and Pacific Islander Seafood Consumption Study (Sechena et al., 1999, including EPA’s
2005 re-evaluation) is well-designed and conducted, but represents only a very small sample of
each of the Asian and Pacific Islander populations surveyed. Because of the differences in API
populations across the state, it may not be appropriate to apply these results statewide.
4. Recreational survey data
Recreational fish consumption surveys conducted in Washington were generally older and
were conducted using less technically defensible methods (creel surveys).
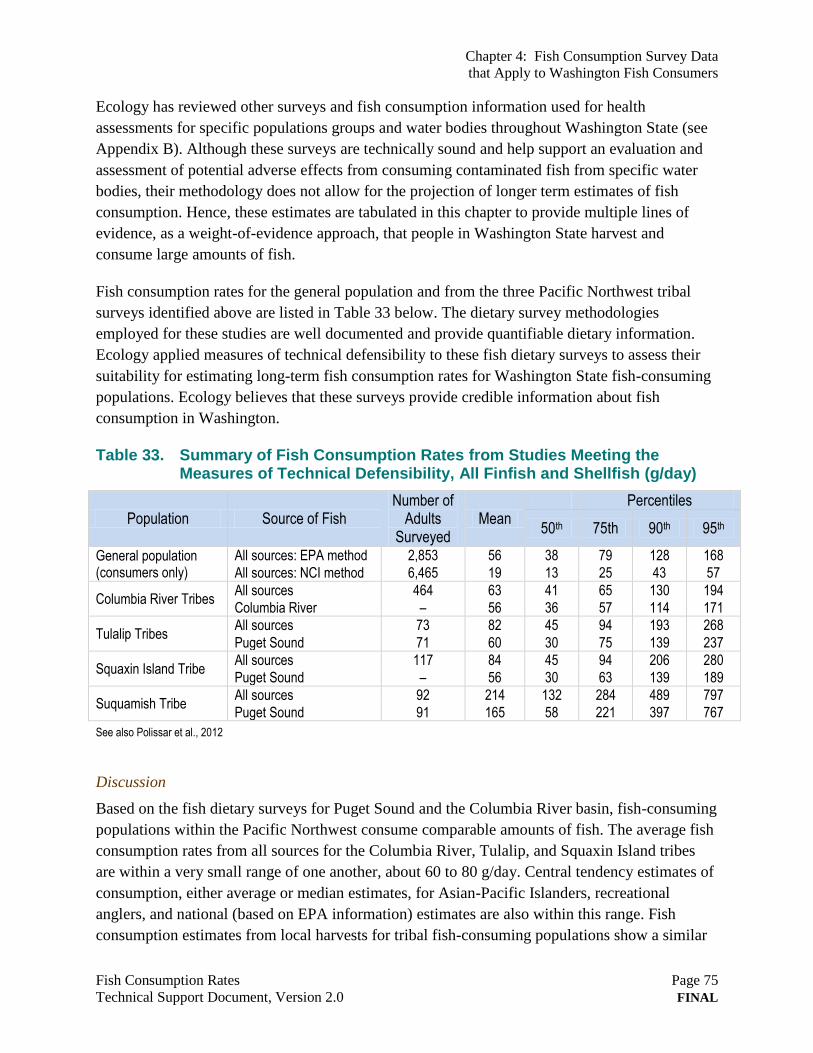
Chapter 4: Fish Consumption Survey Data
that Apply to Washington Fish Consumers
Fish Consumption Rates Page 75
Technical Support Document, Version 2.0 FINAL
Ecology has reviewed other surveys and fish consumption information used for health
assessments for specific populations groups and water bodies throughout Washington State (see
Appendix B). Although these surveys are technically sound and help support an evaluation and
assessment of potential adverse effects from consuming contaminated fish from specific water
bodies, their methodology does not allow for the projection of longer term estimates of fish
consumption. Hence, these estimates are tabulated in this chapter to provide multiple lines of
evidence, as a weight-of-evidence approach, that people in Washington State harvest and
consume large amounts of fish.
Fish consumption rates for the general population and from the three Pacific Northwest tribal
surveys identified above are listed in Table 33 below. The dietary survey methodologies
employed for these studies are well documented and provide quantifiable dietary information.
Ecology applied measures of technical defensibility to these fish dietary surveys to assess their
suitability for estimating long-term fish consumption rates for Washington State fish-consuming
populations. Ecology believes that these surveys provide credible information about fish
consumption in Washington.
Table 33. Summary of Fish Consumption Rates from Studies Meeting the Measures of Technical Defensibility, All Finfish and Shellfish (g/day)
Population Source of Fish Number of
Adults Surveyed
Mean Percentiles
50th 75th 90th 95th
General population (consumers only)
All sources: EPA method 2,853 56 38 79 128 168
All sources: NCI method 6,465 19 13 25 43 57
Columbia River Tribes All sources 464 63 41 65 130 194
Columbia River – 56 36 57 114 171
Tulalip Tribes All sources 73 82 45 94 193 268
Puget Sound 71 60 30 75 139 237
Squaxin Island Tribe All sources 117 84 45 94 206 280
Puget Sound – 56 30 63 139 189
Suquamish Tribe All sources 92 214 132 284 489 797
Puget Sound 91 165 58 221 397 767
See also Polissar et al., 2012
Discussion
Based on the fish dietary surveys for Puget Sound and the Columbia River basin, fish-consuming
populations within the Pacific Northwest consume comparable amounts of fish. The average fish
consumption rates from all sources for the Columbia River, Tulalip, and Squaxin Island tribes
are within a very small range of one another, about 60 to 80 g/day. Central tendency estimates of
consumption, either average or median estimates, for Asian-Pacific Islanders, recreational
anglers, and national (based on EPA information) estimates are also within this range. Fish
consumption estimates from local harvests for tribal fish-consuming populations show a similar
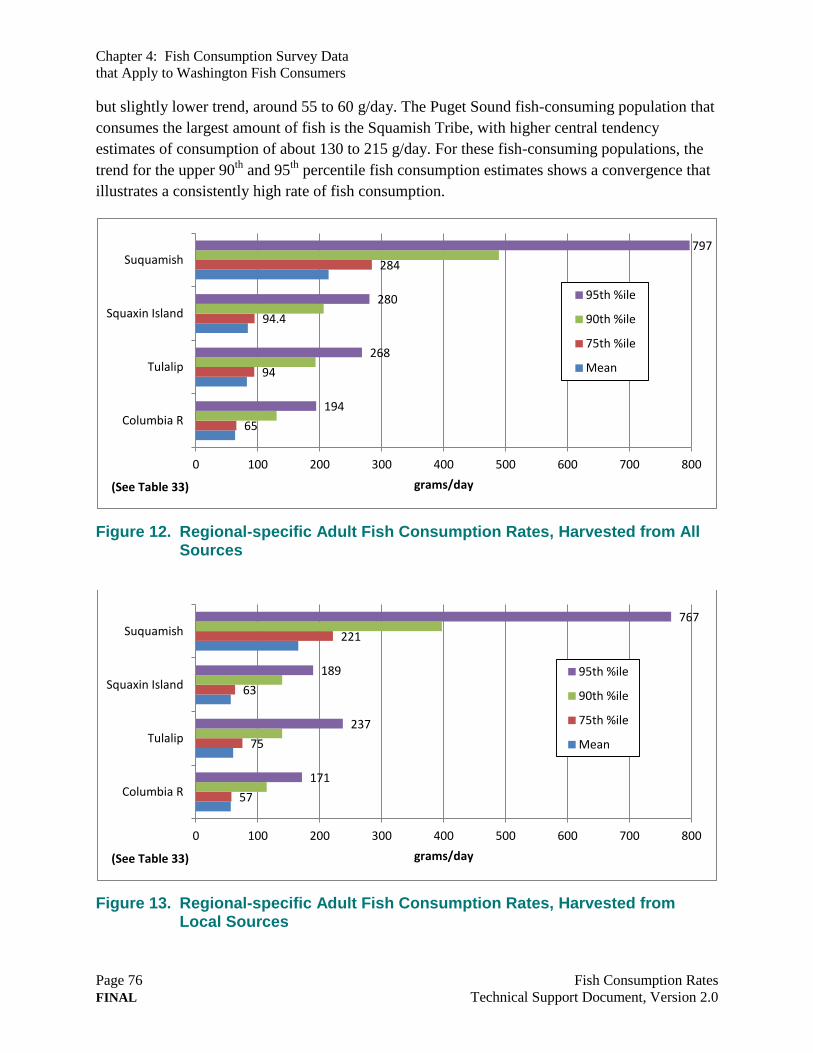
Chapter 4: Fish Consumption Survey Data
that Apply to Washington Fish Consumers
Page 76 Fish Consumption Rates
FINAL Technical Support Document, Version 2.0
but slightly lower trend, around 55 to 60 g/day. The Puget Sound fish-consuming population that
consumes the largest amount of fish is the Squamish Tribe, with higher central tendency
estimates of consumption of about 130 to 215 g/day. For these fish-consuming populations, the
trend for the upper 90th
and 95th
percentile fish consumption estimates shows a convergence that
illustrates a consistently high rate of fish consumption.
Figure 12. Regional-specific Adult Fish Consumption Rates, Harvested from All Sources
Figure 13. Regional-specific Adult Fish Consumption Rates, Harvested from Local Sources
65
94
94.4
284
194
268
280
797
0 100 200 300 400 500 600 700 800
Columbia R
Tulalip
Squaxin Island
Suquamish
grams/day
95th %ile
90th %ile
75th %ile
Mean
57
75
63
221
171
237
189
767
0 100 200 300 400 500 600 700 800
Columbia R
Tulalip
Squaxin Island
Suquamish
grams/day
95th %ile
90th %ile
75th %ile
Mean
(See Table 33)
(See Table 33)
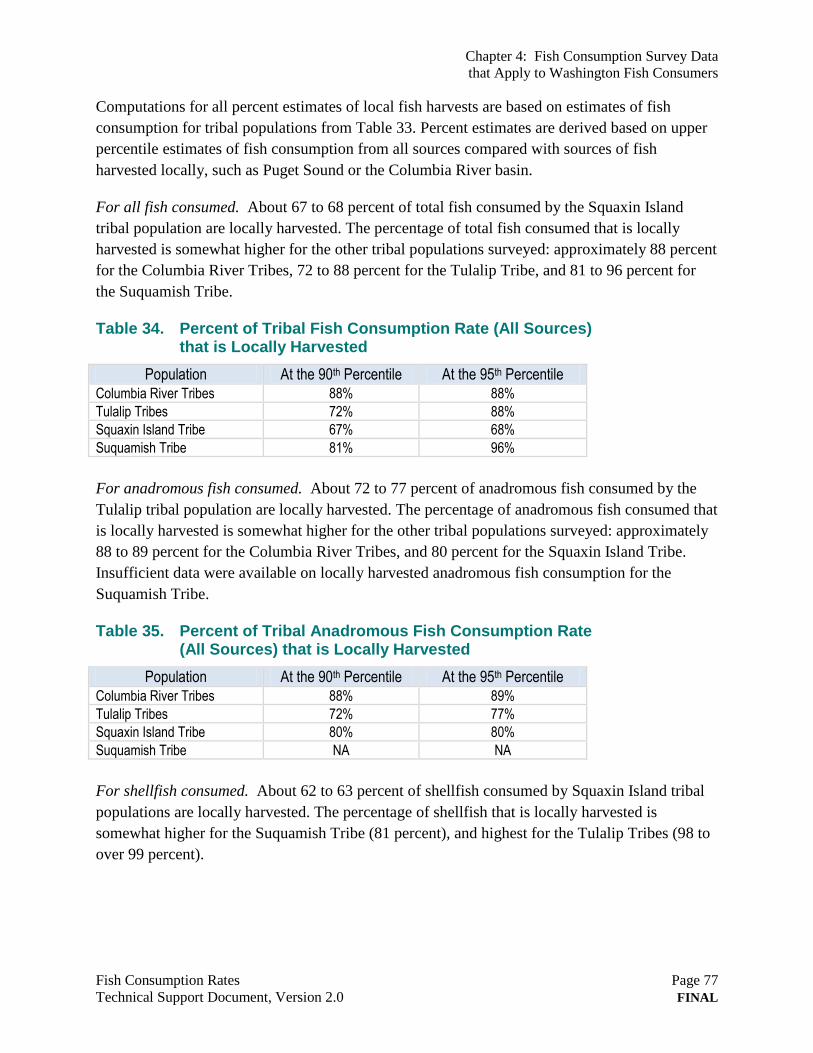
Chapter 4: Fish Consumption Survey Data
that Apply to Washington Fish Consumers
Fish Consumption Rates Page 77
Technical Support Document, Version 2.0 FINAL
Computations for all percent estimates of local fish harvests are based on estimates of fish
consumption for tribal populations from Table 33. Percent estimates are derived based on upper
percentile estimates of fish consumption from all sources compared with sources of fish
harvested locally, such as Puget Sound or the Columbia River basin.
For all fish consumed. About 67 to 68 percent of total fish consumed by the Squaxin Island
tribal population are locally harvested. The percentage of total fish consumed that is locally
harvested is somewhat higher for the other tribal populations surveyed: approximately 88 percent
for the Columbia River Tribes, 72 to 88 percent for the Tulalip Tribe, and 81 to 96 percent for
the Suquamish Tribe.
Table 34. Percent of Tribal Fish Consumption Rate (All Sources) that is Locally Harvested
Population At the 90th Percentile At the 95th Percentile Columbia River Tribes 88% 88%
Tulalip Tribes 72% 88%
Squaxin Island Tribe 67% 68%
Suquamish Tribe 81% 96%
For anadromous fish consumed. About 72 to 77 percent of anadromous fish consumed by the
Tulalip tribal population are locally harvested. The percentage of anadromous fish consumed that
is locally harvested is somewhat higher for the other tribal populations surveyed: approximately
88 to 89 percent for the Columbia River Tribes, and 80 percent for the Squaxin Island Tribe.
Insufficient data were available on locally harvested anadromous fish consumption for the
Suquamish Tribe.
Table 35. Percent of Tribal Anadromous Fish Consumption Rate (All Sources) that is Locally Harvested
Population At the 90th Percentile At the 95th Percentile Columbia River Tribes 88% 89%
Tulalip Tribes 72% 77%
Squaxin Island Tribe 80% 80%
Suquamish Tribe NA NA
For shellfish consumed. About 62 to 63 percent of shellfish consumed by Squaxin Island tribal
populations are locally harvested. The percentage of shellfish that is locally harvested is
somewhat higher for the Suquamish Tribe (81 percent), and highest for the Tulalip Tribes (98 to
over 99 percent).
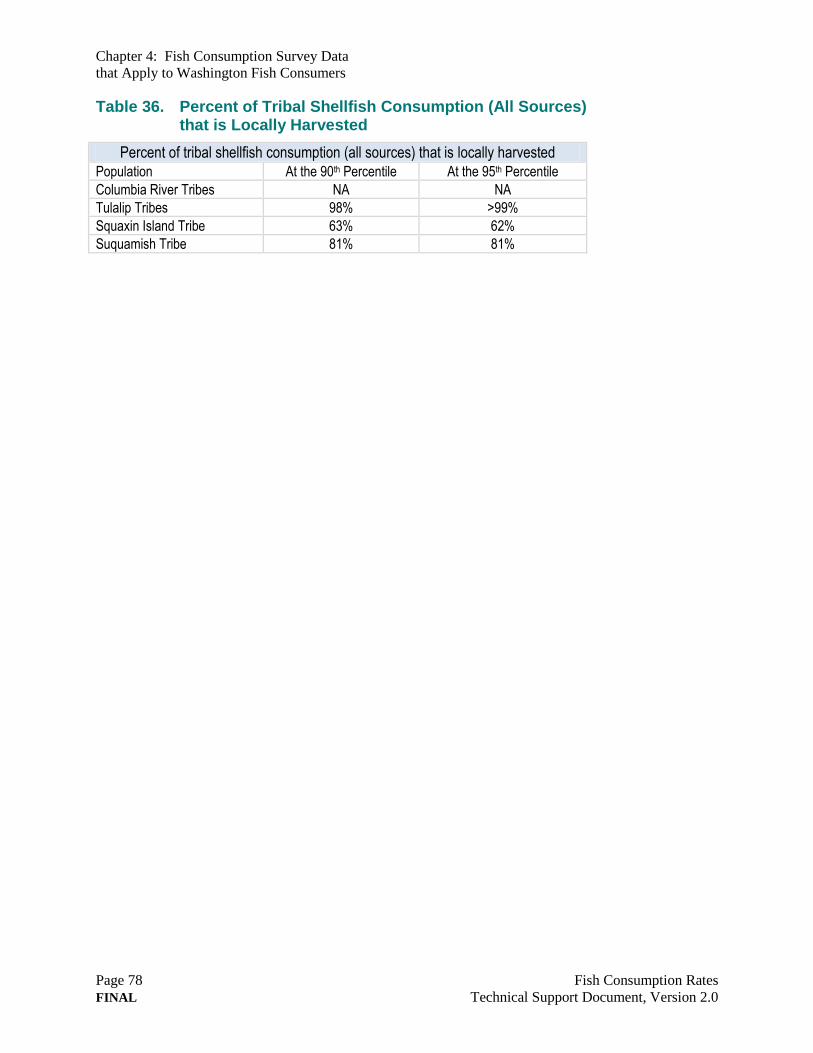
Chapter 4: Fish Consumption Survey Data
that Apply to Washington Fish Consumers
Page 78 Fish Consumption Rates
FINAL Technical Support Document, Version 2.0
Table 36. Percent of Tribal Shellfish Consumption (All Sources) that is Locally Harvested
Percent of tribal shellfish consumption (all sources) that is locally harvested Population At the 90th Percentile At the 95th Percentile
Columbia River Tribes NA NA
Tulalip Tribes 98% >99%
Squaxin Island Tribe 63% 62%
Suquamish Tribe 81% 81%
Chapter 5: Sources of Uncertainty
and Variability
Fish Consumption Rates Page 79
Technical Support Document, Version 2.0 FINAL
Chapter 5: Sources of Uncertainty and Variability
Ecology and other agencies regularly use available scientific information on finfish and shellfish
consumption rates to support regulatory decisions. In these situations, Ecology must generally
select a particular value from a range of values. When making these decisions, it is appropriate to
identify, recognize, and consider both the uncertainties associated with available data and the
variability across individuals, fish species, and geographic areas.
Sometimes these two terms, uncertainty and variability, are lumped together. However, the
nature of the errors (and consequences of over- or underestimating results) that arise due to
uncertainty in the data is different than those errors that arise as a result of variability across
populations, geographic areas, and time. Environmental agencies’ responses to uncertainty are
inherently different than responses to variability. Specifically:
Variability. With variability, people and organizations know that there is a range of
actual values for the parameter in question. In these situations, environmental agencies
must simply decide how to characterize the range of values.
Uncertainty. With uncertainty, people and organizations have limited knowledge on the
magnitude and range of the parameter in question. In these situations, environmental
agencies must decide how to address gaps in information and/or scientific knowledge.
This chapter summarizes important sources of uncertainty and variability in the scientific
information used to estimate finfish and shellfish consumption rates.
Uncertainty associated with dietary intake survey methods.
Variability in consumption rates for individuals within a specific study population.
Geographic variations and uncertainties associated with extrapolating survey results to
different population groups and different areas.
Temporal variability and uncertainties associated with estimating long-term exposure.
Uncertainties associated with estimating future consumption rates and patterns.
Uncertainties and variability in the relationships between cooked and uncooked tissue
weights.
Uncertainties and variability in sources of finfish and shellfish.
Temporal variability in the availability of finfish and shellfish.
This chapter is designed to provide a high-level summary. There are several excellent resources
that provide information on general sources of uncertainty and variability in risk assessments
Chapter 5: Sources of Uncertainty
and Variability
Page 80 Fish Consumption Rates
FINAL Technical Support Document, Version 2.0
(National Research Council, 1994, 2009; U.S. EPA, 2011a). In addition, other agencies and
organizations (U.S. EPA, 2007b; Oregon DEQ, 2008; Windward Environmental, 2007) have
evaluated sources of uncertainty and variability in fish consumption rates.40
(Much of the
information in this chapter is directly from the sources cited.) See also CalEPA (2001) for a
particularly good discussion of sources of variability in fish consumption estimates.
5.1 Survey methodology
Dietary recall surveys are dependent on many factors, and the careful design and execution can
minimize or eliminate sources of certain types of errors.
Chapter 3 discusses survey methodology, execution, publication of results, applicability and
utility for regulatory decision making, and overall technical suitability to support regulatory
decision making. Fish consumption surveys selected as applicable to Washington fish consumers
were evaluated in Chapter 4.
Factors contributing to measurement error and bias include:
Survey design (for example, accurate representation of the target population). Considers
attributes of the survey relative to attaining accuracy and precision (e.g., are all species
included, are visual aids utilized for portion sizes, will the survey be administered over an
entire fishing season, are an appropriate number of individuals interviewed).
Survey methodology (for example, considers the interaction between the survey
methodology chosen and attributes of the target population taking into account literacy,
language barriers, and cultural sensitivity).
Survey execution (for example, coding errors, interviewer bias, recall bias).41
Method of analysis (for example, if and how systematic error is identified and estimated;
treatment of outliers and weighting factors).
Various survey types have inherent biases, strengths, and weaknesses that may contribute to
variable results demonstrated across these different surveys. It should be noted that regulatory
policies (for example, what questions are the surveys designed to answer) can influence the
planning and design phases, which can in turn influence the results and conclusions.
Furthermore, policy choices may not be consistent across various federal and state agencies and
academic institutions.
40 See also the National Cancer Institute discussions of measurement error related to dietary surveys. http://riskfactor.cancer.gov/measurementerror/
41 Recall bias occurs when factors exist that may affect the respondent’s memory of an event. For example, an individual that consumed fish in the last 24 hours may provide greater estimates of fish consumption on a seasonal or yearly basis.
Chapter 5: Sources of Uncertainty
and Variability
Fish Consumption Rates Page 81
Technical Support Document, Version 2.0 FINAL
EPA examined different fish consumption survey methods, identifying important considerations
for survey design, selection of respondents, quality assurance, and statistical analysis (U.S. EPA,
1992). Additional guidance on fish and wildlife consumption surveys thoroughly examines
survey instrument design, execution, and analysis (U.S. EPA, 1998).
Limited resources and differing objectives for organizations and groups interested in determining
fish consumption rates can influence the design of the survey and how it is conducted. Plausible
objectives for fish consumption surveys include: determining average consumption rates, fishing
pressure on water bodies, and maximum consumption during the fishing season. Surveys
designed to meet one objective may not be suitable for another. Ecology must consider a fish
consumption survey’s objectives, execution, and evaluation to determine the utility of a survey’s
use by Ecology for environmental regulation.
5.1.1 Differences due to survey design, terminology, and definitions
Some fish dietary surveys may not include all relevant species in the questionnaire. Terminology
across different fish consumption surveys may be highly variable. A lack of a consistent
terminology can contribute to variability and uncertainty. For example, shellfish usually refers to
aquatic invertebrate organisms with a shell. Clams and oysters are easily identified as shellfish.
However, selected aquatic animals (squid) have evolved such that the shell has become internal
and/or reduced, while in others, the shell has disappeared (octopus). Furthermore, crustaceans
(crayfish) have exoskeletons instead of true shells.
Seafood consumption may include finfish and/or shellfish obtained from a variety of sources.
Surveys may not differentiate the sources of the finfish and/or shellfish. Indeed, some surveys
may consider consumption of fish harvested from a single water body (e.g., Commencement
Bay) while other studies determine rates for fish consumption from multiple water bodies. Also,
consumption rates reported in different studies may or may not distinguish between consumption
of marine, estuarine, and freshwater finfish and shellfish. These differences and their
contributions to variability were summarized in a study published in the Journal of Exposure
Analysis and Environmental Epidemiology (Ebert et al., 1994). This study noted that the
consumption rate of an individual comprises the sum of the rates from different sources. It does
not differentiate among sources of seafood. Estimates may vary substantially depending on how
these different sources are evaluated.
5.1.2 Types of data and methods of collection
The method used to collect dietary information may lead to uncertainty. For example, data
collected from creel surveys involve interviewing anglers at fishing locations to provide water
body-specific data about fishing frequency, fish species, and sizes caught and/or consumed. Hence,
the creel survey method may only provide data about specific species available during specific
seasons. Creel surveys, like other surveys methods, are subject to biases. Poor catches, catches
Chapter 5: Sources of Uncertainty
and Variability
Page 82 Fish Consumption Rates
FINAL Technical Support Document, Version 2.0
below legal size limits, or catches above total allowable limits may not be reported. Persons fishing
without a license may avoid participating. See Table 9 for issues associated with creel surveys.
5.1.3 Cooked and uncooked tissue weights
A number of researchers have noted the uncertainty introduced by inconsistency regarding
reporting of finfish and shellfish using cooked vs. uncooked weight. Raw fish tissue samples are
used to determine chemical contaminant levels for use in human health risk assessments.
The EPA Region 10 Framework recommends that risk assessments be performed using the
weight of uncooked fish, with no modification for potential contaminant losses or gains during
cooking. This is consistent with the fact that uncooked fish consumption rates were measured in
the tribal finfish and shellfish consumption studies cited. EPA notes:
Because of the many ways in which fish may be served, quantitative assumptions
regarding preparation methods and their effects on contaminant concentrations would be
unreliable. Depending upon the preparation and cooking procedures, and upon the
nature of the contaminants in the fish, concentrations may decrease or increase [U.S.
EPA, 1998]. For fat-soluble compounds such as PCBs, trimming and removing adipose
tissue reduces the mass of contaminants in the consumed portion of the fish. Similarly,
broiling, frying, or grilling fish is likely to result in reductions of fat-soluble compounds
[Sherer and Price, 1993]. Cooking is not likely to change the level of exposure to
mercury because it is bound to muscle tissue and is not lost by cooking, which mostly
removes moisture and fat [Morgan et al., 1997]. Fish cooked with no prior preparation,
as in a stew, might show negligible loss of contaminants, except perhaps for volatile
contaminants. Because lead concentrates in bones, preparations where bones are
discarded are likely to result in reductions in lead exposure [Ay et al., 1999].
5.1.4 Variability within a population
A number of factors may contribute to variability in finfish and shellfish consumption survey
results (Ebert et al., 1994). Dietary patterns vary within a population and between populations.
Different population groups may have different fish consumption rates related to cultural or
regional differences. Family preferences, recipes, and individual taste are sources of variability
within a population; access to resources, tradition, and custom are sources of variability between
populations.
5.1.5 Data analysis and statistical considerations
Without careful definition of the target population, it is possible to bias survey results. For
example, to avoid characterizing the consumption for a population that is not at risk from
consuming contaminated fish, surveys are designed to evaluate consumers only, with questions
allowing identification of persons who never (or rarely) consume fish.
Chapter 5: Sources of Uncertainty
and Variability
Fish Consumption Rates Page 83
Technical Support Document, Version 2.0 FINAL
Various statistical techniques have been described to analyze consumption data. For example,
different methods of treating missing data or non-response data may contribute to bias.
Identification and treatment of potential outliers may contribute to biased datasets (this includes
recording outliers as multiples of standard deviations above the mean or eliminating them from
the dataset).
Defining subgroups within a larger population (stratification) differently can affect survey results
and introduce different levels of bias. An important element of survey design is how well the
survey sample population represents the selected target population or population of concern.
Weighting schemes designed to make a sample more representative of the population should be
carefully defined. Statistical methods should consider sampling rate, differences in sampling
days, and other factors that may influence the results.
The fish consumption rates for a fish-consuming population should be sufficiently characterized
to provide a population distribution and statistics that contribute to an understanding of the
nature of a population exposure distribution such as the mean, median, and upper percentiles
(90th
or 95th
percentile) or bounding estimates (99th
or 99.9th
percentile). It is essential to
understand how these distributions were derived as distributions derived from consumers and
non-consumers of fish have different meanings and applications.
It should be noted that 24-hour dietary recall surveys that include food frequency questionnaires
enable calculating the upper percentiles with greater confidence (U.S. EPA 1992, 1998).
Consistent with federal guidance on fish dietary survey methodologies, all regional Pacific
Northwest fish dietary surveys (Tribal and Asian-Pacific Islander populations) employ some
permutation of a food frequency questionnaire in their survey methodology to project long-term
consumption estimates.
Fish dietary information may be reported as point estimates, usually a mean or median value to
represent central tendency estimates of consumption, or as a distribution of values. When the
estimates of fish consumption are normally distributed in a population, the mean and median will
be close or approximately equal. When the distribution is skewed (e.g., lognormal distribution),
the mean and median may be substantially different. The mean fish consumption estimate
represents the average value for the sampled population and in a skewed distribution the mean
will either be a higher or lower value than the median value. For a highly positively skewed
distribution, as found in the Pacific Northwest fish-consuming populations, the mean is higher
than the median estimates of consumption. The median value represents the 50th
percentile (or
midpoint) of the distribution where half of the sampled population consumes more and half
consumes less fish, than the median value (Helsel and Hirsch, 2002).
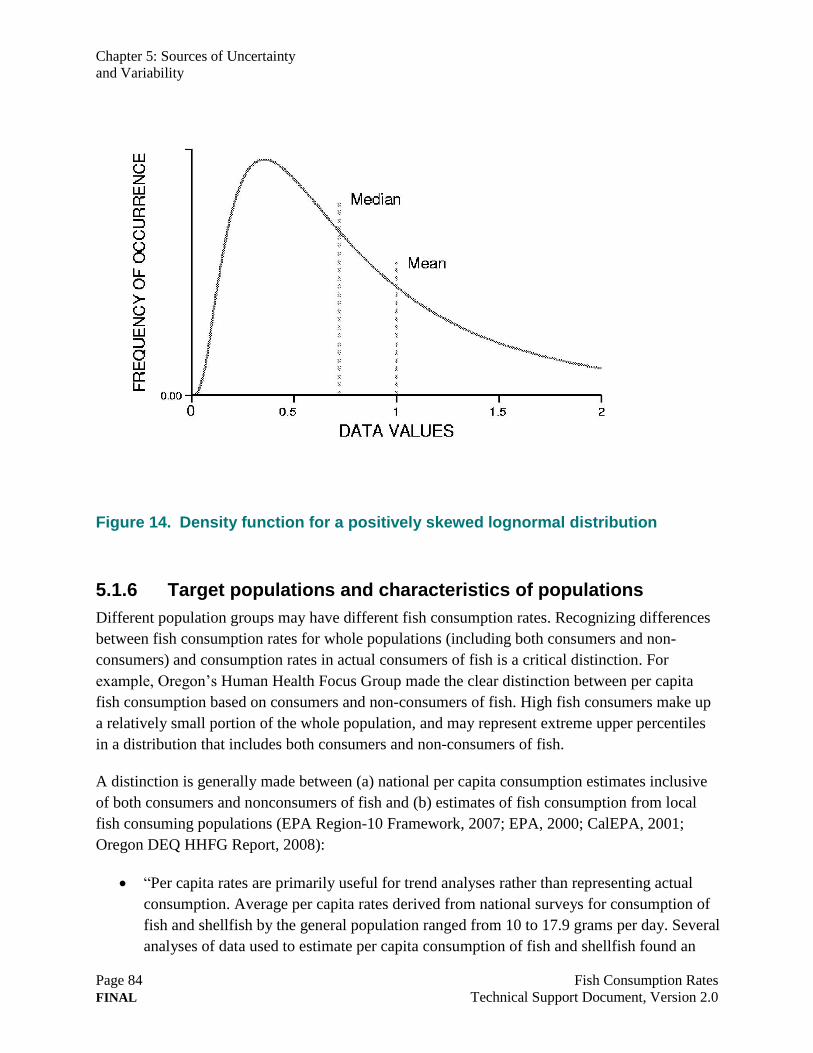
Chapter 5: Sources of Uncertainty
and Variability
Page 84 Fish Consumption Rates
FINAL Technical Support Document, Version 2.0
Figure 14. Density function for a positively skewed lognormal distribution
5.1.6 Target populations and characteristics of populations
Different population groups may have different fish consumption rates. Recognizing differences
between fish consumption rates for whole populations (including both consumers and non-
consumers) and consumption rates in actual consumers of fish is a critical distinction. For
example, Oregon’s Human Health Focus Group made the clear distinction between per capita
fish consumption based on consumers and non-consumers of fish. High fish consumers make up
a relatively small portion of the whole population, and may represent extreme upper percentiles
in a distribution that includes both consumers and non-consumers of fish.
A distinction is generally made between (a) national per capita consumption estimates inclusive
of both consumers and nonconsumers of fish and (b) estimates of fish consumption from local
fish consuming populations (EPA Region-10 Framework, 2007; EPA, 2000; CalEPA, 2001;
Oregon DEQ HHFG Report, 2008):
“Per capita rates are primarily useful for trend analyses rather than representing actual
consumption. Average per capita rates derived from national surveys for consumption of
fish and shellfish by the general population ranged from 10 to 17.9 grams per day. Several
analyses of data used to estimate per capita consumption of fish and shellfish found an
Chapter 5: Sources of Uncertainty
and Variability
Fish Consumption Rates Page 85
Technical Support Document, Version 2.0 FINAL
increase of approximately 25% between 1970 and the early 1990s, indicating that the U.S.
population as a whole consumed more fish in more recent years” (CalEPA, 2001, page 3).
“Consumption rates derived for consumers are preferable to per capita rate for use in
describing actual consumption of fish and shellfish in the U.S.” (CalEPA, 2001, page 3).
Further distinctions are made between national per capita fish consumption estimates and
consumer-only estimates by how consumers of fish and/or shellfish are defined. CalEPA, 2001,
provides further insights regarding consumption estimates for populations that consume fish
compared to estimates for the general national population as follows:
Rates reported for the general national population, usually referred to as per capita
rates, differ from those reported for subpopulations such as individuals who catch and
consume their own catch of fish and shellfish. It is essential to consider whether rates
that apply on a per capita basis are appropriate to the study question or whether rates
specific to particular subpopulations are needed. For example, some consumption rates
have been derived by averaging over both consumers and nonconsumers, as compared to
consumers only. These per capita estimates would not be representative of consumption
by actual consumers or other specific subpopulations. Thus, exposure assessments and
evaluation of potential risks to consumers must consider consumption rates appropriate
for actual consumers.
For groups of individuals who consume sport fish and/or shellfish, there is a continuum
ranging from intermittent fishers, who may eat fish only occasionally, to those who fish
regularly and/or heavily and consume large quantities of the fish that they catch. These
“high-end consumers” could include recreational fishers with high rates of success and
subsistence fishers who rely on their catch to feed themselves and their families.
Therefore, within the subset of the population that fishes (i.e., fishers) there is likely to be
a wide range of fishing effort and success, and a single value is unlikely to adequately
describe consumption by the entire fishing population (CalEPA, 2001, page 13).
5.2 Geographic differences
5.2.1 Variation and uncertainty associated with regional differences
Fish consumption surveys conducted across the United States have shown regional variations.
There are differences between coastal areas and inland areas and regional preferences for certain
types of finfish and/or shellfish. Local variations in climate, fishing regulations, accessibility to
fisheries, and seasonal differences in availability of fish contribute to the variability in reported
fish consumption rates (Ebert et al., 1994; Moya et al., 2008). Differences in habitat may be
relevant (U.S. EPA, 2007b).
Chapter 5: Sources of Uncertainty
and Variability
Page 86 Fish Consumption Rates
FINAL Technical Support Document, Version 2.0
Comparing the results of surveys from different geographic locations, each with regional effects
plus different methodologies, time frames, or other different survey design elements, makes the
interpretation of differences between surveys problematic.
5.2.2 Uncertainty associated with extrapolating survey results to different population groups and different locations
The use of surrogate consumption rates can misrepresent actual finfish and shellfish consumption
rates. For example, Puget Sound-harvested finfish and shellfish consumption rates derived using
Tulalip and Suquamish tribal data as a surrogate for another tribe could lead to either an
overestimate or an underestimate of the actual finfish and shellfish consumption.
For many reasons populations surveyed in a particular study may eat different quantities and ratios
of finfish and shellfish than do those who harvest elsewhere. For example, differences in habitat
type and quality between fishing grounds can affect the quantity of finfish and shellfish available
for harvest.
The EPA Region 10 framework takes this into account. For purposes of the framework, if certain
species or types of finfish and shellfish are not present, or will not be present in the future, tribal
members are assumed to substitute other species or types of finfish or shellfish that may be
equally affected by the site. This assumption of resource switching among local finfish and
shellfish is incorporated into the framework by holding constant the total amount of finfish and
shellfish consumed.
EPA’s policy decision to assume that resource switching occurs is supported by limited data and
examples in Puget Sound. For example, individuals in the Suquamish Tribe study (The
Suquamish Tribe, 2000) eat “more geoduck now, because they are more available to us, but we
used to dry oysters and clams....” Two other respondents reported “reduced consumption of
butter clams, cockles, and other clams and shellfish due to pollution,” but that this “reduced
consumption was offset by the higher availability of geoducks from the Suquamish Tribe.”
Resource switching has been documented in other areas affected by contamination, such as
Alaska (Fall and Utermohle, 1999).
The use of fisheries resources is important to tribes for economic, dietary, and cultural reasons.
Tribes will likely use whatever fisheries resources are available to them.
The following observation is made in the National Environmental Justice Advisory Council
Meeting report (U.S. EPA, 2002b):
For many communities of color, low-income communities, Tribes, and other indigenous
peoples, there are no real alternatives to eating and using fish, aquatic plants, and
wildlife. For members of these groups it is entirely impractical to “switch” to
“substitutes” when the fish and other resources on which they rely have become
Chapter 5: Sources of Uncertainty
and Variability
Fish Consumption Rates Page 87
Technical Support Document, Version 2.0 FINAL
contaminated. There are numerous and often insurmountable obstacles to seeking
alternatives (e.g., fishing “elsewhere,” throwing back “undesirable” species of fish,
adopting different preparation methods, or substituting beef, chicken or tofu). For some,
not fishing and not eating fish are unimaginable for cultural, traditional, or religious
reasons. For the fishing peoples of the Pacific Northwest, for example, fish and fishing
are necessary for survival as a people – they are vital as a matter of cultural flourishing
and self-determination.
If certain types of finfish or shellfish preferred by tribal members are not present in their usual
and accustomed areas, the framework assumes that tribal members will substitute alternative
local types of finfish or shellfish in their diets, generally within the same category of fish or
shellfish. Thus, the total consumption rate remains the same, regardless of the availability of a
particular type of finfish or shellfish. This is a reasonable and protective assumption for tribal
members who, for economic, ceremonial, religious, or personal preference reasons, are likely to
substitute one species for another.
The assumption that resources will be switched is likely to result in an overestimate of risks for
other tribal members who may decrease their overall finfish and shellfish consumption rate
because their preferred types are unavailable. Risks may be underestimated if the actual dietary
practices of a tribe would result in consumption of species that have higher contaminant levels
than the preferred or assumed types of finfish or shellfish.
5.2.3 Availability of finfish and shellfish
The abundance of finfish and shellfish resources available to a given population may be a source
of uncertainty. Different water bodies vary in their capacity to support and sustain different
species of finfish and shellfish. Furthermore, the capacity of the water body to support fish
resources may change over time, for both natural and human caused reasons.
Regarding the use of surrogate data, the EPA Region 10 framework notes:
Although the degree to which site-related risks could be overestimated by the use of any
of the fish and shellfish consumption rates presented in this Framework cannot be known
precisely, these methods are preferable to alternatives that would be likely to
underestimate site-related risks, such as basing a consumption rate (or site-related
estimates of risk) on the size of the cleanup site, or reducing the site’s estimated
contribution to fish and shellfish contamination because nearby sites or sources are
associated with similar contaminants. This Framework includes the assumption that the
selected Tribal fish and shellfish consumption rates and their associated risk estimates
will not be reduced based on consideration of the size of the cleanup site or the presence
of additional sources of contamination.
Chapter 5: Sources of Uncertainty
and Variability
Page 88 Fish Consumption Rates
FINAL Technical Support Document, Version 2.0
The use of a consumption rate based on all finfish and shellfish harvested from Puget Sound as a
surrogate for a consumption rate based on finfish and shellfish affected by a cleanup site is likely
to overestimate the risk of eating finfish and shellfish from the site, since only a portion of the
finfish and shellfish diet will have actually come from the site in question. The degree of
overestimation depends upon such factors as size and location of the site, type and degree of
contamination, and habits of affected finfish and shellfish.
A potential data gap is the lack of information on commercial routes of distribution for locally
harvested fish and/or shellfish to local food markets, restaurants, or other food outlets in
Washington State. However, seafood supply availability as an indirect measure of consumption
has very limited utility. As noted by CalEPA, 2001 (page 15):
Approaches to collecting data on fish consumption include both indirect and direct
measures. Indirect measures primarily rely on data pertaining to food availability or
food disappearance into marketing channels or households, and are best regarded as a
measure of food availability into commercial markets and only a rough indicator of
consumption. Data from studies on food availability generally have been collected for
purposes other than to estimate consumption rates, and data gaps are most serious at the
level of the individual consumer; therefore, these types of data are inappropriate for
estimating consumption rates for consumers (Anderson, 1986; U.S. EPA, 1992).
Additionally, food availability data do not account for waste or spoilage, and
interpretation of the results is highly specialized; however, the results from these types of
surveys can be useful to assess trends over time (Anderson, 1986).
On the other hand, some of the finfish and shellfish consumed in restaurants or obtained in
grocery stores may have been harvested in Puget Sound, which could lead to an underestimate of
exposure.
5.3 Temporal uncertainty and variability
Although estimates of consumption using short-term dietary recall may be reported as g/day, the
values may not be the same as long-term consumption rates averaged over time and presented as
a daily rate. Study methodologies that consider fish consumption over a longer period of time
may be more likely to represent the fish consumption patterns of the population studied.
5.3.1 Using short-term data to estimate long-term exposure
Current health risk models are designed to evaluate health risks associated with exposure over
long periods of time. Risk assessors typically use the results from short-term dietary surveys to
characterize the amounts of finfish and shellfish eaten on a regular basis over longer periods of
time intervals (years).
Chapter 5: Sources of Uncertainty
and Variability
Fish Consumption Rates Page 89
Technical Support Document, Version 2.0 FINAL
This approach works well when average values are used in the health risk model. However,
regulatory approaches based on concepts like reasonable maximum exposure are typically based
on the use of upper percentile values (e.g., 90th
percentile or above). In this situation, the use of
short-term survey results is complicated because the distribution of estimated fish consumption
rates over a short period of time will be more spread out than the actual fish consumption over a
longer period of time. This means that estimates of the 95th
percentile of the fish consumption
rates observed over a short period of time (one or two days) will be higher than the 95th
percentile of the average daily fish consumption over the longer periods of time considered in
health risk assessments (years). This narrowing of the distribution of estimates is called
regression to the mean.42
5.3.2 Temporal factors biasing estimates of fish consumption
The collection of fish consumption information may be subject to temporal biases. Use of 24-
hour recall data to estimate fish consumption rates over longer periods are subject to potential
biases from the effects of the day of the week or seasonal variations in the availability of fish.
Longer term estimates of fish consumption reported by individuals may be subject to recall bias.
Rates will be overestimated if fish consumption habits are surveyed when fish are readily
available relative to periods when fish are not readily available. Consumption data obtained on
consecutive days may be biased due to the consumer correlation with the fish consumed on
adjacent days.
Recall bias for estimates of long-term fish consumption is more of an issue for populations
where fish may be infrequently consumed and consumption patterns are episodic in nature. In
contrast, recall bias in estimating long-term fish consumption rates is minimized for populations
in which fish is a primary dietary protein source, is consumed frequently, and where
consumption information is hence easily recalled.
The timing of survey administration may or may not account for the biases introduced by seasonal
variations in fish availability. Extrapolating estimates of long-term fish consumption from 24-
hour recall data or from evaluations of yearly fish consumption may be improved by interviewing
fractions of the survey populations during different seasons or by re-interviewing individuals.
Short-term estimates of food intake rates for infrequently consumed items for the general
population (e.g., fish) from national short-term surveys are bimodal, varying between zero and
the amount typically consumed at a meal. This results in an overestimate of the prevalence of
42 Regression to the mean is encountered in many areas of science and everyday life. For example, baseball batting averages have a much larger distribution early in the season compared to the end of the season. The following case study illustrates the implications of this situation. There were 177 major league players with at least 400 plate appearances during the 2011 season. Consider the players’ batting averages after their first game and at the end of the 162 game season. The first day estimates for the median and average provide a reasonably good estimate of those values for the whole season. However, the first day estimates for the 90th and 95th percentiles of the distribution of batting averages are much higher than the end-of-the season values. As with many situations, players who did extremely well on the first day of the season also had days where they were hitless. Conversely, players who went hitless on opening day had games later in the season where they had one or more hits.
Chapter 5: Sources of Uncertainty
and Variability
Page 90 Fish Consumption Rates
FINAL Technical Support Document, Version 2.0
low and high intake rates relative to those that would be seen over a longer observation period.
This variation is particularly relevant for assessments of food chemical exposure where the
parameters of interest are at the extremes of the exposure distribution rather than at the center
(Lambe, 2002).
Attempts to account for the variability and uncertainty associated with the use of short-term
consumption studies have generally included qualitative evaluation of data from a range of
sources, coupled with consideration of the intended use of the data. To evaluate long-term
(habitual) seafood intake, longer-term survey data are preferable to short-term dietary survey data.
Ecology conducted a statistical reanalysis of short-term national fish consumption data to
estimate long-term (usual) national fish consumption rates, using the methodology of Tooze
et al., 2006 (as cited in Polissar et al., 2012). National fish consumption rate estimates based on
this reanalysis are significantly lower than estimates based on simple extrapolation of the short-
term fish consumption data. See also the Technical Issue Paper, Estimating Annual Fish
Consumption Rates Using Data from Short-term Surveys (Ecology, 2012).
5.3.3 Issues using currently suppressed fish consumption data to predict future fish consumption
The presence (or absence) of finfish and shellfish adversely affected by site-related
contamination could suppress consumption rates observed during surveys.
The Oregon DEQ Human Health Focus Group discussed some of the factors that may contribute
to depressing fish consumption rates compared to historic rates. They noted (1) significant
reductions in fish populations, (2) the belief that fish that reside in polluted waters will
bioconcentrate pollutants and are contaminated and unsafe to eat, and (3) the intended impact of
local fish advisories or the unintended consequences of national fish advisories of commercial
fish species that are not applicable to local waters.
The Human Health Focus Group also noted that some studies excluded or discounted high fish
consumers by identifying them as statistical outliers. This would have the effect of
underestimating the true range in fish consumption rates. If the rates are already suppressed, the
elimination of the highest values may be reporting an artificially low fish consumption rate.
Where tribal members have already reduced their harvest of finfish and shellfish from impaired
habitat, the use of current consumption rates could result in underestimations of potential finfish
and shellfish consumption rates. As noted in the National Environmental Justice Advisory
Council Meeting report (U.S. EPA, 2002b):
A suppression effect occurs when a fish consumption rate for a given subpopulation
reflects a current level of consumption that is artificially diminished from an appropriate
baseline level of consumption for that subpopulation . . . When agencies set environmental
standards using a fish consumption rate based upon an artificially diminished
Chapter 5: Sources of Uncertainty
and Variability
Fish Consumption Rates Page 91
Technical Support Document, Version 2.0 FINAL
consumption level, they may set in motion a downward spiral whereby the resulting
standards permit further contamination and/or depletion of the fish and aquatic resources.
Cleanup levels in the local aquatic environment, if they are based on current finfish and shellfish
consumption rates in the vicinity of the cleanup site, may not reflect the potential for the water
body to rebound from its current, relatively contaminated state. This should be considered when
deciding whether the use of a surrogate tribal finfish and shellfish consumption rate would better
represent potential future consumption rates than would consumption rates that represent only
current or near-term contamination and habitat conditions.
Studies indicate that tribal fish consumption rates are suppressed compared with historical rates
and presumable rates that would exist given historical fishing stocks. The recommendations in
this report, however, were developed using existing data from published studies.
For Native American populations in Washington, evaluating fish consumption rates using
common survey methodology may be problematic (Donatuto and Harper, 2008). Surveys and the
exposure models they develop provide information only about current consumption patterns. The
number of tribal members practicing traditional lifestyles is below known historical levels.
Survey data do not provide information on historical fish consumption rates and resource use,
which may be more indicative of consumption rates.
Researchers suggest that suppression happens for various reasons (Donatuto and Harper, 2008).
Two reasons are contamination and lower abundance. When the fish are contaminated or absent,
tribal members may eat less fish and/or substitute other types of fish. While, historically, fish
provided the main dietary source of protein, this is true today for only a small subset of the tribal
population (Harper et al., 2007; Harper and Harris, 2008; Harris and Harper, 2001). Tribal health
experts suggest that current tribal fish consumption rates are suppressed due to diminished access
to historical quantities of finfish and shellfish, and some researchers believe that historical rates
represent the appropriate baseline level of consumption. Effects of suppression due to chemical
contamination should be accounted for in environmental cleanup regulations. However,
accounting for suppression in environmental cleanup regulations may be problematic when
suppression is due to permanent loss or modification of habitat due to urban infrastructure.
Where habitat can be restored, then environmental cleanup regulations need to account for
suppression effects in revising fish consumption estimates to help support cleanup decisions.
5.4 Uncertainty in Pacific Northwest fish-consuming populations
Ecology has identified numerous fish dietary surveys in Washington State that reflect high rates
of consumption for certain ethnic groups (CRITFC, 1994; Toy et al., 1996; Sechena et al., 1999;
The Suquamish Tribe, 2000). Consumption estimates vary among subpopulations by age, sex,
mode of harvesting, and by region within Washington State. Washington State fish-consuming
Chapter 5: Sources of Uncertainty
and Variability
Page 92 Fish Consumption Rates
FINAL Technical Support Document, Version 2.0
populations have been identified (tribal populations, Asian-Pacific Islanders, recreational fishers)
and levels of consumption have been estimated from these surveyed populations. These higher
fish-consuming ethnic populations and other high-end fish consumers are represented by upper
percentile consumption estimates (90th
and 95th
percentile) derived from distributional analysis of
the fish dietary data (CalEPA, 2001; Polissar et al., 2012).
Many of the Pacific Northwest regional-specific surveys note differences in patterns of fish
consumption (e.g., eating different fish parts) and fish harvesting techniques, which demonstrates a
level of variability across and among these fish-consuming populations (CalEPA, 2001; CRITFC,
1994; Toy et al., 1996; Sechena et al., 1999; The Suquamish Tribe, 2000; EPA EFH, 2011). Central
tendency estimates of consumption for these populations are very similar (all fish from local
harvests) with upper percentile estimates (90th
and 95th
percentile) within an order of magnitude.
There is considerable uncertainty inherent in evaluating and estimating fish consumption rates
for northwest fish-consuming populations. Much of the uncertainty is because the available
information, although substantial, nonetheless provides only a partial picture of fish consumers
in Washington. Sources of uncertainties can include the following:
Whether the available surveys provide a complete picture of the variety of fish
consumption practices among various fish consuming populations.
Evolving and changing lifestyle patterns for various populations across the state.
Data gaps around dietary habits for other potentially high fish-consuming populations;
for example, various ethnic groups, pescadarians (people who eat fish but not meat),
subsistence fishers, and low income groups.
Using information about one group as a surrogate for another group’s consumption rate
based on evaluation of the similarity or differences in, say, species available or the extent
of local shellfish habitat.
The degree to which lifestyle (ethnic, tribal, subsistence, etc.) is recognized and
accounted for in consumption studies.
Whether or how information from the national fish dietary dataset may be inadequate for
understanding fish consumption along coastal states with significant fishery resources.
Whether and how a particular study addresses consumption of anadromous fish species.
It is expected that as the body of information grows some of these data gaps will be filled and
uncertainty about Pacific Northwest fish-consuming populations will decrease.
Chapter 6: Using Scientific Data
to Support Regulatory Decisions
Fish Consumption Rates Page 93
Technical Support Document, Version 2.0 FINAL
Chapter 6: Using Scientific Data to Support Regulatory Decisions
The purpose of this Technical Support Document (Version 2.0) is to compile and evaluate available
information on fish consumption in Washington State. There are risk management issues related to
regulatory decisions based on this information. This is a technical document; it is not designed to
resolve policy issues associated with using that information to make regulatory decisions. Ecology
will be considering those issues in separate documents and processes.
This chapter is intended to provide context. It offers a brief introduction for people who are
interested in the multiple and interrelated questions that arise during regulatory decision making.
The Conservation Foundation has stated that it is important that environmental agencies
distinguish between scientific and policy choices when making regulatory decisions
(Conservation Foundation, 1984, p. 310):
A key to understanding the risk assessment process is to distinguish between those
aspects of the process that are scientific and those that are matters of policy or
personal values, and to appreciate their complex interrelationships …. A risk
assessment process that is defensible from both a scientific and a policy
standpoint must accurately identify which aspects of the assessment are policy
and which are science. The difficulty is that both scientists and policy makers tend
to define their realm in the broadest terms.
The interaction between science and policy in regulatory decision making is complicated.
Several equally valid scientific options may resolve a particular issue. In these situations, the
regulatory decision essentially represents a policy choice that must take into account statutory
directives, implementation issues, and value judgments on how to deal with scientific uncertainty
and variability in exposure and susceptibility. As Victor Hugo once wrote, “Science says the first
word on everything, and the last word on nothing,” (Hugo and O’Rourke, 1907).
Chapters 4 and 5 of this report provide Ecology’s evaluation and conclusions regarding current
scientific information on fish consumption rates in the Pacific Northwest. As the wealth of
knowledge continues to grow, additional information will be available in the future. Science-
based regulations may have built-in requirements to periodically review and update standards
based on new information. This chapter highlights some of the policy choices that will be needed
when using this information to support regulatory decisions. The chapter is organized into
sections. Each section provides a brief description of a particular regulatory issue and a range of
examples to illustrate how agencies have resolved that issue. The issues are:
Chapter 6: Using Scientific Data
to Support Regulatory Decisions
Page 94 Fish Consumption Rates
FINAL Technical Support Document, Version 2.0
Population groups.
Individual variability in fish consumption rates.
Geographic variations in fish consumption rates.
How anadromous species (e.g., salmon) are included in fish consumption rates used for
environmental regulation.
Locally caught vs. store-bought finfish and shellfish.
Development of regulatory fish consumption rate estimates from consumer-only vs. per
capita surveys.
Other exposure factors (e.g., body weight and exposure duration).
Acceptable risk.
This is a partial list. Other issues may hold equal or greater importance for particular decisions.
In addition, agencies typically do not consider individual policy choices in isolation from other
choices. In other words, a decision on one issue may impact the decisions on other issues. For
example, decisions on what constitutes an acceptable level of risk may influence decisions on
how to address the uncertainties and variability in fish consumption rates.
6.1 Population groups
When developing a regulatory standard based on health protection, agencies must decide what
population groups that standard is designed to protect. This is a policy choice that can be made on
a programmatic (or statewide) or site-specific basis. This choice can have large implications given
the differences in fish consumption rates calculated using information summarized in Chapter 4.
This policy choice is influenced by many factors including statutory requirements, environmental
equity, and the nature of the decision (programmatic vs. site-specific). Options typically
considered by agencies include:
General population. Environmental and health agencies have established regulatory
requirements or fish advisories that are based on the amount of finfish and shellfish
consumed by members of the general population. For example, the EPA has adopted
guidance for implementing the Clean Water Act that includes a default fish consumption
rate of 17.5 g/day. The data used to establish this rate include individuals who do not eat
fish. Several states have used this value to develop state water quality standards and
cleanup standards for individual sites.
Recreational anglers. Environmental and health agencies have established regulatory
requirements or fish advisories using information on the amount of finfish and shellfish
consumed by recreational anglers. For example, Ecology in 1991 adopted a default fish
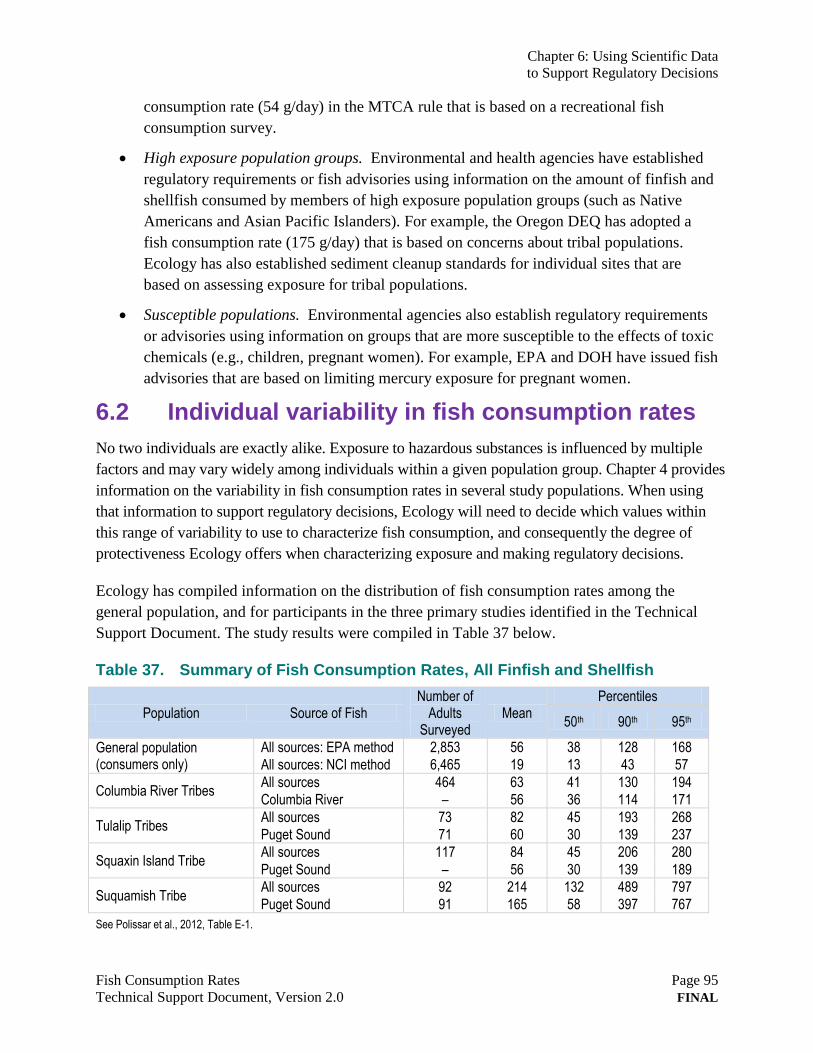
Chapter 6: Using Scientific Data
to Support Regulatory Decisions
Fish Consumption Rates Page 95
Technical Support Document, Version 2.0 FINAL
consumption rate (54 g/day) in the MTCA rule that is based on a recreational fish
consumption survey.
High exposure population groups. Environmental and health agencies have established
regulatory requirements or fish advisories using information on the amount of finfish and
shellfish consumed by members of high exposure population groups (such as Native
Americans and Asian Pacific Islanders). For example, the Oregon DEQ has adopted a
fish consumption rate (175 g/day) that is based on concerns about tribal populations.
Ecology has also established sediment cleanup standards for individual sites that are
based on assessing exposure for tribal populations.
Susceptible populations. Environmental agencies also establish regulatory requirements
or advisories using information on groups that are more susceptible to the effects of toxic
chemicals (e.g., children, pregnant women). For example, EPA and DOH have issued fish
advisories that are based on limiting mercury exposure for pregnant women.
6.2 Individual variability in fish consumption rates
No two individuals are exactly alike. Exposure to hazardous substances is influenced by multiple
factors and may vary widely among individuals within a given population group. Chapter 4 provides
information on the variability in fish consumption rates in several study populations. When using
that information to support regulatory decisions, Ecology will need to decide which values within
this range of variability to use to characterize fish consumption, and consequently the degree of
protectiveness Ecology offers when characterizing exposure and making regulatory decisions.
Ecology has compiled information on the distribution of fish consumption rates among the
general population, and for participants in the three primary studies identified in the Technical
Support Document. The study results were compiled in Table 37 below.
Table 37. Summary of Fish Consumption Rates, All Finfish and Shellfish
Population Source of Fish Number of
Adults Surveyed
Mean Percentiles
50th 90th 95th
General population (consumers only)
All sources: EPA method 2,853 56 38 128 168
All sources: NCI method 6,465 19 13 43 57
Columbia River Tribes All sources 464 63 41 130 194
Columbia River – 56 36 114 171
Tulalip Tribes All sources 73 82 45 193 268
Puget Sound 71 60 30 139 237
Squaxin Island Tribe All sources 117 84 45 206 280
Puget Sound – 56 30 139 189
Suquamish Tribe All sources 92 214 132 489 797
Puget Sound 91 165 58 397 767
See Polissar et al., 2012, Table E-1.
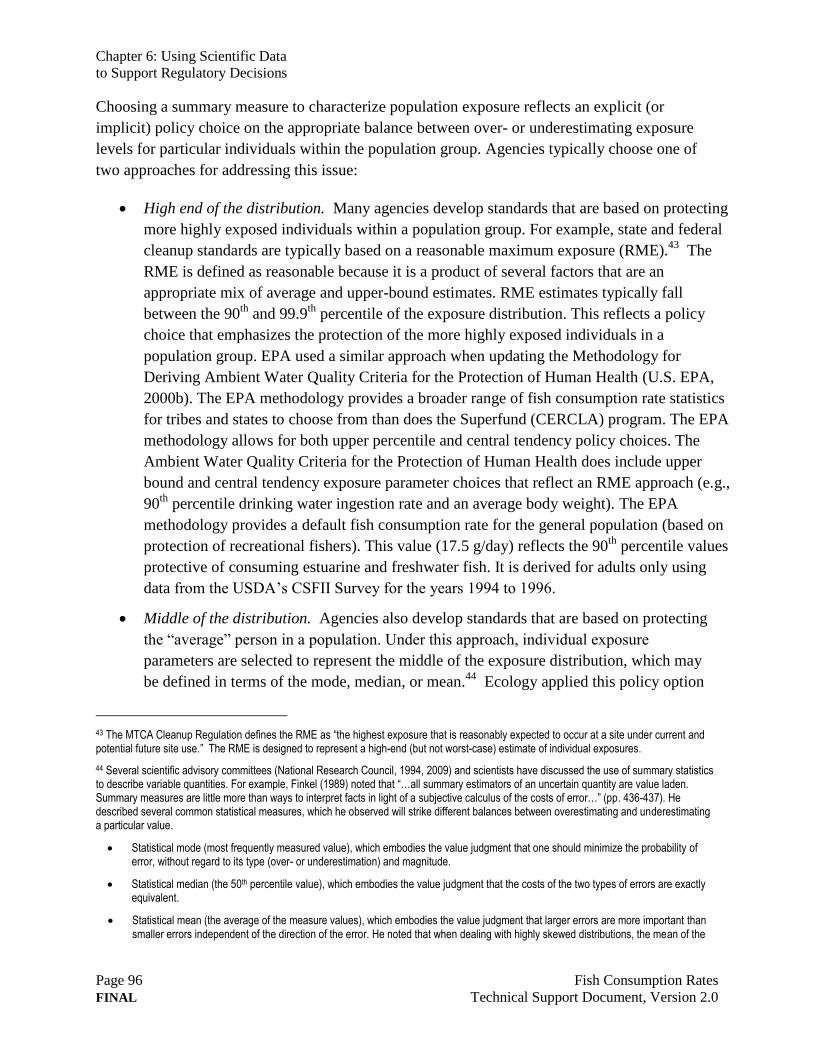
Chapter 6: Using Scientific Data
to Support Regulatory Decisions
Page 96 Fish Consumption Rates
FINAL Technical Support Document, Version 2.0
Choosing a summary measure to characterize population exposure reflects an explicit (or
implicit) policy choice on the appropriate balance between over- or underestimating exposure
levels for particular individuals within the population group. Agencies typically choose one of
two approaches for addressing this issue:
High end of the distribution. Many agencies develop standards that are based on protecting
more highly exposed individuals within a population group. For example, state and federal
cleanup standards are typically based on a reasonable maximum exposure (RME).43
The
RME is defined as reasonable because it is a product of several factors that are an
appropriate mix of average and upper-bound estimates. RME estimates typically fall
between the 90th
and 99.9th
percentile of the exposure distribution. This reflects a policy
choice that emphasizes the protection of the more highly exposed individuals in a
population group. EPA used a similar approach when updating the Methodology for
Deriving Ambient Water Quality Criteria for the Protection of Human Health (U.S. EPA,
2000b). The EPA methodology provides a broader range of fish consumption rate statistics
for tribes and states to choose from than does the Superfund (CERCLA) program. The EPA
methodology allows for both upper percentile and central tendency policy choices. The
Ambient Water Quality Criteria for the Protection of Human Health does include upper
bound and central tendency exposure parameter choices that reflect an RME approach (e.g.,
90th
percentile drinking water ingestion rate and an average body weight). The EPA
methodology provides a default fish consumption rate for the general population (based on
protection of recreational fishers). This value (17.5 g/day) reflects the 90th
percentile values
protective of consuming estuarine and freshwater fish. It is derived for adults only using
data from the USDA’s CSFII Survey for the years 1994 to 1996.
Middle of the distribution. Agencies also develop standards that are based on protecting
the “average” person in a population. Under this approach, individual exposure
parameters are selected to represent the middle of the exposure distribution, which may
be defined in terms of the mode, median, or mean.44
Ecology applied this policy option
43 The MTCA Cleanup Regulation defines the RME as “the highest exposure that is reasonably expected to occur at a site under current and potential future site use.” The RME is designed to represent a high-end (but not worst-case) estimate of individual exposures.
44 Several scientific advisory committees (National Research Council, 1994, 2009) and scientists have discussed the use of summary statistics to describe variable quantities. For example, Finkel (1989) noted that “…all summary estimators of an uncertain quantity are value laden. Summary measures are little more than ways to interpret facts in light of a subjective calculus of the costs of error…” (pp. 436-437). He described several common statistical measures, which he observed will strike different balances between overestimating and underestimating a particular value.
Statistical mode (most frequently measured value), which embodies the value judgment that one should minimize the probability of error, without regard to its type (over- or underestimation) and magnitude.
Statistical median (the 50th percentile value), which embodies the value judgment that the costs of the two types of errors are exactly equivalent.
Statistical mean (the average of the measure values), which embodies the value judgment that larger errors are more important than smaller errors independent of the direction of the error. He noted that when dealing with highly skewed distributions, the mean of the
Chapter 6: Using Scientific Data
to Support Regulatory Decisions
Fish Consumption Rates Page 97
Technical Support Document, Version 2.0 FINAL
when selecting many of the exposure parameters used to calculate Method C cleanup
levels in the MTCA rule.
6.3 Geographic variability
Chapter 4 indicates that there is substantial variation in the amount of finfish and shellfish
consumed in different parts of Washington. Several factors contribute to these variations:
Water body characteristics.
Fish species (shellfish vs. finfish vs. salmon).
Local communities.
Ecology believes that a certain amount of flexibility is needed to address this type of geographic
variability. The question is where to build in the flexibility and where it is most needed.
Flexibility is important for considering questions around current and future habitat and resource
abundance, as well as the variability of fish species present at a site and their life cycle, including
where contaminants are obtained. Ecology also acknowledges that some (but not all) water
bodies are large enough to sustain moderate to high fish consumption rates.
Agencies have several options for addressing the geographic variations in fish consumption
rates. These options include:
Single statewide fish consumption rate. Regulatory agencies may adopt uniform
statewide values that do not fully account for geographic variability in fish consumption
rates. (For example, the current Water Quality Standards for Surface Waters are based
upon a single fish consumption rate of 6.5 grams/day. Similarly, the MTCA Cleanup
Regulation includes a single default fish consumption rate of 54 grams/day.) However,
this approach ultimately requires several policy choices regarding the appropriate
statewide value.
Multiple regional fish consumption rates. Regulatory agencies may adopt regulatory
requirements that use several fish consumption rates that reflect the diversity of fish
consumption from various water bodies in Washington. Several people who provided
comments on Version 1.0 of this Technical Support Document recommended that
Ecology consider this option.
Site-specific fish consumption rates. Regulatory agencies develop site-specific fish
consumption rates that are used to establish regulatory requirements that are applicable to
specific cleanup sites or dischargers. This approach can be implemented in combination
with a default value established on a programmatic basis. As noted above, the MTCA
distribution will often (but not always) fall at the upper end of the distribution. In some cases, the mean may approach the 95th percentile of the distribution.
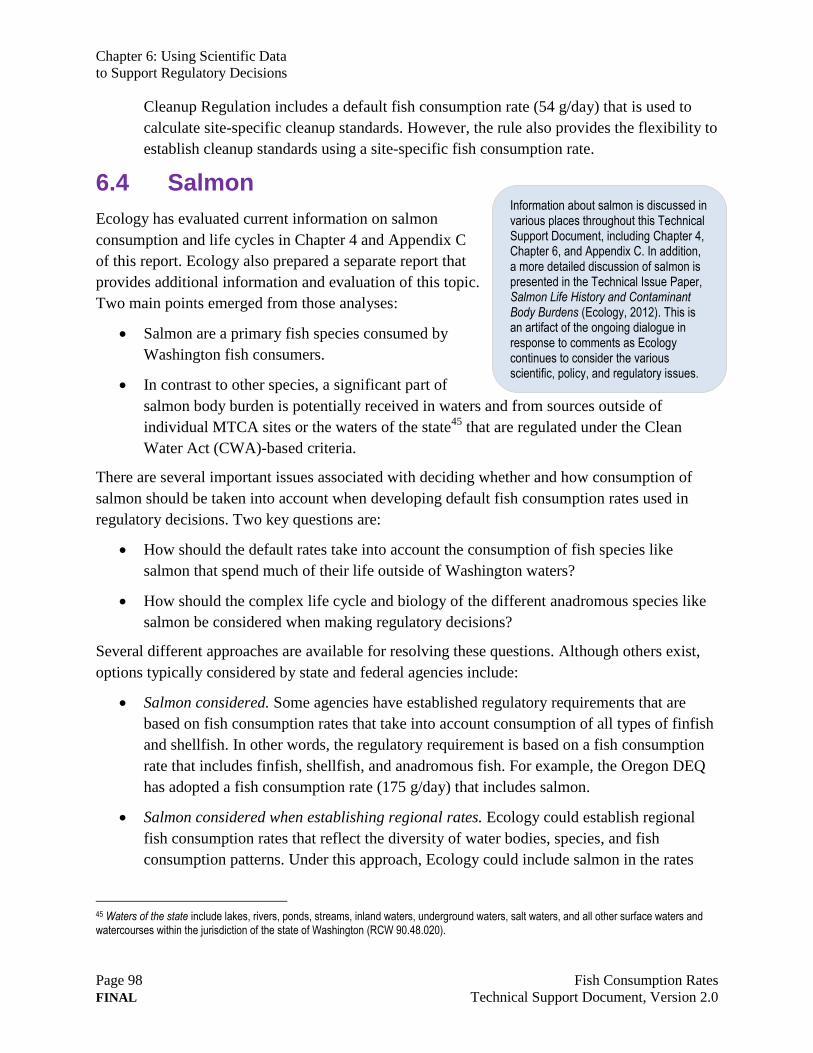
Chapter 6: Using Scientific Data
to Support Regulatory Decisions
Page 98 Fish Consumption Rates
FINAL Technical Support Document, Version 2.0
Information about salmon is discussed in various places throughout this Technical Support Document, including Chapter 4, Chapter 6, and Appendix C. In addition, a more detailed discussion of salmon is presented in the Technical Issue Paper, Salmon Life History and Contaminant Body Burdens (Ecology, 2012). This is an artifact of the ongoing dialogue in response to comments as Ecology continues to consider the various scientific, policy, and regulatory issues.
Cleanup Regulation includes a default fish consumption rate (54 g/day) that is used to
calculate site-specific cleanup standards. However, the rule also provides the flexibility to
establish cleanup standards using a site-specific fish consumption rate.
6.4 Salmon
Ecology has evaluated current information on salmon
consumption and life cycles in Chapter 4 and Appendix C
of this report. Ecology also prepared a separate report that
provides additional information and evaluation of this topic.
Two main points emerged from those analyses:
Salmon are a primary fish species consumed by
Washington fish consumers.
In contrast to other species, a significant part of
salmon body burden is potentially received in waters and from sources outside of
individual MTCA sites or the waters of the state45
that are regulated under the Clean
Water Act (CWA)-based criteria.
There are several important issues associated with deciding whether and how consumption of
salmon should be taken into account when developing default fish consumption rates used in
regulatory decisions. Two key questions are:
How should the default rates take into account the consumption of fish species like
salmon that spend much of their life outside of Washington waters?
How should the complex life cycle and biology of the different anadromous species like
salmon be considered when making regulatory decisions?
Several different approaches are available for resolving these questions. Although others exist,
options typically considered by state and federal agencies include:
Salmon considered. Some agencies have established regulatory requirements that are
based on fish consumption rates that take into account consumption of all types of finfish
and shellfish. In other words, the regulatory requirement is based on a fish consumption
rate that includes finfish, shellfish, and anadromous fish. For example, the Oregon DEQ
has adopted a fish consumption rate (175 g/day) that includes salmon.
Salmon considered when establishing regional rates. Ecology could establish regional
fish consumption rates that reflect the diversity of water bodies, species, and fish
consumption patterns. Under this approach, Ecology could include salmon in the rates
45 Waters of the state include lakes, rivers, ponds, streams, inland waters, underground waters, salt waters, and all other surface waters and watercourses within the jurisdiction of the state of Washington (RCW 90.48.020).
Chapter 6: Using Scientific Data
to Support Regulatory Decisions
Fish Consumption Rates Page 99
Technical Support Document, Version 2.0 FINAL
applicable to some water bodies while excluding salmon in the rates for other water
bodies. Ecology is not aware of examples where this approach has been used.
Salmon considered when establishing site-specific rates. Ecology could establish site-
specific fish consumption rates that include salmon for some (but not all) cleanup sites.
Under this approach, Ecology would consider the cleanup site’s contribution to salmon
body burden when establishing site-specific cleanup standards.
Salmon NOT considered. Some agencies have established regulatory requirements that
are based on fish consumption rates that do not include salmon. For example, the EPA
used this approach when establishing the default fish consumption rates that are included
in the EPA Region 10 framework. Most states have adopted human health-based water
quality criteria that do not include anadromous salmon in the fish consumption rate.
6.5 Sources of finfish/shellfish
In some surveys, people are asked to provide information on the source of the finfish and shellfish
they have consumed. Sources of finfish and shellfish are generally categorized as self-harvested or
purchased from stores or restaurants. Not all locally harvested fish may be affected by site-specific
contamination. Chapter 4 summarizes information from the four key regional fish consumption
surveys conducted in the Pacific Northwest. Section 4.7 summarizes available information on the
source of finfish and shellfish. For these tribal populations, locally or regionally harvested finfish
and shellfish represents 67 to 96 percent of total finfish and shellfish consumed.
Several different approaches are used by federal and state regulatory programs to account for
patterns of exposure from different sources. Options typically considered by agencies include:
Fish consumption rates based on consumption of all finfish and shellfish. Some agencies
establish default and site-specific fish consumption rates using study results that reflect
the total amount of finfish and shellfish consumed by study participants (independent of
whether the finfish/shellfish were locally harvested or store-bought). For example, the
Oregon DEQ used this approach when they revised Oregon’s Water Quality Standards
for Surface Waters.
Fish consumption rates based on consumption of locally harvested finfish and shellfish.
Some agencies establish default and site-specific fish consumption rates using study
results that reflect locally harvested finfish and shellfish consumed by study participants.
For example, the EPA Region 10 framework explicitly recognizes source contribution
issues by adjusting total fish consumption rates to account for fish harvested and
consumed from Puget Sound (U.S. EPA, 2007b).
Fish diet fraction. Some agencies make site-specific adjustments to account for the
amount of locally harvested finfish and shellfish caught at or near an individual sediment
cleanup site. For example, the MTCA rule currently considers the fish diet fraction when
Chapter 6: Using Scientific Data
to Support Regulatory Decisions
Page 100 Fish Consumption Rates
FINAL Technical Support Document, Version 2.0
calculating site-specific surface water cleanup standards. The fish diet fraction is defined
in the MTCA rule as “….the percentage of the total finfish and/or shellfish in an
individual’s diet that is obtained or has the potential to be obtained from the site” (WAC
173-340-708(10)(b)). Applying the 0.5 default fish diet fraction under MTCA to the 54
g/day default fish consumption rate (see Figures 15 and 16) results in an effective fish
consumption rate of 27 g/day.
6.6 Consumer vs. per capita
Fish consumption surveys typically include people who eat fish and people who don’t eat fish.
People who don’t eat fish are termed non-consumers. Those that do eat fish are considered
consumers. The proportion of non-consumers included in the survey will vary depending on the
population being interviewed.
The results from fish consumption surveys can be reported in terms of consumer-only rates and
per capita rates. Consumer-only intake rates refer to the quantity of finfish and shellfish
consumed by individuals during the survey period. These data are generated by averaging intake
across only the individuals in the survey who consumed finfish and shellfish during the survey
period. Per capita intake rates are generated by averaging intake rates over the entire survey
population (including those individuals that reported no intake).
There can be large differences in study results reported on a consumer-only and per-capita basis
when a large percentage of study participants report that they did not eat any finfish or shellfish
during the survey period. For example, EPA evaluated national data from approximately 20,000
individuals (3 years and older). Approximately 28 percent were fish consumers. When expressed
on a per-capita basis, the 90th
percentile of the reported results was 17.5 g/day. When expressed on
a consumer-only basis, the 90th
percentile of the reported results was 250 g/day (U.S. EPA, 2002a).
However, there are much smaller differences in studies where a high percentage of study
participants reported they ate some amount of fish during the survey period. For example, the
per-capita and consumer-only rates from the CRITFC study are virtually identical.
Federal and state environmental agencies have used both types of information to establish
regulatory requirements. Options include:
Per capita data. Environmental agencies have used per capita fish consumption rates to
establish regulatory requirements. For example, several states have adopted surface water
quality standards that are based on the 90th
percentile of 17.5 g/day.
Consumer-only data. Environmental agencies have used consumer-only fish consumption
rates to establish regulatory requirements. For example, the EPA Region 10 framework
includes several default fish consumption rates that are based on consumer-only
information.
Chapter 6: Using Scientific Data
to Support Regulatory Decisions
Fish Consumption Rates Page 101
Technical Support Document, Version 2.0 FINAL
6.7 Other exposure variables
Ecology uses a risk assessment approach to establish cleanup standards and water quality
standards based on human health protection. Risk-based concentrations can be calculated for
both cancer and non-cancer health effects using standard risk assessment equations. This
document is not designed to provide a detailed discussion on individual exposure parameters and
the relationships between those parameters and the fish consumption rate used to calculate risk-
based concentrations. However, when selecting fish consumption rates used in regulatory
decisions, it is important to consider the following points:
Regulatory choices on individual parameters need to be based on a common exposure
scenario. It is important that agencies select fish consumption rates that are consistent
with other exposure parameters. For example, if risk calculations are performed using a
child’s body weight, the fish consumption rate should be based on the amount of finfish
and shellfish eaten by children.
Regulatory choices on individual exposure parameters need to recognize the value
judgments embedded in those parameters and the cumulative impact of those choices. For
example, selecting upper percentile values for all exposure parameters will result in a risk
estimate that does not represent a “reasonable” maximum exposure scenario (RME).
Values should be concordant with the populations chosen to represent regulatory
exposure scenarios, for example body weight for tribal populations or particular ethnic
groups. Similarly, exposure duration should reflect the duration of times populations
selected for evaluation use water bodies for fishing. Tribes have Usual and Accustomed
fishing areas they may use over long periods of time. Individuals may relocate over
limited geographic areas and still utilize water bodies for fishing with the implication that
times in a single residence may not be an appropriate exposure duration.
How bioaccumulation is accounted for is also a source of uncertainty and variability. The
use of bioconcentration factors (BCFs) that relate contaminant concentrations in aquatic
biota to those in water are being replaced by bioaccumulation factors (BAFs) that relate
contaminant concentrations in aquatic biota to those from all sources.
Figures 15 and 16 illustrate other exposure parameters. Shown are equations used to
establish MTCA surface water cleanup standards based on non-cancer hazard and cancer
risks (Figures 15 and 16, respectively). In addition to a default fish consumption rate, the
equation includes default values for body weight, exposure duration, and fish diet
fraction. A similar (but not identical) equation is used to establish water quality
standards. Several of the exposure assumptions used to establish water quality standards
are different than those used under the MTCA rule.
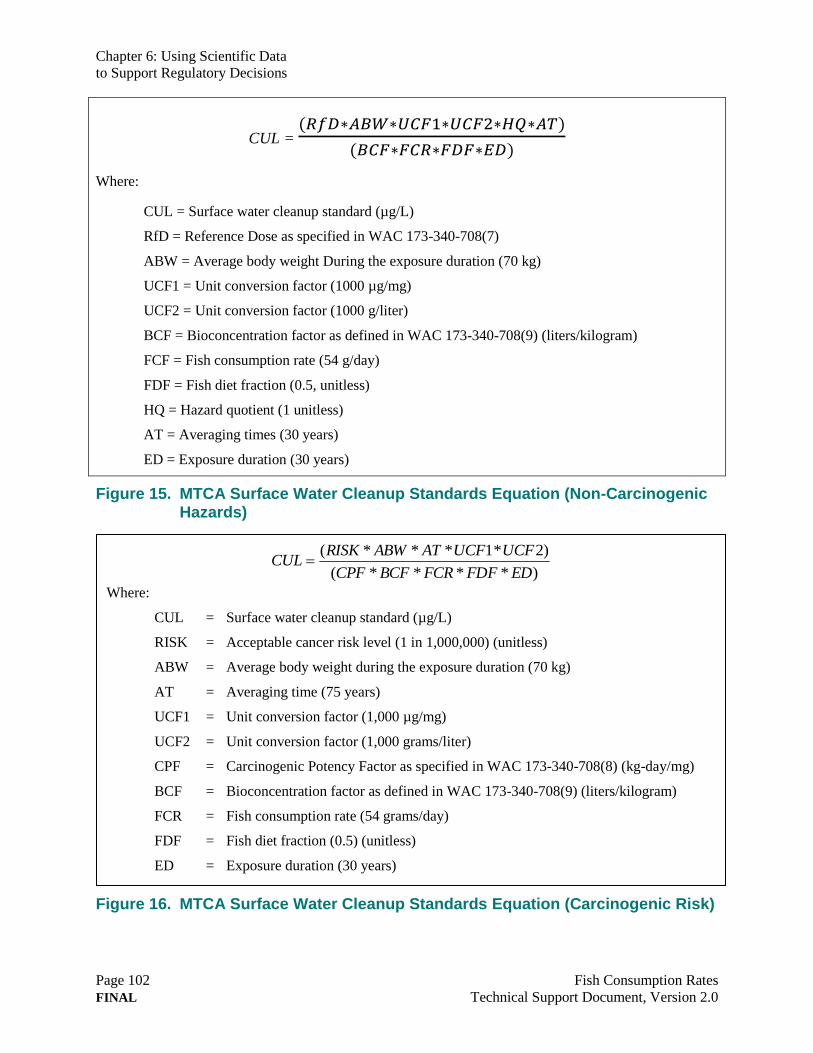
Chapter 6: Using Scientific Data
to Support Regulatory Decisions
Page 102 Fish Consumption Rates
FINAL Technical Support Document, Version 2.0
CUL =
Where:
CUL = Surface water cleanup standard (µg/L)
RfD = Reference Dose as specified in WAC 173-340-708(7)
ABW = Average body weight During the exposure duration (70 kg)
UCF1 = Unit conversion factor (1000 µg/mg)
UCF2 = Unit conversion factor (1000 g/liter)
BCF = Bioconcentration factor as defined in WAC 173-340-708(9) (liters/kilogram)
FCF = Fish consumption rate (54 g/day)
FDF = Fish diet fraction (0.5, unitless)
HQ = Hazard quotient (1 unitless)
AT = Averaging times (30 years)
ED = Exposure duration (30 years)
Figure 15. MTCA Surface Water Cleanup Standards Equation (Non-Carcinogenic Hazards)
Figure 16. MTCA Surface Water Cleanup Standards Equation (Carcinogenic Risk)
)****(
)2*1***(
EDFDFFCRBCFCPF
UCFUCFATABWRISKCUL
Where:
CUL = Surface water cleanup standard (µg/L)
RISK = Acceptable cancer risk level (1 in 1,000,000) (unitless)
ABW = Average body weight during the exposure duration (70 kg)
AT = Averaging time (75 years)
UCF1 = Unit conversion factor (1,000 µg/mg)
UCF2 = Unit conversion factor (1,000 grams/liter)
CPF = Carcinogenic Potency Factor as specified in WAC 173-340-708(8) (kg-day/mg)
BCF = Bioconcentration factor as defined in WAC 173-340-708(9) (liters/kilogram)
FCR = Fish consumption rate (54 grams/day)
FDF = Fish diet fraction (0.5) (unitless)
ED = Exposure duration (30 years)
Chapter 6: Using Scientific Data
to Support Regulatory Decisions
Fish Consumption Rates Page 103
Technical Support Document, Version 2.0 FINAL
6.8 Acceptable risk levels
Washington’s current Water Quality Standards and MTCA Cleanup Regulation are both based
on an acceptable cancer risk of 1 in 1 million and a hazard quotient of one. These are central
policy choices that will continue to be discussed and debated. By necessity, decisions on
acceptable risk levels are informed by science but require consideration of a wide range of other
factors. For example:
Statutory requirements.
Social preferences on risk avoidance and distinctions between voluntary and involuntary
risks.
Uncertainties associated with risk assessment methods.
Risk tradeoffs, including the health benefits associated with eating finfish and shellfish.
Risk comparisons, including the risks associated with other common activities.
Economic impacts of attaining target risk levels.
This technical support document focuses on information about fish consumption. It does not
provide a detailed discussion on risk policy. Ecology acknowledges that when selecting fish
consumption rates for use in regulatory decisions it will be important to consider the
relationships and interactions between the various policy choices.
6.9 Summary
Agencies must address many scientific and policy issues when selecting a fish consumption rate
for use in particular regulatory situations. Chapters 3 through 5 compile the currently available
information on fish consumption rates in Washington. This chapter describes eight policy
choices that should be addressed when using this information in a regulatory context. These
policy choices must take into account statutory mandates and values that inevitably reflect
explicit or implicit choices on how to deal with scientific uncertainty and variability. There are
often multiple answers to these questions surrounding these issues. This chapter provides
examples of how Ecology or other agencies have resolved those issues in the past.
Chapter 6: Using Scientific Data
to Support Regulatory Decisions
Page 104 Fish Consumption Rates
FINAL Technical Support Document, Version 2.0
This page purposely left blank for duplicate printing.
Appendix A: Information on Bioaccumulation,
Fish Consumption by Children, and Species Consumed
Fish Consumption Rates Page A-1
Technical Support Document, Version 2.0 FINAL
Appendices
Appendix A Information on Bioaccumulation, Fish Consumption by
Children, and Species Consumed
This appendix includes information on:
1. Bioaccumulation
2. Children’s fish consumption rates
3. Data on species consumed
This information is included in this document to provide additional context for considering fish
consumption rates. For additional information readers are referred to references cited.
A.1 Bioaccumulation
Bioaccumulation of contaminants in finfish/shellfish
A detailed discussion regarding the bioaccumulation of chemicals in aquatic biota is beyond the
scope of this appendix. The EPA’s Methodology for Deriving Ambient Water Quality Criteria
for the Protection of Human Health (2000) dedicates an entire chapter on the subject of
bioaccumulation and changes in methodologies since the 1980s to assess and predict the
bioaccumulation of chemicals in aquatic biota. Federal and state guidance documents are
available that provide detailed analysis to assess and predict the bioaccumulation of chemicals in
aquatic biota (U.S. EPA, 2000b, 2000c, 2007a; State Water Resources Control Board of
California, 2004; CalEPA, 2006). An 800-page appendix to EPA’s Bioaccumulation Testing and
Interpretation for the Purpose of Sediment Quality Assessment provides chemical-specific
information relevant to the bioaccumulation of chemicals in aquatic biota (U.S. EPA, 2000c,
Appendices).
EPA makes a clear distinction between the terms bioaccumulation and bioconcentration. The
term bioaccumulation “refers to the uptake and retention of a chemical by an aquatic organism
from all surrounding media (e.g., water, food, sediment).” The term bioconcentration “refers to
the uptake and retention of a chemical by an aquatic organism from water only” (U.S. EPA,
2000b). The 2000 EPA guidance reflects the use of bioaccumulation factors (BAFs) to reflect the
uptake of a contaminant by fish from all sources rather than just from the water column reflected
by the use of bioconcentration factors (BCFs). For chemicals that are persistent and hydrophobic,
the magnitude of bioaccumulation by aquatic organisms may be substantially greater than the
Appendix A: Information on Bioaccumulation,
Fish Consumption by Children, and Species Consumed
Page A-2 Fish Consumption Rates
FINAL Technical Support Document, Version 2.0
magnitude of bioconcentration. The 2000 EPA Ambient Water Quality Methodology provides
important concepts regarding the bioaccumulation process as follows (U.S. EPA, 2000b, p. 5–2):
Another noteworthy aspect of bioaccumulation process is the issue of steady-state
conditions. Specifically, both bioaccumulation and bioconcentration can be viewed as the
results of competing rates of chemical uptake and depuration (chemical loss) by an
aquatic organism. The rates of chemical uptake and depuration can be affected by
various factors including the properties of the chemical, the physiology of the organism
in question, water quality and conditions, ecological characteristics of the water body
(e.g., food web structure), and the concentration and loadings history of the chemicals.
When the rates of chemical uptake and depuration are equal, tissue concentrations
remain constant over time and the distribution of the chemical between the organism and
its sources(s) is said to be at steady-state. For constant chemical exposures and other
conditions, the steady-state concentration in the organism represents the highest
accumulation potential of the chemical in that organism under those conditions. The time
required for a chemical to achieve steady state has been shown to vary according to the
properties of the chemical and other factors.
The EPA further notes that…“criteria for the protection of human health are typically designed
to protect humans from harmful lifetime or long-term exposures to waterborne contaminants, the
assessment of bioaccumulation that equals or approximates steady-state accumulation is one of
the principles underlying the derivation of national BAFs. For some chemicals that require
relatively long periods of time to reach steady-state in tissue of aquatic organisms, changes in
water column concentrations may occur on a much more rapid time scale compared to the
corresponding changes in tissue concentrations. Thus, if the system departs substantially from
steady-state conditions and water concentrations are not averaged over a sufficient time period,
the ratio of the tissue concentration to a water concentration may have little resemblance to the
steady-state ratio and have little predictive value of long-term bioaccumulation potential” (U.S.
EPA, 2000b).
There are several important factors that may affect a chemical’s bioavailability and influence its
bioaccumulation in fish. These factors include a wide range of physical, chemical, and biological
characteristics associated with the contaminants, sediments, and aquatic biota (U.S. EPA,
2000c).
Chemical bioavailability. Chemical bioavailability is a complex interplay between the physical-
chemical properties of the contaminant as well as the behavior and physiology of the aquatic
biota.
Physical factors of sediments affecting bioavailability and bioaccumulation. Sediments are
complex and dynamic environments with a wide range of interacting biological and chemical
processes that influence a chemical’s bioavailability and bioaccumulation into fish tissues.
Appendix A: Information on Bioaccumulation,
Fish Consumption by Children, and Species Consumed
Fish Consumption Rates Page A-3
Technical Support Document, Version 2.0 FINAL
Variable rates of mixing surficial sediment layers by physical processes of turbulence and
bioturbation compete with rates of sedimentation. In addition, resuspension of sediments may
also impact the bioavailability of sediment-associated contaminants by exposing filter feeders to
contaminated particulates or by increasing the aqueous concentration of a contaminant via
desorption from the particulates within the water column.
Chemical factors affecting bioavailability and bioaccumulation. The physical-chemical
characteristics of a contaminant (molecular size and polarity) may influence the degree of
association with particles and affect the chemical’s bioavailability. Many persistent and
bioaccumulative toxic chemicals (PBTs) are large, nonpolar compounds, with low water
solubilities and a strong tendency to be associated with dissolved and particulate organic matter.
Hydrophobic chemicals, those that are strongly lipophilic, are a critical factor in determining the
bioaccumulation behavior of organic chemicals in aquatic systems.
Biological factors affecting bioavailability and bioaccumulation. EPA notes that
bioaccumulation is a multi-factorial process that combines the chemical with the biological (U.S.
EPA, 2000c, p. X):
Bioaccumulation is a function of the bioavailability of contaminants in combination with
species-specific uptake and elimination processes. Toxicity is determined by the exposure
of an animal to bioavailable contaminants in concert with the animal’s sensitivity to the
contaminant. These processes have been shown to be a function of the organism’s lipid
content, size, growth rate, gender, diet, and ability to metabolize or transform a given
contaminant, as well as the chemical conditions of the surrounding medium. Other
biological factors that can affect a contaminant’s bioavailability include the burrowing
and feeding behavior of the individual organism or species. The depth to which an
organism burrows, the type of feeding mechanism it uses (e.g., filter feeding, particle
ingestion), the size range of sediment particles it consumes, and its diet all have a large
influence on the concentration of contaminant to which the organism will be exposed.
A.2 Children’s fish consumption rates
The Child-Specific Exposure Factors Handbook and the Highlights of the Child-Specific
Exposure Factors Handbook summarize children’s fish consumption rates for different age
groups. The mean and 95th
percentile consumer-only total fish (marine, estuarine, freshwater)
consumption rate for 16 to less than18 years of age for the general population is 2.1 grams per
kilogram per day (g/kg/day) (136 g/day) and 6.6 g/kg/day (357 g/day), respectively (U.S. EPA,
2008, 2009b). The mean and 95th
percentile consumer-only total fish (finfish and shellfish)
consumption rate for 3 to under 6 years old for the general population is 4.2 g/kg/day (78 g/day)
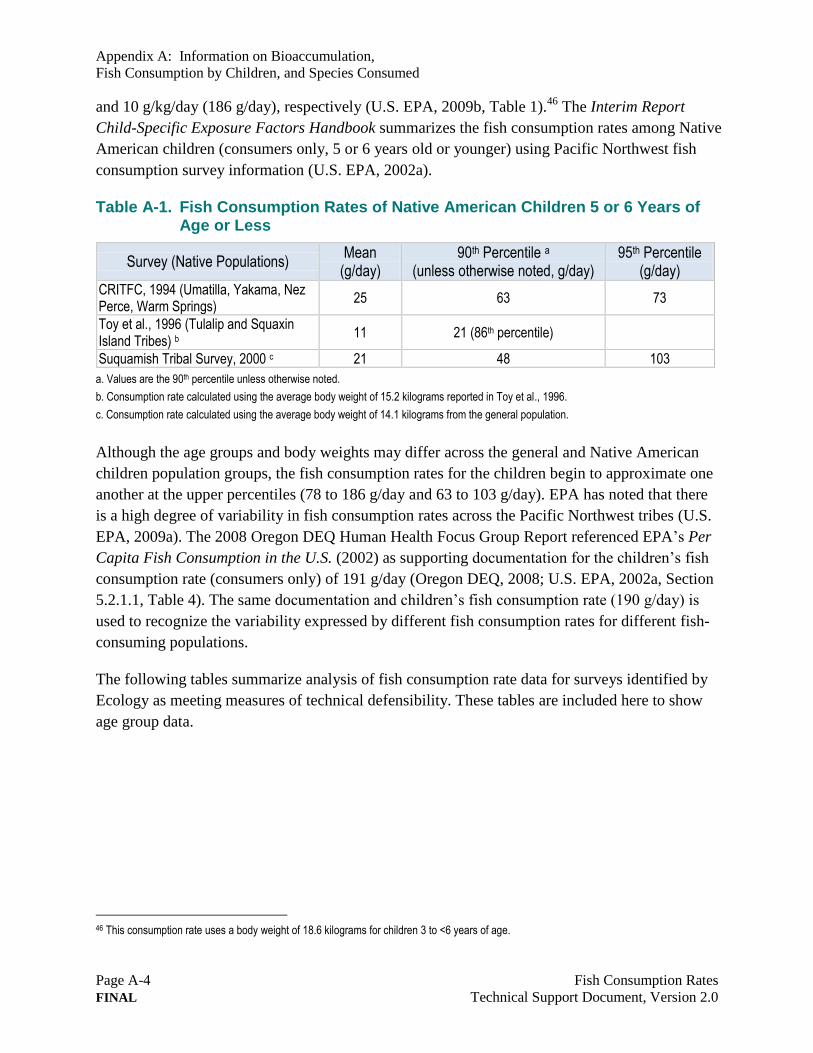
Appendix A: Information on Bioaccumulation,
Fish Consumption by Children, and Species Consumed
Page A-4 Fish Consumption Rates
FINAL Technical Support Document, Version 2.0
and 10 g/kg/day (186 g/day), respectively (U.S. EPA, 2009b, Table 1).46
The Interim Report
Child-Specific Exposure Factors Handbook summarizes the fish consumption rates among Native
American children (consumers only, 5 or 6 years old or younger) using Pacific Northwest fish
consumption survey information (U.S. EPA, 2002a).
Table A-1. Fish Consumption Rates of Native American Children 5 or 6 Years of Age or Less
Survey (Native Populations) Mean
(g/day) 90th Percentile a
(unless otherwise noted, g/day) 95th Percentile
(g/day) CRITFC, 1994 (Umatilla, Yakama, Nez Perce, Warm Springs)
25 63 73
Toy et al., 1996 (Tulalip and Squaxin Island Tribes) b
11 21 (86th percentile)
Suquamish Tribal Survey, 2000 c 21 48 103
a. Values are the 90th percentile unless otherwise noted.
b. Consumption rate calculated using the average body weight of 15.2 kilograms reported in Toy et al., 1996.
c. Consumption rate calculated using the average body weight of 14.1 kilograms from the general population.
Although the age groups and body weights may differ across the general and Native American
children population groups, the fish consumption rates for the children begin to approximate one
another at the upper percentiles (78 to 186 g/day and 63 to 103 g/day). EPA has noted that there
is a high degree of variability in fish consumption rates across the Pacific Northwest tribes (U.S.
EPA, 2009a). The 2008 Oregon DEQ Human Health Focus Group Report referenced EPA’s Per
Capita Fish Consumption in the U.S. (2002) as supporting documentation for the children’s fish
consumption rate (consumers only) of 191 g/day (Oregon DEQ, 2008; U.S. EPA, 2002a, Section
5.2.1.1, Table 4). The same documentation and children’s fish consumption rate (190 g/day) is
used to recognize the variability expressed by different fish consumption rates for different fish-
consuming populations.
The following tables summarize analysis of fish consumption rate data for surveys identified by
Ecology as meeting measures of technical defensibility. These tables are included here to show
age group data.
46 This consumption rate uses a body weight of 18.6 kilograms for children 3 to <6 years of age.
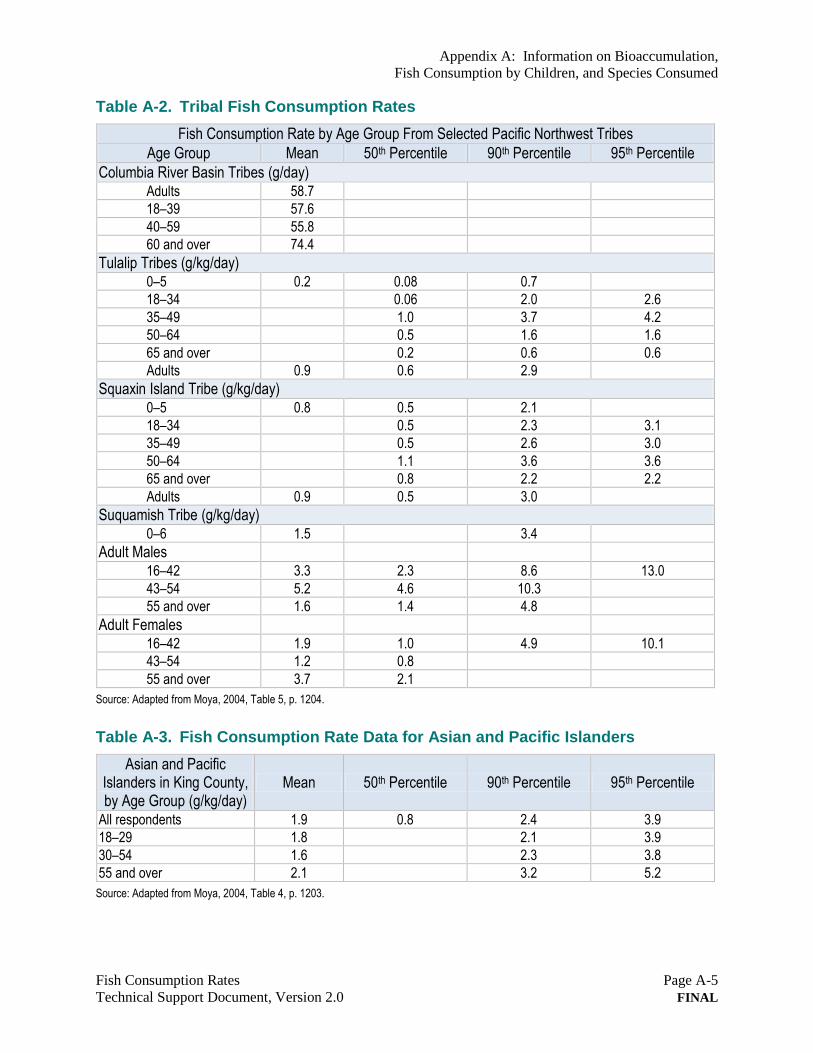
Appendix A: Information on Bioaccumulation,
Fish Consumption by Children, and Species Consumed
Fish Consumption Rates Page A-5
Technical Support Document, Version 2.0 FINAL
Table A-2. Tribal Fish Consumption Rates
Fish Consumption Rate by Age Group From Selected Pacific Northwest Tribes
Age Group Mean 50th Percentile 90th Percentile 95th Percentile
Columbia River Basin Tribes (g/day) Adults 58.7
18–39 57.6
40–59 55.8
60 and over 74.4
Tulalip Tribes (g/kg/day) 0–5 0.2 0.08 0.7
18–34 0.06 2.0 2.6
35–49 1.0 3.7 4.2
50–64 0.5 1.6 1.6
65 and over 0.2 0.6 0.6
Adults 0.9 0.6 2.9
Squaxin Island Tribe (g/kg/day) 0–5 0.8 0.5 2.1
18–34 0.5 2.3 3.1
35–49 0.5 2.6 3.0
50–64 1.1 3.6 3.6
65 and over 0.8 2.2 2.2
Adults 0.9 0.5 3.0
Suquamish Tribe (g/kg/day) 0–6 1.5 3.4
Adult Males 16–42 3.3 2.3 8.6 13.0
43–54 5.2 4.6 10.3
55 and over 1.6 1.4 4.8
Adult Females 16–42 1.9 1.0 4.9 10.1
43–54 1.2 0.8
55 and over 3.7 2.1
Source: Adapted from Moya, 2004, Table 5, p. 1204.
Table A-3. Fish Consumption Rate Data for Asian and Pacific Islanders
Asian and Pacific Islanders in King County, by Age Group (g/kg/day)
Mean 50th Percentile 90th Percentile 95th Percentile
All respondents 1.9 0.8 2.4 3.9
18–29 1.8 2.1 3.9
30–54 1.6 2.3 3.8
55 and over 2.1 3.2 5.2
Source: Adapted from Moya, 2004, Table 4, p. 1203.
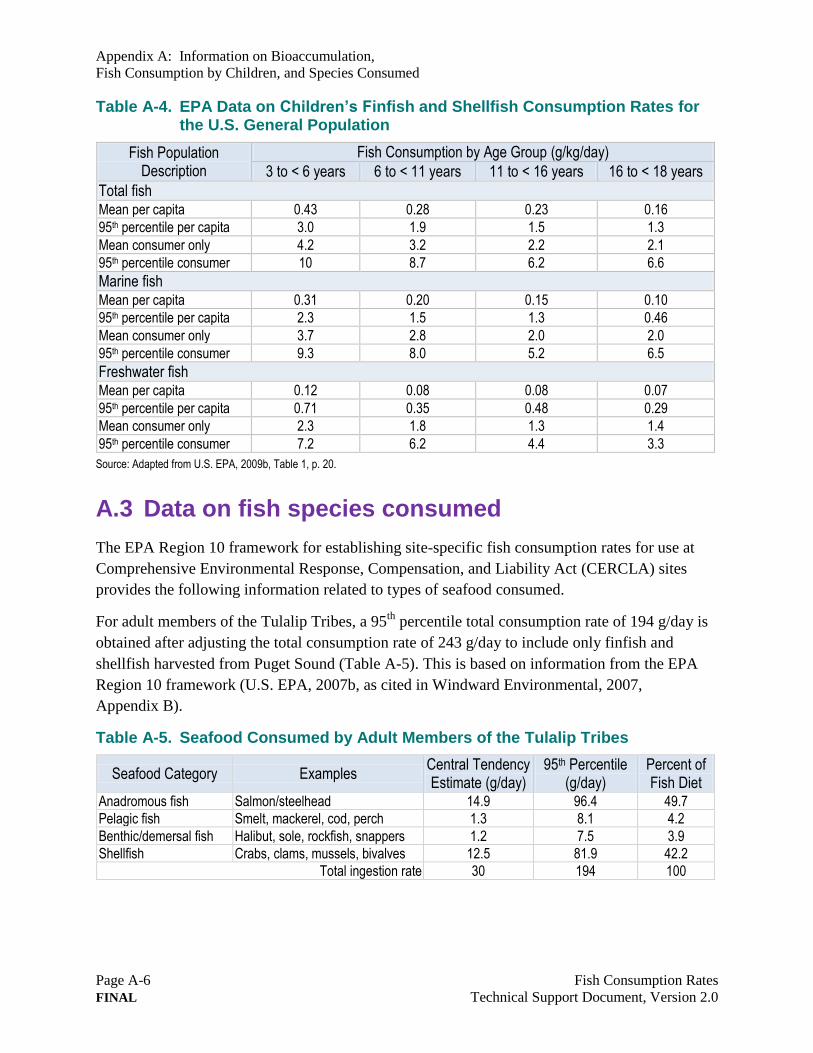
Appendix A: Information on Bioaccumulation,
Fish Consumption by Children, and Species Consumed
Page A-6 Fish Consumption Rates
FINAL Technical Support Document, Version 2.0
Table A-4. EPA Data on Children’s Finfish and Shellfish Consumption Rates for the U.S. General Population
Fish Population Description
Fish Consumption by Age Group (g/kg/day)
3 to < 6 years 6 to < 11 years 11 to < 16 years 16 to < 18 years
Total fish Mean per capita 0.43 0.28 0.23 0.16
95th percentile per capita 3.0 1.9 1.5 1.3
Mean consumer only 4.2 3.2 2.2 2.1
95th percentile consumer 10 8.7 6.2 6.6
Marine fish Mean per capita 0.31 0.20 0.15 0.10
95th percentile per capita 2.3 1.5 1.3 0.46
Mean consumer only 3.7 2.8 2.0 2.0
95th percentile consumer 9.3 8.0 5.2 6.5
Freshwater fish Mean per capita 0.12 0.08 0.08 0.07
95th percentile per capita 0.71 0.35 0.48 0.29
Mean consumer only 2.3 1.8 1.3 1.4
95th percentile consumer 7.2 6.2 4.4 3.3
Source: Adapted from U.S. EPA, 2009b, Table 1, p. 20.
A.3 Data on fish species consumed
The EPA Region 10 framework for establishing site-specific fish consumption rates for use at
Comprehensive Environmental Response, Compensation, and Liability Act (CERCLA) sites
provides the following information related to types of seafood consumed.
For adult members of the Tulalip Tribes, a 95th
percentile total consumption rate of 194 g/day is
obtained after adjusting the total consumption rate of 243 g/day to include only finfish and
shellfish harvested from Puget Sound (Table A-5). This is based on information from the EPA
Region 10 framework (U.S. EPA, 2007b, as cited in Windward Environmental, 2007,
Appendix B).
Table A-5. Seafood Consumed by Adult Members of the Tulalip Tribes
Seafood Category Examples Central Tendency Estimate (g/day)
95th Percentile (g/day)
Percent of Fish Diet
Anadromous fish Salmon/steelhead 14.9 96.4 49.7
Pelagic fish Smelt, mackerel, cod, perch 1.3 8.1 4.2
Benthic/demersal fish Halibut, sole, rockfish, snappers 1.2 7.5 3.9
Shellfish Crabs, clams, mussels, bivalves 12.5 81.9 42.2
Total ingestion rate 30 194 100
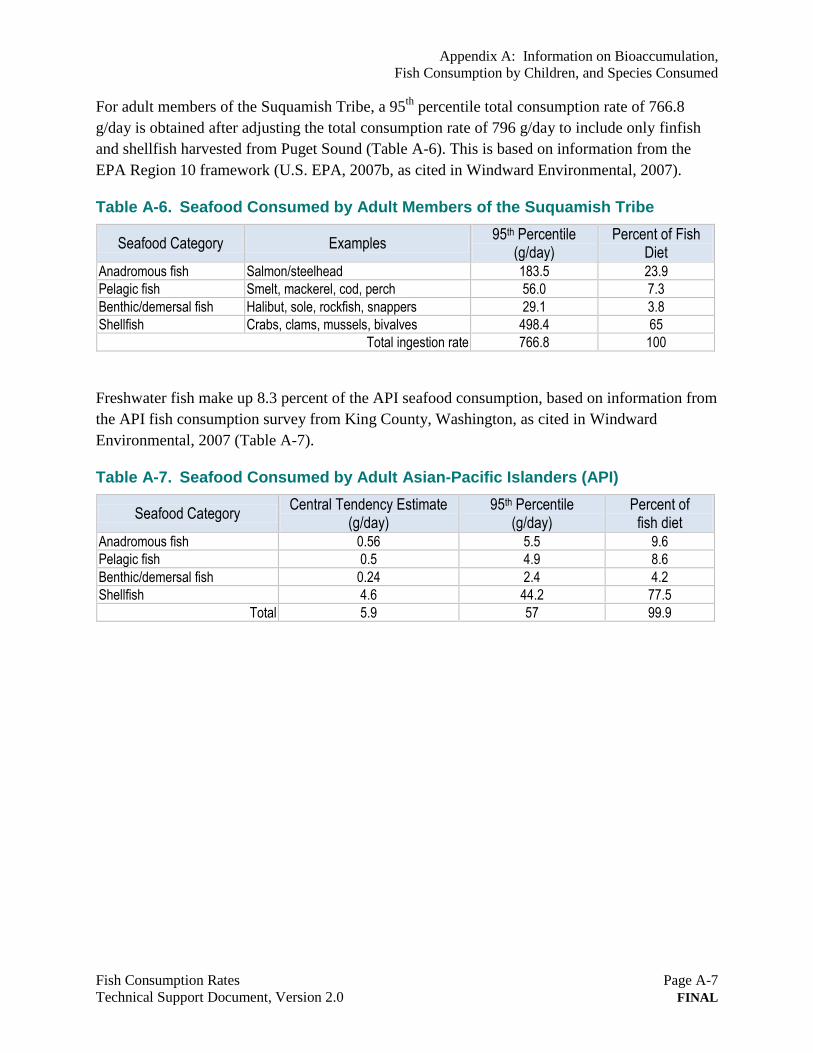
Appendix A: Information on Bioaccumulation,
Fish Consumption by Children, and Species Consumed
Fish Consumption Rates Page A-7
Technical Support Document, Version 2.0 FINAL
For adult members of the Suquamish Tribe, a 95th
percentile total consumption rate of 766.8
g/day is obtained after adjusting the total consumption rate of 796 g/day to include only finfish
and shellfish harvested from Puget Sound (Table A-6). This is based on information from the
EPA Region 10 framework (U.S. EPA, 2007b, as cited in Windward Environmental, 2007).
Table A-6. Seafood Consumed by Adult Members of the Suquamish Tribe
Seafood Category Examples 95th Percentile
(g/day) Percent of Fish
Diet Anadromous fish Salmon/steelhead 183.5 23.9
Pelagic fish Smelt, mackerel, cod, perch 56.0 7.3
Benthic/demersal fish Halibut, sole, rockfish, snappers 29.1 3.8
Shellfish Crabs, clams, mussels, bivalves 498.4 65
Total ingestion rate 766.8 100
Freshwater fish make up 8.3 percent of the API seafood consumption, based on information from
the API fish consumption survey from King County, Washington, as cited in Windward
Environmental, 2007 (Table A-7).
Table A-7. Seafood Consumed by Adult Asian-Pacific Islanders (API)
Seafood Category Central Tendency Estimate
(g/day) 95th Percentile
(g/day) Percent of
fish diet Anadromous fish 0.56 5.5 9.6
Pelagic fish 0.5 4.9 8.6
Benthic/demersal fish 0.24 2.4 4.2
Shellfish 4.6 44.2 77.5
Total 5.9 57 99.9
Appendix A: Information on Bioaccumulation,
Fish Consumption by Children, and Species Consumed
Page A-8 Fish Consumption Rates
FINAL Technical Support Document, Version 2.0
This page purposely left blank for duplicate printing.
Appendix B: Additional Fish Consumption Studies
Fish Consumption Rates Page B-1
Technical Support Document, Version 2.0 FINAL
Appendix B Additional Fish Consumption Studies
This appendix includes information on additional studies considered by Ecology:
1. Background information
2. Biometric studies of Japanese and Korean populations in Washington State
3. Additional studies evaluated:
a. Makah Tribe
b. Port Gamble S’Klallum Tribe
c. Muckleshoot Indian Tribes
d. Upper Columbia River Resources Survey – Confederated Tribes of the Colville
Reservation
e. Spokane River Surveys of Selected Ethnic Populations
f. Swinomish Tribal Study: Bioaccumulative Toxics in Subsistence-Harvested
Shellfish – Contaminant Results and Risk Assessment
4. Additional technical publications by Pacific Northwest tribal staff
B.1 Background information
Ecology identified a number of studies that provide information meeting measures of technical
defensibility and that are appropriate for consideration of statewide fish consumption rates. Other
studies are useful in providing multiple lines of evidence with respect to fish consumption. That is,
numerous other studies, designed for various purposes, provide additional information that may be
of value for particular evaluations or considerations. Although these studies may not have been
conducted to identify specifically fish consumption rates of the population of interest, they assist in
providing a robust picture of the importance of finfish and shellfish to the people of Washington.
The studies discussed in this appendix are comprehensive but not exhaustive. For example, from
July 2003 through December 2011, The Lands Council as part of the Spokane River Toxics
Outreach, completed approximately 5,300 surveys, distributed about 10,000 health advisories,
and participated in public education outreach of nearly 16,000 individuals in the Spokane area.
This public outreach is to educate and increase public awareness of the health risks of PCBs in
the Spokane River fish and heavy metal contamination in the Spokane River sediments. These
surveys have targeted Slavic (eastern European, Russian) and Hispanic populations because they
frequently harvest and consume fish from the Spokane River. Spokane River fish advisories
recommend only one fish meal per month of fish from the river’s middle section and avoid
Appendix B: Additional Fish Consumption Studies
Page B-2 Fish Consumption Rates
FINAL Technical Support Document, Version 2.0
eating any fish from the Spokane River’s upper stretches.47
As noted in Chapters 3 and 4 of this
Technical Support Document, these water body-specific surveys provide important information
to support health protective advisories for people who harvest and consume fish from specific
water bodies. All water body-specific fish dietary surveys, usually some form of a creel survey,
are not detailed in this Technical Support Document. For a more detailed review of all of the
water body-specific surveys and fish advisory information, the reader is referred to the
Washington Department of Health’s website on fish advisories.48
The fish consumption related
information provided in this appendix is important and credible information used to evaluate and
assess the potential health risks from eating contaminated fish (seafood). The additional fish
dietary information provided in Table 33 and this appendix provide multiple lines of evidence, as
a weight of evidence approach, that people in Washington State harvest and consume large
amounts of fish. The estimates of fish consumption detailed in Chapter 4 are based on fish
dietary information based on survey methodology that allows for the projection of fish
consumption estimates over a long period of time with descriptive statistics for percentile
estimates. This type of information is important to help support health protective decisions to
clean up contaminated sediments.
B.2 Biometric studies of Japanese and Korean populations in Washington State
Several studies have been conducted in Washington State to evaluate the fish consumption of
Japanese and Korean populations (Tsuchiya et al., 2008a, 2008b, 2009; Cleland et al., 2009).
These studies were conducted as part of the Arsenic Mercury Intake Biometric Study in
collaboration with the University of Washington’s Institute for Risk Analysis and Risk
Communication and the Washington State Department of Health. The studies were designed to
evaluate mercury exposure within the Japanese and Korean communities and arsenic exposures
within the Korean community of Washington State. Japanese and Korean populations in
Washington State consume fish at higher rates than the national average (Sechena et al., 1999).
These high fish-consuming populations may be exposed to mercury and arsenic from the
consumption of finfish and shellfish.
The fish consumption survey was based on surveys previously conducted for several other
Pacific Northwest fish-consuming populations (tribal surveys and Sechena et al., 1999). The
food frequency questionnaire was a validated dietary tool used and developed by the Fred
Hutchinson Cancer Research Center and was self administered by the participants of this study.
As part of the fish dietary survey, participants were provided a pictorial fish booklet, printed in
three languages, containing pictures with names of various fish species commonly consumed by
47 Spokane River Toxics Outreach, web location: http://www.landscouncil.org/water/river_toxics.asp?template=false
48 Washington State Department of Health Fish Advisory Information: http://www.doh.wa.gov/CommunityandEnvironment/Food/Fish.aspx
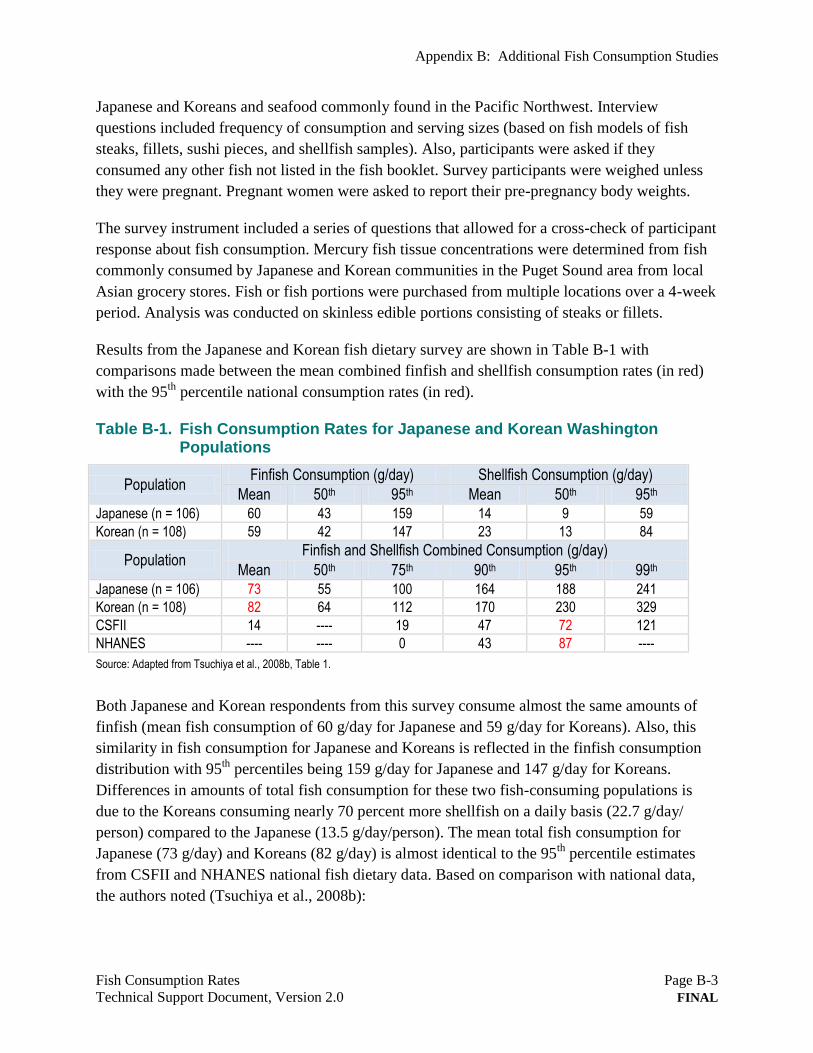
Appendix B: Additional Fish Consumption Studies
Fish Consumption Rates Page B-3
Technical Support Document, Version 2.0 FINAL
Japanese and Koreans and seafood commonly found in the Pacific Northwest. Interview
questions included frequency of consumption and serving sizes (based on fish models of fish
steaks, fillets, sushi pieces, and shellfish samples). Also, participants were asked if they
consumed any other fish not listed in the fish booklet. Survey participants were weighed unless
they were pregnant. Pregnant women were asked to report their pre-pregnancy body weights.
The survey instrument included a series of questions that allowed for a cross-check of participant
response about fish consumption. Mercury fish tissue concentrations were determined from fish
commonly consumed by Japanese and Korean communities in the Puget Sound area from local
Asian grocery stores. Fish or fish portions were purchased from multiple locations over a 4-week
period. Analysis was conducted on skinless edible portions consisting of steaks or fillets.
Results from the Japanese and Korean fish dietary survey are shown in Table B-1 with
comparisons made between the mean combined finfish and shellfish consumption rates (in red)
with the 95th
percentile national consumption rates (in red).
Table B-1. Fish Consumption Rates for Japanese and Korean Washington Populations
Population Finfish Consumption (g/day) Shellfish Consumption (g/day)
Mean 50th 95th Mean 50th 95th Japanese (n = 106) 60 43 159 14 9 59
Korean (n = 108) 59 42 147 23 13 84
Population Finfish and Shellfish Combined Consumption (g/day)
Mean 50th 75th 90th 95th 99th Japanese (n = 106) 73 55 100 164 188 241
Korean (n = 108) 82 64 112 170 230 329
CSFII 14 ---- 19 47 72 121
NHANES ---- ---- 0 43 87 ----
Source: Adapted from Tsuchiya et al., 2008b, Table 1.
Both Japanese and Korean respondents from this survey consume almost the same amounts of
finfish (mean fish consumption of 60 g/day for Japanese and 59 g/day for Koreans). Also, this
similarity in fish consumption for Japanese and Koreans is reflected in the finfish consumption
distribution with 95th
percentiles being 159 g/day for Japanese and 147 g/day for Koreans.
Differences in amounts of total fish consumption for these two fish-consuming populations is
due to the Koreans consuming nearly 70 percent more shellfish on a daily basis (22.7 g/day/
person) compared to the Japanese (13.5 g/day/person). The mean total fish consumption for
Japanese (73 g/day) and Koreans (82 g/day) is almost identical to the 95th
percentile estimates
from CSFII and NHANES national fish dietary data. Based on comparison with national data,
the authors noted (Tsuchiya et al., 2008b):
Appendix B: Additional Fish Consumption Studies
Page B-4 Fish Consumption Rates
FINAL Technical Support Document, Version 2.0
The Koreans and Japanese women consume fish in quantities that exceed the national
average. Mean values for the average values for the Japanese and Korean cohorts are
significantly higher (73 and 82 g/day, respectively). Values of significance within the
NHANES and CSFII distributions are the 95th
percentile values (87 and 72 g/d,
respectively) because the remaining 5% represent many persons. The average
consumption values for the Koreans and Japanese approach or exceed these 95th
percentile values, indicating that these 2 populations may be contained within the
remaining 5th
percentile of the NHANES and CSFII distributions. On the basis of the
percentile values for the consumption distributions from CSFII and NHANES, the 2
populations investigated by us have central estimate shifts in consumption, leading to
distribution patterns displaced to the right and further down the abscissa. Specifically, all
the percentile consumption rates representing the national fish consumer were below
those determined for the Japanese and Koreans.
Mean fish consumption estimates for Japanese and Korean women respondents for each of the
clinic visits are provided in the table below. Additional details regarding the finfish species
consumed and differences in rates from one clinic visit to another are provided in the Technical
Issue Paper, Health Benefits and Risks of Consuming Fish and Shellfish (Ecology, 2012).
B.3 Additional studies evaluated
Makah Tribe
The Makah Indian reservation is located on the northwestern tip of the Olympia Peninsula in
Washington State. The Makah Tribal usual and accustomed areas for harvesting finfish and
shellfish extends east to the Elwha River, south to a geographic point between Ozette and the
Quileute reservation, and north to the Canadian international border and the Swiftsure Bank. The
geographic position of the Makah Indian reservation provides access to diverse terrestrial,
freshwater, and marine resources to support subsistence practices.
An examination of the Makah subsistence practices was conducted by the University of
Washington, Department of Anthropology, between 1997 and 1999. Jennifer Sepez’s 2001
dissertation documents and evaluates the subsistence hunting, fishing, and shellfishing practices
of the Makah Indian Tribe. For the purposes of this research, subsistence was defined as “the
local harvest of natural resources for local consumption” (Sepez, 2001, p. 9). A random
ethnographic survey sample of 15 percent of reservation households provided information on the
contemporary subsistence harvests, uses, and consumption of finfish, shellfish, land mammals,
marine mammals, and birds. Results indicate that 99 percent of the reservation households
participate in some type of subsistence activities. 71 percent of the households engaged in
harvesting resources, while 94 percent received resources harvested by another household. This
comprehensive examination of Makah Tribal subsistence practices included hunting for deer,
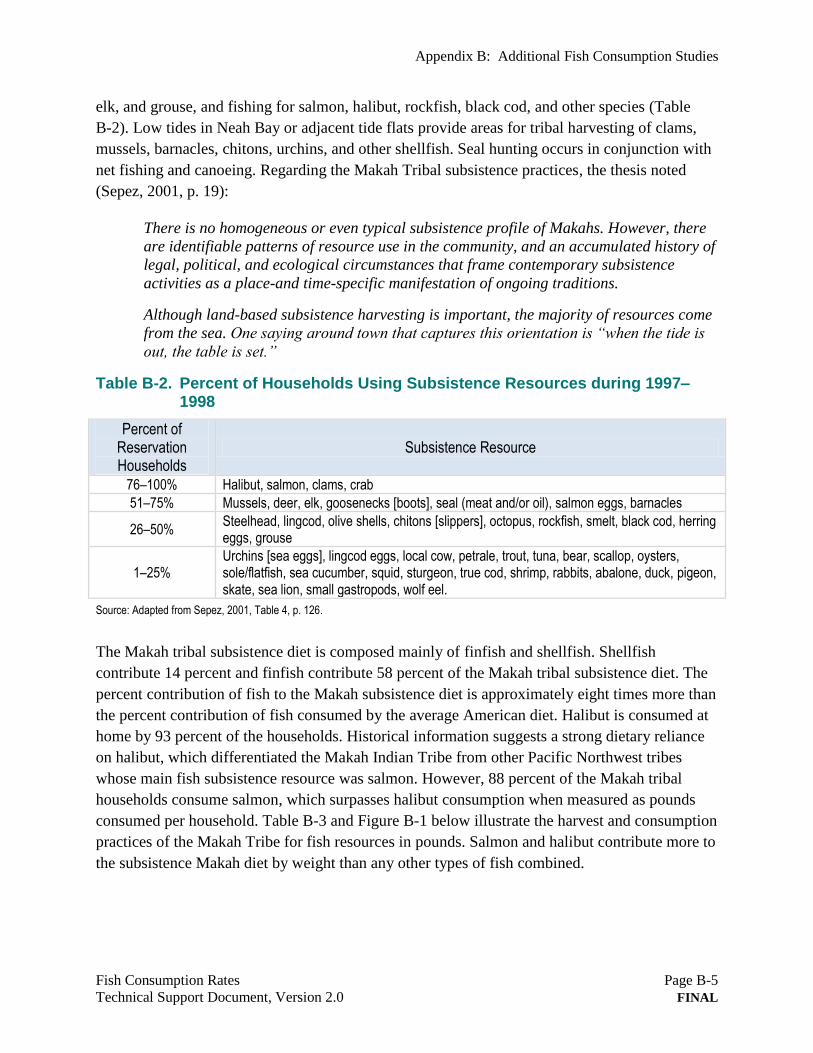
Appendix B: Additional Fish Consumption Studies
Fish Consumption Rates Page B-5
Technical Support Document, Version 2.0 FINAL
elk, and grouse, and fishing for salmon, halibut, rockfish, black cod, and other species (Table
B-2). Low tides in Neah Bay or adjacent tide flats provide areas for tribal harvesting of clams,
mussels, barnacles, chitons, urchins, and other shellfish. Seal hunting occurs in conjunction with
net fishing and canoeing. Regarding the Makah Tribal subsistence practices, the thesis noted
(Sepez, 2001, p. 19):
There is no homogeneous or even typical subsistence profile of Makahs. However, there
are identifiable patterns of resource use in the community, and an accumulated history of
legal, political, and ecological circumstances that frame contemporary subsistence
activities as a place-and time-specific manifestation of ongoing traditions.
Although land-based subsistence harvesting is important, the majority of resources come
from the sea. One saying around town that captures this orientation is “when the tide is
out, the table is set.”
Table B-2. Percent of Households Using Subsistence Resources during 1997–1998
Percent of Reservation Households
Subsistence Resource
76–100% Halibut, salmon, clams, crab
51–75% Mussels, deer, elk, goosenecks [boots], seal (meat and/or oil), salmon eggs, barnacles
26–50% Steelhead, lingcod, olive shells, chitons [slippers], octopus, rockfish, smelt, black cod, herring eggs, grouse
1–25% Urchins [sea eggs], lingcod eggs, local cow, petrale, trout, tuna, bear, scallop, oysters, sole/flatfish, sea cucumber, squid, sturgeon, true cod, shrimp, rabbits, abalone, duck, pigeon, skate, sea lion, small gastropods, wolf eel.
Source: Adapted from Sepez, 2001, Table 4, p. 126.
The Makah tribal subsistence diet is composed mainly of finfish and shellfish. Shellfish
contribute 14 percent and finfish contribute 58 percent of the Makah tribal subsistence diet. The
percent contribution of fish to the Makah subsistence diet is approximately eight times more than
the percent contribution of fish consumed by the average American diet. Halibut is consumed at
home by 93 percent of the households. Historical information suggests a strong dietary reliance
on halibut, which differentiated the Makah Indian Tribe from other Pacific Northwest tribes
whose main fish subsistence resource was salmon. However, 88 percent of the Makah tribal
households consume salmon, which surpasses halibut consumption when measured as pounds
consumed per household. Table B-3 and Figure B-1 below illustrate the harvest and consumption
practices of the Makah Tribe for fish resources in pounds. Salmon and halibut contribute more to
the subsistence Makah diet by weight than any other types of fish combined.
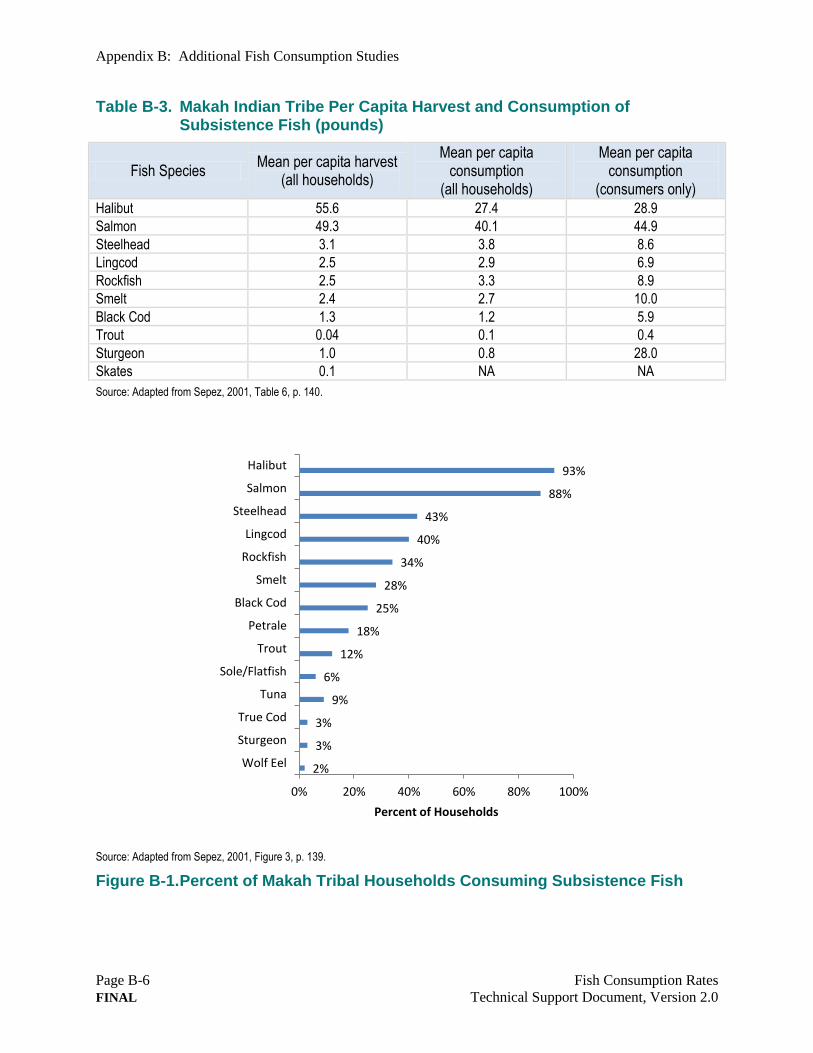
Appendix B: Additional Fish Consumption Studies
Page B-6 Fish Consumption Rates
FINAL Technical Support Document, Version 2.0
Table B-3. Makah Indian Tribe Per Capita Harvest and Consumption of Subsistence Fish (pounds)
Fish Species Mean per capita harvest
(all households)
Mean per capita consumption
(all households)
Mean per capita consumption
(consumers only) Halibut 55.6 27.4 28.9
Salmon 49.3 40.1 44.9
Steelhead 3.1 3.8 8.6
Lingcod 2.5 2.9 6.9
Rockfish 2.5 3.3 8.9
Smelt 2.4 2.7 10.0
Black Cod 1.3 1.2 5.9
Trout 0.04 0.1 0.4
Sturgeon 1.0 0.8 28.0
Skates 0.1 NA NA
Source: Adapted from Sepez, 2001, Table 6, p. 140.
Source: Adapted from Sepez, 2001, Figure 3, p. 139.
Figure B-1. Percent of Makah Tribal Households Consuming Subsistence Fish
2%
3%
3%
9%
6%
12%
18%
25%
28%
34%
40%
43%
88%
93%
0% 20% 40% 60% 80% 100%
Wolf Eel
Sturgeon
True Cod
Tuna
Sole/Flatfish
Trout
Petrale
Black Cod
Smelt
Rockfish
Lingcod
Steelhead
Salmon
Halibut
Percent of Households
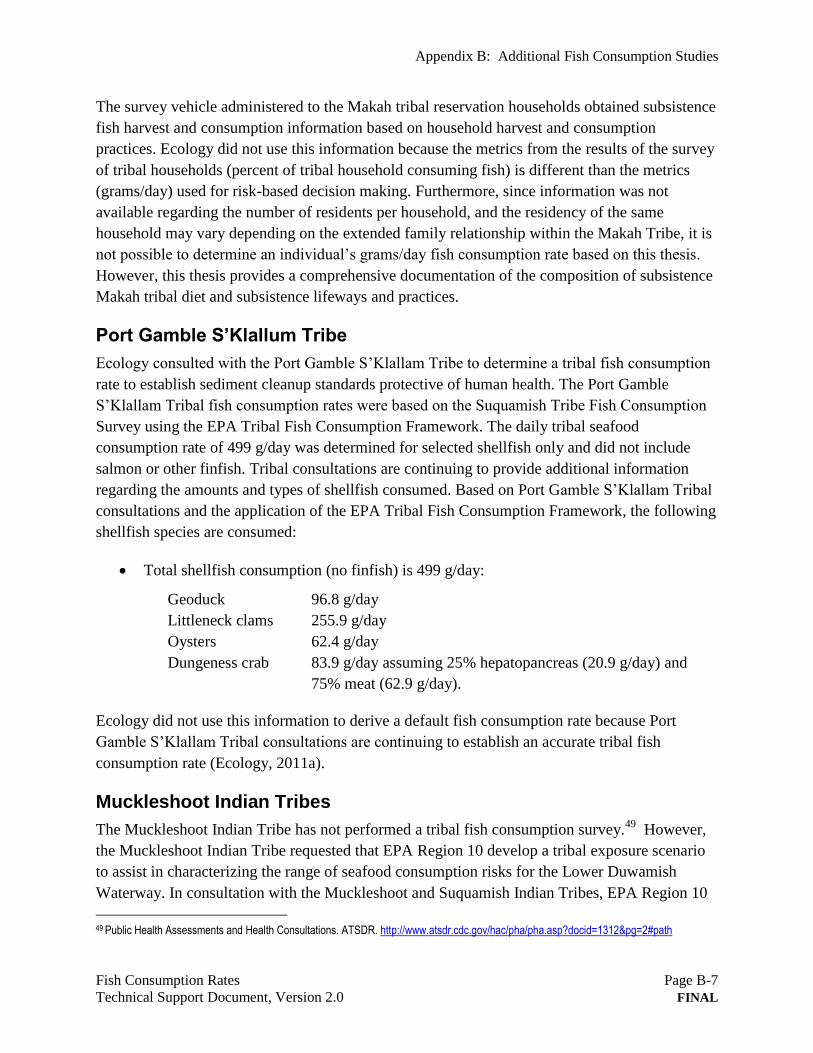
Appendix B: Additional Fish Consumption Studies
Fish Consumption Rates Page B-7
Technical Support Document, Version 2.0 FINAL
The survey vehicle administered to the Makah tribal reservation households obtained subsistence
fish harvest and consumption information based on household harvest and consumption
practices. Ecology did not use this information because the metrics from the results of the survey
of tribal households (percent of tribal household consuming fish) is different than the metrics
(grams/day) used for risk-based decision making. Furthermore, since information was not
available regarding the number of residents per household, and the residency of the same
household may vary depending on the extended family relationship within the Makah Tribe, it is
not possible to determine an individual’s grams/day fish consumption rate based on this thesis.
However, this thesis provides a comprehensive documentation of the composition of subsistence
Makah tribal diet and subsistence lifeways and practices.
Port Gamble S’Klallum Tribe
Ecology consulted with the Port Gamble S’Klallam Tribe to determine a tribal fish consumption
rate to establish sediment cleanup standards protective of human health. The Port Gamble
S’Klallam Tribal fish consumption rates were based on the Suquamish Tribe Fish Consumption
Survey using the EPA Tribal Fish Consumption Framework. The daily tribal seafood
consumption rate of 499 g/day was determined for selected shellfish only and did not include
salmon or other finfish. Tribal consultations are continuing to provide additional information
regarding the amounts and types of shellfish consumed. Based on Port Gamble S’Klallam Tribal
consultations and the application of the EPA Tribal Fish Consumption Framework, the following
shellfish species are consumed:
Total shellfish consumption (no finfish) is 499 g/day:
Geoduck 96.8 g/day
Littleneck clams 255.9 g/day
Oysters 62.4 g/day
Dungeness crab 83.9 g/day assuming 25% hepatopancreas (20.9 g/day) and
75% meat (62.9 g/day).
Ecology did not use this information to derive a default fish consumption rate because Port
Gamble S’Klallam Tribal consultations are continuing to establish an accurate tribal fish
consumption rate (Ecology, 2011a).
Muckleshoot Indian Tribes
The Muckleshoot Indian Tribe has not performed a tribal fish consumption survey.49
However,
the Muckleshoot Indian Tribe requested that EPA Region 10 develop a tribal exposure scenario
to assist in characterizing the range of seafood consumption risks for the Lower Duwamish
Waterway. In consultation with the Muckleshoot and Suquamish Indian Tribes, EPA Region 10
49 Public Health Assessments and Health Consultations. ATSDR. http://www.atsdr.cdc.gov/hac/pha/pha.asp?docid=1312&pg=2#path
Appendix B: Additional Fish Consumption Studies
Page B-8 Fish Consumption Rates
FINAL Technical Support Document, Version 2.0
and Ecology used EPA guidance to develop a tribal exposure scenario and derive fish
consumption rates based on the Suquamish and Tulalip seafood consumption data. Using the
EPA Region 10 guidance framework tribal exposure scenarios were developed for the Lower
Duwamish Waterway for tribal adults consuming anadromous and pelagic finfish,
benthic/demersal finfish, and shellfish. The Lower Duwamish Waterway Remedial Investigation
Report provides a range of tribal consumption rates specific for the risk management decisions
for the Lower Duwamish Waterway (Windward Environmental, 2007). The Lower Duwamish
Waterway fish consumption rates are not applicable for Washington State high fish-consuming
populations. Hence, the Lower Duwamish Waterway fish consumption rates were not used to
derive a default MTCA fish consumption rate to establish surface water cleanup standards.
Upper Columbia River Resources Survey–Confederated Tribes of the Colville Reservation
Background information
The Confederated Tribes of the Colville Reservation and the EPA, Region 10 and Headquarters,
collaborated on the Upper Columbia River Resources Survey (Confederated Tribes of the Colville
Reservation and U.S. EPA, 2012). The upper Columbia River and Lake Roosevelt areas have
been affected by contaminants from Teck Cominco lead-zinc smelter operations for over 100
years. Residents of the Colville Reservation, located 50 miles downstream from Teck Cominco
mine, may have been exposed to these contaminants and have collaborated with the EPA to assess
and measure exposure pathways from the consumption of natural resources (including fish) that
may be contaminated from the Teck Cominco operations. This information will be used by the
EPA to conduct a human health risk assessment for the Upper Columbia River and Colville
reservation residents. The resource use survey was conducted to support efforts to evaluate and
assess the human health risks from exposures to contaminants from the Teck Cominco lead-zinc
smelter located just north of the U.S. Canadian border.
Survey methodology
The Upper Columbia River Resources Survey is composed of two survey vehicles designed to
investigate the food consumed and non-food uses harvested from local resources by residents of
the Colville Reservation located in eastern Washington State. The Food Questionnaire was
administered by trained personnel to Colville Reservation residents regarding the consumption
over the preceding 12-month period of several types of food groups: fish, birds, wild animals,
farm animals, dairy products, fruits, vegetables, and wild plants. The Food Questionnaire survey
method was a 24-hour dietary recall and included a previous 12-month food frequency recall and
non-food use recall associated with resident uses of the reservation’s natural resources. Out of a
pool of 5,893 people, 1,139 people over the age of 2 responded to the Food Questionnaire—
approximately 20 percent of the total resident population. A demographic weighting was applied
to each respondent to account for the variance in response rate for residence location and age.
The percentages and numbers of consumers provided in the Food Questionnaire data report will
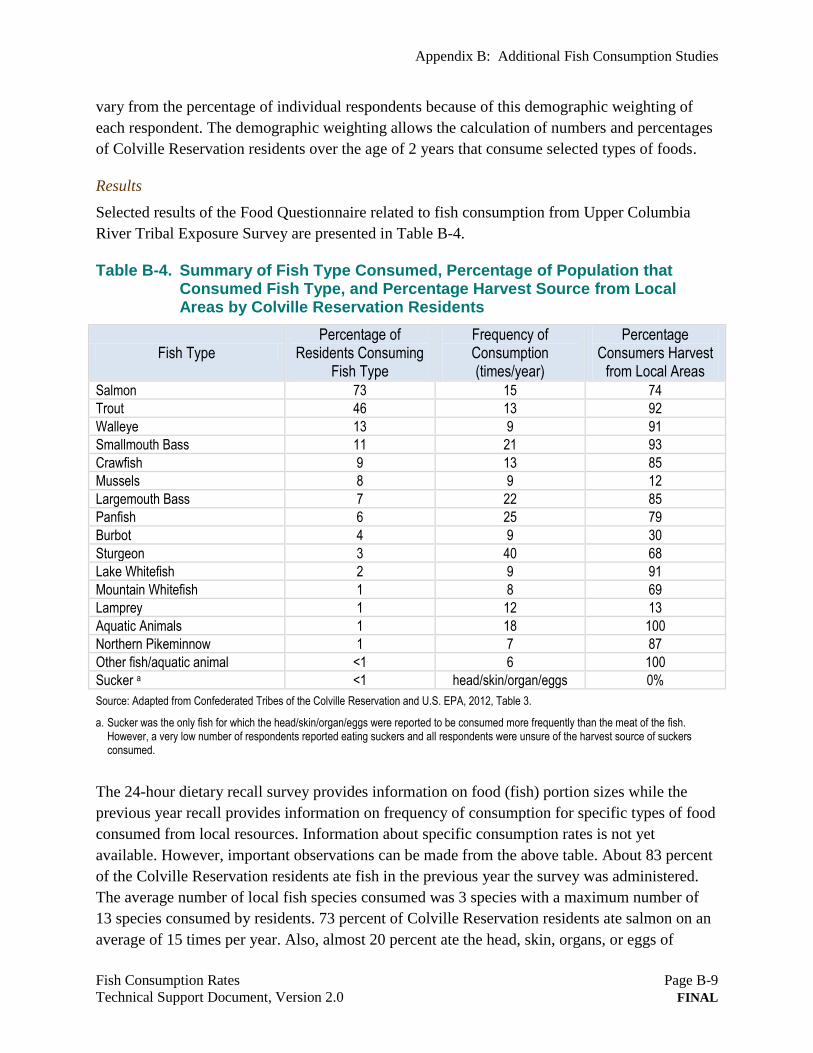
Appendix B: Additional Fish Consumption Studies
Fish Consumption Rates Page B-9
Technical Support Document, Version 2.0 FINAL
vary from the percentage of individual respondents because of this demographic weighting of
each respondent. The demographic weighting allows the calculation of numbers and percentages
of Colville Reservation residents over the age of 2 years that consume selected types of foods.
Results
Selected results of the Food Questionnaire related to fish consumption from Upper Columbia
River Tribal Exposure Survey are presented in Table B-4.
Table B-4. Summary of Fish Type Consumed, Percentage of Population that Consumed Fish Type, and Percentage Harvest Source from Local Areas by Colville Reservation Residents
Fish Type Percentage of
Residents Consuming Fish Type
Frequency of Consumption (times/year)
Percentage Consumers Harvest
from Local Areas Salmon 73 15 74
Trout 46 13 92
Walleye 13 9 91
Smallmouth Bass 11 21 93
Crawfish 9 13 85
Mussels 8 9 12
Largemouth Bass 7 22 85
Panfish 6 25 79
Burbot 4 9 30
Sturgeon 3 40 68
Lake Whitefish 2 9 91
Mountain Whitefish 1 8 69
Lamprey 1 12 13
Aquatic Animals 1 18 100
Northern Pikeminnow 1 7 87
Other fish/aquatic animal <1 6 100
Sucker a <1 head/skin/organ/eggs 0%
Source: Adapted from Confederated Tribes of the Colville Reservation and U.S. EPA, 2012, Table 3.
a. Sucker was the only fish for which the head/skin/organ/eggs were reported to be consumed more frequently than the meat of the fish. However, a very low number of respondents reported eating suckers and all respondents were unsure of the harvest source of suckers consumed.
The 24-hour dietary recall survey provides information on food (fish) portion sizes while the
previous year recall provides information on frequency of consumption for specific types of food
consumed from local resources. Information about specific consumption rates is not yet
available. However, important observations can be made from the above table. About 83 percent
of the Colville Reservation residents ate fish in the previous year the survey was administered.
The average number of local fish species consumed was 3 species with a maximum number of
13 species consumed by residents. 73 percent of Colville Reservation residents ate salmon on an
average of 15 times per year. Also, almost 20 percent ate the head, skin, organs, or eggs of
Appendix B: Additional Fish Consumption Studies
Page B-10 Fish Consumption Rates
FINAL Technical Support Document, Version 2.0
salmon. 61 percent of the respondents noted that all of their salmon was harvested from on or
near the Colville Reservation and another 12 percent harvested part of their salmon catch locally.
Freshwater mussels and crawfish are also harvested and consumed by Colville Reservation
residents. 8 percent of the Colville Reservation residents ate mussels sometime during the previous
year of the administered survey and 9 percent ate crawfish. 13 percent of the mussels were
harvested all or partly locally. 81 percent of the crawfish were harvested entirely from local areas.
Many Colville Reservation respondents noted that they do not eat as much local fish as they
would prefer because of concerns about smelter contaminants. Suppression of resources and
reduced fish consumption remains an important concern by tribal populations. Tribal fish
consumption and corresponding rates are artificially reduced due to concerns about contaminants
and their associated effects.
Spokane River Surveys of Selected Ethnic Populations
Numerous and different types of surveys have been conducted for the Spokane River by the
collaborative efforts of Spokane Regional Health District, Assessment/Epidemiology Center,
Washington State’s Department of Health, and the Lands Council – Center for Justice. From July
2003 through December 2011, The Lands Council – Center for Justice as part of the Spokane
River Toxics Outreach, completed approximately 5,300 surveys, distributed about 10,000 health
advisories, and participated in public education outreach of nearly 16, 000 individuals in the
Spokane area.50
Surveys have focused on ethnic populations that may be exposed to legacy
contaminants from mining operations (arsenic, lead, cadmium) and PCBs by harvesting and
consuming fish from the Spokane River. Two types of surveys are briefly reviewed: (1) 1998
Fish Consumption Survey, Spokane River, Washington (Spokane Regional Health District,
1998), and (2) Lands Council – Center for Justice risk communication and public outreach
survey (Robinson Research, 2007), which was directed to specific ethnic communities that
harvest and consume fish from the Spokane River.
1998 Fish Consumption Survey, Spokane River
A 1998 Fish Consumption Survey was conducted by the Spokane Regional Health District,
Assessment/Epidemiology Center to evaluate how people access the Spokane River for
harvesting fish and to assess the fish consumption habits of Russian, Hmong, and Laotian
populations. The objectives of the survey were to: (1) identify different types of fish caught from
the Spokane River, (2) identify locations where fish are harvested, (3) identify populations who
consume fish from the Spokane River, and (4) identify amounts of fish consumed and meal
preparation methods. A mail survey questionnaire sampled two fish-consuming populations
based on a random sample of Spokane County fishing license holders (2000 sample population)
50 Spokane River Toxics Outreach, web location: http://www.landscouncil.org/water/river_toxics.asp?template=false
Appendix B: Additional Fish Consumption Studies
Fish Consumption Rates Page B-11
Technical Support Document, Version 2.0 FINAL
and individuals from a particular Spokane area fishing club (180 sample population from The
Walleye Club). Russian and Laotian community representatives were hired by the Spokane
Regional Health District to convene a focus group, serve as interpreters, translate the written
survey, and coordinate the survey distribution within Russian and Laotian communities. Key
findings for each of the two ethnic communities surveyed are provided below.
Key Russian Community Findings:
Harvest locations: Upriver Dam, the old Walk in the Wild Zoo, River Front Park,
downtown Spokane area, T.J Meenach Bridge, Nine Mile Bridge, and Long Lake.
Fish harvested: rainbow trout, German (brown) trout, suckers, catfish, crayfish, pike
minnow, smallmouth bass, and perch.
Fish consumption: about 4 pounds per month (about 65 g/day or 2.3 ounces of fish per
day).
Key Laotian Community Findings:
Harvest locations: Nine Mile Bridge where the little Spokane and Spokane River meet.
Fish harvested: catfish, rainbow trout, perch, bass, walleye, and crawdads.
Fish consumption: two to three meals of Spokane River fish per month ( assuming a fish
meal equals an 8-ounce serving, then two to three fish meals per month is about 16 to 24
g/day or less than 1 ounce of fish per day).
2007 Spokane River Toxins Survey
Lands Council – Center for Justice conducted a telephone survey for adults living in Spokane,
Lincoln, and Stevens Counties who live close to the Spokane River. The purpose of the survey
was to evaluate public attitudes and perceptions regarding pollution in the Spokane River. A total
of 600 telephone interviews were completed from December 2006 to January 2007 with 67
percent conducted in Spokane County, 17 percent in Lincoln County, and 17 percent in Stevens
County. This telephone survey is part of a broader public outreach and education effort by the
Lands Council directed to low-income families, indigenous people, and recent immigrant
populations (Hmong, Vietnamese, Slavic, and Hispanic populations). Selection of these
populations was based on previous work conducted by the Spokane Regional Health District, and
State Departments of Health and Ecology, and suggests these ethnic populations may be at
potential health risks from exposure to contaminants in fish harvested from the Spokane River.
There are a significant number of people catching and/or eating fish from the Spokane River. For
those eating fish, few are taking precautionary measures in preparation of the fish. Results of the
Lands Council – Center for Justice provides insights into public outreach and education
challenges:
Appendix B: Additional Fish Consumption Studies
Page B-12 Fish Consumption Rates
FINAL Technical Support Document, Version 2.0
19 percent of respondents fish in the Spokane River.
12 percent catch and eat fish. Over half eat two or more fish in months they are regularly
fishing.
Of those who said they eat fish from the Spokane River in a typical year, nearly two-
thirds (65%) took no precautions in how they prepared the fish for cooking.
The majority of fishing that includes eating what is caught takes place below Long Lake
Dam (80%), where there are no fish advisories regarding consumption.
Some fish consumption not in accordance with the Washington Department of Health
fish advisory is occurring between Lake Spokane and the Idaho Border.
The harvest locations from the Spokane River are as follows:
80 percent below Long Lake Dam.
10 percent from Spokane Falls to Long Lake Dam.
4 percent from Upriver Dam to Spokane Falls.
3 percent from the Idaho State Line to Upriver Dam.
3 percent reported as Don’t Know/Refused.
The Laotian anglers were not evaluated for this survey since fewer than five surveys were
returned from the 17 mailed surveys to the Laotian community.
Sampling and analysis reports that evaluated for metals and PCBs in the Spokane River,
combined with findings from focus groups, established the questionnaire framework for the
development of questions concerning fish harvest location and types of fish harvested. A mail
survey questionnaire sampled two fish-consuming populations based on a random sample of
Spokane County fishing license holders (2000 sample population) and individuals from a
particular Spokane are fishing club (180 sample population from The Walleye Club). The mail
survey questionnaire included an introductory letter asking participants to complete the survey if
they harvest and consume fish from the Spokane River. A $50 gift certificate was included as an
incentive to participate when the survey was completed and returned. There was about a 31
percent response rate to this mail survey.
Swinomish Tribal Study: Bioaccumulative Toxics in Subsistence-Harvested Shellfish – Contaminant Results and Risk Assessment
The Swinomish Indian tribal community is a federally recognized Indian tribe; the Swinomish
Indian reservation is located on interior Puget Sound, Skagit County, Washington. The
Swinomish Tribal Indian Community is a maritime fishing community with strong cultural and
dietary dependence on fish and, particularly, shellfish. Shellfish are an abundant resource
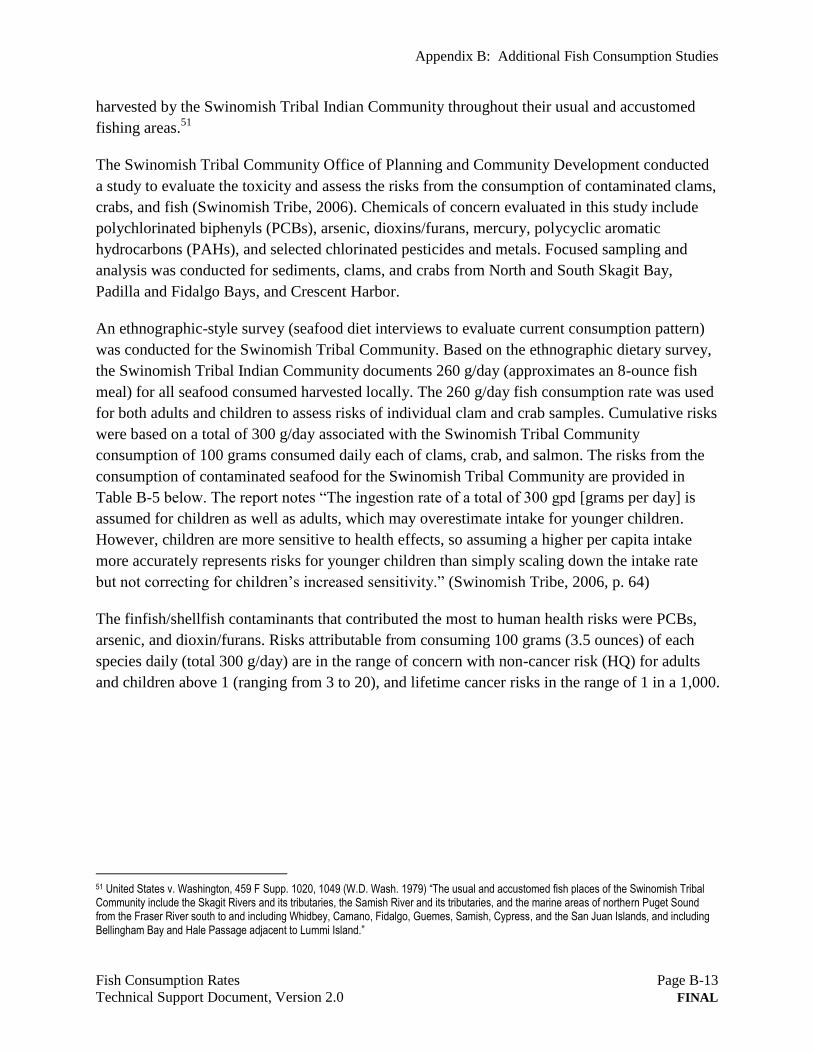
Appendix B: Additional Fish Consumption Studies
Fish Consumption Rates Page B-13
Technical Support Document, Version 2.0 FINAL
harvested by the Swinomish Tribal Indian Community throughout their usual and accustomed
fishing areas.51
The Swinomish Tribal Community Office of Planning and Community Development conducted
a study to evaluate the toxicity and assess the risks from the consumption of contaminated clams,
crabs, and fish (Swinomish Tribe, 2006). Chemicals of concern evaluated in this study include
polychlorinated biphenyls (PCBs), arsenic, dioxins/furans, mercury, polycyclic aromatic
hydrocarbons (PAHs), and selected chlorinated pesticides and metals. Focused sampling and
analysis was conducted for sediments, clams, and crabs from North and South Skagit Bay,
Padilla and Fidalgo Bays, and Crescent Harbor.
An ethnographic-style survey (seafood diet interviews to evaluate current consumption pattern)
was conducted for the Swinomish Tribal Community. Based on the ethnographic dietary survey,
the Swinomish Tribal Indian Community documents 260 g/day (approximates an 8-ounce fish
meal) for all seafood consumed harvested locally. The 260 g/day fish consumption rate was used
for both adults and children to assess risks of individual clam and crab samples. Cumulative risks
were based on a total of 300 g/day associated with the Swinomish Tribal Community
consumption of 100 grams consumed daily each of clams, crab, and salmon. The risks from the
consumption of contaminated seafood for the Swinomish Tribal Community are provided in
Table B-5 below. The report notes “The ingestion rate of a total of 300 gpd [grams per day] is
assumed for children as well as adults, which may overestimate intake for younger children.
However, children are more sensitive to health effects, so assuming a higher per capita intake
more accurately represents risks for younger children than simply scaling down the intake rate
but not correcting for children’s increased sensitivity.” (Swinomish Tribe, 2006, p. 64)
The finfish/shellfish contaminants that contributed the most to human health risks were PCBs,
arsenic, and dioxin/furans. Risks attributable from consuming 100 grams (3.5 ounces) of each
species daily (total 300 g/day) are in the range of concern with non-cancer risk (HQ) for adults
and children above 1 (ranging from 3 to 20), and lifetime cancer risks in the range of 1 in a 1,000.
51 United States v. Washington, 459 F Supp. 1020, 1049 (W.D. Wash. 1979) “The usual and accustomed fish places of the Swinomish Tribal Community include the Skagit Rivers and its tributaries, the Samish River and its tributaries, and the marine areas of northern Puget Sound from the Fraser River south to and including Whidbey, Camano, Fidalgo, Guemes, Samish, Cypress, and the San Juan Islands, and including Bellingham Bay and Hale Passage adjacent to Lummi Island.”
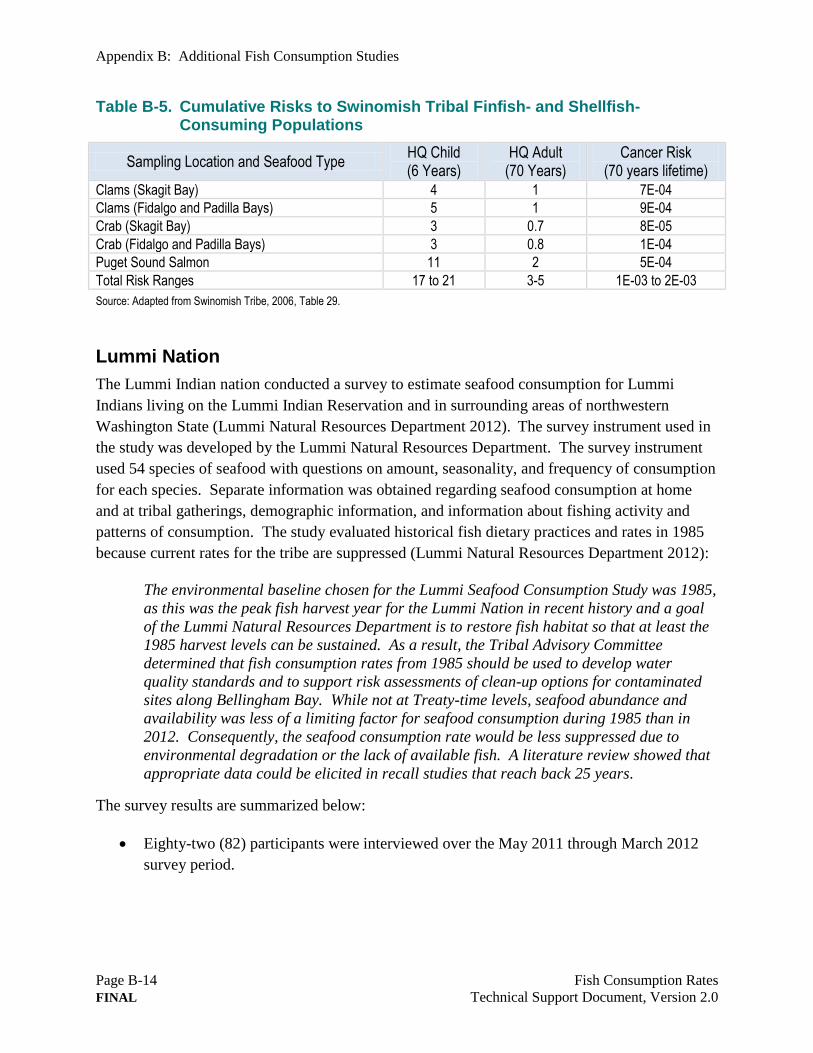
Appendix B: Additional Fish Consumption Studies
Page B-14 Fish Consumption Rates
FINAL Technical Support Document, Version 2.0
Table B-5. Cumulative Risks to Swinomish Tribal Finfish- and Shellfish-Consuming Populations
Sampling Location and Seafood Type HQ Child (6 Years)
HQ Adult (70 Years)
Cancer Risk (70 years lifetime)
Clams (Skagit Bay) 4 1 7E-04
Clams (Fidalgo and Padilla Bays) 5 1 9E-04
Crab (Skagit Bay) 3 0.7 8E-05
Crab (Fidalgo and Padilla Bays) 3 0.8 1E-04
Puget Sound Salmon 11 2 5E-04
Total Risk Ranges 17 to 21 3-5 1E-03 to 2E-03
Source: Adapted from Swinomish Tribe, 2006, Table 29.
Lummi Nation
The Lummi Indian nation conducted a survey to estimate seafood consumption for Lummi
Indians living on the Lummi Indian Reservation and in surrounding areas of northwestern
Washington State (Lummi Natural Resources Department 2012). The survey instrument used in
the study was developed by the Lummi Natural Resources Department. The survey instrument
used 54 species of seafood with questions on amount, seasonality, and frequency of consumption
for each species. Separate information was obtained regarding seafood consumption at home
and at tribal gatherings, demographic information, and information about fishing activity and
patterns of consumption. The study evaluated historical fish dietary practices and rates in 1985
because current rates for the tribe are suppressed (Lummi Natural Resources Department 2012):
The environmental baseline chosen for the Lummi Seafood Consumption Study was 1985,
as this was the peak fish harvest year for the Lummi Nation in recent history and a goal
of the Lummi Natural Resources Department is to restore fish habitat so that at least the
1985 harvest levels can be sustained. As a result, the Tribal Advisory Committee
determined that fish consumption rates from 1985 should be used to develop water
quality standards and to support risk assessments of clean-up options for contaminated
sites along Bellingham Bay. While not at Treaty-time levels, seafood abundance and
availability was less of a limiting factor for seafood consumption during 1985 than in
2012. Consequently, the seafood consumption rate would be less suppressed due to
environmental degradation or the lack of available fish. A literature review showed that
appropriate data could be elicited in recall studies that reach back 25 years.
The survey results are summarized below:
Eighty-two (82) participants were interviewed over the May 2011 through March 2012
survey period.
Appendix B: Additional Fish Consumption Studies
Fish Consumption Rates Page B-15
Technical Support Document, Version 2.0 FINAL
Outliers were removed before the final calculation, which reduced the overall sample size
used to compute the daily seafood consumption rate to 73 respondents. Outliers were
defined by the Tribal Advisory Committee as respondents who reported consumption
rates above the 90th percentile of the daily seafood consumption rate of all respondents.
The resultant average Lummi seafood consumption rate was calculated to be 4.73 grams
per kilogram per day (g/kg/day) or approximately 383 grams per day (g/day) (0.84
pounds per day [lb/day] or 13.5 ounces per day [oz/day]) for all seafood consumed.
The median seafood consumption rate was calculated to be 3.82 g/kg/day or
approximately 314 g/day (069 lb/day or 11 oz/day).
The 90th percentile seafood consumption rate was calculated to be 10.03 g/kg/day or
approximately 800 g/day (1.76 lb/day or 28.2 oz/day).
The 95th percentile seafood consumption rate was calculated to be 11.28 g/kg/day or
approximately 918 g/day (2.02 lb/day or 32.4 oz/day).
The final precision of the survey was ± 16.5%.
B.4 Additional technical publications by Pacific Northwest tribal staff
A Native American exposure scenario
This paper (Harris and Harper, 1997) documents a tribal-based subsistence exposure scenario for
a variety of different foods and exposure parameters for use at the Hanford nuclear reservation
cleanup. A subsistence fish consumption of 540 g/day is based on selected tribal interview from
members of the Confederated Tribes of the Umatilla Indian Reservation and other published
studies.
Lifestyles, diets, and Native American exposure factors related to possible lead exposures and toxicity
This article (Harris and Harper, 2001) documents that any assessment of the risk from lead
exposure to tribal communities requires an understanding of the tribal community, resource base,
and culture. Differences in patterns of exposure between different communities or groups of
people are noted with documented additional sources of lead exposure for Native Americans.
A possible approach for setting a mercury risk-based action level based on tribal fish ingestion rates
Risks from the consumption of mercury-contaminated fish were evaluated with a recommended
action level for mercury protective of Native American tribes in the Columbia River Basin at 0.1
ppm or less (Harper and Harris, 2008). The recommendation is based on the combined risks from
Appendix B: Additional Fish Consumption Studies
Page B-16 Fish Consumption Rates
FINAL Technical Support Document, Version 2.0
mercury exposure plus other fish contaminants and exposures, the higher fish consumption rates
associated with tribal populations, the existing cultural deficit due to loss of salmon, the health
benefits from fish, and the cultural and economic importance of fish to tribal populations. To
assess the risks from the consumption of mercury-contaminated fish, Harper and Harris (2008)
defined the following fish consumption rates:
Less than 100 g/day is the low tribal fish ingestion rate.
100 to 454 (1 pound per day) g/day is the moderate tribal fish ingestion rate.
Above 454 g/day is the true tribal subsistence rate.
Non-cancer and cancer risk to tribal populations from the consumption of mercury-contaminated
fish was documented and within a risk range of concern.
Issues in evaluating fish consumption rates for Native American tribes
As a continuation and further refinement of the ethnographic survey conducted for the
Swinomish Indian tribal community study, Bioaccumulative Toxics in Subsistence-Harvested
Shellfish – Contaminant Results and Risk Assessment, Donatuto and Harper (2008) provide a
Swinomish seafood dietary interview template as an alternative to conventional fish dietary
surveys to estimate contemporary consumption. For traditional subsistence tribal fishers, a
multidisciplinary method to reconstruct tribal heritage dietary practices and patterns is
recommended. Donatuto and Harper identified several problems associated with conventional
fish dietary surveys that are insensitive to cultural tribal practices and may lead to tribal
misunderstanding about current fish dietary level and underestimate tribal consumption.
Appendix C: The Question of Salmon
Fish Consumption Rates Page C-1
Technical Support Document, Version 2.0 FINAL
Appendix C The Question of Salmon
Salmon—showcase of the policy dilemma
The question of whether or how to include salmon in a fish consumption rate highlights the
policy choices facing a regulatory agency. Multiple regulations—in this case MTCA and
CWA—provide differing approaches to account for anadromous fish, with MTCA providing
greater flexibility for site-specific modifications to regulatory standards.
Salmonids employ a complex life strategy. Most – but not all – adult salmon spend a portion of
their lives outside of Washington waters. The inclusion of Pacific salmon in fish consumption
rates is complicated by the question of where and to what extent salmon assume site-specific
contaminants that contribute to their body burdens.
Scientific knowledge related to the biology of the life history for the multiple salmon species has
increased considerably with efforts to restore salmon in Puget Sound and throughout
Washington. This once abundant resource has been reduced, and wild stocks of some species are
endangered. Dams are being removed to restore once great salmon runs, and culvert work by
necessity now involves salmon friendly design considerations. Effects of riparian zones,
temperature, even predators like seals are studied. Understanding has increased of the differing
strategies of fall and spring runs from Chinook, chum, coho, sockeye, and pink salmon, and
whether they migrate through estuaries or directly from streams to the ocean. The recycling of
contaminants means that when uptake occurs in the open ocean those chemicals are deposited by
the dying salmon in their natal streams. In the face of this growing and sophisticated body of
knowledge the classification of salmon as a marine species lacks subtlety and leads to regulatory
dilemma.
For example, Ecology’s Toxics Cleanup Program will consider several factors related to risk
management when deciding how to address the question of salmon. Some of these factors are
discussed in this appendix:
The abundance of salmon.
Salmon life cycles.
Chemical contaminants in ambient waters and sediments.
The unique quality of Puget Sound and other Washington waters.
Considerations of the complex life cycle and survival strategies of anadromous fish species like
salmonids complicate and influence many risk management decisions. For example, risk
Appendix C: The Question of Salmon
Page C-2 Fish Consumption Rates
FINAL Technical Support Document, Version 2.0
management cleanup decisions in Port Angeles Harbor and the Lower Duwamish Waterway are
influenced by the presence/absences of salmonids in the harbor or waterway, migratory patterns,
and contaminant body burdens attributable to site contaminants (Ecology, 2011b; Windward
Environmental, 2007). The complication arises because it is difficult to attribute salmon
contaminant body burdens to site-specific contaminants.
This appendix describes the life cycle and survival strategies of salmonids. This information is
related to policy and technical considerations regarding how to appropriately address the
question of salmon when developing fish consumption rates for regulatory purposes.
C.1 Background
Salmon is consumed in abundance. On a global scale, over the last two decades, advances in
farmed-salmon production have tripled the world’s supply of salmon. In 1985, 6 percent of all
salmon consumed around the world was farmed. In 1988, farmed salmon production surpassed
wild fisheries. In 2000, 58 percent of all salmon consumed around the world was farmed, almost
a tenfold increase from 1985 levels. In the United States, between 1987 and 1999, salmon
consumption increased nine times (Institute for Health and the Environment). During that time
period, salmon consumption increased annually at a rate of 14 percent in the European Union
and 23 percent in the United States (Hites et al., 2004).
Over half the salmon sold globally is farm-raised in Northern Europe, Chile, Canada, and the
United States. The annual global production of farmed salmon (Atlantic salmon, Salmo salar)
has increased from approximately 24,000 to over 1 million metric tons during the past two
decades (Institute for Health and the Environment; Charron, 2004, as cited in Hites et al., 2004).
Contaminant body burdens in farm-raised salmon have been well documented and compared to
wild salmon. European farm-raised salmon have significantly greater organochlorine (dioxin,
dioxin-like PCBs, and selected pesticides) contaminant body burdens than those salmon raised in
North and South America (Hites et al., 2004).
C.2 Factors influencing the health risk from consuming salmon
There are multiple factors to consider when assessing the risk from consuming salmon. Most
Washington salmon spend the largest part of their lives in the open ocean, where exposure to
contaminants originating from Washington sources is minimal. Salmon life cycles are complex,
and the many species have different survival strategies.
Ecology recognizes that salmon are an available Washington State resource for harvest and
consumption. It is appropriate to consider:
Appendix C: The Question of Salmon
Fish Consumption Rates Page C-3
Technical Support Document, Version 2.0 FINAL
Washington State estimates of recreational and commercial salmon harvests.
Estimates of Washington State fish-consuming populations.
Cultural and religious significance of salmon to different Native American fish-
consuming populations in Washington State.
The complexity of the salmon life cycle and survival strategies, local and global salmon
contaminant body burdens, and Puget Sound resident and nonresident salmon
populations.
Federal and state regulatory policies and procedures.
Ecology notes that similarities between bioaccumulative and persistent contaminant
(organochlorines) salmon body burdens from local and global distributions would preclude the
ability to define a chemical fingerprint to attribute salmon body burdens to site-specific
bioaccumulative and persistent contaminants
C.3 Information about salmon consumption in Washington
To determine how to appropriately address salmon when developing one or more default fish
consumption rates, Ecology examined the regional fish dietary survey information regarding
salmon-related consumption. These surveys show that salmon is consumed frequently and in
large amounts.
Based on Pacific Northwest regional-specific fish dietary surveys, salmon and selected types of
shellfish are the most frequently consumed and consumed in the largest amounts of all seafood.
Salmon is the most frequently consumed finfish (more than 90 percent) for all adult respondents
from all of the regional-specific fish dietary surveys. (This observation follows the national trend
where U.S. salmon consumption grew from 9.5 percent to 15 percent from 1996 to 2005 as a
share [percentage] of finfish and shellfish consumption.52
)
For the API populations surveyed, 96 percent of the survey respondents consume anadromous
fish comprising greater than 10 percent of all seafood consumed (Sechena et al., 2003, Tables 2
and 5). Also, 99 percent of the survey participants consume shellfish comprising more than 45
percent of all seafood consumed. The API survey participants consume a large variety of finfish
and shellfish.
52 Fish and Shellfish Consumption data from National Marine Fisheries Service, Salmon Consumption data from National Fisheries Institute. Web location: http://www.fas.usda.gov/ffpd/Newsroom/Salmon.pdf, as cited in USDA, 2006.
Appendix C: The Question of Salmon
Page C-4 Fish Consumption Rates
FINAL Technical Support Document, Version 2.0
For the Tulalip Tribes and the Squaxin Island Tribe, 72 to 80 percent of anadromous fish
consumed and 62 to 72 percent of shellfish consumed were harvested in the Puget Sound area
(Toy et al., 1996). When fish harvests are accounted for outside of the Puget Sound area, greater
than 90 percent of the seafood harvested was anadromous. Of both the Tulalip Tribes and the
Squaxin Island Tribe surveyed, greater than 90 percent of the survey respondents consume
anadromous fish, which comprises almost 50 percent of all seafood consumed. The Tulalip
dataset was adjusted for the harvest and consumption of finfish and shellfish from Puget Sound
in the EPA Region 10 framework. With the adjusted rates used in the EPA Region 10
framework, salmon and shellfish comprise about 50 percent each of the Tulalip tribal seafood
diet, with salmon consumed in slightly greater amounts than shellfish. Hence, if the total fish
ingestion rate did not account for salmon consumption, then the fish consumption rate would be
reduced by about 50 percent, from 194 g/day to 97.6 g/day (U.S. EPA, 2007b, Appendix B-1,
Table B-1).
The Suquamish fish dietary survey identified the largest variety, most frequently consumed, and
consumed in the largest amounts of finfish and shellfish for all of the Pacific Northwest tribal
fish-consuming populations surveyed (The Suquamish Tribe, 2000). Fifty percent or more of the
respondents consumed various types of anadromous fish and about 10 different types of
shellfish. The Suquamish dataset was adjusted for the harvest and consumption of finfish and
shellfish from Puget Sound in the EPA Region 10 framework. With the adjusted rates used in the
EPA Region 10 framework, salmon and shellfish comprise about 25 percent and 65 percent,
respectively, of the Suquamish tribal seafood diet. Hence, if the total fish ingestion rate did not
account for salmon consumption, then the fish consumption rate would be reduced by about 25
percent, from 766.8 g/day to about 583 g/day (U.S. EPA, 2007b, Appendix B-2, Table B-2).
The fish dietary survey for the Columbia River tribal populations identified a variety of fish
harvested and consumed in large amounts (CRITFC, 1994). However, this survey did not include
any questions regarding shellfish consumption. Salmon is consumed by the largest number of
adult respondents (92 percent), followed by trout (70 percent), lamprey (54 percent), and smelt
(52 percent). Using the weighted mean fish consumption rate for adult fish consuming CRITFC
tribal populations, salmon would contribute about 50 percent of the tribal seafood diet (≈25/63
g/day). Hence, if the total fish ingestion rate did not account for salmon consumption, then the
fish consumption rate would be reduced by more than about 50 percent, from a weighted mean
of 63 to about 40 g/day.
C.4 Pacific salmon life cycle and survival strategies
Salmonids have complex life cycles and survival strategies, with large variations across and
among different species (Quinn, 2005). The geographic distribution of Pacific salmonids extends
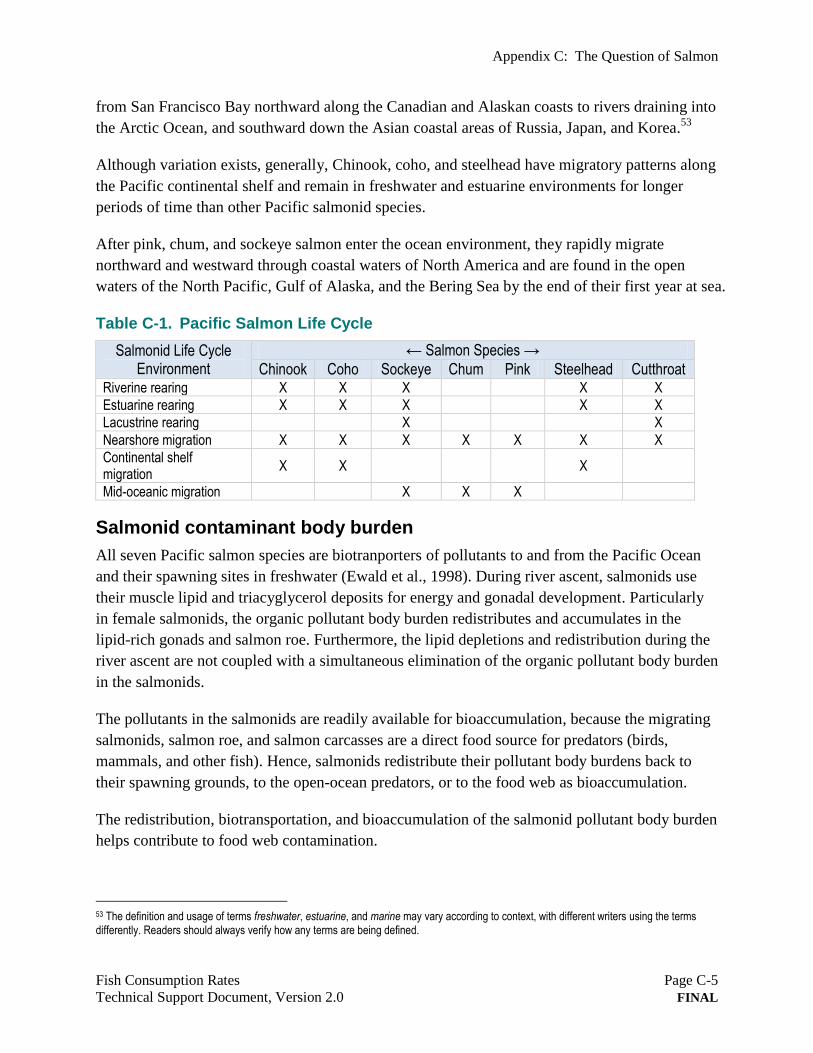
Appendix C: The Question of Salmon
Fish Consumption Rates Page C-5
Technical Support Document, Version 2.0 FINAL
from San Francisco Bay northward along the Canadian and Alaskan coasts to rivers draining into
the Arctic Ocean, and southward down the Asian coastal areas of Russia, Japan, and Korea.53
Although variation exists, generally, Chinook, coho, and steelhead have migratory patterns along
the Pacific continental shelf and remain in freshwater and estuarine environments for longer
periods of time than other Pacific salmonid species.
After pink, chum, and sockeye salmon enter the ocean environment, they rapidly migrate
northward and westward through coastal waters of North America and are found in the open
waters of the North Pacific, Gulf of Alaska, and the Bering Sea by the end of their first year at sea.
Table C-1. Pacific Salmon Life Cycle
Salmonid Life Cycle Environment
← Salmon Species →
Chinook Coho Sockeye Chum Pink Steelhead Cutthroat Riverine rearing X X X X X
Estuarine rearing X X X X X
Lacustrine rearing X X
Nearshore migration X X X X X X X
Continental shelf migration
X X X
Mid-oceanic migration X X X
Salmonid contaminant body burden
All seven Pacific salmon species are biotranporters of pollutants to and from the Pacific Ocean
and their spawning sites in freshwater (Ewald et al., 1998). During river ascent, salmonids use
their muscle lipid and triacyglycerol deposits for energy and gonadal development. Particularly
in female salmonids, the organic pollutant body burden redistributes and accumulates in the
lipid-rich gonads and salmon roe. Furthermore, the lipid depletions and redistribution during the
river ascent are not coupled with a simultaneous elimination of the organic pollutant body burden
in the salmonids.
The pollutants in the salmonids are readily available for bioaccumulation, because the migrating
salmonids, salmon roe, and salmon carcasses are a direct food source for predators (birds,
mammals, and other fish). Hence, salmonids redistribute their pollutant body burdens back to
their spawning grounds, to the open-ocean predators, or to the food web as bioaccumulation.
The redistribution, biotransportation, and bioaccumulation of the salmonid pollutant body burden
helps contribute to food web contamination.
53 The definition and usage of terms freshwater, estuarine, and marine may vary according to context, with different writers using the terms differently. Readers should always verify how any terms are being defined.
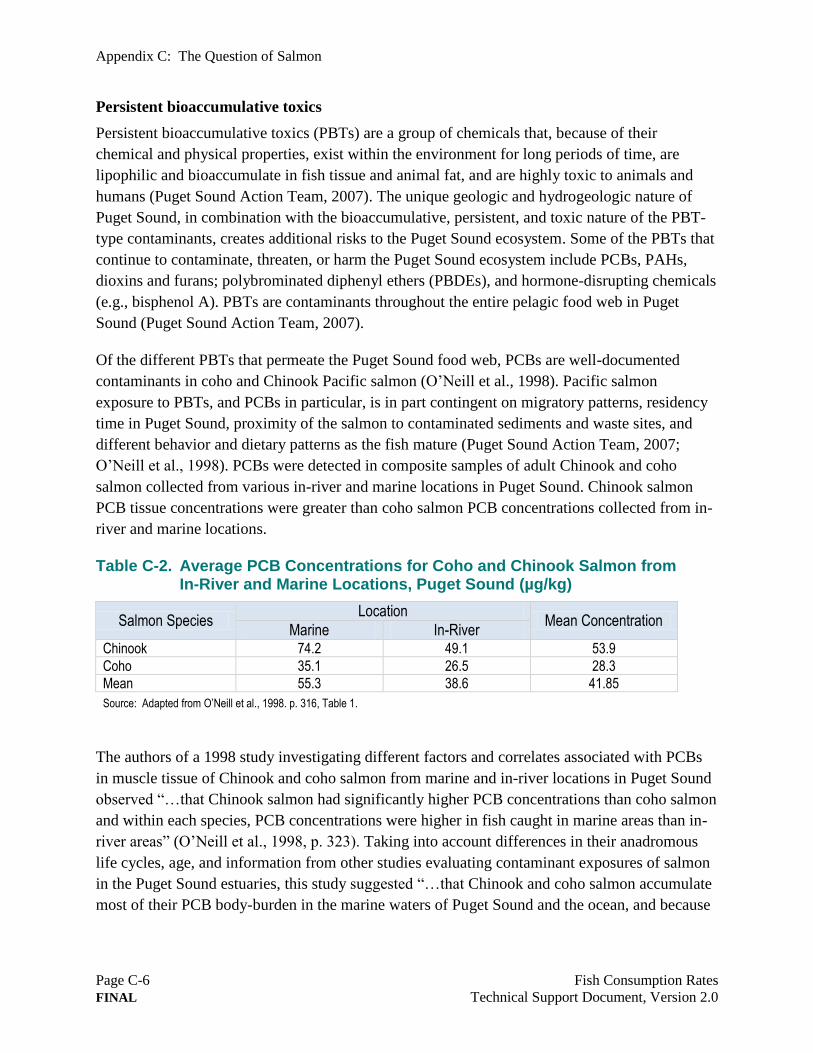
Appendix C: The Question of Salmon
Page C-6 Fish Consumption Rates
FINAL Technical Support Document, Version 2.0
Persistent bioaccumulative toxics
Persistent bioaccumulative toxics (PBTs) are a group of chemicals that, because of their
chemical and physical properties, exist within the environment for long periods of time, are
lipophilic and bioaccumulate in fish tissue and animal fat, and are highly toxic to animals and
humans (Puget Sound Action Team, 2007). The unique geologic and hydrogeologic nature of
Puget Sound, in combination with the bioaccumulative, persistent, and toxic nature of the PBT-
type contaminants, creates additional risks to the Puget Sound ecosystem. Some of the PBTs that
continue to contaminate, threaten, or harm the Puget Sound ecosystem include PCBs, PAHs,
dioxins and furans; polybrominated diphenyl ethers (PBDEs), and hormone-disrupting chemicals
(e.g., bisphenol A). PBTs are contaminants throughout the entire pelagic food web in Puget
Sound (Puget Sound Action Team, 2007).
Of the different PBTs that permeate the Puget Sound food web, PCBs are well-documented
contaminants in coho and Chinook Pacific salmon (O’Neill et al., 1998). Pacific salmon
exposure to PBTs, and PCBs in particular, is in part contingent on migratory patterns, residency
time in Puget Sound, proximity of the salmon to contaminated sediments and waste sites, and
different behavior and dietary patterns as the fish mature (Puget Sound Action Team, 2007;
O’Neill et al., 1998). PCBs were detected in composite samples of adult Chinook and coho
salmon collected from various in-river and marine locations in Puget Sound. Chinook salmon
PCB tissue concentrations were greater than coho salmon PCB concentrations collected from in-
river and marine locations.
Table C-2. Average PCB Concentrations for Coho and Chinook Salmon from In-River and Marine Locations, Puget Sound (µg/kg)
Salmon Species Location
Mean Concentration Marine In-River
Chinook 74.2 49.1 53.9
Coho 35.1 26.5 28.3
Mean 55.3 38.6 41.85
Source: Adapted from O’Neill et al., 1998. p. 316, Table 1.
The authors of a 1998 study investigating different factors and correlates associated with PCBs
in muscle tissue of Chinook and coho salmon from marine and in-river locations in Puget Sound
observed “…that Chinook salmon had significantly higher PCB concentrations than coho salmon
and within each species, PCB concentrations were higher in fish caught in marine areas than in-
river areas” (O’Neill et al., 1998, p. 323). Taking into account differences in their anadromous
life cycles, age, and information from other studies evaluating contaminant exposures of salmon
in the Puget Sound estuaries, this study suggested “…that Chinook and coho salmon accumulate
most of their PCB body-burden in the marine waters of Puget Sound and the ocean, and because
Appendix C: The Question of Salmon
Fish Consumption Rates Page C-7
Technical Support Document, Version 2.0 FINAL
Chinook salmon live longer and stay at sea longer than coho salmon they accumulate higher
PCB concentrations in their muscle tissues” (O’Neill et al., 1998).54
The authors further noted
that the salmon contaminant body burden attributable to freshwater and estuarine environments
was negligible compared with residency time, growth patterns, and feeding habits of the salmon
at sea. A 2005 study on the behavior and ecology of Pacific salmon and trout noted that salmon
have high metabolic rates, feed heavily, and grow fast in the ocean (Quinn, 2005).
Salmon can double their body length and increase their body weight tenfold during their first
summer at sea. More than 98 percent of the final body weight of most salmon is attained at sea.
For example, pink salmon entering the ocean may have a body weight of 0.2 gram but return
from the sea weighing 2 kilograms, a ten thousand-fold increase. Further study also associates
the percent contaminant body burden with fish biology (O’Neill et al., 2006). Coho and Chinook
salmon populations that have more coastal migratory distributions have higher tissue
concentrations of PCBs compared with those salmonids with more oceanic migratory
distributions (chum, pink, and sockeye). Variations in the contaminant body burdens were noted
and attributed to the marine distribution of the species (O’Neill et al., 2006, pp. 3–4):
…Chinook salmon returning to Puget Sound had significantly higher concentrations of
PCBs and PBDEs compared to other Pacific coast salmon populations we sampled.
Furthermore, Chinook salmon that resided in Puget Sound in the winter rather than
migrate to the Pacific Ocean (“residents”) had the highest concentrations of POPs
[persistent organic pollutants], followed by Puget Sound fish populations believed to be
more ocean-reared. Fall Chinook from Puget Sound have a more localized marine
distribution in Puget Sound and the Georgia Basin than other populations of Chinook
from the west coast of North American and are more contaminated with PCBs (2 to 6
times) and PBDEs (5 to 17 times).
Residence time in Puget Sound
Ecology evaluated a variety of information related to the residence time of salmon in Puget
Sound and different river systems of Puget Sound. Several factors have a bearing on the salmon
residence time:
Biological variability exists across and within salmon species regarding migratory habits
and behavior patterns.
The location of rivers or streams within Puget Sound. Locations deep within the sound
lengthen the time the salmon reside in the sound.
54 Chinook and coho salmon occupy three distinct habitat types during their life cycle: (a) Freshwater habitats (eggs hatch and fry develop); (b) Puget Sound (smolts enter marine waters to feed and reside during migration); and (c) Ocean habitat.
Appendix C: The Question of Salmon
Page C-8 Fish Consumption Rates
FINAL Technical Support Document, Version 2.0
Selected salmonid species do not die after spawning, and may spawn more than once,
migrating to and from the same river/stream in Puget Sound.
With considerable species variability, selected salmonid populations do not migrate to the
open ocean and, instead, remain in Puget Sound.
Different residency times of salmon within Puget Sound will result in more or less exposure to
chemicals that contaminate the sound and, therefore, contribute to the contaminant body burden
of salmon. Some salmon (resident “blackmouth” or Chinook salmon populations) may spend
significant portions of their lives in Puget Sound.
Salmon abundance
Interpreting salmon abundance records and historical records on salmon counts is complicated.
Salmon are difficult to count because salmon populations are variable due to continual changes
in freshwater and marine environments or to the cyclic nature of salmonid behaviors. Very long
time-series records (a decade or longer) of catch or escapement are required for detecting large
changes (50 percent or greater) in population abundance. Also, long-term changes in abundance
may not occur as a continuous linear series of events and, therefore, are not accounted for with
standard statistical evaluations. Therefore, records of abundance for short periods of time may
suggest an increase or decrease in salmonid populations when, in fact, long-term trends are the
reverse. The inherent biological variability of salmonids confers a level of uncertainty about the
abundance counts and records associated with the different salmonid species (National Research
Council, 1996, pp. 77–79).
Puget Sound salmon
The Puget Sound Basin includes the river systems in Puget Sound, Hood Canal, and the Strait of
Juan de Fuca. As shown in the tables below (which provide the status of Washington and Puget
Sound Salmon Stocks), there is a wide range of salmon population conditions in Puget Sound
ranging from critical to healthy.55
Generally, for Puget Sound, the Washington Department of
Fisheries (now referred to as the Washington Department of Fish and Wildlife) in 1993 classified
about 44 percent of the salmon stocks as healthy, about 21 percent as depressed, about 5 percent
as critical, and about 30 percent unknown. Puget Sound is considered to have more depressed
salmon stocks compared to the Washington coastal regions but fewer depressed stocks than the
Columbia River Basin (National Research Council, 1996, pp. 86–90). Many wild salmon,
steelhead, and bull trout stocks have been listed under the Endangered Species Act by the
National Marine Fisheries Services or the U.S. Fish and Wildlife Service. As of 1998, less than
50 percent of Washington’s salmon stocks were considered to be healthy (Governor’s Salmon
55 Stock is defined by Governor’s Salmon Recovery Office (http://www.governor.wa.gov/gsr0/glossary/default.asp) as “fish spawning in a particular lake or stream(s) at a particular season which to a substantial degree do not interbreed with any group spawning in a different place at the same time, or in the same place at a different time.” The National Research Council (1996, pp. 12–13) notes that salmon stocks refers to a geographic aggregate of salmon populations that includes many local breeding populations of varied size and productivity.
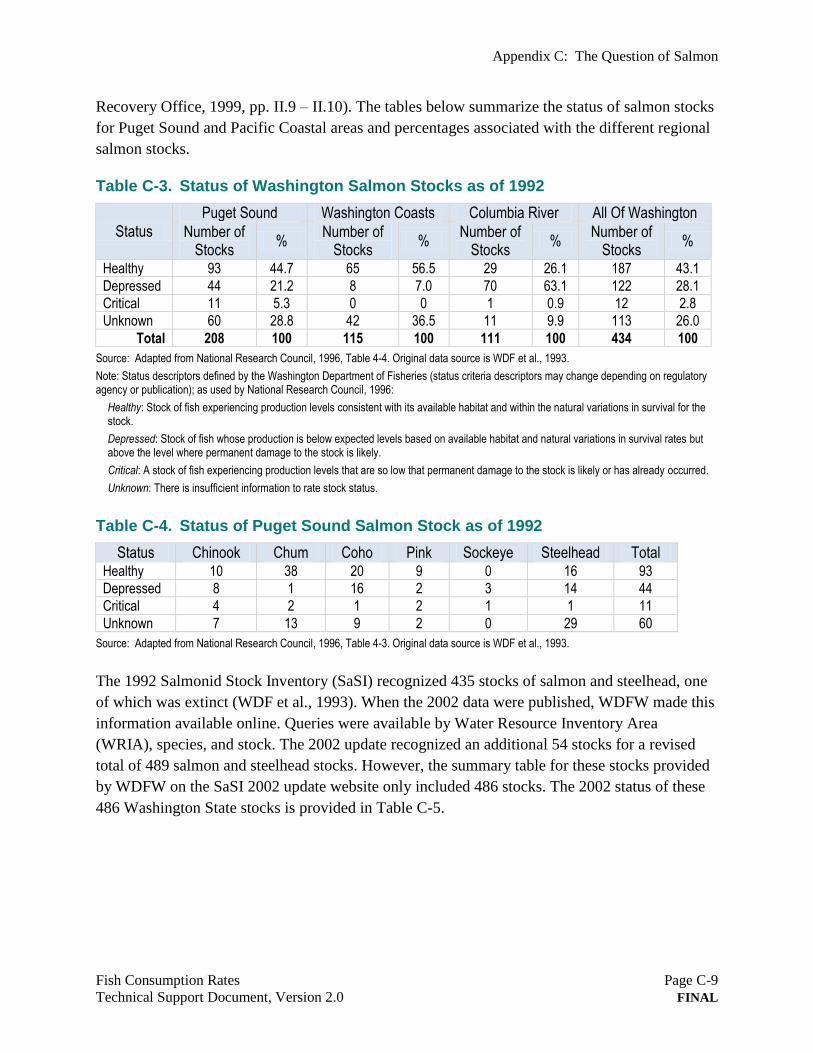
Appendix C: The Question of Salmon
Fish Consumption Rates Page C-9
Technical Support Document, Version 2.0 FINAL
Recovery Office, 1999, pp. II.9 – II.10). The tables below summarize the status of salmon stocks
for Puget Sound and Pacific Coastal areas and percentages associated with the different regional
salmon stocks.
Table C-3. Status of Washington Salmon Stocks as of 1992
Status Puget Sound Washington Coasts Columbia River All Of Washington
Number of Stocks
% Number of
Stocks %
Number of Stocks
% Number of
Stocks %
Healthy 93 44.7 65 56.5 29 26.1 187 43.1
Depressed 44 21.2 8 7.0 70 63.1 122 28.1
Critical 11 5.3 0 0 1 0.9 12 2.8
Unknown 60 28.8 42 36.5 11 9.9 113 26.0
Total 208 100 115 100 111 100 434 100
Source: Adapted from National Research Council, 1996, Table 4-4. Original data source is WDF et al., 1993.
Note: Status descriptors defined by the Washington Department of Fisheries (status criteria descriptors may change depending on regulatory agency or publication); as used by National Research Council, 1996:
Healthy: Stock of fish experiencing production levels consistent with its available habitat and within the natural variations in survival for the stock.
Depressed: Stock of fish whose production is below expected levels based on available habitat and natural variations in survival rates but above the level where permanent damage to the stock is likely.
Critical: A stock of fish experiencing production levels that are so low that permanent damage to the stock is likely or has already occurred.
Unknown: There is insufficient information to rate stock status.
Table C-4. Status of Puget Sound Salmon Stock as of 1992
Status Chinook Chum Coho Pink Sockeye Steelhead Total Healthy 10 38 20 9 0 16 93
Depressed 8 1 16 2 3 14 44
Critical 4 2 1 2 1 1 11
Unknown 7 13 9 2 0 29 60
Source: Adapted from National Research Council, 1996, Table 4-3. Original data source is WDF et al., 1993.
The 1992 Salmonid Stock Inventory (SaSI) recognized 435 stocks of salmon and steelhead, one
of which was extinct (WDF et al., 1993). When the 2002 data were published, WDFW made this
information available online. Queries were available by Water Resource Inventory Area
(WRIA), species, and stock. The 2002 update recognized an additional 54 stocks for a revised
total of 489 salmon and steelhead stocks. However, the summary table for these stocks provided
by WDFW on the SaSI 2002 update website only included 486 stocks. The 2002 status of these
486 Washington State stocks is provided in Table C-5.
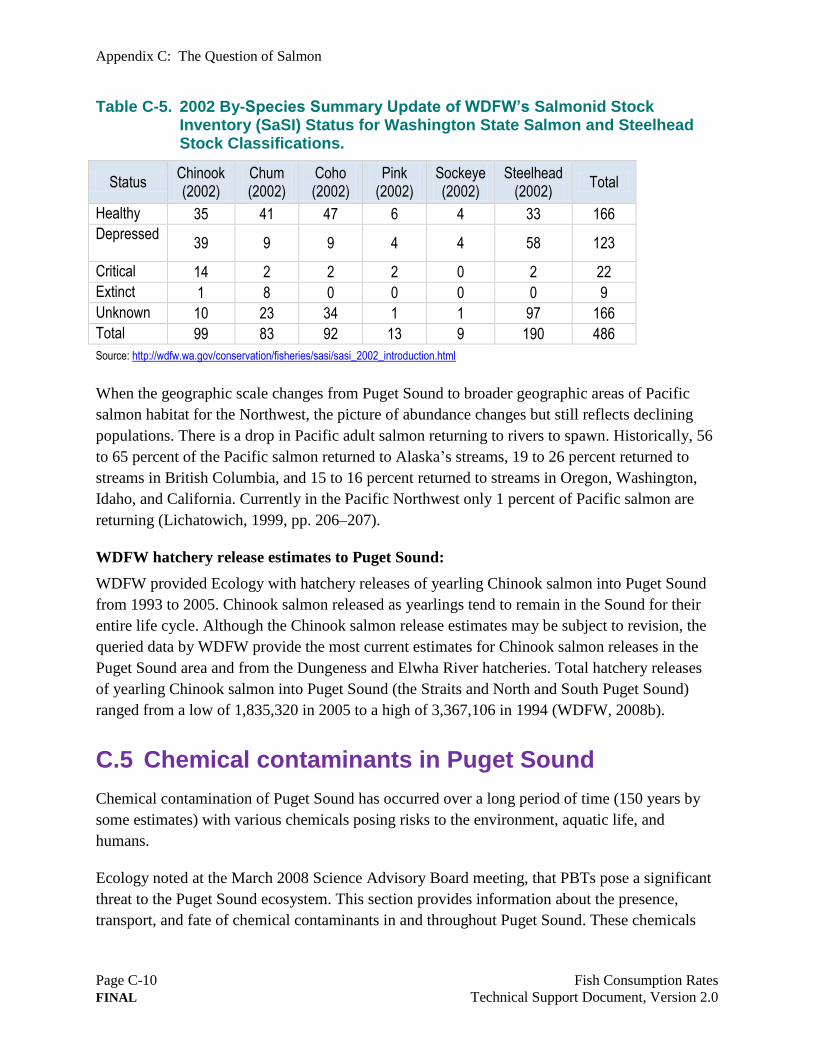
Appendix C: The Question of Salmon
Page C-10 Fish Consumption Rates
FINAL Technical Support Document, Version 2.0
Table C-5. 2002 By-Species Summary Update of WDFW’s Salmonid Stock Inventory (SaSI) Status for Washington State Salmon and Steelhead Stock Classifications.
Status Chinook (2002)
Chum (2002)
Coho (2002)
Pink (2002)
Sockeye (2002)
Steelhead (2002)
Total
Healthy 35 41 47 6 4 33 166
Depressed 39 9 9 4 4 58 123
Critical 14 2 2 2 0 2 22
Extinct 1 8 0 0 0 0 9
Unknown 10 23 34 1 1 97 166
Total 99 83 92 13 9 190 486
Source: http://wdfw.wa.gov/conservation/fisheries/sasi/sasi_2002_introduction.html
When the geographic scale changes from Puget Sound to broader geographic areas of Pacific
salmon habitat for the Northwest, the picture of abundance changes but still reflects declining
populations. There is a drop in Pacific adult salmon returning to rivers to spawn. Historically, 56
to 65 percent of the Pacific salmon returned to Alaska’s streams, 19 to 26 percent returned to
streams in British Columbia, and 15 to 16 percent returned to streams in Oregon, Washington,
Idaho, and California. Currently in the Pacific Northwest only 1 percent of Pacific salmon are
returning (Lichatowich, 1999, pp. 206–207).
WDFW hatchery release estimates to Puget Sound:
WDFW provided Ecology with hatchery releases of yearling Chinook salmon into Puget Sound
from 1993 to 2005. Chinook salmon released as yearlings tend to remain in the Sound for their
entire life cycle. Although the Chinook salmon release estimates may be subject to revision, the
queried data by WDFW provide the most current estimates for Chinook salmon releases in the
Puget Sound area and from the Dungeness and Elwha River hatcheries. Total hatchery releases
of yearling Chinook salmon into Puget Sound (the Straits and North and South Puget Sound)
ranged from a low of 1,835,320 in 2005 to a high of 3,367,106 in 1994 (WDFW, 2008b).
C.5 Chemical contaminants in Puget Sound
Chemical contamination of Puget Sound has occurred over a long period of time (150 years by
some estimates) with various chemicals posing risks to the environment, aquatic life, and
humans.
Ecology noted at the March 2008 Science Advisory Board meeting, that PBTs pose a significant
threat to the Puget Sound ecosystem. This section provides information about the presence,
transport, and fate of chemical contaminants in and throughout Puget Sound. These chemicals
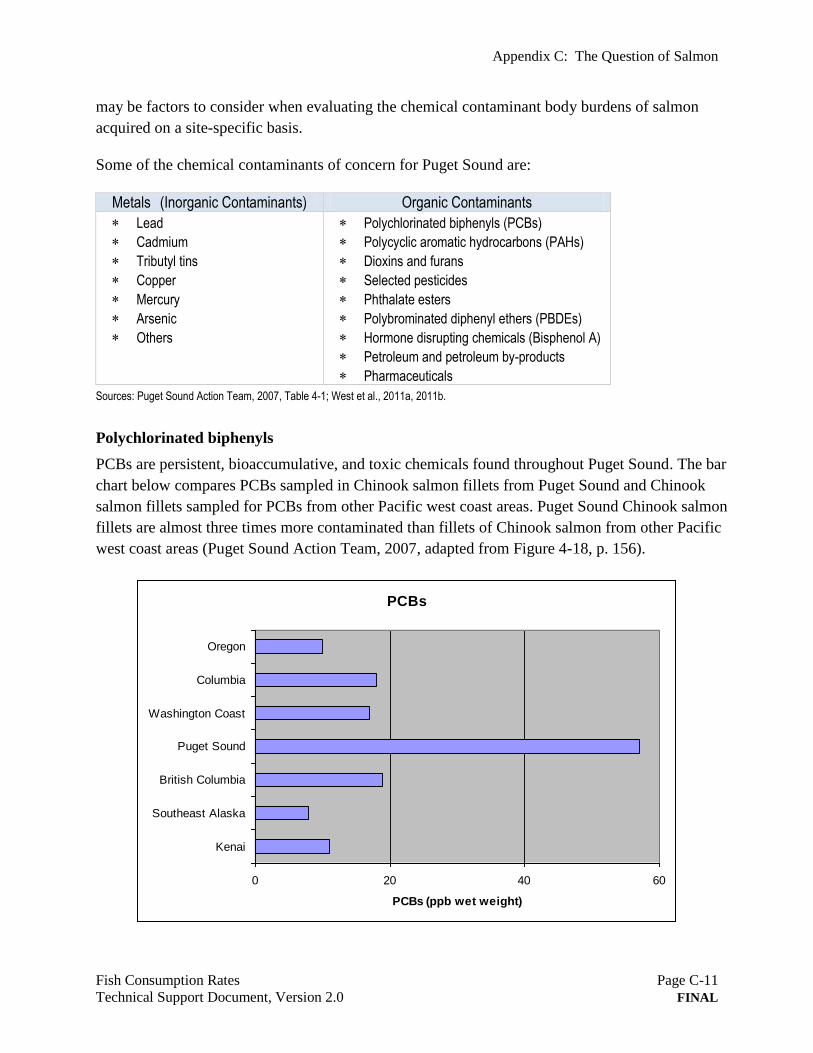
Appendix C: The Question of Salmon
Fish Consumption Rates Page C-11
Technical Support Document, Version 2.0 FINAL
may be factors to consider when evaluating the chemical contaminant body burdens of salmon
acquired on a site-specific basis.
Some of the chemical contaminants of concern for Puget Sound are:
Metals (Inorganic Contaminants) Organic Contaminants
Lead
Cadmium
Tributyl tins
Copper
Mercury
Arsenic
Others
Polychlorinated biphenyls (PCBs)
Polycyclic aromatic hydrocarbons (PAHs)
Dioxins and furans
Selected pesticides
Phthalate esters
Polybrominated diphenyl ethers (PBDEs)
Hormone disrupting chemicals (Bisphenol A)
Petroleum and petroleum by-products
Pharmaceuticals
Sources: Puget Sound Action Team, 2007, Table 4-1; West et al., 2011a, 2011b.
Polychlorinated biphenyls
PCBs are persistent, bioaccumulative, and toxic chemicals found throughout Puget Sound. The bar
chart below compares PCBs sampled in Chinook salmon fillets from Puget Sound and Chinook
salmon fillets sampled for PCBs from other Pacific west coast areas. Puget Sound Chinook salmon
fillets are almost three times more contaminated than fillets of Chinook salmon from other Pacific
west coast areas (Puget Sound Action Team, 2007, adapted from Figure 4-18, p. 156).
PCBs
0 20 40 60
Kenai
Southeast Alaska
British Columbia
Puget Sound
Washington Coast
Columbia
Oregon
PCBs (ppb wet weight)
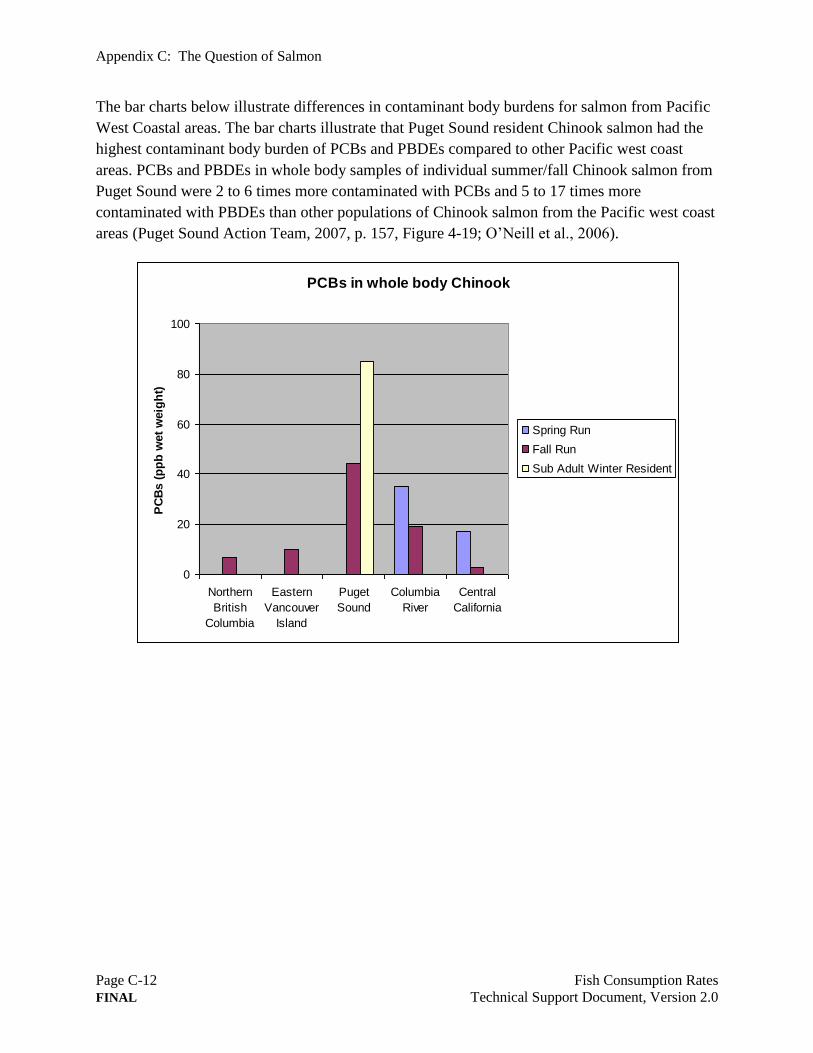
Appendix C: The Question of Salmon
Page C-12 Fish Consumption Rates
FINAL Technical Support Document, Version 2.0
The bar charts below illustrate differences in contaminant body burdens for salmon from Pacific
West Coastal areas. The bar charts illustrate that Puget Sound resident Chinook salmon had the
highest contaminant body burden of PCBs and PBDEs compared to other Pacific west coast
areas. PCBs and PBDEs in whole body samples of individual summer/fall Chinook salmon from
Puget Sound were 2 to 6 times more contaminated with PCBs and 5 to 17 times more
contaminated with PBDEs than other populations of Chinook salmon from the Pacific west coast
areas (Puget Sound Action Team, 2007, p. 157, Figure 4-19; O’Neill et al., 2006).
PCBs in whole body Chinook
0
20
40
60
80
100
Northern
British
Columbia
Eastern
Vancouver
Island
Puget
Sound
Columbia
River
Central
California
PC
Bs (
pp
b w
et
weig
ht)
Spring Run
Fall Run
Sub Adult Winter Resident
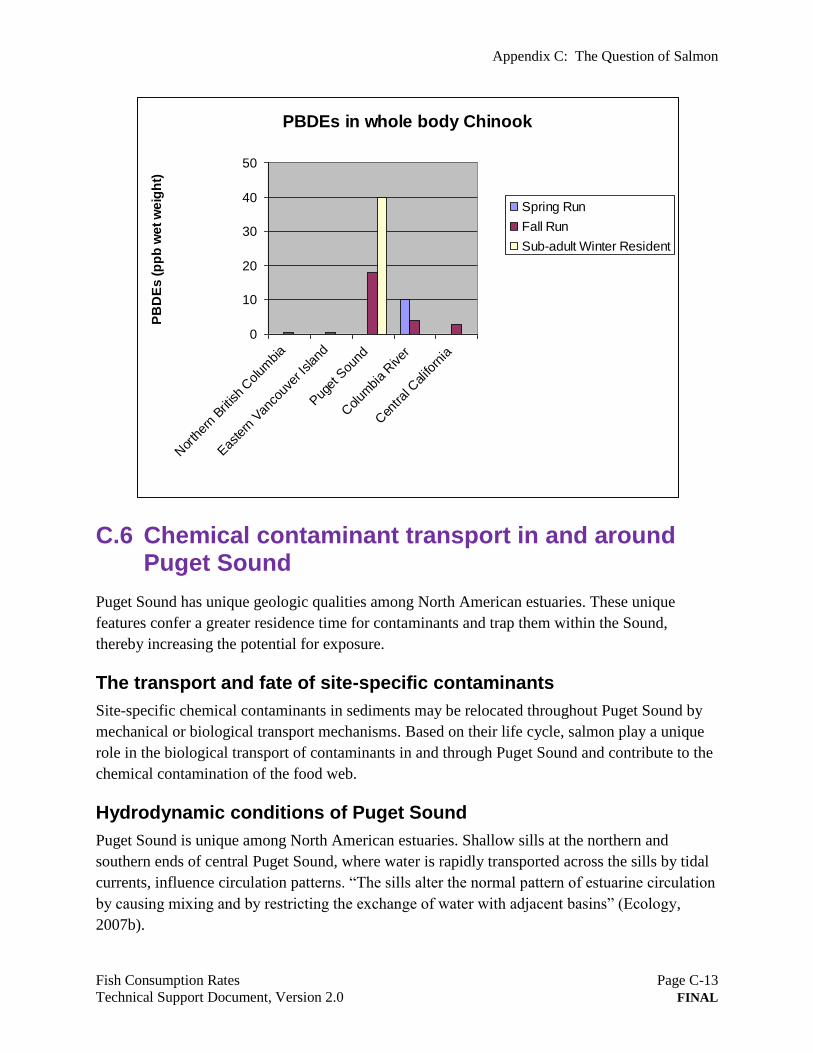
Appendix C: The Question of Salmon
Fish Consumption Rates Page C-13
Technical Support Document, Version 2.0 FINAL
C.6 Chemical contaminant transport in and around Puget Sound
Puget Sound has unique geologic qualities among North American estuaries. These unique
features confer a greater residence time for contaminants and trap them within the Sound,
thereby increasing the potential for exposure.
The transport and fate of site-specific contaminants
Site-specific chemical contaminants in sediments may be relocated throughout Puget Sound by
mechanical or biological transport mechanisms. Based on their life cycle, salmon play a unique
role in the biological transport of contaminants in and through Puget Sound and contribute to the
chemical contamination of the food web.
Hydrodynamic conditions of Puget Sound
Puget Sound is unique among North American estuaries. Shallow sills at the northern and
southern ends of central Puget Sound, where water is rapidly transported across the sills by tidal
currents, influence circulation patterns. “The sills alter the normal pattern of estuarine circulation
by causing mixing and by restricting the exchange of water with adjacent basins” (Ecology,
2007b).
PBDEs in whole body Chinook
0
10
20
30
40
50
Nor
ther
n Brit
ish
Colum
bia
Eas
tern
Van
couv
er Is
land
Pug
et S
ound
Colum
bia
River
Cen
tral C
alifo
rnia
PB
DE
s (
pp
b w
et
we
igh
t)
Spring Run
Fall Run
Sub-adult Winter Resident
Appendix C: The Question of Salmon
Page C-14 Fish Consumption Rates
FINAL Technical Support Document, Version 2.0
Contaminant residence times
The residence times for contaminants in Puget Sound are extended because the circulation
conditions of the Sound, including the shallow sills associated with different inlets,
freshwater/marine water gradients, and highly variable flow velocities in different areas of the
Sound, all facilitate the trapping and mixing of toxic chemical contaminants. Chemical
contaminants spend longer in the Sound increasing exposures to aquatic organisms, humans, and
the environment.
Mechanical transport
Plastic debris may be transporting hydrophobic contaminants to sediments and sediment-
dwelling (benthic infaunal communities) organisms (Teuten et al., 2007). Representative plastics
(polyethylene, polypropylene, and polyvinyl chloride) were used to evaluate the preferential
sorption of PAHs in plastics compared to sediments in marine environments. The addition of
small amounts of PAH-contaminated plastics to sediments significantly increased the
bioaccumulation of PAHs (phenanthrene) in sediment dwelling organisms. In addition, sorption
of hydrophobic chemicals to plastics facilitates the transport of the contaminants to other areas in
marine environments and to marine aquatic life.
Contaminant dispersal, re-suspension, and transport
Chemical contaminants can be transported and dispersed throughout Puget Sound by a variety of
processes. Chemical contaminants within different estuaries and marine water bodies can be
transported and dispersed through different watersheds, bay and harbor areas, and inlets. The
implications for the transport and dispersion of chemical contaminants throughout these water
bodies is an increased potential for exposure to these contaminants by aquatic life and humans,
regardless of where the contaminants originated from.
Dispersal
Sediment reservoirs of historically discharged contaminants (metals, PAHs, PCBs, selected
pesticides) may be disturbed and distributed by bioadvection, biodiffusion, and physical
processes. The sediment-bound contaminants may be moved from the subsurface to upper
sediments where the contaminants may undergo further resuspension and redistribution. Benthic
infaunal communities (annelids, mollusks, crustaceans), storm events, and tidal influences
contribute to the redistribution and dispersion of contaminated sediments (Niedoroda et al., 1996;
Stull et al., 1996; Swift et al., 1996).
Resuspension and transport
Historically deposited chemical contaminants buried in sediments may be resuspended in the
water column and then transported and redeposited into coastal areas distant from the bay areas
where the contaminants originated. Hydrodynamic processes include diffusion, tidal dispersion
and transport of chemicals, sediment-water interactions, and adsorption-desorption of chemicals
Appendix C: The Question of Salmon
Fish Consumption Rates Page C-15
Technical Support Document, Version 2.0 FINAL
to and from suspended particulate matter. Models evaluate the transport and fate of chemical
contaminants from tidal estuaries and bay areas to other proximate marine environments.
Empirical data support modeled outputs related to the remobilization of sediment contaminants,
resuspension of the contaminants into the water column, and the subsequent redeposition of the
contaminants to distant areas (Zeng and Venkatesan, 1999; Zeng et al., 2005).
Biological transport
All seven Pacific salmon species are biotranporters of pollutants to and from the Pacific Ocean
and their spawning sites in freshwater (Ewald, 1998). During river ascent, salmonids use their
muscle lipid and triacyglycerol deposits for energy and gonadal development. Particularly in
female salmonids, the organic pollutant body burden redistributes and accumulates in the lipid
rich gonads and salmon roe. Furthermore, the lipid depletions and redistribution during the river
ascent are not coupled with a simultaneous elimination of the organic pollutant body burden in
the salmonids. The pollutants in the salmonids are readily available for bioaccumulation because
the migrating salmonids, the salmon roe, and salmon carcasses are a direct food source for
predators (birds, mammals, and other fish). Hence, salmonids redistribute their pollutant body
burdens back to their spawning grounds, to the open-ocean predators, or bioaccumulate in the
food web. The redistribution, biotransportation, and bioaccumulation of the salmonid pollutant
body burden contribute to food web contamination.
Chemical contaminants are exhibited through the salmon life cycle, which contributes to the
transport and distribution of contaminants in Puget Sound:
Depletion of lipid reserves during upstream migration can cause significant biomagnifications
of contaminant body burdens in eggs and gonadal tissues (Kelly et al., 2007).
Post spawning decay of Chinook salmon carcasses are sources of persistent organic
pollutants (POPs), such as PCBs, and dichlorodiphenyltrichloroethanes (DDTs), where
body burden contaminants are released into river sediments and, furthermore, are
released into the water column of tributary streams (O’Toole et al., 2006).
Areas in the Pacific Northwest where Chinook salmon are harvested may account for the
variations in their PCB body burden concentrations. Although some contamination of the
Chinook salmon occurs in the Pacific Ocean, a larger source of the salmon body burden
occurs within Puget Sound or along the migratory route within Puget Sound for Chinook
salmon (Missildine et al., 2005).
Chemical contaminants (selected pesticides and POPs) have been documented in
outmigrant juvenile Chinook salmon (Johnson et al., 2007).
Life histories and biological variability in life histories of Pacific coast salmonids
The following tables present detailed information on the life histories and biological variability
of Pacific coast salmonids.
Appendix C: The Question of Salmon
Page C-16 Fish Consumption Rates
FINAL Technical Support Document, Version 2.0
Additional information on biological transport of contaminants is provided in the following
publications:
Data Report for Lower Columbia Juvenile Salmon Persistent Organic Pollutant Exposure
Assessment. NOAA Damage Assessment Center, Portland Harbor Natural Resource
Trustees,
O’Toole, Shaun, Chris Metcalfe, Ian Craine, and Mart Gross. Release of persistent
organic contaminants from carcasses of Lake Ontario Chinook salmon (Oncorhynchus
tshawytscha). Environmental Pollution 140 (2006), 102-113.
Missildine, Brian. Polychlorinated Biphenyl Concentrations in Adult Chinook Salmon
(Oncorhynchus tshawytscha) Returning to Coastal and Puget Sound Hatcheries. Master
of Environmental Studies Thesis. The Evergreen State College. February 2005.
Missildine, Brian, R., Roger J. Peters, Gerardo Chin-Leo, and Douglas Houck.
Polychlorinated Biphenyl Concentrations in Adult Chinook Salmon (Oncorhynchus
tshawytscha) Returning to Coastal and Puget Sound Hatcheries of Washington State.
Environmental Science & Technology. 2005, 39, 6944-6951.
Merna, James W., Contamination of Stream Fishes with Chlorinated Hydrocarbons from
Eggs of Great Lakes Salmon. Transactions of the American Fisheries Society 115:60-74,
1986.
KrÜmmel, E. M., R. W. Macdonald, L.E. Kimpe, I Gregory-Eaves, et al. Delivery of
pollutants by spawning salmon. Nature, Sept 18, 2003; 425; brief communications 255-
256.
Kelly, Barry, C., Samantha L. Gray, Michael G. Ikonomou, J. Steve Macdonald, Stelvio
M. Bandiera, and Eugene G. Hrycay. Lipid Reserve Dynamics and Magnification of
Persistent Organic Pollutants in Spawning Sockeye Salmon (Oncorhynchus nerka) from
the Fraser River, British Columbia. Environmental Science & Technology. 2007, 41,
3083-3089.
Johnson, Lyndal, L., Gina M. Ylitalo, Catherine A. Sloan, Bernadita F. Anulacion, Anna
N. Kagley, Mary R. Arkoosh, Tricia A. Lundrigan, Kim Larson, Mark Siipola, Tracy K.
Collier. Persistent organic pollutants in outmigrant juvenile Chinook salmon from the
Lower Columbia Estuary, USA. Science of the Total Environment 374 (2007) 342-366.
Janetski, David J., Dominic T. Chaloner, Ashley H. Moerke, Richard R. Rediske, James
P. O’Keefe, and Gary A. Lamberti. Resident Fishes Display Elevated Organic Pollutants
in Salmon Spawning Streams of the Great Lakes. Environmental Science & Technology.
2012, 46, 8035-8043.
Appendix C: The Question of Salmon
Fish Consumption Rates Page C-17
Technical Support Document, Version 2.0 FINAL
Hites, Ronald, A. Polybrominated Diphenyl Ethers in the Environment and in People: A
Meta-Analysis of Concentrations. Critical Review. Environmental Science &
Technology. 2004, Vol 38, No 4, 945-956.
Gende, Scott, M., Richard T. Edwards, Mary F. Willson, and Mark S. Wipfli. Pacific
Salmon in Aquatic and Terrestrial Ecosystems. Bioscience, October 2002, Vol. 52, No.
10, 917-928.
Fletcher, Demetrius. Concentrations of PCBs and PBDEs in water in the Cedar River and
fish from the Lake Washington/Cedar/Sammamish Watershed. Master of Science,
University of Washington. 2009.
Report for 2001AK3481B: Final Report: Mercury Levels in Alaskan Rivers: Relationship
between Hg levels and young salmon.
Ewald, GÖran, Per Larrsson, Henric Linge, Lennart Okla, Nicole Szarzi. Biotransport of
Organic Pollutants to an Inland Alaska Lake by Migrating Sockeye Salmon
(Oocorhynchus nerka). Arctic, Vol 51, No. 1 (March 1998) pp. 40-47.
Blais, Jules M., Robie W. Macdonald, Donald Mackay, Eva Webseter, Colin Harvey, and
John P. Smol. Biologically Mediated Transport of Contaminants to Aquatic Systems.
Critical Review. Environmental Science & Technology. 2007, Vol 41, No 4, 1075-1084.
Blais, Jules M., Lynda E. Kimpe, Dominique McMahon, Bronwyn E. Keatley, Mark L.
Mallory, Marianne S. V. Douglas, John P. Smol. Arctic Seabirds Transport Marine-
Derived Contaminants. Science, Brevia, July 15, 205, 309, 5733, pp 445.
Macdonald, R., D. Mackay and B. Hickie. 2002. Peer Reviewed Contaminant
Amplification in the Environment. Environmental Science & Technology, 36 (25), pp
456A-462A.
Marcy, S., D. Dasher, R. Deitz, L. Duffy, M. Evans, S. Juntto, S. Lindberg et al. Report
for 2001AK3481B: Final Report: Mercury Levels in Alaskan Rivers: Relationship
between Hg levels and young salmon.
NOAA. 2009. Data Report for Lower Columbia Juvenile Salmon Persistent Organic
Pollutant Exposure Assessment. Prepared by Environmental Conservation Division,
Northwest Fisheries Science Center, National Marine Fisheries Service, National Oceanic
and Atmospheric Administration. Prepared for NOAA Damage Assessment Center and
Portland Harbor Natural Resource Trustees.
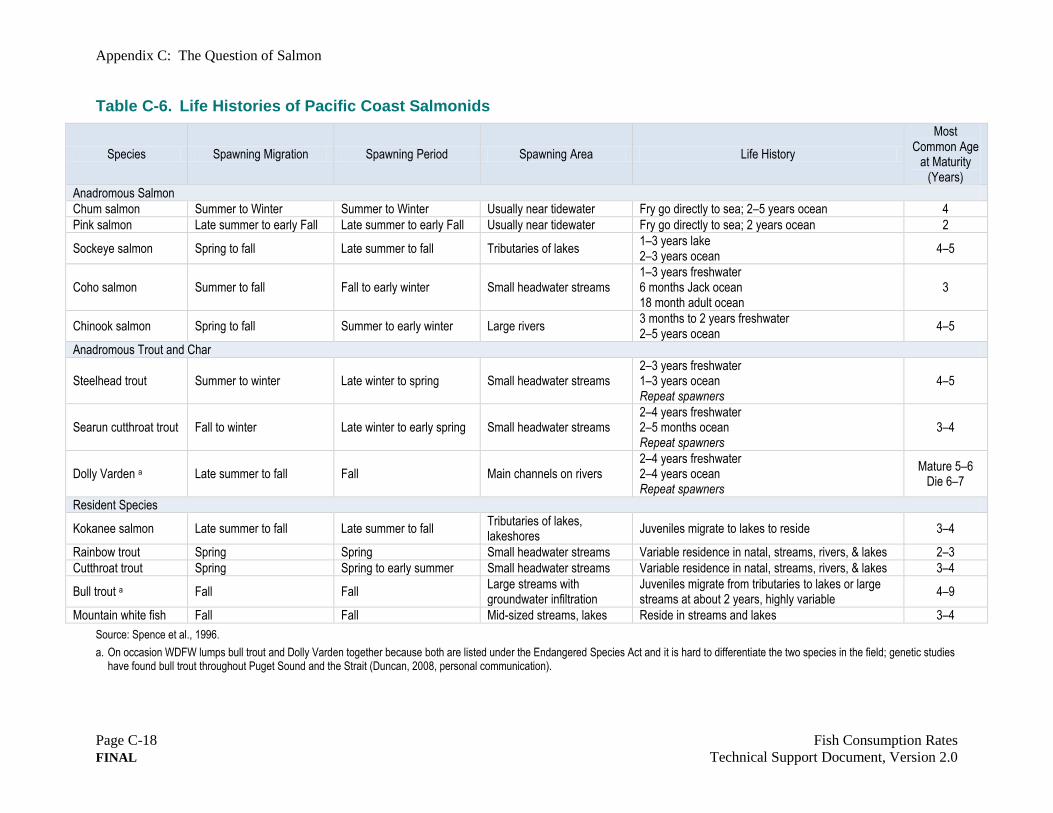
Appendix C: The Question of Salmon
Page C-18 Fish Consumption Rates
FINAL Technical Support Document, Version 2.0
Table C-6. Life Histories of Pacific Coast Salmonids
Species Spawning Migration Spawning Period Spawning Area Life History
Most Common Age
at Maturity (Years)
Anadromous Salmon
Chum salmon Summer to Winter Summer to Winter Usually near tidewater Fry go directly to sea; 2–5 years ocean 4
Pink salmon Late summer to early Fall Late summer to early Fall Usually near tidewater Fry go directly to sea; 2 years ocean 2
Sockeye salmon Spring to fall Late summer to fall Tributaries of lakes 1–3 years lake 2–3 years ocean
4–5
Coho salmon Summer to fall Fall to early winter Small headwater streams 1–3 years freshwater 6 months Jack ocean 18 month adult ocean
3
Chinook salmon Spring to fall Summer to early winter Large rivers 3 months to 2 years freshwater 2–5 years ocean
4–5
Anadromous Trout and Char
Steelhead trout Summer to winter Late winter to spring Small headwater streams 2–3 years freshwater 1–3 years ocean Repeat spawners
4–5
Searun cutthroat trout Fall to winter Late winter to early spring Small headwater streams 2–4 years freshwater 2–5 months ocean Repeat spawners
3–4
Dolly Varden a Late summer to fall Fall Main channels on rivers 2–4 years freshwater 2–4 years ocean Repeat spawners
Mature 5–6 Die 6–7
Resident Species
Kokanee salmon Late summer to fall Late summer to fall Tributaries of lakes, lakeshores
Juveniles migrate to lakes to reside 3–4
Rainbow trout Spring Spring Small headwater streams Variable residence in natal, streams, rivers, & lakes 2–3
Cutthroat trout Spring Spring to early summer Small headwater streams Variable residence in natal, streams, rivers, & lakes 3–4
Bull trout a Fall Fall Large streams with groundwater infiltration
Juveniles migrate from tributaries to lakes or large streams at about 2 years, highly variable
4–9
Mountain white fish Fall Fall Mid-sized streams, lakes Reside in streams and lakes 3–4
Source: Spence et al., 1996.
a. On occasion WDFW lumps bull trout and Dolly Varden together because both are listed under the Endangered Species Act and it is hard to differentiate the two species in the field; genetic studies have found bull trout throughout Puget Sound and the Strait (Duncan, 2008, personal communication).
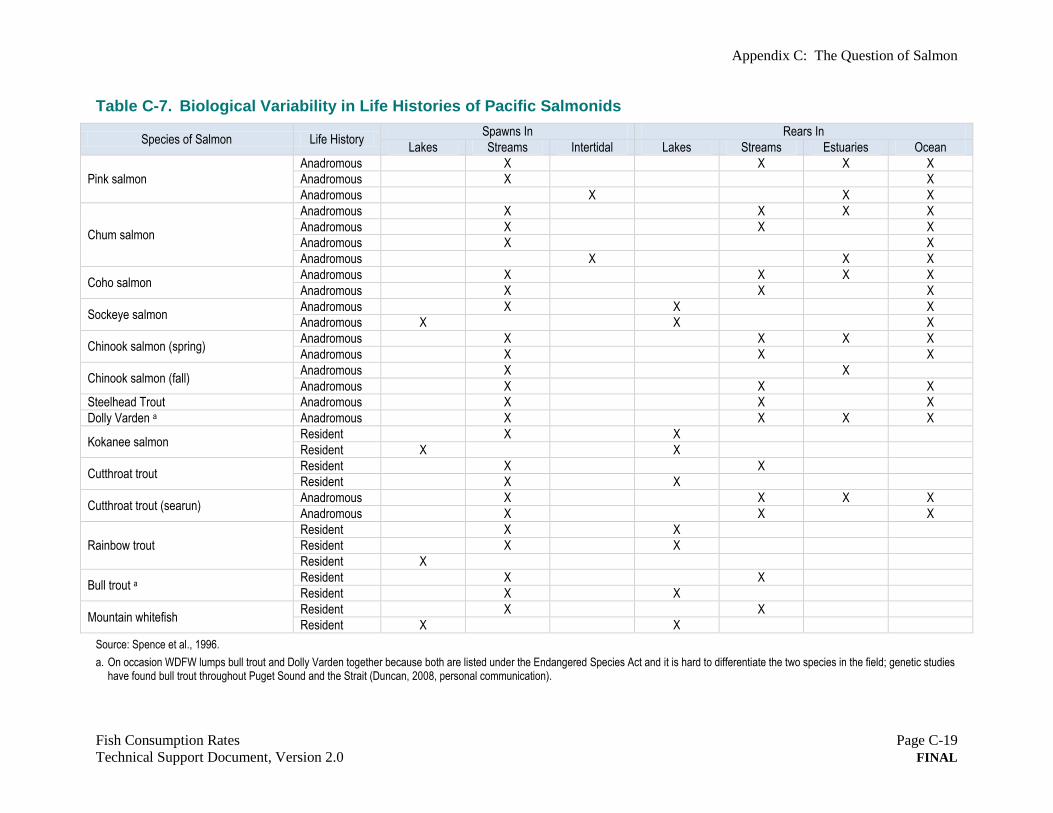
Appendix C: The Question of Salmon
Fish Consumption Rates Page C-19
Technical Support Document, Version 2.0 FINAL
Table C-7. Biological Variability in Life Histories of Pacific Salmonids
Species of Salmon Life History Spawns In Rears In
Lakes Streams Intertidal Lakes Streams Estuaries Ocean
Pink salmon
Anadromous X X X X
Anadromous X X
Anadromous X X X
Chum salmon
Anadromous X X X X
Anadromous X X X
Anadromous X X
Anadromous X X X
Coho salmon Anadromous X X X X
Anadromous X X X
Sockeye salmon Anadromous X X X
Anadromous X X X
Chinook salmon (spring) Anadromous X X X X
Anadromous X X X
Chinook salmon (fall) Anadromous X X
Anadromous X X X
Steelhead Trout Anadromous X X X
Dolly Varden a Anadromous X X X X
Kokanee salmon Resident X X
Resident X X
Cutthroat trout Resident X X
Resident X X
Cutthroat trout (searun) Anadromous X X X X
Anadromous X X X
Rainbow trout
Resident X X
Resident X X
Resident X
Bull trout a Resident X X
Resident X X
Mountain whitefish Resident X X
Resident X X
Source: Spence et al., 1996.
a. On occasion WDFW lumps bull trout and Dolly Varden together because both are listed under the Endangered Species Act and it is hard to differentiate the two species in the field; genetic studies have found bull trout throughout Puget Sound and the Strait (Duncan, 2008, personal communication).
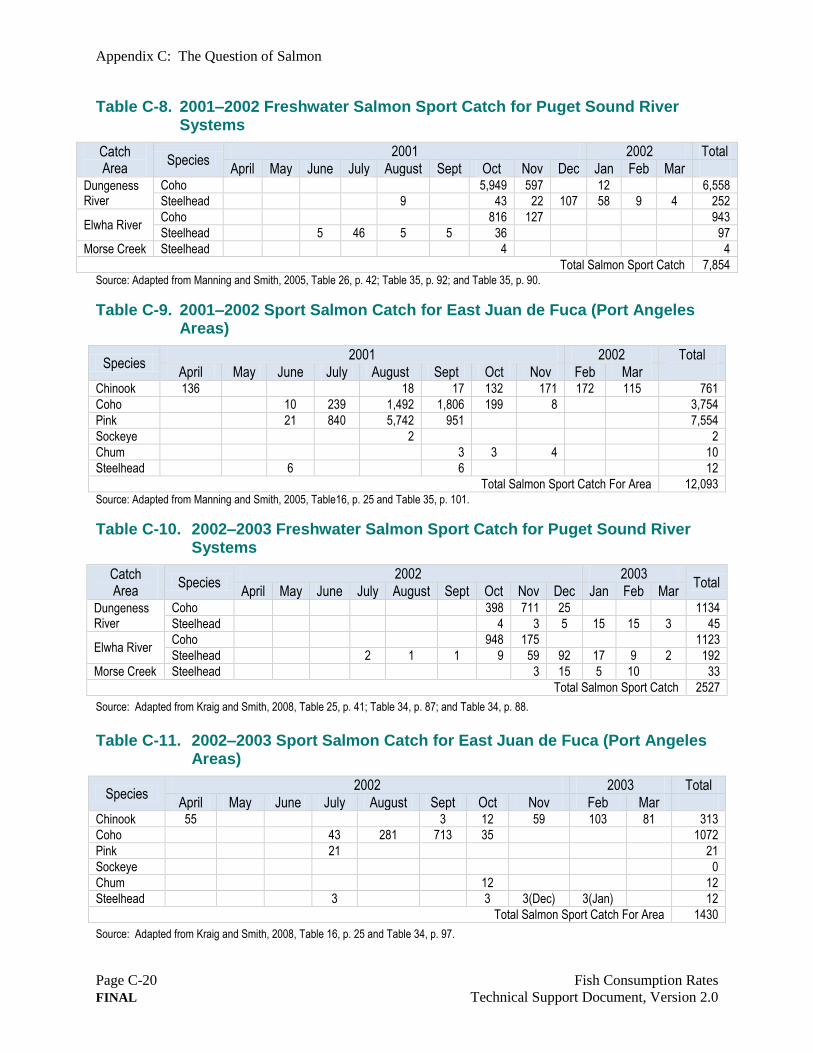
Appendix C: The Question of Salmon
Page C-20 Fish Consumption Rates
FINAL Technical Support Document, Version 2.0
Table C-8. 2001–2002 Freshwater Salmon Sport Catch for Puget Sound River Systems
Catch Area
Species 2001 2002 Total
April May June July August Sept Oct Nov Dec Jan Feb Mar Dungeness River
Coho 5,949 597 12 6,558
Steelhead 9 43 22 107 58 9 4 252
Elwha River Coho 816 127 943
Steelhead 5 46 5 5 36 97
Morse Creek Steelhead 4 4
Total Salmon Sport Catch 7,854 Source: Adapted from Manning and Smith, 2005, Table 26, p. 42; Table 35, p. 92; and Table 35, p. 90.
Table C-9. 2001–2002 Sport Salmon Catch for East Juan de Fuca (Port Angeles Areas)
Species 2001 2002 Total
April May June July August Sept Oct Nov Feb Mar Chinook 136 18 17 132 171 172 115 761
Coho 10 239 1,492 1,806 199 8 3,754
Pink 21 840 5,742 951 7,554
Sockeye 2 2
Chum 3 3 4 10
Steelhead 6 6 12
Total Salmon Sport Catch For Area 12,093 Source: Adapted from Manning and Smith, 2005, Table16, p. 25 and Table 35, p. 101.
Table C-10. 2002–2003 Freshwater Salmon Sport Catch for Puget Sound River Systems
Catch Area
Species 2002 2003
Total April May June July August Sept Oct Nov Dec Jan Feb Mar
Dungeness River
Coho 398 711 25 1134
Steelhead 4 3 5 15 15 3 45
Elwha River Coho 948 175 1123
Steelhead 2 1 1 9 59 92 17 9 2 192
Morse Creek Steelhead 3 15 5 10 33
Total Salmon Sport Catch 2527
Source: Adapted from Kraig and Smith, 2008, Table 25, p. 41; Table 34, p. 87; and Table 34, p. 88.
Table C-11. 2002–2003 Sport Salmon Catch for East Juan de Fuca (Port Angeles Areas)
Species 2002 2003 Total
April May June July August Sept Oct Nov Feb Mar Chinook 55 3 12 59 103 81 313
Coho 43 281 713 35 1072
Pink 21 21
Sockeye 0
Chum 12 12
Steelhead 3 3 3(Dec) 3(Jan) 12
Total Salmon Sport Catch For Area 1430
Source: Adapted from Kraig and Smith, 2008, Table 16, p. 25 and Table 34, p. 97.
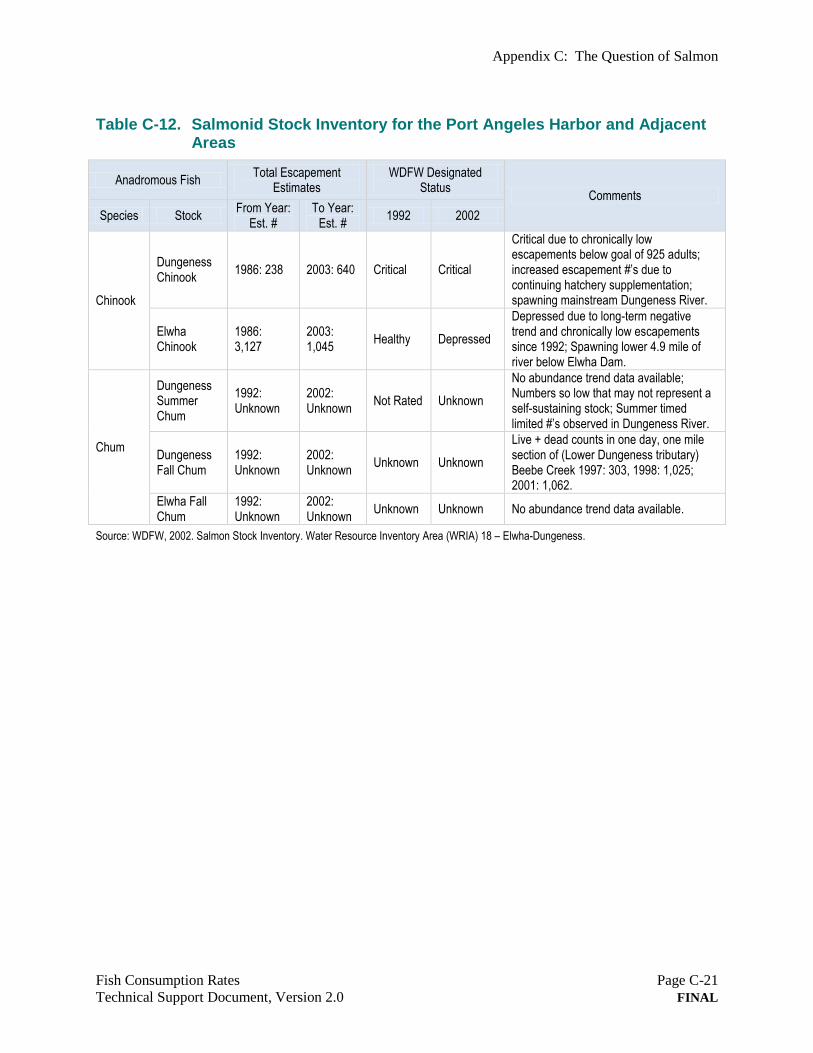
Appendix C: The Question of Salmon
Fish Consumption Rates Page C-21
Technical Support Document, Version 2.0 FINAL
Table C-12. Salmonid Stock Inventory for the Port Angeles Harbor and Adjacent Areas
Anadromous Fish Total Escapement
Estimates WDFW Designated
Status Comments
Species Stock From Year:
Est. # To Year:
Est. # 1992 2002
Chinook
Dungeness Chinook
1986: 238 2003: 640 Critical Critical
Critical due to chronically low escapements below goal of 925 adults; increased escapement #’s due to continuing hatchery supplementation; spawning mainstream Dungeness River.
Elwha Chinook
1986: 3,127
2003: 1,045
Healthy Depressed
Depressed due to long-term negative trend and chronically low escapements since 1992; Spawning lower 4.9 mile of river below Elwha Dam.
Chum
Dungeness Summer Chum
1992: Unknown
2002: Unknown
Not Rated Unknown
No abundance trend data available; Numbers so low that may not represent a self-sustaining stock; Summer timed limited #’s observed in Dungeness River.
Dungeness Fall Chum
1992: Unknown
2002: Unknown
Unknown Unknown
Live + dead counts in one day, one mile section of (Lower Dungeness tributary) Beebe Creek 1997: 303, 1998: 1,025; 2001: 1,062.
Elwha Fall Chum
1992: Unknown
2002: Unknown
Unknown Unknown No abundance trend data available.
Source: WDFW, 2002. Salmon Stock Inventory. Water Resource Inventory Area (WRIA) 18 – Elwha-Dungeness.
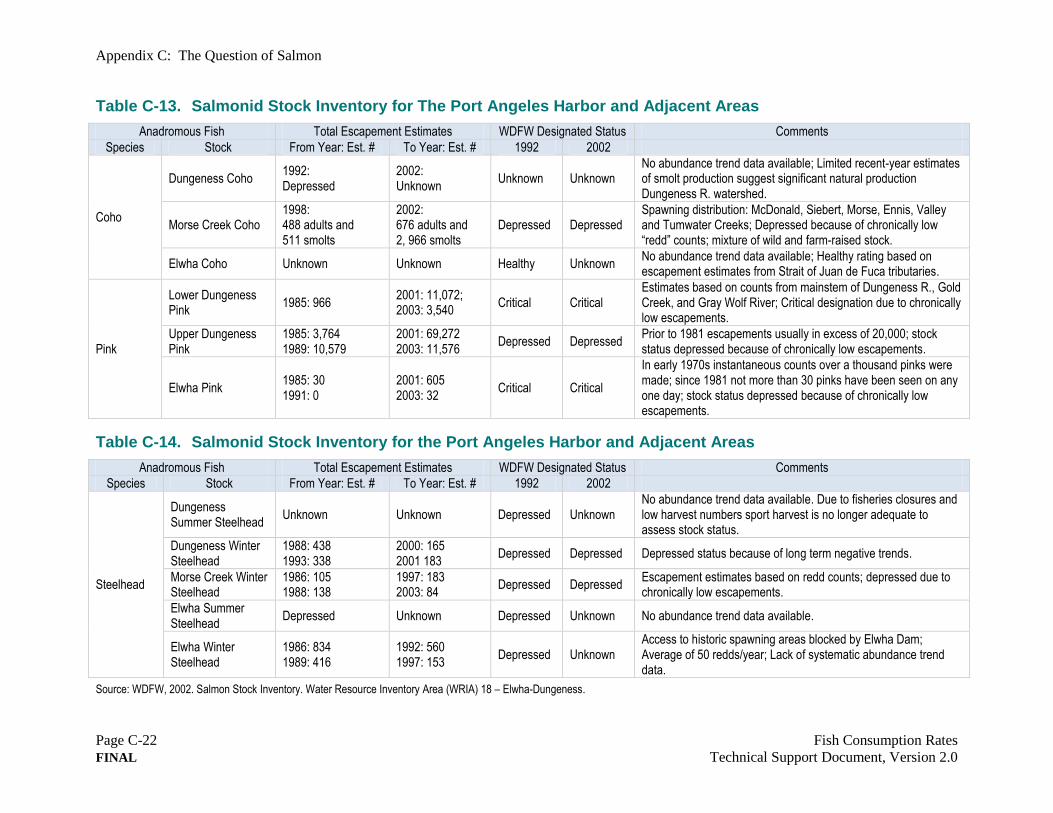
Appendix C: The Question of Salmon
Page C-22 Fish Consumption Rates
FINAL Technical Support Document, Version 2.0
Table C-13. Salmonid Stock Inventory for The Port Angeles Harbor and Adjacent Areas
Anadromous Fish Total Escapement Estimates WDFW Designated Status Comments
Species Stock From Year: Est. # To Year: Est. # 1992 2002
Coho
Dungeness Coho 1992: Depressed
2002: Unknown
Unknown Unknown No abundance trend data available; Limited recent-year estimates of smolt production suggest significant natural production Dungeness R. watershed.
Morse Creek Coho 1998: 488 adults and 511 smolts
2002: 676 adults and 2, 966 smolts
Depressed Depressed Spawning distribution: McDonald, Siebert, Morse, Ennis, Valley and Tumwater Creeks; Depressed because of chronically low “redd” counts; mixture of wild and farm-raised stock.
Elwha Coho Unknown Unknown Healthy Unknown No abundance trend data available; Healthy rating based on escapement estimates from Strait of Juan de Fuca tributaries.
Pink
Lower Dungeness Pink
1985: 966 2001: 11,072; 2003: 3,540
Critical Critical Estimates based on counts from mainstem of Dungeness R., Gold Creek, and Gray Wolf River; Critical designation due to chronically low escapements.
Upper Dungeness Pink
1985: 3,764 1989: 10,579
2001: 69,272 2003: 11,576
Depressed Depressed Prior to 1981 escapements usually in excess of 20,000; stock status depressed because of chronically low escapements.
Elwha Pink 1985: 30 1991: 0
2001: 605 2003: 32
Critical Critical
In early 1970s instantaneous counts over a thousand pinks were made; since 1981 not more than 30 pinks have been seen on any one day; stock status depressed because of chronically low escapements.
Table C-14. Salmonid Stock Inventory for the Port Angeles Harbor and Adjacent Areas
Anadromous Fish Total Escapement Estimates WDFW Designated Status Comments
Species Stock From Year: Est. # To Year: Est. # 1992 2002
Steelhead
Dungeness Summer Steelhead
Unknown Unknown Depressed Unknown No abundance trend data available. Due to fisheries closures and low harvest numbers sport harvest is no longer adequate to assess stock status.
Dungeness Winter Steelhead
1988: 438 1993: 338
2000: 165 2001 183
Depressed Depressed Depressed status because of long term negative trends.
Morse Creek Winter Steelhead
1986: 105 1988: 138
1997: 183 2003: 84
Depressed Depressed Escapement estimates based on redd counts; depressed due to chronically low escapements.
Elwha Summer Steelhead
Depressed Unknown Depressed Unknown No abundance trend data available.
Elwha Winter Steelhead
1986: 834 1989: 416
1992: 560 1997: 153
Depressed Unknown Access to historic spawning areas blocked by Elwha Dam; Average of 50 redds/year; Lack of systematic abundance trend data.
Source: WDFW, 2002. Salmon Stock Inventory. Water Resource Inventory Area (WRIA) 18 – Elwha-Dungeness.
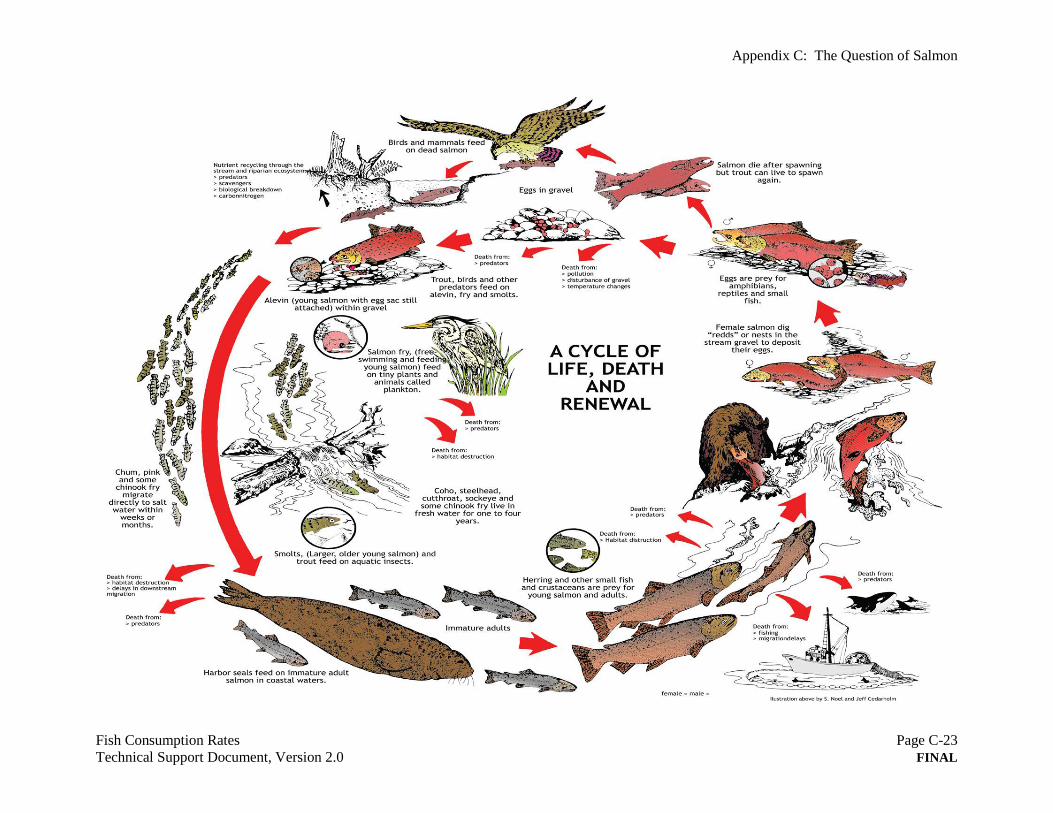
Appendix C: The Question of Salmon
Fish Consumption Rates Page C-23
Technical Support Document, Version 2.0 FINAL
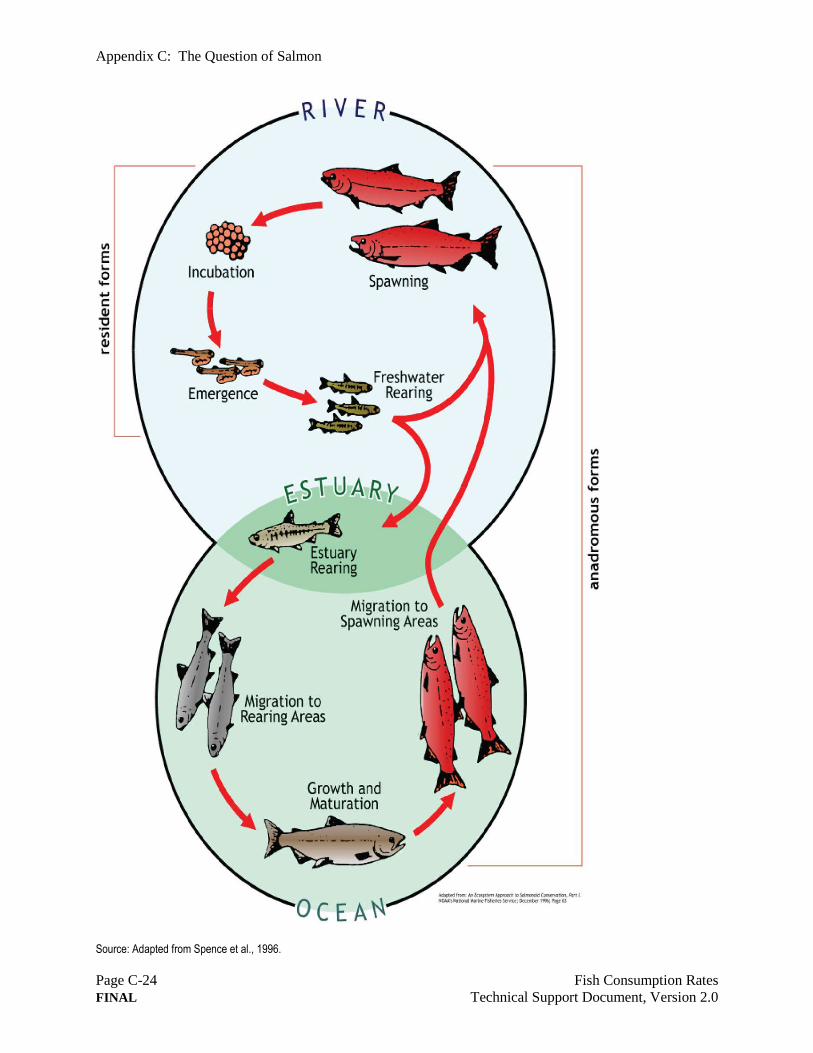
Appendix C: The Question of Salmon
Page C-24 Fish Consumption Rates
FINAL Technical Support Document, Version 2.0
Source: Adapted from Spence et al., 1996.
Appendix D: Glossary
Fish Consumption Rates Page D-1
Technical Support Document, Version 2.0 FINAL
Appendix D Glossary
Anadromous fish: fish that hatch in freshwater, spend a portion of their life maturing in
saltwater, then return to freshwater habitats to spawn.
Angler: one who fishes with hook and line, sometimes used to denote “fishers.”
Aquatic: from or living in a water body, including both marine and freshwater.
Bottomfish: fish that include Pacific cod, Pacific tomcod, Pacific hake, walleye Pollock, all
species of dabs, sole and founders (except Pacific halibut), lingcod and all other species of
greenling, ratfish, sablefish, cabezon, buffalo sculpin, great sculpin, red Irish lord, brown Irish
lord, Pacific staghorn sculpin, wolf-eel, giant wry mouth, plainfin midshipman, spiny dogfish,
six gill shark, soupfin shark and all other species of shark, and all species of skate, rockfish,
rattails and surfperches except shiner perch.
Coastal waters: a term that refers to waters having a coastline that forms the boundary between
land and freshwaters and marine and/or estuarine waters. This term encompasses all freshwaters
of statewide significance (lakes, rivers, streams, etc.) and those marine and/or estuarine waters
extending from the landward edge of a barrier beach or shoreline of coastal bay to the outer
extent of the Continental Shelf.
Commercial fishers: those individuals who harvest finfish and/or shellfish by any method from
Washington State waters (marine, estuarine, and freshwaters) for economic gain as a livelihood.
Creel survey: on-site interview with fishers to obtain information such as species caught;
number, length, and weight of catch; location; etc.; typically for use by fisheries managers; may
or may not include information on consumption.
Demersal fish: fish that dwell at or near the bottom of a body of water.
Estuarine: from an estuary, i.e., a partly enclosed water body, such as an inlet of the ocean or
the mouth of a river where it meets the ocean that contains brackish water (a mixture of salty and
freshwater) such as Elliott Bay in Seattle, Washington.
Finfish: fish; a term that is usually applied to the consumption of true fish as opposed to
shellfish.
Appendix D: Glossary
Page D-2 Fish Consumption Rates
FINAL Technical Support Document, Version 2.0
Fish: any of various aquatic animals (belonging to the subphylum Vertebrata) having gills,
commonly fins, and bodies usually but not always covered by scales, including those having
bony skeletons (bony fishes) and more primitive forms with cartilaginous skeletons (lampreys;
hagfishes; and sharks, skates, and rays).
Fish consumers: those individuals who consume finfish and/or shellfish; synonymous with
Washington State fish-consuming populations.
Fisher: one who fishes for any type of seafood by any method, inclusive of hook and line and
other methods of catching seafood.
Freshwater: water bodies including lakes, ponds, rivers, and streams that contain water with
relatively low salinity, i.e., less that 0.5 parts per trillion; species inhabiting freshwater bodies.
Game fish: sport fish that are caught for food.
Indian (Native American) Reservation: land set aside by the federal government for the use,
possession, and benefit of a Native American tribe or group of Indians; created by some formal
legal directive such as a treaty, statute passed by Congress or an executive Presidential order.
Marine: from, or living in, the ocean; saltwater, with a salinity of approximately 35 parts per
trillion.
Native American: a member of the indigenous peoples of the Western Hemisphere. In this
technical support document the term “Indian” is used only with reference to the name of a
specific Native American tribe.
Noncommercial fisher: one who fishes for recreation and/or home consumption; synonymous
with recreational fisher, sport fisher.
Pelagic fish: fish that live near the surface or in the water column of coastal, oceanic, and lake
waters.
Reasonable maximum exposure (RME):
The MTCA definition of RME (WAC 173-340-200) is as follows:
Reasonable maximum exposure means the highest exposure that can be reasonably
expected to occur for a human or other living organisms at a site under current and
potential future site use.
Appendix D: Glossary
Fish Consumption Rates Page D-3
Technical Support Document, Version 2.0 FINAL
The EPA definition of RME is as follows:
Actions at Superfund sites should be based on an estimate of the reasonable maximum
exposure (RME) expected to occur under both current and future land-use conditions.
The reasonable maximum exposure is defined here as the highest exposure that is
reasonably expected to occur at a site. RMEs are estimated for individual pathways (U.S.
EPA, 1989b, page 6-4 to 6-5).
The worst-case exposure represents an extreme set of exposure conditions, usually not
observed in an actual population, which is the maximum possible exposure where everything
that can plausibly happen to maximize exposure happens (U.S. EPA Guidelines for Exposure
Assessment, Federal Register Notice, Vol. 57, No. 104, May 1992, pages 22888-22938).
The preamble to the National Contingency Plan further indicates that the RME will:
…result in an overall exposure estimate that is conservative but within a realistic range
of exposure. Under this policy, EPA defines “reasonable maximum” such that only
potential exposures that are likely to occur will be included in the assessment of
exposures. The Superfund program has always designed its remedies to be protective of
all individuals and environmental receptors that may be exposed at a site; consequently,
EPA believes it is important to include all reasonably expected exposures in its risk
assessments…
Recall bias: Dietary recall surveys may cover specific periods of time or seasons; short term
recall surveys may cover a 24-hour food recall to obtain information on the diet of an individual
in the prior 24 hours. Dietary surveys that rely on an individual’s recall of their diet may undergo
some recall errors that introduce an element of bias in the dietary estimates. These recall errors
may result in either overestimation or underestimation of fish consumption. Factors that
contribute to recall error and bias include how commonly or frequently the food (fish) is
consumed, time frames covered by the survey that contribute to seasonal variation in food
consumption, survey methods used including provisions to enhance dietary memory or recall
(food models), and the desirability or cultural influences on the food consumed. Generally, recall
error increases as the length of the recall period increases, with recall periods of 1 year likely to
result in the least reliable estimates of consumption. The optimal recall period will be long
enough to accurately portray typical dietary (fish consumption) habits and patterns without
impairing the ability of respondents to recall their dietary (fish) consumption (Chu et al., 1992).
Recreational fisher: one who fishes primarily for recreational purposes; recreational catch is
used primarily for home consumption; synonymous with noncommercial fisher, sport fisher.
Seafood: aquatic organisms that are consumed, including mainly finfish and shellfish, and less
frequently, other invertebrate animals or plants or marine mammals.
Appendix D: Glossary
Page D-4 Fish Consumption Rates
FINAL Technical Support Document, Version 2.0
Shellfish: aquatic invertebrate animals having a shell or exoskeleton, the term usually used in
the context of food, including species belonging to the following taxa (some of which have
evolved such that the shell has become internal and/or reduced, or has disappeared entirely): (1)
mollusks, including bivalves (e.g., clams, oysters, mussels, scallops), gastropods (e.g., snails,
limpets, abalone), and cephalopods (e.g., squid, octopods); (2) crustaceans (e.g., crabs, shrimps,
lobsters); and (3) echinoderms (e.g., sea urchins, sea cucumbers).
Sport fish: fish that are caught by a sport fisher as opposed to purchased or caught
commercially, synonymous with sport-caught, recreationally caught, and noncommercial fish.
Sport fishers: those individuals who harvest finfish and/or shellfish by any method from
Washington State waters (marine, estuarine, and freshwaters) for recreation; synonymous with
recreational fisher or noncommercial fisher.
Subsistence: Although no single universally accepted definition is available to define what is
meant by subsistence or subsistence-based populations, several definitions of subsistence fishers
may apply to Washington State ethnic groups and/or fish-consuming populations. It is difficult to
define and to quantify subsistence fishers. Definitions and perceptions of what constitute
subsistence fishers and fishing may vary among regions and cultures. The 1994 Presidential
Executive Order 12898, Section 4-4. Subsistence Consumption of Fish and Wildlife noted
differential patterns of subsistence consumption of fish and wildlife for populations who
principally rely on fish and/or wildlife for subsistence.56
Differential patterns of subsistence
consumption of fish and wildlife relates to subsistence and differential patterns of subsistence,
and means differences in rates and/or patterns of fish, water, vegetation and/or wildlife
consumption among minority populations, low-income populations, or Native American tribes, as
compared to the general populations. As a response to Executive Order 12898, the 1999 National
Academy of Sciences publication noted the following (Institute of Medicine, 1999, p. 17):
… differences in behavior, employment, and lifestyles among subgroups in the
population may result in differences in exposure. For example, among the Alutiiq, Yup’ik,
and Inupiat Alaskan Native peoples, the yearly intake of wild foods per person is between
171 and 272 kilograms (375 and 600 pounds). Increasing evidence of certain
contaminants such as mercury in the wild food supply of these Alaskan Natives has been
exhibited by methyl mercury levels that exceed those provisionally established as safe by
the World Health Organization.
56 Presidential Executive Order 12898: Federal Actions To Address Environmental Justice In Minority Populations and Low-Income Populations. Signed by President William J. Clinton, February 11, 1994 web location: http://www.epa.gov/region2/ej/exec_order_12898.pdf
Appendix D: Glossary
Fish Consumption Rates Page D-5
Technical Support Document, Version 2.0 FINAL
Tribal subsistence exposure scenario and fishers: “Subsistence” refers to the hunting, fishing,
and gathering activities that are fundamental to the way of life of many indigenous peoples
(Confederated Tribes of the Umatilla Indian Reservation, 2004, p. 4). Subsistence utilizes
traditional, small-scale technologies for harvesting and preserving foods as well as for
distributing the produce through communal networks of sharing and bartering. Because it often
misinterpreted, an explanation of “subsistence” is taken from the National Park Service
(Confederated Tribes of the Umatilla Indian Reservation, 2004):
While non-natives tend to define subsistence in terms of poverty or the minimum amount
of food necessary to support life, native people equate subsistence with their culture.
Among many tribes, maintaining a subsistence lifestyle has become the symbol of their
survival in the face of mounting political and economic pressures. It defines who they are
as a people. To Native Americans who continue to depend on natural resources,
subsistence is more than eking out a living. While it is important to the economic well-
being of their communities, the subsistence lifestyle is also the basis of cultural existence
and survival. It is a communal activity. It unifies communities as cohesive functional
units through collective production and distribution of the harvest. Some groups have
formalized patterns of sharing, while others do so in more informal ways. Entire families
participate, including elders, who assist with less physically demanding tasks. Parents
teach the young to hunt, fish, and farm. Food and goods are also distributed through
native cultural institutions. Most require young hunters to distribute their first catch
throughout the community. Subsistence embodies cultural values that recognize both the
social obligation to share as well as the special spiritual relationship to the land and
resources. This relationship is portrayed in native art and in many ceremonies held
throughout the year.57
The average subsistence adult fish consumption rate is 620 g/day (500 pounds/year) for the
Confederated Tribes of the Umatilla Indian Reservation.58
Usual and Accustomed Fishing Areas: also referred to as U & A areas or U & A fishing areas.
The term refers to the 1854 and 1855 negotiated treaties with the Pacific Northwest Native
Americans in Washington state: “The right of taking fish at usual and accustomed grounds and
stations is further secured to said Indian in common with all citizens of the Territory…”
57 National Park Service. Archeology Program. Preservation On the Reservation [And Beyond] Web location: http://www.nps.gov/archeology/cg/fa_1999/Subsist.htm
58 Traditional Tribal Subsistence Exposure Scenario and Risk Assessment Guidance Manual. August 2007. Appendix 3: Fish Consumption Rate. Web location: http://www.hhs.oregonstate.edu/ph/tribal-grant-main-page2

Appendix D: Glossary
Page D-6 Fish Consumption Rates
FINAL Technical Support Document, Version 2.0
This page purposely left blank for duplicate printing.
Appendix E: References
Fish Consumption Rates Page E-1
Technical Support Document, Version 2.0 FINAL
Appendix E References
Anderson, S.A. (ed.). 1988. Estimation of exposure to substances in the food supply. Life
Sciences Research Office. Bethesda MD. Report No. PB-205199.
ATSDR (Agency for Toxic Substances and Disease Registry). 2009. Health Consultation. Naval
Base Kitsap, Keyport, Health Consultation, EPA Facility No. WA1170023419.
September 15, 2009.
Ay, O., M. Kalay, L. Tamer, and M. Canli. 1999. Copper and lead accumulation in tissues of a
freshwater fish Tilapia zillii and its effects on the branchial Na, K-ATPase activity.
Bulletin of Environmental Contamination & Toxicology, 62: 160–168.
CalEPA. 2001. Chemicals in Fish: Consumption of Fish and Shellfish in California and the
United States. Final Report. Pesticide and Environmental Toxicology Section, Office of
Environmental Health Hazard Assessment, California Environmental Protection Agency.
October 2001.
CalEPA. 2006. Evaluation of Bioaccumulation Factors and Translators for Methylmercury.
Office of Environmental Health Hazard Assessment. California Environmental Protection
Agency. March 2006. Web Location:
http://oehha.ca.gov/fish/special_reports/pdf/BAF020907.pdf
CalEPA. 2008. Development of Fish Contaminant Goals and Advisory Tissue Levels for
Common Contaminants in California Sport Fish: Chlordane, DDTs, Dieldrin,
Methylmercury, PCBs, Selenium and Toxaphene. Office of Environmental Health
Hazard Assessment, California Environmental Protection Agency. June 2008.
Charron, B. 2004. An IntraFish.com Industry Report on Salmon Product Development-The Fish
of the Future and Fisheries Global Information System of the Food and Agriculture
Organization of the United Nations.
Chu, A., D. Eisenhower, M. Hay, D. Morganstein, J. Neter, and J. Waksberg. 1992. Measuring
the recall error in self-reported fishing and hunting activities. Journal of Official Statistics
8(1):19-39.
Cleland, B., A. Tsuchiya, D.A. Kalman, R. Dills, T.M. Burbacher, J. White, E.M. Faustman, and
K. Mariën. 2009. Arsenic exposure within the Korean community (United States) based
on dietary behavior and arsenic levels in hair, urine, air, and water. Environmental Health
Perspectives, Volume 117, No. 4, April 2009, pp. 632-638.
Appendix E: References
Page E-2 Fish Consumption Rates
FINAL Technical Support Document, Version 2.0
CRITFC (Columbia River Inter-Tribal Fish Commission). 1994. A Fish Consumption Survey of
the Umatilla, Nez Perce, Yakama, and Warm Springs Tribes of the Columbia River
Basin. Technical Report 94-3. Portland, Oregon. 1994.
CRITFC. 2012. Columbia River Inter-Tribal Fish Commission Correspondence From Babtist
Paul Lumley, Executive Director of Columbia River Inter-Tribal Fish Commission, to
Ted Sturdevant, Director, Washington Department of Ecology, Dated March 19, 2012.
Confederated Tribes of the Colville Reservation and U.S. EPA Region 10. 2012. Food
Questionnaire Data Report, Upper Columbia River Resources Survey, June 12, 2012
Appended to Upper Columbia River Site Remedial Investigation and Feasibility Study
Tribal Consumption and Resource Use Survey. Final Report. June 22, 2012.
Confederated Tribes of the Umatilla Indian Reservation. 2004. Exposure Scenario for CTUIR
Traditional Subsistence Lifeways. Confederated Tribes of the Umatilla Indian
Reservation. Department of Science & Engineering. Stuart Harris, Director. September
15, 2004. Quoted from p. 4. Web location:
http://www.hhs.oregonstate.edu/ph/sites/default/files/CTUIR-SCENARIO.pdf
Conservation Foundation, 1984. State of the Environment: An Assessment at Mid-Decade.
Washington D.C.
Donatuto, J. and B.L. Harper. 2008. Issues in evaluating fish consumption rates for Native
American tribes. Perspective. Risk Analysis, Vol. 28, No. 6, 2008, pp. 1497–1506.
Duncan, S. 2008. S. Duncan (Washington Department of Fish and Wildlife), personal
communication with Craig McCormack (Washington State Department of Ecology), Re:
bull trout and Dolly Varden. May 16, 2008.
Ebert, E.S., P. Price, and R.E. Keenan. 1994. Selection of fish consumption estimates for use in
the regulatory process. Journal of Exposure Analysis and Environmental Epidemiology
4:373-393.
Ecology (Washington State Department of Ecology). 1999. DRAFT: Analysis and Selection of
Fish Consumption Rates for Washington State Risk Assessments and Risk-Based
Standards. By Leslie Kiell and Lon Kissinger. March 1999. Pub. No. 99-200.
Ecology. 2007a. Draft Remedial Investigation for Port Gamble Bay. Department of Ecology,
Sediments Unit. June 2010.
Ecology. 2007b. Puget Sound Update, Pub. No. PSAT 07-02.
Ecology. 2011a. Port Gamble Bay Wide Remedial Investigation. Washington State Department
of Ecology, Toxics Cleanup Program. February 2011.
Appendix E: References
Fish Consumption Rates Page E-3
Technical Support Document, Version 2.0 FINAL
Ecology. 2011b. Port Angeles Harbor Marine Environment. Human Health and Ecological Risk
Assessment. Public Review DRAFT. March 2011.
Ecology. 2012. Supplemental Information to Support the Fish Consumption Rates Technical
Support Document (Pub. No. 12-09-058). Washington State Department of Ecology,
Olympia, WA. July 20, 2012.
Efron, B. 1982. The Jackknife, the Bootstrap and Other Resampling Plans. Philadelphia,
Pennsylvania: Society for Industrial and Applied Mathematics.
Ewald, G., P. Larsson, H. Linge, L. Okla, and N. Szarzi. 1998. Biotransport of organic pollutants
to an inland Alaska lake by migrating sockeye salmon (Oncorhynchus nerka). Arctic,
Volume 51, No. 1, pp. 40–47. March 1998.
Fall, J.A., and C.J. Utermohle, compilers. 1999. Subsistence Service Update: Subsistence
Harvests and Uses in Eight Communities Ten Years after the Exxon Valdez Oil Spill.
Exxon Valdez Oil Spill Restoration Project Final Report (Restoration Project 99471).
Technical Paper No. 252. Alaska Department of Fish and Game, Division of Subsistence.
http://www.subsistence.adfg.state.ak.us/TechPap/tp252.pdf
Finkel, A. 1989. Is risk assessment really too conservative? Revising the revisionists. Columbia
Journal of Environmental Law 14(2): 427-467.
Governor’s Office of Indian Affairs, 2010. July 2010 access to web link: Tribal Map at the
following link: http://www.goia.wa.gov/tribal_gov/documents/WAStateTribalMap.pdf
and Governors Office of Indian Affairs at: http://www.goia.wa.gov/.
Governor’s Salmon Recovery Office. 1999. Summary Statewide Strategy to Recovery Salmon.
Extinction Is Not An Option. September 1999, pp. II.9 – II.10.
Hanson, B., A. Sugden, and B. Alberts. 2011. Making data maximally available. Science.
331(6018): 649.
Harper, B.L., B. Flett, S. Harris, C. Abeyta, and F. Kirschner. 2002. The Spokane Tribe’s
Multipathway Subsistence Exposure Scenario and Screening Level RME. Risk Analysis,
Vol 22, No. 3, 2002, pp. 513–526.
Harper, B.L., A.K. Harding, T. Waterhouse, and S. Harris. 2007. Traditional tribal subsistence
exposure scenario and risk assessment guidance manual. Oregon State University
Department of Public Health, Confederated Tribes of the Umatilla Indian Reservation;
Oregon State University Departments of Public Health and Nutrition and Exercise
Sciences, August 2007.
Appendix E: References
Page E-4 Fish Consumption Rates
FINAL Technical Support Document, Version 2.0
Harper, B.L. and S. Harris. 2008. A possible approach for setting a mercury risk-based action
level based on tribal fish ingestion rates. Environmental Research, 107 (2008) 60-68.
May 2008.
Harris, S.G. and B.L. Harper. 1997. A Native American exposure scenario. Risk Analysis, Vol.
17, No. 6. pp. 789–795.
Harris, S.G. and B.L. Harper. 2001. Lifestyles, diets, and Native American exposure factors
related to possible lead exposures and toxicity. Environmental Research Section A, 86.
pp. 140–148.
Helsel, D.R. and Hirsch, R.M. Chapter A3: Statistical Methods in Water Resources. Techniques
of Water-Resources Investigations of the United States Geological Survey. Book 4,
Hydrologic Analysis and Interpretation. September 2002.
Hites, R.A., J.A. Foran, D.O. Carpenter, C.M. Hamilton, B.A. Knuth, S.J. Schwager. 2004.
Global assessment of organic contaminants in farmed salmon. Science 09 January 2004,
Vol 303, pp. 226–229.
Hugo, Victor, and Lorenzo O’Rourke (trans.) Victor Hugo's Intellectual Autobiography:
(Postscriptum de ma vie) (1907), 237.
Institute for Health and the Environment. University at Albany. General Information about
World Salmon Production and Consumption. Web location:
http://www.albany.edu/ihe/salmonstudy/background.html
Institute of Medicine. 1999. Toward Environmental Justice. Research, Education, and Health
Policy Needs. Institute of Medicine, National Academy of Sciences, Washington, DC,
p. 17.
Johnson L.L., G.M. Ylitalo, C.A. Sloan, B.F. Anulacion, A.N. Kagley, M.R. Arkoosh, T.A.
Lundrigan, K. Larson, M. Siipola, and T.K. Collier. 2007. Persistent organic pollutants in
outmigrant juvenile Chinook salmon from the Lower Columbia Estuary, USA. Science of
the Total Environment 374, pp. 342–366.
Kelly, B.C., S.L. Gray, M.G. Ikonomou. 2007. Lipid reserve dynamics and magnification of
persistent organic pollutants in spawning sockeye salmon (Oncorhynchus nerka) from the
Fraser River, British Columbia. Environmental Science and Technology, Vol. 41, No 9,
pp. 3083–3089.
Appendix E: References
Fish Consumption Rates Page E-5
Technical Support Document, Version 2.0 FINAL
Kissinger, L. 2005. Application of data from an Asian and Pacific Islander (API) seafood
consumption study to derive fish and shellfish consumption rates for risk assessment.
Office of Environmental Assessment, U.S. Environmental Protection Agency Region 10,
Seattle, WA.
Kraig, E. and S. Smith. 2008. Washington State Sport Catch Report 2002. Washington
Department of Fish and Wildlife, Fish Program Science Division, April 2008.
Lambe, J. 2002. The use of food consumption data in assessments of exposure to food chemicals
including the application of probabilistic modeling. Proceedings of the Nutrition Society
(2002), 61:11-18.
Landolt, M.L., Hafer, F.R., Nevissi, A., Van Belle, G., Van Ness, K., and Rockwell, C. 1985. Potential
toxicant exposure among consumers of recreationally caught fish from urban embayments of
Puget Sound. NOAA Technical Memorandum NOS OMA 23. November 1985.
Landolt, M.L., Kalman, D.L., Nevissi, A., Van Belle, G., Van Ness, K., and Hafer, F.R. 1987.
Potential toxicant exposure among consumers of recreationally caught fish from urban
embayments of Puget Sound. NOAA Technical Memorandum NOS OMA 33. As cited in
Tetra Tech 1988.
Lichatowich, J. 1999. Salmon Without Rivers, A History of the Pacific Salmon Crisis by Jim
Lichatowich. Island Press, 1999.
Lower Elwha Klallam Tribe. 2007. Local Seafood and Lower Elwha Klallam Tribal Health, May
30, 2007.
Lower Elwha Klallam Tribe. 2008. Lower Elwha Klallam Tribe Fish Consumption Rate,
Additional Data, February 10, 2008.
Lummi Natural Resources Department. 2012. Lummi Nation Seafood Consumption Study.
Prepared for Lummi Indian Business Council by Water Resources Division, Lummi
Natural Resources Department. August 31, 2012.
Manning, T., and S. Smith. 2005. Washington State Sport Catch Report 2001. Washington
Department of Fish and Wildlife, Fish Program Science Division, May.
Mayfield, D.B., Robinson, S., and Simmonds, J. 2007. Survey of fish consumption patterns of
King County (Washington) recreational anglers. Journal of Exposure Analysis and
Environmental Epidemiology, 17:604-612.
Appendix E: References
Page E-6 Fish Consumption Rates
FINAL Technical Support Document, Version 2.0
McCallum, M. 1985. Recreational and subsistence catch and consumption of seafood from three
urban industrial bays of Puget Sound: Port Gardner, Elliott Bay and Sinclair Inlet.
Washington State Division of Health, Epidemiology Section. January 1985.
Missildine B.R., R.J. Peters, G. Chin-Leo, and D. Houck. 2005. Polychlorinated biphenyl
concentrations in adult Chinook salmon (Oncorhynchus tshawytscha) Returning to
coastal and Puget Sound hatcheries of Washington State. Environmental Science &
Technology, Vol. 39, No. 18, 2005, pp. 6944–6951.
Morgan, J.N., M.R. Berry, and R.L. Graves. 1997. Effects of commonly used cooking practices
on total mercury concentration in fish and their impact on exposure assessments. Journal
of Exposure Analysis and Environmental Epidemiology, 7: 119–133.
Moya, J. 2004. Overview of fish consumption rates in the United States. Human and Ecological
Risk Assessment, 10: 1195-1211.
Moya, J. 2011. Jacqueline Moya (U.S. Environmental Protection Agency), personal
communication with Craig McCormack (Washington State Department of Ecology), Re:
Percentage of U.S. general population who are fish consumers. April 11, 2011.
Moya, J., C. Itkin, S.G. Selevan, J.W. Rogers, and R.P. Clinckner. 2008. Estimates of fish
consumption rates for consumers of bought and self-caught fish in Connecticut, Florida,
Minnesota, and North Dakota. Science of the Total Environment. 403 (2008) 89-98.
National Park Service. Archeology Program. Preservation On the Reservation [And Beyond]
Web location: http://www.nps.gov/archeology/cg/fa_1999/Subsist.htm
National Research Council. 1994. Science and Judgment in Risk Assessment. Committee on Risk
Assessment of Hazardous Air Pollutants. Board on Environmental Studies and
Toxicology. Commission on Life Sciences. National Academy Press. Washington, D.C.
National Research Council. 1996. Upstream. Salmon and Society in the Pacific Northwest. Board
on Environmental Studies and Toxicology, Committee on Protection and Management of
Pacific Northwest Anadromous Salmonids, Commission on Life Sciences. National
Academy of Sciences.
National Research Council. 2009. Science and Decisions: Advancing Risk Assessment.
Committee on Improving Risk Analysis Approaches Used by the U.S. EPA. National
Academy Press. Washington D.C.
Appendix E: References
Fish Consumption Rates Page E-7
Technical Support Document, Version 2.0 FINAL
Naval Facilities Engineering Command Northwest. 2010. Technical Memorandum: Human
Health Risk Evaluation of Mercury in Sinclair Inlet Seafood, OU B Marine. Bremerton
Naval Complex. Department of the Navy, Naval Facilities Engineering Command
Northwest. Final 12 August 2010.
Niedoroda, A.W., D.J.P. Swift, C.W. Reed, and J.K. Stull. 1996. Contaminant dispersal on the
Palos Verdes continental margin: III. Processes controlling transport, accumulation and
re-emergence of DDT-contaminated sediment particles. The Science of the Total
Environment 179 (1996) pp. 109–133.
O’Neill, C.A. 2000. Variable Justice: Environmental Standards, Contaminated Fish, and
“Acceptable” Risk to Native Peoples. Stanford Environmental Law Journal, Volume 19,
Number 1, January 2000, pp. 3–118.5.
O’Neill, S.M., J.E. West, and J.C. Hoeman. 1998. Spatial Trends in the Concentration of
Polychlorinated Biphenyls (PCBs) in Chinook (Oncorhynchus tshawytscha) and Coho
Salmon (O. kisutch) in Puget Sound and Factors Affecting PCB Accumulation: Results
from the Puget Sound Ambient Monitoring Program. Published in Puget Sound Research
’98 Proceedings, Seattle, Washington, Volume 1, pp. 312–328.
O’Neill S.M., G.M. Ylitalo, J.E. West., J. Bolton, C.A. Sloan, and M.M. Krahn. 2006. Regional
patterns of persistent organic pollutants in five Pacific salmon species (Oncorhynchus
spp) and their contributions to contaminant levels in northern and southern resident killer
whales (Orcinus orca). Extended Abstract in 2006 Southern Resident Killer Whale
Symposium. April 3–5, 2006.
Oregon DEQ (Oregon Department of Environmental Quality). 1999. Guidance for Use of
Probabilistic Analysis in Human Health Risk Assessments (Interim final) Portland, OR.
[Note: Guidance was published in January 1998 with updates in November 1998 and
March 1999.]
Oregon DEQ. 2008. Human Health Focus Group Report Oregon Fish and Shellfish Consumption
Rate Project. Adapted from Table 3, p. 28 of the DEQ Water Quality Division. June 2008.
O’Toole, S., C. Metcalfe, I. Craine, and M. Gross. 2006. Release of persistent organic
contaminants from carcasses of Lake Ontario Chinook salmon (Oncorhynchus
tshawytscha). Environmental Pollution 140 (2006) pp. 102–113.
Parametrix. 2003. Results of a human use survey for shoreline areas of Lake Union, Lake
Washington, and Lake Sammamish. Sammamish-Washington Analysis and Modeling
Program (SWAMP). Prepared for King County Department of Natural Resources.
September 2003.
Appendix E: References
Page E-8 Fish Consumption Rates
FINAL Technical Support Document, Version 2.0
Pierce, D., Noviello, D.T., and Rogers, S.H. 1981. Commencement Bay seafood consumption
study. Preliminary Report. Tacoma-Pierce County Health Department, Tacoma,
Washington. December 1981.
Polissar, N.L., M. Neradilek, A.Y. Aravkin, P. Danahar, and J. Kalat. 2012. Statistical Analysis
of National and Washington State Fish Consumption Data. Draft. Prepared for the
Washington State Department of Ecology by The Mountain-Whisper-Light Statistics,
Seattle, WA. July 22, 2012.
Price, P., Su, S., and Gray, M. 1994. The effects of sampling bias on estimates of angler
consumption rates in creel surveys. Journal of Exposure Analysis and Environmental
Epidemiology 4:355-371. As cited in USEPA 2011.
Puget Sound Action Team. 2007. Puget Sound Update. Ninth Report of the Puget Sound
Assessment and Monitoring Program. Publication No. PSAT 07-02. 2007.
Quinn, T.P. 2005. The Behavior and Ecology of Pacific Salmon & Trout. By Thomas P. Quinn,
American Fisheries Society in Association with University of Washington Press.
Robinson Research. 2007. Center for Justice, Spokane River Toxins Survey, Executive Summary
Report. Prepared by Robinson Research. January 29, 2007.
Sechena, R., C. Nakano, S. Liao, N. Polissar, R. Lorenzana, S. Truong, and R. Fenske. 1999.
Asian and Pacific Islander Seafood Consumption Study in King County, Washington.
EPA 910/R-99-003. May 1999.
http://www.epa.gov/region10/pdf/asian_pacific_islander_seafood_consumption_1999.pdf.
Sechena, R., S. Liao, R. Lorenzana, C. Nakano, N. Polissar, and R. Fenske. 2003. Asian
American and Pacific Islander seafood consumption – A community-based study in King
County, Washington. Journal of Exposure Analysis and Environmental Epidemiology.
(2003) 13, 256-266.
Sepez, J. 2001. Political and Social Ecology of Contemporary Makah Subsistence Hunting, Fish
and Shellfish Collecting Practices. Doctor of Philosophy Dissertation By Jennifer Sepez,
Department of Anthropology, University of Washington. 2001.
Sherer, R.A. and P.S. Price. 1993. The effect of cooking processes on PCB levels in edible fish
tissue. Quality Assurance: Good Practice, Regulation and Law, 2(4): 396–407.
Spence, B.C., G.A. Lomnicky, R.M. Hughes, and R.P. Novitzki. 1996. An Ecosystem Approach
to Salmonid Conservation, Part I. December. TR-4501-96-6057. ManTech
Environmental Research Services Corp., Corvallis, OR.
Appendix E: References
Fish Consumption Rates Page E-9
Technical Support Document, Version 2.0 FINAL
Spokane Regional Health District. 1998. 1998 Fish Consumption Survey, Spokane River,
Washington, Survey Report. Spokane Regional Health District, Assessment/Epidemiology
Center. November 1998.
State Water Resources Control Board of California. 2004.Development of Sediment Quality
Objectives for California Bays and Estuaries. Work Plan for: Using Biota-Sediment
Accumulation Models to Develop Sediment Chemistry Indicators. Revised October 18,
2004. Web Location:
http://www.swrcb.ca.gov/water_issues/programs/bptcp/docs/sqoindicator/bioaccumulatio
nsqo.pdf
Strauss, H. 2004. Sportsfish consumption surveys: A risk assessment practitioner’s wish list,
Human and Ecological Risk Assessment. 10: 6, 1213-1225. (2004).
Stull, J.K., D.J.P. Swift, and A.W. Niedoroda. 1996. Contaminant dispersal on the Palos Verdes
continental margin: I. Sediments and biota near a major California wastewater discharge.
The Science of the Total Environment 179 (1996) pp. 73–90.
Sun Rhodes, N.A. 2006. Fish Consumption, Nutrition, and Potential Exposure to Contaminants
Among Columbia River Basin Tribes. Master of Public Health Thesis. Department of
Public Health and Preventative Medicine. Oregon Health & Science University. April
2006.
Swift, D.J.P., J.K. Stull, A.W. Niedoroda, C.W. Reed, and G.T.F. Wong. 1996. Contaminant
dispersal on the Palos Verdes continental margin: II. Estimates of the biodiffusion
coefficient, DB, from composition of the benthic infaunal community. The Science of the
Total Environment 179 (1996) pp. 91–107.
Swinomish Tribe. 2006. Bioaccumulative Toxics in Subsistence-Harvested Shellfish –
Contaminant Results and Risk Assessment. Swinomish Tribe, Swinomish Tribal
Community. Swinomish Water Resources Program, Office of Planning & Community
Development. December 01, 2006.
Tetra Tech. 1988. Health Risk Assessment of Chemical Contamination in Puget Sound Seafood.
Puget Sound Estuary Program. TC-3338-28. Prepared for U.S. Environmental Protection
Agency, Region 10. Seattle, Washington. September 1988.
Teuten, E.L., S.J. Rowland, T.S. Galloway, and R.C. Thompson. 2007. Potential for plastics to
transport hydrophobic contaminants. Environmental Science and Technology, 2007, 41
(22) pp. 7759–7764.
The Suquamish Tribe. 2000. Fish Consumption Survey of the Suquamish Indian Tribe of the
Port Madison Indian Reservation. Puget Sound Region. August 2000.
Appendix E: References
Page E-10 Fish Consumption Rates
FINAL Technical Support Document, Version 2.0
Tooze, J.A., D. Midthune, K.W. Dodd, L.S. Freedman, S.M. Krebs-Smith, A.F. Subar, P.M.
Guenther, R.J. Carroll, and V. Kipnis. 2006. A new statistical method for estimating the
usual intake of episodically consumed foods with application to their distribution.
Journal of the American Dietetic Association 106:10, pp. 1575-1587.
Toy, K.A., N.L. Polissar, S. Liao, and G.D. Mittelstaedt. 1996. A Fish Consumption Survey of
the Tulalip and Squaxin Island Tribes of the Puget Sound Region. Tulalip Tribes,
Department of Environment, 7615 Totem Beach Road, Marysville, Washington 98271.
1996.
Tsuchiya, A., T.A. Hinners, T.M. Burbacher, E.M. Faustman and K. Mariën. 2008a. Mercury
exposure from fish consumption within the Japanese and Korean communities. Journal of
Toxicology and Environmental Health, Part A 71:1019-1031, 2008.
Tsuchiya, A., J. Hardy, T.M. Burbacher, E.M. Faustman, and K. Mariën. 2008b. Fish intake
guidelines: incorporating n-3 fatty acid intake and contaminant exposure in the Korean
and Japanese Communities. American Journal of Clinical Nutrition 87(6):1867-1875.
Tsuchiya, A., T.A. Hinners, F. Krogstad, J.W. White, T.M. Burbacher, E.M. Faustman, and K.
Mariën. 2009. Longitudinal mercury monitoring within the Japanese and Korean
communities (United States): Implications for exposure determination and public health
protection. Environmental Health Perspectives, Volume 117, No. 11, November 2009,
pp. 1760-1766.
University of Washington. 2012. University of Washington, School of Public Health
Correspondence From William Daniell, Associate Professor, to Craig McCormack,
Toxics Cleanup Program, Washington Department of Ecology, Dated March 20, 2012.
U.S. Census Bureau. 2000. Census 2000 Redistricting Data (Public Law 94-171) Summary file,
Table PL1, and 2010 Census Redistricting Data (Public Law 94-171) Summary file,
Table P1. Provided by Washington’s Office of Financial Management At
http://www.ofm.wa.gov/pop/census2010/data.asp.
U.S. Census Bureau. 2010. Census 2000 Redistricting Data (Public Law 94-171) Summary file,
Table PL1, and 2010 Census Redistricting Data (Public Law 94-171) Summary file,
Table P1. [Provided by Washington State’s Office of Financial Management At
http://www.ofm.wa.gov/pop/census2010/data.asp]
USDA (U.S. Department of Agriculture). Continuing Survey of Food Intakes by Individuals in
1994–96, and 1998 Children’s Supplement.
Appendix E: References
Fish Consumption Rates Page E-11
Technical Support Document, Version 2.0 FINAL
USDA. 2006. Fish and Shellfish Consumption data from National Marine Fisheries Service,
Salmon Consumption data from National Fisheries Institute. As cited in The U.S. and
World Situation: Salmon. U.S. Department of Agriculture, Foreign Agricultural Service,
Office of Global Analysis, Specialty Crops and Food Branch. Web location:
http://www.fas.usda.gov/ffpd/Newsroom/Salmon.pdf
U.S. Department of the Interior, Fish and Wildlife Service. 1994. Habitat Quality and Fish Usage
of Five Chehalis River Tributaries in the South Aberdeen-Cosmopolis Area. October 1994.
U.S. Department of the Interior, Fish and Wildlife Service, and U.S. Department of Commerce,
U.S. Census Bureau. 2008. 2006 National Survey of Fishing, Hunting, and Wildlife-
Associated Recreation – Washington. FHW/06-WA. Issued May 2008.
U.S. EPA. 1980. Seafood consumption data analysis. Stanford Research Institute International,
Menlo Park, California. Final report, Task 11, Contract No. 68-01-3887.
U.S. EPA. 1989a. Assessing Human Health Risks from Chemically Contaminated Fish and
Shellfish: A Guidance Manual. U.S. Environmental Protection Agency, Office of Marine
and Estuarine Protection. September 1989. EPA-503/8-89-002.
U.S. EPA. 1989b. Risk Assessment Guidance for Superfund, Volume I, Human Health
Evaluation Manual (Part A). Interim Final. EPA/540/1-89/002.
U.S. EPA (U.S. Environmental Protection Agency). 1992. Consumption Surveys for Fish and
Shellfish. A Review and Analysis of Survey Methods. U.S. Environmental Protection
Agency, Office of Water. February 1992. EPA 822/R-92-001.
U.S. EPA. 1998. Guidance for Conducting Fish and Wildlife Consumption Surveys. U.S.
Environmental Protection Agency, Office of Water. November 1998. EPA-823-B-98-007.
U.S. EPA. 2000a. Choosing a Percentile of Acute Dietary Exposure as a Threshold of
Regulatory Concern, Office of Pesticide Programs. March 16, 2000.
U.S. EPA. 2000b. Methodology for Deriving Ambient Water Quality Criteria for the Protection
of Human Health. Final methodology document (EPA-822-B-00-004). Volume 1: Risk
Assessment (EPA-822-B00-005). October 2000
http://water.epa.gov/scitech/swguidance/standards/criteria/health/methodology/index.cfm
U.S. EPA. 2000c. Bioaccumulation Testing and Interpretation for the Purpose of Sediment
Quality Assessment. Office of Water and Solid Waste EPA-823-R-00-001. February
2000. Web location: http://water.epa.gov/polwaste/sediments/cs/biotesting_index.cfm
Appendix E: References
Page E-12 Fish Consumption Rates
FINAL Technical Support Document, Version 2.0
U.S. EPA, 2000d. Guidance for Assessing Chemical Contaminant Data for use in Fish
Advisories, Vol. II: Risk Assessment and Fish Consumption Limits. Third Edition. Office
of Water. U.S. Environmental Protection Agency. Washington, DC: Document No. EPA
823-B-94-008. November 2000.
U.S. EPA. 2001. General Principles for Performing Aggregate Exposure and Risk Assessments,
Office of Pesticide Programs, November 28, 2001,
http://www.epa.gov/oppfead1/trac/science/aggregate.pdf.
U.S. EPA. 2002a. Estimated Per Capita Fish Consumption in the United States. EPA-821-C-02-
003. Table 4, Section 5.1.1.1. August 2002.
U.S. EPA. 2002b. Fish Consumption and Environmental Justice. A report developed from the
National Environmental Justice Advisory Council Meeting of December 3-6, 2002. A
Federal Advisory Committee to the U.S. Environmental Protection Agency. November
2002 (revised) p. 31.
U.S. EPA. 2004. An Examination of EPA Risk Assessment Principles and Practices. Office of
the Science Advisor, U.S. Environmental Protection Agency. EPA/100/B-04/0001. March
2004.
U.S. EPA. 2006. EPA Region 10, Statement of Basis for Remedy Selection and Corrective Action
Complete Without Controls Determination at Rhone-Poulenc, Inc., East Parcel, EPA ID
# WAD 00928 2302, Administrative Order of Consent 1091-11-20-3008(h), November
2006.
U.S. EPA. 2007a. Framework for Metals Risk Assessment. EPA 120/R-07/001. March 2007.
Web location: http://www.epa.gov/raf/metalsframework/pdfs/metals-risk-assessment-
final.pdf
U.S. EPA. 2007b. Region 10 Framework for Selecting and Using Tribal Fish and Shellfish
Consumption Rates for Risk-Based Decision Making at CERCLA and RCRA Cleanup
Sites in Puget Sound and the Strait of Georgia. August 2007. p. 6.
U.S. EPA. 2008. Child-Specific Exposure Factors Handbook. (Final Report) EPA/600/R-
06/096F. September 2008 http://cfpub.epa.gov/ncea/cfm/recordisplay.cfm?deid=199243.
U.S. EPA. 2009a. Exposure Factors Handbook: 2009 Update. EPA/600/R-09/052A. July 2009.
U.S. EPA. 2009b. Highlights of the Child-Specific Exposure Factors Handbook. EPA/600/R-
08/135. August 2009.
Appendix E: References
Fish Consumption Rates Page E-13
Technical Support Document, Version 2.0 FINAL
U.S. EPA. 2011a. Exposure Factors Handbook: 2011 Edition. National Center for
Environmental Assessment. Office of Research and Development. September 2011.
EPA/600/R-090/052F.
U.S. EPA. 2011b. Tribal Water Quality Standards in the Pacific Northwest and Alaska. U.S.
EPA Region 10 at: Accessed June 2011.
WDF et al. (Washington Department of Fisheries, Washington Department of Wildlife, and
Western Washington Treaty Indian Tribes). 1993. 1992 Washington State Salmon and
Steelhead Stock Inventory (SASSI). Washington Department of Fisheries, Olympia, WA.
March, 1993. 215 pp. http://wdfw.wa.gov/conservation/fisheries/sasi/
WDFW (Washington Department of Fish and Wildlife). 2002. Salmonid Stock Inventory (SaSI).
Introduction. web location:
http://wdfw.wa.gov/conservation/fisheries/sasi/sasi_2002_introduction.pdf.
WDFW. 2008a. Economic Analysis of the Non-Treaty Commercial and Recreational Fisheries in
Washington State. Final Report. December 2008. Web location:
http://wdfw.wa.gov/publications/00464/wdfw00464.pdf.
WDFW. 2008b. Hatchery Releases of Yearling Chinook into Puget Sound Brood Years 1993-
2005, WDFW spreadsheet and raw data query provided to S. Duncan by Jeffrey Haymes,
WDFW in e-mail correspondence dated 4/22/08.
WDFW. 2010. Where to Catch Fish In The Evergreen State. 2010 Washington Fishing
Prospects. Web location: http://wdfw.wa.gov/fishing/prospects/.
WDFW. 2012. Where to Catch Fish In The Evergreen State. 2012 Washington Fishing
Prospects. 2012. Web location: http://wdfw.wa.gov/publications/01375/wdfw01375.pdf.
Washington DOH (Washington Department of Health). 1997. Consumption Patterns of Anglers
Who Frequently Fish Lake Roosevelt. September 1997.
Washington DOH. 2001. Data Report Lake Whatcom Residential and Angler Fish Consumption
Survey. April 2001.
Washington DOH. 2004. Final Report, Evaluation of Contaminants in Fish from Lake
Washington, King County, Washington. September 2004.
Washington DOH. 2010. Health Consultation, Evaluation of Dioxins in Shellfish from the
Oakland Bay Site Shelton, Mason County, WA, July 27, 2010.
Appendix E: References
Page E-14 Fish Consumption Rates
FINAL Technical Support Document, Version 2.0
West, J.E., J. Lanksbury, and S.M. O’Neill. 2011a. Persistent Organic Pollutants in Marine
Plankton from Puget Sound. Washington Department of Ecology. Publication number 11-
10-002. March, 2011. Web location: http://www.ecy.wa.gov/biblio/1110002.html
West, J.E., J. Lanksbury, S.M. O’Neill, and A. Marshall. 2011b. Persistent Bioaccumulative and
Toxic Contaminants in Pelagic Marine Fish Species from Puget Sound. Washington
Department of Ecology. Publication number 11-10-003. March, 2011. Web location:
http://www.ecy.wa.gov/biblio/1110003.html
Windward Environmental. 2007. Lower Duwamish Waterway Remedial Investigation Report.
Appendix B: Baseline Human Health Risk Assessment. Final. Prepared for U.S.
Environmental Protection Agency Region 10 and Washington State Department of
Ecology. November 12, 2007.
Zeng, E.Y., and M.I. Venkatesan. 1999. Dispersion of sediment DDTs in the coastal ocean off
Southern California. The Science of the Total Environment, Volume 229, Issue 3, 19 May
1999, pp. 195–208.
Zeng, E.Y., D. Tsukada, D.W. Diehl, J. Peng, K. Schiff, J.A. Noblet, and K.A. Maruya. 2005.
Distribution and mass inventory of total dichlorodiphenyldicloroethylene in the water
column of the Southern California Bight. Environmental Science & Technology, 2005,
Volume 39, No. 21, pp. 8170–8176.