fish consumption advice for alaskans: a risk … consumption advice for alaskans a risk management...
TRANSCRIPT
Volume No. 11 Number 4 October 15, 2007
Local telephone number 907-269-8000 24 Hour Emergency 1-800-478-0084
3601 C Street, Suite 540 Anchorage, Alaska 99503 http://www.epi.alaska.gov
Editors: Joe McLaughlin, MD, MPH Bradford D. Gessner, MD, MPH
Division of Public Health Beverly Wooley, Director
Department of Health and Social Services Karleen Jackson, Commissioner Jay Butler, MD, Chief Medical Officer
Fish Consumption Advice for Alaskans:
A Risk Management Strategy
to Optimize the Public’s Health
Fish Consumption Advice for Alaskans:
A Risk Management Strategy to
Optimize the Public’s Health
Lori A. Verbrugge, Ph.D. on behalf of the
Alaska Scientific Advisory Committee for Fish Consumption
Section of Epidemiology Division of Public Health
Department of Health and Social Services State of Alaska
October 15, 2007
Acknowledgments: The Section of Epidemiology would like to thank the many individuals who assisted in the development of this report. We particularly wish to acknowledge the contributions of the Alaska Scientific Advisory Committee for Fish Consumption members Jim Berner, Jay Butler, Larry Duffy, Bob Gerlach, Joe McLaughlin, Todd O’Hara, Angela Matz, and Doug Woodby. We thank Nim Ha and Sophie Wenzel for coordinating the community involvement process and Scott Meyer for his helpful review comments. We also thank Sharon Tiplady for providing formatting and publication support for the final document.
Table of Contents
Executive Summary................................................................................................................................................1
Purpose of Document .............................................................................................................................................3
History of Fish Consumption Advice in Alaska...................................................................................................3
Description of the Alaska Fish Monitoring Program ..........................................................................................4
Overview of Process for Developing Alaska’s Fish Consumption Recommendations .....................................4
Purpose and Membership of the Alaska Scientific Advisory Committee for Fish Consumption ...................6
Alaska-specific Data Considered in the Development of Fish Consumption Recommendations....................6 Mercury Levels in Alaska Fish..........................................................................................................................7 Human Biomonitoring (Mercury Levels in Human Hair or Blood)................................................................ 10 Fish Consumption Rates in Alaska.................................................................................................................. 11 Nutrition-related Disease Rates and Trends in Alaska.................................................................................... 14
Federal and International Criteria for Acceptable Mercury Exposure Levels in Humans........................... 15
Risk Assessment for Food Consumption Guidelines ......................................................................................... 18
Local Risk Management Issues for Mercury in Fish from Alaska .................................................................. 22 Description of Alaska...................................................................................................................................... 22 Cultural and Societal Importance of Fish in Alaska........................................................................................ 23 Economic Importance of Subsistence ............................................................................................................. 23 Employment Significance of Alaska Fisheries................................................................................................ 24 Risks of Less Healthy Replacement Foods ..................................................................................................... 24
Health Benefits of Fish Consumption ................................................................................................................. 25 Neonatal Growth and Development and Healthy Pregnancies........................................................................ 26 Reduction in Cardiovascular Disease.............................................................................................................. 26 Cancer.............................................................................................................................................................. 27 Conclusions Regarding Health Benefits of Fish Consumption ....................................................................... 28
Consensus Recommendations from the Alaska Scientific Advisory Committee for Fish Consumption...... 28
Acceptable Daily Intakes for Contaminants Vary According to their Purpose: Public Health Practice vs. Regulation ..........................................................................................................29
Fish Consumption Guidance for the State of Alaska ........................................................................................ 30
Data Gaps and Future Research Priorities ........................................................................................................ 32
General Guidelines to Minimize Exposure to Contaminants from Fish ......................................................... 33
References ............................................................................................................................................................. 34
Fish Consumption Advice for Alaskans
A Risk Management Strategy to Optimize the Public’s Health Executive Summary Benefits of Fish Consumption Extensive scientific research has documented the numerous health, social, cultural and economic benefits of eating fish. Fish is an excellent source of lean protein, omega-3 fatty acids, antioxidants, and vitamins. A balanced diet that includes fish can lower the risk of heart disease, diabetes, and stroke. Fish is also an important part of a healthy diet for pregnant and nursing women, and young children as the omega-3 fatty acids in fish improve maternal nutrition and brain development in unborn and young children. Furthermore, many Alaska Native people have a strong reliance on fish as part of their traditional way of life and subsistence diet. Risks of Fish Consumption Fish can contain environmental contaminants they pick up from the water or sediments they live in, or the food they eat. Concerns about the health risks of contaminants have prompted many states, and several federal agencies, to advise the public to limit consumption of fish. Worldwide, the most notable fish contaminants are mercury and persistent organic pollutants (POPs). Mercury is a toxic metal that can damage the developing brain. Too much mercury may affect how children behave, learn, think and solve problems later in life. Thus, babies in the womb, nursing babies, and young children are at greatest risk for adverse health effects from mercury exposure. National studies have shown that all fish contain some mercury, with varying concentrations based on species, location, age, and other factors. POPs, which include polychlorinated biphenyls, dioxins, and organochlorine pesticides, are a group of toxic chemicals that do not degrade very rapidly in the environment or in the body. Adverse health effects that have been associated with POPs exposure include hormone disruption, learning and behavior changes, immune system suppression, and cancer. POPs exposures from consumption of Alaska fish are very low, and have never been found to cause adverse human health effects. Monitoring in Alaska To evaluate the safety of Alaska seafood, the Alaska Department of Environmental Conservation (ADEC) and the Alaska Department of Health and Social Services (DHSS) monitor contaminant levels in fish and in human seafood consumers. ADEC began a comprehensive Fish Monitoring Program in 2001 to analyze a wide variety of chemical contaminants in fish from Alaska, while DHSS began a Statewide Maternal Hair Mercury Biomonitoring Program in July 2002 to monitor the levels of mercury in the hair of pregnant Alaskans. Eligibility for this program has since been expanded to include all Alaskan women of childbearing age. Monitoring Results Current data from Alaska’s Fish Monitoring Program demonstrate a wide range of mercury tissue concentrations among the 23 species of Alaska fish sampled. Most species of Alaska fish—including all five wild Alaska salmon species—contained very low mercury levels that are not of health concern. However, a small number of Alaska fish species had high enough mercury levels to warrant recommendations for women who are or can become pregnant, nursing mothers, and young children to limit consumption of those fish species. Of 359 women of childbearing age from 51 Alaskan communities tested as part of Alaska’s ongoing Statewide Mercury Biomonitoring Program during 2002–2006, none had hair mercury levels of clinical or public health concern as a result of eating Alaska fish.
1
Fish Consumption Advice for Alaskans
Current data from Alaska’s Fish Monitoring Program demonstrate that Alaska fish have levels of POPs that are well below a level of health concern for consumers. Recommendations Due to the numerous well-documented health (and cultural) benefits of fish consumption, teenage boys, adult men, and women who cannot become pregnant should continue unrestricted consumption of all fish from Alaska waters. Women who are or can become pregnant, nursing mothers, and children aged 12 years and under should continue unrestricted consumption of fish from Alaska waters that are low in mercury, which include all five species of Alaska salmon, pacific cod, walleye pollock, black rockfish, pacific ocean perch, halibut under 20 pounds, and lingcod <30 inches. To protect the nervous systems of developing fetuses and young children, women who are or can become pregnant, nursing mothers, and children aged 12 years and under should limit their consumption of the fish that are known to have elevated mercury levels according to the following categories: • Category 1: limit consumption of sablefish, rougheye rockfish, medium-sized halibut (20–39.9 pounds),
store-bought halibut, and medium-sized lingcod (30 to 39.9″ length) to ≤ 4 meals per week (or ≤16 meals per month);
• Category 2: limit consumption of medium-large halibut (40 to 49.9 pounds) to ≤3 meals per week (or ≤12 meals per month);
• Category 3: limit consumption of large lingcod (40–44.9″ length), yelloweye rockfish, and large halibut (50–89.9 pounds) to ≤2 meals per week (or ≤8 meals per month); and
• Category 4: limit consumption of salmon shark, spiny dogfish, very large lingcod (45″ and longer) and very large halibut (≥90 pounds) to ≤1 meal per week (or ≤4meals per month).
The fish consumption limitations listed above assume a person eats fish from a single category listed above, and that an adult meal size is 6 ounces. For those who eat multiple fish species, a tool to calculate mixed diet allowances is available at: www.epi.alaska.gov/eh/fish/. Women who are or can become pregnant, nursing mothers, and children aged 12 years and under who consume fish from the categories listed above during a given month may also consume unlimited quantities of fish known to be low in mercury (e.g., salmon) during that month. Since the average commercially-caught halibut in Alaska weighs only 33 pounds, women who are or can become pregnant, nursing mothers, and children aged 12 years and under may eat up to sixteen meals per month of halibut from Alaska that are sold in stores and restaurants. Recommendations and guidance on fish consumption will change as new data become available.
2
Fish Consumption Advice for Alaskans
Purpose of Document This document provides updated fish consumption guidance to the public, specific to Alaska-caught fish. The levels of mercury in Alaska-caught fish, as reported by the ADEC’s Fish Monitoring Program in 2006, are described and interpreted. The risks of mercury exposure are weighed against the health benefits of fish consumption to develop fish consumption guidance that is both balanced and protective. Our intent is to assist individuals, families and communities in Alaska as they make decisions about their fish consumption patterns. This document is not intended to influence Air Quality or Water Quality criteria, or other regulatory standards. The allowance of daily intake levels for mercury that exceed the reference dose established by the U.S. Environmental Protection Agency (EPA) should not be interpreted as a recommendation to relax air or water quality standards. The Alaska Division of Public Health (DPH) appreciates the health risks posed by mercury, and encourages regulatory agencies to control mercury releases to the fullest extent possible to protect our environment and the health of all Alaskans. History of Fish Consumption Advice in Alaska DPH has historically recommended unrestricted consumption of all fish from Alaska waters. This recommendation was based largely on 1) a combination of insufficient fish contaminant data upon which to base restrictive advisories; 2) limited human mercury biomonitoring data that showed no exposures of health concern to Alaskans; and 3) the principle of nonmaleficence (i.e., first do no harm). In this case, nonmaleficence refers to the potential harm that could occur by encouraging people to reduce their fish consumption and thereby not receive the beneficial health effects of this nourishing food.1 In 2001, the United States federal government issued generic fish consumption advice that was contrary to DPH’s longstanding recommendation. Due to concerns about mercury in fish, EPA and the U.S. Food and Drug Administration (FDA) recommended that pregnant women, women of childbearing age who may become pregnant, nursing mothers, and young children limit their consumption of fish. FDA recommended that these vulnerable members of the population should not eat shark species, swordfish, king mackerel or tilefish, and should limit consumption of other (commercial) fish to 12 ounces per week. EPA further recommended that these persons should limit consumption of fish caught by family members and friends to one meal per week, and suggested finding alternative sources of protein for children. This federal guidance was edited and re-issued in 2004 as a joint EPA/FDA advisory.2 Public health officials in Alaska reviewed the available evidence and concluded that the federal advice was inappropriate for Alaska. Alaskans rely heavily on fish as a lean, nutritious protein source, particularly among Alaska Native subsistence users who live in rural areas with less access to healthy alternative foods. Also, Alaska fish, particularly wild Alaska salmon, have far lower mercury levels than those used to develop the generic national guidelines. In response to the national advisories, Alaska public health officials met with numerous stakeholders including tribal health corporations, other state agencies, and university professors to develop a consensus statement regarding fish consumption advice in Alaska. Because mercury levels in Alaska fish, particularly wild Alaska salmon, are far lower than those used to develop the generic national guidelines, the consensus statement considered the federal advice to be inappropriate public health policy for Alaska. The consensus statement reported that “the known benefits of fish consumption far outweigh the theoretical and controversial potential adverse health effects from mercury found in Alaska fish.” DPH continued to strongly recommend that all Alaskans continue unrestricted consumption of fish from Alaska waters.
3

Fish Consumption Advice for Alaskans
However, the stakeholder group concluded that “an extensive collaborative program of research and monitoring of mercury in Alaska fish and in Alaskans who consume fish is needed and is being developed to increase the amount of data on mercury levels and follow trends in the future.”3
In response to this charge for additional data, State agencies launched two major programs: ADEC began a comprehensive Fish Monitoring Program in 2001 to analyze a wide variety of chemical contaminants in fish from Alaska, and DHSS began a Statewide Maternal Hair Mercury Biomonitoring Program in July 2002, to monitor the levels of mercury in the hair of pregnant Alaskans. This gave public health officials direct information about the degree of mercury exposure occurring in the most vulnerable subpopulation in Alaska, to optimally assess the likelihood of adverse health effects. This report presents and discusses both of these programs in detail. DPH also works closely with other researchers in the state to review study designs, data quality and interpretation, and most importantly, public health advice. Description of the Alaska Fish Monitoring Program The Fish Monitoring Program involves surveying selected marine and freshwater finfish species from around the state and testing these fish for a broad range of environmental contaminants. This program involves collaboration with biologists from the Alaska Department of Fish and Game (ADF&G), the U.S. National Oceanic and Atmospheric Administration (NOAA), the International Pacific Halibut Commission, and commercial and Alaska Native fishermen. Fish samplers are trained to perform the standard protocol written in the Quality Assurance Project Plan to assure submission of quality samples for analysis. Fish are caught, labeled, put in food grade plastic bags (fish sleeves or Ziploc® type bags) and placed in lined wetlock boxes. The samples are either immediately shipped on ice, or frozen and then shipped when feasible, to the Environmental Health Laboratories in Palmer or Anchorage. Over 2,300 fish samples were collected from 2001 through January 2007. The Environmental Health Laboratories process the fish and perform chemical analysis on the homogenized skinless fillets of individual fish, testing for seven metals (arsenic, cadmium, lead, nickel, chromium, selenium, and methyl- and total- mercury). Results for the heavy metal and mercury analyses can be found on the state web page: http://www.state.ak.us/dec/eh/vet/fish.htm. Due to the high cost of organic contaminant analysis, only a subset of fish samples were analyzed for organochlorine contaminants, including polychlorinated biphenyls (PCBs), polybrominated diphenyl ethers (PBDEs), polychlorinated dibenzo-p-dioxins (PCDDs) , polychlorinated dibenzofurans (PCDFs) and organochlorine pesticides (e.g., “DDT”). This subset of fish does not include all species collected. AXYS Analytical Services Ltd. (AXYS) in British Columbia, Canada performed the testing following EPA analytical methods, and data were validated by independent contractors using EPA Region 10 Validation Methods. Overview of Process for Developing Alaska’s Fish Consumption Recommendations EPA provides the states with guidance for collecting and interpreting environmental contaminant data in fish to assist with the development of fish consumption advice. ADEC uses Volume 1 of the guidance to perform fish sampling and analysis for the Fish Monitoring Program.4 After ADEC receives and reviews the fish contaminant data, they forward the data to DPH for interpretation of the health significance and development of optimal Alaska fish consumption recommendations.
4
Fish Consumption Advice for Alaskans
DPH takes several steps to analyze the fish contaminant data and develop public health advice. First, the data are screened against EPA Risk-Based Consumption Limit Tables provided in Volume 2 of their guidance.5 For organic contaminants, DPH generally uses the screening criteria for non-cancer health endpoints rather than cancer health endpoints, because the chronic endpoint risk assessment often is more scientifically defensible. Animal cancer studies usually involve administration of high doses of the test chemical, which may involve mechanisms and risks not associated with lower doses, such as compensatory mitogenesis following tissue damage.6 This mechanism of toxicity would not apply to chronic low-dose exposures, such as exposures from consuming fish from Alaska. Use of cancer endpoints may overestimate true risks because EPA uses a conservative method to calculate the risks posed by environmental carcinogens. Their approach assumes that no threshold exists below which an increased cancer risk does not occur. Extrapolation of effects from high-dose laboratory studies to low environmental levels is based on a linearized multistage no-threshold model. Numerous authors have criticized this approach as being unrealistically conservative, since it does not take into account evidence of thresholds for carcinogenic endpoints, particularly for chemicals such as PCBs and dioxins that act through a promotion mechanism.7-10 Using PCBs as an example, EPA has adopted a high risk and persistence upper-bound slope factor of 2.0 per (mg/kg)/day for PCBs as carcinogens.11 EPA concedes that this slope factor drives a currently recommended seafood screening value for PCBs that “will result in widespread exceedance in waterbodies throughout the country and will drive virtually all fish and shellfish contaminant monitoring programs into the risk assessment phase for PCBs.”12
If a mean chemical concentration for a fish species exceeds the EPA screening value for unlimited consumption (defined as over 16 meals per month), DPH considers the risk in greater detail. This includes an examination of the evidence behind health-based risk values, the magnitude of safety factors that have been incorporated, and a consideration of the health benefits of fish consumption. Before 2006, insufficient fish data were available to justify the need to issue restrictive fish consumption recommendations in Alaska. ADEC’s website provides earlier reports that detail the contaminant data for fish from Alaska, and the public health interpretation of the data.13
In the summer and fall of 2006, ADEC provided a large body of additional data to DPH, describing the mercury content of over 2,300 individual fish from 23 species. Several species had mercury content of potential concern, prompting DPH to implement EPA’s risk management principles.14 As part of this process, ADEC and DPH assembled a committee of scientific experts from Alaska to participate in the risk management process. This committee became known as the Alaska Scientific Advisory Committee for Fish Consumption. The Alaska Scientific Advisory Committee for Fish Consumption met on November 30, 2006, and agreed that a few Alaska fish species had mercury levels too high to warrant “unrestricted consumption” guidance for the most sensitive members of the population, specifically women who are or can become pregnant, nursing mothers, and young children. After considering the risks of mercury exposure, and the multiple benefits of fish consumption, the committee reached consensus on a strategy to provide balanced, yet protective, fish consumption advice. Following the committee meeting, ADEC and DPH conducted a series of meetings and workshops with various stakeholders to obtain input. A list of these meetings is presented in Table 1.
5

Fish Consumption Advice for Alaskans
Table 1. Stakeholder Meetings and Workshops, January–March 2007 Date Description
January 9 Inter-agency meeting with Alaska Division of Public Health, Alaska Department. of Environmental Conservation and Alaska Department of Fish and Game
January 23 Meeting with Alaska Seafood Processors Advisory Committee, Alaska Seafood Marketing Institute, and International Pacific Halibut Commission
January 30 Meeting with Alaska Native Tribal Health Consortium, Aleutian/Pribolof Islands Association, and University of Alaska
February 9 Hearing with Alaska legislators February 14–15 Presentations and workshop at the Alaska Forum on the Environment
March 27 Meeting with sports fishing charter operators at the North Pacific Fisheries Management Council meeting
The final aspect of the consumption advisory process is the ongoing development and implementation of an effective public communications and education strategy. ADEC, DPH, and ADF&G work together on this task, and use volume 4 of the EPA guidance document as a reference tool.15
Purpose and Membership of the Alaska Scientific Advisory Committee for Fish Consumption The purpose of the Alaska Scientific Advisory Committee for Fish Consumption is to provide scientific input and advice to DPH to assist with the development of optimal fish consumption recommendations for Alaska. Alaska scientists were selected for the Committee based upon their respective expertise in contaminants, human health and nutrition, in the context of Alaska’s unique social, cultural, economic and geographical challenges. The membership roster was created during a joint meeting with ADEC and DPH staff members, and respective Division Directors (Table 2). Table 2. Alaska Scientific Advisory Committee for Fish Consumption Members
Name Organization Expertise James Berner, M.D. Alaska Native Tribal Health Consortium Pediatric medicine, contaminants Jay Butler, M.D. Alaska Dept. of Health and Social Services Medical Epidemiology Larry Duffy, Ph.D. University of Alaska Fairbanks Chemistry, contaminants Bob Gerlach, V.M.D. Alaska Dept. of Environmental Conservation Veterinary Medicine, Fish Monitoring Angela Matz, Ph.D. U.S. Fish and Wildlife Service Contaminants biologist Joe McLaughlin, M.D. Alaska Dept. of Health and Social Services Medical Epidemiology Todd O'Hara*, DVM Ph.D. University of Alaska Fairbanks Environmental Toxicology Lori Verbrugge, Ph.D. Alaska Dept. of Health and Social Services Environmental Toxicology Doug Woodby, Ph.D. Alaska Dept. of Fish and Game Fisheries Science *Invited but could not attend on Nov. 30, 2006
Alaska-Specific Data Considered in the Development of Fish Consumption Recommendations Alaska-specific data sources utilized in the decision-making process for the development of Alaska fish consumption recommendations include the following:
Mercury Levels in Alaska Fish Human Biomonitoring (Mercury Levels in Human Hair or Blood) Fish Consumption Rates in Alaska Nutrition-related Disease Rates and Trends in Alaska
6
Fish Consumption Advice for Alaskans
7
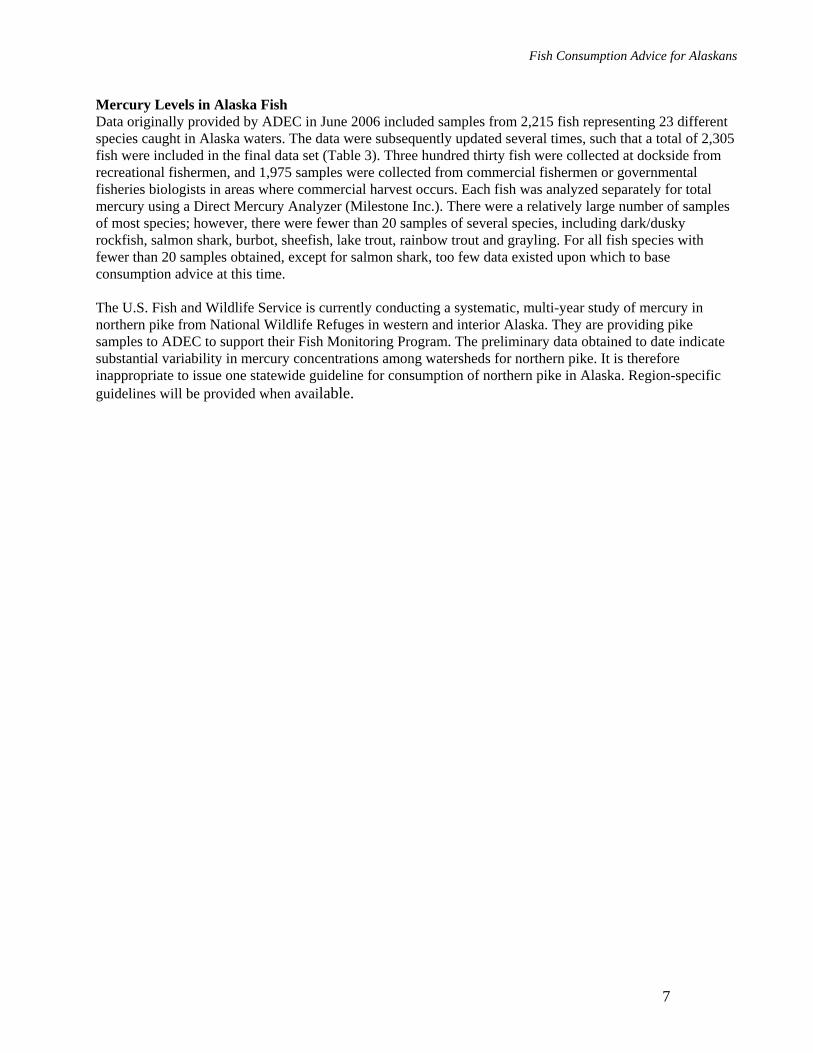
Mercury Levels in Alaska Fish Data originally provided by ADEC in June 2006 included samples from 2,215 fish representing 23 different species caught in Alaska waters. The data were subsequently updated several times, such that a total of 2,305 fish were included in the final data set (Table 3). Three hundred thirty fish were collected at dockside from recreational fishermen, and 1,975 samples were collected from commercial fishermen or governmental fisheries biologists in areas where commercial harvest occurs. Each fish was analyzed separately for total mercury using a Direct Mercury Analyzer (Milestone Inc.). There were a relatively large number of samples of most species; however, there were fewer than 20 samples of several species, including dark/dusky rockfish, salmon shark, burbot, sheefish, lake trout, rainbow trout and grayling. For all fish species with fewer than 20 samples obtained, except for salmon shark, too few data existed upon which to base consumption advice at this time. The U.S. Fish and Wildlife Service is currently conducting a systematic, multi-year study of mercury in northern pike from National Wildlife Refuges in western and interior Alaska. They are providing pike samples to ADEC to support their Fish Monitoring Program. The preliminary data obtained to date indicate substantial variability in mercury concentrations among watersheds for northern pike. It is therefore inappropriate to issue one statewide guideline for consumption of northern pike in Alaska. Region-specific guidelines will be provided when available.
Tab
le 3
. A
lask
a D
epar
tmen
t of E
nvir
onm
enta
l Con
serv
atio
n Fi
sh M
onito
ring
Pro
gram
T
otal
Mer
cury
Con
cent
ratio
n *(
ppm
) for
Fis
h Sp
ecie
s Col
lect
ed
Janu
ary
2007
N
umbe
r
Mea
n St
anda
rd
Med
ian
Min
imum
M
axim
um
W
eigh
t (po
unds
)**
Sam
pled
(ppm
) D
evia
tion
(ppm
) (p
pm)
(ppm
)
Min
. M
ax.
Sc
ient
ific
Nam
e
Pa
cific
Cod
G
adus
mac
roce
phal
us
110
0.
133
0.09
7 0.
108
<DL
0.49
6
1.8
23.2
Pa
cific
Hal
ibut
H
ippo
glos
sus s
teno
lepi
s 64
3
0.32
5 0.
290
0.22
2 <D
L 1.
947
13
.4
289.
7 L
ingc
od
Oph
iodo
n el
onga
tus
89
0.
468
0.34
5 0.
420
0.03
3 1.
428
2.
6 56
.2
Wal
leye
Pol
lock
Th
erag
ra c
halc
ogra
mm
a 14
3
0.05
2 0.
067
<DL
<DL
0.38
9
0.7
7.3
Sabl
efis
h An
oplo
pom
a fim
bria
19
1
0.18
2 0.
192
0.10
7 <D
L 1.
192
1.
8 16
.7
Bla
ck R
ockf
ish
Seba
stes
mel
anop
s 26
0.13
4 0.
076
0.10
6 0.
044
0.34
9
3.1
7.5
Dar
k/D
usky
Roc
kfis
h Se
bast
es c
iliat
us/v
aria
bilis
6
0.
097
0.10
7 0.
061
0.02
6 0.
309
2.
4 5.
5 Pa
cific
Oce
an P
erch
Se
bast
es a
lutu
s 78
0.05
6 0.
054
0.04
1 <D
L 0.
262
0.
5 2.
5 R
ough
eye
Roc
kfis
h Se
bast
es a
leut
ianu
s 21
0.23
4 0.
195
0.16
7 0.
077
0.87
0
1.3
4.6
Yel
low
eye
Roc
kfis
h Se
bast
es ru
berr
imus
31
0.51
3 0.
286
0.46
6 0.
144
1.26
3
4.4
19.8
Sh
ark
Lam
na d
itrop
is
9
1.18
2 0.
286
1.19
1 0.
758
1.56
8
6' 5
.9" *
**
7" 9
.7" *
**
Spin
y D
ogfis
h Sq
ualu
s aca
nthi
as
49
0.
799
0.25
1 0.
834
0.09
5 1.
340
4.
2 8.
4 A
ll Sa
lmon
(k
ing,
red,
silv
er, c
hum
,pin
k)
765
0.
040
0.02
1 0.
038
<DL
0.15
9
Kin
g Sa
lmon
O
ncor
hync
hus t
shaw
ytsc
ha
115
0.
064
0.02
8 0.
058
<DL
0.15
9
1.3
31.5
C
hum
Sal
mon
O
ncor
hync
hus k
eta
174
0.
043
0.01
5 0.
041
<DL
0.10
3
2.9
13.9
Pi
nk S
alm
on
Onc
orhy
nchu
s gor
busc
ha
120
0.
019
0.01
0 <D
L <D
L 0.
064
1.
3 7.
1 R
ed S
alm
on
Onc
orhy
nchu
s ner
ka
202
0.
038
0.01
5 0.
038
<DL
0.08
2
0.9
9.8
Silv
er S
alm
on
Onc
orhy
nchu
s kis
utch
15
4
0.03
7 0.
015
0.03
6 <D
L 0.
113
1.
1 15
.4
Bur
bot
Lota
lota
10
0.53
3 0.
254
0.55
8 <D
L 0.
854
0.
3 6.
8 N
orth
ern
Pike
Es
ox lu
cius
10
4
0.27
2 0.
261
0.18
5 <D
L 1.
202
0.
2 6.
7 Sh
eefis
h St
enod
us le
ucic
hthy
s 8
0.
136
0.05
7 0.
120
0.09
2 0.
262
5.
9 17
.2
Lak
e T
rout
Sa
lvel
inus
nam
aycu
sh
9
0.30
3 0.
126
0.32
3 0.
113
0.45
5
1.5
6 R
ainb
ow T
rout
O
ncor
hync
hus m
ykis
s 6
0.
210
0.03
6 0.
200
0.17
2 0.
258
0.
7 1.
3 A
rctic
Gra
ylin
g Th
ymal
lus a
rctic
us
7
0.09
0.
028
0.08
8 0.
057
0.14
1
1.1
1.8
*Con
cent
ratio
n ex
pres
sed
as p
pm (p
arts
per
mill
ion,
mg/
kg)
Det
ectio
n Li
mit:
0.0
25 p
pm
V
alue
s bel
ow th
e A
naly
tical
Det
ectio
n Li
mit
are
treat
ed a
s 1/2
the
Det
ectio
n Li
mit
for c
alcu
latio
n pu
rpos
es
<D
L: B
elow
Det
ectio
n Li
mit
**W
eigh
ts sh
own
are
for w
hole
fish
**
*Val
ue is
Len
gth
(fee
t, in
ches
), si
nce
Wei
ght i
s not
ava
ilabl
e fo
r thi
s spe
cies
Fish Consumption Advice for Alaskans
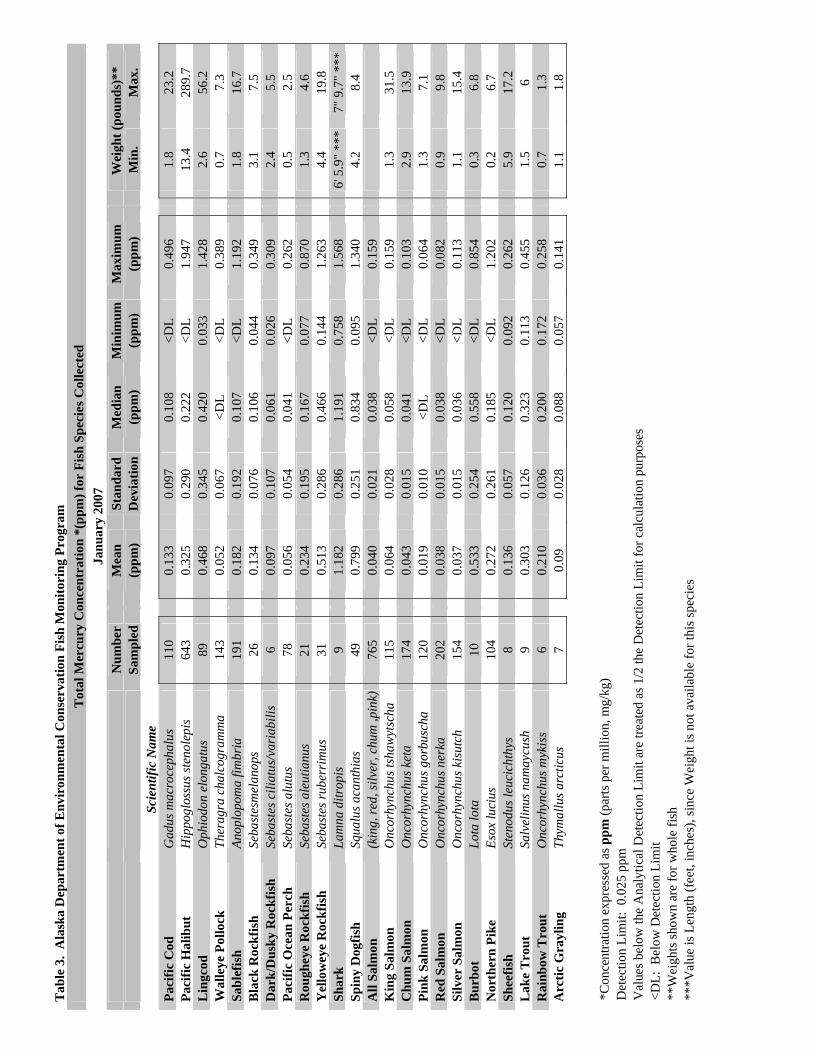
Although there were only nine samples of salmon shark, the Committee determined that sufficient data existed upon which to base recommendations for reduced consumption of this species because the data lacked substantial variability and were consistent with expected levels for this species. All nine salmon shark samples contained mercury in excess of 0.75 parts per million (ppm) wet weight. Shark species in general contain relatively high mercury levels because they are long-lived and occupy a predatory position in the food chain. In their generic federal advisory, the EPA and FDA advise women of childbearing age and young children not to eat shark (all species) due to its high mercury content. Alaska halibut data from the Fish Monitoring Program were interpreted by weight class as calculated from total fish length (Table 4a). Despite substantial variability in mercury content within each weight class, the mean mercury level increased with weight across all weight classes evaluated. Mean mercury levels in the heaviest halibut (greater than 200 pounds) were approximately 8-fold higher than those for the lightest halibut (less than 20 pounds). Because of this, the Committee found it necessary to give halibut consumption advice specific to each weight class. Similarly, Alaska lingcod data were interpreted by length class (Table 4b) due to the trend of higher mean mercury concentrations among longer fish.
Table 4a. Halibut Mercury Statistics by Weight Class, Statewide (ADEC Fish Monitoring Program) Total Mercury (ppm)
Weight, Pounds* Length, Inches N Mean Median Std Dev Min Max Percent fish > 1 ppm 0 – 19.9 25 to 34.9 52 0.122 0.086 0.129 0.026 0.793 0%
20 – 29.9 35 to 39.9 186 0.218 0.166 0.152 0.052 0.994 0% 30 – 39.9 40 to 43.9 119 0.265 0.188 0.221 0.067 1.512 2% 40 – 49.9 44 to 46.9 124 0.370 0.272 0.266 0.094 1.745 3% 50 – 59.9 47 to 49.9 85 0.466 0.388 0.340 0.053 1.947 9%
9% 60 – 69.9 50 to 51.9 23 0.458 0.345 0.328 0.165 1.578 70 – 79.9 52 to 53.9 22 0.602 0.559 0.367 0.159 1.616 18%
15% 80 – 89.9 54 to 55.9 13 0.636 0.439 0.463 0.168 1.653 90 – 99.9 56 to 57.9 12 0.687 0.600 0.513 0.133 1.571 33%
25% 100 – 200 58 to 71.9 4 0.682 0.602 0.436 0.279 1.245 200+ > 72 3 0.950 1.059 0.342 0.567 1.224 67%
*Calculated by IPHC; WR =[(6.921x10⁻⁶ x L3.24) x 1.33], where WR = round (whole) weight and L = fork length in cm
Table 4b. Lingcod Mercury Statistics by Size Class, Statewide (ADEC Fish Monitoring Program) Total Mercury (ppm)
Length, Inches N Mean Median Std Dev Minimum Maximum Percent fish > 1 ppm 20 to 29.9 9 0.081 0.041 0.068 0.033 0.199 0% 30 to 34.9 13 0.177 0.133 0.126 0.054 0.531 0% 35 to 39.9 21 0.276 0.241 0.172 0.070 0.653 0% 40 to 44.9 12 0.638 0.533 0.385 0.122 1.350 17% 45 to 49.9 27 0.731 0.724 0.263 0.196 1.428 11% 50 to 54 7 0.774 0.753 0.140 0.614 1.011 14%
Other researchers in Alaska also generate contaminant data for Alaska fish, including the University of Alaska Fairbanks, the U.S. Fish and Wildlife Service, Alaska Native tribes, and other entities. The Alaska Scientific Advisory Committee for Fish Consumption acknowledges the important contributions these research projects can make towards the development of fish consumption advice, and some of these data may be included in future updates to this DPH guidance. Inclusion of other data sources will require the Committee to establish internal guidelines for evaluation of data quality, representativeness, comparability of data type, and other criteria. These guidelines will allow the Committee to objectively determine which data are appropriate to merge with the ADEC Fish Monitoring data for the purpose of fish consumption guidance development.
9
Fish Consumption Advice for Alaskans
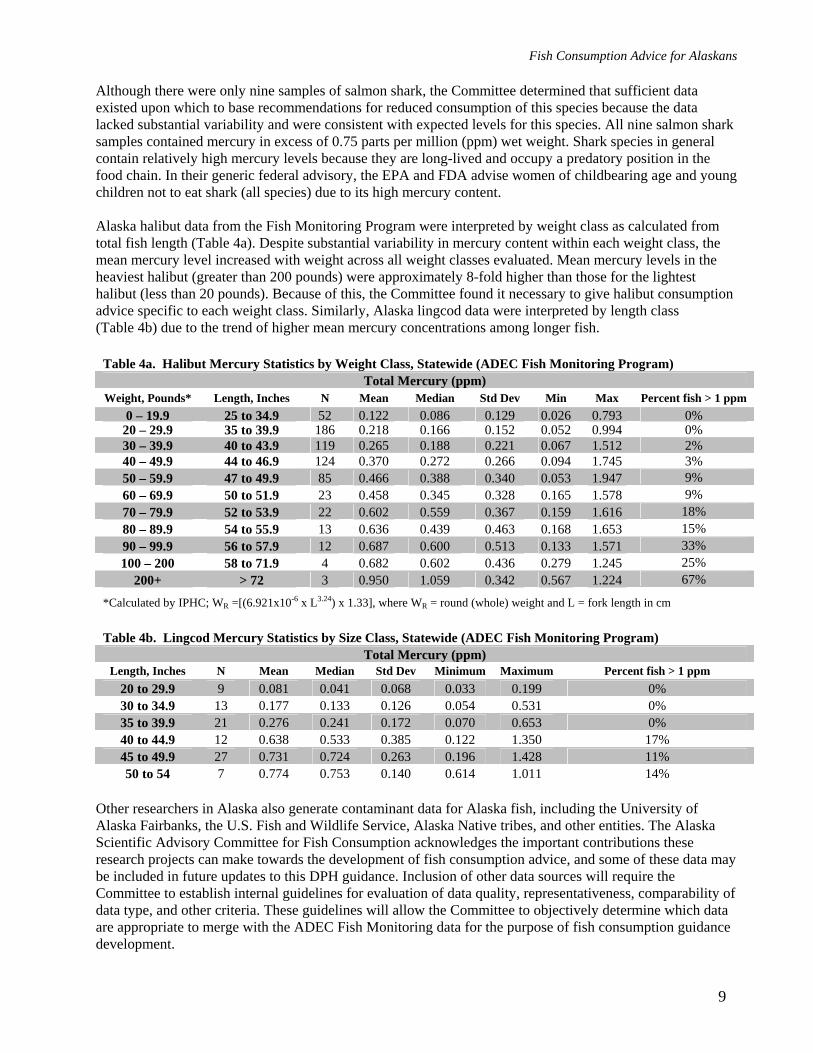
Human Biomonitoring (Mercury Levels in Human Hair or Blood) Human biomonitoring is an important tool to assess actual human exposures to contaminants by measuring contaminant levels present in blood, urine, hair, fat, or other matrices. Biomonitoring data reduce scientific uncertainty relative to a standard risk assessment, which estimates human exposure to the contaminant from sources such as air, food, or water using a series of exposure assumptions and theoretical calculations. In Alaska, public health officials often use biomonitoring data to optimize their risk interpretations and health advice regarding environmental exposures to contaminants.16 To assess mercury exposure in Alaska, DPH launched a Statewide Maternal Hair Mercury Biomonitoring Program in July 2002. This ongoing program originally offered free, confidential hair mercury testing to all pregnant women in Alaska. Eligibility has since been expanded to include all Alaskan women of childbearing age (aged 15–45 years). Through December 31, 2006, hair samples were analyzed from 359 women from 51 Alaskan communities.17 Participants included 201 pregnant women and 158 non-pregnant women of childbearing age. The 359 participants had a median hair mercury level of 0.53 parts per million (ppm) (Figure 1), with a maximum of 7.82 ppm. All hair mercury levels were well below 14 ppm. The World Health Organization’s (WHO) analysis of two large epidemiological studies determined that no adverse health effects occurred to the fetus when maternal hair mercury levels were less than 14 ppm.18
Figure 1. Hair Mercury Concentrations of Women who Participated in the Alaska Mercury Biomonitoring Program, July 2002 – December 2006 (n=359)
0
10
20
30
40
50
60
70
80
90
100
0 1 2 3 4 5 6 7 8
Total Mercury (ppm)
Num
ber
of S
ampl
es
To provide a margin of safety, DPH conducts follow-up investigations on all hair mercury levels above 5 ppm. Follow-up investigations were conducted for the three women whose hair samples exceeded 5 ppm. All three women lived in the Yukon-Kuskokwim Delta or the Aleutian Islands and consumed large amounts of marine mammal livers and/or kidneys, which were determined to be the primary source of their mercury exposure. DPH informed the women of ways to reduce their mercury exposure if they chose to do so, by eating traditional foods that contain less mercury.
10
Fish Consumption Advice for Alaskans
11
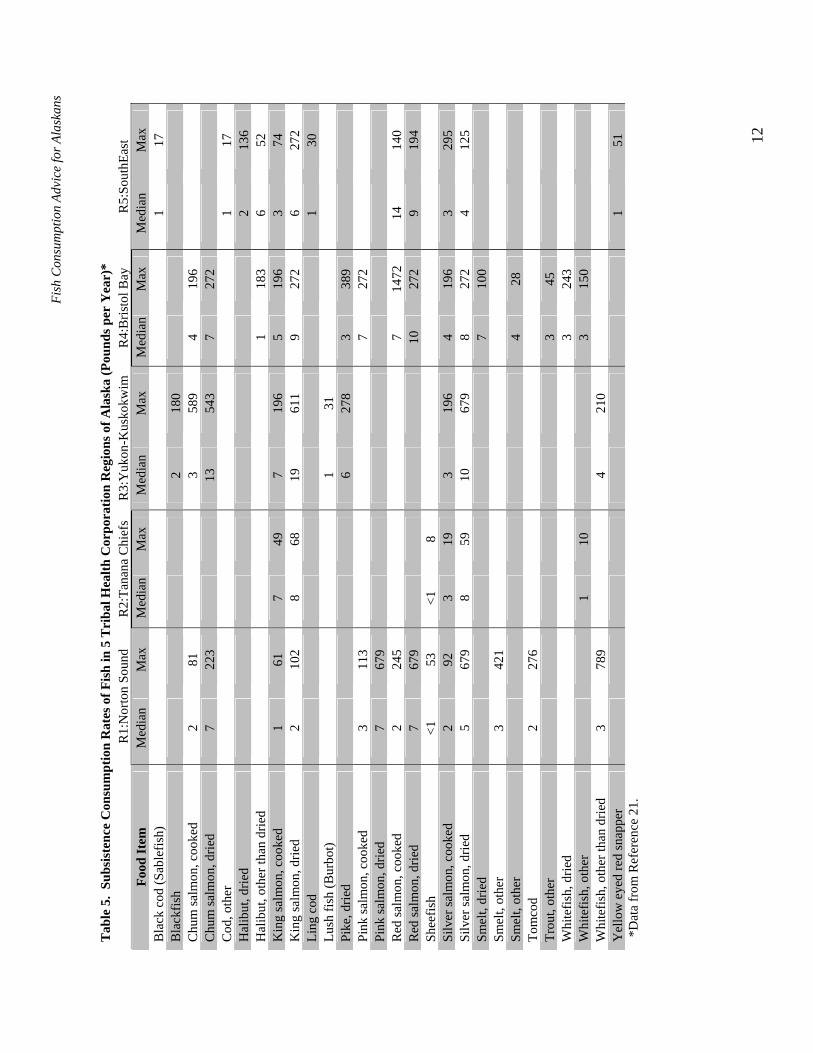
In addition to the Statewide Maternal Hair Mercury Biomonitoring Program, the Alaska Native Traditional Food Safety Monitoring Program began in 1999 as a multi-agency collaborative program designed to monitor human tissue levels of persistent organic pollutants (POPs), heavy metals, and micronutrients in a group of isolated rural subsistence-dependent Alaska Native mothers and infants.19 As of November 2005, the program enrolled 205 Alaska Native mother/baby pairs. Maternal participants had a mean blood mercury level of 6.6 parts per billion (ppb) with a maximum level of 14.1 ppb. All blood mercury levels were well below that associated with subtle health effects in the developing fetus (approximately 58 ppb in maternal blood based on data from the Faroe Islands epidemiological study). Fish Consumption Rates in Alaska Current population-based fish consumption rates provide important information when developing fish consumption advice. This information allows public health officials to assess whether documented contaminant levels in fish might put consumers at risk due to fish consumption rates, or if fish tissue contaminant concentrations are irrelevant because the item is not consumed. Many Alaskans eat far more fish than the average American, especially in rural areas that rely on fish for subsistence.20 Alaska is a large state with diverse ecological regions, and the people that inhabit these various ecological regions have different cultures and diets. These features present challenges to the comprehensive study of diets in Alaska. The Alaska Traditional Diet Survey was recently undertaken to fill this data gap (Table 5).21
Fish
Con
sum
ptio
n Ad
vice
for A
lask
ans
12
Tab
le 5
. Su
bsis
tenc
e C
onsu
mpt
ion
Rat
es o
f Fis
h in
5 T
riba
l Hea
lth C
orpo
ratio
n R
egio
ns o
f Ala
ska
(Pou
nds p
er Y
ear)
*
R1:
Nor
ton
Soun
d R
2:Ta
nana
Chi
efs
R3:
Yuk
on-K
usko
kwim
R
4:B
risto
l Bay
R
5:So
uthE
ast
Food
Item
M
edia
n M
ax
Med
ian
Max
M
edia
n M
ax
Med
ian
Max
M
edia
n M
ax
Bla
ck c
od (S
able
fish)
1
17
Bla
ckfis
h
2
180
Chu
m sa
lmon
, coo
ked
2 81
3
589
4 19
6
C
hum
salm
on, d
ried
7 22
3
13
54
3 7
272
Cod
, oth
er
1 17
H
alib
ut, d
ried
2 13
6 H
alib
ut, o
ther
than
drie
d
1
183
6 52
K
ing
salm
on, c
ooke
d 1
61
7 49
7
196
5 19
6 3
74
Kin
g sa
lmon
, drie
d 2
102
8 68
19
61
1 9
272
6 27
2 Li
ng c
od
1 30
Lu
sh fi
sh (B
urbo
t)
1
31
Pike
, drie
d
6
278
3 38
9
Pi
nk sa
lmon
, coo
ked
3 11
3
7
272
Pink
salm
on, d
ried
7 67
9
R
ed sa
lmon
, coo
ked
2 24
5
7
1472
14
14
0 R
ed sa
lmon
, drie
d 7
679
10
272
9 19
4 Sh
eefis
h <1
53
<1
8
Silv
er sa
lmon
, coo
ked
2 92
3
19
3 19
6 4
196
3 29
5 Si
lver
salm
on, d
ried
5 67
9 8
59
10
679
8 27
2 4
125
Smel
t, dr
ied
7 10
0
Sm
elt,
othe
r 3
421
Smel
t, ot
her
4 28
To
mco
d 2
276
Trou
t, ot
her
3 45
W
hite
fish,
drie
d
3
243
Whi
tefis
h, o
ther
1
10
3 15
0
W
hite
fish,
oth
er th
an d
ried
3 78
9
4
210
Yel
low
eye
d re
d sn
appe
r
1
51
*Dat
a fr
om R
efer
ence
21.
Fish Consumption Advice for Alaskans
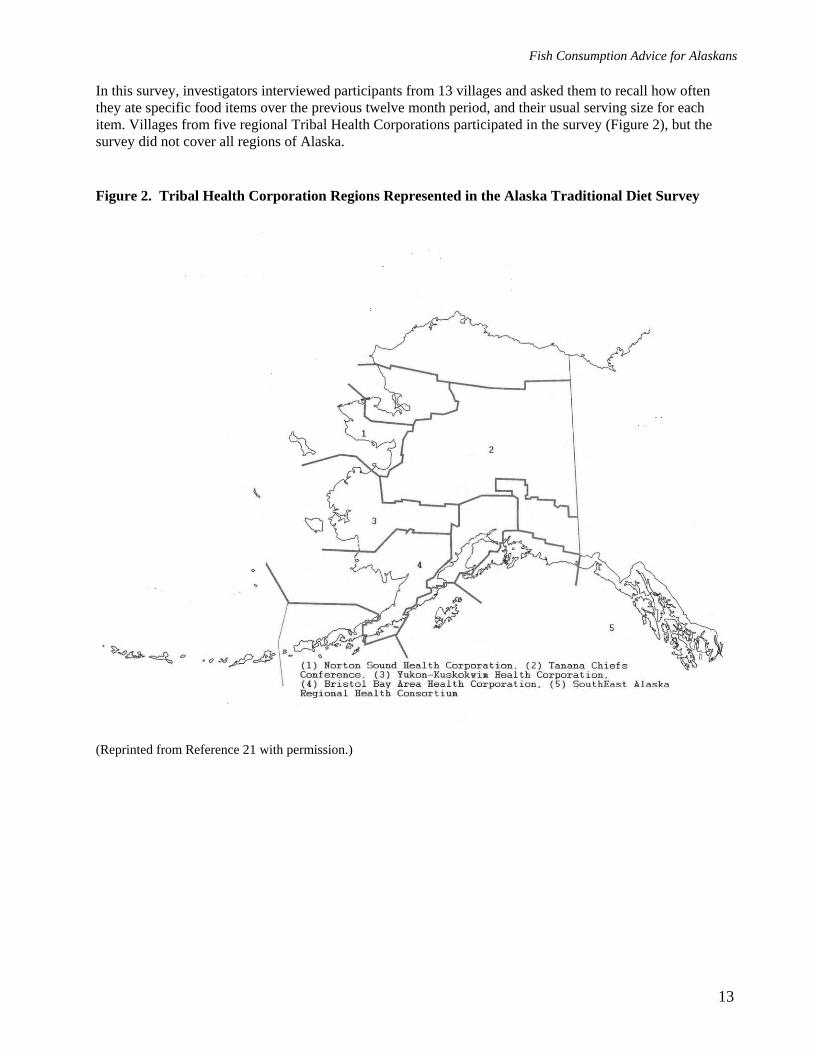
In this survey, investigators interviewed participants from 13 villages and asked them to recall how often they ate specific food items over the previous twelve month period, and their usual serving size for each item. Villages from five regional Tribal Health Corporations participated in the survey (Figure 2), but the survey did not cover all regions of Alaska. Figure 2. Tribal Health Corporation Regions Represented in the Alaska Traditional Diet Survey
(Reprinted from Reference 21 with permission.)
13

Fish Consumption Advice for Alaskans
The Alaska Traditional Diet Survey data can be simplified by combining all the fish into two categories—salmon and non-salmon (Table 6). Table 6. Summary of Fish Consumption Rates in 5 Tribal Health Corporation Regions of Alaska (Pounds per Year)* Median Rate
Region Salmon Non-salmon R1: Norton Sound 38 8 R2: Tanana Chiefs 26 1 R3: Yukon-Kuskokwim 55 13 R4: Bristol Bay 61 24 R5: South East 39 12 Maximum Rate R1: Norton Sound 2954 1539 R2: Tanana Chiefs 195 18 R3: Yukon-Kuskokwim 2814 699 R4: Bristol Bay 3420 1138 R5: South East 1100 303
*Data from Reference 21 In contrast to fish consumption rates among rural subsistence consumers, fish consumption rates among urban Alaskans and non-subsistence consumers have not been well characterized. Risk managers need to learn more about seafood consumption in urban centers in Alaska, including an assessment of the types, quantity, and mercury content of seafood consumed from sources outside Alaska. Nutrition-related Disease Rates and Trends in Alaska In communities that rely heavily on subsistence fish harvests—the majority of which are populated by Alaska Native people—traditional foods provide more than a food source. Subsistence is often a cultural cornerstone, providing spiritual, nutritional, medicinal, and economic well being.22 Subsistence activities connect community members through work and through sharing, and provide a thread of cultural continuity from generation to generation. Therefore, any advice to limit traditional food consumption must be well-justified. Unfortunately, the social and cultural disruption associated with food consumption advisories can have profound effects on the health and well-being of subsistence communities. For example, changes in diet, lifestyle, and the social and cultural disruption that follows alterations in subsistence traditions can contribute to a wide range of adverse health effects, such as increases in obesity, diabetes, hypertension, violence, alcoholism and drug abuse.23,24 Indigenous peoples in Canada have viewed chronic diseases as resulting from moving away from country (traditional) food and taking on the “white man’s diet.”25 This information indicates the importance of monitoring trends of nutritionally-related disease prevalence among subsistence communities to understand the potential health impacts of dietary changes. DPH recognizes that fish consumption advisories may adversely affect all residents of subsistence communities. However, no easily accessible methodology exists to stratify populations based on their reliance on subsistence food. Because the majority of subsistence users in Alaska are Alaska Native people, as a rough proxy we compare outcomes among Alaska Native versus non-Native people. Increasing non-traditional food consumption and sedentary lifestyles among Alaska Native people have been associated with increasing chronic disease prevalence, including an increase in hypertension, glucose intolerance, and diabetes.26-28
14
Fish Consumption Advice for Alaskans
The prevalence of diabetes, which was once rare among Alaskan and Canadian Eskimos, has steadily increased.30-34 Data from the Alaska Native diabetes registry for 1998 indicate that 1,666 Alaska Native people had diabetes.34 The overall age-adjusted prevalence rate increased from 15.7 to 28.3 per 1,000 population from 1985 to 1998, an 80% increase. Within the Alaska Native population, Aleut people had an age-adjusted prevalence during 1998 of 49.1 per 1,000, versus 18.5 per 1,000 for Eskimos. Unfortunately, the prevalence rate of 18.5 per 1,000 persons among Eskimos represents a 110% increase since 1985. Among regions, the percent increase in diabetes between 1985 and 1998 ranges from a low of 50% in the Kotzebue and Barrow regions to a high of 194% in the Norton Sound region. Diabetes prevalence rates among Alaska Native populations are now similar to the overall rate in the United States of 30.1 per 1,000 persons, a rate which has increased by just 13% since 1985.34
Alaska Native people previously had a lower risk for death from coronary heart disease than did Alaskans of other races. Over the past several decades, this discrepancy has disappeared.35 Heart disease currently accounts for 55% of all deaths among Alaska Native people.36 These higher rates of heart disease are due to the higher prevalence of risk factors for coronary heart disease among Alaska Native people in recent years. Tobacco smoking rates are very high in Alaska Native people, store-bought foods have replaced traditional foods in the diet to varying extents, and modern conveniences such as motorized vehicles have led many Alaska Native people to a more sedentary lifestyle.37 Thus, the changing patterns of disease in Alaska Native people likely reflect increases in smoking, decreases in physical activity, changes in dietary practices, and increased obesity.38,39 Increasing rates of diabetes and overweight/obesity are problems not only for Alaska Native people, but for all Alaskans. The prevalence of diabetes in the adult Alaska population has increased from 4.1% in 1996–1998 to 5.6% in 2003–2005.40 The percentage of all Alaska adults categorized as above normal weight (body mass index ≥25) has increased from 52.7% in 1991–1993 to 61.4% in 2003–2005.41
Fish consumption has been shown to reduce the occurrence of death from all causes,42 and many researchers have recommended maintaining or increasing fish consumption both for the cardiovascular disease prevention benefits as well as the benefits of preventing other chronic diseases.43 Federal and International Criteria for Acceptable Mercury Exposure Levels in Humans DPH recently reviewed information about the human health effects of mercury exposure through fish consumption.44 Sections of this review, or revised portions, are reprinted below for the purpose of these new state guidelines. The critical target organ for methylmercury toxicity is the central nervous system. Three acute, high-dose poisoning episodes that occurred in Japan and Iraq during the period from 1953 through 1972 elucidated the severe, toxic effects of methylmercury.45-47 These outbreaks occurred with extremely high exposures to mercury and resulted in death or severe, irreversible neurological damage. Investigators also noted milder toxic effects. In contrast to these high-dose poisoning episodes, the exposure of Alaskans to methylmercury through fish consumption is extremely small. Health effects of very low-dose mercury exposure from fish consumption, if any, are likely to be unmeasureable and of much less importance than many other variables that may impact neurological outcomes in children, such as pre-term birth, abuse and neglect, lower parental educational attainment, prenatal maternal alcohol and other drug use, and other factors. This is true even among the most sensitive segment of the population to the neurotoxic effects of methylmercury, i.e., the developing fetus.
15
Fish Consumption Advice for Alaskans
Two large-scale epidemiologic studies, as well as numerous smaller ones, have examined the potential association between chronic low-level in utero exposures to mercury and subtle neurodevelopmental effects. One study took place in the Seychelles Islands off the coast of Africa and the other in the Faroe Islands in the North Atlantic between Scotland and Iceland. Because of the large sample sizes and the homogeneous nature of both study populations, the studies provide the best opportunity to characterize the magnitude and nature of the risks potentially associated with low-level methylmercury exposure through fish and/or marine mammal consumption. Both studies have been reviewed and critiqued elsewhere.48,49 The results are summarized briefly here. The Seychelles Islands In 1989, the University of Rochester, in collaboration with the Seychelles Island Government, initiated a large scale study (the Seychelles Child Development Study) of 779 mother-infant pairs, examining the developmental effects of low-level methylmercury exposure through frequent fish consumption.50-54 Seventy-five percent of the women indicated eating 10–14 fish meals per week.54 Mercury levels in 20 different species of fish (homogenized muscle) ranged from 0.001 ppm for reef fish to 2.04 ppm for Moro shark, and 4.4 ppm for dog tooth tuna.50 The overall average fish muscle tissue concentration was 0.3 ppm. Multiple maternal hair samples were collected during pregnancy for quantification of methylmercury exposures. Maternal hair mercury levels were as high as 27 ppm with a median of 6.6 ppm (compared to a maximum of 7.82 ppm and median of 0.53 ppm in 359 women of childbearing age in Alaska17). All but two women in the study had hair concentrations under 20 ppm, and 659 (80% of the cohort) had maternal hair concentrations ≤ 12 ppm. Maternal hair concentrations did not vary during pregnancy. Maternal hair mercury levels in each trimester correlated with levels representing the entire gestational period, indicating no seasonal differences or peak exposure periods. Numerous neurodevelopmental tests and physical examinations were conducted on the children at 6.5, 19, 29, and 66 months of age. The neurologic evaluation included the Fagan Test, the Revised Denver Development Screening Test, the Bayley Scales of Infant Development, the General Cognitive Index, the Infant Behavior Record, Mental Developmental Index, McCarthy Scales of Children’s Abilities, Psychomotor Developmental Index, Preschool Language Scale, and numerous other perceptual, verbal, memory, behavior and motor tests. No adverse health effects resulting from prenatal or postnatal exposure to methylmercury were noted in the 66-month evaluation, or in any of the earlier tests.52 In fact, greater prenatal and postnatal exposure to methylmercury correlated with better performance on some test scores, an outcome that may have resulted from beneficial effects of increased fish consumption. A new cohort has been established in the Seychelles to investigate the benefits of fish consumption versus the potential risks of methylmercury exposure.55
During a subsequent follow-up of this cohort at age 9 years, tests previously reported to show an adverse association with prenatal exposure to methylmercury in the Faroe Islands were used.56 Investigators tested cognition (memory, attention, executive functions), learning, perceptual, motor, social and behavioral abilities. Of the 21 end-points evaluated, only two showed a significant association with prenatal methylmercury exposure. One association was adverse (the grooved pegboard, non-dominant hand) and the other association was beneficial (Conner’s Teacher Rating Scale, ADHD Index). As predicted, effects from other covariates known to affect child development were found. Consistent with the previous evaluations of this cohort, the investigators concluded that the findings did not support an association between prenatal exposure to methylmercury from consumption of large quantities of a wide variety of ocean fish and adverse neurodevelopmental consequences.56
16
Fish Consumption Advice for Alaskans
The Faroe Islands The other large-scale study took place in the Faroe Islands, where methylmercury exposure occurs primarily through consumption of pilot whale meat (1–2 meals a week) containing an average total mercury concentration of 3.3 ppm (1.6 ppm methylmercury).57 Of 1,023 consecutive births, the median umbilical cord blood mercury concentration was 24.2 ppb; 25.1% (n=250) had blood-mercury concentrations that exceeded 40 ppb. The median maternal hair mercury concentration was 4.5 ppm, with 12.7% (n=130) of women having concentrations exceeding 10 ppm.58
Evaluation of 583 subjects during infancy (age < 12 months) demonstrated that infants with higher hair mercury concentrations had more rapid achievement of developmental milestones than other infants. Increased frequency of breast-feeding was associated with better test performance and higher hair mercury concentrations.59
Possible in utero neurologic effects were evaluated at 7 years of age. Neurologic and developmental tests included the Neurobehavioral Evaluation System (NES) Finger Tapping Test, the NES Hand-Eye Coordination Test, NES Continuous Performance Test, the Tactual Performance Test, the Boston Naming Test for language skills, the Wechsler Intelligence Scale for Children-Revised (WISC-R), WISC-R Digit Spans, WISC-R Block Designs, WISC-R Similarities, Bender Gestalt Test for visuospatial skills, California Verbal Learning Test for memory, and the Nonverbal Analogue Profile of Mood States. Analyses of 917 children at 7 years of age found no clinical or neurophysiological mercury-related abnormalities. However, subtle decreases in neuropsychological test performance were associated with prenatal mercury exposure at maternal hair levels below 10 ppm, “although test scores obtained by most of the highly exposed children were mainly within the range seen in the rest of the children....”60 Interestingly, the Faroese children had excellent visual contrast sensitivity that may be attributed to the ample supply of dietary omega-3 fatty acids. At age 14 years, an association with prenatal methylmercury exposure and delays in the response of the brain to sound was reported; however, hearing thresholds were not affected by methylmercury exposure.61
Pilot whales also contain relatively high concentrations of PCBs and organochlorine pesticides. In 2001 Grandjean, et al, reported neurobehavioral deficits associated with PCBs in this cohort.62 PCBs were quantified by multiplying the sum concentration of 3 congeners by 2 to derive the total. This is a relatively crude method with which to quantify PCBs; more rigorous methods quantify many more congeners (typically 40 or more; 209 are possible) and sum them for a more accurate total. Such analyses allow consideration of structure-activity relationships of individual congeners, and increase power to detect significant associations with outcome variables.63 Four of the neuropsychological outcomes measured showed possible decrements associated with wet-weight PCB concentration, but not lipid-adjusted PCB concentrations. Adjustment for methylmercury reduced the association to a nonsignificant level. The strongest PCB effect was noted in those within the highest tertile of methylmercury exposure. Interestingly, the most sensitive parameter to the PCB exposure was the Boston Naming test, the endpoint selected by EPA to derive its reference dose for methylmercury. EPA concluded that “…methylmercury neurotoxicity may be a greater hazard than that associated with PCBs, but PCBs could possibly augment the neurobehavioral deficits at increased levels of mercury exposure.” Previous statistical analysis by this group indicated methylmercury-associated neurobehavioral deficits were unlikely to be affected by PCB exposure.64 A consideration of the potential neurobehavioral effects of PCBs and methylmercury suggests a need for further study to determine whether the effects noted in the Faroe Islands study result from methylmercury exposure alone.
17

Fish Consumption Advice for Alaskans
18
Summary The absence of associations between methylmercury exposures and neurodevelopmental effects in the Seychelles Islands study and the potential confounding effect of PCB exposure on the results of the Faroe Islands study cause continued debate among public health officials as to the appropriate study to use as the basis for dietary guidelines for seafood containing methylmercury. The Alaska Scientific Advisory Committee for Fish Consumption reviewed both studies, and decided that the Seychelles Islands study provides the most appropriate data for determining the human health risks posed by mercury exposure via fish consumption in Alaska. The Seychelles Islander and Alaskan exposure scenarios are comparable, as both populations eat large quantities of ocean fish with minimal influence from local mercury sources, and mercury levels in most fish species encompass a similar range in the two locations. The Committee was also concerned about the uncertainty associated with PCB confounding in the Faroe Island study, especially when Alaska fish have very low PCB levels. Further, potential differences in toxicity of mercury through consumption of pilot whale versus fish (such as the species of mercury present, the relative quantities and types of nutrients such as selenium, relative bioavailability and other issues) add uncertainty to the predictive power of the Faroe Island data. Therefore, the committee concluded that the Seychelles Islands study provided the most appropriate data to develop an Alaska-specific mercury Acceptable Daily Intake for use in fish consumption guideline calculations. Risk Assessment for Food Consumption Guidelines Currently, public health scientists and regulators have not reached a consensus on methylmercury dietary exposure guidelines. For example, FDA, the U.S. Agency for Toxic Substances and Disease Registry (ATSDR), and EPA each use different epidemiological studies to derive distinct guidelines (Table 7). FDA bases their dietary intake guidelines for methylmercury on knowledge gained from the acute poisoning episodes in Minamata and Niigata, Japan and Iraq. ATSDR bases their intake guidelines on the Seychelles data while EPA uses Faroe Islands data, and WHO considers both studies.

Fish
Con
sum
ptio
n Ad
vice
for A
lask
ans
19
Tab
le 7
. G
uide
lines
Der
ived
by
Var
ious
Age
ncie
s for
Acc
epta
ble
Mer
cury
Inta
ke L
evel
s
Age
ncy
NO
AE
L
Prim
ary
Stud
y Po
pula
tion
A
ccep
tabl
e D
aily
In
take
Lev
el
(ug/
kg B
W/d
ay)
Safe
ty
Fact
or
Exp
lana
tion
for
Safe
ty F
acto
r C
orr.
To
Blo
od1
Cor
r. T
o H
air1 P
0.22
6.
4 JE
CFA
(F
AO
/WH
O)
14 p
pm h
air
Use
d re
sults
of F
aroe
s (N
OA
EL 1
2 pp
m)
AN
D S
eych
elle
s (N
OA
EL 1
5.3
ppm
)
WC
BA
and
ch
ildre
n
3.2
– in
ter-
indi
vidu
al
varia
bilit
y in
dos
e re
cons
truct
ion
2 –
varia
bilit
y in
bl
ood/
hair
ratio
8.7
ppb
2.2
ppm
JEC
FA
(FA
O/W
HO
) 52
ppm
hai
r (L
OA
EL)
Japa
nese
dat
a al
l oth
er a
dults
0.
5 10
22 p
pb
5.2
ppm
ATS
DR
(U.S
.) 15
.3 p
pm
Seyc
helle
s
0.3
4.5
3 –
phar
mac
o va
riabi
lity
1.5
– te
mp
lack
of
certa
in te
sts
ATS
DR
(U.S
.)
Seyc
helle
s N
ot a
dopt
ed
by A
TSD
R
0.4*
3*
phar
mac
o va
riabi
lity
*rea
sona
ble
chan
ge;
dom
ain-
spec
ific
test
s no
w a
vaila
ble
U.S
. EPA
85
ppb
blo
od
benc
hmar
k do
se
Faro
es –
low
er 9
5% C
L on
the
BM
D (5
8 pp
b)
0.
1 10
5.8
ppb
1.2
ppm
Hea
lth C
anad
a 10
ppm
hai
r
WC
BA
and
ch
ildre
n 0.
2 5
inte
r-in
divi
dual
va
riabi
lity
LOC
20
– 10
0 pp
b A
ctio
n >1
00
ppb
Hea
lth C
anad
a
al
l oth
er a
dults
0.
5
U.S
. FD
A
200
ppb
bloo
d (L
OA
EL)
Japa
nese
dat
a al
l oth
er a
dults
0.
5 10
20 p
pb
1 =
"Acc
epta
ble"
blo
od a
nd/o
r hai
r lev
els e
xpec
ted
to c
orre
spon
d to
the
acce
ptab
le d
aily
inta
ke le
vel
U.S
. EPA
= U
nite
d St
ates
Env
ironm
enta
l Pro
tect
ion
Age
ncy
JEC
FA =
Join
t FA
O/W
HO
Exp
ert C
omm
ittee
on
Food
Add
itive
s (FA
O/W
HO
) A
TSD
R =
Age
ncy
for T
oxic
Sub
stan
ces a
nd D
isea
se R
egis
try
U.S
. FD
A =
U.S
. Foo
d an
d D
rug
Adm
inis
tratio
n
W
CB
A =
Wom
en o
f chi
ldbe
arin
g ag
e LO
AEL
= L
owes
t obs
erve
d ad
vers
e ef
fect
leve
l
N
OA
EL =
No
obse
rved
adv
erse
eff
ect l
evel
LO
C =
Lev
el o
f con
cern
B
MD
= B
ench
mar
k do
se
Fish Consumption Advice for Alaskans
World Health Organization (WHO) WHO recently established a new Provisional Tolerable Weekly Intake for methylmercury of 1.6 µg/kg body weight/week (or a Provisional Tolerable Daily Intake of 0.22 µg/kg body weight /day) based on the results of the Faroe Islands and Seychelles Islands cohort studies.18 WHO determined a No Observable Effect Level relating to subtle neurobehavioral effects from in utero methylmercury exposure. WHO calculated the No Observable Effect Level of 14 ppm for methylmercury in maternal hair based on the ‘critical endpoint’ of 12 ppm from the Faroe Islands study and 15.3 ppm from the Seychelles Islands study. As noted previously, no effects were attributed to methylmercury exposure in the Seychelles study, and the value of 15.3 ppm represents the mean maternal hair level of mothers in the highest exposure group. Using the standard steady state one-compartment model for methylmercury, and applying an uncertainty factor of 6.4, the No Observable Effect Level represented by a methylmercury concentration of 14 ppm in hair was converted to the Provisional Tolerable Daily Intake of 0.22 µg/kg body weight /day. The Provisional Tolerable Daily Intake corresponds to a hair value of 2.2 ppm and a blood value of 8.7 ppb.18 This Provisional Tolerable Daily Intake applies to children and women of childbearing age. WHO established a Provisional Tolerable Daily Intake of 0.5µg/kg body weight/day for adults other than women of childbearing age, which the agency reaffirmed in 1999.65 This Provisional Tolerable Daily Intake for the “general population” was established for adults from the Japanese data, and is based on a Lowest Observable Adverse Effect Level for methylmercury in whole blood of 220 ppb (52 ppm hair). WHO used an uncertainty factor of 10 to derive the Provisional Tolerable Daily Intake. Similarly, the Iraqi data provided a Lowest Observable Adverse Effect Level of 240 ppb to 480 ppb in whole blood. For adults the clinical adverse effect detectable at the lowest methylmercury dose is paresthesia (a numbness and tingling sensation) of the mouth, lips, fingers, and toes. The Japanese hair samples were originally analyzed by the dithizone procedure, yielding a value of 52 ppm in the patient with paresthesia with the lowest level of hair mercury. A later reanalysis of the hair from that patient using the newer atomic absorption technique yielded a value of 82.6 ppm.66 All other affected individuals had hair mercury levels above 100 ppm. Based on available models, a consistent intake of the WHO’s Provisional Tolerable Daily Intake (0.5 µg/kg body weight /day) would correspond to a blood mercury concentration of 20 ppb and a hair mercury concentration of 5 ppm. These exposure levels are one tenth of the Lowest Observable Adverse Effect Level of 220 ppb (blood). The 1999 WHO Committee also noted “that fish (the major source of methylmercury in the diet) contribute importantly to nutrition, especially in certain regional and ethnic diets, and recommended that, when limits on the methylmercury concentration in fish or on fish consumption are under consideration, the nutritional benefits are weighed against the possibility of harm.”65 U.S. Food and Drug Administration (FDA) FDA followed the approach taken by WHO and derived its action level for commercial sale of 1 ppm mercury (wet weight) in the edible portion of fish based on the Japanese data.67 FDA calculated the action level for edible portions of seafood for interstate commerce by assuming an acceptable methylmercury daily intake of 0.5 µg/kg body weight/day, a half pound (226 g) of fish consumed per week, and a 70 kg adult, resulting in a tolerance level of 1 ppm (1 ppm = [0.5 µg/kg x 7 days x 70 kg]/226 g of seafood consumption). U.S. Agency for Toxic Substances and Disease Registry (ATSDR) ATSDR derived an oral Minimal Risk Level of 0.3 µg/kg body weight/day68 based on the 66-month evaluation of the Seychelles Child Development Study.52 ATSDR selected the mean maternal hair level of 15.3 ppm in the group with the highest exposure to represent the No Observed Adverse Effect Level and derivation of the chronic oral Minimal Risk Level for methylmercury. An uncertainty factor of 4.5 was used to account for human pharmacokinetic and pharmacodynamic variability (3.0) and a modifying factor of 1.5 to account for the lack of domain-specific tests used in the Seychelles Islands cohort compared to the Faroe Islands cohort.
20
Fish Consumption Advice for Alaskans
ATSDR stated that the modifying factor of 1.5 could be removed if the results of the domain-specific tests in the 96-month Seychelles evaluation are consistent with previous results (i.e., no effects due to methylmercury exposure). As noted earlier, preliminary results of the 107-month evaluation do not support an association between prenatal exposure to low levels of methylmercury from consumption of ocean fish with background levels of contamination and adverse neurodevelopmental consequences. Thus, one may conclude that ATSDR should raise its Minimal Risk Level from 0.3 µg/kg body weight /day to 0.4 µg/kg body weight /day. ATSDR selected the Seychelles Islands study over the Faroe Islands study primarily because the Seychellois diet more closely resembles that of persons living in the United States. The Seychellois primary exposure to methylmercury is fish containing concentrations of methylmercury similar to the typical range seen in the United States (0.004 ppm to 0.75 ppm). The Seychellois, however, consume approximately 10 to 20 times more fish than the United States population; this is similar to the high rates of fish consumption in some Alaska communities. In contrast, the majority of methylmercury exposure in the Faroe Islands cohort was from pilot whale, with a small portion from fish. Unlike the Seychelles Islands fish, pilot whale hunted by the Faroese contains high concentrations of PCBs and organochlorine pesticides. It is still not clear to what degree concurrent in utero exposure to PCBs influenced the outcome of the neurobehavioral tests in the Faroe Islands study.48,62,68 United States Environmental Protection Agency (EPA) In 2001, EPA calculated its reference dose of 0.1 µg/kg body weight/day for methylmercury using the results of the Faroe Islands study.60,69 Grandjean et al reported “significant associations between either maternal hair mercury or cord-blood mercury and decrements in several neuropsychological measures.”60 EPA selected the Boston Naming Test as the critical endpoint. To estimate the level of exposure or dose that is associated with an increase in adverse effects, or “benchmark dose”, EPA relied on the statistical analysis performed by Butdz-Jorgensen et al.64 The benchmark dose, defined as the dose associated with a doubling of the rate of incorrect responses on the Boston Naming Test (from 5% to 10%), was 85 ppb mercury in cord blood. Using current models and applying an uncertainty factor of 10, EPA then used the lower 95% confidence limit of the benchmark dose, i.e., 58 ppb, to calculate a reference dose of 0.1 µg/kg body weight/day, a value identical to that derived from the Iraqi data.71 The reference dose of 0.1 µg/kg body weight/day corresponds to a hair mercury concentration of 1.2 ppm and a blood mercury concentration of 5.8 ppb. Health Canada Health Canada has derived a provisional tolerable daily intake (PTDI) of methylmercury for women of reproductive age and infants of 0.2 µg/kg body weight/day, and they use 0.5 µg/kg body weight/day for other adults.48 Based on the recent epidemiological data, Health Canada established a provisional No Observable Adverse Effect Level of 10 ppm mercury in maternal hair. By applying an uncertainty factor of 5 to account for interindividual variability, Health Canada derived the Provisional Tolerable Daily Intake of 0.2 µg/kg body weight/day.48 For biomonitoring studies, Health Canada applies the following ranges: a blood mercury value of ≤ 20 ppb is normal, 20 ppb to 100 ppb is the level of concern, and greater than 100 ppb is their action level.72,73 A blood value of 20 ppb corresponds to 5 ppm in hair. Arctic Monitoring and Assessment Programme (AMAP) Since 1991, the international Arctic Monitoring and Assessment Programme (AMAP) has evaluated the potential human health impacts of exposures to arctic contaminants such as mercury and PCBs.73,74 Public health officials from AMAP and other arctic scientists have concluded that the nutritional and physiological health benefits of traditional arctic subsistence foods outweigh potential risks from contaminants in most areas of the Arctic, and advise local public health policy makers to encourage continued traditional food use when indicated by risk-benefit analyses.73,74
21

Fish Consumption Advice for Alaskans
This was recently highlighted at the 2002 AMAP meeting in Rovenemi, Finland by the AMAP human health working group, and at the 2002 Arctic Council meeting in Saariselka, Finland. The working group also stated that public health officials should use methylmercury intake guidelines only as tools to craft dietary advice, not as a strict standard. The AMAP pointed out that the EPA reference dose for methylmercury only considers the potential risks and does not take into account the well-known benefits of fish consumption. Local Risk Management Issues for Mercury in Fish from Alaska It is widely recognized that local risk management is an essential element of developing optimal public health advice regarding consumption of locally-caught fish.14,75 States vary tremendously in many relevant ways, including reliance on locally caught fish, consumption practices, contaminant concentrations in local fish, and the health status of local populations. When only weak data support an association between an exposure and adverse outcomes, as is the case for mercury exposure at the low levels present in most Alaska fish, then public health officials can place more weight on factors such as local economics and cultural considerations when developing consumption advice. Alaska has many unique characteristics that distinguish it from the rest of the nation (and that distinguish individual regions within Alaska from each other). These include the vast geographical distances and limited transportation systems that limit alternate food choices in rural villages, a heavy reliance on fish as a subsistence food, both for basic caloric needs and nutrition and as an anchor for Native culture, and an abundant supply of fish with extremely low mercury levels. Alaska’s unique characteristics, in combination with the weak data supporting any association between low-level mercury exposure and neurological outcomes, make the generic joint advice of EPA and FDA, which encourages women and young children to limit their fish consumption to 12 ounces weekly,2 inappropriate for the State of Alaska.3
Description of Alaska Alaska, encompassing 586,412 square miles, is larger than Texas, California and Montana combined. To walk across this “great land” at its widest point would be to walk from California to Florida: 2,400 miles from west to east and 1,420 miles from north to south. The 2005 Census estimated the population of Alaska as 663,661 persons. Of these, 70% were white. Alaska Native people comprised 16% of the population and 26% of births. Within the Alaska Native population are the following groups: Aleut, Eskimo (Yupik, Inupiat), and Indian (Athabaskan, Tlingit, Haida, and Tsimshian). Based on 1999 estimates, 42% of the State’s population resided in Anchorage, 52% in the three largest cities (Anchorage, Fairbanks, and Juneau), and 77% in the five largest census areas (Anchorage, Fairbanks, the Kenai Peninsula, Matanuska-Susitna Borough, and Juneau). While 70% of all Alaskans lived in urban or suburban areas of 2,500 persons or more, 46% of Alaska Native people lived in rural towns and villages with less than 1,000 persons. Only five of Alaska’s urban centers are connected by road. Alaska includes vast wilderness areas dotted with isolated villages, some with fewer than a dozen persons. Many villages lack basic public health infrastructure such as in-home piped water and septic systems,76 and remain accessible only by small airplane or boat. Throughout rural Alaska, local economies are poorly developed and many residents live below the federal poverty line. Most villagers in rural Alaska rely on the land and its wildlife as a major food source; subsistence food gathering includes hunting, fishing, trapping, and gathering wild berries and other plant products.
22
Fish Consumption Advice for Alaskans
Cultural and Societal Importance of Fish in Alaska The use of traditional foods, including fish, provides a basis for cultural, spiritual, health, nutritional, medicinal, and economic well being among Alaska Native people and indigenous peoples. The social aspects of sharing in subsistence harvests and feasts associated with age-old traditions are integral to the cultural fabric of current-day Alaska Native people. Subsistence activities use local knowledge and skills and provide an opportunity to pass on knowledge from generation to generation, preserving cultural and community identity. Subsistence harvest activities are an opportunity for physical activity, self-reliance and meaningful productive work, especially in remote areas where few wage paying jobs exist. Thus, traditional food is “the basis of social activity and of the maintenance of social bonds through its production and distribution. This is the essence of subsistence not simply as an activity, but as a socio-economic system.”77 Thus, the social and cultural disruption associated with food consumption advisories can have profound and measurable effects on the health and well-being of subsistence communities.78 One Alaska Native leader put it this way: “The act and ritual of our subsistence food activities encompass who we are, and all that we are and is a vital source of our spirituality. I emphasize these things because I want you to know how much of an impact the threat of contaminants has on these things which are so sacred to us.” (Sally Smith, Chair, Alaska Native Health Board). The importance of fish and the act of fishing extends beyond Alaska Native people to influence the majority of all Alaskans. While over 90 percent of rural households participate in subsistence fishing activities in Alaska, about half of all rural Alaska residents are not Alaska Native people.85 Thus, subsistence is central to the culture, economy, and way of life of almost all rural households, whether residents are of Alaska Native origin or not. Statewide, approximately 60% of Alaska residents over the age of 18 could be classified as “active anglers”.79 Even in urban areas, the primary motivation for many of these fishers was to obtain fish for food. During 2000, 22% of active fishers purchased a sport fishing license in Alaska primarily for the purpose of obtaining a Personal Use fishing permit to harvest fish or shellfish in Alaska.79 Alaska’s Personal Use fisheries are designed to allow Alaskan residents to harvest fish for food in designated areas that are not eligible for subsistence fisheries (such as Cook Inlet) using fishery-specific techniques such as dipnetting or gillnetting.80 Many urban (and other) Alaskan families have embraced this unique opportunity to harvest sufficient salmon (or other species in some areas) to eat throughout the year. Economic Importance of Subsistence In addition to the socio-cultural value and associated physical activity, traditional foods such as fish have great economic value in Alaska. In rural Alaska, family incomes are often low and store-bought foods are several times the price found in Anchorage, so traditional foods such as fish provide an important source of nutritious and affordable food in many communities. Approximately 90% of rural households participate in subsistence activities, as traditional foods can be obtained with little or moderate costs compared to the cost of market foods. Unemployment is relatively high in rural Alaska, although published figures typically underestimate unemployment rates.81 Only about 25% of employed Alaska Native people hold jobs in remote rural areas outside of the regional centers.81 During 2000, 20% of Alaska Native people lived in households with incomes below the national poverty level and the per capita income in remote areas was $14,032.82 These statistics mask much worse economic conditions in some villages, generally those with a high reliance on subsistence food gathering. Despite low economic status, the geographic isolation, high transportation costs, and harsh climate in rural areas of Alaska contribute to a much higher cost of living compared to urban areas. Electricity can cost four times more in rural Alaska, and food generally costs at least 50% more.83 Store-bought foods are very expensive in rural Alaska, particularly in remote areas inaccessible by road where food items must be imported by plane or boat. For example, food for a week for a family of four eating at home costs $187 in Bethel, $173 in Nome, and $106 in Anchorage according to a 2003 survey.84
23
Fish Consumption Advice for Alaskans
Statewide, the costs associated with replacing subsistence foods with market substitutes in rural Alaska ranges from $131 to $218 million annually.85 In the Northwest Arctic Borough, where residents harvest an average of 617 pounds of wild foods per year, the cost of replacing those foods with market foods (assuming a $5 per pound replacement value) would total $3,085 per year, or roughly 20% of the per capita income of the region.86 In the Yukon-Koyukuk census area, yearly wild foods harvest replacement costs would total 26% of per capita income, and 53% in the Wade Hampton census area of southwest Alaska. Recent analyses of subsistence data from ADF&G performed by the Alaska Department of Community and Economic Development estimates that subsistence harvests provide residents of the Northwest Arctic Borough with 56% of their caloric requirements, and nearly four times the amount of protein consumed by the typical American.87 Thus, replacing subsistence foods with market foods presents both negative health and economic consequences to Alaska Native people and other rural Alaska residents. Recreationally-caught fish are also valued economic assets to Alaskans. Residents who fish recreationally expect to receive benefits of greater value than the expenses they incur when going fishing. Economists estimate that the average value (over and above expenses) that individual Alaskans place on their annual recreational fishing is $714 (2003 dollars)—technically referred to as “net economic value”.88
Employment Significance of Alaska Fisheries The commercial fishing industry in Alaska provides many Alaskan residents with a livelihood. It is the number one private basic sector employer in Alaska, providing more jobs than oil, gas, timber, or tourism.89 In Southeast Alaska the seafood industry accounted for 43.9% to 47.8% of all jobs in the private basic sector in 1994.90 In that year, the commercial fishing industry in Southeast Alaska alone employed 7,155 Alaska residents.90 Thriving commercial fishing industries provide employment to many Alaska residents in other parts of the state, including Dutch Harbor, Kodiak, Naknek-King Salmon, Seward, Homer, Kenai, Bristol Bay, and the Aleutian/Pribilof Islands. In all, over 4.46 billion pounds of seafood were harvested from Alaskan waters in 2000, comprising approximately 48% of the entire U.S. seafood harvest.89
Many Alaskans make a living as sport fishing guides. In 1999, ADF&G registered 4,225 sport fishing guides and 2,242 sport fishing service businesses.91 Of those registered businesses, 1,215 vessels provided saltwater sport fishing charter services in 1999 in Alaska.91 The charter boat industry operates predominantly in Southeast and Southcentral Alaska. As stated by Kevin C. Duffy, former Commissioner of the ADF&G, “Alaska is a world class destination for sport fishing. Alaska’s sport fishing guide industry provides access to fishery resources for those who might not otherwise be able to access them. This industry provides significant economic benefits to Alaskans by creating jobs and bringing tourism dollars into Alaska’s communities.”92
Risks of Less Healthy Replacement Foods In rural Alaska, supermarkets are rare and existing village stores are often poorly stocked. Residents cannot obtain many fresh foods at any cost. Small village stores sell convenience items including chips, canned soda, and candy, have a limited supply of meat and dairy products, and usually have a poor supply of fresh fruits and vegetables. Thus, an insufficient variety in products exists to provide healthy alternatives to traditional foods, and shopping excursions to major cities and shipping can be costly. The market foods available to replace locally harvested wildlife have higher concentrations of saturated fat, trans-fat, salt, vegetable oils, and carbohydrates and often provide less nutrient value.93
Dietary shifts away from traditional food use have been documented in some parts of the Arctic. In Canada, approximately 60–70% of the total energy in the contemporary diet of Dene and Inuit peoples consists of market foods, resulting in a diet much higher in fat and carbohydrates, and lower in protein than their traditional diet.25 Similarly, during a dietary survey of 74 Alaska Native women residing in and near Anchorage, only a small proportion reported eating any traditional foods, and intake was very infrequent. The participants reported high intakes of fats/oils and sweets, and intake of some nutrients was low.94
24
Fish Consumption Advice for Alaskans
While dietary changes are complex in nature, they often coincide with a number of other lifestyle changes that also contribute to increases in chronic diseases such as heart disease, diabetes, and cancer. Diet and lifestyle factors influence most of the leading causes of death in Alaska. Switching from a subsistence lifestyle and diet to a more sedentary existence and a “Westernized” diet high in saturated and trans fats and carbohydrates has contributed to a pattern of increasing obesity and chronic disease among many indigenous populations in North America and the Pacific Rim.27 The prevalence of obesity in Alaska has increased dramatically in recent years, from 48% in 1991–1993 to 61% in 1999–2001, representing a 26% increase.29 Increasing non-traditional food use and sedentary lifestyles among Alaska Native people have been associated with an increasing chronic disease prevalence, including an increase in hypertension, glucose intolerance, and diabetes.26-28
Health Benefits of Fish Consumption This section (pages 25–28) is adapted from a previously unpublished review by Tracey V. Lynn, DVM, MPH. Fish provides a diet rich in high quality protein, low in saturated and trans fats, and rich in omega-3 polyunsaturated fatty acids. Fish contains all of the essential amino acids, and is an excellent source of the fat-soluble vitamins A and D, as well as selenium and iodine. Selenium is an essential trace mineral important for the proper functioning of antioxidant enzymes, the immune system and thyroid gland, and is protective against the toxic effects of mercury.95
The traditional Alaska Native diet, which is low in saturated fat and high in monounsaturated fat and omega-3 polyunsaturated fatty acids from fish and marine oils, is considered to be more healthy than the typical Western diet, especially beneficial in preventing heart disease, and possibly beneficial in preventing non-insulin dependent diabetes mellitus.96-99 Fish and marine mammals, and to a lesser extent shellfish, are the only significant direct dietary sources of two types of omega-3 polyunsaturated fatty acids: eicosapentaenoic acid (EPA, 20:5) and docosahexaenoic acid (DHA, 22:6). In addition to providing healthy fats to the diet, fish is also an excellent source of protein and contains other nutrients in varying quantities depending upon the species. A 3-ounce serving of cooked king salmon provides 40% of the daily requirement of protein, 9% of the daily requirement for iron, and 7% of the daily requirement for vitamin A.100
Great interest exists in studying the beneficial effects of dietary seafood that is high in omega-3 polyunsaturated fatty acids. This interest traces its origins to two Danish physicians, Bang and Dyerberg, who in 1970 observed a low incidence of cardiovascular diseases in Greenland Eskimos and who showed a strong association between this lack of heart disease and a marine-based diet.101-103 Many subsequent studies have documented additional health benefits from omega-3 polyunsaturated fatty acids.104-106
A dietary shift from fish, marine mammals, wild game meats and plants to a typical Western diet rich in saturated fat from dairy and meat products and linoleic acid from vegetable oils changes the balance between omega-6 and omega-3 polyunsaturated fatty acids. Specifically, significant dietary increases in omega-6 vegetable oils and decreases in the dietary intake of DHA and EPA (oils from fish and marine mammals) result in an increased ratio of omega-6 to omega-3 polyunsaturated fatty acids in the diet. Diets relying upon fish, wild game and plants provide an estimated 1:1 omega-6 to omega-3 polyunsaturated fatty acid ratio, while the current Western diet provides a ratio that may be as high as 10:1 to 20–25:1.107 A high omega-6 to omega-3 ratio enhances ischemic and inflammatory processes, leading to an increase in chronic diseases.106 Eicosanoids derived from omega-6 polyunsaturated fatty acids promote inflammation, while those derived from omega-3 polyunsaturated fatty acids are anti-inflammatory, and act as competitive inhibitors of the omega-6 derived inflammatory mediators.
25

Fish Consumption Advice for Alaskans
The scientific literature explores this potential influence of absolute or relative omega-3 deficiency, and the potential effect of supplementation, on a variety of chronic diseases, including arthritis and inflammation, depression, skin disorders, diabetes, cardiovascular disease, eye disorders, cancer and cancer therapy, neonatal growth and development, pregnancy outcome, and immune function.108 In recent years, the amount of research and number of publications has increased exponentially, and have consistently supported the health benefits of omega-3 polyunsaturated fatty acids.109
Neonatal Growth and Development and Healthy Pregnancies Humans appear to have evolved on a diet with a 1:1 ratio of omega-6 to omega-3 fatty acids. The current ratio, up to 25:1, may be inadequate to meet omega-3 needs for optimal health, especially during pregnancy. Increased omega-3 polyunsaturated fatty acid consumption during pregnancy may result in decreased frequency of or risk from eclampsia, gestational diabetes, and pre-term delivery. In the United States, the annual cost of pre-term births is several billion dollars, with significant long-term implications for health and quality of life.110 Polyunsaturated fatty acids, predominately in the form of DHA, are present in large amounts in the grey matter of the brain, nerve synapses, the retina of the eye and other specific body locations.111-113 During the third trimester, omega-3 polyunsaturated fatty acids are selectively mobilized to meet the demands of increased neural and vascular growth.114,115 Of all adult brain cells, 70% are formed before birth. Omega-3 polyunsaturated fatty acid concentrations and the ratio of omega-6 to omega-3 polyunsaturated fatty acids are important for optimal brain and retinal development, maturation of the visual cortex, and motor skill development.116-121 More recent reviews of the literature support an association between increased maternal intake of omega-3 polyunsaturated fatty acids with increased gestational length in newborns.110,120
Findings of diminished omega-3 polyunsaturated fatty acids in cell membranes during lactation and pregnancy have led some nutritionists to speculate a need for omega-3 fatty acid supplementation during pregnancy to promote optimal brain and visual development.116,122 Maternal DHA status during pregnancy, and the availability of optimal DHA levels to the developing fetal brain, is largely dependent on the maternal diet.123
The recent EPA/FDA advice, which recommends limiting fish consumption to 12 ounces per week,2 might actually be harmful to early child development. A recent study of nearly 12,000 pregnant women in the United Kingdom found that maternal seafood intake during pregnancy of less than 12 ounces per week was associated with increased risk of their children being in the lowest quartile for verbal IQ, compared with mothers who consumed more than 12 ounces per week.124 Other outcomes negatively affected by eating 12 ounces of seafood per week or less included prosocial behavior, and development of fine motor, communication, and social development skills. For each outcome measure, the higher the maternal seafood intake the less likely the infant was to have a suboptimum score. Reduction in Cardiovascular Disease Initial observations of a decreased prevalence of ischemic heart disease among the Greenland Eskimos prompted investigations into the possible beneficial effects of consuming fish and marine oils. Greenlandic Eskimos have significantly lower levels of total cholesterol and triglycerides, higher levels of high density lipoproteins, and decreased platelet aggregability than Danish comparisons.125,126 The effect of omega-3 polyunsaturated fatty acids on cardiovascular disease has since developed into an area of intense scientific interest, with numerous publications available, nearly all of which document beneficial effects on cardiovascular health. The strength of the evidence prompted the American Heart Association in 2000 to provide the following dietary guideline: “Because of increased evidence for the cardiovascular benefits of fish (particularly fatty fish), consumption of at least 2 fish servings per week is now recommended.”127
26
Fish Consumption Advice for Alaskans
Fish and fish oils are known to have a favorable effect on a variety of factors that are known or suspected of reducing cardiovascular disease risk.128-130 Dietary intake of omega-3 polyunsaturated fatty acids shifts the eicosanoid balance from proaggregatory and vasoconstrictory to antiaggregatory and vasodilatory.128,131
While all of the mechanisms by which omega-3 polyunsaturated fatty acids work to improve cardiovascular functioning remain to be determined, one important measure is the decreased risk of sudden death (i.e., myocardial infarction) among men without evidence of prior cardiovascular disease.132 The potential decrease in cardiovascular mortality from increased omega-3 polyunsaturated fatty acid consumption is quite large. In one review of the evidence from three large clinical trials, the authors suggest that omega-3 polyunsaturated fatty acids may be as important as statins for the prevention of death in post-myocardial infarction patients.133 Another recent review concluded that modest fish consumption (1–2 servings per week), especially fatty fish rich in omega-3 polyunsaturated fatty acids, reduces the risk of coronary death by 36%, and total mortality by 17%.134
Cancer Cancer incidence rates among Alaska Native people have increased by nearly 50% during the last 30 years.138 While the causes for this increase are likely complex, concern among Alaska Natives exists that exposure to contaminants in traditional foods contributes to the problem:
“People on the island are very concerned about the animals we eat now. They think there might be something wrong because they are getting very skinny. A couple of years ago there was a lot of dead birds all over the beach. I wonder why this is happening. The elders said that there never used to be cancer but now they are getting cancer. They think it might be from the Northeast Cape site.”
Herman Toolie, Savoonga (quoted in 139) Recent ecologic studies involving cross-national comparisons have documented an inverse relationship between per capita fish consumption and the incidence of breast and prostate cancer, and a temporal association exists between decreased fish consumption over time and increased incidence of these cancers (reviewed in 140). These temporal trends are also seen in Alaska where data from 1984–1998 indicate that the greatest increases in cancer incidence among Alaska Native people are for lung, breast, and prostate cancers.138 During the first five years of the Alaska Native Cancer Registry (1969–1974), Alaska Native women developed breast cancer half as often as white women in the United States; however, this has changed to the extent that the incidence rates in both groups were nearly equal during the years 1984–1998, primarily due to an increase in incidence among Alaska Native women.138
In recent years, many studies have worked to evaluate the relationship between fish consumption and cancer. Unfortunately, many of these studies have evaluated total fish consumption, and have not given consideration to intake of omega-3 fatty acids, which are more plentiful in fatty fish compared with lean fish. Studies indicate that the omega-6 to omega-3 ratio is more important than total fish consumption to the risk of developing cancer. A recent review of the literature on associations between polyunsaturated fatty acids and breast and colorectal cancer identified the omega-6:omega-3 ratio as “crucial,”141 as omega-3 fatty acids act through competitive inhibition. Thus, the inhibitory effects of omega-3 polyunsaturated fatty acids on the enzyme systems involved in cancer development and progression appear to depend on the relative levels of omega-6 polyunsaturated fatty acids. In addition, a diet high in omega-6 polyunsaturated fatty acids leads to oxidative DNA damage, and increases the risk for breast and colon cancer, and for metastatic cancers.141 Thus, the mixed results from epidemiologic studies may result from incomplete consideration of the fatty acid ratio.142 Another complicating factor is that food frequency questionnaires might not be sensitive enough to accurately estimate fish and omega-3 polyunsaturated fatty acid consumption.143
27

Fish Consumption Advice for Alaskans
There is also good evidence that fish consumption helps reduce the risk of developing prostate cancer. Among 47,882 men followed for 12 years as part of the Health Professionals’ Follow Up Study, men with higher consumption of fish had a lower risk of prostate cancer, and especially metastatic cancer.144 Omega-3 polyunsaturated fatty acids and fish consumption also appear to protect against other cancers, including lung and digestive tract cancers. Data from an integrated series of case-control series in Italy found that higher levels of fish consumption (compared with the lowest consumption group) consistently provided protection against the risk of digestive tract cancers, especially colon and rectal cancer.145
Conclusions Regarding Health Benefits of Fish Consumption Overall, the health status of Alaska’s population has improved greatly during the last fifty years, especially among Alaska Native people. Life expectancy has increased and infant mortality has decreased. The improvements in health status are associated with public health interventions including improvements in sanitation, treatment of infectious diseases, prevention efforts such as immunizations, and improved medical care. While 50 years ago infectious diseases were a leading cause of death, today the leading causes of death in Alaska are related to a “Westernized” diet and lifestyle, which has led to increases in cancer, heart disease, and diabetes. Many researchers have recommended maintaining or increasing consumption of foods rich in omega-3 polyunsaturated fatty acids, such as fish, both for the cardiovascular disease prevention benefits as well as the benefits of preventing other chronic diseases.43
Fish harvest and consumption in Alaska provide important cultural, economic, nutritional and health benefits. Scientific evidence provides extensive documentation of the nutritional superiority and health benefits of fish relative to many other protein sources. Strong evidence exists that decreased consumption of fish—rather than increased consumption—leads to adverse neurological outcomes in the fetus and young child. Particularly in rural Alaska, where healthy alternatives may be limited, recommendations to restrict fish consumption could result in unintended and undesirable consequences in the population. Reduced reliance on fish and other traditional foods often results in increased consumption of market foods high in carbohydrates, sugars, and saturated fats that provide inferior nutrient value. Unfortunately, these dietary changes already appear have affected Alaskans. Increased use of store-bought, processed foods high in saturated fats, processed sugars, trans-fats, and salt in combination with a sedentary lifestyle have contributed to higher chronic disease prevalence rates among Alaska Native people. Dietary changes such as these promote hypertension, glucose intolerance, obesity, diabetes, cardiovascular disease, preterm birth and cancer. Scientific research continues to document the many benefits of omega-3 polyunsaturated fatty acids, which are found in high levels in fish.75 These benefits may include a reduced risk of developing cardiovascular disease, diabetes, and cancer. In addition, omega-3 polyunsaturated fatty acids are critical for a healthy pregnancy and neonatal growth and development. Increasing omega-3 polyunsaturated fatty acid consumption could decrease chronic disease prevalence and increase healthy life-years. In Alaska, multiple data sources support the assertion that the benefits of fish consumption far outweigh the small, theoretical risks associated with mercury exposure. Consensus Recommendations from the Alaska Scientific Advisory Committee for Fish Consumption After careful evaluation of the information presented thus far, the Alaska Scientific Advisory Committee for Fish Consumption achieved consensus on the following points: • The 2004 EPA/FDA federal fish advisory,2 which advises sensitive populations to limit fish consumption
to 12 ounces per week, is inappropriately restrictive for Alaskans because it does not adequately factor in the relatively low levels of mercury in most Alaska fish species and the important health benefits of fish consumption.
28

Fish Consumption Advice for Alaskans
• Fish consumption guidelines for women who are or can become pregnant, nursing mothers and young children are warranted for a small number of Alaska fish species due to elevated mercury levels in these fish (see Fish Consumption Guidance below). However, the EPA reference dose for mercury is unnecessarily restrictive for application in Alaska, where the risk/benefit balance is influenced strongly by local factors.
• The U.S. Agency for Toxic Substances and Disease Registry (ATSDR) struck the most appropriate balance in risk interpretation of mercury intake for public health purposes in developing its No Observed Adverse Effect Level of 0.0013 mg/kg body weight/day, which was based upon an analysis of the Seychelles Islands epidemiologic study.68
• The Seychelles Islands study provides the most appropriate data for determining the human health risks posed by mercury exposure via fish consumption in Alaska. The Seychelles Islander and Alaskan exposure scenarios are comparable, as both populations eat large quantities of ocean fish that have minimal influence from local mercury sources, and the two locations have similar mercury levels in most fish species. Therefore, the Seychelles Islands study provides the most appropriate data to develop an Alaska-specific Acceptable Daily Intake for methylmercury for use in consumption guideline calculations.
• For Alaska’s purposes, it is appropriate to remove the 1.5-fold modifying factor that ATSDR originally used in its Minimal Risk Level calculation to account for domain-specific findings in the Faroe Island study. The domain-specific tests have since been performed in the Seychelles cohort, and no negative associations with mercury exposure were observed.56 When the 1.5-fold modifying factor is removed, a 3-fold uncertainty factor remains.
• The 3-fold uncertainty factor applied to ATSDR’s No Observed Adverse Effect Level provides sufficient protection against any subtle neurodevelopmental effects from mercury exposure. Additional uncertainty factors are not warranted and would result in fish consumption restrictions that would likely be more harmful than beneficial to the health of Alaskans.
• Therefore, the Alaska-specific chronic oral Acceptable Daily Intake for methylmercury for women who are or can become pregnant, nursing mothers, and young children is 0.0004 mg/kg body weight/day. This value was derived using the ATSDR No Observed Adverse Effect Level of 0.0013 mg/kg body weight/day52 divided by a 3-fold uncertainty factor for human pharmacokinetic and pharmacodynamic variability.
• Alaska demographic groups other than women who are or can become pregnant, nursing mothers, and young children should continue to enjoy unlimited consumption of all fish from Alaska waters.
• Fish consumption advice must be tailored and targeted for specific demographic groups and actual fish species consumed. DPH will develop separate, specific health education materials for the general public eating store-bought fish, subsistence consumers, recreational fishermen, and health care providers.
• Persons limiting consumption of a particular fish due to mercury concerns should substitute it with an Alaskan fish lower in mercury (such as salmon), or with another food of comparable nutritional quality.
• Monitoring of both fish and humans should be expanded to fill important data gaps. The process of data evaluation and development of consumption guidance will be an ongoing effort, with updated guidance provided as needed.
Acceptable Daily Intakes for Contaminants Vary According to their Purpose: Public Health Practice vs. Regulation Some confusion may result from varying safety guidelines developed by numerous government agencies. In this case, the chronic oral Acceptable Daily Intake for methylmercury for women who are or can become pregnant, nursing mothers, and young children adopted by the State of Alaska for fish consumption advice is 0.0004 mg/kg body weight/day. This is four times higher than the EPA’s Reference Dose of 0.0001 mg/kg body weight/day.
29

Fish Consumption Advice for Alaskans
The differences in the two agency’s guidelines are based on the different purposes for which they were derived. Even though the ultimate goal of both agencies is to protect public health, they each approach that goal from different perspectives, entailing different basic responsibilities. The EPA is a regulatory agency charged with protecting the environment from pollutant-caused degradation. This agency must establish “acceptable” levels of pollution, and manage and enforce their decisions through the issuance of waste discharge permits, punitive actions on violators, and other regulatory mechanisms. These acceptable levels of pollution must be scientifically defensible, and based on potential harm to pollutant receptors such as humans or endangered species. Since the EPA is responsible for controlling the input of pollutants into the environment, it is important for that agency to be conservative, and incorporate adequate safety factors to err on the side of caution. EPA’s over-riding goal is to minimize risk. In contrast, as public health agencies grapple with the issue of fish consumption advice, public health officials must balance the risks of contaminant exposure against the known benefits of fish consumption. In this task, they must react to environmental pollution that has already occurred, by developing the most appropriate consumption guidance given the circumstances faced in their respective jurisdictions. In developing fish consumption advice, public health officials maximize public health by finding a balance between two opposing actions that each carry a risk of harm. If the public is encouraged to eat fish, they encounter potential health risks associated with exposure to contaminants. If the public is encouraged not to eat fish, they encounter potential health risks associated with replacement foods that may be of inferior nutritional quality, and the loss of health benefits associated with fish consumption. In this case, Alaska public health officials have reached a balance by adopting a smaller safety factor than the regulatory agency, while still protecting Alaskan fish consumers from being exposed to potentially harmful levels of mercury. Regulatory agencies have expressed concern that the chronic oral Acceptable Daily Intake of 0.0004 mg/kg body weight/day established by DPH for fish advisory purposes may be used as a justification for higher allowable levels of mercury waste disposal into Alaska’s environment. DPH asserts that this would be inappropriate. The chronic oral Acceptable Daily Intake of 0.0004 mg/kg body weight/day should not be used for regulatory purposes. Instead, the dependence of many Alaska residents on subsistence fish harvests argues for sustained or enhanced protection of Alaska’s environment from mercury pollution relative to national standards. A significant portion of Alaska’s population depends on fish consumption, and Alaskans consume larger quantities of fish than the average American does. We have provided evidence of the types of adverse health effects that could occur if Alaskans were compelled to reduce fish consumption due to contaminant concerns. To maintain clean, healthy fish stocks upon which the health of many Alaskans depend, Alaska must protect its environment from mercury pollution. Fish Consumption Guidance for the State of Alaska Based on the decisions of the Alaska Scientific Advisory Committee for Fish Consumption, DPH has developed a series of fish consumption recommendations. These are explained in detail below. First, DPH used EPA guidance to calculate monthly consumption allowances for Alaska-caught fish5 based on each species’ arithmetic mean mercury concentration. DPH substituted its Alaska-specific Acceptable Daily Intake of 0.4 μg/kg body weight/day for EPA’s reference dose of 0.1 μg/kg body weight/day and used a meal size of 6 ounces (raw) for adults (Table 8). Although states consistently limit mercury exposure from fish consumption among women of childbearing age and “young children,” the states and other agencies have inconsistent age cut-offs for “young children”. The concern is that mercury affects the developing brain, and a child’s brain continues to develop at a relatively rapid pace through about age 17 years. However, there are no definitive studies linking low-level
30
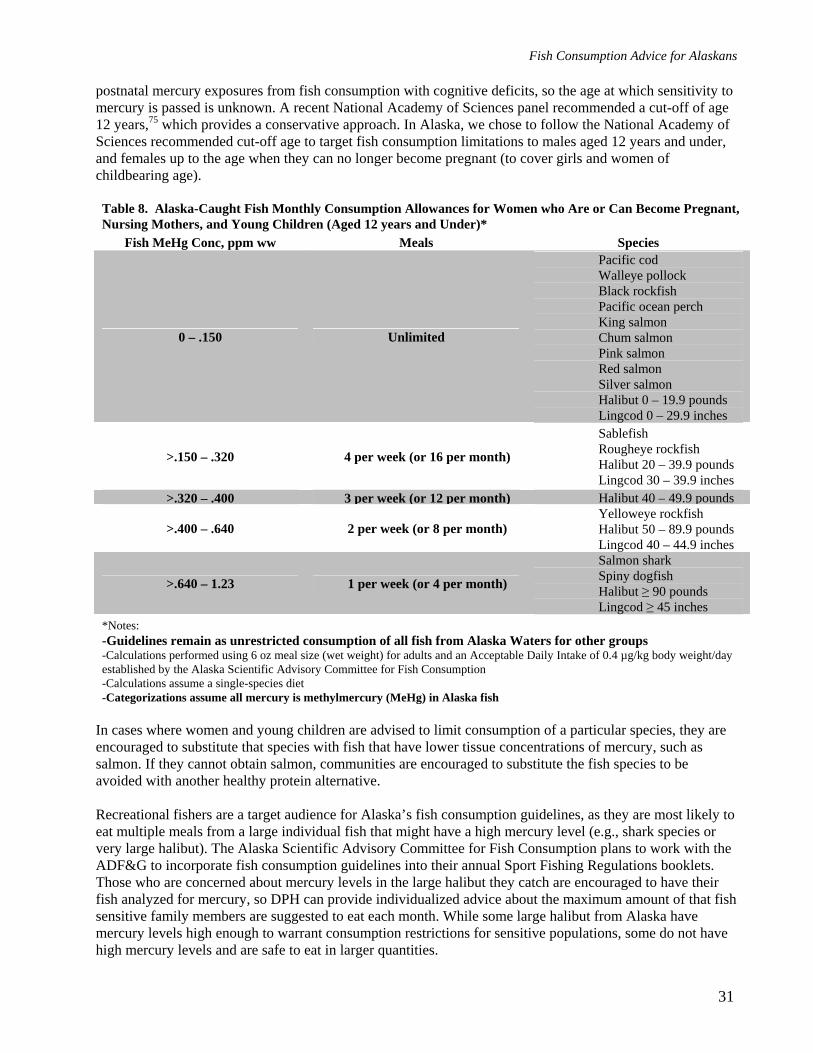
Fish Consumption Advice for Alaskans
postnatal mercury exposures from fish consumption with cognitive deficits, so the age at which sensitivity to mercury is passed is unknown. A recent National Academy of Sciences panel recommended a cut-off of age 12 years,75 which provides a conservative approach. In Alaska, we chose to follow the National Academy of Sciences recommended cut-off age to target fish consumption limitations to males aged 12 years and under, and females up to the age when they can no longer become pregnant (to cover girls and women of childbearing age). Table 8. Alaska-Caught Fish Monthly Consumption Allowances for Women who Are or Can Become Pregnant, Nursing Mothers, and Young Children (Aged 12 years and Under)*
Fish MeHg Conc, ppm ww Meals Species
0 – .150 Unlimited
Pacific cod Walleye pollock Black rockfish Pacific ocean perch King salmon Chum salmon Pink salmon Red salmon Silver salmon Halibut 0 – 19.9 pounds Lingcod 0 – 29.9 inches
>.150 – .320 4 per week (or 16 per month)
Sablefish Rougheye rockfish Halibut 20 – 39.9 pounds Lingcod 30 – 39.9 inches
>.320 – .400 3 per week (or 12 per month) Halibut 40 – 49.9 pounds
>.400 – .640 2 per week (or 8 per month) Yelloweye rockfish Halibut 50 – 89.9 pounds Lingcod 40 – 44.9 inches
>.640 – 1.23 1 per week (or 4 per month)
Salmon shark Spiny dogfish Halibut ≥ 90 pounds Lingcod ≥ 45 inches
*Notes: -Guidelines remain as unrestricted consumption of all fish from Alaska Waters for other groups -Calculations performed using 6 oz meal size (wet weight) for adults and an Acceptable Daily Intake of 0.4 µg/kg body weight/day established by the Alaska Scientific Advisory Committee for Fish Consumption -Calculations assume a single-species diet -Categorizations assume all mercury is methylmercury (MeHg) in Alaska fish
In cases where women and young children are advised to limit consumption of a particular species, they are encouraged to substitute that species with fish that have lower tissue concentrations of mercury, such as salmon. If they cannot obtain salmon, communities are encouraged to substitute the fish species to be avoided with another healthy protein alternative. Recreational fishers are a target audience for Alaska’s fish consumption guidelines, as they are most likely to eat multiple meals from a large individual fish that might have a high mercury level (e.g., shark species or very large halibut). The Alaska Scientific Advisory Committee for Fish Consumption plans to work with the ADF&G to incorporate fish consumption guidelines into their annual Sport Fishing Regulations booklets. Those who are concerned about mercury levels in the large halibut they catch are encouraged to have their fish analyzed for mercury, so DPH can provide individualized advice about the maximum amount of that fish sensitive family members are suggested to eat each month. While some large halibut from Alaska have mercury levels high enough to warrant consumption restrictions for sensitive populations, some do not have high mercury levels and are safe to eat in larger quantities.
31
Fish Consumption Advice for Alaskans
It is important to note that most halibut caught in Alaska are relatively small, and on average these smaller halibut do not contain mercury at levels of health concern. In 2006, the average size of a recreationally-caught halibut in Alaska was 23 pounds.143 Similarly, the average size of a subsistence-caught halibut in 2005 was 27 pounds.147,148 The average size of a commercially-caught halibut from Alaska waters in 2005 was 33 pounds.149
Consumers of store- or restaurant-bought fish are encouraged to eat more fish, particularly fish that are lower in mercury, for their important health benefits. Very few commercial fish from Alaska are affected by the Alaska fish consumption guidelines. Most Alaska fish species, including all five wild Alaskan salmon species, are very low in mercury and are safe to eat in unlimited quantities. Women who are or can become pregnant, nursing mothers, and young children may eat as many as sixteen store- or restaurant-bought halibut meals per month, as the average weight of commercially-caught halibut in Alaska is only 33 pounds. On occasion, lingcod, yelloweye rockfish, and spiny dogfish may also be available commercially. Consumers of those fish species should follow the fish consumption guidelines outlined in Table 8. DPH encourages health care providers to promote fish consumption as a healthy dietary choice, and as a tool to reduce the risks associated with several common chronic diseases. Special information is being developed for health care providers who treat pregnant patients. It is important for health care providers to know that fish consumption is essential for optimal fetal brain development, so that patients are not mistakenly advised to avoid fish consumption due to mercury or other concerns. DPH is providing information to obstetricians and other health care providers about those Alaska fish species with low mercury levels, those with the highest omega-3 fatty acid levels (and thus the greatest potential benefit to the developing fetus), and those that should be consumed sparingly during pregnancy. Data Gaps and Future Research Priorities The Alaska Scientific Advisory Committee for Fish Consumption has identified a number of data gaps and research priorities for the future. These include: • There are insufficient human biomonitoring data. The statewide surveillance program for women of
childbearing age should be continued indefinitely to inform public health officials about trends of mercury exposure among locations and through time. The Section of Epidemiology should perform more targeted projects among individual communities with the potential for higher mercury exposures, to ensure that no Alaskans incur exposure to mercury at levels of health concern.
• There are insufficient mercury data on Alaska halibut. More information is needed to learn about location-specific trends, time trends, size/mercury concentration relationships, feeding ecology, and gender-specific information about mercury levels. In addition, more halibut in the large size classes (over 50 pounds) need to be tested in order to better characterize mercury concentrations in these fish.
• There are insufficient data on fish consumption rates and practices among urban Alaskans. • There are insufficient data on omega-3 fatty acid levels and other nutrients in each Alaskan fish species.
These data are needed to effectively incorporate benefit information into local fish consumption advice. • There are insufficient sample sizes for many Alaska fish species, including all rockfish species, burbot,
sheefish, lake trout, rainbow trout, and grayling. • Baseline data are needed for many Alaska fish species that have not yet been tested by ADEC’s Fish
Monitoring Program, including Arctic char, Dolly Varden, herring, eulachon, whitefish, blackfish, cisco, tomcod and smelt.
• There are insufficient mercury data on king crab and other shellfish from Alaska waters. • There are insufficient data on fish from inland waters of Alaska. Variation in mercury content among
fish in different watersheds is likely, making this a challenging task for a state as large as Alaska.
32
Fish Consumption Advice for Alaskans
Monitoring efforts should focus on long-lived resident freshwater species such as whitefish, lake trout, blackfish, burbot, pike, cisco, sheefish and char.
General Guidelines to Minimize Exposure to Contaminants from Fish In addition to the mercury-specific guidelines discussed in this document, there are steps the general public can take to minimize their exposure to mercury or other contaminants in fish. These include: • Eat smaller fish (subject to minimum size limit regulations). In addition to tasting better, younger,
smaller fish have had less time to accumulate mercury and other contaminants than older, larger fish. Consuming smaller fish reduces health risks due to mercury exposure.
• Eat smaller meals when you eat large fish, and eat large fish less often. Freeze part of your catch to space the meals out over time.
• Eat fish that are less contaminated, such as wild Alaska salmon or smaller halibut. By following these simple tips, people can enjoy the many health benefits of fish consumption while minimizing their potential risk of contaminant exposure.
33
Fish Consumption Advice for Alaskans
References
(1) Egeland GM, Middaugh JP. Balancing fish consumption benefits with mercury exposure. Science. 1997;278:1904-1905.
(2) US Environmental Protection Agency and US Food and Drug Administration. What you need to know about mercury in fish and shellfish. EPA-823-R-04-005. 2004.
(3) Alaska Section of Epidemiology. Mercury and national fish advisories–Recommendations for fish consumption in Alaska. Epidemiology Bulletin. No. 6, June 15,2001. Available at: http://www.epi.hss.state.ak.us/bulletins/docs/b2001_06.htm
(4) US Environmental Protection Agency. Guidance for assessing chemical contaminant data for use in fish advisories Volume 1: Fish sampling and analysis. Third Edition. EPA 823-B-00-007. 2000.
(5) US Environmental Protection Agency. Guidance for assessing chemical contaminant data for use in fish advisories. Volume 2: Risk assessment and fish consumption limits, Third Edition. EPA 823-B-00-008. 2000.
(6) Pitot HC, Dragan YP. Chemical Carcinogenesis. In: Klaassen CD, ed. Casarett & Doull's Toxicology - The basic science of poisons. Fifth ed. New York: McGraw-Hill; 1996:201-267.
(7) Shu HP, Paustenbach DJ, Murray FJ. A critical evaluation of the use of mutagenesis, carcinogenesis, and tumor promotion data in a cancer risk assessment of 2,3,7,8-tetrachlorodibenzo-p-dioxin. Regulatory Toxicology and Pharmacology. 1987;7:57-58.
(8) Hanson DJ. Dioxin toxicity: new studies prompt debate, regulatory action. Chemical & Engineering News. 1991;7-14.
(9) Ames BN, Magaw R, Gold LS. Ranking possible carcinogenic hazards. Science. 1987;236:271-280. (10) Covello VT, Merkhofer MW. Risk Assessment Methods Approaches for Assessing Health and
Environmental Risks. New York: Plenum Press; 1993. (11) IRIS Integrated Risk Information System. Denver CO: Micromedex Inc; 1996. (12) USEPA. Guidance For Assessing Chemical Contaminant Data For Use In Fish Advisories Volume 1:
Sampling and Analysis, Second Edition. EPA 823-R-95-007. 1995. United States Environmental Protection Agency Office of Water (4305). 1995.
(13) http://www.dec.state.ak.us/eh/news.htm#fmp. Alaska Department of Environmental Conservation. 2007. (14) US Environmental Protection Agency. Guidance for assessing chemical contaminant data for use in fish
advisories. Volume 3 - Overview of risk management. EPA 823-B-96-006. 1996. (15) US Environmental Protection Agency. Guidance for assessing chemical contaminant data for use in fish
advisories. Volume IV - Risk communication. EPA 823-R-95-001. 1995. (16) Arnold SM, Lynn TV, Verbrugge LA, Middaugh JP. Human biomonitoring to optimize fish consumption
advice: Reducing uncertainty when evaluating benefits and risks. American Journal of Public Health. 2005;95:393-397.
(17) Alaska Section of Epidemiology. Alaska mercury biomonitoring program update, July 2002 - December 2006. Epidemiology Bulletin. No 4, February 26, 2007. Available at http://www.epi.hss.state.ak.us/bulletins/docs/b2007_04.pdf
(18) JECFA. Summary and conclusions, sixty-first meeting, Rome, 10-19 June 2003. 2003. Joint Food and Agriculture Organization of the United Nations (FAO)/World Health Organization (WHO) Expert Committee on Food Additives.
(19) Berner, James E. and Lauterbach, Martina. The Alaska Native traditional food safety monitoring program report: Data summary and conclusions. 11-25-2005. Alaska Native Tribal Health Consortium.
(20) Nobmann ED, Byers T, Lanier AP, Hankin JH, Jackson MY. The diet of Alaska Native adults: 1987-1988. American Journal of Clinical Nutrition. 1992;55:1024-1032.
(21) Ballew, C., Ross, A., Wells, R. S., Hiratsuka, V., Hamrick, K. J., Nobmann, E. D., and Bartell, S. Final report on the Alaska Traditional Diet Survey. 2004. Anchorage, AK. Alaska Native Health Board.
(22) Van Oostdam JV, Gilman A, Dewailly E et al. Human health implications of environmental contaminants in Arctic Canada: a review. Science of the Total Environment. 1999;230:1-82.
(23) Wheatley B. A new approach to assessing the effects of environmental contaminants on aboriginal peoples. Arctic Medical Research. 1994;53:386-390.
(24) Shkilnyk AM. A Poison Stronger than Love: The Destruction of an Ojibwa Community. New Haven: Yale University Press; 1985.
(25) Kuhnlein HV, Receveur O, Chan HM. Traditional food systems research with Canadian Indigenous Peoples. International Journal of Circumpolar Health. 2001;60:112-122.
34
Fish Consumption Advice for Alaskans
(26) Murphy NJ, Schraer CD, Theile MC et al. Hypertension in Alaska Natives: association with overweight, glucose intolerance, diet and mechanized activity. Ethnicity & Health. 1997;2:267-275.
(27) Risica PM, Schraer C, Ebbesson SOE, Nobmann ED, Caballero B. Overweight and obesity among Alaskan Eskimos of the Bering Straits Region: the Alaska Siberia project. International Journal of Obesity Related Metabolic Disorders . 2000;24:939-944.
(28) Risica PM, Ebbesson SOE, Schraer CD, Nobmann ED, Caballero BH. Body fat distribution in Alaskan Eskimos of the Bering Straits region: the Alaskan Siberia Project. International Journal of Obesity Relat Metab Disord. 2000;24:171-179.
(29) State of Alaska Dept. of Health & Social Services. The burden of overweight & obesity in Alaska. 2003. Anchorage, AK, Alaska Division of Public Health, Section of Epidemiology. Available at: http://www.epi.hss.state.ak.us/pubs/obesityburden/obesityburden.pdf
(30) Scott EM, Griffith IV. Diabetes mellitus in Eskimos. Metabolism. 1957;6:320-325. (31) Mouratoff GJ, Carroll NV, Scott EM. Diabetes mellitus in Eskimos. Journal of the American Medical
Association. 1967;199:107-112. (32) Mouratoff GJ, Scott EM. Diabetes Mellitus in Eskimos after a decade. Journal of the American Medical
Association. 1973;226:1345-1346. (33) Schraer CD, Lanier AP, Boyko EJ, Gohdes D, Murphy NJ. Prevalence of diabetes mellitus in Alaskan
Eskimos, Indians, and Aleuts. Diabetes Care. 1988;11:693-700. (34) Schraer CD, Mayer AM, Vogt AM et al. The Alaska Native diabetes program. Int J Circumpolar Health.
2001;60:487-494. (35) McLaughlin JB, Middaugh JP, Utermohle CJ, Asay ED, Fenaughty AM, Eberhart-Phillips JE. Changing
patterns of risk factors and mortality for coronary heart disease among Alaska Natives, 1979-2002. JAMA. 2004;291:2545-2546.
(36) Lanier, A. P., Ehrsam, G., and Sandidge, J. Alaska Native mortality 1989-1998. 2002. Office of Alaska Native Health Research, Division of Community Health Services, Alaska Native Tribal Health Consortium.
(37) Ebbesson SOE, Adler AI, Risica PM et al. Cardiovascular disease and risk factors in three Alaskan Eskimo populations: the Alaska-Siberia project. Int J Circumpolar Health. 2005;64:365-386.
(38) Middaugh, John P. Cardiovascular Disease in Alaska. January 13, 1997. State of Alaska, Alaska Division of Public Health. Epidemiology Bulletin 1997. http://www.epi.hss.state.ak.us/bulletins/docs/b1997_03.htm
(39) Middaugh, John P. Physical Activity and Health in Alaska. January 17, 1997. State of Alaska, Alaska Division of Public Health. Epidemiology Bulletin 1997. http://www.epi.hss.state.ak.us/bulletins/docs/b1997_04.htm
(40) Alaska Division of Public Health. Age-adjusted diabetes prevalence, Alaska (AK BRFSS) and US (NHIS), 1996 - 2005. Alaska Diabetes Prevention and Control Program . 2007. 6-8-2007.
(41) Alaska Division of Public Health. Age-adjusted distribution of Alaska adults by body weight category, AK BRFSS 1991 - 2005. Alaska Diabetes Prevention and Control Program . 2007. 6-8-2007.
(42) Gillum RF, Mussolino M, Madans JH. The relation between fish consumption, death from all causes, and incidence of coronary heart disease: the NHANES I Epidemiologic Follow-up Study. J Clin Epidemiol. 2000;53:237-244.
(43) Dewailly E, Blanchet C, Lemieux S et al. N-3 Fatty acids and cardiovascular disease risk factors among the Inuit of Nunavik. Am J Clin Nutr. 2002;74:464-473.
(44) Arnold, Scott M. and Middaugh, John P. Use of traditional foods in a healthy diet in Alaska: Risks in perspective. Second Edition, Volume 2 - Mercury. 48. 12-2-2004. Anchorage, AK, Alaska Division of Public Health. Epidemiology Bulletin. http://www.epi.hss.state.ak.us/bulletins/docs/rr2004_11.pdf
(45) Kutsuna, Masachika. Minamata Disease. 1968. Study Group of Minamata Disease Kumamoto University, Japan. 1968.
(46) Kinjo Y, Takizawa Y, Shibata Y, Watanabe M, Kato H. Threshold dose for adults exposed to methylmercury in Niigata Minamata Disease Outbreak. Environmental Sciences. 1995;3:91-101.
(47) Bakir F, Damluji SF, Amin-Zaki L et al. Methylmercury poisoning in Iraq. Science. 1973;181:230-241. (48) National Research Council. Toxicological effects of methylmercury. Washington DC: National Academy
Press; 2000. (49) NIEHS (National Institute of Environmental Health Sciences). Scientific issues relevant to assessment of
health effects from exposure to methylmercury. 1998. Report from Workshop, November 10-18, 1998, Raleigh NC.
35
Fish Consumption Advice for Alaskans
(50) Cernichiari E, Toribara TY, Liang L et al. The biological monitoring of mercury in the Seychelles study. NeuroToxicology. 1995;16:613-628.
(51) Davidson PW, Myers GJ, Cox C et al. Neurodevelopmental test selection, administration, and performance in the main Seychelles child development study. NeuroToxicology. 1995;16:665-676.
(52) Davidson PW, Myers GJ, Cox C et al. Effects of prenatal and postnatal methylmercury exposure from fish consumption on neurodevelopment. JAMA. 1998;280:701-707.
(53) Marsh DO, Clarkson TW, Myers GJ et al. The Seychelles study of fetal methylmercury exposure and child development: introduction. NeuroToxicology. 1995;16:583-596.
(54) Shamlaye CF, Marsh DO, Myers GJ et al. The Seychelles child development study on neurodevelopmental outcomes in children following in utero exposure to methylmercury from a maternal fish diet: background and demographics. NeuroToxicology. 1995;16:597-612.
(55) Clarkson TW, Strain JJ. Nutritional factors may modify the toxic action of methyl mercury in fish-eating populations. J Nutrition. 2003;133:1539S-1543S.
(56) Myers G, Davidson P, Cox C et al. Prenatal methylmercury exposure from ocean fish consumption in the Seychelles child development study. The Lancet. 2003;361:1686-1692.
(57) Grandjean P, Weihe P, Nielsen JB. Methylmercury: significance of intrauterine and postnatal exposures. Clin Chem. 1994;40:1395-1400.
(58) Grandjean P, Weihe P, Jorgensen PJ, Clarkson T, Cernichiari E, Videro T. Impact of maternal seafood diet on fetal exposure to mercury, selenium, and lead. Archives of Environmental Health. 1992;47:185-195.
(59) Grandjean P, Weihe P, White RF. Milestone development in infants exposed to methylmercury from human milk. NeuroToxicology. 1995;16:27-34.
(60) Grandjean P, Weihe P, White RF et al. Cognitive deficit in 7-year old children with prenatal exposure to methylmercury. Neurotoxicology and Teratology. 1997;19:417-428.
(61) Murata K, Weihe P, Budtz-Jorgensen E, Jorgensen PJ, Grandjean P. Delayed brainstem auditory evoked potential latencies in 14-year-old children exposed to methylmercury. J Pediatr. 2004;144:177-183.
(62) Grandjean P, Weihe P, Burse VW et al. Neurobehavioral deficits associated with PCB in 7-year-old children prenatally exposed to seafood neurotoxicants. Neurotoxicology and Teratology. 2001;23:305-317.
(63) McFarland VA, Clarke JU. Environmental occurrence, abundance, and potential toxicity of polychlorinated biphenyl congeners: considerations for a congener-specific analysis. Environmental Health Perspectives. 1989;81:225-239.
(64) Budtz-Jorgensen E, Keiding N, Grandjean P, White RF, Weihe P. Methylmercury neurotoxicity independent of PCB exposure. Environ Health Perspect. 1999;107:A236-A237.
(65) JECFA. WHO Food Additives Series:44. Safety evaluation of certain food additives and contaminants. Methylmercury. 2000. Geneva, Fifty-third Meeting of the Joint FAO/WHO Expert Committee on Food Additives.
(66) WHO. Environmental Health Criteria 101: Methylmercury. Geneva, Switzerland: World Health Organization; 1990.
(67) Friberg L. Methylmercury in fish: A toxicological-epidemiological evaluation of risks report from an expert group. Nord Hyg Tidskr. 1971;4 (Suppl):19-364.
(68) US ATSDR. Toxicological profile for mercury. 1999. (69) Grandjean P, Weihe P, White RF, Debes F. Cognitive performance of children prenatally exposed to
"safe" levels of methylmercury. Environ Res. 1998;77:165-172. (70) US Environmental Protection Agency. Reference dose for methylmercury. 2001. Ref Type: Report (71) Marsh DO, Clarkson TW, Cox C, Myers G, Amin-Zaki J, Al-Tikriti S. Fetal methylmercury poisoning:
relationship between concentration in single strands of maternal hair and child effects. Archives of Neurology. 1987;44:1017-1022.
(72) Van Oostdam, J., Donaldson, S., Feeley, M., and Tremblay, N. Toxic substances in the Arctic and associated effects - Human health. 127. 2003. Ottawa, Indian and Northern Affairs Canada. Northern Contaminants Program, Canadian Arctic Contaminants Assessment Report II.
(73) AMAP. AMAP Assessment 2002: Human Health in the Arctic. 2003. Oslo, Norway. (74) AMAP. Arctic Pollution 2002. 2002. Oslo, Norway. (75) Institute of Medicine of the National Academies. Seafood choices: Balancing benefits and risks.
Washington DC: National Academies Press; 2007.
36
Fish Consumption Advice for Alaskans
(76) Goldsmith, S., Howe, L., Angvik, J., Leask, L., and Hill, A. Status of Alaska Natives 2004. 2004. Anchorage, AK, Institute of Social and Economic Research, University of Alaska Anchorage. Available at: http://www.iser.uaa.alaska.edu/Publications/StatusAKNativessumm.pdf
(77) Usher, Peter J., Baikie, Maureen, Demmer, Marianne, Nakashima, Douglas, Stevenson, Marc G., and Stiles, Mark. Communicating About Contaminants in Country Food: The Experience in Aboriginal Communities. ISBN 0-9699774-0-9. 1995. Research Department Inuit Tapirisat of Canada. 1995.
(78) Wheatley, Margaret A. The social and cultural effects of environmental contaminants on Aboriginal peoples. 1994. Yellowknife. 10-5-1994.
(79) Romberg, William J. Factors affecting recreational fishing participation among Alaska residents. Special Publication 06-20. 2006. Anchorage, AK, Alaska Dept. of Fish and Game. Available at: http://www.sf.adfg.state.ak.us/FedAidPDFs/fds06-20.pdf
(80) Alaska Department of Fish and Game. Cook Inlet personal use fisheries: Important information. Alaska Department of Fish and Game. 2007. 6-11-2007.
(81) Goldsmith, S., Howe, L., Angvik, J., Leask, L., and Hill, A. Status of Alaska Natives 2004. 2004. Anchorage, AK, Institute of Social and Economic Research, University of Alaska Anchorage.
(82) Goldsmith, S., Howe, L., Angvik, J., Leask, L., and Hill, A. Status of Alaska Natives 2004. 2004. Anchorage, AK, Institute of Social and Economic Research, University of Alaska Anchorage.
(83) Goldsmith, S., Howe, L., Angvik, J., Leask, L., and Hill, A. Status of Alaska Natives 2004. 2004. Anchorage, AK, Institute of Social and Economic Research, University of Alaska Anchorage.
(84) Cost of food at home for a week in Alaska. Alaska Cooperative Extension. 2003. Available at: http://www.uaf.edu/ces/fcs/index.html
(85) Alaska Department of Fish and Game. Subsistence in Alaska: A Year 2000 Update. 2000. Juneau, Alaska, Division of Subsistence.
(86) Goldsmith, S., Howe, L., Angvik, J., Leask, L., and Hill, A. Status of Alaska Natives 2004. 2004. Anchorage, AK, Institute of Social and Economic Research, University of Alaska Anchorage.
(87) Alaska wild food harvest by census area. Alaska Dept. of Community and Economic Development. 1999. (88) Haley, Sharman, Berman, Matthew, Goldsmith, Scott, Hill, Alexandra, and Kim, Hongjin. Economics of
Sport Fishing in Alaska. 1999. Anchorage, AK, Institute of Social and Economic Research. (89) Alaska Seafood Industry Fish Facts. Alaska Department of Commerce, Community, and Economic
Development . 2007. 6-12-2007. (90) Hartman, Jeff. Economic impact analysis of the seafood industry in Southeast Alaska: Importance,
personal income, and employment in 1994. 5J02-07. 10-16-2002. Juneau, AK, Alaska Department of Fish and Game. Regional Information Report.
(91) Dean, Michael R. Alaska Department of Fish and Game Sport fishing Guide and Business Registration and Saltwater Sportfishing Charter Vessel Logbook Program, 1999. No. 01-1. 2001. Anchorage, AK, Alaska Dept. of Fish and Game, Division of Sport Fish. Special Publication.
(92) Alaska Department of Fish and Game. Commissioner welcomes Governor's signature on sport fish guide bill. Alaska Department of Fish and Game. 6-16-2004. Juneau, AK. Press Release. 6-12-2007.
(93) Receveur O, Boulay M, Kuhnlein HV. Decreasing Traditional Food Use Affects Diet Quality for Adult Dene/Métis in 16 Communities of the Canadian Northwest Territories. J Nutr. 1997;127:2179-2186.
(94) Nobmann ED, Lanier AP. Dietary intake among Alaska native women resident of Anchorage, Alaska. Int J Circumpolar Health. 2001;60:123-137.
(95) Dorea JG. Fish are central in the diet of Amazonian riparians: should we worry about their mercury concentrations? Environmental Research. 2003;92:232-244.
(96) Feskens EJM. Dietary factors determining diabetes and impaired glucose tolerance. Diabetes Care. 1995;18:1104-1110.
(97) Storlien LH. Skeletal muscle membrane lipids and insulin resistance. Lipids. 1996;31:S261-S265. (98) Schraer CD, Ebbesson SO, Adler AI, Cohen JS, Boyko EJ, Nobmann ED. Glucose tolerance and insulin-
resistance syndrome among St. Lawrence Island Eskimos. Int J Circumpolar Health. 1998;57:348-354. (99) Adler AI, Boyko EJ, Schraer CD, Murphy NJ. Lower prevalence of impaired glucose tolerance and
diabetes associated with daily seal oil or salmon consumption among Alaska Natives. Diabetes Care. 1994;17:1498-1501.
(100) Jensen, Pia G. and Nobmann, Elizabeth. What's in Alaskan Foods. 1994. Anchorage, Alaska, Nutrition Services, Alaska Area Native Health Service, U. S. Department of Health and Human Services, Indian Health Service, Alaska Area Native Health Service.
37

Fish Consumption Advice for Alaskans
(101) Bang HO, Dyerberg J. Plasma lipids and lipoproteins in Greenlandic west coast Eskimos. Acta Med Scand. 1972;192:185.
(102) Bang HO, Dyerberg J, Hjorne N. The composition of food consumed by Greenland Eskimos. Acta Med Scand. 1976;200:69-73.
(103) Dyerberg J, Bang HO. Dietary fat and thrombosis. Lancet. 1978;1:152. (104) Bang HO, Dyerberg J. Lipid metabolism and ischemic heart disease in Greenland Eskimos. Adv Nutr Res.
1980;3:1-22. (105) Dyerberg J. Coronary heart disease in Greenland Inuit: a paradox. Implications for western diet patterns.
Arct Med Res. 1989;48:47-54. (106) Uauy R, Valenzuela A. Marine oils: the health benefits of n-3 fatty acids. Nutrition. 2000;16:680-684. (107) Simopoulos AP. Omega-3 fatty acids in health and disease and in growth and development. Am J Clin
Nutr. 1991;54:438-463. (108) NIH. Effects of Fish Oils and Polyunsaturated Omega-3 Fatty Acids in Health and Disease. 1995. (109) Connor WE. Importance of n-3 fatty acids in health and disease. Am J Clin Nutr. 2000;71:171S-175S. (110) Allen KG, Harris MA. The role of n-3 fatty acids in gestation and parturition. Exp Biol Med.
2001;226:498-506. (111) OBrien JS, Fillerup DL, Mean JF. Quantification of fatty acid and fatty aldehyde composition of
thanolamine, choline and serine phosphoglycerides in human cerebral gray and white matter. J Lipid Res. 1964;5:329-330.
(112) Anderson RE. Lipids of ocular tissues. IV. A comparison of the phospholipids from the retina of six mammalian species. Exp Eye Res. 1970;10:339-344.
(113) Tinoco J, Miljanich P, Medwadowski B. Depletion of docosahexaenoic acid in retinal lipids of rats fed a linolenic acid-deficient linoleic acid-containing diet. Biochem Biophys Acta. 1977;486:575-578.
(114) Clandinin MT, Chappell JE, Leong S, Heim T, Swyer PR, Chance GW. Intrauterine fatty acid accretion rates in human brain; implications for fatty acid requirements. Early Hum Dev. 1980;4:121-129.
(115) Martinez M, Ballabriga A, Gil-Gibernou JJ. Lipids of the developing human retina: I. Total fatty acids, plasmalogens, and fatty acid composition of ethanolamine and choline phosphoglycerides. J Neurosci Res. 1988;20:484-490.
(116) Uauy-Dagach R, Mena P. Nutritional role of omega-3 fatty acids during the perinatal period. Clinics in Perinatology. 1995;22:157-175.
(117) Uauy R, Peirano P, Hoffman D, Mena P, Birch D, Birch E. Role of essential fatty acids in the function of the developing nervous system. Lipids. 1996;31:S-167 - S-176.
(118) Innis SM, Lupton BA, Nelson CM. Biochemical and functional approaches to study of fatty acid requirements for very premature infants. Nutrition. 1994;10:72-76.
(119) Carlson SE, Werkman SH, Rhodes PG, Tolley EA. Visual-acuity development in health preterm infants: effect of marine-oil supplementation. Am J Clin Nutr. 1993;58:35-42.
(120) Uauy R, Mena P, Rojas C. Essential fatty acids in early life: structural and functional role. Proceedings of the Nutrition Society. 2000;59:3-15.
(121) Uauy R, Birch DG, Birch EE, Tyson JE, Hoffman DR. Effect of dietary omega-3 fatty acids on retinal function of very-low-birth-weight neonates. Pediatric Research. 1990;28:485-492.
(122) Holman RT, Johnson SB, Ogburn PL. Deficiency of essential fatty acids and membrane fluidity during pregnancy and lactation. Proceedings National Academy of Science USA. 1991;88:4835-4839.
(123) Innis SM. The role of dietary n-6 and n-3 fatty acids in the developing brain. Dev Neurosci. 2000;22:474-480.
(124) Hibbeln JR, Davis JM, Steer C et al. Maternal seafood consumption in pregnancy and neurodevelopmental outcomes in childhood (ALSPAC study): an observational cohort study. Lancet. 2007;369:578-585.
(125) Bang HO, Dyerberg J, Nelson AB. Plasma lipid and lipoprotein pattern in Greenlandic west coast Eskimos. Lancet. 1971;1:1143-1146.
(126) Dyerberg J, Bang HO. Haemostatic function and platelet polyunsaturated fatty acids in Eskimos. Lancet. 1979;2:433-435.
(127) Krauss RM, Eckel RH, Howard B et al. Revision 2000: a statement for healthcare professionals from the Nutrition Committee of the American Heart Association. J Nutr. 2001;131:132-146.
(128) Schmidt EB, Dyerberg J. Omega-3 fatty acids. Current status in cardiovascular medicine. Drugs. 1994;47:405-24.
38
Fish Consumption Advice for Alaskans
39
(129) Harris WS. n-3 Fatty acids and serum lipoproteins: human studies. Am J Clin Nutr. 1997;65 (suppl):1645S-1654S.
(130) Nestel PJ. Fish oil and cardiovascular disease: lipids and artierial function. American Journal of Clinical Nutrition. 2000;71:228S-231S.
(131) Dyerberg J, Bang HO, Stoffersen E. Eicosapentaenoic acid and prevention of thrombosis and atherosclerosis. Lancet. 1978;2:117-119.
(132) Albert CM, Campos H, Stampfer MJ et al. Blood levels of long-chain n-3 fatty acids and the risk of sudden death. N Engl J Med. 2002;346:1113-1117.
(133) Harris WS, Isley WL. Clinical trial evidence for the cardioprotective effects of omega-3 fatty acids. Curr Atheroscler Rep. 2001;3:174-179.
(134) Hibbeln JR, Davis JM, Steer C et al. Maternal seafood consumption in pregnancy and neurodevelopmental outcomes in childhood (ALSPAC study): an observational cohort study. Lancet. 2007;369: 578-585.
(135) Eberhart-Phillips, J. E., Fenaughty, A., and Rarig, A. The burden of cardiovascular disease in Alaska: Mortality, hospitalization and risk factors. 2003. Anchorage, AK, Section of Epidemiology, Division of Public Health, Alaska Department of Health and Social Services. Available at: http://www.hss.state.ak.us/dph/chronic/chp/pubs/burden_jan04.pdf
(136) Hibbeln JR, Davis JM, Steer C et al. Maternal seafood consumption in pregnancy and neurodevelopmental outcomes in childhood (ALSPAC study): an observational cohort study. Lancet. 2007;369:578-585.
(137) Nobmann ED, Ebbesson SOE, White RG, Bulkow LR, Schraer CD. Associations between dietary factors and plasma lipids related to cardiovascular disease among Siberian Yupiks of Alaska. International Journal of Circumpolar Health. 1999;58:254-271.
(138) Lanier AP, Kelly JJ, Holck P, Smith B, McEvoy T, Sandidge J. Cancer incidence in Alaska Natives thirty-year report 1969-1998. Alaska Medicine. 2001;43:87-115.
(139) Wongittilin J Sr. Traditional knowledge & contaminants project. Int J Circumpolar Health. 2001;60:454-460.
(140) Terry PD, Rohan TE, Wolk A. Intakes of fish and marine fatty acids and the risks of cancers of the breast and prostate and of other hormone-related cancers: a review of the epidemiologic evidence. Am J Clin Nutr. 2003;77:532-543.
(141) Bartsch H, Nair J, Owen RW. Dietary polyunsaturated fatty acids and cancers of the breast and colorectum: emerging evidence for their role as risk modifiers. Carcinogenesis. 1999;20:2209-2218.
(142) Chajes V, Bougnoux P. Omega-6/omega-3 polyunsaturated fatty acid ratio and cancer: The scientific evidence. In: Simopoulos AP, Cleland LG, eds. World Rev. Nutr. Diet. Karger, France: Basel; 2003:133-151.
(143) Norrish AE, Skeaff CM, Arribas GLB, Sharpe SJ, Jackson RT. Prostate cancer risk and consumption of fish oils: a dietary biomarker-based case-control study. British Journal of Cancer. 1999;81:1238-1242.
(144) Augustsson K, Michaud DS, Rimm EB et al. A prospective study of intake of fish and marine fatty acids and prostate cancer. Cancer Epidemiol Biomarkers Prev. 2003;12:64-67.
(145) Fernandez E, Chatenoud L, La Vecchia C, Negri E, Franceschi S. Fish consumption and cancer risk. Am J Clin Nutr. 2004;70:85-90.
(146) Blood CL. 2006 sport fishery. In: Blood C, Forsberg J, Kong T et al, eds. International Pacific Halibut Commission Report of Assessment and Research Activities 2006. International Pacific Halibut Commission; 2007:47-54. http://www.iphc.washington.edu/HALCOM/pubs/rara/2006rara/2k6rara01.pdf
(147) Fall, James A., Koster, David, and Davis, Brian. Subsistence harvests of Pacific Halibut in Alaska, 2005. 320, 1-188. 2006. Juneau, AK, Alaska Department of Fish and Game, Division of Subsistence. Technical Paper. http://www.subsistence.adfg.state.ak.us/geninfo/publctns/articles.cfm#2005_HAL_REPORT
(148) Williams GH. Retention of sublegal halibut in the Area 4D/4E CDQ fishery: 2006 harvests. In: Blood C, Forsberg J, Kong T et al, eds. International Pacific Halibut Commission Report of Assessment and Research Activities 2006. 2007:63-5.
(149) Forsberg JE. Age distribution of the commercial halibut catch for 2006. In: Blood C, Forsberg J, Kong T et al, eds. International Pacific Halibut Commission Report of Assessment and Research Activities 2006. International Pacific Halibut Commission; 2007:75-80.
Fish Consumption Advice for Alaskans
PERMIT NO. 1034
PRSRT STD U.S. POSTAGE
PAID ANCHORAGE, AK
State of Alaska, Section of Epidemiology 3601 C Street, Suite 540 Anchorage, AK 99503