global overview on fish consumption - ciheamom.ciheam.org/om/pdf/c17/96605669.pdf · global...
TRANSCRIPT
Global overview on fish consumption
Josupeit H.
Marketing of aquaculture products
Zaragoza : CIHEAMCahiers Options Méditerranéennes; n. 17
1996pages 9-23
Article available on line / Article disponible en ligne à l’adresse :
--------------------------------------------------------------------------------------------------------------------------------------------------------------------------
http://om.ciheam.org/article.php?IDPDF=96605669
--------------------------------------------------------------------------------------------------------------------------------------------------------------------------
To cite th is article / Pour citer cet article
--------------------------------------------------------------------------------------------------------------------------------------------------------------------------
Josupeit H. Global overview on fish consumption. Marketing of aquaculture products . Zaragoza :
CIHEAM, 1996. p. 9-23 (Cahiers Options Méditerranéennes; n. 17)
--------------------------------------------------------------------------------------------------------------------------------------------------------------------------
http://www.ciheam.org/http://om.ciheam.org/
Global overview on fish consumption
H. JOSUPEIT FAOlGLOBEFlSH FISHERIES INDUSTRY DIVISION ROME ITALY
SUMMARY - The paper will cover the main fish consumption trends by regions and by economic groupings. It will give an overview on the impact of aquaculture on world fish production and world fish supply. Projections for future demand for fishery products will be given. The case of Chinese fish supply will be highlighted, as China is the world's most populous country and the country where aquaculture plays a dominant role for food fish supply. Finally fish consumption in Mediterranean countries will be highlighted, giving an overview by species and by regions.
Key words: Aquaculture, consumption.
RESUME - "Consommation mondiale de poisson". Cet article présente les principales tendances de consommation de poisson par régions et par groupes économiques. Il offre une visión de l'impact de l'aquaculture sur la production mondiale et l'offre mondiale de poisson. Des,projections de la demande future de produits des pêcheries sont apportées. Le cas de l'offre de poisson en Chine est mis en relief, la Chine étant le pays avec la plus forte population du monde, ainsi que celui où l'aquaculture joue un rôle prédominant en ce qui concerne l'offre alimentaire de poisson. Finalement la consommation de poisson dans les pays méditerranéens est présentée, avec une révision par espèces et par régions.
Mots-clés : Aquaculture, consommation.
WORLD CONSUMPTION
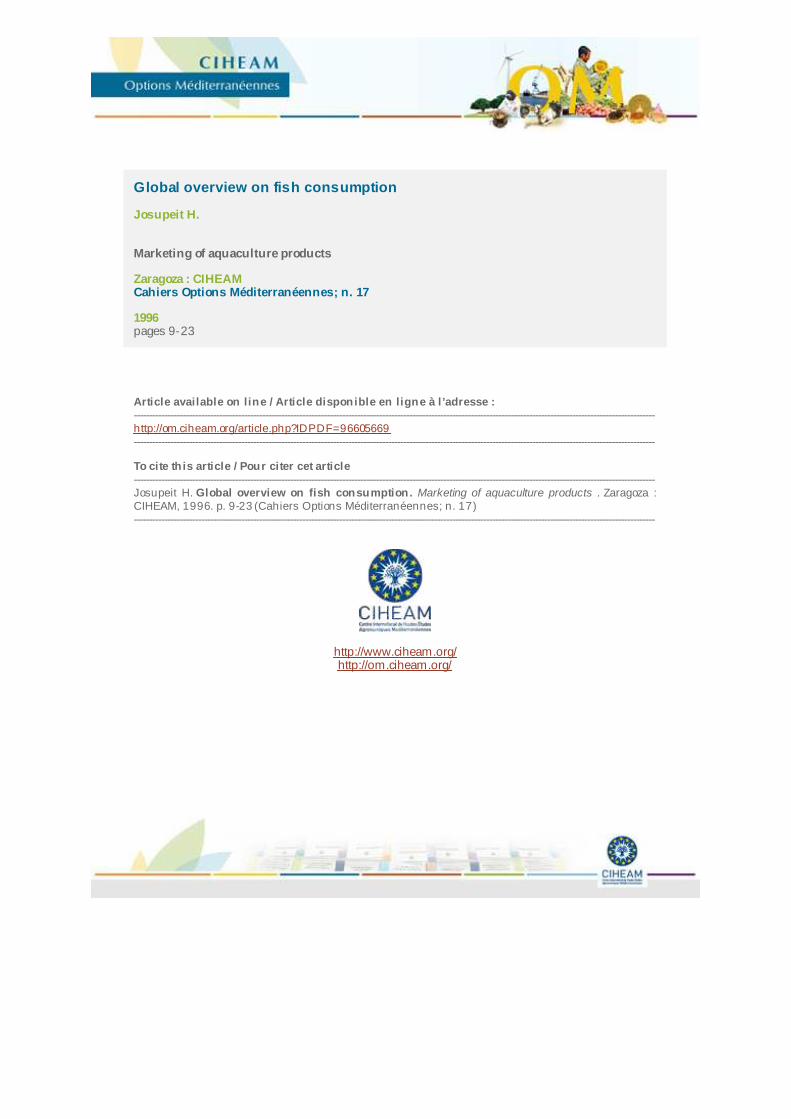
In 1993, the apparent world average food fish per caput consumption is estimated to have attained 13 kg. This represent a decline from the peak of kg in 1989.
Up from the temporary set-back experienced the early 9Os, world fish consumption has increased during the last two decades. In 1970 the per caput consumption was 10.9 kg. However the growth experienced during the last twenty years or so was not continuous.The per capuf consumption in fact declined in the late 1970s to pick up again in the early 1980s.
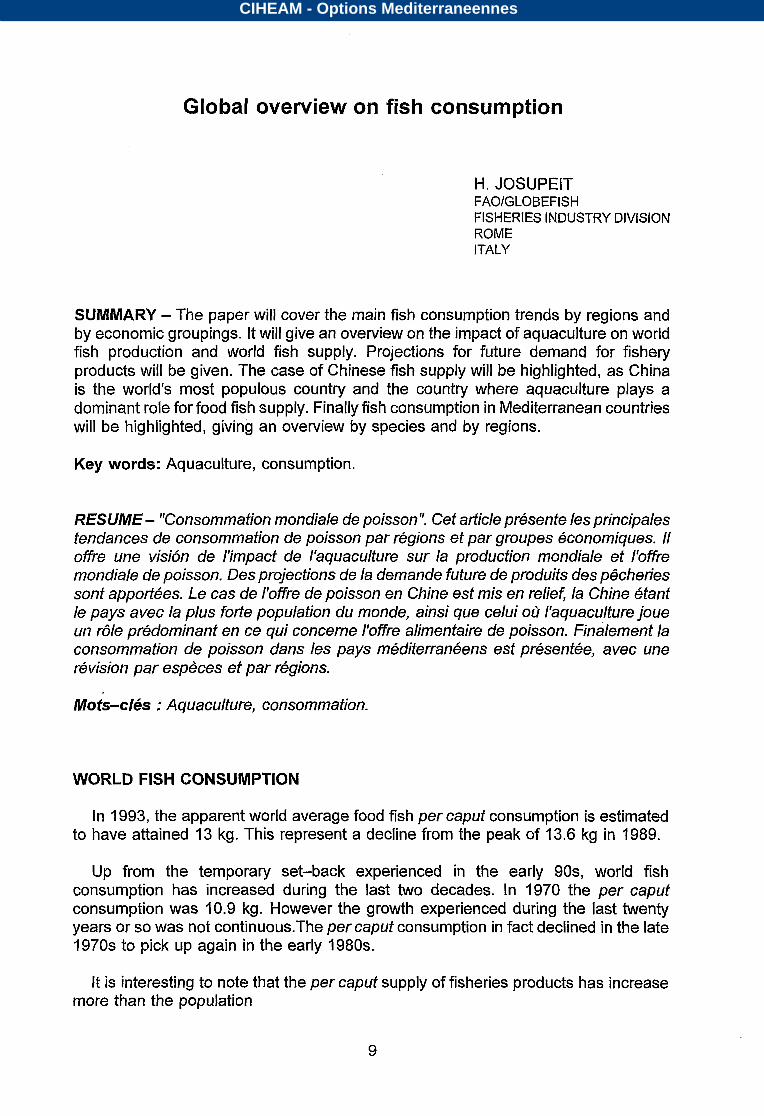
It is interesting to note that the per caput supply of fisheries products has increase more than the population
9
CIHEAM - Options Mediterraneennes
14-
12-
10-
4 8- m * 6-
4-
2-
O-& 1970 1975 i 980 1985
Fig. 1. World per caput Supply.
T
/:I O 2 4 i-
1970 1975 1980 1985 1990
m Supply - Population
7
Fig. 2. World per caput Fish Supply versus Population Growth.
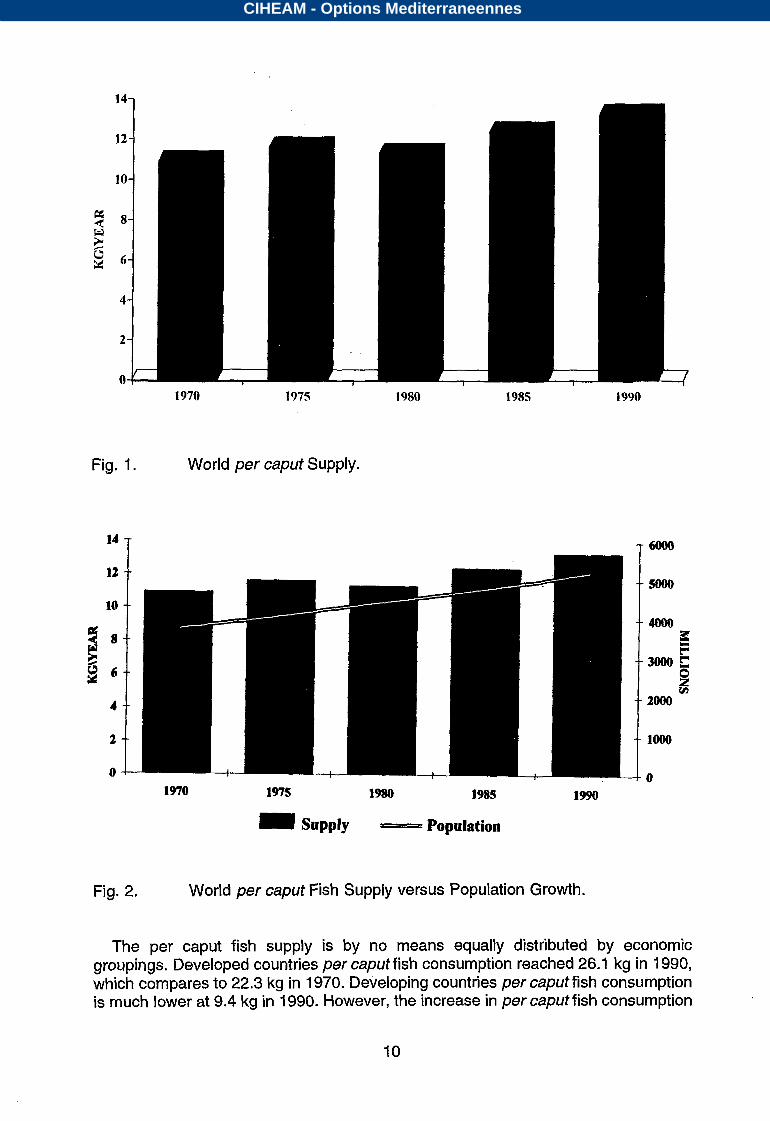
The per caput fish supply is by no means equally distributed by economic groupings. Developed countries per caputfish consumption reached 26.1 kg in 1990, which compares to 22.3 kg in 1970. Developing countries per caput fish consumption is much lower at 9.4 kg 1990. However, the increase in per caput fish consumption
10
CIHEAM - Options Mediterraneennes
by developing countries was much stronger than in the developed world. In fact in 1970, the per caput fish consumption in developing countries was only 6.2 kg.
30-
2s-
20-
.-. . . . :il
p!
2 z
10
S
O 1970 197s 1985 1990
World I 1 Countries r"l Countries
Fig. World per caput Fish Supply by economic groupings.
75
a (a) Japan Total
(d) Western Europe (e) Northern America (f) Australia, New
(c) Former
2 4s
2 ..
Zealand 30 (g) Eastern Europe -
def -
1s 3 5
-g O
197s l985
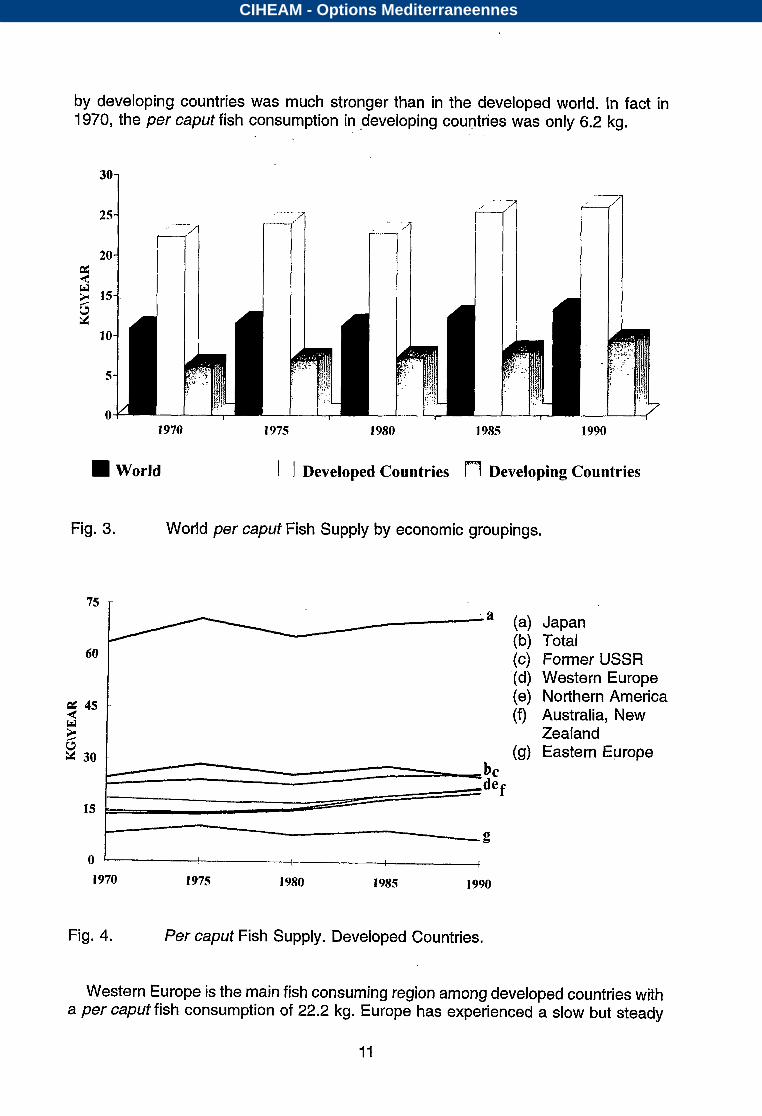
Fig. 4. Per caput Fish Supply. Developed Countries.
Western Europe is the main fish consuming region among developed countries with a per caput fish consumption of 22.2 Europe has experienced a slow but steady
11
CIHEAM - Options Mediterraneennes
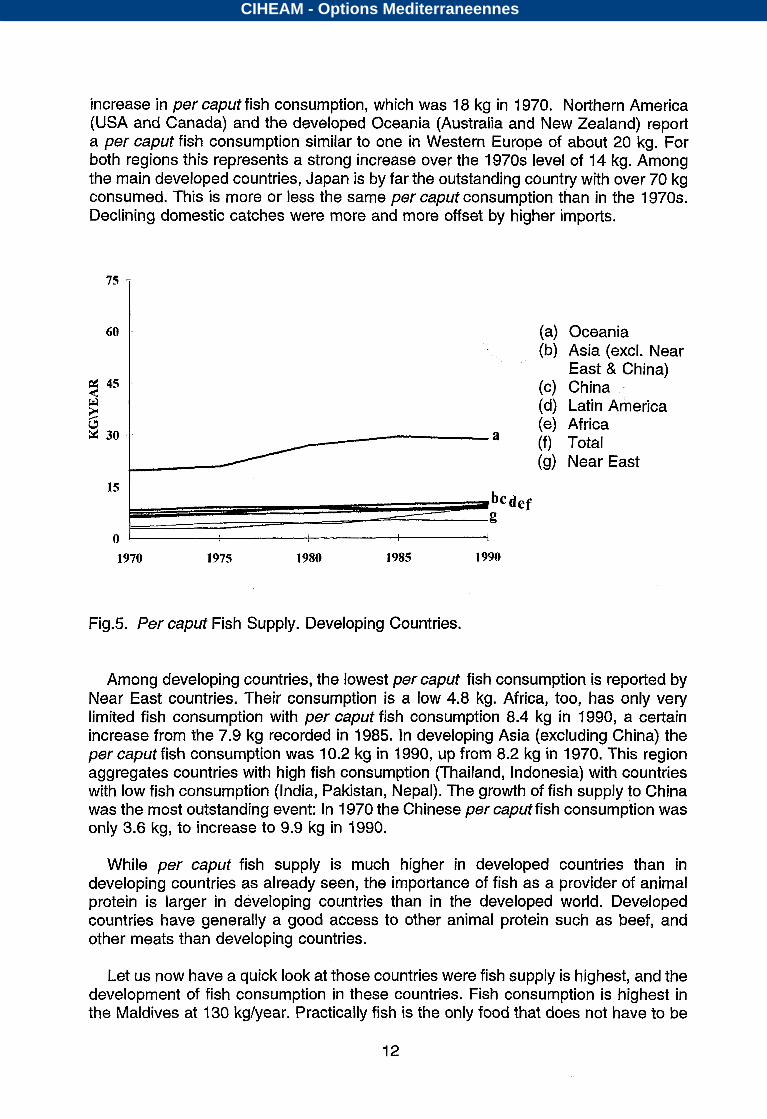
increase in per caput fish consumption, which was 18 kg in 1970. Northern America (USA and Canada) and the developed Oceania (Australia and New Zealand) report a per caput fish consumption similar to one in Western Europe of about 20 kg. For both regions this represents a strong increase over the 1970s level of 14 kg. Among the main developed countries, Japan is by far the outstanding country with over 70 kg consumed. This is more or less the same per caput consumption than in the 1970s. Declining domestic catches were more and more offset by higher imports.
75
60 (a) Oceania (b) Asia (excl. Near
East & China) (c) China ..
(d) Latin America (e) Africa
/-'a [:) East
$iCdef 0 1 1
Fig.5. Per caput Fish Supply. Developing Countries.
Among developing countries, the lowest per caput fish consumption is reported by Near East countries. Their consumption is a low 4.8 kg. Africa, too, has only very limited fish consumption with per caput fish consumption kg in 1990, a certain increase from the 7.9 kg recorded in 1985. In developing Asia (excluding China) the per caput fish consumption was 10.2 kg in 1990, up from kg in 1970. This region aggregates countries with high fish consumption (Thailand, Indonesia) with countries with low fish consumption (India, Pakistan, Nepal). The growth of fish supply to China was the most outstanding event: In 1970 the Chinese per caput fish consumption was only 3.6 kg, to increase to 9.9 kg in 1990.
While per caput fish supply is much higher in developed countries than in developing countries as already seen, the importance of fish as a provider of animal protein is larger in developing countries than in the developed world. Developed countries have generally a good access to other animal protein such as beef, and other meats than developing countries.
Let us now have a quick look at those countries were fish supply is highest, and the development of fish consumption in these countries. Fish consumption is highest in the Maldives at kg/year. Practically fish is the only food that does not have to be
CIHEAM - Options Mediterraneennes
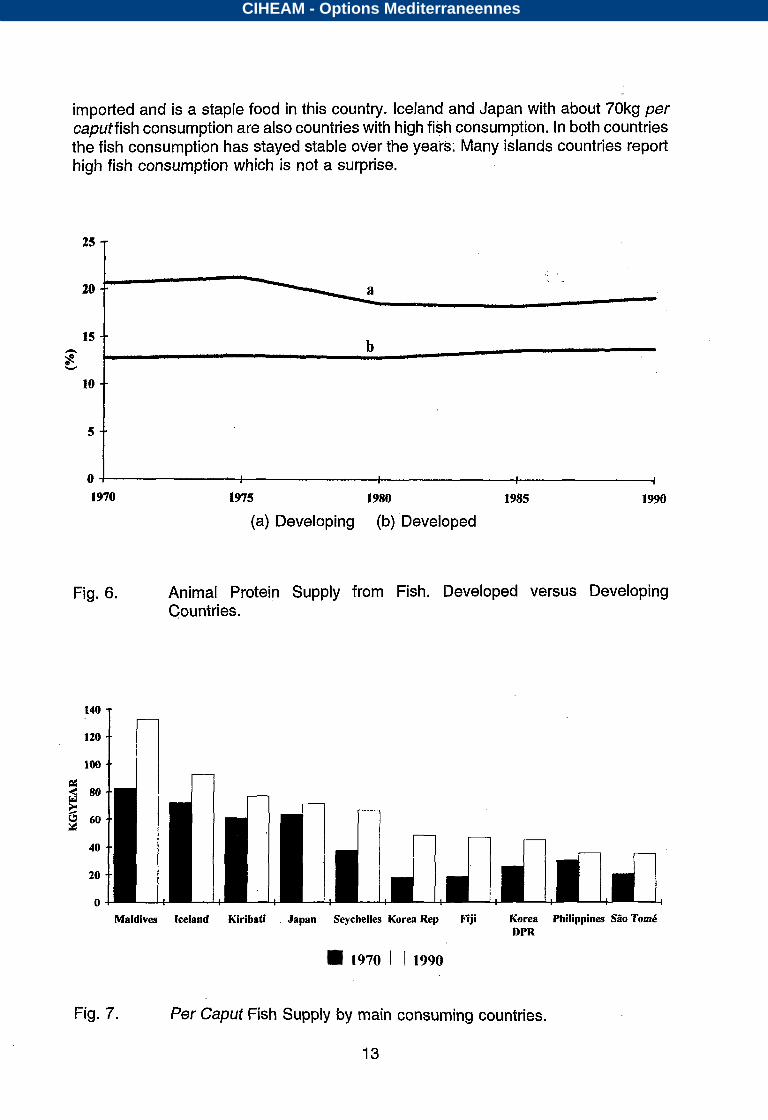
imported and is a staple food in this country. Iceland and Japan with about 70kg per caputfish consumption are also countries with high fish consumption. In both countries the fish consumption has stayed stable over the years: Many islands countries report high fish consumption which is not a surprise.
25 T
o ! I i
1970 1975 1980 1985
(a) Developing (b) Developed 1990
Fig. 6. Animal Protein Supply from Fish. Developed versus Developing Countries.
140
120
100
3 80
8 60
40
20
O
4
Japan Seychelles Fiji
1970 I 1990
Fig. 7. Per Caput Fish Supply by main consuming countries.
13
Philippines São Tomé
CIHEAM - Options Mediterraneennes
v
Per caput supply * Share of fish in total animal protein
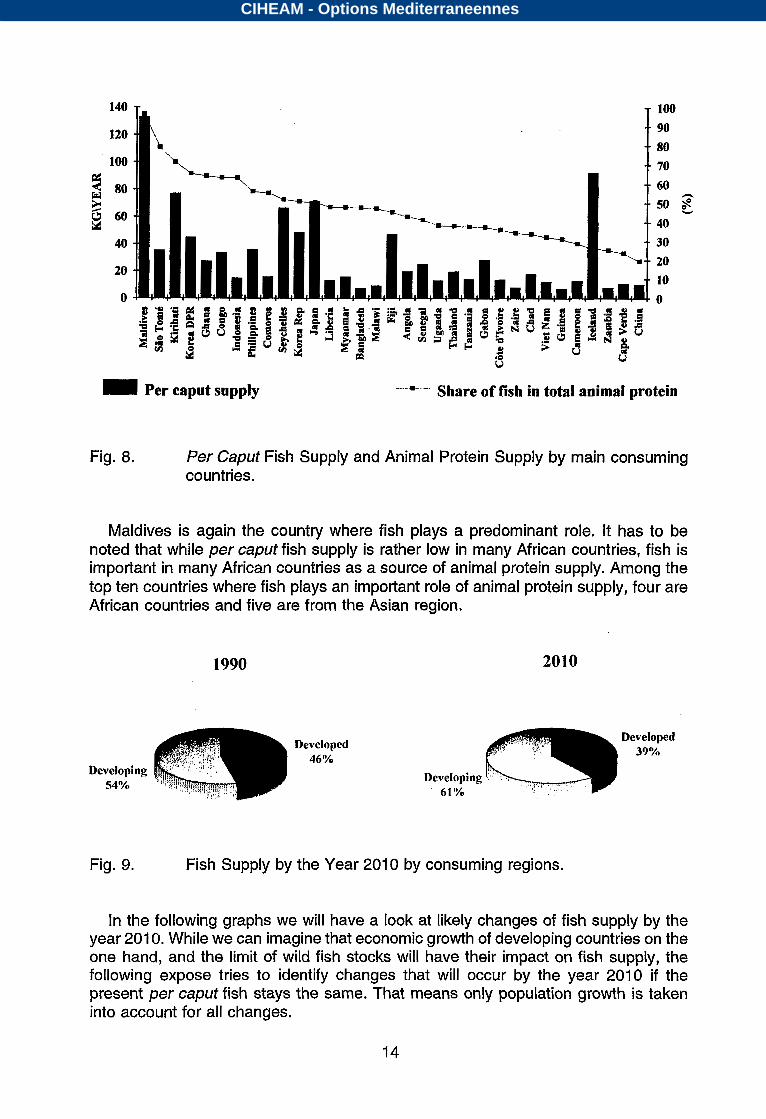
Fig. Per Caput Fish Supply and Animal Protein Supply by main consuming countries.
Maldives is again the country where fish plays a predominant role. It has to be noted that while per caput fish supply is rather low in many African countries, fish is important in many African countries as a source of animal protein supply. Among the top ten countries where fish plays an important role of animal protein supply, four are African countries and five are from the Asian region.
1990 2010
39% 46Yn
54%
Fig. 9. Fish Supply by the Year 2010 by consuming regions.
In the following graphs we will have a look at likely changes of fish supply by the year 201 O. While we can imagine that economic growth of developing countries on the one hand, and the limit of wild fish stocks will have their impact on fish supply, the following expose tries to identify chan.ges that will occur by the year 2010 if the present per caput fish stays the same. That means only population growth is taken into account for all changes.
14
CIHEAM - Options Mediterraneennes
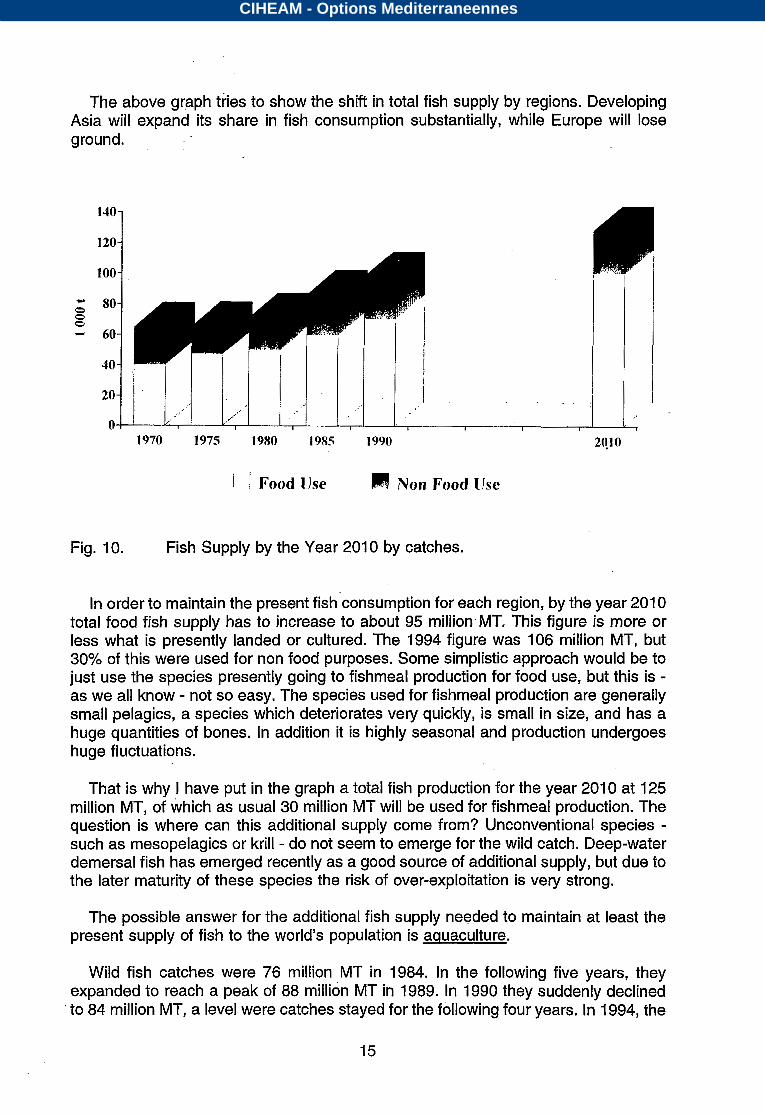
The above graph tries to show the shift in total fish supply by regions. Developing Asia will expand its share in fish consumption substantially, while Europe will lose ground.
140-
120-
100-
80- O O
60-
40-
20-
0 T-
1970 1975 1980 1985 1990 2q1 0
J ! [)se m Non Food
Fig. 10. Fish Supply by the Year 2010 by catches.
In order to maintain the present fish consumption for each region, by the year 201 O total food fish supply has to increase to about 95 million. MT. This figure is more or less what is presently landed or cultured. The 1994 figure was 106 million MT, but 30% of this were used for non food purposes. Some simplistic approach would be to just use the species presently going to fishmeal production for food use, but this is - as we all know - not so easy. The species used for fishmeal production are generally small pelagics, a species which deteriorates very quickly, is small in size, and has a huge quantities of bones. In addition it is highly seasonal and production undergoes huge fluctuations.
That is why I have put in the graph a total fish production for the year 2010 at 125 million MT, of which as usual 30 million MT will be used for fishmeal production. The question is where can this additional supply come from? Unconventional species - such as mesopelagics or krill - do not seem to emerge for the wild catch. Deep-water demersal fish has emerged recently as a good source of additional supply, but due to the later maturity of these species the risk of over-exploitation is very strong.
The possible answer for the additional fish supply needed to maintain at least the present supply of fish to the world's population is aquaculture.
Wild fish catches were 76 million MT in 1984. In the following five years, they expanded to reach a peak of 88 million MT in 1989. In 1990 they suddenly declined to 84 million MT, a level were catches stayed for the following four years. In 1994, the
15
CIHEAM - Options Mediterraneennes
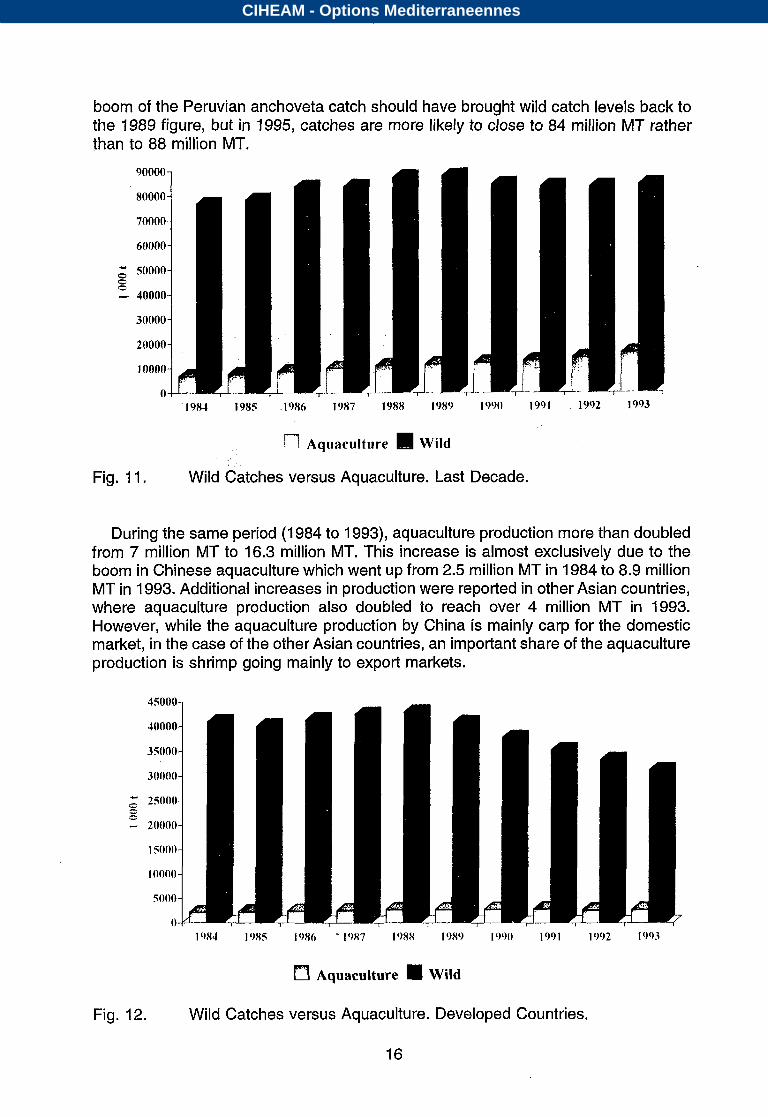
boom of the Peruvian anchoveta catch should have brought wild catch levels back to the 1989 figure, but in 1995, catches are more likely to close to 84 million MT rather than to 88 million
90000
80000
70000
60000
* SO000
-- 40000 8 O
30000
20000
0000
Q
Fig. 11.
1984 1985 1986 1987 1988 l 9 9 0 1991 1902 1993
r"l Aquaculture Wild
Wild Catches versus Aquaculture. Last Decade.
During the same period (1 984 to 1993), aquaculture production more than doubled from 7 million MT to 16.3 million MT. This increase is almost exclusively due to the boom in Chinese aquaculture which went up from 2.5 million MT in 1984 to 8.9 million MT in 1993. Additionai increases in production were reported in other Asian countries, where aquaculture production also doubled to reach over 4 million MT in 1993. However, while the aquaculture production by China is mainly carp for the domestic market, in the case of the other Asian countries, an important share of the aquaculture production is shrimp going mainly to export markets.
Fig. 12.
CIHEAM - Options Mediterraneennes
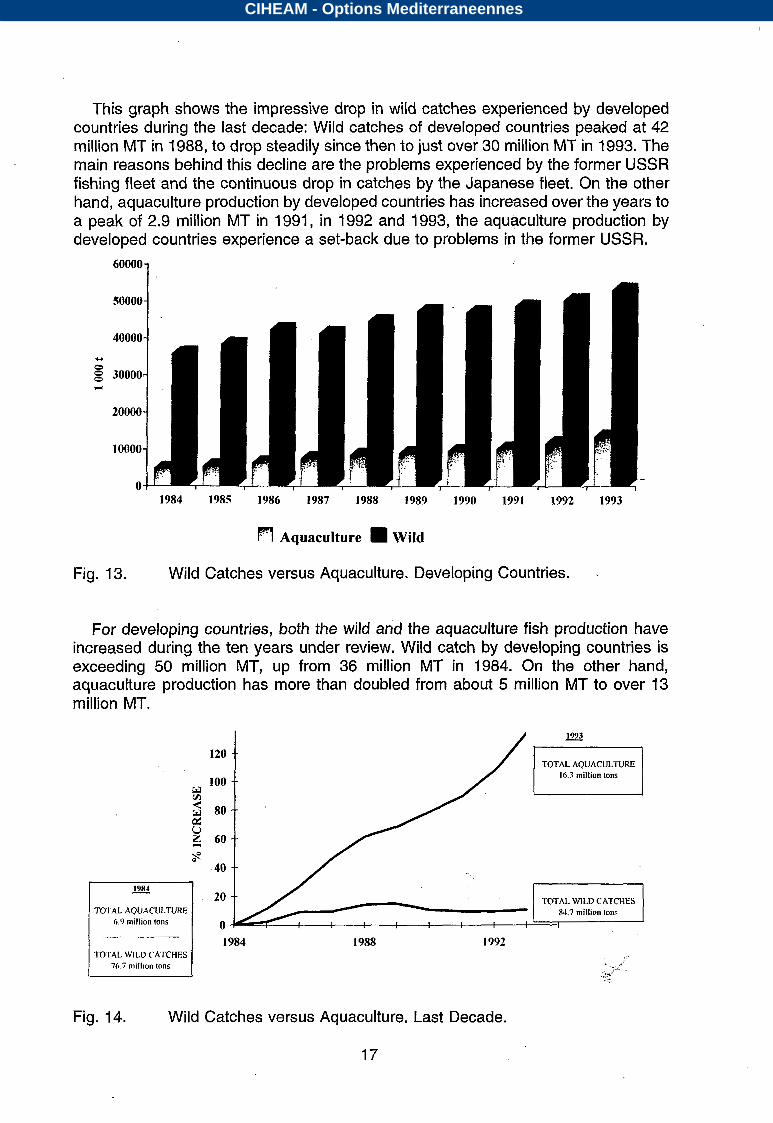
This graph shows the impressive drop in wild catches experienced by developed countries during the last decade: Wild catches of developed countries peaked at 42 million MT in 1988, to drop steadily since then to just over 30 million MT in 1993. The main reasons behind this decline are the problems experienced by the former USSR fishing fleet and the continuous drop in catches by the Japanese fleet. On the other hand, aquaculture production by developed countries has increased over the years to a peak of 2.9 million MT in 1991, in 1992 and 1993, the aquaculture production by developed countries experience a set-back due to problems in the former USSR.
60000
50000
40000
30000
20000
10000
O
Fig. 13.
1984 1985 1986 1987 1988 1989 1990 1991 1992 1993
p"1 Aquaculture Wild
Wild Catches versus Aquaculture. Developing Countries. -
For developing countries, both the wild and the aquaculture fish production have increased during the ten years under review. Wild catch by developing countries is exceeding 50 million MT, up from 36 million MT in 1984. the other hand, aquaculture production has more than doubled from about 5 million MT to over 13 million MT.
120
100 v1
3 80 u p!
Z: 60
--
--
--
--
1993
16.3 million
40 --
TOTAL 6.0 million tons
TOTAL XJ.7 million tons
-_l__
76.7 mlllton
Fig. 14. Wild Catches versus Aquaculture. Last Decade.
17
CIHEAM - Options Mediterraneennes
The above graph shows again the impressive percentage increase of world aquaculture production versus the relative limited increase in wild fisheries. While aquaculture production increased during the last decade by over 130%, wild catches increased by only 10%.
3000
2000
O Y
1000
O
Total Western Europe Japan Northern America Former USSR Eastern Europe Australia, New Zealand
1984 1985 1986 1987 1988 1989 1990 1991 1992 1993
Fig. 15. Aquaculture production. Developed Countries.
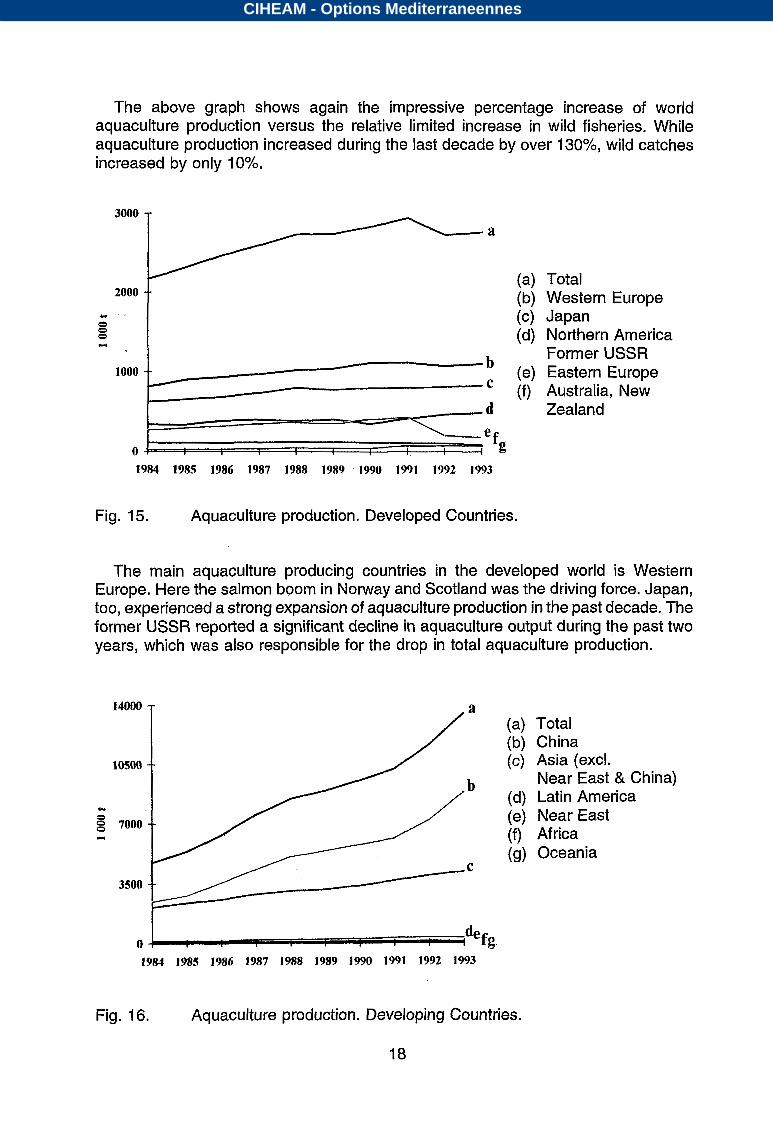
The main aquaculture producing countries in the developed world is Western Europe. Here the salmon boom in Norway and Scotland was the driving force. Japan, too, experienced a strong expansion of aquaculture production the past decade. The former USSR reported a significant decline aquaculture output during the past two years, which was also responsible for the drop in total aquaculture production.
14000 T a (a) Total (b) China
los00 -- (c) Asia (excl.
b Near East & China) (d) Latin America (e) Near East (f) Africa (g) Oceania
o I l d e @
1984 1985 1986 1987 1988 1989 1990 1991 1992 1993
Fig. 16. Aquaculture production. Developing Countries.
CIHEAM - Options Mediterraneennes
This graph shows that China and the rest of Asia are the main driving forces behind the developing countries' boom in aquaculture output. All other regions - namely Latin America, Near East, Africa and Oceania - only contribute marginally to the world's aquaculture production.
9000-
8000-
7000-
6000-
0' 5000-
- 4000-
3000-
2000-
1000-
O-- 1984 1985 1986 1987 1988 1989 1990 1991 1992. 1993
Aquaculture Wild
Fig. 17. Aquaculture production versus Wild Catches. China.
1984 1985 1986 1987 1988 1989 1990
r"l Aquaculture Wild
Fig. 18. Chinese per caput Fish Supply.
19
CIHEAM - Options Mediterraneennes
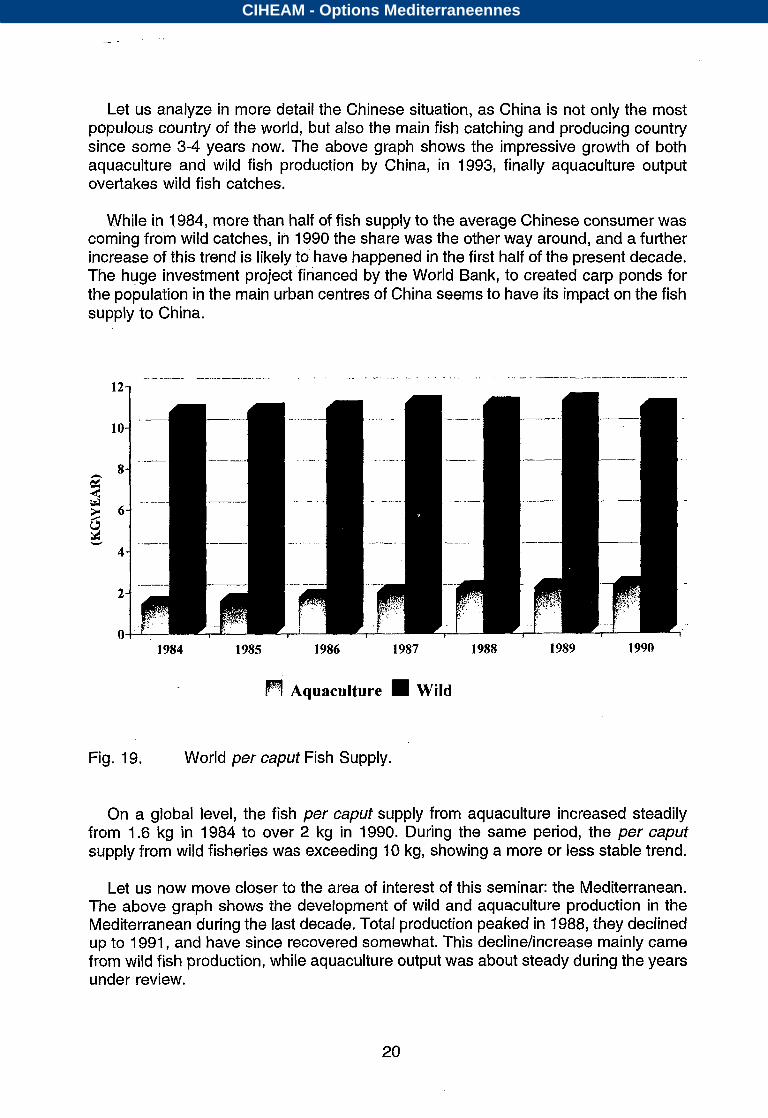
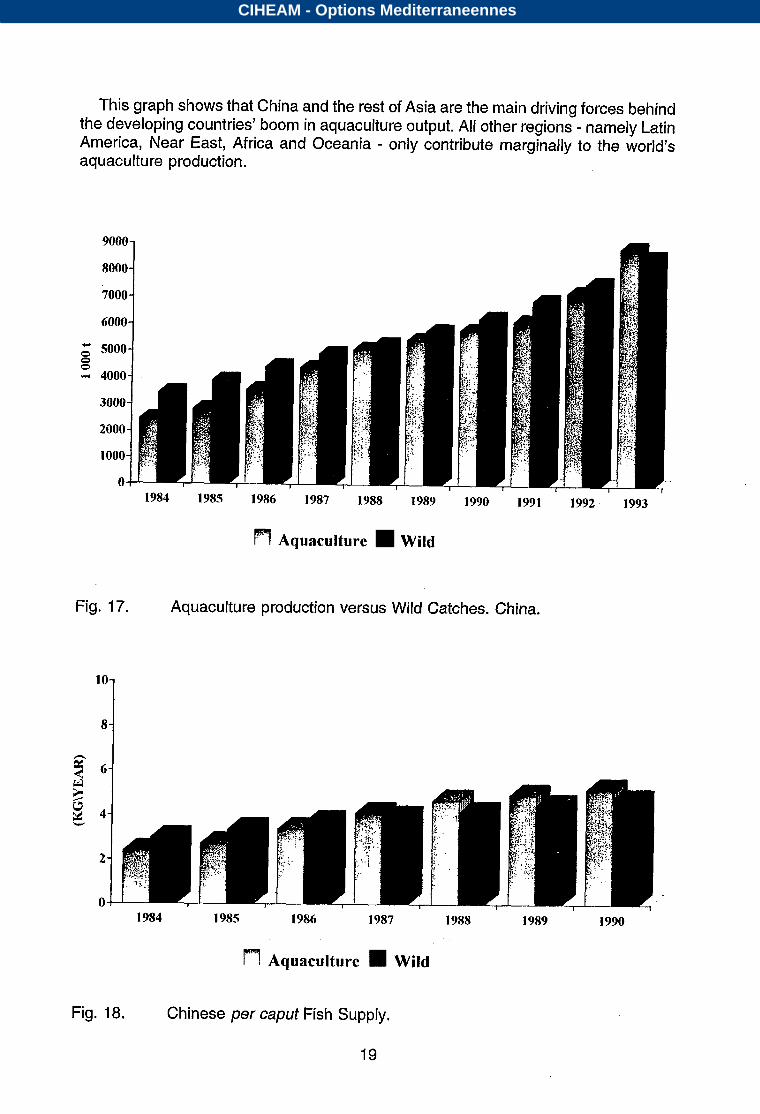
Let us analyze in more detail the Chinese situation, as China is not only the most POPU~OUS country of the world, but also the main fish catching and producing country since some 3-4 years now. The above graph shows the impressive growth of both aquaculture and wild fish production by China, in 1993, finally aquaculture output overtakes wild fish catches.
While in 1984, more than half of fish supply to the average Chinese consumer was coming from wild catches, in 1990 the share was the other way around, and a further increase of this trend is likely to'have happened in the first half of the present decade. l h e huge investment project financed by the World Bank, to created carp ponds for the population in the main urban centres of China seems to have its impact on the fish supply to China.
12-
10-
8-
S 2 6-
4-
2-
O T
m Aquaculture Wild
Fig. 19. World per caput Fish Supply.
On a global level, the fish per caput supply from aquaculture increased steadily from 1.6 kg in 1984 to over kg in 1990. During the same period, the per caput supply from wild fisheries was exceeding 10 kg, showing a more or less stable trend.
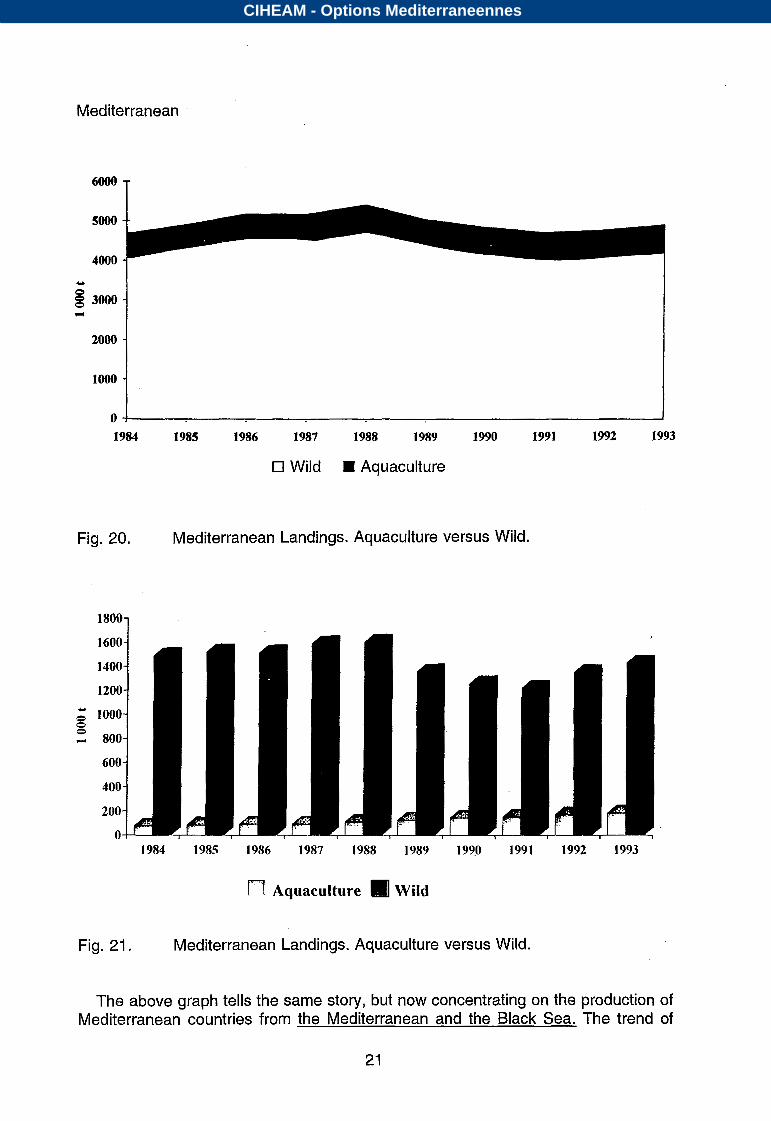
Let us now move closer to the area of interest of this seminar: the Mediterranean. The above graph shows the development of wild and aquaculture production in the Mediterranean during the last decade. Total production peaked in 1988, they declined up to 1991, and have since recovered somewhat. This decline/increase mainly came from wild fish production, while aquaculture output was about steady during the years under review.
CIHEAM - Options Mediterraneennes
Mediterranean l
"T
2000 -
-
o .
Fig. 20.
1600-
1400-
1200-
g 1000-
M 800-
600-
400-
O Wild Aquaculture
Mediterranean Landings. Aquaculture versus Wild.
1984 1985 1986 1987 1988 1989 1990 1992 1993
r"l Aquaculture Wild
Fig. 21. Mediterranean Landings. Aquaculture versus Wild.
The above graph tells the same story, but now concentrating on the production of Mediterranean countries from the Mediterranean and the Black Sea. The trend of
21
CIHEAM - Options Mediterraneennes
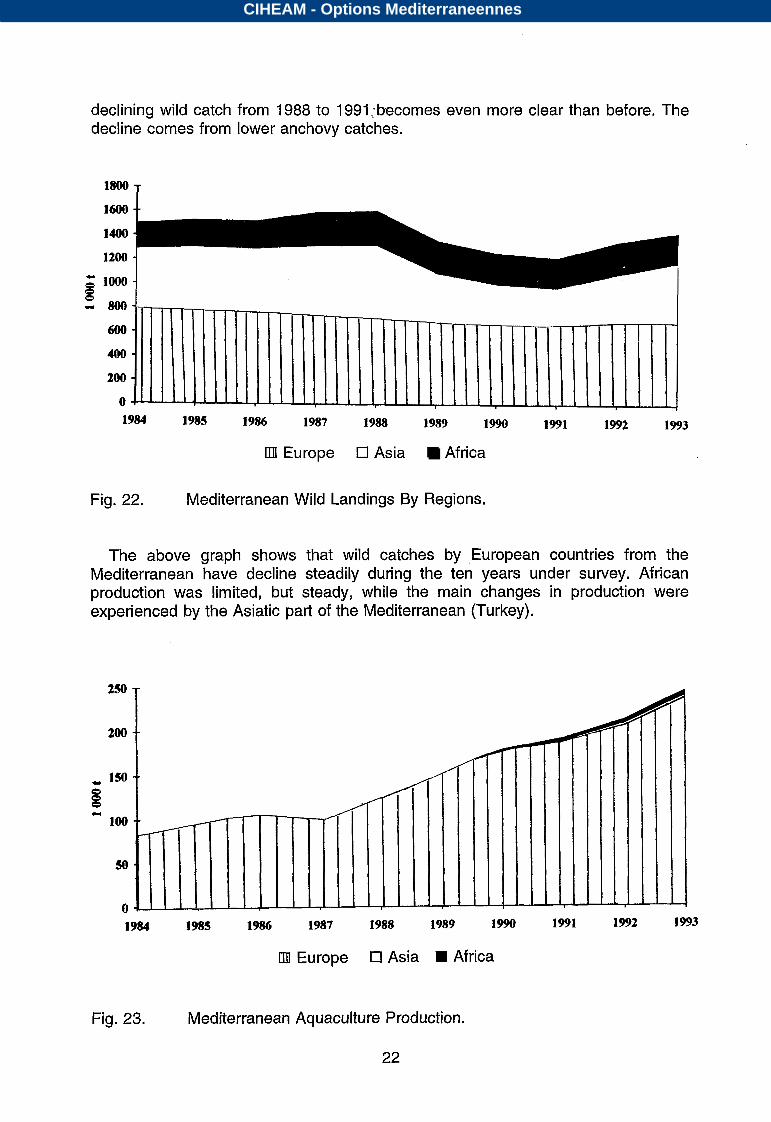
declining wild catch from 1988 to 1991;becomes even more clear than before. The decline cornes from lower anchovy catches.
1990
Europe 0 Asia Africa
Fig. 22. Mediterranean Wild Landings By Regions.
The above graph shows that wild catches by ,European countries from the Mediterranean have decline steadily during the ten years under survey. African production was limited, but steady, while the main changes in production were experienced by the Asiatic part of the Mediterranean (Turkey).
T
1986
UII Europe U Asia W Africa
e
l Fig. 23. Mediterranean Aquaculture Production.
22
CIHEAM - Options Mediterraneennes
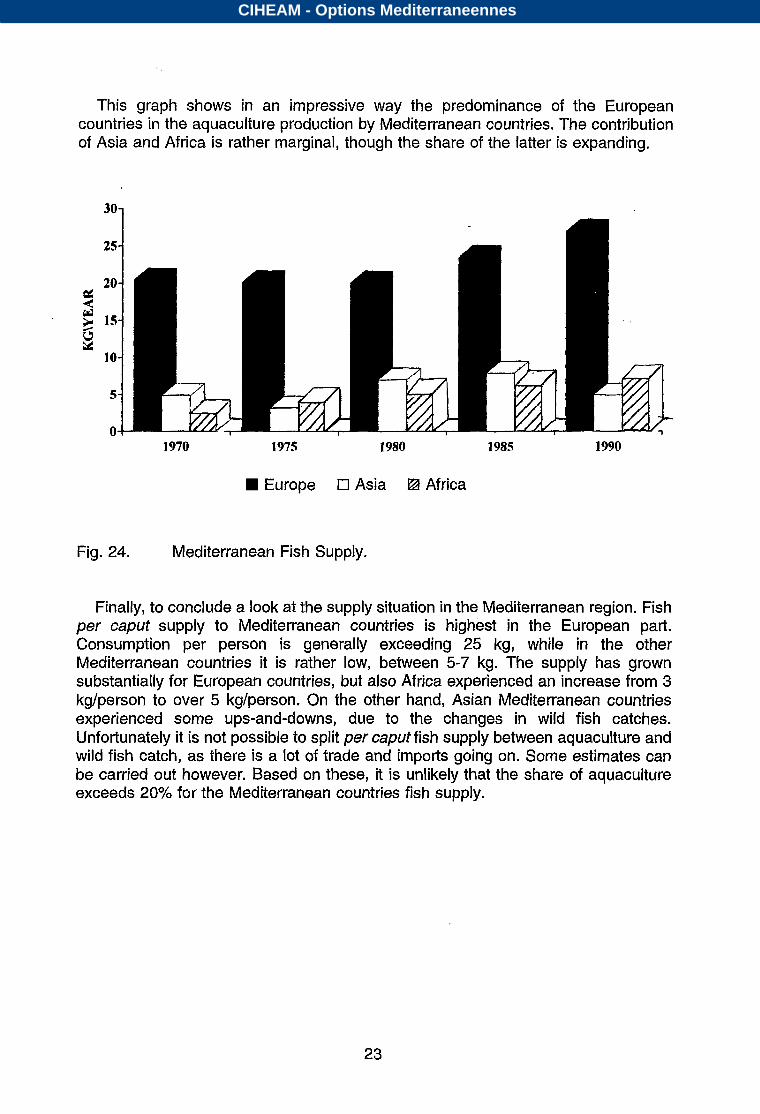
This graph shows in an impressive way the predominance of the European countries in the aquaculture production by Mediterranean countries. The contribution of Asia and Africa is rather marginal, though the share of the latter is expanding.
1970 1975 1980 1985 1990
Europe O Asia Africa
Fig. 24. Mediterranean Fish Supply.
Finally, to conclude a look at the supply situation in the Mediterranean region. Fish per caput supply to Mediterranean countries is highest in the European part. Consumption per person is generally exceeding 25 kg, while in the other Mediterranean countries it is rather low, between 5-7 kg. The supply has grown substantially for European countries, but also Africa experienced an increase from 3 kg/person to over 5 kg/person. On the other hand, Asian Mediterranean countries experienced some ups-and-downs, due to the changes in wild fish catches. Unfortunately it is not possible to split per caput fish supply between aquaculture and wild fish catch, as there is a lot of trade and imports going on. Some estimates can be carried out however. Based on these, it is unlikely that the share of aquaculture exceeds 20% for the Mediterranean countries fish supply.
CIHEAM - Options Mediterraneennes