finpro digital africa growth program pre study for kenya - 26052015
TRANSCRIPT
Finpro Digital Africa Growth Program Pre-study: Kenya Market study on opportunities in Kenya for Finnish ICT companies within the sectors of banking and financial services, telecommunications and cyber security

Finpro Digital Africa Growth Program Pre-study: Kenya
2 of 42
Content index:
1 BANKING AND FINANCIAL SERVICES SECTOR ..................................... 5
1.1 Summary ............................................................................................................................................ 5 1.2 Introduction ....................................................................................................................................... 6 1.3 Nature of the market and market size for technology solutions .............................................. 7 1.4 Structure of the market ................................................................................................................... 7
1.4.1 Banks................................................................................................................................................... 7 1.4.2 Savings and Credit Cooperatives (SACCOs) .................................................................................... 7 1.4.3 Mobile Money ...................................................................................................................................... 8 1.4.4 Insurance companies ........................................................................................................................ 8 1.4.5 Money remittance services (from diaspora) ................................................................................... 9
1.5 Overview of companies and products ........................................................................................... 9 1.5.1 Agent banking .................................................................................................................................... 9 1.5.2 Islamic banking .................................................................................................................................. 9 1.5.3 Credit Reference Bureaus (CRBs) .................................................................................................. 10 1.5.4 Deposit Taking Microfinance Institutions ...................................................................................... 10 1.5.5 Revised Prudential and Risk Management Guidelines ................................................................. 10 1.5.6 African Trade Insurance Agency (ATI) products ............................................................................ 10 1.5.7 Key industry players ......................................................................................................................... 10
1.6 Market size....................................................................................................................................... 11 1.7 Competition ..................................................................................................................................... 11 1.8 SWOT analysis ................................................................................................................................. 12
1.8.1 Strengths .......................................................................................................................................... 12 1.8.2 Weakness .......................................................................................................................................... 12 1.8.3 Opportunities .................................................................................................................................... 13 1.8.4 Threats .............................................................................................................................................. 13
2 TELECOMMUNICATIONS INDUSTRY IN KENYA ................................. 14
2.1 Summary .......................................................................................................................................... 14 2.2 Nature of the market and market size for technology solutions ............................................ 14 2.3 Structure of Kenya’s ICT market .................................................................................................. 16
2.3.1 Fixed Telephony - Monopoly ........................................................................................................... 18 2.3.2 Mobile Telephony - Oligopoly .......................................................................................................... 18 2.3.3 Internet/data - Perfect competition .............................................................................................. 18
2.4 Product and services: .................................................................................................................... 19 2.5 Key players, value chain and business models .......................................................................... 19
2.5.1 International network facility providers: ........................................................................................ 19 2.5.2 Internet/Data Market ....................................................................................................................... 20 2.5.3 Mobile telephony market ................................................................................................................. 21 2.5.4 Fixed telephony market ................................................................................................................... 21 2.5.5 Mobile money transfer service ........................................................................................................ 21
2.6 Value chain & business models .................................................................................................... 21 2.7 Estimated market size and value ................................................................................................. 22 2.8 Competition ..................................................................................................................................... 24 2.9 SWOT analysis ................................................................................................................................. 25

Finpro Digital Africa Growth Program Pre-study: Kenya
3 of 42
2.10 Challenges and needs, and the resulting opportunities .......................................................... 26 2.10.1 Potential opportunities stemming from these needs .................................................................. 28
2.11 Buying process and decision making .......................................................................................... 31 2.12 Entry strategy and partners .......................................................................................................... 31
3 CYBER SECURITY IN KENYA ............................................................. 33
3.1 Summary .......................................................................................................................................... 33 3.2 Introduction ..................................................................................................................................... 34 3.3 Laws and regulations ..................................................................................................................... 34 3.4 Top threats in 2013 ........................................................................................................................ 34
3.4.1 Insider threats .................................................................................................................................................. 34 3.4.2 VoIP PBX fraud .................................................................................................................................................. 35 3.4.3 Social media ...................................................................................................................................................... 35 3.4.4 Denial of service attacks ............................................................................................................................... 35 3.4.5 Botnet attacks .................................................................................................................................................. 35 3.4.6 Online and mobile banking ............................................................................................................................ 35 3.4.7 Mobile money fraud ......................................................................................................................................... 35 3.4.8 Cyber espionage ............................................................................................................................................... 35
3.5 Threat landscape analysis ............................................................................................................ 36 3.6 Criminal activity .............................................................................................................................. 36 3.7 Structure and size of the market ................................................................................................. 37 3.8 Nature of the market value chain ................................................................................................ 37 3.9 Overview of key companies and organizations .......................................................................... 38 3.10 Buying process and decision making .......................................................................................... 39 3.11 Business models ............................................................................................................................. 39 3.12 SWOT analysis ................................................................................................................................. 40 3.13 Challenges ....................................................................................................................................... 40 3.14 Business needs ............................................................................................................................... 41 3.15 Opportunities .................................................................................................................................. 41 3.16 Entry strategy and partners .......................................................................................................... 41

Finpro Digital Africa Growth Program Pre-study: Kenya
4 of 42
CONTACT DETAILS For communication concerning this report please contact: GrowthAfrica: Contact person: Address Lenana Towers 843, Ian Lorenzen 5th floor, Lenana Road Business Facilitator & Partner Nairobi, Kenya Email: [email protected] Email: [email protected] Website: www.growthafrica.com Mobile: +254 731513951
ABBRIVIATIONS
ARPU ‐ Average Revenue Per User ASP ‐ Applications Service Provider ATI ‐ African Trade Insurance Agency BPO ‐ Business Process Outsourcing CAGR ‐ Compound Annual Growth Rate CBK ‐ Commercial Bank Of Kenya CCK/CA ‐ Communications Authority Of Kenya CRB ‐ Credit Reference Bureau CSP ‐ Content Service Provider DTM ‐ Deposit Taking Microfinance Institution DTS ‐ Deposit Taking Saccos EAASy ‐ Eastern Africa Submarine Cable System EABS ‐ East African Building Society EIB ‐ European Investment Bank FttH ‐ Fibre to the Home GDP ‐ Gross Domestic Product GSM ‐ Global System for Mobile communication ICT‐ Information Communication And Technology IDC ‐ Industrial Development Corporation IFMIS ‐ Integrated Financial Management Information System IPTV ‐ Internet Protocol Television ISP ‐ Internet Service Provider IXP ‐ Internet Exchange point KENET ‐ Kenya Education Network KIXP ‐ Kenya Internet Exchange Point
LION ‐ Lower Indian Ocean Network LTE ‐ Long Term Evolution MNC ‐ Multinational Corporation MNO ‐ Mobile Network Operator MVNO ‐ Mobile Virtual Network Operator NFP ‐ Network Facilities Provider NOFBI ‐ National Optic Fibre Backbone Infrastructure PBX ‐ Private Branch Exchange PDCC ‐ Public Data Communications Carrier SACCO ‐ Savings And Credit Cooperative SASRA ‐ Sacco Society Regulatory Authority SIM ‐ Subscriber Identity Module SME ‐ Small And Medium‐Sized Enterprises TESPOK ‐ Telecommunication Service Providers Association Of Kenya ULF ‐ Unified Licencing Framework VAR ‐ Value Added Reseller VOIP ‐ Voice Over IP VPN ‐ Virtual Private Network VSAT ‐ Very Small Aperture Terminal WAN ‐ Wide Area Networking WiMAX ‐ Worldwide Interoperability For Microwave Access WTO ‐ World Trade Organization
CURRENCY All numbers are presented in EURO (EUR) and calculated as follows: 1.00 USD = 0.900648 EUR, 1.00 KES = 0.00931433 EUR
The material is developed based on the conducted interviews and available information and data. This document represents the latest publicly available information. As often is the case in Africa the data and information may not be absolutely up to date.

Finpro Digital Africa Growth Program Pre-study: Kenya
5 of 42
1 BANKING AND FINANCIAL SERVICES SECTOR
1.1 Summary The Kenyan Financial and banking sector has registered impressive performance, with the size of assets standing at EUR 22.05 billion, loans and advances amounting to EUR 12.85 billion, while the deposit base stood at EUR 16.54 billion and profit before tax of EUR 258.89 million as at 31st March 2013. During the same period, the number of bank customer deposit and loan accounts stood at 17.3 million and 2.3 million respectively a steady increase from previous figures. The sector has had immense innovations with the most outstanding being mobile money transfer and agency or satellite banking initiatives that have gradually put the sector on the global map. In the first quarter of 2015, the number of mobile money transfer subscriptions stood at 26.0 million while the number of agents increased by 4.6 % to reach 121,924 up from 114,988 agents recorded in 2014. In 2014, the value of mobile payments grew by nearly a third to EUR 21 billion compared to EUR 8 billion of 2013. This means that consumers moved an average of EUR 1.71 billion monthly or EUR 56.7 million per day compared to the EUR 43.84 million a day they moved in a similar period in 2013. Cash deposits through commercial bank agents in 2012 stood at 13 million transactions, valued at EUR 10.52 billion. On the other hand, cash withdrawals were valued at EUR 517.92 million. Agents made transactions of payment of retirement social benefits worth EUR 11.41 million and bill payments worth EUR 2.45 million. As at March 31, 2013, there were 11 commercial banks that had contracted 18,082 active agents facilitating over 48.4 million transactions valued at EUR 2.63 billion. This is an increase from the 10 banks that had contracted 16,333 active agents facilitating over 38.7 million transactions valued at EUR 2.1 billion in December 2012. The sector continues to present a favourable outlook for the future due to solid macroeconomic fundamentals. This is seen through continued expansion of Kenyan banks into the region, further expansion of the branch network and agency banking in the domestic market, entry of foreign (regional and international) banks, and higher demand for banking services as financial inclusion leads to more individuals banked across the country and region. Proper guidelines and frameworks have been put in place by the relevant bodies to harbour a healthy and competitive environment for increased growth. Merging of corporate tax and value‐added tax procedures, as well as the digitization of the registrar’s records in 2011 has increased efficiency in the sector. As a result new entrants are able to secure their place with a reduced bureaucratic probe. Amidst the changing landscape in the sector and technological innovations put in place, there is a need to improve operational efficiency and enhance control of operations. As a result diverse opportunities lie for Finnish ICTs which wish to provide solutions in various gaps in the sector. Key sector trends and opportunities: Consolidation of data, systems and processes Internet and mobile payment solutions / concepts / innovations / services Process automation IT solutions and software Leasing solutions / products System for online, real‐time trading on the stock exchange Solutions driving down the cost of receiving remittances from abroad (for example through BitCoins) Credit sharing solutions E‐learning solutions and content for financial institutions branch employees Vulnerable core banking servers Printed passwords to the Central Bank Virtual Private Network Favourable public‐private partnerships in the execution of infrastructure projects Finnish ICT companies can therefore take up the opportunities in an environment that wishes to foster new experiences for their consumers through technological development. This is due to new customer centric models of innovation as banks evolve from a product oriented value addition to the latter.

Finpro Digital Africa Growth Program Pre-study: Kenya
6 of 42
1.2 Introduction Financial sectors on the African continent remain largely underdeveloped, while banking industries continue to dominate the landscape in terms of total assets and services. Nonetheless, financial sector development has been on the agenda of African policy makers for some time. Various policy reforms over the past decade have contributed to an environment more conducive to financial sector development. Governments have made progress in introducing much needed legal regulatory frameworks, information infrastructure and regulatory institutions. As a result, the depth and coverage of financial systems, when measured by the ratios of broad money volumes of bank deposits and private sector credit to GDP, have improved over the past two decades.i Nevertheless, Africa’s financial sector continues to be less developed compared to other emerging market regions. However, Africa enjoys certain key advantages that will enable the continent to equal or even surpass at least some of its emerging market counterparts in terms of financial sector development in the coming decade and beyond. Most African financial markets are open to new entrant including foreign players compared to other emerging market economies. The growing presence of subsidiaries of major global banks on the continent has undoubtedly improved the quality of financial services in recent years; the focus here has largely, but not exclusively, been on high margin corporate businesses as opposed to retail banking sector. Kenyan is the third largest financial market in sub Saharan Africa after Nigeria and South Africa however, the larger two are dominated by large local players. The continent has also often been at the forefront of new technological advances and other innovative methods to reach new customers and simplify access to banking, especially in more rural locations. However, more than anything else, Kenya represents massive financial sector growth potential due to the fact that the market is still largely unsaturated. According to the World Bank, only 14.9% of adults in sub‐Saharan Africa had deposit accounts with commercial banks in 2012. Africa’s flourishing middle class, forecast to triple over the next two decades, further supports the massive potential that lies within Africa’s growing consumer base. Indeed, with real GDP per capita in many African countries having climbed past the critical EUR 886‐level, a rapid expansion in retail banking is foreseen in coming years. The World Bank projected retail banking in sub‐Saharan Africa to grow at a compound annual rate of 15% between 2013 and 2020, bringing the sector’s contribution to the continent’s collective GDP to 19% from an estimated 11% in 2009. To do so however, institutions will continually need to embrace innovative strategies so as to shape banking products to fit consumers’ rising financial sophistication needs as well as to tap into the continent’s massive ‘unbanked’ population. Kenya leads the way in the region’s financial sector and is the only country whose local banks have achieved a significant presence throughout the region. In most other countries, local banks focus predominantly on domestic markets. Most of the banking sectors in the region with the exception of Kenya, have significantly more foreign banks than local banks operating in local markets. The Kenyan banking sector comprises of 43 commercial banks. The sector is relatively well developed and dynamic, while access to credit has been boosted over the past decade by the advent of mobile and agency banking. A number of Kenyan banks have also expanded into neighbouring countries. Prudential guidelines introduced in 2012 have helped to improve banks’ risk management practices. The sector has continued to record strong growth during 2013, seeing as the deposit base expanded by 12.5%, while gross loans grew by 17.65% year‐over‐year in December 2013. Also, the demand for credit picked up significantly following the peaceful conclusion of elections in March 2013. Credit demand was further boosted by lower interest rates and an upbeat macroeconomic outlook. Kenya’s banking sector has a favourable outlook for the future. This view is supported by solid macroeconomic fundamentals, continued expansion of Kenyan banks into the region, further expansion of the branch network and agency banking in the domestic market, and higher demand for banking services due to the government’s devolution process. In the Kenya Revenue Authority Top 10 largest taxpayers 2011, banks occupied four of the top position. This simply reflects the sector’s economic dominance in Kenya. Regional integration is taking hold within Kenya's banking sector. The latest foray into Kenya by Nigeria's United Bank for Africa (UBA) signifies West Africa's increasing appetite to participate in the East African markets. UBA is the second bank from West Africa to enter into the Kenyan banking industry. Togo‐based Ecobank entered Kenya last year after acquiring a 75% stake in East African Building Society (EABS) Bank.

Finpro Digital Africa Growth Program Pre-study: Kenya
7 of 42
1.3 Nature of the market and market size for technology solutions The advent of modern technology and other innovations have successfully enabled a handful of pioneers to provide banking services to a far wider income customer base than ever before. More specifically, the emergence of mobile technology as an alternative to more traditional banking has allowed for services to be provided to lower income households often residing at distant rural locations. This was made possible by the rapid diffusion of affordable cellular technology on the African continent. According to a study completed by the African Development Bank during 2012, “the number of subscribers on the continent has grown almost 20% each year for the past five years. Mobile telephony penetration in Africa has increased exponentially from less than 2 million subscribers in 1998 to over 500 million in 2011.” Mobile banking has achieved the broadest success in sub‐Saharan Africa, where 16% of adults reported having used a mobile phone in the 12‐months leading to April 2012 to pay bills or send or receive money. This is compared to less than 5% in other regions. One of the most successful mobile banking models in Africa is considered to be Kenya’s MPESA, which caters to more than 14 million customers (70% of Kenya’s adult population). Developed by Vodafone and launched commercially by the company’s Kenyan affiliate Safaricom, MPESA is an electronic payment system accessible from ordinary mobile phones. MPESA account holders can use their mobile phones to transfer funds, pay bills, and purchase mobile airtime credit. This is widely aired as successful but the success has not been replicated in any other African country to date.
1.4 Structure of the market Kenya’s banking sector consists of 43 commercial banks and 1 mortgage finance company whereby 31 are locally owned and 13 are foreign owned. These are further split into private and public owned institutions. The leading banks in terms of asset ownership are Kenya Commercial Bank (KCB), which has regional foothold in all of East Africa with branches in all South Sudan’s ten provinces. KCB has EUR 4.05 billion in assets. Equity is the second largest with EUR 2.84 billion in assets with Barclays and Cooperative Banks taking the third and fourth positions with a share of EUR 2.25 billion and EUR 2.063 billion respectively.
1.4.1 Banks
The latest data reveals that Kenya’s banking industry is going strong. In 2011, the industry recorded a EUR 822.96 million pre‐tax profit and paid up EUR 236.3 million in total. According to Habil Olaka, CEO of Kenya Banker’s Association, they are expecting the banking sector to increase its contribution to the country’s coffers. He adds that Kenya’s economy is reliant to the banking industry, and that it is likely to continue to develop. Based on the data released by the Central Bank of Kenya, the banking industry recorded a 20% increase in profit last year, amounting to EUR 993 million. Therefore, if the tax payment increase by the same margin, then the tax from the banking industry is expected to surpass EUR 275.6 million.
1.4.2 Savings and Credit Cooperatives (SACCOs)
There are over 6,000 registered Savings and Credit Cooperatives (SACCOs) in Kenya. 1,995 SACCOs filed audited financial statements for the year ending 31 December 2013 with the Ministry of Industrialization and Enterprise Development. There are 215 deposit taking SACCOs (DTS), out of which 135 have been licensed by the Sacco Society Regulatory Authority (SASRA). The remaining 80 are yet to meet statutory requirements to be licensed. These DTS account for 78% of the total assets and deposits of the entire SACCO sector, the DTS command 82% of the SACCO membership.ii The financial performance of the 1,995 SACCOs that filed returns has recorded growth. Membership served by SACCOs increased to 3.3 Million as at December 2013 from 2.97million in 2012. Total Assets increased by 14% to EUR 3.08 billion (2.7 billion in 2012). Deposits grew by 13% to EUR 2.2 billion (1.95 billion in 2012). Loans and advance grew by 13.7% to EUR 2.32 billion (2.05 billion in 2012). Total Capital grew by 11% to EUR 230.4 million (193.8 million in 2012) The performance of the 235 licensed deposit taking SACCOs is as below: Total assets grew by 17% from EUR 1.9 billion in 2012 to EUR 2.23 billion in 2013 Income also grew by 32% to EUR 313.6 million, from the EUR 258.3 million recorded in 2012 Financial expenses grew by 14% to stand at EUR 147.6 million Non‐Performing loans (NPLs) declined from 7.4% in 2012 to 4.7% in 2013. Total capital grew by 30% to EUR286.4 million from 221.7 million in 2012

Finpro Digital Africa Growth Program Pre-study: Kenya
8 of 42
Loans and advances remain the biggest component of total assets of SACCOs contributing 76% of the total
Finance expenses to total income ratio stands at 47% of total income, which does not compare favourably with banks at 31% and Micro finance institutions at 21% but it is expected as most earnings are paid out as interest and rebates to members.
Operating expenses grew by 18% from EUR 91.5 million to EUR 108.1 million All the 135 licensed SACCOs complied with minimum core capital requirement of EUR 92,369.9 On average the SACCOs in 2013 exceeded core capital to total assets regulatory ratio of 10% to stand at
10.47% SACCOs in addition exceeded Core Capital to Total deposit liabilities statutory ratio of 8% to record
14.66% performance
1.4.3 Mobile Money
In 2014, the Central Bank of Kenya’s (CBK) report showed the value of mobile payments grew by nearly a third to EUR 21.3 billion compared to EUR 8.06 billion of 2013. This means that consumers moved an average of EUR 1.72 billion monthly or EUR 57.4 million per day compared to the EUR 44.4 million a day they moved in a similar period in 2013. Kenya has five main mobile money platforms: Safaricom’s M‐Pesa, Airtel Money, Orange Money, MobiKash and Tangaza Pesa ‐ backed by a network of about 120,781 agents.iii Interestingly for a middle class economy like Kenya, CBK data shows card payments plunged 17.4% to EUR 11.11 billion last year compared to EUR 13.9 billion in 2013. People trust mobile money more than they trust cards and with the increasing opportunities for paying with mobile money across consumer and business sectors mobile appear to be winning market shares at the expense of cards. Four MNVO licenses were sold in 2014 and for two of the licensees it anticipated that the licenses’ primary target is to establish a significant presence in the mobile money space. It is important to note that there still remains 2 million unbanked individuals despite the various inclusion initiatives. Financial inclusion has therefore led to a strategy where the formerly “unbanked” population has been propelled towards incorporating banking services in their banking strategies. More than double the number of adults use mobile phone financial services (11.5 million) compared with banks (5.4 million). As a result: Use of mobile phone financial services more than doubled from 28% in 2009 to 62% in 2013 Bank use has been rising over time from 13.5% in 2006 to 29.2% in 2013 Use of MFIs has remained at 3.5% between 2009 and 2013 Use of SACCOs has decreased since 2006, from 13.5% in 2009 to 9.1% in 2013 Use of informal groups has decreased from 39.1% in 2006 to 27.7% in 2013
1.4.4 Insurance companies
Total expenses in the insurance industry amounted to EUR 193.4 million in 2013 compared to EUR 157.4 million in 2012. Medical and motor classes in the insurance industry continue to be the main drivers of the sector contributing 63% of the total gross premiums in 2013, hitting EUR 1.2 billion in 2013 compared to EUR 1.01 billion in 2012. Individuals may collide with health practitioners to fake illnesses and medical operations while health centres over price insured individuals. This is also facilitated as half the claims paid are not insured. According to the Annual Insurance Industry Report by the Association of Kenya Insurers (AKI), motor insurance accounted for 39% of total gross premiums or EUR 313.1 million including commercial and private, while medical class recorded a 24% or EUR 192.71 million of the total premiums. At the same time medical insurance recorded the highest growth of 59% to EUR 194.7 million from EUR 120.5 million in 2012. The growth of the medical class was exceptionally high because of newly licensed medical insurance underwriters who were not included in 2012. The two classes are under the general insurance or Non‐Life segment which recorded a gross premium worth EUR 797.2 million compared to EUR 661.7 million in 2012. Other classes include fire, work injury benefit, personal accident, marine, theft and aviation. The life insurance business on the other hand recorded a premium income of EUR 407.9 million up from EUR 343 million in 2012. The segment carries the ordinary life, group life, pension business and investment contracts. Meanwhile, claims increased to EUR 315.2 million in the year under review from EUR 269 million in 2012 with medical insurance recording the highest loss of 75% or EUR 89.1 million followed by motor private at 70%, equivalent to EUR 83.5 million.

Finpro Digital Africa Growth Program Pre-study: Kenya
9 of 42
1.4.5 Money remittance services (from diaspora)
About 2.5 million Kenyans living abroad are sending money back to Kenya. Remittance inflows to Kenya in February 2015 increased by 11.6% to EUR 110.89 million from EUR 99.3 million in February 2014 was 7.5% higher than inflows in January 2014. The increase in February 2015 was largely on account of inflows from North America. The 12 month cumulative inflows in February 2015 increased by 10.6% to USD 1,299 million from EUR 1,175 million in the year to February 2014. The 12 month average flow maintained an upward trend during the year peaking at to EUR 108.2 million by February 2015. The market has traditionally been dominated by global remittance services such as Western Union and MoneyGram. Safaricom announced a new service with MoneyGram at the end of 2014 enabling consumers in over 90 countries outside Kenya to send money directly to M‐PESA. It was recently rumoured that Western Union and MoneyGram were in merger or acquisition talks – a move seen as a reaction to an increasingly competitive space. Nation Media Group in partnership with Diamond Trust Bank (DTB) has in the second half of 2013 launched its own money transfer service named Nation Hela (www.nationhela.com). Recently bitcoin remittance provider BitPesa has officially launched its beta test in Kenya. The company offers a 3% cut‐rate fee. BitPesa is just one of a few bitcoin firms that aims to disrupt a traditional remittance market that often imposes high costs on those wishing to use remittance services. For example, the cost of sending money to Kenya by other means can be as much as 9.2% of the value being transferred by services like Western Union and MoneyGram, and 19.8% by banks,
1.5 Overview of companies and products Before 2010, financial institutions focused on their traditional and conservative roles. The market share was rather small and focused on the seemingly banked populations which includes but is not limited to individuals with formal employment and constant income flows. However as mentioned, the introduction of mobile banking pioneered by Safaricom saw a paradigm shift that incorporated the unbanked population as discussed under the mobile banking category. Apart from the lending, and mortgage products offered by the financial institutions, it is important to note some commendable products offered by banks that have seen them incorporate some of the latest technological advances and also allow them capture a larger clientele. This was in a quest for banks to counter and catch up with the strands taken up by the introduction of mobile banking.
1.5.1 Agent banking
Cash deposits through commercial bank agents in 2012 stood at 13 million transactions, valued at EUR 1.07 billion. On the other hand, cash withdrawals were valued at EUR 529.4 million. The agents also made transactions of payment of retirement social benefits worth EUR 11.6 million and bill payments worth EUR 2.51 million. As at March 31, 2013, there were 11 commercial banks that had contracted 18,082 active agents facilitating over 48.4 million transactions valued at EUR 2.69 billion. This was an increase from 10 banks that had contracted 16,333 active agents facilitating over 38.7 million transactions valued at EUR 2.06 billion in December 2012.iv Agency banking model allows banks to liaise with commercial outlets like cybercafés, shops, petrol stations and supermarkets to offer financial services that include depositing and withdrawing cash. The partnership has seen banks in Kenya take financial services closer to people, in particular, to areas that lack them. It is estimated that a third of the country’s 40 million people lack access to banking services. Kenya changed its banking laws in January 2011 to allow commercial banks offer their services through the third‐party businesses. The agents operate as satellite branches.
1.5.2 Islamic banking
Islamic banking is also a unique product that many companies are offering in Kenya. Gulf African Bank and
First Community Bank, each an Islamic bank, commenced operations in Kenya in 2008 offering Sharia‐compliant banking services. Their combined operations now represent approximately 1% of Kenya's gross banking assets. In the current year, Kenya Commercial bank (KCB) also rolled out its Sharia Compliant banking product for both its Islamic and Non Islamic clientele, in an aim to cater to more of the unbanked populations.

Finpro Digital Africa Growth Program Pre-study: Kenya
10 of 42
1.5.3 Credit Reference Bureaus (CRBs)
The Credit Information Sharing (CIS) mechanism, which was launched in July 2010, continues to be used by both commercial banks and individuals. The number of credit reports requested by institutions stood at 2,596,600 in March 2013 up from 2,321,766 reports in December 2012, representing an increase of 11.8% or 274,834 reports. Over the same period, the number of reports requested by customers increased from 28,733 to 35,172 reports. The introduction of the credit information sharing mechanism has further strengthened credit appraisal standards. Banks have now incorporated credit reference reports in the credit risk appraisal. It is also expected that credit referencing will go a long way in inculcating credit discipline in borrowers. There are currently 3 CRBs in Kenya: Just licensed Creditinfo Credit Reference Bureau Kenya Limited (www.creditinfo.com, Icelandic firm), Metropol Corporation Ltd. (www.metropol.co.ke, Kenyan company, worked with Dun & Bradstreet International (D&B) till 2006)) and CRBAfrica (www.crbafrica.com, Kenyan).
1.5.4 Deposit Taking Microfinance Institutions
As at 31st March 2013, 8 Deposit Taking Microfinance Institutions (DTMs) were in operation and had gross loans worth EUR 196.5 million compared to EUR 191 million registered in December 2012 thus translating to a growth of 3.7%. Similarly, the deposits base stood at EUR 152.1 million representing a growth of 6.4% from EUR 142.8 million in December 2012. The long‐term borrowings by DTMs increased from EUR 76.97 million in December 2012 to EUR 81.6 million in March 2013. The number of DTMs deposit accounts and loan accounts stood at 1.79 million and 0.47 million respectively in March 2013 compared to 1.76 million deposit accounts and 0.46 million loans accounts registered at end of December 2012.
1.5.5 Revised Prudential and Risk Management Guidelines
The revised Prudential and Risk Management Guidelines issued in November 2012 came into effect in January 2013. Seven new Prudential Guidelines were issued covering various operating aspects of banks. These include Outsourcing, Representative Offices of Foreign Institutions, Voluntary Liquidation, Consolidated Supervision, Stress Testing, Prompt Corrective Action and Consumer Protection. In addition, the existing nine Risk Management Guidelines were reviewed while two new guidelines on Country and Transfer Risk and Information and Communication Technology Risk Management were introduced. According to the Banking Sector 2013 Outlook the banking sector is expected to sustain its growth momentum on the backdrop of a stable macro‐economic environment, and domestic and regional expansion by banks.
1.5.6 African Trade Insurance Agency (ATI) products
In 2014, NIC Bank and ATI formed a partnership aimed at addressing the lending gap that exists most notably in the SME sector. Under the transaction, NIC Bank will be the first bank to take up ATI’s new insurance cover that will protect NIC’s entire portfolio of trade finance borrowers against the risks of insolvency and non‐payment – risks that have traditionally inhibited most African banks from lending to SMEs. The product will help banks extend credit facilities such as short term loans, invoice discounting, bank guarantees and letters of credit without the requirement of the standard tangible securities as is the current practice by banks. This stands to have a positive impact particularly on the SME sector, which has historically been hindered from accessing working capital due to insufficient security. ATI product stands to impact the financial industry because it provides a risk mitigation against credit default risk, thereby opening up a window of opportunity for both the SMEs and the banks to benefit.
1.5.7 Key industry players:
The strengthening of the Kenyan economy for the last ten years due to a change in governance has seen a major transformation in the banking industry. Commercial banks and investment banks in Kenya have been opened up throughout the country to provide financial services.
Top 10 banks: Top 10 insurance companies:
Equity Bank Kenya Co‐Operative Insurance Company (CIC
Standard Chartered Bank Kenya Blue Shield Insurance Company
Barclay's Bank Kenya Insurance Company of East Africa (ICEA) Lion Group
Kenya Commercial Bank (KCB) Kenindia Assurance Company
Diamond Trust Bank Kenya (DTB) UAP Provincial Insurance Company
Housing Finance Bank of Kenya British American Insurance Company
CFC Stanbic Bank Kenya Heritage Insurance Company
NIC Bank Kenya Jubilee Insurance Company

Finpro Digital Africa Growth Program Pre-study: Kenya
11 of 42
Cooperative Bank of Kenya APA Insurance Services
Commercial Bank of Africa (CBA) Pan Africa Insurance Holdings
1.6 Market size In 2012, the banking industry has been the major contributor to the rise in tax revenue. Apart from corporation tax, banks also pay VAT, stamp duty and income tax for the more than 30,000 people they employ. The Kenyan Banking Sector registered improved performance with the size of assets standing at EUR 22.3 billion, loans and advances amounting to EUR 13 billion, while the deposit base stood at EUR 16.7 billion and profit before tax of EUR 261.4 million as at 31st March 2013. During the same period, the number of bank customer deposit and loan accounts stood at 16.0 million and 2.13 million respectively. Assets:
The banking sector’s aggregate balance sheet expanded by 2.7% from EUR 21.8 billion in December 2012 to EUR 22.4 billion in March 2013. The major components of the balance sheet were loans and advances, government securities and placements, which accounted for 55.8%, 21.1% and 5.5% of total assets respectively.
Loans and advances:
The sector’s gross loans and advances increased from EUR 12.6 billion in December 2012 to EUR 13 billion in March 2013, which translated to a growth of 3.0%. The growth, which stood at EUR 370.7 million, was in 7 sectors registering a marginal decline occasioned by faster loan repayment rate compared with the rate at which new loans were being made in those sectors during the period.
Deposit liabilities:
Deposits, which form the main source of funding for the banking sector, accounted for 73.5% of total funding liabilities. The deposit base grew by 0.8% from EUR 16.31 billion in December 2012 to EUR 16.5 billion in March 2013 mainly due to branch expansion, remittances and receipts from exports. The number of deposit accounts increased from 14,735,836 in December 2012 to 16,036,067 in March 2013 representing a growth of 1.44 million accounts or 9.1%.
Capital and reserves: The banking sector registered improved capital levels in March 2013 with total
capital growing by 6.7% from EUR 3.09 billion in December 2012 to EUR 3.3 billion in March 2013. Shareholders’ funds increased by 3.5% from EUR 3.4 billion in December 2012 to EUR 3.5 billion in March 2013. Similarly, the ratio of total capital to total risk‐weighted assets increased from 21.9% in December 2012 to 23.2% in March 2013 while core capital to total risk weighted assets increased from 18.9% to 20.3% over the same period.v
1.7 Competition Financial institutions are face the emergence of formidable competitors, from companies in the retail and communications sectors that haven’t traditionally operated in this space. Financial institutions have therefore turned to technology to create disruptive banking models that capture the imagination of consumers and erode the market of traditional banks. A slew of new payment technologies with bolstered security features are making it easier for non‐traditional financial companies to cross the chasm of distrust among merchants and consumers. For example; Oracle recognizes these challenges and is working closely with financial institutions on new strategies that focus on a “customer in” versus “product out” approach. The rapidly evolving landscape, while threatening at first glance, actually holds hidden opportunities for traditional players who focus on reinventing the customer experience. As consumers become more accustomed to conducting transactions outside the traditional banking environment, financial institutions can leverage their scale to provide an experience superior to that offered by new entrants.

Finpro Digital Africa Growth Program Pre-study: Kenya
12 of 42
As banking institutions survey the unfolding landscape, the message becomes obvious: To continue to lead on their home turf, financial institutions must not only rethink and improve the customer experience, they must look at new approaches to transform it, from end to end.
1.8 SWOT analysis
1.8.1 Strengths
Recent developments, such as the expansion of mobile phone‐based banking and the spread of pan‐African banking groups, have the potential to significantly change the landscape for banking in much of sub‐Saharan Africa, but also introduce new challenges for financial regulators. A broad sector with a significant number of players catering for various segments. The industry players are relatively technology driven and open to innovations and solutions which can improve their internal processes and drive their customer acquisition or retention.
1.8.2 Weakness
a. Weak controls in the banking sector Impediments to development include the small size of national markets, low income levels, and weak creditor rights and judicial enforcement mechanisms. Examining various indicators in relation to financial system access, depth, efficiency and stability; the findings suggest that sub‐Saharan Africa (SSA) performed weakest on average.
b. Infrastructural weaknesses
The unavailability of efficient infrastructure remains a key challenge for a number of African countries and as such, cost of providing the necessary infrastructure adds significantly to the cost of doing business. Also, payments systems are largely underdeveloped and as such supports process for efficiencies and reduction in cash handling are limited in a number of countries.
c. Weak regulatory frameworks
The global financial crises encouraged many countries on the continent to embark on becoming compliant with international regulatory frameworks (e.g. Basel guidelines). However, progress in this regard varies greatly between countries and regions. In addition to improved regulatory frameworks, African countries need to strengthen oversight and enforcement.
d. Unaffordable banking services
Probably one of the greatest constraints to growth in the African banking sector pertains to the fact that formal banking services remain mostly too expensive for the vast majority of lower income households. Banks have limited incentive to develop products for the poor masses that currently cannot afford banking products and hence mostly compete at the higher end of the income distribution. Increased competition at the higher end of the market could serve to make banking services more cost‐effective for higher income households. However, to bridge the gap between affordability and commercial viability would require an increase in average income and as a result larger middle classes across the continent. Although the evidence suggests that the African middle class is in fact expanding, innovative new banking solutions might serve to speed up this process.
e. Fraud
In 2013, Kenya lost about EUR 18 million to fraudsters who consisted of tech savvy employees. Identity theft, electronic funds transfer, cheques and credit card fraud, forgery of documents and online fraud as among the ways through which financial institutions lost cash. The insurance sector also faced impeccable restraints as the industry recorded that 20% of the claims paid for motor insurance are fraudulent while in the medical insurance sector fraudulent claims paid are between 30 ‐ 40%. Most of the fraud is done by staff members of insurance companies as well as loss assessors colluding with the insured to commit fraud.

Finpro Digital Africa Growth Program Pre-study: Kenya
13 of 42
f. Excess liquidity The European Investment Bank (EIB) notes that in many African countries “banking systems are characterized by significant excess liquidity, reflecting the scarcity of what banks deem to be credit‐worthy borrowers.” Banks in many countries continue to rely on government securities to generate earnings instead of growing loan books. In cases where loans are more prevalent, the interest rate spreads between loans and deposits are mostly large. The situation is compounded by the fact that, in a number of African countries, the necessary enablers to grow retail credit e.g. identification, credit bureaus etc. are absent or where they exist, in a very nascent phase.
g. Technological backlogs
A whitepaper published by the Industrial Development Corporation (IDC) of South Africa in 2013 highlighted information technology as a major operational challenge. The proliferation of multiple systems to deliver on operational needs, without a clear architecture governing interoperability and synergy has resulted in its own unique issues. Many banks in Africa indeed are plagued with reporting and data integration problems resulting from this challenge or the complete lack of requisite technology. “The consolidation of data, systems and processes is, therefore, a key priority for African banks in order to improve operational efficiency and enhance control of their operations”
1.8.3 Opportunities
Mobile payment solutions / concepts / innovations / services Process automation IT solutions and software Leasing solutions / products System for online, real‐time trading on the stock exchange Solutions driving down the cost of receiving remittances from abroad (for example through BitCoins) Credit sharing solutions Mortgage and housing loan products E‐learning solutions and content for financial institutions branch employees
1.8.4 Threats
The convergence and disruptive development in the mobile financial service space continues to challenge the industry. Especially Safaricom’s monopolistic position and utilisation of M‐PESA to leverage own or partnership products and services remains a challenge. Financial institutions will continue to weigh their strategic option – and whether to partner with Safaricom, compete with it or seek to build its current business in other ways.

Finpro Digital Africa Growth Program Pre-study: Kenya
14 of 42
2 TELECOMMUNICATIONS INDUSTRY IN KENYA
2.1 Summary The Kenyan telecommunications market is one characterized by a liberal regulatory framework, fierce competition, and rapidly developing infrastructure. This potential market of 44.3 million people consists of 180,000 fixed lines, a bandwidth capacity of 847,523 Mbps which is the highest in Africa, the largest mobile money market in the world at 25 million users, 27 million internet users, and 34 million mobile users which translates into 61% internet, and 80.5% mobile market penetration. These numbers reflect the staggering growth of the telecoms market caused by the overhauled licensing regime, and the arrival of four fibre‐optic international submarine cables resulting in a heavy investment in the National Optic Fibre Backbone Infrastructure (NOFBI). This in turn dramatically increased coverage and resulted in some of the lowest mobile tariffs the world and highest level of internet and telephony competition. The rapid nature with which this has been done however has left considerable gaps in the cyber security realm at almost all levels. In 2013, the ICT market in Kenya reached a value of EUR 4.64 billion, of which telecommunication services accounted for 71.9%, hardware made up 22.3%, and IT services and software represented 3.0% and 2.8%, respectively. The stratification of MNO provider’s services throughout all levels of the market has resulted in a cutthroat business environment based on product and service differentiation. This has spurred on higher quality services, more choice, and more innovative products for the consumer. The introduction of three new MVNO licenses in 2014 is set to shake up this mix and present an opportunity for further differentiation and potential partnerships. This rapid development of infrastructure and services mean that digital engagement which encompasses integration of mobility benefits with those offered by cloud, big data and social networking will be the key to capturing market share in Kenya. Digital engagement will combine social mobility, and big data initiatives, enabled by a cloud‐based approach, and move Africa’s mobility momentum further into the value‐added space. In addition the Kenyan Governments push to consolidate all 47 county governments’ fibre optic networks into one, and digitize their day‐to‐day operations in a non‐technology specific manner poses another huge market entry point for foreign entities. The automation of business processes in all levels of the education and health sector is another mammoth undertaking that will surely present opportunities for foreign software, hardware, and IT consultant services and products alike. Ultimately the coming years will be a large battle for the SME market as they rapidly automate their business processes and operations. In addition with this new modernization comes new IT procurement – new clients, new products, and new markets. The East African market is characterized by new markets, products, and clients, sought after by multinational corporations and African organisations alike driving innovation and entrepreneurship through cloud, the social enterprise, enterprise mobility, and big data as new product sets. However the lack of skilled ICT professionals and training initiatives poses a huge opportunity for foreign businesses to partner, invest, and play a role in the knowledge transfer process necessary in future large scale ICT projects. In summary the Kenyan ICT market is one that has the political will, established infrastructure, and plan in place to grow at an exponential rate. Entry into the market would also establish numerous future opportunities for further expansion into the East African market as terrestrial fibre cables connect deeper into the continent. There are numerous opportunities for Finnish firms to actively foster relationships and showcase their products and services so that they play an integral role in ensuring this exponential growth takes place in an effective and secure way.
2.2 Nature of the market and market size for technology solutions Kenya is often touted as the “Silicon Savannah”. The extent to which that is true is up for debate but the fact of the matter is that the telecommunications market in Kenya has been one of rapidly growing infrastructure, user adoption, market penetration, and increased competition ever since Kenya made a commitment to the WTO of becoming a fully competitive sector by 2004. It was then that the Telkom Kenya fixed‐line market, and international bandwidth market, through its subsidiary JamboNet, essentially ended. This event paved

Finpro Digital Africa Growth Program Pre-study: Kenya
15 of 42
the way for the Communications Commission of Kenya, now known as Communications Authority Kenya (CA), to license extensive backbone infrastructure providers, international gateway operators, and application services providers. The liberalization of the communications sector has had a positive effect on the deployment of communications infrastructure and services in the country. Kenya is now a nation of 44.3 million people, with 180,000 fixed lines, a bandwidth capacity of 847,523 Mbps which is the highest in Africa, the largest mobile money market in the world at 25 million users, 27 million internet users, and 34 million mobile users Which translates into 61% internet, and 80.5% mobile market penetration. In fact Kenya’s internet contribution to GDP (iGDP) is at 2.9%, the highest in Africa as well. In recent years much of this success stems from the installation of four fibre‐optic international submarine cables greatly reducing the industries costly dependency on satellite bandwidth. Kenya’s National Optic Fibre Backbone Infrastructure (NOFBI) now has a total length of over 5,000 km. Satellite capacity on the other hand sits at 273.0 Mpbs. Prior to the cables coming in 2009 East Africa was the only densely populated region globally without international fibre access. By and large at the time internet traffic, international calls and even some regional calls were carried via satellite though Europe or North America at staggering costs as the intercontinental fixed line infrastructure was highly fragmented or simply not there. Thus while bandwidth prices have now fallen upwards of 90% as a result, leading to cheaper phone and internet tariffs, many ISPs have grudgingly passed on these savings to end users and the CA has threatened price caps. Many companies that started out as ISPs have transformed themselves into second‐tier telcos by rolling out national and metropolitan fibre backbones and wireless broadband access networks, offering converged voice, data and video/entertainment services. At least six major deployments of WiMAX technology and four Fibre to the Home (FttH) rollouts have or are currently taking place. As a result advanced services such as IPTV/triple‐play, e‐commerce, e‐learning and e‐government are now rapidly evolving. However, the infrastructure investments have been costly and the market has become more competitive, which has led to takeovers in the sector. Several infrastructure sharing agreements have been forged. A large factor in this evolution has been the simplified and converged licensing regime introduced in 2008 now allows operators to offer any kind of service in a technology‐ and service‐neutral regulatory framework. This greatly reduced entry marries to the market and increased competition. Following the enactment of the Kenya Information and Communication Act, 2013 the CCK rebranded to the CA and vastly expanded their original mandate of the regulation and the management of the country’s radiofrequency spectrum. They are now responsible for the development and implementation of policies and strategies with respect to telecommunications services in Kenya. Which include the following: Telecommunications licensing
Preparation of procedures and regulations to license operators, including; Network Facility Operators, Application Service Providers and Content Service Providers. The Authority also enforces all license conditions and regulations.
Effective competition Maintains and promotes effective competition between commercial entities connected with telecommunication services in Kenya. This ensures efficiency and economy in the provision of such services that promote research and development in the sub‐sector. In addition, the Authority reviews the sector on a continuous basis to ensure that competition is fostered and to guard against anti‐competitive behaviour by licensed operators.
Consumer protection Protecting the interests of all users of telecommunications services in Kenya with respect to the prices charged for and the quality and variety of such services.
Promotion of investment and provision of international transit services Encourages private investment in the telecommunications sector and provision of international transit services by persons providing telecommunications services in Kenya.
Universal service obligations Develops mechanisms to ensure the availability of telecommunications services to all citizens throughout

Finpro Digital Africa Growth Program Pre-study: Kenya
16 of 42
the country.
Tariff regulation Develops pricing guidelines for service providers in order to ensure service affordability.
This competition has led to an all‐out price war in Kenya’s mobile communications sector in recent years resulting in the CA placing tariffs, special offers and promotions. The real trouble began with the introduction in 2008 of Kenya’s third and fourth GSM networks. While this hassled to an explosion of subscriber, it also severely hindered the profitability of operators. This has lead them to race towards more streamlined operations and diversify revenue streams. Exacerbating the issue has been slumping levels of Average Revenue per User which according to The Technology, Media and Telecom (TMT) Predictions 2014: Highlights and Context Report predicts ARPU at EUR 5.8 monthly. Third Generation (3G) mobile broadband, mobile payment and banking services are the primary sources of this added revenue but all segments are highly competitive. The Kenyan government has proposed an open access approach for 4G networks with plans to prohibit licensing of individual operators and instead make service providers lease capacity from an independent company. This was naturally met with heavy resistance from MNOs already in the market. 2014 and the beginning of 2015 saw key developments in the mobile market in particular. First with the sale of four MVNO licenses for a license fee of EUR 930 each to the following companies; Tangaza Pesa which is a mobile money transfer service, Zioncell Limited (the company behind is MODE) which is a technology company that offers value‐add services to different MNOs across Africa, and Finserve a Virtual Network Operator (a subsidiary of Equity Bank, one of East Africa’s largest), all of which would utilize the Airtel network. This was a move opposed by the Consumer Federation of Kenya, Safaricom and Telkom Kenya. A fourth license was subsequently acquired by Kenya Airways also using Airtel’s network. The second big event was the market exit by one of the major mobile operators Essar Telecom Kenya Limited (operating under the brand “yuMobile”) whose assets were ultimately acquired through a joint venture between Safaricom (infrastructure) and Airtel (customers). In the end, Essar was bleeding cash, costs far outnumbered revenues even resulting in some suppliers going to court to recover money owed. Having only entered the market in 2007 with a EUR 179.5 million investment and ultimately cutting their losses by selling for EUR 108. This should serve as a sobering indicator of the volatility inherent in this competitive market. A third major story was France Telcom, the 70% majority shareholder in the fixed and mobile line operator Telkom Kenya made it known of their desire to exit in 2014 but have reached an apparent deadlock with the 30% shareholder that is the Kenyan Government. Disagreement between the Kenyan government and France Telecom intensified last year after the minority shareholder refused to give in to demands that would allow France Telcom to sell its 70% stake to Vietnam based Viettel Group. France Telcom even stated it had lost control of the ability to implement any solutions to the challenges facing the business without the latter’s agreement. The possibly the biggest development was Equity Bank’s purchase of an MVNO license and partnering with Airtel. Equitel, launched in September 2014 under Equity Bank’s wholly owned Finserve has already racked up 786,000 active SIM card users. With the ultimate goal of taking down the juggernaut that is Safaricom’s M‐PESA which controls the lion’s share of the mobile money market. In response to this move Safaricom even slashed transaction charges by 65%. The bank says Equitel will aid users transfer money, access credit and make payments by phone. It also offers typical mobile services of calls, text messages and Internet browsing. According to Reuters, Equity leases Airtel’s telecoms infrastructure network, so it keeps all the revenue. They are also introducing dual SIM cards via a 0.1mm thick film (dubbed “Slim SIM”) which can be layered on an active SIM card without affecting customers’ original service providers’ network reception.
2.3 Structure of Kenya’s ICT market: Kenya’s Information and Communication Technology (ICT) market structure, and its players, can be categorized by three general provider segments under the CA Unified Licensing Framework (ULF). Both National and International companies are housed under the same overall structure. It goes as follows: a) Network Facilities Provider (NFP) Licensees under this category own and operate any form of
communications infrastructure (based on satellite, terrestrial, mobile or fixed). They largely provide infrastructure systems for long‐distance transmission and for local access;

Finpro Digital Africa Growth Program Pre-study: Kenya
17 of 42
a. Tier 1 NFP (international) i. International Gateway Systems and Services ii. International Sub‐Marine Cable Operators
b. Tier 1 NFP (National) i. National Fixed Network Operator (i.e. TKL) ii. Cellular Mobile Operators
c. Tier 2 NFP i. Data Carrier Network Operators ii. Public Data Network Operators iii. Regional Telecom Operators
d. Tier 3 NFP i. Local Loop Providers
b) Applications Service Provider (ASP) Licensees under this category provide all forms of services to end
users using network services of a facilities provider. These Include: a. GMPCS Service Providers b. Internet Exchange Point (IXP) c. Internet Service Providers (ISPs) d. Resale Service Providers e. Other Value Added Service Providers (VAS)
c) Content Services Provider (CSP) Licensees under this category provide contents services material,
information services and data processing services. These include: a. Premium Rate Service Providers b. Audio‐text Service Providers c. Credit Car Validation Service Providers d. Other Web‐based Public Commercial Information Service Providers e. Business Processes Outsourcing (BPO)
* NFP = Network Facilities Providers This liberalized regulatory framework embraces technological convergence and encourages innovativeness. It was designed to be the best method to meet end‐user needs, especially in respect to new and emerging markets to stimulate innovation and deployment. Under the framework there is no distinction between say mobile or fixed services, satellite or terrestrial, data or voice services, etc. The infrastructure providers have an infrastructure sharing code of practice with clear guidelines that is agreed upon by the operators. It is the spirit of infrastructure sharing that the operators keep local traffic local via the Kenya Internet Exchange point; a centrally monitor network security via the industry computer security response team and have a central manager for the country code top‐level. This public‐private ownership model of shared infrastructure is regionally and globally recognized as best practices.
2014 Market Composition by number of licensees:
Type of licensed provider No. of licenses (2014)
International Submarine Cable Operators 4
International satellite providers 3
National tier 1 NFPs 3
National Tier 2 NFPs 18
National Tier 3 NFPs 13
BPO operators 39
Telecommunications vendors 219
Content Service Providers 168 (as of 2012)
Public Communications Centre 40 as of
2012)

Finpro Digital Africa Growth Program Pre-study: Kenya
18 of 42
In order to break down the market structure further the 3 biggest market services (mobile money is covered under “Banking and financial services”) will be used:
1. Fixed telephony;
2. Mobile telephony
3. Internet/Data Next a basic market structure type will be attributed to each of the aforementioned market services by assessing their respective interconnected characteristics, including the: Number and relative strength of buyers and sellers Degree of collusion among players Level and forms of competition Extent of product differentiation Ease of entry into and exit from the market
2.3.1 Fixed Telephony ‐ Monopoly
The fixed line telephony market in Africa is essentially a monopoly as they are the sole provider. A monopoly exists when a firm has no competitors in its industry. It reduces output to drive up prices and increases profits. By doing so, it produces less than the socially optimal output level and produces at higher costs than competitive firms. Fixed line networks hardly ever invest in spreading their networks much farther from the urban areas than needed and subsequently, they rarely reach the remote rural areas where a substantial %age of the population lives. The fixed telephone service in Kenya is no exception. Until 2004, Telkom had exclusivity (a monopoly) over the provision of fixed line telecommunications services. Although the exclusivity legally has ended since then, thus far there is very limited competition. The government has issued 19 “local loop provider” licenses, but because their operations are restricted in both scope and geography, investment and interconnection having proven challenging, and so few entities holding such licenses have actually launched services. Efforts to issue a SNO license have also stalled. While the situation is changing, the mobile telephony market is significantly more competitive and dynamic.
2.3.2 Mobile Telephony ‐ Oligopoly
Although the mobile telephony market in Kenya is more open, it does not constitute perfect competition. Rather, it is representative of an oligopoly, an industry with only a few major firms: Safaricom
Bharti Airtel (formerly Zain, Celtel)
Orange Kenya (Telkom Kenya)
Finserve (Equity Bank) – recent entrant via MNVO licence Since there are only a few providers controlling a particular commodity, they can influence prices and affect the competition. They are price‐makers but highly interdependent. Safaricom has enjoyed their lion’s share of the market since its inception and several price wars have been sparked. However this benefits neither company as revenues drop and costs remain. Thus the key to their differentiation is in non‐price competition. Through innovative products, value addition, diversified revenue streams, and marketing. This market has been characterized in the past by a race to release the next big thing in the market. Safaricom had a runaway success with M‐PESA and Airtel just might have the same with its recent UnlimiNET bundles.
2.3.3 Internet/data ‐ Perfect competition
The Internet/data market in Kenya would be most representative of perfect competition. In this structure, numerous firms compete against each other, most small. There are numerous Internet Service Providers (ISPs) in Kenya, as listed in the table below.
Operator Subscribers (thousand) Market share
Safaricom (Mobile) 9,638 73%
Bharti Airtel (mobile) 1,945 15 %
Telkom Orange (mobile) 905 6.9%

Finpro Digital Africa Growth Program Pre-study: Kenya
19 of 42
Essar (yuMobile) (SOLD 2014) 603 4.6%
Wananchi (ZUKU) 44 0.3%
Liquid Telecom 15 0.1%
Access Kenya 11 <0.1%
Telkom (fixed) 11 <0.1%
Safaricom (fixed) 7.0 <0.1%
Jamii Telecom 2.3 <0.1%
iWay Africa 2.1 <0.1%
MTN 1.4 <0.1%
Call Key Networks 0.5 <0.1%
Tangerine 0.3 <0.1%
Others 0.8 <0.1%
Total 13,187 100%
When there are more than a few firms in an industry, providers are less likely to collude and reducing output and driving up profits the way a monopoly does. ISPs in Kenya began to feel some competitive pressure especially in the high‐end segment of the market when Safaricom upgraded to EDGE technology in 2006, which provides broadband‐like data rates of up to 384 Kbps. Pressure increased further when Safaricom introduced 3G services in 2008, offering peak data transfer speeds of 7.2 Mbps. The increased number contributes to an environment where providers attempt to outdo each other, driving the prices down and the output up. As such, firms in a competitive industry produce the socially optimal output level at the minimum possible cost per unit. The disparities regarding infrastructure costs requirements between mobile internet access and broadband or fixed line should be noted as key reason for the market share Safaricom holds. Mobil penetration is far higher than computer and internet access penetration so it only makes sense that mobile data would trump the latter.
2.4 Product and services:
In summary the key products in the industry are:
Mobile telephony (very little growth)
Mobile data (growth market)
Cloud services (yet to really take off, Safaricom is pushing SME products)
Mobile money (growth market)
Internet (growth market)
Fixed line telephony (declining, vanishing market)
Internet‐enabled digital television
There is a significant convergence and disruption in the space between telecommunication, content delivery
and financial solutions. Innovative solutions in this space are of interest to companies in telecommunications.
2.5 Key players, value chain and business models The ICT market is inherently complex with a consolidated power structure of distributors consisting of multinational corporations, government and large enterprises that provide infrastructure and networks to vendors who then distribute to tier 1 Value Added Resellers (VARs) & dealers down to tier 2 VARs, right down to the SME, retail, and consumer markets. As one goes down each level the amount of players in the value chain typically gets bigger. For the sake of this analysis the five main segments of the ICT market will be utilized and then broken down to who the major players are and their market share. The covered segments are international network facility providers, internet/data, mobile telephony, fixed telephony, and mobile transactions.
Finpro Digital Africa Growth Program Pre-study: Kenya
20 of 42
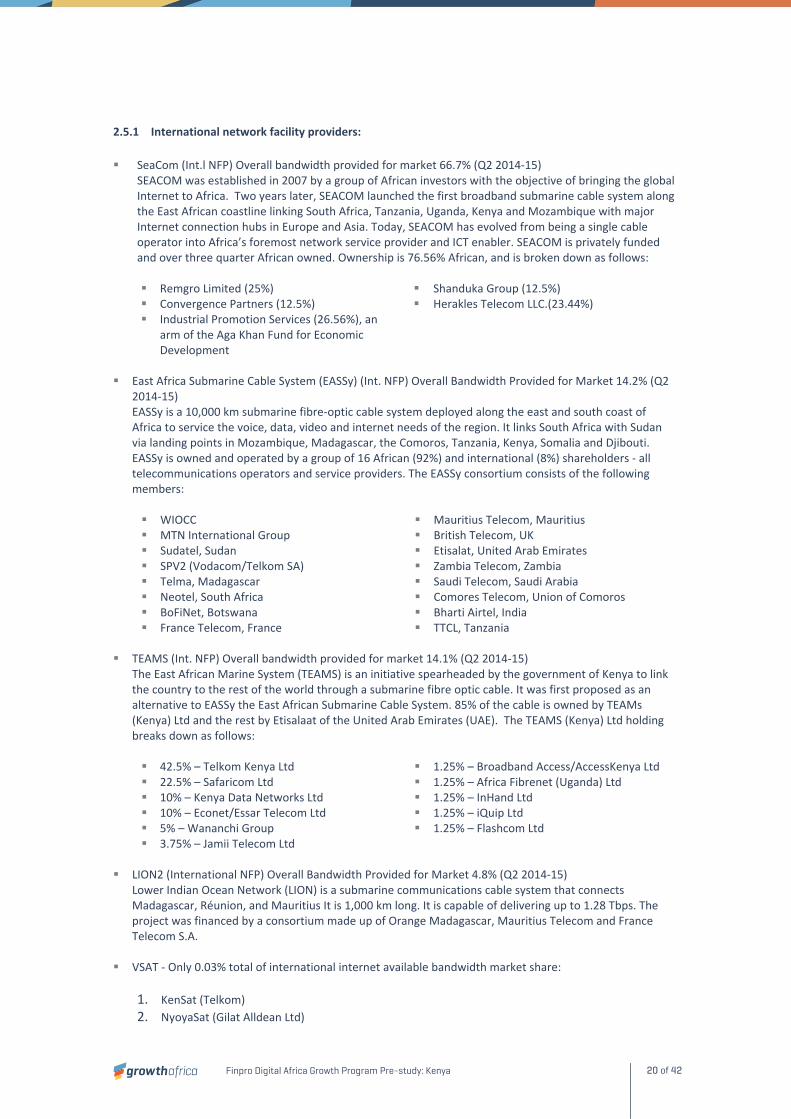
2.5.1 International network facility providers:
SeaCom (Int.l NFP) Overall bandwidth provided for market 66.7% (Q2 2014‐15)
SEACOM was established in 2007 by a group of African investors with the objective of bringing the global Internet to Africa. Two years later, SEACOM launched the first broadband submarine cable system along the East African coastline linking South Africa, Tanzania, Uganda, Kenya and Mozambique with major Internet connection hubs in Europe and Asia. Today, SEACOM has evolved from being a single cable operator into Africa’s foremost network service provider and ICT enabler. SEACOM is privately funded and over three quarter African owned. Ownership is 76.56% African, and is broken down as follows: Remgro Limited (25%) Shanduka Group (12.5%) Convergence Partners (12.5%) Herakles Telecom LLC.(23.44%) Industrial Promotion Services (26.56%), an
arm of the Aga Khan Fund for Economic Development
East Africa Submarine Cable System (EASSy) (Int. NFP) Overall Bandwidth Provided for Market 14.2% (Q2
2014‐15) EASSy is a 10,000 km submarine fibre‐optic cable system deployed along the east and south coast of Africa to service the voice, data, video and internet needs of the region. It links South Africa with Sudan via landing points in Mozambique, Madagascar, the Comoros, Tanzania, Kenya, Somalia and Djibouti. EASSy is owned and operated by a group of 16 African (92%) and international (8%) shareholders ‐ all telecommunications operators and service providers. The EASSy consortium consists of the following members: WIOCC Mauritius Telecom, Mauritius MTN International Group British Telecom, UK Sudatel, Sudan Etisalat, United Arab Emirates SPV2 (Vodacom/Telkom SA) Zambia Telecom, Zambia Telma, Madagascar Saudi Telecom, Saudi Arabia Neotel, South Africa Comores Telecom, Union of Comoros BoFiNet, Botswana Bharti Airtel, India France Telecom, France TTCL, Tanzania
TEAMS (Int. NFP) Overall bandwidth provided for market 14.1% (Q2 2014‐15)
The East African Marine System (TEAMS) is an initiative spearheaded by the government of Kenya to link the country to the rest of the world through a submarine fibre optic cable. It was first proposed as an alternative to EASSy the East African Submarine Cable System. 85% of the cable is owned by TEAMs (Kenya) Ltd and the rest by Etisalaat of the United Arab Emirates (UAE). The TEAMS (Kenya) Ltd holding breaks down as follows: 42.5% – Telkom Kenya Ltd 1.25% – Broadband Access/AccessKenya Ltd 22.5% – Safaricom Ltd 1.25% – Africa Fibrenet (Uganda) Ltd 10% – Kenya Data Networks Ltd 1.25% – InHand Ltd 10% – Econet/Essar Telecom Ltd 1.25% – iQuip Ltd 5% – Wananchi Group 1.25% – Flashcom Ltd 3.75% – Jamii Telecom Ltd
LION2 (International NFP) Overall Bandwidth Provided for Market 4.8% (Q2 2014‐15)
Lower Indian Ocean Network (LION) is a submarine communications cable system that connects Madagascar, Réunion, and Mauritius It is 1,000 km long. It is capable of delivering up to 1.28 Tbps. The project was financed by a consortium made up of Orange Madagascar, Mauritius Telecom and France Telecom S.A.
VSAT ‐ Only 0.03% total of international internet available bandwidth market share:
1. KenSat (Telkom)
2. NyoyaSat (Gilat Alldean Ltd)

Finpro Digital Africa Growth Program Pre-study: Kenya
21 of 42
3. iWay Africa (Gondwana International Networks)
2.5.2 Internet/Data Market:
Wananchi Telecom Limited (retail brand “ZUKU”) (PDCC)/ Internet and data market share 48.8% Liquid Telecom Limited / Internet and data market share 15.7% Telkom Kenya / Internet and data market share 10.5% Safaricom Limited / Internet and data market share 7.2% Jamii Telecommunication Limited (“JTL”) / Internet and data market share 2.2% iWay Africa / Internet and data market share below 1.5% TESPOK (Telecommunication Service Providers Association of Kenya) plays a vital role in the market with
its operation of the KIXP (Kenya Internet Exchange Point):
2.5.3 Mobile telephony market:
Safaricom (MNO) mobile market share 67.4% (Q2 2014‐15) Bharti Airtel (MNO) mobile market share 22.6% (Q2 2014‐15) Telkom Kenya (Orange) (MNO) mobile market share 10% (Q2 2014‐15) Finserve (Equity Bank) (MVNO) mobile market share 1.5% (Q2 2014‐15)
2.5.4 Fixed telephony market:
Telkom Kenya (MNO) / Fixed telephony market share 100% (Q2 2014‐15)
2.5.5 Mobile money transfer service:
Safaricom (M‐PESA) market Share of mobile money services 77.4% (Q2 2014‐15) Airtel (Airtel M Commerce Services Ltd) market share of mobile money services 12.4% (Q2 2014‐15) Mobikash (MobiKash Afrika) market share of mobile money services 5.9% (Q2 2014‐15) Tangaza (Mobile Pay Limited) Market Share of Mobile Money Services 1.9% (Q2 2014‐15) Finserve (Equity Bank) Market Share of Mobile Money Services 1.5% (Q2 2014‐15) Orange Money (Telkom) Market Share of Mobile Money Services 0.7% (Q2 2014‐15)
2.6 Value chain & business models In 2013, the ICT market in Kenya reached a value of EUR 4.6 billion, of which telecommunication services accounted for 71.9%. However with voice services nearing saturation, coupled with lower tariffs, telcos have been compelled to re‐think their strategies away from both voice services and the mass market towards data services and enterprise solutions (cloud computing, hosted infrastructure, managed services etc.). Companies are now engaged in forms of non‐price competition. Rather than simply undercut their prices they’re now trying to foster long‐term relationships with customers, invest in a highly skilled and differentiated workforce, and implement more efficient operational routines. Some key areas in their value chain that Kenyan ICT companies have identified and are implementing are brand name recognition, strategic partnerships and resource developments through trainings. This means working to build strong brands through marketing and offering quality services, excellent customer service and fair pricing. Developing strategic alliances with suppliers that result in preferential terms of price, and support for products and services. These benefits, when extended to customers, result in improved customer satisfaction and that indirectly contributes to increased profitability of the firms. Training of staff results in developing skilled work force and enhances their ability to execute different tasks more efficiently thereby improving lead times for service or product deliveries. Differentiation strategy is the most prominent value chain management approach adopted by most firms to survive in this highly competitive industry. Excellent customer service, delivery of quality products & services, flexible product offering and leading both in innovation and technology emerged as the key drivers for this strategy. For those organizations that adopt cost leadership strategy, deployment of advanced technology, effective cost control mechanisms, lean operation and efficiencies in operation were evident as the key drivers. Some key factors preventing the adoption of effective value chain models were poaching of experienced employees by competitors, failure to internally train staff but instead preferring to hire experienced staff, tough rules on investing in new technologies, high customer mobility, imitation of

Finpro Digital Africa Growth Program Pre-study: Kenya
22 of 42
product/service offering, failure by the businesses to penetrate all possible channels and unpredictable government policies or decisions. The unified licensing regime that simplifies market structure has allowed operators more latitude in terms of service offerings. This has fostered better stratification of the market along the lines of services, infrastructure, content and applications. Many mobile operators acquired ISP licenses to add to their existing mobile and international gateway licenses, dramatically increasing mobile internet connections. The CA regulation setting maximum mobile voice tariffs has directly resulted in increased subscription and consumption of services. As a result dramatically increased connectivity with higher speeds and reduced costs have driven consumer uptake in data and devices. And in the business sector those factors have allowed for initiatives to deploy cheaper Wide Area Networking (WAN) technologies like Virtual Private Networks (VPN). In fact telecommunications businesses (Orange Telkom, Safaricom, Airtel and Finserve, as well as large data infrastructure operators, including Jamii Telecom, Liquid Telcom, Access Kenya Group, Wananchi Group, Kenya Education Network (KENET), MTN, Internet Solutions, are all developing infrastructure. The infrastructure providers have an infrastructure sharing code of practice with clear guidelines that is agreed upon by the operators. It is the spirit of infrastructure sharing that the operators keep local traffic local via the Kenya Internet Exchange point; centrally monitor network security via the industry computer security response team and have a central manager for the country code top‐level domain name .ke. The above shared infrastructure is regionally and globally recognized as best practices. The financial sector In Kenya is among the top consumers of IT, in addition to peripheral tech development like mobile banking and mobile payments, the rigid adherence to hardware refreshment cycles and software cycles makes them a key driver of ICT spending. The near monopoly Safaricom has had on the mobile money market is being effectively tested now as other companies come in with added value and increased services. Currently, all the four mobile operators and two licensed content service providers (Mobikash Africa and Mobile Pay) are offering mobile money transfer services. Furthermore, with mobile phones collaborating with the banking sector, new mobile banking products have emerged. In addition, most bills from public and private institutions ranging from electricity, water, insurance, travel and NHIF and NSSF contributions among others can now be paid via mobile phone platforms While the Government and the private sector have been investing heavily in the ICT infrastructure as outlined above, there has comparatively been little investment in the human resources required to design, develop and operate this infrastructure and the associated e‐applications. However innovation hubs and cluster have proved extremely valuable for Kenya’s ICT sector. Places like iLab, iHub, Nailab, University of Nairobi’s C4DLab and infoDev’s mlabs in Kenya has set the stage for innovation of applications and information services such as Drumnet, mFarm, Ushahidi, etc. Over the years, Kenya has been home to multiple African Regional hubs including, IBM’s first African Research lab, Nokia’s Africa Headquarters and Google’s first Sub‐Saharan Africa office (outside of South Africa). All of this helps spur innovation, create talent, attract investment, and potentially create the next big thing. Which is something that every player in the ICT market is currently dying for. Another by‐product of market liberalization is the creation of Internet exchange points (IXPs). IXPs are physical infrastructures for the exchange of traffic between Internet service providers (ISPs) and other content providers. As countries develop their digital infrastructure, IXPs are used to route domestic traffic exclusively within the country without needing to exchange data through international carriers. This significantly improves the network performance in terms of latency and stability, and it also decreases costs for domestic ISPs. IXPs can be established with the direct support of the government (as in Nigeria) or by a group of private ISPs (as in Kenya). In both cases, governments provide an essential element, either by playing an active, leadership role in spurring the adoption of this type of technology, or by creating an enabling, competitive environment and properly regulating the existence and provision of this type of services. Governments also play a strategic role in developing IXPs through the construction of Internet backbone networks to connect IXPs to potential users both domestically and abroad.
2.7 Estimated market size and value ICT has assumed a highly strategic role in the development of the Kenyan economy. ICT spending in Kenya, covering the domains of hardware, packaged software, and IT and telecommunication services, has surged considerably over the past five years, growing from 8.9% of GDP in 2006 to an estimated 12.1% of GDP in 2013. 2014 saw IT in Kenya have a 9.5% compound annual growth rate (CAGR).

Finpro Digital Africa Growth Program Pre-study: Kenya
23 of 42
In 2013, the ICT market in Kenya reached a value of EUR 4.6 billion, of which telecommunication services accounted for 71.9%, hardware made up 22.3%, and IT services and software represented 3.0% and 2.8%, respectively. Spending is expected to continue growing over the forecast period to reach a value of EUR 5.3 billion in 2017. Albeit coming from relatively small bases, growth will be boosted by strong IT services (17.2% CAGR) and software (16.1% CAGR) spending, while also seeing positive momentum from the much larger markets of hardware (3.7% CAGR) and telecommunication services (1.7% CAGR). The dramatic increase in mobile and internet adoption while simultaneously reduced costs has led to dramatically increased ICT market size and potential. Safaricom has retained its lion share of the market throughout with a EUR 57.8 million market value.
Factors contributing to the ICT market's growth include the anticipated spending on technologies arising out of various infrastructure projects such as the Konza Techno City, increased business automation process in both government and the private sector, the digitization of both the health and education sector, and a market push to harden IT systems with enhance cyber security. The construction of a fifth undersea cable that would double the amount of current bandwidth in the country is also currently in progress. The country is also currently extending and enhancing the redundancy of its National Optic Fibre Backbone Infrastructure (NOFBI) network in order to expand fibre capacity to all parts of the country. Initiatives such as the Central Bank's mandate for banks to set up disaster recovery sites as a measure to improve security, will also contribute positively – as will projects receiving support from international agencies, such as the World Bank‐funded Integrated Financial Management Information System (IFMIS) or the USAID‐sponsored enhancements in health systems. The projected growth of the market depends on several key factors. Broadband penetration in Kenya, Nigeria, and South Africa remains low. According to the IDC Telecom Services Database, the penetration in these countries in 2013 was as low as 0.2%, 0.2%, and 2.2%, respectively. This includes DSL connections, cable, FTTx, and fixed wireless access. After the introduction of submarine fibre cables, all three countries now have sufficient international bandwidth. Nevertheless, national and local broadband infrastructure is insufficient, and wireless broadband solutions are the primary form of broadband access in studied markets. It is expected that the number of broadband connections to increase over the forecast period; however, the penetration is expected to remain in low, single‐digit numbers. Recognizing that broadband is a strategic area for socioeconomic growth, Kenya, Nigeria, and South Africa have each developed national broadband strategies. To make broadband available and affordable to citizens, key areas have been identified and defined goals have been outlined as part of these plans.

Finpro Digital Africa Growth Program Pre-study: Kenya
24 of 42
In regards to internet users, since there is a much higher mobile phone penetration rate compared to PC, the introduction of mobile data and 3G broadband services has brought the internet within reach of a much greater percentage of the population. With mobile penetration forecast to reach between 83% and 93% by 2018, the stellar rise in internet usage is expected to continue. The only part of the population not fully participating in this development will be the illiterate, currently around 15% of the population, and the extremely poor. Depending on improvements in these areas, an internet user penetration rate of between 70% and 84% is expected for 2018. Table: Forecasted internet usage – 2015‐2018
Year Internet users (million)
Lower growth Higher growth
2015 30 33
2018 35 42
In regard to mobile subscribers, depending on the final outcome of this market consolidation, a reduced level of competition may send the market on a lower growth trajectory going forward, which would not see it move significantly above the 80% penetration mark by 2018, with operators returning to a strategy of achieving more sustainable ARPU. A higher growth scenario may result from a successful market entry of the three MVNOs licensed in April 2014, with penetration reaching more than 90% by 2018. However, MVNOs in Africa have so far mostly failed to have a major impact on the market. On the other hand, dedicated mobile data subscriptions are expected to lead to also contribute to an increasing SIM card penetration rate. Moreover, the success and the wide adoption of mobile banking in sub‐Saharan Africa demonstrates that innovation can indeed germinate in, and diffuse from, developing world locations. M‐PESA, now moves the equivalent of 43% of GDP annually. Table: Forecasted mobile subscribers – 2015‐2018
Year Internet users (million)
Lower growth Higher growth
2015 35.0 39.0
2018 41.5 46.5
Overall the 2015 Global Information Technology Report 2015 indicates Kenya, while it faces it’s challenged, is a market of rapid growth and high potential for dramatically increasing its ICT potential in the future.
Global Information Technology Report 2015 rankings
Kenya (Out of 143)
Nigeria (Out of 143)
South Africa (Out of 143)
Network Readiness Index 2015 86 119 75
A: Environment sub index: ‐ Political and regulatory framework ‐ Business an innovation environment
72 66 89
120 116 111
31 24 55
B: Readiness sub index ‐ Infrastructure ‐ Affordability ‐ Skills
108 94 106 100
123 121 104 135
102 85 107 95
C: Usage sub index ‐ Individual usage ‐ Business usage ‐ Government usage
83 110 43 49
104 114 79 95
67 68 34 105
D: Impact sub index ‐ Economic impacts ‐ Social impacts
51 59 52
104 81 116
92 58 110

Finpro Digital Africa Growth Program Pre-study: Kenya
25 of 42
2.8 Competition The very high level vendors, for example submarine fibre optic cable consortiums and other international gateway licensees are fairly content with the business environment. High level Network Facility Providers and their infrastructure poses extreme barrier to entry due to regulation and primarily cost. Thus their oligopoly on the internet/broadband supply is secure for now. They are also setting their sights on infrastructure projects that will see them able to extend further into East Africa through the internet exchange hubs and terrestrial fibre optic lines being planned. Kenya’s thee MNOs however have for the most part been locked in a mobile price war since 2011. As a result this has forced MNOs to diversify their revenue streams and become more non‐price competitive. Resulting in more choice, higher quality services, and more innovative products for the consumer. Nonetheless Kenya’s mobile market has continued to show strong growth in the number of mobile subscribers. This has translated into sustained revenue growth for operators as they develop mobile data services on the back of heavy investments in technologies and infrastructure upgrades. France Telcom on the other hand has made it well know of their desire to sell their stake in Orange and leave the cut throat market. Some market consolidation has occurred following the acquisition by Airtel and Safaricom of Essar Telecom’s yuMobile business. Competition has nevertheless presented challenges to the profitability of network operators, encouraging them to streamline operations and develop revenue streams from services such as mobile data, m‐commerce and m‐banking. In mid‐2014 the regulator compelled Safaricom to open up its popular M‐PESA platform to rival networks. To develop fourth generation (LTE) technology, the government has pursued an open‐access approach, though Safaricom pulled out of the proposed consortium which would operate the network. A potentially huge mix to future competition is the 3 MVNO licences awarded since 2014. One of which, Finserve, a subsidiary of Equity Bank, has already surpassed 600,000 subscriptions in its first 6 months and obtained a higher market share than Tangaza in the mobile money market. Adding to the competitive mix is the fact that all 3 MVNO licenses will use Airtel’s network. The launch of Equitel (Finserve) has created a serious value proposition for the consumer as Equity Bank has increased financial inclusion by presenting their financial services offering on to a single platform which will make banking services more accessible, flexible convenient and more affordable. This is also thanks do to their potentially game changing introduction of the ultra slim dual‐SIM card technology via small magnetic strip able to allow access to the service without the requirement of a separate phone or dual‐SIM phone. The evolution of advanced services such as e‐government, e‐commerce, e‐learning and IPTV/Triple Play has resulted to increased demand for data/internet services. As a result, data/internet service providers have deployed WiMax technology, rolled out fibre to the homes and offices, and invested in 3G mobile services to meet the increasing market demand. This has resulted into increased data/internet and broadband subscriptions. The Kenyan ISP sector is consolidating, with many companies buying up their competitors and new foreign owners entering the market. Pressure on margins from the switch to DSL broadband has been one of the key drivers of consolidation. Wananchi Telecom Limited alone has 50% of the market share and with the continually falling ARPU, the market for internet that is not derived via cheaper more accessible mobile data is relatively stagnant. The 2014 International Data Corporation Report believes digital engagement that encompasses integration of mobility benefits with those offered by cloud, big data and social networking will be the key to capturing market share in Africa. Digital engagement will combine social, mobility, and big data initiatives, enabled by a cloud‐based approach, and move Africa’s mobility momentum into the value‐add space, a trend already being seen heavily in Kenya. Ultimately the coming years will be a large battle for the SME market as they rapidly automate their business processes and operations. In addition with this new modernization comes new IT procurement – new clients, new products, and new markets. The African market is characterized by new markets, products, and clients, sought after by MNCs and African organisations alike driving innovation and entrepreneurship through cloud, the social enterprise, enterprise mobility, and big data as new product sets.

Finpro Digital Africa Growth Program Pre-study: Kenya
26 of 42
2.9 SWOT analysis
Strengths Weaknesses
ICT hub and gateway into East and Central Africa New and fast broadband & telecommunication
infrastructure Access to untapped Fibre optic cable capacity &
plans to expand NOFBI World’s largest mobile money transaction market 27 million internet users, 61% market penetration 34 million mobile users , 80.5% market penetration Liberal regulatory market promoting competition
and innovation Strong political commitment to investment and
growth of ICT market (ICT Master Plan) Stratification amongst ICT companies has fostered
competition and product diversification Kenya has invested heavily in innovation hubs like
iLab, iHub, Nailab, University of Nairobi’s C4DLab and infoDev’s mLabs
Major infrastructure projects are under way, ie, roads, electricity, and communications resulting in more attracted investment is hub for innovation
Generally unsophisticated hardware in ICT market Lack of highly skilled ICT professionals Lack of trainings programs to create high end ICT
pros Often difficult procurement cycles Low automation levels of business processes Lack of data analytics Infrastructure gaps mainly in rural areas Price wars causing unsustainably low prices Fragmented ICT government services Culture of dominant companies cornering public
and private sector business Slow up take of mobile money platforms from
medium to large business Security risk with mobile money Risk of fraud and piracy Mobile and SMS market saturation Uncertainty of the open access approach to 4G
Opportunities Threats
Automation of business operations in business sector, education, and health. All huge undertakings that require help
Government is not technology specific in who they choose to work with, leaving the door open
Government incentives for companies to enter market
Cyber security becoming large priority Customer service platform required across all
sectors, and especially for SMEs 47 County government set to incorporate new
fibre networks and connect to the national government. Also require all new software for operations purposes.
Cloud is increasingly becoming a topic of interest for stakeholders
Public and private data hub projects underway and more proposed
5th submarine fibre optic cable in works that will double bandwidth
Huge requirement for skilled ICT professionals and many will come from outside Kenya
Huge need for consultants and professionals to create knowledge transfer programs
Inadequate and unstable electrical grid Political corruption and turnover Falling ARPU Terrorism Vandalism of infrastructure Fluctuating/weak currency Marine fibre optic cable damage (dredger has
done so in the past) Global economic crash Only 85% literacy means 15% of market may be
excluded for many product offerings
2.10 Challenges and needs, and the resulting opportunities In order for ICT to continue growing as an industry in Kenya there are several challenges that must be overcome. Some are far easier to do, but within each challenge lies the potential not only for domestic players but foreign firms as well. First the challenges as they are will be examined and then discuss wherein the opportunity lies for Finnish companies to provide their products and services in this rapidly expanding market. One of the challenges to contend with is the ongoing shift to more autonomous county governments as laid out in 2013 as a decentralization of government from the national level. Many counties, particularly the rural ones, may lack the capacity and skills to effectively manage the growth and investment of their ICT needs. A

Finpro Digital Africa Growth Program Pre-study: Kenya
27 of 42
problem many companies have cited in regards to doing business with government at all levels is the long sales cycles from prolonged procurement as well as cyclic spending. In the past as well there has been reports of inconsistent importation regulations and tariffs. Import duties and other levies are frequently cited as irregular and mostly stemming from either a poor understanding of different ICT goods or poor definitions of the different classes of ICT products. Among the chief challenges experienced by vendors include changes of leadership with government organizations with whom vendors would like to enter into private public partnership (PPPs) with in order to grow skills and nurture usage, help ensure the enforcement of intellectual property and copyright laws (piracy, counterfeit goods, IP theft, etc.), and help with the creation of industry standards and overall harmonized policies to govern growth in the sector. Another interesting challenge currently facing the government, which will be elaborated on later in the opportunities portion, are the hurdles involved in its quest to provide e‐Government services. These include:
Low automation levels of business processes, thus threatening effective service delivery against the backdrop of increasingly high demands for efficiency in government
Public data and information that is stored in silos and in disparate non‐standard formats that are difficult to access
Silo provision of government services by government agencies that are not citizen centric, and don’t directly promote inclusion and an indiscriminate right of access to Government services
The need to consolidate government wide IT programs based on a unique identification number for each citizen and establishment, and to align these programs to the emerging data and information trends of public data hubs, data warehousing, data marts and open data.
An absolutely imperative need in the ICT sector is the lack of highly skilled professionals. Interestingly enough the growth of ICT professionals and their skill level hinges heavily on, the size of and number of both large scale local and international organizations, the level of maturity and sophistication of their ICT setups, their ability to improve in these environments, and the growth of the SME segment as a key consumer. In addition, there are very few industry firms that provide structured on‐the job training for new ICT graduates. Most graduates are left to develop themselves, or attempt the various industry certification programs. In addition the public often lacks the basic ICT literacy skills to use and exploit ICT resources. Kenya has many factors driving their need for high‐end ICT professionals. There is a large demand from national and county governments that are trying to provide e‐government services and automate internal processes. Public institutions like Hospitals and Universities are also in the process of automating business processes and seeking to improve service delivery while increasing efficiency. There is also a push to create new ICT sector employment opportunities through business process outsourcing and IT enabled services to local and international organizations. There is also a large demand from large local firms and SMEs doing the same. In many instances the prohibitive labour costs of highly skilled ICT professionals is often an issue as well. Due to instances of theft and piracy there is sometimes a culture of being weary towards local developers and thus diminishes their value. In the realm of cyber security there is an urgent need to develop, implement and institutionalize a cyber security management framework. The ICT Authority is tasked with this and has developed but not yet implemented both a cybersecurity strategy and master plan. These are of course critical to securing the online environment for citizens, industry, and foreign partners; increasing the Kenyan people’s confidence in online transactions, data security, fraud protection and privacy; as well as encouraging greater foreign investment and enhancing trade opportunities. One of the biggest and most costly challenges lies in infrastructure. A key challenge is the limited coverage of national fibre infrastructure and limited internet penetration, especially in the rural areas. A second challenge is the provision of last mile infrastructure connectivity, which if appropriately addressed can leap frog the country into a knowledge economy. Internet access in homes, schools, social centres and villages should be key drivers to ensuring this goal. The high cost of ICT (infrastructure, applications, end‐user equipment, recurrent cost of internet, etc.) for businesses, households and individuals is also a challenge with falling ARPU. Other challenges include limited sharing of communication infrastructure by infrastructure operators, the inadequate and high cost of power infrastructure and limited uptake of ICT in SMEs. There’s also points of

Finpro Digital Africa Growth Program Pre-study: Kenya
28 of 42
contention in the market with the proposed open access approach with the 4G shared network infrastructure. The current challenges in using ICT to achieve significant impact on the productivity across all industries is varied. First there is a small number of favoured local and foreign companies offering ICT solutions that dominate the market with Government and business. In addition, organizations in multiple economic sectors find it difficult to appropriately use ICT in their business value chain due to inadequate capacity to perform or scale up ICT operations. This is due in part to the fact that there is inadequate process maturity across the various economic sectors where there is lack of best practice standards and discipline in use of ICT in the value chain. ICT illiteracy has also lead to an often limited understanding of the implications of Service Level Agreements (SLAs) in the activities of various economic sectors. There is a need to automate business processes as a majority of institutions have not done so and this creates inefficiencies that can be avoided. The need for data and information for policy and decision making on various sectors is imperative and affordable business analytics are often hard to come by. This applies also to informal businesses and the need to formalize the operations of those sectors through ICT solutions. However the cost of devices and internet services still remains a constraint that keeps more users, many in the informal sector, from adopting ICT and current users from increasing their usage. This data is also crucial in helping MNOs diversify their revenue streams as the saturated voice and SMS market currently has the cheapest rates in the world according to the Global Information Technology Report.
2.10.1 Potential opportunities stemming from these needs
Now within all these challenges comes the fun part. The ability to innovate and identify areas that both local companies and foreign entities can satisfy market needs while turning a profit. Kenya is poised to become the financial hub of Eastern Africa. Thus in order to enhance this notion and increase the contribution of the financial services sector to GDP, a national payment gateway project is being implemented to facilitate secure online payments by supporting multiple financial institutions to carry out electronic transactions and simplify the processing of payments. This will increase the adoption of electronic services especially the internet enabled payments. This means software firms specializing in financial services software and security have the opportunity to influence and contribute to the largest mobile transaction market in the world. The trend in data and information markets is moving towards business intelligence and data mining of large data sets, based on a unique identifier concept, for policy, decision making, and wealth creation. This has been facilitated by the institutionalization and implementation of public data hubs that are tasked with the creation, continuous update, and archiving of public information (i.e. from ministries, private business, banks, schools, hospitals etc.) In a manner that eases accessibility, communication, dissemination and processing to promote public service delivery, transparency, and accountability for various stakeholders. However the Government has not yet adopted a unique identifier. Thus they are seeking to develop and institutionalize an integrated public data and information sharing infrastructure. The government will focus on continuous improvement and enhancements towards efficient and effective sharing of public data via several means. This includes implementing priority national public data hubs based on the unique identifier concept, and develop middleware API’s to enable information sharing across Ministries, Counties, Departments and Agencies (MCDAs). Next they will develop sustainable automation, digitization and document management programmes for at least 5 priority MCDAs (i.e. Planning & Devolution, Interior & Security, Health, KRA, Education, KIPPRA). This is a massive undertaking, one requiring an army of developers and differing technical backgrounds. Finnish firms may find their software development services and expertise in big data and analytics, cyber security, digital services platforms, and data centres in high demand. On top of this initiative the Kenyan government is seeking to cut procurement costs, and enhance transparency and improve governance through various ICT systems. It wants to consolidate its systems and break away from having discrete systems and multiple operating environments. This will lead to enhanced partnership opportunities, faster access to market opportunities, and reduce initial costs for foreign companies looking to expand in the region. They are doing this by means of a Government Common Core Network (GCCN). This is meant to serve as a shared and secure interoperable Government‐wide ICT architecture. In addition, the Government developed the tier‐2 Government Data Center (GDC) infrastructure to ensure security of Government data and applications. Bandwidth support to Government offices has been

Finpro Digital Africa Growth Program Pre-study: Kenya
29 of 42
steadily growing again opening up a massive expansion of needed ICT solutions and training or consultancy, potentially from Finnish firms. The biggest opportunity potentially comes from the fact that most of the 47 county governments have not yet started developing their ICT infrastructure, but the expanding NOFBI can be used to connect the national government to the county governments. They are establishing ICT as an important tool for delivering services to citizens and businesses. However there are few electronic governance systems, most focusing on revenue collection based on Local Authorities Integrated Financial and Operations Management System (LAIFOMS), the system used by the local authorities that preceded the creation of county governments. The good news is that they are technology neutral, only encouraging the use of common, interoperable standards and protocols. In addition they are encouraging local firms to outsource IT business processes and development. While also actively seeking partnerships with deliberate efforts to engage and collaborate with private sector, academic institutions, County Governments and local and international partners in implementing these projects and to foster ICT sector growth as a whole. Development of special purpose vehicles/ private sector consortiums and waivers on certain levies, licensing fees, tax incentives and tax breaks may be a part of this effort. A massive project underway that stems from the Kenyan Vision 2030 initiative which is a national long‐term development blueprint that aims to transform the country into a modern, globally competitive, middle income country offering a high quality of life, is their Information and Communication Technology Master Plan. This ICT Master Plan is based on three foundations and three pillars. The foundations are: To develop quality ICT human capital and a strong ICT workforce through by ensuring that ICT
development, implementation, and exploitation are engrained as an integral and sustainable component of the countries development
An integrated ICT infrastructure which seeks to provide the backbone required to enable cost effective delivery of ICT products and services to Kenyans
An integrated information infrastructure which aims at improving the quality of e‐Government services
and enable the country to transition to a knowledge based economy by ensuring maximum access to information held by public authorities in an affordable and secure way
The three pillars are: E‐Government services, which aims at ensuring provision of e‐Government information and services as
key to improving productivity, efficiency, effectiveness and governance in all key sectors
ICT as a Driver of Industry, which aims at transforming key Vision 2030 2nd Medium Term Plans (MTP) economic sectors to significantly enhance productivity, global competitiveness and growth
Developing ICT Businesses that can produce and or provide exportable quality products and services that
are comparable to the best in the world. The intended outcomes expected by 2017 are: 8% ICT contribution to GDP Creation of 180,000 direct jobs 37 successfully commercialized ICT applications with at least two transformative 55 ICT companies established two of which will have a customer base of over 5 million Improved global competitiveness by moving up 15 points on GII, eGovernment and NRI ranking Recognition of Kenya as a regional ICT hub Increased public value of e‐Government services with 50% of adults accessing at least one e‐Government
service ICT is classified as a standalone economic sector by 2016 The vital importance of this in recognizing opportunity is clear. This is a multi‐sector, heavily funded strategic plan with hundreds of stakeholders in the public and private sector with much still left to be implemented and surely much that will go wrong. The liberalized regulatory market and lack of choice for locally sourced solutions means foreign firms are poised to play a big role in a variety of aspects.
Finpro Digital Africa Growth Program Pre-study: Kenya
30 of 42
As the economy grows so too do the number of large enterprise users of IT as there are as of now not many. Currently this largely unsophisticated market has left the size of IT projects smaller and limited the number of professionals in the industry. This presents an opportunity for Finnish firms to do larger projects and foster knowledge transfer programs. With such a heavy focus on knowledge transfer it could be a key business strategy to win business by ensuring that is part of any contracts. Furthermore, as additional infrastructure is put in place the ICT expenditure focus will shift to services (maintenance, support, implementation, customization etc.) and software (custom software development, mobility, business analytics, etc.). Many major undertakings of this nature in Kenya require them to temporarily import skills to implement and manage large projects. But it is typically done so outside of any framework where those skills are transferred to local professionals. This could again be a key selling point in negotiations. Some key projects stemming from the ICT Master Plan that pose huge logistical issues and thus opportunity, are in the field of big data and analytics, the creation of an agricultural commodity exchange with heavy emphasis on mobile banking, and integrated IT operating system for the health and education sector that digitize their business administration processes and focus on consumer delivery platforms. They are as follows: In order to improve security an integrated security, intelligence and surveillance system project will be
implemented. Built on the persons’ data hub, this project will enable the creation of multiple agency database and master data platform, data warehouse, crime analytics and profiling. The system will provide the police with real time data on incidences and crime suspects providing them with the efficiency required to better manage crime. This project will include the necessary ICT infrastructure to have broadband connectivity in police stations
A national agriculture commodity exchange will be implemented as a flagship project to facilitate competitive and efficient trade in commodities by providing reliable, timely and accurate marketing information and intelligence to farmers and other stakeholders via mobile phones and other end‐user devices and to enable farmers sell their produce through the electronic platform. This platform would enable farmers and producers of primary commodities to access timely and accurate marketing and price information and sell their produce through it.
The flagship project to be implemented is an integrated national health system. This system will integrate the various systems that are developed and implemented in the health sector, including doctors’ management system, drug supply chain system, and hospital management system for all hospitals.
Automation of academic and administrative processes at all levels of education in order to have all education information online. This will include an education e‐portal that provides services and summary statistics to the public.
In summary the Kenyan ICT market is one that has the political will, established infrastructure, and plan in place to grow at an exponential rate. There are numerous opportunities for Finnish firms to actively foster relationships and showcase their products and services so that they play an integral role in ensuring that exponential growth takes place in an effective and secure way. From the 12 industry interviews the following areas were highlighted: Cloud based solutions (though are the split opinions on whether the market is ready) Data analytics solutions and capacity development
(solutions are to some degree there but capacity to translate the data into business is lacking) Encrypted currencies Internet and mobile banking solutions and applications Video content solutions and management systems Video recognition software Financial technologies (fintech) on a broad scale Digitalisation solutions for SMEs E‐learning (incl. localized content development) for training of employees in growing branch network Digital customer service platforms Smartphone apps development and training solutions for Kenyan developers on same (as much of
current solutions are USSD based) Content and solutions which can drive data and use of mobile money

Finpro Digital Africa Growth Program Pre-study: Kenya
31 of 42
There is broadly a very open mind towards innovative solutions hence the opportunities are split in pre‐defined solutions and innovations which will be considered on a case‐by‐case.
2.11 Buying process and decision making When it comes to an industry as complex in its stakeholders, regulatory framework, differentiation of product and potential for innovation as the ICT sector is, it’s difficult to make any sweeping generalizations about the buying and decision making processes. However according to the 2015 Global Information Technology Report Kenya ranks 22nd in the world when it comes to the importance of ICTs to the governments vision and 21st in government promotion of ICTs. This is no surprise when one sees the extremely liberalized regulatory market that is allowing for firms both domestically and foreign to pursue business partnerships and expand into the East African market. Thus before a company seeks to introduce a product into the market or form partnerships it is wise to consult the licensing structure laid out by the Communication Authority of Kenya. The CA, The Ministry of Information Communication and Technology, as well The Information and Communication Technology Authority are the three government bodies that can heavily dictate the viability or promotion of foreign IT products or services. As such they can affect the buying process so it is again wise to ensure you are leveraging them to the best of your ability. Most importantly to note is that the ICT provides and facilitates the tendering process for government ICT projects and posts them currently on their website. For many SME’s the buying process is not as formalized or rigid as the multinationals or large enterprise level businesses. Many deals have been known to happen at one of the many conferences and tradeshows that take place here in Nairobi and that is true for larger companies as well. These shows are tremendous opportunities to get all of the market players in one room and showcase your company or technology. Many of the larger companies stipulate that new technology is often brought in through the tendering process on a needs basis. However in the last 10 years infrastructure and hardware has dominated the landscape of ICT spending. Thus now that the infrastructure has largely been established, there is now a growing need for more complex IT systems from both the business and end‐user spectrum. As a result, the limited local solutions and lack of ICT workforce skills, have caused a loosening of the sometimes rigid business processes and Kenya based firms becoming more open to foreign companies pitching their ideas. In addition many of the decision making bodies in these organization aren’t fully aware of the solutions or alternatives in the market and as a result the onus can sometimes be on foreign companies to reach out and make themselves known. A strong web presence was a key factor in this. These larger businesses prefer to deal with companies that have a presence on the ground as well and understand the local context. In addition there are cases where ‘middle men’ of sorts can be cumbersome to deal with and are often counterproductive when a new company is trying to make the sale. This is also due to the fact that most big decisions regarding the adoption of new technology or partnerships is made often by a committee or board members. Another point of interest was the absolute need to be price competitive. If not the negotiations won’t make it past the boardroom door. That being said there was a general consensus that if the product or service is of such high quality, or revolutionary in Nature, that they would absolutely be willing to pay a premium price. Seeing as how much of the market is controlled by large firms like Safaricom. Sending delegations to meet with their key decision makers is crucial to getting a foot in the door. From the interviews conducted only a small few were not open to foreign delegations as they had little success in the past. The others however were more than welcome to the idea of partnerships, or purchasing products or services, should of course the value proposition be worth it. In addition there is a strong need for buyers to demonstrate their technology. Whether that be through prototyping or proven data and case studies to support its worth, buyers of ICT solutions are often weary of spending before a proof of concept is proven.
2.12 Entry strategy and partners International new entrants would largely be advised to either invest in an own local setup with a minimal sales force supported from headquarters. Finding the right resource and awaiting the first sale is a

Finpro Digital Africa Growth Program Pre-study: Kenya
32 of 42
comparatively expensive solution without the guaranteed controls that normally would come with own staff. Expected lead time from customer contact to first order is 6‐12 months. Deploying own expat staff may be an alternative but takes time due to work and stay permits and is fairly costly. An understanding of the local business culture will be require and will take time to acquire.
East Africa is a very relational culture and business environment hence there is significant value in working
with local partners and with/through their existing network and contacts. It is recommended that interested
Finnish companies work with a local partner/reseller or a sales representative strongly supported by the
headquarter in the acquisition of the first 1‐2 clients which then can be leveraged to acquire additional
clients. It is possible to jet in to sell but as the majority of the potential customers emphasises the need for a
long term Africa strategy and commitment paired with an understanding of the local market this is in reality
not a viable strategy.
Given the broad span of the sector it is difficult to point at specific organisational partners. Key organisation in
the sector are Telecommunication Service Providers Association of Kenya (TESPOK) (see more info under
Cyber Security), Communications Authority of Kenya (CA – government) and ICT Authority (government) plus
the government flagship Konza Technology City (www.konzacity.go.ke). It would be advisable to foster
relationships with these organisations without expecting that they will drive significant business.

Finpro Digital Africa Growth Program Pre-study: Kenya
33 of 42
3 CYBER SECURITY IN KENYA
3.1 Summary The number of Internet users in Africa at the moment is estimated to exceed 200 million and keeps rapidly growing, particularly due to rising access to mobile devices. However, great prospects for economic advancement by using the momentum of information technology can be slowed down if governments and organizations fail to recognize and manage cyber security risks and fail to create a secure digital environment that encourages innovation and investment in the region. Lack of protection and cybercrime laws in East Africa in general has created a fertile ground for cybercrime which is often complicated to investigate and prosecute ‐ between 2010 and the first quarter of 2013, cyber fraud‐related losses (mostly due to card skimming and ATM withdrawals). Last year, recognized that technology is moving so rapidly that many governments and organizations are struggling to keep up and are ill‐prepared to defend themselves against both internal and external cyber opponents. Top cyber security threats in East Africa: Insider threats: Involving privileged users corrupting systems for various reasons among them to defraud
the company by stealing crucial data, revenging against those perceived as enemies and blackmailing others
VoIP PBX fraud: The popularity of Internet telephony has made many private box exchange (PBX) to have Internet connectivity unlike before. As a result, PBX fraud has been on the rise, with hackers gaining access and making free calls, with the real owners of the equipment receiving the bill
Social media: Social media has been misused as a platform where individuals post defamatory statements, spread hate speech, cyber‐bully others and post obscene images
Online and mobile banking: The popularity of online and mobile banking has seen some financial institutions introducing vulnerable web and mobile applications. Some financial institutions have inadequate online security for their web applications and lack strong encryption making them susceptible to phishing.
Mobile fraud: The popularity of the mobile money in East Africa has made it attractive to criminals. Fraudsters are getting innovative every day, identifying loopholes in software used by mobile network operators to defraud users of their hard‐earned money.
Cyber espionage: Involves stealing of secrets stored in digital formats or on computers and IT network. Cyber criminals either sponsored by states or individuals are using sophisticated gadgets to gains access to networks and steal information.
Businesses in telecommunications plus banking and financial services are very aware of the growing need for
securing their ICT infrastructure and that this is an increasingly complex business challenge. It is
acknowledged that it will grow exponentially with the need to deploy ICT as a key differentiator and business
driver.
Most cyber attacks and fraud are not publicly reported and it should be considered that the actual cases and
amount lost exceeds the aggregated numbers that is in the public domain. There is an acknowledgement that
the government and concerned regulatory bodies are proactively working on developing the right legal and
regulatory framework.
The market is looking for trusted and benchmarked western products supported by local distributors. There
may be an opportunity of building an entry strategy around expert training and capacity building.

Finpro Digital Africa Growth Program Pre-study: Kenya
34 of 42
3.2 Introduction With over 21 million internet users out of its 44 million population, Kenya ranks fourth in cyber‐crime cases in Africa. Kenya has experienced increased cyber‐attacks since the going live of submarine fiber optic cables with financial institutions and government agencies suffering the brunt of it. Hundreds of government ministries and institutions have been hacked or defaced in the last two years including the central bank of Kenya and google Kenya’s websites. These are the publically visible cases, however victims of commercial espionage often are reluctant to acknowledge they have been victims of cyber‐crime and therefore go unreported. Kenya’s connection to the internet was greatly enhanced with the connection of the SEACOM cable in 2009 and the connection of the EASSy cable in 2010. Even with current investments by the government, banking and telecommunications sectors, there are still in general serious security loopholes hindering the growth of e‐commerce brought about by the increased connectivity leading to the rise of cybercrime in Kenya in both public and private domains. With mounting evidence of increasing vulnerabilities, the Government of Kenya (GoK) embarked on the Implementation of the National Public Key Infrastructure (NPKI) to help create trust for online transactions. Widely recognized as the most secure platform for e‐commerce transactions, the Public Key Infrastructure (PKI) is also by far the most matured solution that addresses all four key elements of security: authentication, non‐repudiation, confidentiality and integrity.vi Kenya is in the process of drafting tough cyber laws. The draft, dubbed “cyber‐crime and computer related offences bill 2014”, is to address offences against confidentiality, integrity and availability of computer data and systems. It also seeks to curb cyber stalking, hate speech and identity related crimes. Communications Authority of Kenya set up the national Kenya computer incident response team coordination center (National KE‐CIRT/CC) whose mandate is to coordinate response and manage cyber security incidents nationally and to collaborate with relevant actors locally, regionally and internationally. Other organizations such as the telecommunication service providers association of Kenya (TESPOK ‐ www.tespok.co.ke ); the lobby group representing telecom companies; has also set up response teams and organizations aimed at providing information and alert to the public and organizations.
3.3 Laws and regulations
In July 2014, the first draft of the cybercrime and computer related crimes bill in Kenya (‘cybercrime bill’) was established. The draft bill is an initiative of the office of the director of public prosecutions (ODPP). It seeks to equip law enforcement agencies with the necessary legal and forensic tools to tackle cybercrime. The bill comes on the heels of a cyber‐security conference in June 2014 where the telecommunications service providers association of Kenya (TESPOK) and cyber security groups from Canada, Singapore, south Africa, India and USA discussed the role of the private sector in tackling cybercrime.
3.4 Top threats in 2013 The Kenyan cyber security landscape is evolving fast as more organizations are becoming vulnerable to intrusions and exploitation. The fast‐growing digitally enabled operating ecosystem in Kenya is characterized by increasingly sophisticated insiders and outsiders launching more frequent and targeted attacks. These attackers are using clever tactics to penetrate inherent weaknesses in information security programs and systems, rendering standard methods of detection and incident response obsolete. The list below gives an overview of the top threats in 2013.vii 3.4.1 Insider threats Insiders threats remains the biggest security threat facing Kenyan organizations in 2013. In this period, insider threats contained a high incidence of deliberate malicious activity by current employees. Privileged users probed systems for unauthorized access, co‐opted other user’s access privileges, and attacked systems for a variety of reasons including disgruntlement, revenge, competitive advantage and blackmail. The scope of insider threats only intensified as business models continued to evolve with increased mobility, a growing mix of users, and geographically diverse business offices.

Finpro Digital Africa Growth Program Pre-study: Kenya
35 of 42
3.4.2 VoIP PBX fraud The introduction and increasing popularity of internet telephony (voice over IP ‐ VoIP) services has led to the majority of PBX’s used in Kenyan organizations to have internet connectivity where traditionally they did not. This has increased the number of attack vectors available to be exploited where they have not been secured. A growing number of businesses in Kenya are being targeted by PBX fraud/hacking. This type of fraud has been around globally for the past 10‐20 years; however over the past few years there appears to be a concerted focus on attacking businesses within Kenya. 3.4.3 Social media Social media websites have become a popular platform that many Kenyan organizations use to build new relationships and contacts. However, social media websites are also being used by cyber criminals to indulge in various cyber‐crimes. In 2013, the number of criminal offences related to social media websites in Kenya increased. Most of these cases identified were related to posting of defamatory, hate speech, cyber‐bullying, obscene matter or images on various social media websites. During the Westgate terror attack of 2013, the terrorists utilized social media such as twitter to gain information on the rescue efforts being conducted by the police. 3.4.4 Denial of service attacks The continued growth of new online services launched by organizations in Kenya is increasing the country’s susceptibility to targeted denial of service attacks. Many attacks are originating from compromised servers at hosting providers that are slow to respond to malware clean‐up requests, as well as servers that are out of reach of international authorities. The government has introduced a number of online enabled services including; integrated financial management information system ‐ IFMIS, iTax and Kentrade single window system. In the private sector banks are introducing internet banking systems, insurance companies are introducing customer portals while other organizations are introducing customer case support and fulfillment systems. 3.4.5 Botnet attacks The number of compromised computers (botnet) in the Kenyan cyberspace is growing. In 2013, the number of botnet activity detected, increased by 100% from 900,000 events for the period ending December 2012 to 1,800,000 events for 2013. This is attributed to the increasing number of broadband and high speed internet subscriptions. These subscriptions are exposing new unsecured computers and routers to the internet ‐ increasing the number of computers that can be compromised by cybercriminals. Once these devices are compromised, they can be used to spread viruses, generate spam, and commit other types of online crime and fraud. These attackers then utilize this highly distributed network to attack targeted infrastructure such as financial institutions and government ministries in attempts to defraud, cripple or steal information. 3.4.6 Online and mobile banking The continued adoption of online and mobile banking services is leading to new threats for customers and local financial institutions’. Many financial institutions are introducing vulnerable web and mobile applications. A recent study was conducted by Serianu Ltd on 33 online banking portals. Out of the 33 banking applications sampled, only 2 banking portals had adequate online security deployed on their web application. Majority of the web applications reviewed lack of strong encryption and are susceptible to phishing attacks. 3.4.7 Mobile money fraud The continued popularity of mobile money adoption in the region has attracted criminals who are now targeting this new money transfer channel. In 2013, marked an increase in mobile money fraud targeting individuals and organizations. The fraudsters are getting innovative and a very fast on finding loopholes in new controls implemented by merchants, banks and consumers. 3.4.8 Cyber espionage In 2013, there was an increase in cases of cyber espionage. Cyber criminals either sponsored by states or individual organizations are using highly sophisticated and carefully constructed methods to gain access to a network and steal information quietly. Locally, there were reports that a local foreign embassy was targeted by a foreign government in an attempt to steal information. Cyber espionage is an emerging threat especially with the ongoing political and economic policy changes in the country. There is also the threat of competing organizations using cyber espionage attacks to gain information from their competitors.

Finpro Digital Africa Growth Program Pre-study: Kenya
36 of 42
3.5 Threat landscape analysis In 2013 the number of cyber threat attacks detected in the Kenyan cyberspace grew by 108% to 5.4 million attacks compared to 2.6 million attacks detected in 2012. During the period there were numerous attempts detected to penetrate cyber networks operating in Kenya. The attacks observed originated from the cyber space of a number of countries including Kenya. It was observed that the attackers were compromising computer systems located in Kenya and used masquerading techniques and hidden servers to hide the identity of actual system from which the attacks are being launched.viii
3.6 Criminal activity Fraudsters have stolen at least 13.8 million Euros from Kenyan banks in the past one year, in schemes hatched by technology‐savvy bank employees. Financial institutions reported 13.7 million Euros stolen from customers’ accounts between April 2012 and April 2013. Investigators managed to recover only EUR 4.9 million. Several cases are pending in court or are still under investigation. Security experts say the amounts reported reflect only a small portion of the real losses suffered since banks prefer internal disciplinary measures in cases involving thieving employees. Kenya’s top five banks by profitability — Equity Bank, Co‐operative Bank, Standard Chartered, KCB and Barclays — were the worst hit by fraudsters.

Finpro Digital Africa Growth Program Pre-study: Kenya
37 of 42
The top 3 malicious countries are China, Brazil and the United States. China comes in first responsible for about a third of the total malware sent to Kenya. Police in Kenya are currently holding 77 Chinese nationals accused of running a cybercrime network and mysterious "command center" from upmarket houses in Nairobi. They believe the gang were "preparing to raid the country's communication systems" and that they possessed equipment capable of infiltrating bank accounts, Kenya's M‐PESA mobile banking system and ATM machines. Preliminary investigations have shown the group were making microchips for ATM cards.
3.7 Structure and size of the market International Data Corporation (IDC ‐ www.idc.com) predicts that Kenya’s ICT market size will be worth EUR 1.8 billion in 2015. Multinationals are investing in the country because it is a spring board of connecting ICT and business to other markets.ix It is also estimated that Kenya loses EUR 20.6 million through cybercrime annually according to Kenya’s information, communication and technology division.xLeading industry players in the financial and telecommunications sectors have and continue to invest heavily in technology systems and continue to leverage it as a strategic component in dominances over their sectors.xi The market displays a form of perfect competition whereby there are a number of firms offering the same type of products with no control over the market price and control only but a small share of the market. The market has no barriers on entry and exit, and very little regulation by the government save for enabling competitiveness. Industry spending is on the rise with organizations spending more of their technology budgets in buying more security tools to help automate and enhance the enterprise security posture. These tools range from the traditional firewall and antivirus solutions to advanced end point protection, web application firewall and security event management (SEM) tools.
3.8 Nature of the market value chain The Kenya market for cyber security is still underdeveloped and under researched. The is little funding that goes into dealing with issues of insecurity until recently when the government of Kenya formed the national cybersecurity master plan which has not yet been implemented. It is driven by its reactive nature whereby measures are taken after the fact, but none the less a growing market based off demand for better security guards. There is very little regulation in the market save for a bill that has not yet been passed being drafted and a few government bodies trying to regulate the market such as the Communications Authority of Kenya (www.ca.go.ke ) and the Ministry of Information, Communications and Technology (www.information.go.ke ). Most of the players in the market are consultancies and resellers of products by companies like Cyberoam, Norton, McAfee, Kaspersky and Cisco. Of these some of them have established a mild presence by opening offices, appointing channel managers and even partnering with distributors. There are no regional security solution developers primarily because locally developed solutions would lack the trust required to penetrate the market. There are few skilled individuals in the works force which has prompted a few universities to offer information security courses. Strathmore University is the only institution which offers Masters of Science (Msc.) degree courses. United States International University (USIU) offers courses in digital forensics and cybercrime, which are targeted at chief information officers, network security engineers, information security architects, incident responders, penetration testers, forensic experts in defense, police service, quasi government agencies and private enterprises. Nairobi University has partnered with the ICT Authority and offers cyber security through its C4Dlab. The offered courses are though by industry and employers seen as too theoretical and with little business reality.

Finpro Digital Africa Growth Program Pre-study: Kenya
38 of 42
3.9 Overview of key companies and organizations
Key companies:
Companies Website Products/ offering
Serianu www.serianu.com Technology Advisory Information Security and Risk Information Intelligence and Analytics Information Enablement focus
Professional Technologies LTD
www.protec.co.ke End Point Protection Content Filtering & Management Gateway Protection & Intrusion Prevention Network Access Control
Isolutions Associates (ISOLS)
www.isolutions.co.ke Identity Protection & Management Firewalls & UTM’s Multi‐Factor Authentication Network Monitoring & Management SSL Certificates Anti‐fraud Security Information & Event Security Configuration Management Data Leakage Protection Database Security Vulnerability Management
Data Guard www.dataguard.co.ke Networking Anti‐virus Networking Hardware
Computer Forensics Kenya
www.computerforensickenya.com
Computer Forensic Investigation Penetration testing Vulnerability Management Investigation of computer related crimes Training of security personnel Infosec Consultancy
Cyber Securities Africa
www.cybersecurityafrica.com End Point Security Vulnerability Management Intrusion Prevention Systems Full Disk Encryption Source Code Analysis Network Access Control Systems Computer Forensics Equipment Mobile Forensics Equipment SIEM Management
WestconAfrica www.africa.westcon.com Vendors of network and security solutions
Imaging and Printing Security Solutions Infrastructure Solutions
Mart Network Solutions
www.mart‐networks.com Cabling Infrastructure Data center Networking Unified Communications Network Security
Furthermore a number of larger infrastructure and hardware companies such as Next Technologies (www.next.co.ke), CopyCat (www.copycatltd.com), and Dimension Data (www.dimensiondata.com) which also offer security solutions to their customers – yet are not experts in the field.

Finpro Digital Africa Growth Program Pre-study: Kenya
39 of 42
Key organizations:
Cyber Usalama (part of TESPOK (Telecommunication Service Providers Association of Kenya)
www.tespok.or.ke Develop and promote the use of appropriate technology and systems management practices to resist attacks on networked systems, to limit damage and ensure continuity of critical services
National Kenya Computer Incident Response Team Coordination Center (National KE‐CIRT/CC)
www.ke‐cirt.go.ke Offering advisories on Cybersecurity matters and coordinating cyber incident response in collaboration with relevant actors locally, regionally and internationally;
Acting as the national trusted point of contact for information security matters;
Gathering and disseminating technical information on computer security incidents;
Carrying out research and analysis on computer security;
Capacity building in information security and creating and maintaining awareness on cybersecurity‐related activities; and,
Facilitating the development of a National Public Key Infrastructure (NPKI), among others.
Industry Computer Security Incident Response Team (iCSIRT)
www.tespok.co.ke Weekly Reports on Bad IPs reported on the member’s networks – Providing a summary of IPs with spam, botnets, open resolvers, scanners, proxies and malware URL’s reported.
Security Bulletins‐a compilation of recorded activities from external sources sent to members of the Kixp‐tech and security mailing list.
Alerts and Warnings – Gathering computer security information on vulnerabilities and providing security alert and advisory message to prevent attacks.
General Security incident handling – IP hijack, identity theft, phishing attacks via the discussions and coordinated response with the members.
Ministry of Information, Communications and Technology
www.information.go.ke
Responsibility of formulating administering, managing and developing the Information, Broadcasting and Communication sector
3.10 Buying process and decision making Security solutions are a budget integral item yet new threats and security solutions means there is an openness towards new and innovative solutions. Solutions are sought from local resellers/partners and the decision making for cyber security solutions is typically with the Head of IT. There need to be significant aspects for it to be escalated to a MD/CEO or board level.
3.11 Business models The interviewed companies were reselling their cyber security solutions based on reseller agreements with the principals (both the two interviewed companies) – iSolutions had a number of agreements with the continental master reseller for Africa (typically based in UAE or South Africa). Retail and corporate products are kept separate and often spun into a separate firm catering for the retail market (iSolutions has DataGuard which caters for this segment). The cyber security solutions business in Kenya is entirely based on a channel strategy. Many of the principals are though also present own staff

Finpro Digital Africa Growth Program Pre-study: Kenya
40 of 42
supporting their channels. Cyber security firms are focused on the sales of solutions centered on a given product. The size and maturity of the market is yet to see firms centered on consulting, research or cyber security training. Current market players there provides training and some level of advisory/consulting services integral to their deployment of actual solutions. For implementation and consulting projects the companies appear to rely on their own inhouse resources or especially consultants from India seen as cost efficient and experienced. Clients either define RFP and requirement specifications inhouse or do consult with cyber security firms.
3.12 SWOT analysis
Strengths Increased spending on cyber security protection
measures High rate of digitalization Growing ICT sector Kenya is becoming a hub for many businesses to
invest in due to increased spending power Universities are now offering courses on cyber
security Government strategies and bodies have been
put in place to govern such acts of hacktivism, which monitor and counsel organizations on threat mitigation.
Weaknesses Arrogance by large organizations when alerted
on threats and how to mitigate, instead they ignore.
Ignorance by users on ways to curb cyber insecurity and ways to safe guard against such incidents
Products in the market are expensive to maintains by users on a personal level hence why many go unprotected
Use of outdated software by service providers Weak national support
Opportunities Need to set up more companies providing such
services with local support Arising need for cyber security with the
advancements in ICT Willingness to spend on security measures Untapped potential for ICT infrastructure
vendors, defense contractors, and technology companies
Market for consultancies to set up and offer advisory
Online and mobile banking will continue to grow and lead to increased need to secure the concerned channels
Threats Inadequate training of own staff resulting in
security lapses and ultimately loss of trust in local suppliers
Lacking expert training of end clients/users resulting in a lacking up‐to‐date understanding of risks and their mitigation
No sharing of attacks and incidences among institutions meaning that attacks are easily replicated across same system institutions
Attacks instigated by staff from inside otherwise secure systems
3.13 Challenges Organized criminal activities by external criminals (and terrorists), and internal staff are across the board
expected to grow and require increased focus and solutions. Organizations tend to play “catch up” when it comes to mitigating threats, instead of forward thinking
beforehand and making the necessary preparations Lack of implementation of the cyber security master plan that was developed recently ‐ National ICT
Master Plan Lack of trained individuals in the market. Most/all of the provided training and education are extremely
theoretical and companies experience that it is practically inapplicable in their reality No culture of accepting disclosure. Issues are handled entirely internally to the degree possible – before
externals may be consulted. Little or no advice or help is sought from industry peers. Mindset of arrogance and superiority by larger organizations

Finpro Digital Africa Growth Program Pre-study: Kenya
41 of 42
Constant evolution of the nature of cyber threats requiring continuous training and knowledge upgrading
Lack of dedicated research funds to apply to cyber security
3.14 Business needs
Capacity building and training Focus on Research and development for the sector Set up regulations and laws to govern the ICT sector Awareness creation and education of the public on threats posed in the state of cyber insecurity Fostering of information sharing and collaboration among relevant stakeholders to facilitate an
information sharing environment Protection of critical information structure Implementation of the national cybersecurity strategy and master plan More research and development Capacity building and training of staff
3.15 Opportunities There are among all the interviewed companies a clear understanding that the increasing use of internet and mobile access and devices will be a growing need for security solutions. The general perception is that trusted solutions in this area have to be sourced from the West. Opportunities: Security solutions for mobile and internet devices and access points Mobile and internet banking security solutions Professional and practically application centered security training (could be blended learning whereby
there is an element of e‐learning). Generally there appear to be potential for providers which can deliver more value add to the clients whether through research or training
The banking and financial services industry is the key industry together with the telcom sector – followed by the government, medical institutions, INGOs/UN and the hospitality sector. Educational institutions are trailing behind because of funding
Solutions protecting the increasing number of system integrations (for example with mobile money) Protection of cloud based solutions (though the interviewed companies are divided on whether to move
to the cloud now or within the next 3‐5 years)
3.16 Entry strategy and partners New market entrants should work through a local partner and equip the partner to sell, support and build up capacity the partner’s own staff and the staff of the end clients. As trust is a key issue in the procurement and deployment of security software Finnish companies are advised to participate in and drive the initial client acquisition till it has a couple of key showcase accounts. There is no need to deploy own staff on the ground and a strong online support of the local partner and when needed the end client would do. Possibly allow for potential initial clients to interact with the Finnish headquarter in the process of building confidence and relations. The listed organizations in section 3.9 would be organizations to foster relationships with. Furthermore it would be recommended to develop ties with key industry organizations such as Kenya Bankers Association (www.kba.co.ke) and Association of Kenya Insurers (www.akinsure.com).

Finpro Digital Africa Growth Program Pre-study: Kenya
42 of 42
i KPMG, 2014, Sector Report: Banking in Africa. www.kpmg.com/Africa/en/IssuesAndInsights/Articles‐Publications/General‐Industries‐Publications/Documents/Banking%20in%20Africa.pdf
ii Sacco Society Regulatory Authority (SASRA), 2014, SASRA Annual Supervisory Report. www.stractconsult.com/kenya‐saccos‐2013‐performance/
iii Business Daily, 2014, Kenyans move Sh1.1trn on mobile phones in 6 months, www.businessdailyafrica.com/Kenyans‐move‐Sh1‐1trn‐on‐mobile‐phones‐in‐6‐months/‐/539552/2414794/‐/y22x2tz/‐/index.html
iv Business Daily, 2013, Agency banking racing to catch up with mobile money www.businessdailyafrica.com/Agency‐banking‐racing‐to‐catch‐up‐with‐mobile‐money/‐/539552/1857746/‐/rq112y/‐/index.html
v Kenya Central Bank, 2015, Kenyan Banking Sector Registers Improved Performance. CBK: www.centralbank.go.ke/index.php/news/296‐kenyan‐banking‐sector‐registers‐improved‐performance
vi www.govca.go.ke
vii www.enisa.europa.eu/activities/Resilience‐and‐CIIP/national‐cyber‐security‐strategies‐ncsss/KE_NCSS.pdf
viii www.serianu.com/downloads/KenyaCyberSecurityReport2012.pdf
ix www.cio.co.ke/news/main‐stories/idc,‐kenya%E2%80%99s‐ict‐market‐will‐be‐worth‐usd‐2‐billion‐by‐2015
x http://tekedia.com/wp‐content/uploads/2014/06/Kenya‐cybersecurity‐report‐rethinking‐cybersecurity.pdf
xi www.worldbulletin.net/haber/138783/kenya‐loses‐millions‐of‐dollars‐to‐cybercrime