financing growth and development: options for raising more...
TRANSCRIPT

FINANCING GROWTH AND DEVELOPMENT:
Options for raising more
domestic revenues
Uganda Economic Update, 11th Edition
MAY 2018
Pub
lic D
iscl
osur
e A
utho
rized
Pub
lic D
iscl
osur
e A
utho
rized
Pub
lic D
iscl
osur
e A
utho
rized
Pub
lic D
iscl
osur
e A
utho
rized


FINANCING GROWTH AND DEVELOPMENT:
Options for raising more
domestic revenues
Uganda Economic Update, 11th Edition

Foreword ............................................................................................... v Abbreviations and Acronyms ...............................................................vi Acknowledgements ............................................................................. vii
KEY MESSAGES ..................................................................................viii
PART 1: STATE OF THE ECONOMY 1.0 Recent economic developments .......................................................... 1
2.0 Economic outlook and risks ................................................................. 16
PART 2: UGANDA MUST RAISE MORE DOMESTIC REVENUES TO MEET DEVELOPMENT NEEDS
3.0. Uganda’s.domestic.revenue.effort.is.not.matching.its.good economic performance ......................................................................................... 21
4.0. Policy.discretion.and.informality.are.constraining.expansion.of.the.revenue base ........................................................................................ 24
5.0. Addressing.policy.distortions.can.raise.the.productivity.of.tax.instruments .......................................................................................... 32
6.0. Enhance.efficiency.of.revenue.administration. ................................... 487.0. Strengthen.the.social.contract.to.improve.tax.compliance ................ 508.0 Concluding remarks ............................................................................ 52
CONTENTS
Figure.1:.Global.output.growth.has.strengthened.1.|.Figure.2:.Real.GDP.growth.rebounds.in.Uganda..3Figure.3:.Inflation.rates.decelerate.| Figure 4: Easing of food, energy, fuel, and utility prices 6Figure.5:.Private.credit.growth.remains.subdued.|.Figure.6:.Weighted.average.lending.rates.are.declining 7.|.Figure.7:.Current.Account.Deficit.and.net.FDI.|.Figure 8: Relatively stable nominal exchange.rate.10 | Figure 9: Interest rate development on T-bills and T-bonds 12 | Figure 10: Borrowing requirement increasingly met by foreign debt 12 |.Figure.11:.Stock.of.verified.arrears.13.| Figure 12: Evolution of total public debt 13.|.Figure.13:.Principal.repayment.profile.(in.millions.of.Ush).14.| Figure 14:.External.public.debt,.nominal.(in.percent.GDP).15.|.Figure.15:.Total.public.debt,.nominal.(in.percent.GDP).15.|.Figure 16: Vulnerabilities of debt sustainability.|.Figure.17:.Contribution.of.Various.Tax.heads.to Revenue Collection 25 | Figure.18:.Responsiveness.of.taxes.to.GDP.with.and.without.discretionary.measures.(1996-2016)..26 | Figure 19: Evolution in GDP and revenue by Economic Activity 27 | Figure 20:.Buoyancy.of.taxes.to.GDP.growth.for.main.sectors.and.sub-sectors.of.GDP.(1999-2016).28.| Figure 21:.Informality.in.Uganda’s.Economy.(2013-2017).29
LIST OF FIGURES
ii
to stay on its development course and not compromise fiscal stability, Uganda needs to urgently increase the mobilization of domestic revenues
iii

© 2017 International Bank for Reconstruction and Development /International Development Association or The World Bank Group1818 H Street NWWashington DC 20433Telephone: 202-473-1000Internet: www.worldbank.org
This work is a product of the staff of The World Bank with external contributions. The findings, interpretations, and conclusions expressed in this work do not necessarily reflect the views of The World Bank, its Board of Executive Directors, or the governments they represent.
The World Bank does not guarantee the accuracy of the data included in this work. The boundaries, colors, denominations, and other information shown on any map in this work do not imply any judgment on the part of The World Bank concerning the legal status of any territory or the endorsement or acceptance of such boundaries.
Rights and Permissions
The material in this work is subject to copyright. Because The World Bank encourages dissemination of its knowledge, this work may be reproduced, in whole or in part, for noncommercial purposes as long as full attribution to this work is given.
Any queries on rights and licenses, including subsidiary rights, should be addressed to the Office of the Publisher, The World Bank, 1818 H Street NW, Washington, DC 20433, USA; fax: 202-522-2422; e-mail: [email protected].
Design/Layout: Artfield Graphics Ltd, [email protected].
Cocept, typesetting, graphics, and page layout: Artfield Graphics Ltd.Printed in Uganda by Artfield Graphics Ltd
Additional.material.relating.to.this.report.can.be.found.on.the.World.Bank.Uganda.website.(www.worldbank.org/uganda).
iv

Uganda has reached a critical point in its development. Aid flows have slowed, and public debt is rising, and is expected to increase above 40 percent of GDP by the end of 2019. The Government’s ability to borrow domestically is also constrained, due to the crowding out effect this can have on private sector credit growth. At the same time, however, Uganda needs to scale up the financing of important infrastructure, and continue to build human capital through the provision of better education and health services. Thus, to stay its development course and not compromise fiscal stability, the country needs to urgently increase the mobilization of domestic revenues.
Domestically generated revenues will ensure that Uganda owns and drives its development agenda in a sustainable manner, and provides a better and more prosperous future for subsequent generations. Taking bold decisions now to diversify and increase domestic tax revenues before the oil starts to flow, will also better position Uganda to use the envisaged oil windfall for strategic physical and human capital investments, and saving for a future when the oil runs out – rather than expecting future oil revenues to plug expenditure gaps and repay the ever-increasing debt burden. Extensive evidence from other countries shows that the latter is certainly not a prudent approach.
Against this background, I am pleased to introduce the Eleventh Uganda Economic Update, which assesses Uganda’s domestic revenue performance as the special topic, and shows that the country is doing poorly compared to its peers and its potential. Currently, Uganda’s tax-to-GDP ratio is just under 14 percent, which is lower than the ratio in neighboring Kenya (18 percent) and Rwanda (16 percent); and is also below the broader COMESA and Sub-Saharan Africa averages. Furthermore, comparing Uganda to economies with similar characteristics, it has the potential to collect revenues of above 20 percent of GDP over the medium term.
Reforms are required to put the revenue-to-GDP ratio on an upward trajectory so that Uganda moves towards its potential, and raises sufficient resources to finance its growth and development priorities. I trust the report will be useful in advancing the recent public discourse around revenue mobilization and overall fiscal policy management.
In line with the structure of earlier editions of the Uganda Economic Update series, this report reviews recent economic developments, provides an outlook for the macro-economy, and then delves into the special topic of domestic revenue mobilization.
Diarietou GayeCountry Director, Eritrea, Kenya, Rwanda, and Uganda; Africa Region
Foreword
v

Abbreviations and Acronyms
ASCUDA Automated System for Customs Data MDA Ministries, Departments, and Agencies
BOU Bank of Uganda MoFPED Ministry of Finance, Planning, and Economic Development
CET Common External Tariff MSME Micro, Small, and Medium EnterprisesCIT Corporation Income Tax NGOs Non-government Organizations
COMESA Common Market for Eastern and Southern Africa NPL Non-Performing Loans
CSOs Civil Society Organizations OECD Organisation for Economic Co-operation and Development
CY Calendar Year OSR Own source revenueDRC Democratic Republic of Congo OTT Over the TopDRM Domestic Revenue Mobilization PAYE Pay as You EarnDRM-S Domestic Revenue Mobilization Strategy PIT Personal Income TaxDSA Debt Sustainability Analysis PPP Purchasing Power Parity
EAC East African Community SBP Single Business Permit
EACCMA East African Community Customs Management Act SSA Sub Saharan Africa
EFU Energy, Fuel, and Utilities T&T Track and TraceEMDE Emerging Markets and Developing Economies TREP Tax Payer Register Expansion ProjectEU European Union UBOS Uganda Bureau of StatisticsFDI Foreign Direct Investment UCC Uganda Communications CommissionFY Financial Year UGX Uganda ShillingGDP Gross Domestic Product UN United NationsICAS Investment Climate Advisory Services URA Uganda Revenue AuthorityICT Information and Communication Technology URSB Uganda Registration Services BureauICTD International Centre for Tax and Development USD Unites States DollarsIDA International Development Association VAT Value Added TaxIMF International Monetary Fund WB World BankKCCA Kampala City Council Authority WHO World Health Organisation
YOY Year-on-Year
vi

The Eleventh Edition of the Uganda Economic Update was prepared by a team consisting of Rachel Kaggwa Sebudde; Moses Kajubi; Tihomir Stucka; Joseph Mawejje; and Richard A. Walker. The team is grateful to Leif Jensen for additional inputs on the structure and messaging of the special topic and to Barbara Magezi for guidance on the governance issues related to domestic revenue mobilization. Barbara Katusabe provided logistical support, while Sheila Kulubya managed the communications and dissemination strategy. The Uganda Country Team provided useful feedback during the preparation of the report. Abebe Adugna (Practice Manager, Macroeconomics, Trade and Investment) and Christina Malmberg Calvo (Country Manager) provided overall guidance on the project.
The report benefitted from the insights provided by internal peer reviewers, including Marijn Verhoeven (Lead Economist and Cluster Lead Tax); Sebastian S. James (Senior Economist Domestic Revenue Mobilization); and Rafael Chelles Barroso (Senior Economist, Macroeconomics, Trade and Investment). Additional insights came from International Monetary Fund staff including Axel Schimmelpfennig (Advisor, African Department); Larry Qiang Cui (Senior Economist, Uganda); Thomas Baunsgaard (Deputy Division Chief, FAD), Andrew Hodge, and Peter Mullins.
The report draws on two diagnostic studies conducted under the auspices of the Domestic Revenue Committee, whose core members consist of representatives of the Ministry of Finance, Planning and Economic Development and Uganda Revenue Authority. The committee operates under the stewardship of the Secretary to Treasury and Permanent Secretary to the Ministry of Finance, Planning and Economic development.
Irfan Kortschak provided professional editing services.
Acknowledgements
vii

Uganda’s fiscal policy has remained mainly expenditure driven, with domestic revenue continuing to lag. This has resulted in a widening financing gap. In the 10-year period to 2017, the total value of public expenditure increased from 15 percent of GDP to more than 20 percent. During this time, the tax-to-GDP ratio grew by an average annual rate of 0.2 percentage points, with the value of collected revenues increasing from 10 to 13.8 percent of GDP over the same period. By 2016, the value of Uganda’s collected per capita revenues stood at US$ 211 of PPP adjusted to 2011 international dollars. This covered 66 percent of general government expenditures, with the remainder covered by loans and grants. The gap between revenues and expenditures could continue to increase into the future, with the expenditure increasing to meet the need to develop the stock of physical infrastructure and to raise the quality and quantity of social services to meet the needs of Uganda’s rapidly expanding population.
With the Government currently formulating a new strategy to increase domestic revenues, this is an appropriate point to reassess previous approaches to revenwue collection. Over the past few years, Uganda has set a mid-term revenue target of 16 percent of GDP. However, it has been unable to meet this target, with many areas of economic activity remaining outside the tax net due to gaps in the areas of tax policy and administration. The new medium-term Domestic Revenue Mobilization Strategy (DRM-S) currently under preparation is critically important, most importantly because it offers a significant opportunity for Uganda to reboot its efforts to generate increased revenues and to improve the way in which these revenues are raised, in a manner consistent with the overall objectives of increased growth and equity. The efficient mobilization of domestic revenue, combined with the efficient use of financial resources, is also essential to strengthen the social contract between Uganda’s government and the country’s citizens.
However, it remains to be seen whether Uganda can increase its domestic revenues and, if so, how. This update argues that to improve performance in this area, avoiding policy discretion is just as important as extending the tax net through innovative approaches to collect revenues from hard-to-tax areas, particularly in the informal economy.
KEY MESSAGES
It remains to be seen whether Uganda can increase its domestic revenues. To improve performance in this area, avoiding policy discretion is just as important as extending the tax net through innovative approaches
Container.depot,.waiting.for.clearance.by.the.customs.authorities.(World.Bank,.2016).
viii

Part 1: State of the economy
After growing at 4 percent in FY2016/17, preliminary data suggests that real GDP in Uganda has risen 7.1 percent during the first half of FY 2017/18, compared to the same period in FY 2016/17. In fact, real output only grew 2.4 percent in the first half of FY 2016/17, when the economy was plagued by adverse weather conditions and pests such as the army worm. The recent growth recovery is largely driven by a double-digit increase in ICT services, strong food crops production, and the robust growth performance of the manufacturing sector.
Improved food supply supported the deceleration in core inflation to 3.2 percent during the first three quarters of FY 2017/18 from 5.2 percent a year ago, well within the Bank of Uganda’s target (3 to 7 percent), allowing for a reduction in February of the policy rate to 9 percent. This is the fourth reduction since the rate reached a peak of 11.5 percent a year ago. The inflation deceleration was mainly due to a decline in sugar, bread and cereal prices. Despite the consecutive reductions of the policy rate, the cost of private sector credit remains relatively high and, subsequently, private sector credit growth remains subdued.
The rebound in output growth accelerated import volumes and widened the external current account deficit to 4.4 percent of GDP during the first half of FY 2017/18, including capital transfers, from 2.5 percent a year earlier. Non-oil private sector imports more than offset strong export growth of coffee, tea, maize and beans. This led to a widening of the merchandise trade deficit to 6.8 percent of GDP in the first half of FY 2017/18, compared to 6.5 percent of GDP the year before. Net travel and remittance inflows, meanwhile, have not performed as well as last year. Nevertheless, net government borrowing and FDI inflows exceeded the external shortfall. As a result, foreign exchange reserves increased to US$ 3.7 billion (or 5.3 months of imports of goods and services) in December 2017. The value of the shilling has remained relatively stable over the 12-month period since March 2017, depreciating around 1.5 percent in nominal terms, and 6 percent in real terms.
Domestic debt of GDP
26%
14%
External debt of GDP
Money.–.Uganda’s.currency.notes.(World.Bank./.Sheila.Kulubya,.2016)
ix

Smaller capital spending offset a contraction in fiscal revenues leaving the central government cash deficit at 4.9 percent of GDP during the first half of FY 2017/18, roughly the same level compared to last year when the deficit amounted to 4.8 percent of GDP. Government revenues shrunk, in GDP terms, mainly due to a fall in grants, while tax collection was marginally below last year’s outcomes. Thus, the Government is unlikely to achieve its goal of increasing tax revenues by 0.5 percent of GDP in FY 2017/18. The Government repaid 0.4 percent of GDP in arrears, double the amount compared to the same period last year. It appears, however, that at the same time, the stock of arrears is likely to have risen, in GDP terms.
Despite sizable fiscal gross financing needs averaging 11.5 percent of GDP over the past five years, Uganda’s external risk of debt distress remains low. Total public debt stood at 40 percent of GDP, a level comparable to Uganda’s peers in East Africa. Over the past four years, the authorities have switched the financing mix to rely more on foreign than domestic borrowing to meet the gross financing need. This shift in the financing mix meant faster growth in external public debt, which at the end of 2017 reached 26 percent of GDP, while domestic debt stabilized at around 14 percent of GDP. External financing is largely contracted on highly concessional terms, with long grace periods and long maturities, which reduces Uganda’s debt burden in present value terms. The Government was prudent in avoiding international bond issuances over the past few years, when global interest rates were low. Therefore, the debt repayment profile is smooth, with no external principal repayment spikes that raise rollover risks, as in some other East African countries.
In FY 2017/18, real output is expected to grow at close to 5.5 percent and could reach 6 percent in FY 2018/19, assuming improved execution of capital spending, favorable weather conditions, and barring other external shocks. In the short term, weather-related shocks, pest infestations and delays in public investment execution may constrain real GDP growth. Real GDP growth could also be adversely impacted by an unexpected increase in oil prices or a sudden decline in foreign demand. Reduced foreign demand, which would weaken exports, can come in the form of further regional instability due to an escalation of conflict in South Sudan and the Democratic Republic of Congo (DRC), Uganda’s second and fourth export destinations.
Strong output growth is expected to widen the current account deficit to about 5 percent of GDP in FY 2017/18 and 6 percent in FY 2018/19. Nevertheless, a pick-up in net FDI investment, as oil exports get nearer, would ensure a stronger buffer in terms of foreign exchange reserves.
Improved food supply supported the deceleration in core inflation to 3.2 percent during the first three quarters of FY 2017/18 from 5.2 percent a year ago
A.good.harvest.makes.Gina.smile,.Kapchorwa.(Artfield.Graphics.2017)
x

Weaker than planned tax collections will prevent the Government from meeting the 0.5 percent of GDP increase in FY 2017/18, as mandated by the Charter of Fiscal Responsibility. The overall fiscal cash deficit, including repayments of arrears, is likely to widen from 3.9 percent of GDP recorded last year to around 4.5 percent of GDP in FY 2017/18. This is still lower than the budgeted deficit of 6.2 percent of GDP presented in the Budget Framework Paper. At the same time, however, the stock of verified arrears could exceed 3 percent of GDP by the end of FY 2017/18.
The weaker tax collections this year demonstrates the limited progress made in the past, and raises the urgency of tax reforms. Comparing Uganda to economies with similar characteristics, it has the potential to collect revenues of about 20 percent of GDP or more over the medium term. Thus, Uganda needs a robust revenue strategy to finance much-needed capital and social safety spending, which will help promote economic growth and also safeguard fiscal sustainability. The expected oil revenues further raise the urgency of taking the opportunity now to increase tax revenues. Considering the wide-ranging benefits and urgency of tax reforms, the second chapter of this report discusses options for tax policy and tax administration, and recommends reforms that could put the tax-to-GDP ratio on an upward trajectory, so that Uganda reaches its growth potential.
Part 2: Special topic: Financing growth and development: Uganda must raise more domestic revenues
Uganda’s revenue collection performance has improved over recent years, with its revenue-to-GDP ratio reaching almost 14 percent of GDP. While this is significantly better than the average ratio of 11 percent that it recorded in the recent decade, it is still lower than that of regional peers and short of the Government’s own target. In the period from 1993 to 2013, the tax-to-GDP ratio grew by the average annual rate of 0.2 percentage points, increasing the value of collected taxes from 7.6 percent to 11.6 percent of GDP. Non-tax revenues added another 0.2 percent of GDP. By FY 2016/17, the ratio had increased to around 14 percent, with the improvement attributable to the impact of new policy initiatives to expand the tax net and to more effectively collect non-tax revenues, as well as efforts to improve compliance. However, with the failure to sustain some of these efforts, in more recent years, there have been significant shortfalls. In FY 2017/18, the ratio is expected to reach about 13.5 percent. This is significantly lower than the mid-term revenue target of 16 percent of GDP established some time ago, and lower than that recorded by regional peers.
Smaller capital spending offset a contraction in fiscal revenues leaving the central government cash deficit at 4.9 percent of GDP during the first half of FY 2017/18, roughly the same level compared to last year when the deficit amounted to 4.8 percent of GDP. Government revenues shrunk, in GDP terms, mainly due to a fall in grants, while tax collection was marginally below last year’s outcomes.
Thus, the Government is unlikely to achieve its goal of increasing tax revenues by 0.5 percent of GDP in FY 2017/18. The Government repaid 0.4 percent of GDP in arrears, double the amount compared to the same period last year. It appears, however, that at the same time, the stock of arrears is likely to have risen, in GDP terms.
xi

In 2016, Kenya’s tax-to-GDP ratio stood at around 18 percent; Rwanda’s at 16 percent; and Tanzania’s at around 14.5 percent. Uganda’s ratio is also below the COMESA and Sub-Saharan average more generally.
The tax revenue system has been negatively affected by application of tax exemptions, growing informality, and diminishing political support for tax collection efforts. Revenue forgone under the current tax system across all tax sources due to exemptions was estimated to be in the range of 4.5 to 5.0 percent of GDP in 2016/17.1 This can be explained by several factors. First, policy discretion, mainly in the form of tax exemptions, had a significant impact in the period from 2006 to 2016, as measured by the differential between tax buoyancy2 and tax elasticity.3 Second, the shift in the composition of the economy from agriculture to services and industry has strengthened the informal sector, with those leaving agriculture tending to end up in small informal non-agricultural enterprises. According to UBOS, informal activities account for 45 percent of GDP. Those involved in these activities are hard-to-reach tax payers, conducting most of their transactions in cash and/or hiding their economic activities from tax authorities. Finally, current policy messages have resulted in a perception that Uganda needs investors, but not revenue. Some income categories are exempted from taxation, with this benefiting privileged groups and creating perceptions of unfairness. The social contract remains weak, due to poor service delivery.
The VAT is the most important source of revenues, generating revenues to a value of around 4 percent of GDP. However, this category of tax is also subject to the most significant losses due to exceptions, amounting to a value of around 2.5 percent of GDP. In FY 2016/17, roughly half of the 4 to 5 percent of GDP tax losses were attributable to VAT exemptions. Practices such as carrying forward offsets, allowing concessions on zero-rating for domestic supplies, VAT exemptions, mal-implementation of the VAT refund system, and deemed VAT provisions, are all eroding the VAT tax base. As a result, Uganda’s performance in the collection of VAT remains consistently poorer than Kenya’s, Tanzania’s and Rwanda’s.
A key reform to the VAT system would involve the establishment of a Tax Expenditure Governance Framework to help manage tax exceptions. The framework would include rules related to tax expenditures to assess the efficiency, impact and equity of tax exemptions, and to remove them if warranted. The framework should: (i) include a clause that refrains
1 Tax expenditures represent the cost to the economy resulting from exemptions or deviations or concessions from a regular tax (VAT, CIT or Excise) system. These have been computed using the revenue foregone method.
2 Tax buoyancy measures the responsiveness of taxes collected to the change in GDP.3 Tax elasticity also measure responsiveness of taxes collected to the change in GDP (as tax buoyancy), but
excludes the impact of policy changes on taxes collected
In FY 2017/18, real output is expected to grow at over 5 percent and could reach 6 percent in FY 2018/19, assuming improved execution of capital spending, favorable weather conditions, and barring other external shocks. In the short term, weather-related shocks, pest infestations and delays in public investment execution may constrain real GDP growth.
Real GDP growth could also be adversely impacted by an unexpected increase in oil prices or a sudden decline in foreign demand. Reduced foreign demand, which would weaken exports, can come in the form of further regional instability due to an escalation of conflict in South Sudan and the Democratic Republic of Congo (DRC), Uganda’s second and fourth export destinations.
xii

any authority from granting discretionary exemptions in whatever form; (ii) subject each new exemption or VAT zero rating to an extensive cost/benefit analysis; (iii) evaluate existing VAT exemptions to determine whether they remain relevant, with the release of the associated analysis to ensure greater transparency; and (iv) if feasible, establish a ceiling on VAT exemptions, with the publication of reports on the degree to which compliance with this ceiling is achieved. The establishment of this framework and the promulgation of the associated fiscal rules could reduce the number of exemptions and thus increase the total value of collected VAT.
The value of collected excise duties amounts to around 2.5 percent of GDP, a decline from the figure of 3.5 percent recorded in the 1990s, with the value of forgone revenues within this system estimated to stand at about 0.5 percent of GDP. Preferential excise rates charged on beers, cigarettes, spirits and wines, and exemptions for automobiles and aviation taxes have been the main sources of leakages. Product-specific challenges range from definitional distortions to loss of value through inflation. In terms of policy, the introduction of a system of price indexation of specific rates to preserve value against inflation could be followed by streamlining product-specific excise duty policies, including: (i) creating a single tier tax rate structure for all cigarettes to ensure that all forms of cigarettes are covered by the excise regime, with the implementation of Track and Trace Systems to curb tax evasion; (ii) applying alcohol tax rates on alcohol content, rather than the current approach with which rates are based on the raw materials used to produce alcohol products; and (iii) broadening the classification and definition of non-alcoholic beverages. In the medium term, petroleum excise duty coverage could be reviewed to confirm that aviation or jet fuel importers on the exemption list meeting the requirements for this exemption. Also, imposing excise tax rates that factor in the energy content in fuels and that includes residual oils, medium oils and preparations in the excise tax base, would follow good international practice.
The corporate income tax generates revenues to a value of about 2 percent of GDP, but is constrained by tax reliefs in the form of incentives and generous depreciation rules, which together result in forgone revenues to a value of about 1 to 2 percent of GDP. In the period from 2014 to 2016, CIT revenue foregone was estimated to have declined from 1.9 to 0.2 percentage points of GDP, due to exemptions alone. However, the reforms implemented in 2017 could reverse the gain made. In
Over the past four years, the authorities have switched the financing mix to rely more on foreign than domestic borrowing to meet the gross financing need. This shift in the financing mix meant faster growth in external public debt, which at the end of 2017 reached 26 percent of GDP
Money: United States of America dollar.(World.Bank./.Morgan.Mbabazi,.2016)
xiii

addition, ‘other’ allowable deductions and the lack of thin capitalization rules for domestic companies reduces taxable income, thus eroding the tax base. The perpetual loss-carry-forward policy has resulted in the potential deferral of CIT tax payments worth 3 percent of GDP. Estimates suggest that the effective CIT rate on net chargeable income has consistently been negative, at an average of 14 percent over the last four years, whereas the nominal tax rate is 30 percent. To raise additional revenues from the business sector, the Government should review the current system of tax reliefs and incentives and retain only those that address market failures. The development of a Tax Expenditure Fiscal Governance Framework would be beneficial to guide the process of assessing the efficiency of tax exemptions and to identify those that should be abolished. It would also provide a solid basis for the assessment of new tax exemptions.
There is also scope to increase the efficiency of the tax administration. This could be achieved through the improved computerization of URA’s operations, the maintenance of a clean tax register to improve accuracy and confidence in the tax system, and the development of the appropriate capacities amongst staff of the URA. In the short term, the priority for capacity building should be to close gaps in core functions such as data analysis and forecasting, auditing and the investigative functions. This should be followed with a strategic plan to build and maintain the required capacities across all policy and administrative functions across all DRM institutions, in the medium and long term.
To support the reforms, the authorities should formulate and implement strategies that promote a culture of compliance with the tax system, including through high-level political messaging. In addition to developing a culture of compliance amongst ordinary taxpayers, political leaders must make a deliberate effort to conduct a campaign that raises public awareness of the importance of taxation for Uganda’s development. It should implement measures to improve perceptions of fairness by minimizing exemptions, as these perceptions play an important role in the establishment of a culture of compliance with the tax system.
The Government could improve transparency and accountability by establishing clearer linkages between taxation and public expenditure and by ensuring that tax administration and enforcement was implemented more equitably. In addition to the annual URA revenue report, the Government could prepare and publicize a report on revenue by
Uganda’s revenue collection performance has improved over recent years, with its revenue-to-GDP ratio reaching almost 14 percent of GDP, better than the average ratio of 11 percent but still lower than that of regional peers
Goods.verification.in.a.warehouse.in.Nakawa.(World.Bank./.Morgan.Mbabazi,.2016)
xiv

In the preparation of the Domestic Revenue Mobilization Medium-Term Revenue Strategy, the authorities core aim is to expand the tax base to increase the tax to GDP ratio
Value of collected excise duties
4.5%
2.5%
Revenue forgone due to VAT exemptions
geographic area and link these to valuable expenditure outcomes. The URA has invested heavily in taxpayer services by establishing a taxpayer services division, the main task of which is to offer taxpayer services, including assistance, information, education, and outreach services. This division runs a call center, while URA provides online self-services to taxpayers through the e-Tax system.
These reforms could contribute significantly to the formulation of an effective Domestic Revenue Mobilization Medium-Term Revenue Strategy (DRMTS). In the preparation of the DRMTS, the authorities core aim is to expand the tax base to increase the tax to GDP ratio, while establishing a transparent, equitable and fair tax system that ensures that per capita tax liabilities match the income profiles of the taxpayers and that the Government is accountable for the use of revenues. The DRMTS creates an opportunity for the Government and the broader public to establish a new social contract based on a sense of mutual responsibility, with the rights and obligations of all parties clearly defined.
Transporters waiting for customs clearance in Malaba.(World.Bank./.Sheil.Gashishiri,.2015)
xv

PART 1STATE OF THE
ECONOMY
A typical business scene at Kikuubo market in Kampala.(World.Bank./.Morgan.Mbabazi,.2018)

RECENT ECONOMIC DEVELOPMENTS
1.1 The.global.economy.continues.strengthening4
Supported.by.improved.confidence,.accommodative.polices, and a rebound in investment, commodity prices and.trade,.global.output.growth.is.recovering.(Figure.1)..While.the.recovery.in.the.US.is.investment-led,.better.output.growth.in.the.Euro.Area.is.being.driven.primarily.by.trade..Thus,.policies.will.likely.start.shifting.from.supporting.domestic.demand.to.structural.reforms.that.boost.potential.growth.and.productivity..Higher.global.growth.rates.are.expected.to.be.sustained.over.the.medium.term,.especially.in.commodity.exporters..However,.downside.risks.remain.substantial.and.relate.to.stress.in.financial.markets,.increased trade protectionism, and rising geopolitical tensions.
Figure.1:.Global.output.growth.has.strengthened
Source: Global Economic Prospect, World Bank, 2018Notes: EMDEs = emerging market and developing economies. Aggregate Growth rates calculated using constant 2010 U.S. dollar GDP weights.
Growth accelerated in all major economies, including better than expected growth in the Euro Area, and in most emerging markets and developing economies (EMDEs). With real GDP growing at 2.4 percent, the Euro Area gained momentum in 2017 spurred by external demand and policy stimulus. The latter reflects the European Central Bank’s asset purchase program that has stimulated private credit growth, which in turn supported growth in domestic demand. Labor markets tightened in response, as unemployment 4 The Global Economy section is based on the World Bank’s Global Economic Prospects
(GEP), January 2018
01
1

rates dropped to levels last seen in 2009. Investment-led growth in the US picked up in 2017 to an estimated 2.3 percent. As a result, the US economy moved closer to full employment, and the Federal Reserve continued to normalize monetary policy, raising interest rates and starting to reduce gradually the size of its balance sheet. In Japan, real GDP grew 1.7 percent, supported by a fiscal stimulus package and a gradual recovery in consumer spending and investment. As in the Euro Area and the US, labor markets tightened, and the unemployment rate fell to a 22-year low. Despite a recovery in output growth, inflation rates remain relatively low across all major economies. Output growth in China, meanwhile, reached 6.8 percent, driven by fiscal support and net exports. Chinese growth is expected to decelerate to about 6 percent over the medium term, as the drivers of growth shift from investment and exports to domestic consumption.
Output growth in Sub-Saharan Africa is estimated to have picked up to 2.6 percent in 2017 from 1.5 percent in 2016. This increase is based on the modest recovery in Africa’s largest economies: Angola, Nigeria, and South Africa. The recovery was driven by favorable global financial conditions and, to some extent, by the modest rise in commodity prices. That said, oil exporters across the region continue dealing with the effects of the oil price collapse, and public debt-to-GDP trajectories continue rising. For example, Chad, Congo Republic, and Equatorial Guinea all recorded negative growth rates in 2017, while growth rates in Cameroon and Gabon declined by roughly 1 percentage point compared to the previous year. At the same time, non-resource countries have expanded at a solid pace, with Senegal and Cote d’Ivoire growing at around 7 percent.
In East Africa, Ethiopia, Rwanda, and Tanzania exhibited the highest growth rates in 2017, ranging between 6.1 and 10.3 percent. In Kenya, poor rains led to a decrease in real growth to 4.9 percent of GDP, which caused a contraction in agriculture output and also reduced hydropower generation. Domestic demand was further dampened by a decline in private sector credit growth and election-related uncertainty.
In the meantime, two of Uganda’s main trading partners, the Democratic Republic of Congo (DRC) and South Sudan, exhibited weak growth performance. Although real GDP in DRC is estimated to have grown 3.4 percent in 2017, after slowing to 2.4 percent in 2016, this moderate recovery remains fragile. Uncertainties related to the elections scheduled for the end of 2018 hamper investment in all sectors, and delay development partners’ decisions to scale up their financing. In South Sudan, the economic collapse continued, following two years of double-digit negative growth rates due to conflict, disruptions to oil production, and weak agriculture production. The situation in both
In East Africa, Ethiopia, Rwanda, and Tanzania exhibited the highest growth rates in 2017, ranging between 6.1 and 10.3 percent.
2

In Kenya poor rains led to a decrease in real.growth.to
7.1%
4.9%
real GDP in Uganda has.risen.to
countries has negative implications for Uganda’s export prospects in FY 2017/18 and beyond.
Output growth in Uganda bounced back strongly
After growing at 4 percent in FY 2016/17, preliminary data suggests that real GDP in Uganda has risen 7.1 percent during the first half of FY 2017/18, compared to the same period in FY 2016/17. Real output growth amounted to 7.5 and 6.6 percent (yoy) during the first two quarters in FY 2017/18, respectively, building on the recovery underway since the second quarter of FY 2016/17 (Figure 2). The strong growth outcome during the first half of FY 2017/18 compares to 2.4 percent output growth during the same period last year, which was plagued by adverse weather conditions and infestations such as the army worm. Interestingly, from a calendar year perspective -- a measure used by most countries worldwide -- real GDP growth in Uganda in 2017 has more than tripled to 7.6 percent compared to only 2.5 percent in 2016. This strong rebound would place Uganda among the top growth performers in East Africa, based on a calendar year measure. The weak real GDP growth outcome in calendar year 2016 in Uganda is evidence of the economy’s dependence on rain-fed agriculture, and untapped large potentials that are grounded in the country’s diverse agro-ecological zones, comparably low temperature variability, and two rainy seasons in most parts of the country.
Figure.2:.Real.GDP.growth.rebounds.in.Uganda.
Source: Uganda Bureau of Statistics (UBOS)
3

Strong growth during the first half of FY 2017/18 was largely driven by an increase in services and agriculture output (Table 1). Output in the services sector accelerated to close to 9 percent supported by another year of double digit growth in ICT. The latter rose over 15 percent in the first half of FY 2017/18 (yoy), after growing 14 percent in FY 2016/17. Favorable weather conditions, meanwhile, led to the sizable pick-up in overall agriculture output of 6.3 percent, spurred by a 9.5 percent increase in food crops production. This remarkable recovery can be in part explained by the low base in the first half of FY 2016/17, when food crop production dropped 4 percent, largely due to drought and pests. In contrast to the impressive performance of food crops, the production of cash crops declined by 3 percent in the first half of FY 2017/18 compared to the same period last year. Forestry output grew 6.6 percent during the first half of FY 2017/18, while livestock production grew 2.6 percent, compared to 1.5 percent a year ago during the same period.
In addition to ICT, growth in the services sector was supported by trade and financial/insurance services. With larger export and import flows, trade services grew 7.6 percent in the first half of FY 2017/18, while financial and insurance services rose 12 percent (yoy), a sign that the insurance market is gaining momentum. At the same time, sustained strong construction activity, which largely relies on government projects, supported the robust growth in real estate services amounting to 6.3 percent (compared to 5.5 percent a year ago).
Industrial output grew 6.4 percent (yoy) during the first half of FY 2017/18, after growing 3.3 percent in FY 2016/17. This acceleration
Strong growth during the first half of FY 2017/18 was largely driven by an increase in services and agriculture output
Beans..(Artfield.Graphics.2017)
4

in industrial output exceeds significantly the growth rate of around 4 percent recorded during the first half of last year, and 5 percent the year before. Manufacturing accounts for more than one-third of growth in industry output, and has expanded 5.4 percent during the first half of FY 2017/18. Construction, meanwhile, grew 4.8 percent, based largely on government projects.
1.2 Headline inflation and core inflation continue decelerating
Core inflation continued decelerating, and stood at 1.7 percent in March 2018 (yoy), allowing for a reduction in the policy rate to 9 percent (Figure 3). Overall, core inflation averaged 3.2 percent during the first three quarters of FY 2017/18, which lies within the central bank’s target range of 3 to 7 percent. In response to this downward trajectory, Bank of Uganda lowered the policy rate in February, the fourth reduction in the policy rate since it reached its peak of 11.5 percent a year ago. The deceleration in core inflation was mainly due to lower sugar, bread and cereal prices.
Headline inflation more than halved to 2 percent in March 2018, from its recent peak of 7 percent in May 2017, due to a significant slowdown in food prices (Figure 3). The deceleration in headline inflation was supported by deflation in food crop prices (-1.6 percent) in March (yoy) due to improved supply, particularly of fruits and vegetables. In other words, during the first three quarters of FY 2017/18 (July to March), food crop prices have grown on average only 4.4 percent, compared to 9.6 percent during the same period last year. Recent deflationary pressures in food crop prices were in part offset by a sharp increase in charcoal and firewood prices, which rose
The deceleration in headline inflation was supported by deflation in food crop prices due to improved supply
Table 1: Evolution of output growth and prices
Source: UBOS and BoU
Output and inflation (percent change) H1 (July - Dec) 2014/15 2015/16 2016/17 2016/17 2017/18Real GDP (2009/10 prices) 5.2 4.7 4.0 2.4 7.1 Agriculture, forestry and fishing 2.3 2.8 1.6 -1.9 6.3Industry 7.8 4.6 3.3 4.2 6.4Services 4.8 5.9 5.7 3.8 8.8 Memoranda: Exports of goods, total (value, yoy % chg) 1.2 -1.8 17.7 18.2 11.6Imports of goods, w/o freight and insurance (value, yoy % chg) -1.7 -8.3 3.1 -6.0 13.5Nominal effective exchange rate (yoy % chg) 6.4 12.7 0.8 -1.8 2.4Consumer prices (average) 2.9 6.5 5.7 4.8 4.7Consumer prices (end-perod) 4.9 5.9 6.4 5.7 3.3
5

16.8 percent in March 2018. In Uganda, charcoal and firewood are used by around 90 percent of households for cooking. This spike in prices was the main driver of the marked increase in the growth of Energy, Fuel and Utilities (EFU) prices to 14.1 percent in October 2017 (yoy). Furthermore, an acceleration in liquid energy fuels (petrol, diesel, and kerosene) to 8.7 percent has played an important role in EFU price increases recently, as global oil prices continue rising. Specifically, the Brent spot price rose from a low in June 2017 of US$ 46 per barrel to US$ 64 per barrel in March 2018,5 with spillover effects on retail pump prices in Uganda. Nevertheless, EFU price pressures have eased, with the rate declining from a peak of 14 percent in October 2017 to 10.3 percent in March 2018 (Figure 4).
1.3 Despite a drop in the policy rate, private sector lending remains subdued
Domestic credit growth averaged around 3.5 percent (yoy) during the first eight months of FY 2017/18, which is a deceleration compared to the 8.5 percent growth rate recorded during the same period last year. This outcome is a combination of steady growth in private sector credit, and a reduction in the growth of net credit to government due to a shift in the financing mix toward external borrowing. Private sector credit growth averaged around 5.5 percent during the first eight months of FY 2017/18 (yoy), and remained stagnant despite the reductions to the policy rate of 2.5 percentage points over the past 12 months.
The cost of private credit remains relatively high. The weighted average lending rate of commercial banks in domestic currency declined to 21 percent in February 2018, after reaching a peak of 25 percent
5 www.eia.gov
Figure.3:.Inflation.rates.decelerate. . . ............Figure.4:.Easing.of.food,.energy,.fuel,.and.utility.prices.
Source: Bank of Uganda Source: Bank of Uganda
Commercial banks maintain high net interest margins, attributed to high overhead costs, costs of conducting due diligence and costs associated with the expansion of branches to rural areas
6

two years ago (Figure 6). Lending rates in foreign currency follow a similar trend, and fell from over 10 percent to 7.2 percent in February 2018. Meanwhile, deposit rates (on savings in shillings) have also declined, from close to 5 percent in July 2016 to around 3 percent in February 2018. Thus, commercial banks maintain high net interest margins. These high margins are attributed to high overhead costs, high costs of conducting due diligence, and high costs associated with the expansion of branches in rural areas. 6 Uganda’s ratio of overhead costs to total assets appears to be the second highest in the EAC (after Rwanda), and much higher than international levels. Salaries constituted the largest share of overhead costs in Uganda due to the scarcity of qualified professionals, which also hampers financial innovation in the financial sector. Banks in Uganda have a limited number of large customers, and the cost of conducting due diligence on small and medium enterprises is high.
Non-performing loans (NPLs) are contracting, but have not yet reached the levels seen in 2015. NPLs-to-total gross loans have contracted from a peak of 10.5 percent in December 2016 to 5.6 percent in December 2017, which is still above the level of 4 percent recorded in 2015. In this context, the build-up of government arrears is not conducive to reducing NPLs. Thus, measures to improve public financial management to prevent the build-up of arrears would benefit the financial sector. Furthermore, enhancing the coverage of the credit reporting system through credit bureaus would also support private sector credit growth, in addition to other structural measures. According to the Doing Business 2018 report, only 6 percent of the population in Uganda is covered by the credit reporting system. In Kenya, the population coverage is 30 percent, in Rwanda it is close to 20 percent, while in Malawi population coverage is around 24 percent.7
6 See World Bank (2015) Uganda – Financial Sector Review, June7 See www.doingbusiness.org
Source: Bank of Uganda Source: Bank of Uganda
Measures to improve public financial management to prevent the build-up of arrears would benefit the financial sector
Figure.5:.Private.credit.growth.remains.subdued. ........................Figure.6:.Weighted.average.lending.rates.are.declining.
7

1.5 The external position has deteriorated, driven by strong demand for imports to support the rebound in output growth
The external current account deficit rose to 4.4 percent of GDP during the first half of FY 2017/18, including capital transfers, from 2.5 percent during the same period a year earlier (Table 2). The jump in export volumes, particularly of coffee (32 percent), was more than offset by an acceleration in import volumes. Driven by the recovery in economic activity, non-oil imports have risen around 10.5 percent, while oil imports increased 10 percent. As a result, the merchandise trade deficit widened to 6.8 percent of GDP, which is 0.5 percentage points larger compared to the deficit recorded during the same period last year (Table 2). The improvement in terms of trade of close to 4 percent has helped limit the widening of the merchandise trade deficit.8 In addition to a wider deficit in the trade of goods, the traditionally positive balance from net services, income, and transfers flows has narrowed by 1.1 percentage points to 1.9 percent of GDP, compared to the same period last year. The resulting external shortfall of 4.4 percent of GDP, including capital transfers, was largely financed by non-debt creating net FDI inflows, which amounted to 2.5 percent of GDP (or US$ 363 million).
Export of goods rose 12 percent during the first half of FY 2017/18, driven by coffee and tea exports. Aided by improved terms of trade, exports of goods increased by US$ 175 million to around US$ 1.7 billion during the first half of FY 2017/18. The value of coffee and tea exports expanded by 33 percent, while exports of maize grew 50 percent and beans 145 percent. Together, these four commodities accounted for one-fourth of total exports in the first half of FY 2017/18. The decline in gold exports (13 percent), which alone represents one-tenth of total exports, and tobacco (2 percent) offset in part the good export performance.
Imports, meanwhile, grew 13.5 percent to US$2.7 billion in the first half of FY 2017/18 from US$2.3 billion a year ago, largely due to private sector imports that expanded at a rate close to 17 percent. Total private sector imports rose by US$ 400 million to US$ 2.4 billion, of which oil imports alone accounted for US$ 100 million, an increase of 32 percent yoy, largely due to higher global oil prices. Non-oil imports increased 16 percent to US$ 1.8 billion, mostly due to larger imports of chemical products (28 percent); non-durable consumption goods, such as vegetable products, fats and oil (16 percent); and durable consumption and investment goods, such as machinery and vehicles (20 percent). In parallel, imports for government projects continued to decline gradually after reaching a peak of US$ 340 million in FY15/16, to US$ 270 million in FY 2016/17 and to US$ 255 million in the first half of FY 2017/18. This decline is largely due to the completion of three-fourths of the
8 Exportpricesrose8.7percent,whileimportpricesincreased4.7percentinthefirsthalfofFY2017/18compared to the same period last year.
Export of goods rose 12 percent during the first half of FY 2017/18, driven by coffee and tea exports
Ripe.coffee.beans.ready.for.harvest.(Artfield.Graphics.2017)
8

Isimba and Karuma dams, as well as a general contraction in government capital spending to 3.6 percent of GDP in the first half of FY 2017/18 from 4.9 percent of GDP during the same period a year earlier.
Smaller tourism revenues and remittances compared to last year narrowed the surplus on the services and incomes accounts to 1.9 percent of GDP in the first half of FY 2017/18 from 3 percent of GDP a year ago. Taken together, net travel earnings and remittances shrunk US$110 million compared to the previous year, which implies smaller foreign exchange inflows on the order of 1.5 percent of GDP. Net transport outflows increased by US$ 80 million, or 0.3 percent of GDP. At the same time, the Government paid close to US$50 million in interest on external loans during the first half of FY 2017/18, an increase of 47 percent compared to the same period a year ago.
Source: Bank of Uganda
Table 2: The current account balance
Current Account Balance (millions of dollars) H1 (July - Dec) 2015/16 2016/17 2016/17 2017/18 Merchandise trade -1887 -1555 -831 -974 (% GDP) (-7.8) (-6.0) (-6.3) (-6.8) Exports 2688 3164 1515 1690 Imports 4574 4718 2346 2664 Services, income and transfers, net 678 515 401 278 (% GDP) (2.8) (2.0) (3.0) (1.9) (Travel earnings, net) 853 763 431 369 (Transport earnings, net) -871 -901 -451 -531 (Personal transfers/remittances) 950 1183 690 642 (Government interest payments) 47 77 32 47 Current account balance -1209 -1040 -430 -696 (% GDP) (-5.0) (-4.0) (-3.3) (-4.8) Current account balance, including capital transfers -1089 -889 -335 -628 (-4.5) (-3.4) (-2.5) (-4.4) Current account balance, including capital transfers and NEO -938 -647 -421 -513 (% GDP) (-3.9) (-2.5) (-3.2) (-3.6) net FDI inflows 629 494 313 363 (% GDP) (2.6) (1.9) (2.4) (2.5) Memoranda: (percent change) Terms of Trade 5.3 0.0 -0.2 3.9 Real effective exchange rate 8.6 -0.6 4.4 5.5 GDP, nominal (in millions of dollars) 24079 25881 13181 14361
9

Debt and non-debt creating flows exceeded the current account deficit, resulting in a build-up of foreign exchange reserve on the order of US$215 million during the first half of FY 2017/18. Net foreign direct investments (FDI) stood at 2.5 percent of GDP (or US$ 363 million), of which US$ 154 million (or 1.1 percent of GDP) was direct equity; US$ 102 million (or 0.7 percent) was reinvested earnings; and US$ 107 million (0.7 percent of GDP) represented loans from parent companies to their subsidiaries in the form of intercompany loans (Figure 7). The Government borrowed externally 4.2 percent of GDP (or close to US$607 million), in gross terms, of which 93 percent was project-related and the remaining 7 percent for budget support. The Government repaid US$ 98 million in principal during this period (or 0.7 percent of GDP), twice as much as the year before. This brought the external debt stock (public and private) to US$ 6.9 billion at the end of December 2017, an increase of US$ 1.5 billion relative to the debt stock at the end of December 2016. Net external financing and FDI inflows bolstered foreign exchange reserves rose, which amounted to US$ 3.7 billion at end-December 2017 compared to US$ 3 billion a year ago. This is equivalent to 5.3 months (as calculated by the Bank of Uganda), which represents a robust buffer.
The value of the shilling has remained relatively stable during the 12-month period (Figure 8). After a cumulative depreciation of 48 percent from February 2014 to September 2015, the value of the shilling relative to the US dollar appreciated 9 percent in July 2016 to UGX 3,379 per dollar. Since then, the shilling depreciated to around UGX 3,600 per dollar, trading in a narrow band between Ush 3,620 and UGX 3,640 and from October 2017 to February 2018 traded in a narrow band ranging between UGX 3,620 and UGX 3,640.
Figure.7:.Current.Account.Deficit.and.net.FDI. ....................Figure.8:.Relatively.stable.nominal.exchange.rate
Source: UBOS Source: Bank of Uganda
the value of the shilling relative to the US dollar appreciated 9 percent in July 2016 to UGX 3,379 per dollar. Since then, the shilling depreciated to around UGX 3,600 per dollar
10
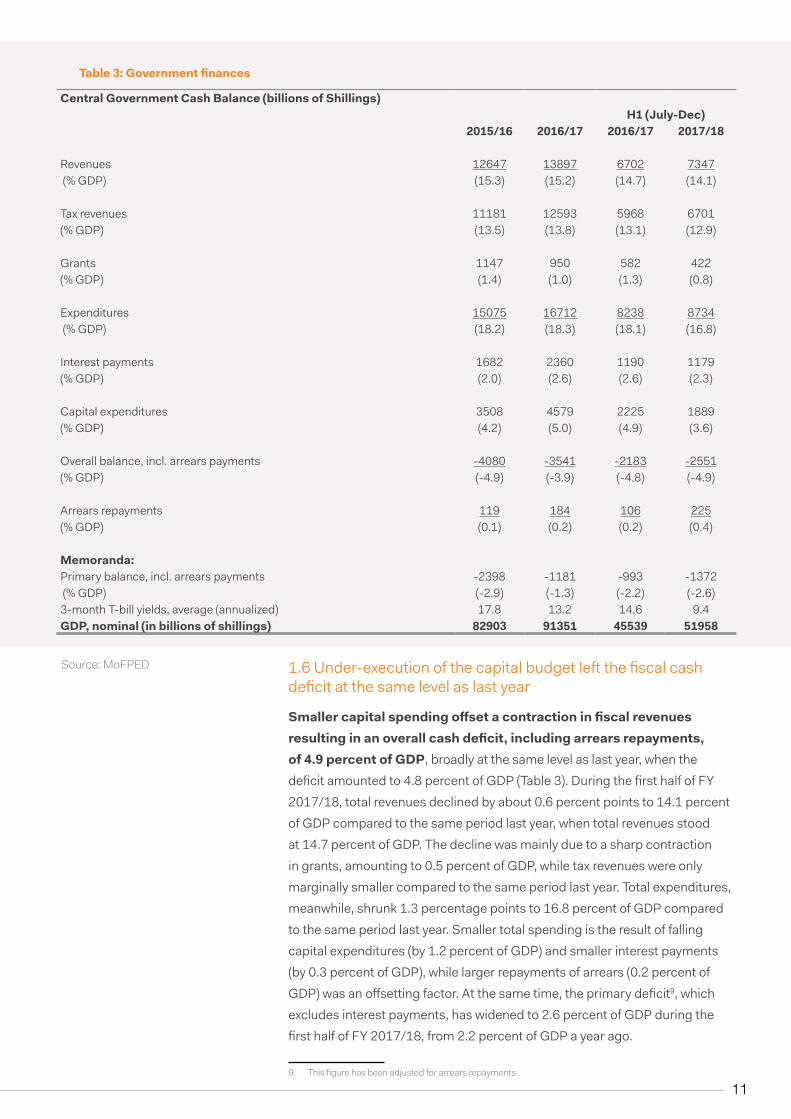
Central Government Cash Balance (billions of Shillings) H1 (July-Dec) 2015/16 2016/17 2016/17 2017/18 Revenues 12647 13897 6702 7347 (% GDP) (15.3) (15.2) (14.7) (14.1) Tax revenues 11181 12593 5968 6701(% GDP) (13.5) (13.8) (13.1) (12.9) Grants 1147 950 582 422(% GDP) (1.4) (1.0) (1.3) (0.8) Expenditures 15075 16712 8238 8734 (% GDP) (18.2) (18.3) (18.1) (16.8) Interest payments 1682 2360 1190 1179(% GDP) (2.0) (2.6) (2.6) (2.3) Capital expenditures 3508 4579 2225 1889(% GDP) (4.2) (5.0) (4.9) (3.6) Overall balance, incl. arrears payments -4080 -3541 -2183 -2551(% GDP) (-4.9) (-3.9) (-4.8) (-4.9) Arrears repayments 119 184 106 225(% GDP) (0.1) (0.2) (0.2) (0.4) Memoranda: Primary balance, incl. arrears payments -2398 -1181 -993 -1372 (% GDP) (-2.9) (-1.3) (-2.2) (-2.6)3-month T-bill yields, average (annualized) 17.8 13.2 14.6 9.4GDP, nominal (in billions of shillings) 82903 91351 45539 51958
1.6 Under-execution of the capital budget left the fiscal cash deficit at the same level as last year
Smaller capital spending offset a contraction in fiscal revenues resulting in an overall cash deficit, including arrears repayments, of 4.9 percent of GDP, broadly at the same level as last year, when the deficit amounted to 4.8 percent of GDP (Table 3). During the first half of FY 2017/18, total revenues declined by about 0.6 percent points to 14.1 percent of GDP compared to the same period last year, when total revenues stood at 14.7 percent of GDP. The decline was mainly due to a sharp contraction in grants, amounting to 0.5 percent of GDP, while tax revenues were only marginally smaller compared to the same period last year. Total expenditures, meanwhile, shrunk 1.3 percentage points to 16.8 percent of GDP compared to the same period last year. Smaller total spending is the result of falling capital expenditures (by 1.2 percent of GDP) and smaller interest payments (by 0.3 percent of GDP), while larger repayments of arrears (0.2 percent of GDP) was an offsetting factor. At the same time, the primary deficit9, which excludes interest payments, has widened to 2.6 percent of GDP during the first half of FY 2017/18, from 2.2 percent of GDP a year ago.
9 Thisfigurehasbeenadjustedforarrearsrepayments
Table 3: Government finances
Source: MoFPED
11
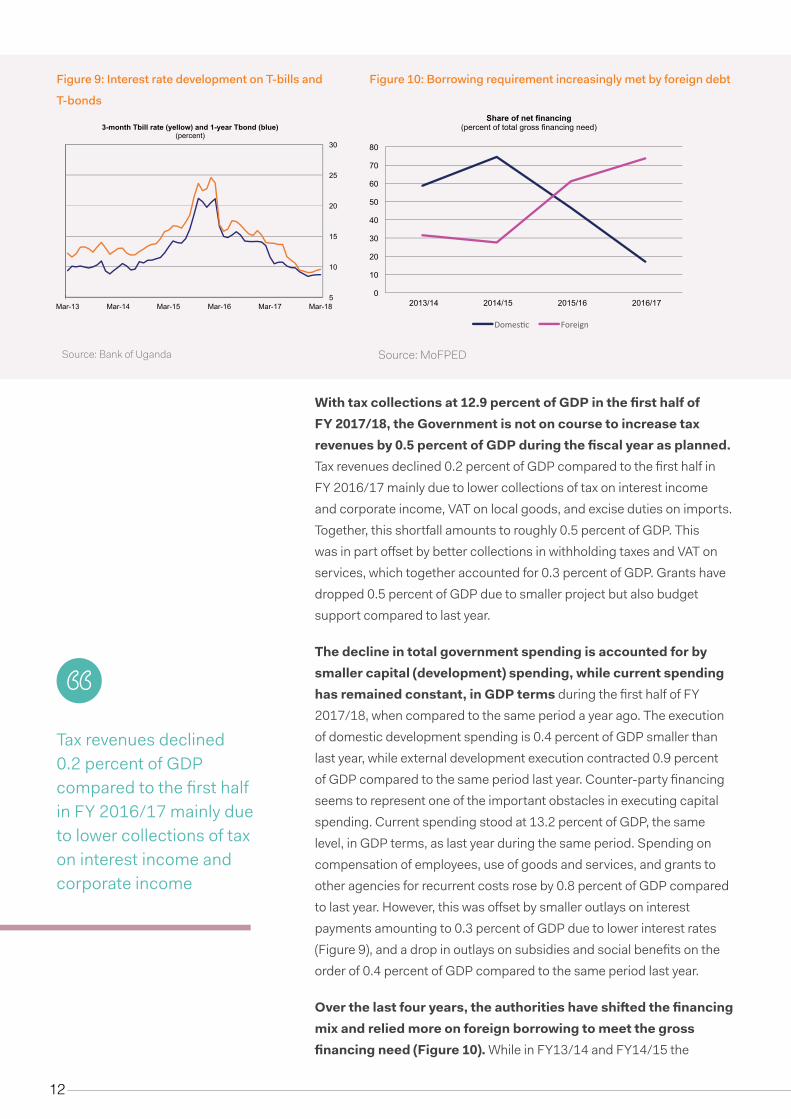
With tax collections at 12.9 percent of GDP in the first half of FY 2017/18, the Government is not on course to increase tax revenues by 0.5 percent of GDP during the fiscal year as planned. Tax revenues declined 0.2 percent of GDP compared to the first half in FY 2016/17 mainly due to lower collections of tax on interest income and corporate income, VAT on local goods, and excise duties on imports. Together, this shortfall amounts to roughly 0.5 percent of GDP. This was in part offset by better collections in withholding taxes and VAT on services, which together accounted for 0.3 percent of GDP. Grants have dropped 0.5 percent of GDP due to smaller project but also budget support compared to last year.
The decline in total government spending is accounted for by smaller capital (development) spending, while current spending has remained constant, in GDP terms during the first half of FY 2017/18, when compared to the same period a year ago. The execution of domestic development spending is 0.4 percent of GDP smaller than last year, while external development execution contracted 0.9 percent of GDP compared to the same period last year. Counter-party financing seems to represent one of the important obstacles in executing capital spending. Current spending stood at 13.2 percent of GDP, the same level, in GDP terms, as last year during the same period. Spending on compensation of employees, use of goods and services, and grants to other agencies for recurrent costs rose by 0.8 percent of GDP compared to last year. However, this was offset by smaller outlays on interest payments amounting to 0.3 percent of GDP due to lower interest rates (Figure 9), and a drop in outlays on subsidies and social benefits on the order of 0.4 percent of GDP compared to the same period last year.
Over the last four years, the authorities have shifted the financing mix and relied more on foreign borrowing to meet the gross financing need (Figure 10). While in FY13/14 and FY14/15 the
Figure 9: Interest rate development on T-bills and
T-bonds
Source: Bank of Uganda Source: MoFPED
Figure 10: Borrowing requirement increasingly met by foreign debt
Tax revenues declined 0.2 percent of GDP compared to the first half in FY 2016/17 mainly due to lower collections of tax on interest income and corporate income
12

Government met between 60 and 70 percent of its gross financing need through domestic net issuances, this share fell in FY 2016/17 to below 20 percent. In the first half of FY 2017/18, net domestic financing from commercial banks and the non-bank sector stood at 0.4 percent of GDP, while Bank of Uganda net financed 0.2 percent of GDP. This implies net financing of 0.6 percent of GDP in the domestic debt market. In parallel, the stock of arrears to domestic suppliers verified by the Accountant General’s Office grew by about 0.3 percentage points to 2.8 percent of GDP in December 2017 compared to a year ago (Figure 11).10 Net external financing rose to 3.9 percent of GDP in the first half of FY 2017/18, which is 0.6 percent of GDP more than during the same period last year.
External public debt stood at 40 percent of GDP at the end of 2017. The shift in the financing mix resulted in faster growth of external public debt, while domestic debt stabilized, in GDP terms (Figure 12). External public debt almost doubled since FY11/12, from 14 to 26 percent of GDP in FY 2016/17, while domestic debt stabilized at 14 percent of GDP. However, most of the loans in the Government portfolio are on concessional terms, with long grace periods and long maturities. Therefore, in present value terms, a measure that considers the favorable financing terms in the Government loan portfolio, external public debt amounts to 15 percent of GDP, as opposed to 26 percent of GDP in nominal terms. At the same time, the average term to maturity in Uganda, like in most Sub-Saharan countries, is rather short at 3.7 years, which results in elevated rollover risks, also called refinancing risks, and re-fixing risks as close to 40 percent of the domestic debt stock will come due in 2018 (Figure 13). In other words, if there is a negative shock, for example another episode of dry weather, and inflation accelerates to double digits, then government borrowing will suddenly become more expensive in the domestic market, and larger interest payments on domestic debt will reduce the fiscal space. 10 Thestockofarrearsisofficiallyproducedattheendofeveryfiscalyear,whilehalfyearoutcomesare
intermediateestimatesandshouldnotnecessarilybecomparedwithend-FYfigures.Weusethemhereasrough indicators in which direction arrears are moving.
Figure.11:.Stock.of.verified.arrears Figure 12: Evolution of total public debt
Source:MoFPED,AccountantGeneralOffice Source: MoFPED and WB-IMF Debt Sustainability Analysis
The shift in the financing mix resulted in faster growth of external public debt, while domestic debt stabilized, in GDP term
1415 16
1922
25
Money – Uganda’s lower denomination coins.(World.Bank.Sheila.Kulubya,.2017)
13

Figure.13:.Principal.repayment.profile
Source: MoFPED
Government must have a fiscal rule in place to avoid overheating pressures and boom-and-busts cycles seen in other oil exporting countries in Sub-Saharan Africa
Despite sizable fiscal gross financing needs averaging 11.5 percent of GDP over the past five years, Uganda’s external risk of debt distress remains low, based on the 2017 Debt Sustainability Analysis (DSA). The overall risk of debt distress rating continues to be low once domestic debt is added to the assessment. Since 2012, external public debt has risen around 12 percent of GDP driven by a scale-up in public investment, mainly in hydro-power. The latter is almost completed, but infrastructure investment such as, for example, energy/transmission projects, the planned refinery and pipeline to Tanzania, are expected to drive external public debt to roughly 31 percent of GDP over the medium term.
Uganda’s external debt development appears sustainable, but should be closely monitored and fiscal rules put in place to ensure it remains sustainable. From 2012 to 2017, Uganda’s debt-to-GDP trajectory lies below the trajectories of the other three peer countries such as Kenya, Tanzania, and Rwanda (Figures 14 and 15). Rwanda and Kenya have a larger external and overall public debt burden, compared to Uganda, whereas Tanzania exhibits a similar debt trajectory. In Uganda, the outstanding heavy investment agenda, once implemented, is expected to result in faster growth in debt than in real GDP. Infrastructure spending, in predominantly oil-related investments, is therefore likely to result in an upward debt trajectory until oil exports take off. From that point, it is expected that the debt-to-GDP will fall sharply, but for that to happen the Government must have a fiscal rule in place to avoid overheating pressures and boom-and-busts cycles seen in other oil exporting countries in Sub-Saharan Africa.
(in millions of UGX)
Money – Uganda’s currency notes (Bank.of.Uganda,.2016)
14

The narrow export base in Uganda and export volatility are the most pronounced vulnerabilities to debt sustainability (Figure 16). Export volatility affects adversely the ability to generate foreign exchange needed to repay the increasing external debt service burden, that is interest and amortization payments in foreign currency. This volatility is caused by export revenues heavily influenced by movements in only a few commodity prices and/or circumstances that affect the production volumes. For instance, weather can have a significant impact on the exports because one-third of the export base represents agricultural products. With limited irrigation or water conservation infrastructure, export revenues and therefore foreign exchange inflows will in large part be a function of the volatility observed in weather patterns, and infestations. Hence, simulating a shock in the first two projection years that resembles a reduction in exports seen in the past results in a sharp increase in the debt-to-exports trajectory as the denominator (exports) falls and the Government borrows to import food (the numerator increases). However, with a take-off in oil exports around 2023, external public debt is expected to decline sharply thereafter.
Source: WB-MF Debt Sustainability Analyses
Figure.15:.Total.public.debt,.nominal.(in.percent.GDP)
Source: WB-MF Debt Sustainability Analyses
Figure.14:.External.public.debt,.nominal.(in.percent.GDP)
Source: WB-MF Debt Sustainability Analyses
Figure 16: Vulnerabilities of debt sustainability
The overall risk of debt distress rating continues to be low once domestic debt is added to the assessment
Uganda.Stock.Exchange.in.action,.Kampala..(Bank.of.Uganda,.2016)
15

2.1 Stronger real GDP growth expected from increased public investment and agriculture output
Real GDP is expected to grow close to 5.5 percent in FY2017/18, and.could.rise.further.to.6.percent.in.FY.2018/19,.barring.adverse.weather.conditions.and.continued.inefficiencies.in.the.execution.of.capital.spending..This.outlook.is.premised.on.improved.food.supply,.which.in.turn.assumes.favorable.weather.conditions..It.is.also.premised.on.foreign.demand.that.would.support.further.increase.in.exports..Imports.are.expected.to.continue.rising.driven.by.stronger.economic.growth.and.because.of.higher.project-related.government.imports,.should.better.execution.of.capital.spending.materialize..Better.macroeconomic.conditions.should.also.be.conducive.to.a.rise.in.credit.to.the.private.sector,.and.result.in.higher.growth.in.private.consumption..The.increase.in.private.consumption.and.public.investment.would.widen.the.current.account.deficit.to.around 5 percent of GDP in FY 2017/18, and close 6 percent in.FY.2018/19,.as.the.Government.continues.finalizing.the.construction.of.dams,.and.accelerates.building.the.road.network,.including.for.oil-purposes.in.the.western.region..Investment.in.the.refinery.and.pipeline.to.Tanzania.is.likely.to.be.delayed.
After years of good progress, the tax-to-GDP ratio is unlikely to grow in FY 2017/18 compared to last year. Thus, the Government will not be able to meet the 0.5 percentage point increase in the tax-to-GDP ratio as mandated by the Charter of Fiscal Responsibility. The Government has recognized that it is unlikely to achieve this target, and has revised revising the nominal cash target for FY 2017/18 from Ush 16.7 to 15.9 trillion. At the same time, the execution of development expenditure continues to underperform, and is likely to be well below target. The delays in the execution of capital spending are likely to weaken the growth outlook. The overall fiscal deficit, including the repayment of arrears, could widen from last year’s 3.9 percent of GDP (FY 2016/17) to around 4.5 percent in FY 2017/18. However, this is still below the deficit of 6.2 percent of GDP presented in the National Budget Framework Paper. In the context of current developments, the stock of verified arrears could exceed 3.5 percent of GDP by the end of FY 2017/18, compared to 3.2 percent recorded at the end of FY 2016/17. Underperforming tax collections and the overall low tax-to-GDP ratio highlights the urgency of implementing the next generation of tax reforms. Larger tax revenues would not only create fiscal space for social spending and safeguard debt sustainability,
02 ECONOMIC OUTLOOK AND RISKS
Women workers in a stone quarry in outskirts of.Kampala.(Artfield.Graphics.2017)
16
but would also unlock counter-party financing that often causes delays in capital expenditures. The special topic section describes the context of these reforms, and presents policy recommendations.
In the 2018/19 Budget Framework, the Government envisages a fiscal deficit of 5.4 percent. The Isimba dam could be completed by early 2019, while the Karuma dam may take a few more years before commencing operations. Whether the Government’s envisaged deficit target will be achieved depends on the interaction between wage bill increases included in the FY 2018/19 budget and the execution of capital expenditures. spending that depends on the implementation of the oil-related road network in the western region, among others. Decisions related to pipeline modalities were planned to be announced by the end of June 2018, and those related to the refinery by end-June 2019. Delays are, however, likely, which would push these large capital investments to the outer years.
The Government recognizes the major challenges it faces, including the low revenue-to-GDP ratio and poor planning and budgeting. The buildup of arrears is the result of court awards and delayed payments to the private sector, which reflects weaknesses in public financial management. Finally, the Government sees low budget absorption for infrastructure projects as the consequence of the delayed acquisition of right of way for projects and lengthy procurement processes.
Barring severe unexpected shocks, the recovery in agricultural output will help the country return to a poverty reducing path again. However, such a path also requires modernizing agricultural production, and increasing the share of employment in and value added of non-agricultural activities (see Box 1). The focus should also be on addressing the vulnerability of households to weather and other unexpected shocks, reducing regional inequalities, ensuring universal access to all basic services, and reducing gender discrimination.
2.2 Risks remain tilted to the downside
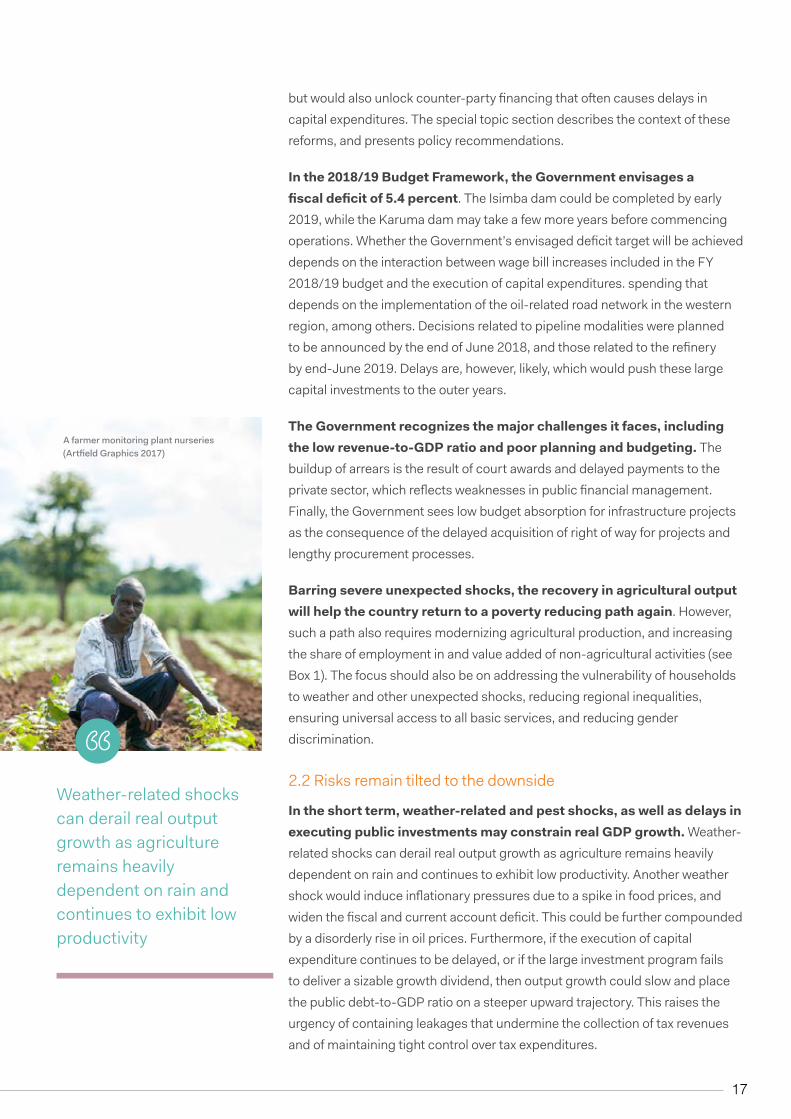
In the short term, weather-related and pest shocks, as well as delays in executing public investments may constrain real GDP growth. Weather-related shocks can derail real output growth as agriculture remains heavily dependent on rain and continues to exhibit low productivity. Another weather shock would induce inflationary pressures due to a spike in food prices, and widen the fiscal and current account deficit. This could be further compounded by a disorderly rise in oil prices. Furthermore, if the execution of capital expenditure continues to be delayed, or if the large investment program fails to deliver a sizable growth dividend, then output growth could slow and place the public debt-to-GDP ratio on a steeper upward trajectory. This raises the urgency of containing leakages that undermine the collection of tax revenues and of maintaining tight control over tax expenditures.
Weather-related shocks can derail real output growth as agriculture remains heavily dependent on rain and continues to exhibit low productivity
A farmer monitoring plant nurseries (Artfield.Graphics.2017)
17

Regional instability could undermine exports. South Sudan and the Democratic Republic of Congo (DRC) are Uganda’s 2nd and 4th most significant export destinations. Intensified conflicts in these countries would have a negative impact on Uganda’s exports, which in turn would also have negative implications for Uganda’s current account and debt sustainability. The influx of refugees from South Sudan and DRC could place pressure on local service delivery systems and result in increased inter-communal tensions. However, it could also provide an economic stimulus, as refugee savings are spent and new businesses established.
Box 1. Structural policies required to raise productivity in agriculture
Uganda’s agriculture potential is high, yet it remains unexploited. Uganda has diverse agro-ecological zones, comparably low temperature variability, and two rainy seasons in most parts of the country. However, this potential is not tapped for many reasons.
Ugandan agriculture exhibits low levels of technology and input adaptation. While agriculture commercialization has become the centerpiece of the sector priorities and interventions anchored in the Agriculture Sector Strategic Plan (2015/16 – 2019/2020), Uganda has one of the lowest adoption levels of improved seeds, inputs, mechanized traction, and productivity enhancing land management practices. Also, mechanization of agriculture is low in Uganda, and many small farmers cannot afford the necessary technologies and agricultural equipment. A leasing law is in preparation, which could promote leasing among stakeholders and facilitate private investment in the industry. Low quality seeds are prevalent, which significantly lowers returns, as only 13 percent of the crop area is planted with improved seeds. Other reasons for low technology adoption and commercialization levels are the weak regulatory measures and poor-quality control systems. Thus, delays in enacting changes to seed and fertilizer policy, as well as regulation capacity, dampen the productivity of the sector.
Uganda ranks amongst the lowest in the world in terms of fertilizer use. Only 2 percent of farmers use inorganic fertilizer, and its use remains concentrated on a few larger farms where cash crops are grown. No secondary regulations exist for detailing the four principal laws governing agricultural inputs (i.e. Seeds and Plant Act 2006, Agricultural Chemicals Act 2007, Plant Variety Protection Act 2014, Plant Protection and Health Act 2015).
Finally, it is estimated that over 30 percent of agricultural produce is lost due to the absence of storage facilities. Farmers often have no option than to sell their produce when prices are low. Efforts to develop a Warehouse Receipt System (and associated warehouse receipt policy) need to be pursued, along with interventions to facilitate low cost storage options at the individual farmer and farmer group levels. 2.3 Improving domestic tax revenues will create fiscal space for infrastructure investment and slow the build-up of public debt
Uganda’s external debt development appears sustainable, but should be closely monitored and fiscal rules put in place to ensure it remains sustainable
18

2.3 Improving domestic revenues will create fiscal space for infrastructure investment and social safety spending, and safeguard debt sustainability
Lack of progress in tax collections demonstrate the fragility of improvement made over the past years. To raise the tax-to-GDP ratio, a fundamental shift in attitudes towards taxation is needed to improve the tax system’s productivity. This would require a broadening of the tax base and reducing the revenue leakage from tax exemptions.
Economies with similar characteristics as Uganda indicate a potential to collect revenues of between 18 and 23 percent of GDP. This revenue potential stands in stark contrast to the current reality of tax collections on the order of 14 percent of GDP.
Uganda needs a revenue strategy to finance much-needed increases in expenditures that will help promote economic growth, safeguard fiscal sustainability, and enhance social spending. The development strategy is premised on a significant boost to capital expenditure, which should have the potential to support stronger macroeconomic growth over the medium term. At the same time, larger interest payments on public debt need to be accommodated within a relatively tight envelope for recurrent spending. This could crowd out spending in other areas, including health and education. Finally, a larger revenue envelop would help reduce the pace of borrowing and stabilize the debt-to-GDP trajectory.
The prospective oil revenues raise further the urgency of strengthening tax revenues. Over the next four to six years, Uganda is expected to start generating sizable oil revenues that could peak at 3 percent of GDP per annum in the longer term. Experience from other resource-rich countries suggests that the Government must establish a robust non-resource revenue base oil before revenues come on stream, given the negative relationship between resource revenues and domestic non-resource revenues, including from major taxes.
Considering the wide-ranging benefits of raising tax revenues, and the urgency of these reforms, the following special topic discusses tax policy and tax administration options, and recommends reforms that could put the tax-to-GDP ratio on an upward trajectory, so it can reach its potential.
Improving domestic revenues will create fiscal space for infrastructure investment and social safety spending, and safeguard debt sustainability.
19

PART 2Uganda must raise more domestic
revenues to meet development needs
A Mutuma Commercial Agencies factory worker packs.goods.for.the.market.(World.Bank./.Morgan.Mbabazi,.2013)
20

Over.the.five-year.period.to.FY.2016/17,.revenue.collection.performance.in.Uganda.improved.and.the.ratio.of.revenue-to-GDP.increased.to.nearly.14.percent.of.GDP..This.performance.is.better.than.in.earlier.periods,.where.the.ratio.stagnated.at.around.12.percent.of.GDP..However,.it.was.still.below.regional.peers’.and.the.Government.of.Uganda’s own target of 16 percent of GDP. In the period from 1993 to 2013, the tax-to-GDP ratio grew by an average annual rate of 0.2 percentage points, with the ratio of collected taxes to GDP increasing from 7.6 percent to 11.6 percent (see Figure 16a). The value of non-tax revenues amounts to an additional 0.2 percentage points of GDP. In the five years to FY 2016/17, revenue collection performance improved as a result of new policy initiatives to expand the tax net; to collect non-tax revenues more effectively; and to achieve higher rates of compliance. With these measures, the ratio of domestic revenues to GDP increased to about 14.0 percent, with taxes alone constituting around 13.8 percent11. However, more recently, there have been significant shortfalls in revenue collections, largely due to a failure to sustain progress towards reducing tax expenditures12. In FY 2017/18, the total value of collected revenues is projected to reach 13.5 percent of GDP. In these terms, Uganda is lagging behind regional peers, with the tax-to-GDP ratio in Kenya standing at about 18 percent in 2016; in Rwanda at about 16 percent; and in Tanzania at about 14.5 percent. Overall, Uganda’s ratio is lower than the average for the COMESA and the Sub-Saharan region more generally (see Figure 16).
UGANDA’S DOMESTIC REVENUE EFFORT IS NOT MATCHING ITS GOOD ECONOMIC PERFORMANCE
03
11.Staffcomputations.BasedonGDPdatafromUBOSandRevenueDatafromMinistryofFinance,Planning & Economic Development.
12. Tax expenditures represent the cost to the economy resulting from exemptions, deviations or concessionsfromaregulartax(VAT,CITorExcise)system,irrespectiveoftheobjectivefortheexception.
21

Research has demonstrated that countries that achieve tax-to-GDP ratios in excess of 12.75 percent are significantly more likely to experience strong GDP growth due to the productivity gains associated with better public service delivery. With Uganda’s tax-to-GDP ratio standing at 13.8 percent in FY2016/17, it could be in a position to reap these benefits.
Figure 16: Uganda’s tax revenues in comparison to potential and peers
Figure 16a. Uganda Tax Revenue, 1993-2015 (% of GDP)Figure 16b. Uganda trailing most COMESA countries’ Tax Revenue (% of GDP), 2015
Sources:UBOS,URAandstaffestimatesforFigure16a.ICTDdatabaseforFigure16b)
Countries that fail to mobilize domestic revenues effectively are likely to face significant challenges in providing basic services; achieving sustainable fiscal balances; and keeping the public debt trajectory on a sustainable path. Thus, the Word Bank places great importance on the effectiveness of a country’s mobilization of domestic revenues, setting a minimum threshold level for the ratio of domestic revenues to GDP of 15 percent for IDA countries, with an understanding that countries that fall below this threshold are likely to face challenges in financing basic state functions.13 Other research has demonstrated that countries that achieve tax-to-GDP ratios in excess of 12.75 percent are significantly more likely to experience strong GDP growth due to the productivity gains associated with better public service delivery.14 With Uganda’s tax-to-GDP ratio standing at 13.8 percent in FY2016/17, it could be in a position to reap these benefits. However, with Uganda’s rapidly increasing population and the challenges it faces in terms of delivering public services, such as education, health and infrastructure, of the appropriate quality and in sufficient quantity, it needs to intensify its revenue collection efforts.
While Uganda has implemented a wide range of reforms to its revenue policies and administration over the past 20 to 25 years, it must now intensify efforts to improve its performance still further. During the 1990s, the Government implemented a number of significant reforms, including the establishment of the URA in 1991; the introduction of VAT in 1996; and the reform of the income tax regime in 1997. These reforms contributed to an increase in the tax-to-GDP ratio from 6 percent in 1990
13.WorldBankGroup,IMF,OECD,UN(2016);EnhancingtheEffectivenessofExternalSupportinBuildingTaxCapacity in Developing Countries
14. Gaspar V., L. Jaramillo, & P. Wingender (2016); IMF Bulletin; Volume 17, Number 4; “Tax Capacity and Growth: Is There a Tipping Point?”
0
5
10
15
20
25 SychellesSwazilandDjibouti
ZimbabweMauritius
ZambiaKenya
COMESAMalawi
RwandaEthiopiaBurundiUganda
ComorosEgypt
MadagascarSudan
0 5 10 15 20 25 30 35
15.9
11.7
22

to around 10.5 percent in 1999. In 2005, the Common External Tariff (CET) under the EAC Customs Union was adopted, and the URA was restructured along functional lines. By 2009, large and medium-sized taxpayer offices were established and the ASYCUDA World customs system was introduced. By 2012, the e-Tax system was introduced to systematize and standardize tax processes. Therefore, overall, Uganda’s tax system is modern and its policy instrument design meets international legal standards, at least on paper. However, it is estimated that Uganda is still only partially fulfilling its potential in terms of collecting revenues. Uganda’s potential15 in this area was estimated to lie in the range of 18 to 23 percent of GDP in the period from 1997 to 2015.16 This estimate indicates the boundaries within which technical and political discussions could take place with respect to how much revenue Government should aim to collect. Therefore, a renewed effort is required to close the gap between the country’s tax effort and its potential over the medium to longer term, and to minimize the gap between tax revenues and increasing and sustained demands for service delivery and infrastructure.
With the Government formulating a new strategy to intensify its revenue collection efforts, this is an appropriate time to assess the successes and failures of the past to determine a path into the future. Over the past few years, Uganda set the medium-term revenue-to-GDP target at 16 percent, with collected revenue to increase by an annual value equivalent to about 0.5 percentage points.17 Despite the targets, actual revenue collections have increased by an average annual rate of only 0.2 percentage points over the past two decades. A new medium-term revenue mobilization strategy (DRM-S) is currently under preparation and will play a critical role in addressing the gap. It provides an opportunity for Uganda to reboot its efforts to increase its revenues and to improve the manner in which these revenues are raised to ensure they are consistent with the achievement of the overall objectives of growth and equity. Efficient domestic revenue mobilization, combined with the efficient use of the resources is essential also for strengthening the social contract between the Ugandan government and her citizens.
15. Tax potential was estimated as the maximum level of tax revenues that Uganda could collect given a set of economic, social, demographic and institutional factors. The analysis based on a stochastic frontier modelling, used a panel data set for 175 countries over the period 1996-2015, for which the estimates for potential revenues were in the range of 18 to 23 percent of GDP.
16. Earlier estimates using a similar approach done by the IMF (Fenochietto and Pessino, 2010, 2013) but over the period 2000-2013 for 113 countries put Uganda’s revenue potential at about 20 percent of GDP by 2013. However, Langford and Ohlenburg (2016), who employed the approach over a longer time frame between 1984 and 2010, suggested that Uganda’s potential could rise to between 22 and 26 percent of its GDP.
17.SeeGovernmentofUganda’sNationalDevelopmentPlanIIfromwww://npa.go.ug.
Over.the.past.few.years,.Uganda.set.the.medium-term.revenue-to-GDP target at
16%
0.5%
with.collected.revenue.to.increase by an annual value equivalent to about
per year
A.busy.section.of.Northern.Bypass,.Kampala.(World.Bank,.Sarah.Farhart,.2015)
23

VAT.has.accounted.for.a.third.of.the.total.value.of.collected.revenues,.with.the.total.value.of.collected.VAT amounting to 4 percent of GDP in 2016
In this context, the special topic in this Economic Update focusses on how Uganda can increase its revenues through reforms to tax policy and administration in the short to medium term. The subsequent sections analyze Uganda’s achievements and the challenges it faces within the evolving economic structure; the distortions in the policy environment that reduce the effectiveness and productivity of the tax instruments; and the weaknesses in the revenue administration system, all of which need to be addressed for Uganda to collect increased tax revenues. More efficient taxation and the improved management and administration of the tax regimes are the means to improve revenue mobilization, as has been clearly demonstrated by the experience of many low- and middle-income countries.
Tax.revenues.account.for.the.largest.proportion.of.Uganda’s.domestic.revenues,.with.these.revenues.derived.from.a.range.of.different.types.of.taxes,.of.which.VAT.is.the.most.important.(see.Figure.17).On.average,.VAT.has.accounted.for.around.a.third.of.the.total.value.of.collected.revenues,.with.the.total.value.of.collected.VAT.amounting.to.4 percent of GDP in 2016.
Of the total value of VAT, about 40 percent is collected from taxes on the domestic supply of goods and services, with the remaining 60 percent being derived from imports. The second most important source of domestic revenues is derived from duty on imports, which has accounted for an average of 23 percent of the total value of domestic revenues over the past decade. Up to 60 percent of revenues from this category is derived from duties imposed on petroleum products. Pay-As-You Earn (PAYE) on employment income is also an increasingly important source of revenue, contributing to an average of about 16.5 percent of the total, followed by excise duty (9.4 percent) and corporate income tax (7.5 percent). Overall, domestic taxes are making an increasingly significant contribution, with this contribution increasing from 47 to 56 percent of the total over the decade, driven by the increased contribution from VAT on domestic goods and decreasing contribution from trade taxes.
04 POLICY DISCRETION AND INFORMALITY ARE CONSTRAINING EXPANSION OF THE REVENUE BASE
Kampala.city.(World.Bank./.Morgan.Mbabazi,.2016)
24
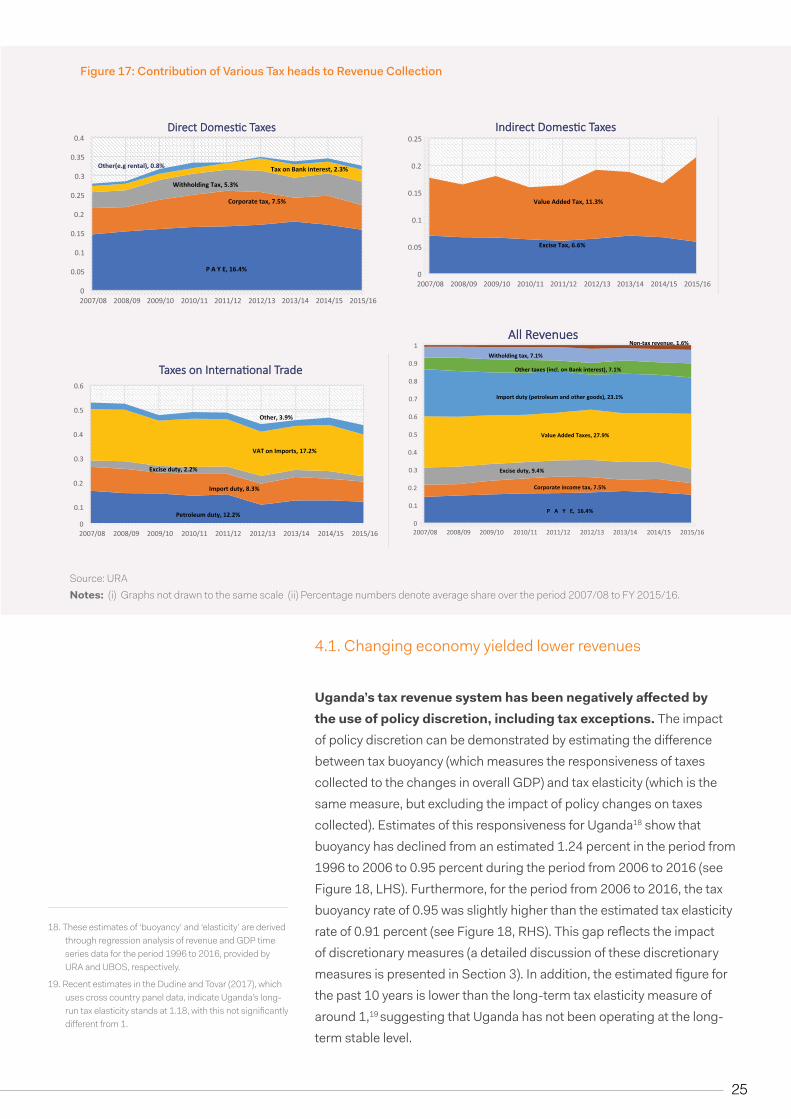
4.1. Changing economy yielded lower revenues
Uganda’s tax revenue system has been negatively affected by the use of policy discretion, including tax exceptions. The impact of policy discretion can be demonstrated by estimating the difference between tax buoyancy (which measures the responsiveness of taxes collected to the changes in overall GDP) and tax elasticity (which is the same measure, but excluding the impact of policy changes on taxes collected). Estimates of this responsiveness for Uganda18 show that buoyancy has declined from an estimated 1.24 percent in the period from 1996 to 2006 to 0.95 percent during the period from 2006 to 2016 (see Figure 18, LHS). Furthermore, for the period from 2006 to 2016, the tax buoyancy rate of 0.95 was slightly higher than the estimated tax elasticity rate of 0.91 percent (see Figure 18, RHS). This gap reflects the impact of discretionary measures (a detailed discussion of these discretionary measures is presented in Section 3). In addition, the estimated figure for the past 10 years is lower than the long-term tax elasticity measure of around 1,19 suggesting that Uganda has not been operating at the long-term stable level.
Figure.17:.Contribution.of.Various.Tax.heads.to.Revenue.Collection.
Source: URA Notes: (i)Graphsnotdrawntothesamescale(ii)Percentagenumbersdenoteaverageshareovertheperiod2007/08toFY2015/16.
18. These estimates of ‘buoyancy’ and ‘elasticity’ are derived through regression analysis of revenue and GDP time series data for the period 1996 to 2016, provided by URA and UBOS, respectively.
19. Recent estimates in the Dudine and Tovar (2017), which uses cross country panel data, indicate Uganda’s long-runtaxelasticitystandsat1.18,withthisnotsignificantlydifferentfrom1.
25
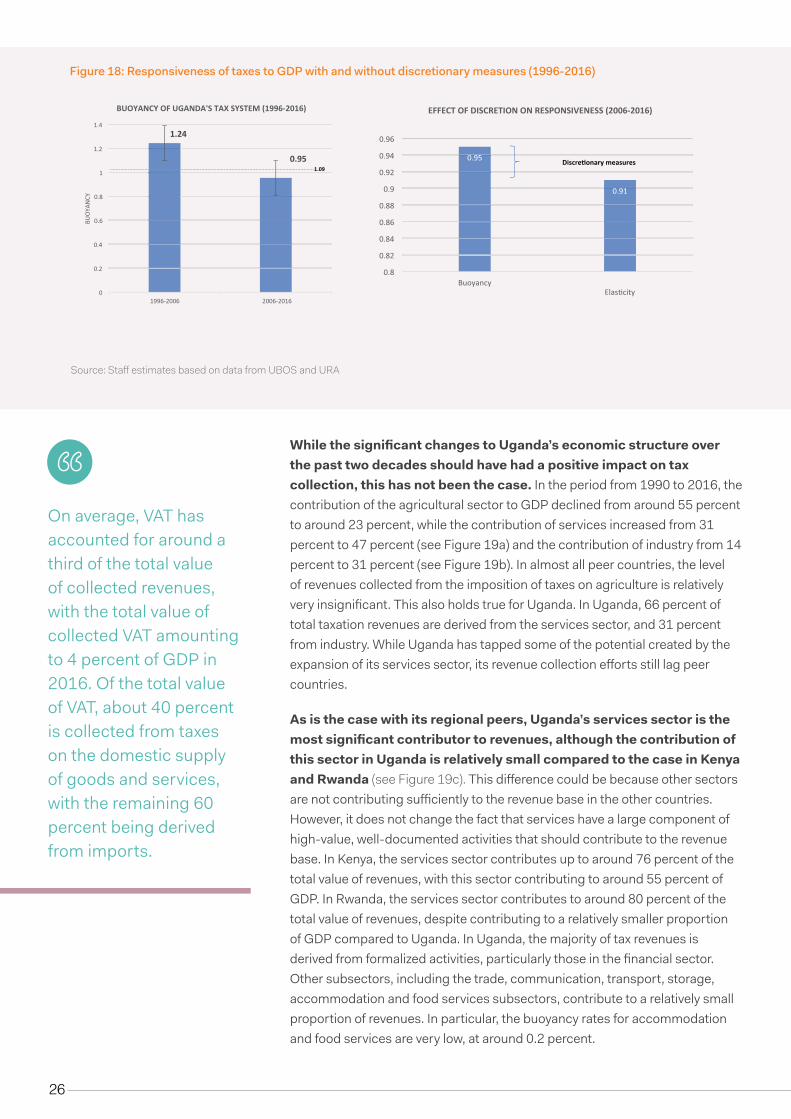
Source:StaffestimatesbasedondatafromUBOSandURA
Figure.18:.Responsiveness.of.taxes.to.GDP.with.and.without.discretionary.measures.(1996-2016).
While the significant changes to Uganda’s economic structure over the past two decades should have had a positive impact on tax collection, this has not been the case. In the period from 1990 to 2016, the contribution of the agricultural sector to GDP declined from around 55 percent to around 23 percent, while the contribution of services increased from 31 percent to 47 percent (see Figure 19a) and the contribution of industry from 14 percent to 31 percent (see Figure 19b). In almost all peer countries, the level of revenues collected from the imposition of taxes on agriculture is relatively very insignificant. This also holds true for Uganda. In Uganda, 66 percent of total taxation revenues are derived from the services sector, and 31 percent from industry. While Uganda has tapped some of the potential created by the expansion of its services sector, its revenue collection efforts still lag peer countries.
As is the case with its regional peers, Uganda’s services sector is the most significant contributor to revenues, although the contribution of this sector in Uganda is relatively small compared to the case in Kenya and Rwanda (see Figure 19c). This difference could be because other sectors are not contributing sufficiently to the revenue base in the other countries. However, it does not change the fact that services have a large component of high-value, well-documented activities that should contribute to the revenue base. In Kenya, the services sector contributes up to around 76 percent of the total value of revenues, with this sector contributing to around 55 percent of GDP. In Rwanda, the services sector contributes to around 80 percent of the total value of revenues, despite contributing to a relatively smaller proportion of GDP compared to Uganda. In Uganda, the majority of tax revenues is derived from formalized activities, particularly those in the financial sector. Other subsectors, including the trade, communication, transport, storage, accommodation and food services subsectors, contribute to a relatively small proportion of revenues. In particular, the buoyancy rates for accommodation and food services are very low, at around 0.2 percent.
On average, VAT has accounted for around a third of the total value of collected revenues, with the total value of collected VAT amounting to 4 percent of GDP in 2016. Of the total value of VAT, about 40 percent is collected from taxes on the domestic supply of goods and services, with the remaining 60 percent being derived from imports.
1.24
0.95
26

The vibrant information and communications sector is also characterized by a remarkably low buoyancy rate, suggesting that a significant proportion of activities within this sector are not taxed effectively. There are three possible explanations for this. First, it could be related to the nature of ICT company value chains, which are characterized by the outsourcing of services (labor, towers, etc.) and the use of a wide range of distribution networks. Second, it could be related to changing consumption patterns for telecom services from voice to data and Over the Top (OTT) services, which may not be captured adequately in the tax base.20 OTT service providers21 are not regulated by the Uganda Communications Commission (UCC), with this lack of regulation enabling them to provide messaging and voice services at low fees or without charge to clients. Consumers purchase goods and services from global OTT operators, not local operators, who would be obliged to pay taxes in the countries in which they are domiciled.22 Third, systems for the effective taxation of the telecommunications sector are difficult to design and implement, especially considering the rapidly evolving tax base. In sum, the evolution of electronic media has been characterized by the use of
Source:URA:FigurescompiledfromdatafromRevenueAuthoritiesforrespectivecountriesandStatisticsOffices
Figure 19: Evolution in GDP and revenue by Economic Activity
20. The existing excise duty base for voice communication is on airtime on mobile telephony and landlines (internet isnotsubjecttoexciseduty).Whencallersswitchfrom using normal mobile telephone or landline calls or messaging services to using VoIP technologies including messaging and voice calls on WhatsApp or similar apps, the excise base is eroded to the extent that the use of OTT to make voice calls or send messages is notsubjecttoexciseduty.
21. Facebook, WhatsApp, Viber, Skype etc.
22. Countries like Pakistan and India are reviewing licensing frameworks and consider issuing licenses to OTT playersbeforetheycanoperateintheirjurisdictions.
19a. Agriculture 19b. Industry 19c. Services
Tea.harvest.in.Mubende..(World.Bank./.Morgan.Mbabazi,.2016)
27

Source: UBOS and URA data
Figure.20:.Buoyancy.of.taxes.to.GDP.growth.for.main.sectors.and.sub-sectors.of.GDP.(1999-2016)
Uganda’s economic transformation has been characterized by the proliferation of micro, small and medium enterprises (MSMEs), which exhibit low levels of productivity and high levels of informality.
technological innovations, outsourcing, multilayer value chains, and electronic commerce, all of which make it difficult to effectively tax the sector, as does the dynamic behavior of communication services users. Furthermore, most firms operating in this sector are multi-national companies that can avoid taxes using transfer pricing mechanisms, which makes the effective taxation of the sector even more challenging. Given these challenges, Uganda may need time to develop and adapt a tax framework that is most suited to the unique features of this sector. Until such a time Uganda develops the ability to regulate and license OTT service providers, the tax base from this stream is likely to continue to decline.
In Uganda, while the industrial sector contributes to a relatively high proportion of total revenues relative to regional peers, within this sector, the construction and mining sub-sectors do not contribute their expected share. The most significant proportion of taxes from Uganda’s industrial sector come from manufacturing (see Figure 20). By contrast, the buoyancy rate for the mining and construction subsectors is just as low as that of ICT. This is mainly because these subsectors are characterized by high levels of informality, with a lack of appropriate regulation and monitoring to integrate them into the tax base.
As is the case with regional peers, Uganda’s agricultural sector makes the least significant contribution to collected tax. This sector contributes to 23 percent of GDP, but to less than 1 percent of total revenues. This share is relatively low compared to the figure recorded in Kenya, which stands at 1.6 percent, with the contribution of Kenya’s agricultural sector to GDP also slightly higher, at 29 percent. Interestingly, the buoyancy rates for fishing and cash crops are relatively the lowest, with these figures indicating that growth in nominal GDP of 1 percent results in growth of tax revenues from this activity of below 0.2 percent.
23. The Income Tax Act exempts Micro taxpayers with turnovers below UGX 10 million. Flat presumptive taxes (varied depending on business trade and location) are charged on business with turnover ranges between UGX 10 million- 50 million. MSMEs with turnovers exceeding UGX 50 million, but less than UGX 150 million pay presumptive tax of 1.5 percent on gross turnover. The VAT threshold beyond which taxpayers are required to be on the VAT register is UGX 150 million.
28

Figure.21:.Informality.in.Uganda’s.Economy.(2013-2017)
Share of Informality by sector (percent)
Source: Uganda Bureau of Statistics
Across sectors, the high level of informality in Uganda has contributed significantly to the limited responsiveness of taxes to economic activity. According to UBOS, the informal sector contributes to about 45 percent of economic activity. Uganda’s economic transformation has been characterized by the proliferation of micro, small and medium enterprises (MSMEs), which exhibit low levels of productivity and high levels of informality. By 2010, Uganda’s MSMEs accounted for more than 85 percent of all non-agricultural enterprises, contributing to more than 75 percent of total value added in GDP and employment. Notwithstanding the MSME Tax regime,23 many of these firms are still hard to reach, as many conduct financial transactions in cash, making it easy for them to hide their economic activities from tax authorities. In addition, businesses are highly mobile, with services often delivered from no permanent address. Others operate without regulation and/or do not register with the appropriate authorities. Under these circumstances, a significant proportion of the formal sector’s transactions may involve transactions with informal firms, which leave no audit trails and hence most likely reduce the payment of taxes from firms in the formal sector. Within the services and industrial sectors, for example, such transactions may relate to real estate activities, accommodation and food services, transport, construction, water, and mining, a large proportion of which remain informal (see Figure 21).
4.2 Strategies to include informal firms and transactions in the revenue base
Measures.to.streamline.tax.policies.and.the.regulatory.environment.are.just.as.important.as.improving.administration..As an example, the MSME tax regime aims to reduce the tax burden on micro firms, and by doing so, to minimize both compliance and administration costs. URA has also made efforts to address informality by creating withholding tax regimes
23% of GDP
Uganda’s agricultural sector contributes to
97
65
53
46
22
96
36
88
66
Green.coffee.beans.(World.Bank./.Morgan.Mbabazi,.2016)
29

and collaborations with Kampala City Council Authority (KCCA), and the Uganda Registration Services Bureau (URSB) to identify tax payers. These efforts could be complemented with additional reforms in the following areas:
a. Tax the agriculture sector and rely on appropriate VAT and income thresholds to protect the poor, rather than through exemptions on the consumption side: Currently, the income tax law exempts income derived from agro-processing, and the VAT law exempts unprocessed foodstuffs, agricultural products and livestock. Exempting agriculture from taxation is justified in terms of equity concerns, with the stated goal being to provide support to small farmers. However, these exemptions also exclude large farmers and cattle breeders from the tax base, with the result being that in terms of absolute value, the level of support provided to large farmers significantly exceeds that provided to small farmers. This makes the stated justification for these exemptions unconvincing. As a possibly more equitable alternative, it might be appropriate to establish VAT and income thresholds in the agriculture sector to exempt small farmers from certain taxation requirements, while ensuring large farmers that produce significant values of cash crops or cattle are included in the tax base. Once big farmers are compliant with VAT requirements, those producing significant profits should also be subjected to corporate income tax. Thus, for the introduction of VAT in agriculture, a VAT threshold of UGX 150 million might be optimal, as this would ensure the inclusion of large farmers in the VAT base.
b. Strengthen the relationship between local governments and the URA to facilitate the collection of taxes. The participation of local governments in the identification of informal businesses and the assessment of their tax liability often leads to better results than if these processes are fully implemented by central authorities. For instance, the Single Business Permit (SBP) required by all businesses helps to improve the level of revenue collected from payments for public services and promotes political responsibility and improved accountability. The partnership between KCCA, URA, and the URSB code, known as the Tax Payer Register Expansion Project (TREP), is a great example of how partnerships between central government and local government entities can result in improved registration compliance by operators within informal sectors, facilitating an expansion of the tax register. However, beyond registration, initiatives to ensure declaration and payment compliance need to be in place to genuinely tap into the informal sector. Once the implementation challenges such as inadequate declaration and payments, non-compliance, have been overcome, these initiatives should be encouraged, strengthened, and rolled out countrywide using existing local government structures.
c. Create non-tax based incentives for compliance with tax requirements. The Government could establish systems to provide incentives for compliance. One example would involve encouraging small, informal actors to create synergies by working together through
A number of changes to the economic environment could have significant implications on the abilities of the Government to collect taxes. Efforts to increase formalization would facilitate the increased collection of taxes from businesses and individual income earners
30

participation in cooperatives and savings and credit unions, which are primarily intended to facilitate members’ production and marketing activities and access to credit, but which could also be used to enhance contributions to the tax system. Other measures that may be effective could involve measures to reduce the propensity to conduct transactions in cash, which is indicative of the size of the shadow economy. While these measures may be considered as financial reforms whose primary purpose is to deepen the financial sector, tax administrations in many countries (e.g. South Korea and Mexico) have worked with banks to issue points of sale through a combination of incentives (e.g. value-added tax cut) and legal obligations (e.g., requiring card acceptance by merchants of a certain size). In Uganda, use of telephone mobile money services, which facilitates financial inclusion, has created alternatives to cash transactions,24 and a possible trail for linking money flows to economic activity. This form of financial inclusion needs to be strengthened to reduce the use of cash in the economy.
d. Strengthen the relationship between local governments and the URA to facilitate the collection of taxes. The participation of local governments in the identification of informal businesses and the assessment of their tax liability often leads to better results than if these processes are fully implemented by central authorities. For instance, the Single Business Permit (SBP) required by all businesses helps to improve the level of revenue collected from payments for public services and promotes political responsibility and improved accountability. The partnership between KCCA, URA, and the URSB code, known as the Tax Payer Register Expansion Project (TREP), is a great example of how partnerships between central government and local government entities can result in improved registration compliance by operators within informal sectors, facilitating an expansion of the tax register. However, beyond registration, initiatives to ensure declaration and payment compliance need to be in place to genuinely tap into the informal sector. Once the implementation challenges have been overcome, such initiatives should be encouraged, strengthened, and rolled out countrywide using existing local government structures.
e. Explore other economic reforms that could support revenue mobilization. A number of changes to the economic environment could have significant implications on the abilities of the Government to collect taxes. In India, for example, when the government carried out a currency reform, it had the impact of attracting holders of cash into the banking system. While the main aim of this reform was to restore the value of the currency, it also indirectly supported revenue mobilization efforts, as it was also combined with a requirement to declare tax by filing returns.
These efforts to increase formalization would facilitate the increased collection of taxes from businesses and individual income earners by establishing a culture of compliance, promoting fairness and upholding the social contract.
24. According to BOU, by 2017, mobile money transactions had reached a value worth UGX 55 trillion, which is over 60 percent of GDP.
In Uganda, use of telephone mobile money services, which facilitates financial inclusion, has created alternatives to cash transactions, and a possible trail for linking money flows to economic activity. This form of financial inclusion needs to be strengthened to reduce the use of cash in the economy.
31

25. An assessment of the tax expenditures, to determine the revenues forgone, was undertaken in the report–“AssessingpotentialrevenuegapsinraisingdomesticrevenuesinUganda,2017”,jointlyprepared by the GOU and World Bank in 2017. The tax expenditures were computed using the “revenue foregone method”, following the ICAS guidelines. The estimate captures both discretionary incentives given by government and those automatically claimed by tax payers in their tax declarations, for the four main taxes (i.e. VAT, CIT, excise duty and Customs). The value of tax expenditures published by government on the Ministry of Finance, Planning and Economic Development website, estimated at about 3 percent of GDP), covers discretionary tax expenditures only. The benchmark against which tax expenditures are measured varies across countries, and for that reason, interpretation of estimations of level and composition of revenue forgone should be undertaken with caution. For that reason, the estimate in this report provides the range of 4-5% of revenue forgone.
If.Uganda.had.minimized.the.rate.at.which.it.provides.tax.reliefs,.it.could.have.achieved.a.tax-to-GDP.ratio.of.between.16.to.20.percent..In.FY.2016/17.alone,.the.value.of.revenues.forgone.due.to.exemptions.across all tax types was estimated to stand at around 4.0-5.0 percent of GDP.25..This.amount.included.forgone.revenues.from.domestic.VAT.amounting.to.2.5.percent.of.GDP;.from.the.CIT.system.to.1.0-2.0.percent.of.GDP;.from.excise.duty.to.0.43.percent.of.GDP;.and.from.the.proportion of non EAC duty exempt imports to 0.9 percent of GDP.
The tax exemptions under PIT are also significant, but have not yet been calculated in detail. In addition, tax compliance issues exacerbate the weak tax collection performance, with significant potential for fraudulent offset claims to VAT26 (2.7 percent of GDP).27 With the current tax-to-GDP ratio standing at around 13-14 percent, tax reforms designed to reduce tax reliefs; to close other tax policy gaps; and to strengthen tax administration, are all vitally necessary measures. This section highlights a range of issues signifying these policy distortions and the corresponding reform options.
5.1 Value Added Tax (VAT): Blocking Leakages arising from tax exemptions can improve VAT productivity
Accounted for on a cash basis, the value of collected VAT is estimated at 4 percent of GDP, a figure that still lags behind several key regional peers. Uganda’s VAT collection performance is still weaker than that of Kenya and Rwanda, where the value of collected VAT amounted to around 4.5 percent of GDP in both cases, at least until 2013, the last year for which data are available. At an average rate of about 20 percent over the past decade, Uganda’s VAT productivity28 is amongst the lowest in the East African Community (EAC), with Kenya recording a rate of 36 percent; Tanzania of 29 percent; and Rwanda of 23 percent.29
ADDRESSING POLICY DISTORTIONS CAN RAISE THE PRODUCTIVITY OF TAX INSTRUMENTS 05
In.Uganda,.the.practice.of zero-rating non-export.items.has.created.challenges.for.revenue.administration and collection,.with.some.taxpayers miss classifying standard-rated items to evade taxation obligations
Production.processes.at.Roofings.(U).Ltd.(World.Bank./.Morgan.Mbabazi,.2016)
32
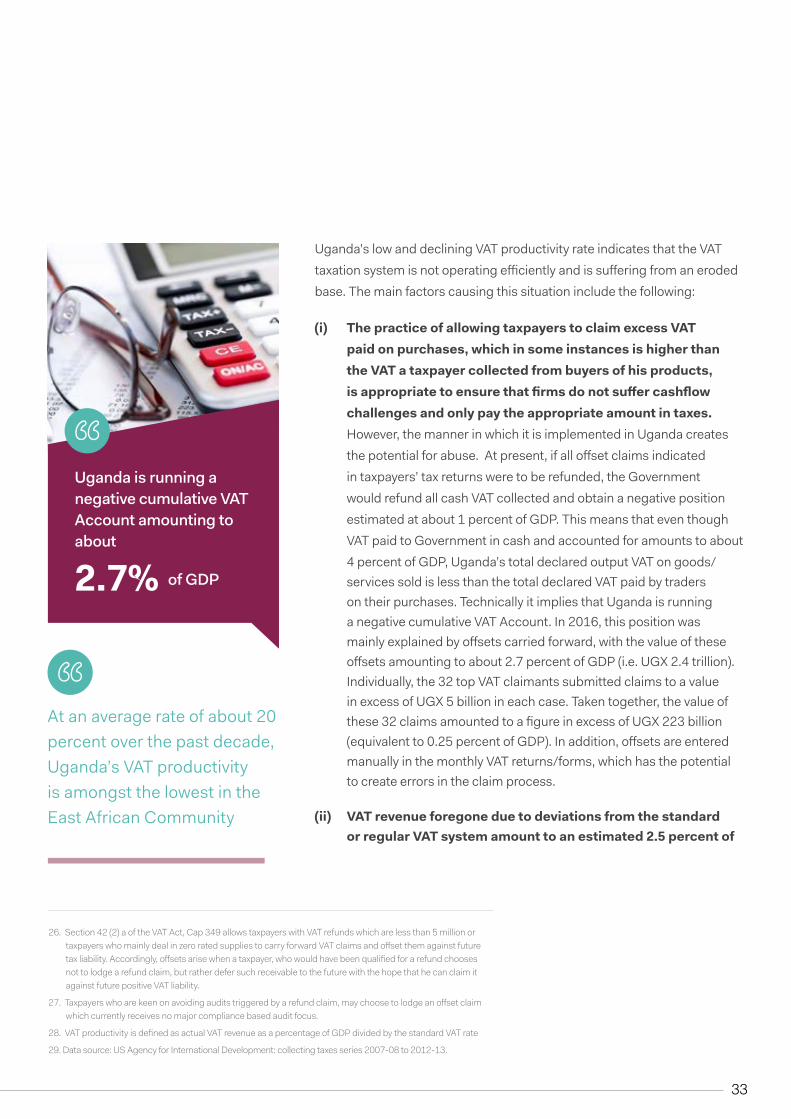
26. Section 42 (2) a of the VAT Act, Cap 349 allows taxpayers with VAT refunds which are less than 5 million or taxpayerswhomainlydealinzeroratedsuppliestocarryforwardVATclaimsandoffsetthemagainstfuturetaxliability.Accordingly,offsetsarisewhenataxpayer,whowouldhavebeenqualifiedforarefundchoosesnot to lodge a refund claim, but rather defer such receivable to the future with the hope that he can claim it against future positive VAT liability.
27.Taxpayerswhoarekeenonavoidingauditstriggeredbyarefundclaim,maychoosetolodgeanoffsetclaimwhichcurrentlyreceivesnomajorcompliancebasedauditfocus.
28.VATproductivityisdefinedasactualVATrevenueasapercentageofGDPdividedbythestandardVATrate
29. Data source: US Agency for International Development: collecting taxes series 2007-08 to 2012-13.
Uganda’s low and declining VAT productivity rate indicates that the VAT taxation system is not operating efficiently and is suffering from an eroded base. The main factors causing this situation include the following:
(i) The practice of allowing taxpayers to claim excess VAT paid on purchases, which in some instances is higher than the VAT a taxpayer collected from buyers of his products, is appropriate to ensure that firms do not suffer cashflow challenges and only pay the appropriate amount in taxes. However, the manner in which it is implemented in Uganda creates the potential for abuse. At present, if all offset claims indicated in taxpayers’ tax returns were to be refunded, the Government would refund all cash VAT collected and obtain a negative position estimated at about 1 percent of GDP. This means that even though VAT paid to Government in cash and accounted for amounts to about 4 percent of GDP, Uganda’s total declared output VAT on goods/services sold is less than the total declared VAT paid by traders on their purchases. Technically it implies that Uganda is running a negative cumulative VAT Account. In 2016, this position was mainly explained by offsets carried forward, with the value of these offsets amounting to about 2.7 percent of GDP (i.e. UGX 2.4 trillion). Individually, the 32 top VAT claimants submitted claims to a value in excess of UGX 5 billion in each case. Taken together, the value of these 32 claims amounted to a figure in excess of UGX 223 billion (equivalent to 0.25 percent of GDP). In addition, offsets are entered manually in the monthly VAT returns/forms, which has the potential to create errors in the claim process.
(ii) VAT revenue foregone due to deviations from the standard or regular VAT system amount to an estimated 2.5 percent of
At an average rate of about 20 percent over the past decade, Uganda’s VAT productivity is amongst the lowest in the East African Community
2.7%
Uganda is running a negative cumulative VAT Account amounting to about
of GDP
33

GDP.30 This value is normally referred to as the tax expenditure.31 Given the current level of VAT collection (4 percent of GDP), the tax expenditure on VAT constitutes a significant loss of revenue, with this value estimated to reach 62.5 percent of the value of actual collections. Despite the high level of loss, this has not been closely monitored.
(iii). The.revenue.foregone.due.to.the.application.of.VAT.zero-rates.amounts to about 1.5 percent of GDP. Uganda applies zero-rates to exported goods and to the international transportation of goods or passengers, which is good practice. However, the list of goods eligible for zero-rating expands beyond this good practice.32 Uganda could significantly increase its revenues by reducing the list of zero rated items. In this regard, it could learn from the experience of its neighbors. Among EAC countries, Kenya applies zero-rates to only two items apart from exported goods, these being natural water and the transfer of business (as going concern). Rwanda is even more restrictive, applying zero rates only to exports and to donor funded projects. In Uganda, the practice of zero-rating non-export items has created challenges for revenue administration and collection, with some taxpayers miss classifying standard-rated items to evade taxation obligations.
(iv). VAT.exemptions.on.domestic.sales.result.in.forgone.revenues.amounting to a value of about 0.84 percent of GDP. VAT exemption is good practice for merit33 goods or services and goods and services that are hard to tax, such as educational and financial services. However, exempting goods and services which are neither hard-to-tax nor meritorious results in the unnecessary loss of revenue. In addition to foregone revenue, extensive VAT exemptions create two major problems. Firstly, exemptions break the VAT chain and cause inefficiencies due to cascading, which leaves a tax content on end products. This distorts the choice of consumer goods and inputs by producers, and renders exports less competitive, even if those are zero-rated. Second, the extensive
30. To compute cost of VAT exemptions, VAT returns were used to determine zero rated supplies (excluding exports)andexemptdomesticsales.VATdomesticsaleswereadjustedforitemsexemptunderVATnormativeregimes,andaproportionthatmayhavereflectedintermediatesales.Thecustomsdatabasewasusedtoidentify import on which VAT was not paid. Goods that are traditionally exempted such as petroleum products (these attract excise duty), goods related to education, health, veterinary sectors or armed sectors were excluded for purposes of computing revenue foregone. The resulting revenue was discounted by 18.7% (valueofimportsinthefinalvalueadded)toremovevalueofimportsthatwouldhavebeenclaimedbackiftheimporters are registered for domestic revenue purposes.
31. According to Bank of Uganda statistics, by 2017, mobile money transaction had reached a value worth UGX 55 trillion, which is over 65 percent of GDP.
32. Uganda’s list of non-export zero-rated items include: (a) Drugs and medicines; (b) Educational materials used in schools, colleges, universities and institutions engaged in adult education, vocational or technical education or training for handicapped persons; (c) Seeds, fertilizers, pesticides and hoes; (d) Cereals where these are gown, milled or produced in Uganda; (e) Sanitary towels and tampons and inputs for their manufacture; (f) Supplyofleasedaircraft,partsandmaintenanceequipment;and(g)Handlingserviceswithrespectofmedicalsupplies funded by donors
VAT exemption is good practice for merit goods or services, and for goods and services that are hard to tax, such as educational and financial services
34

exemptions increase both the administrative burden and the cost of compliance for taxpayers.
(v). While.some.VAT.exemptions.may.have.been.previously.justifiable,.they.may.now.have.become.obsolete..The list of VAT exemptions mandated by the Fifth Schedule of the East Africa Community Customs Management Act, 2004, contains items for which exemptions may no longer be justified. Using this schedule, exemptions have been granted on some imported goods, while locally manufactured goods are not exempt. This results in variations in the application of VAT on local and imported items. Furthermore, in the case of some imports, exemptions for which there is no solid legal basis may have been be granted. For example, imported exercise books are exempt from VAT. There is no solid legal basis for this exemption, with the law stating that only books intended for inclusion in libraries qualify for exemption.
(vi). While.there.is.a.solid.legal.basis.for.both.the.VAT.Refund.System.and.for.VAT.offset.processes,.the.manner.in.which.associated.processes are implemented may result in leakages. In the period from 2013 to 2015, the average total value of claimed refunds amounted to UGX 400 billion (i.e. about US$ 120 million, or about 0.5 percent of GDP), with an average of about 4,000 refund claims.34 In practice, only about 50 percent of claims are paid promptly. The balance remains unprocessed for long periods of time. This creates a general impression that the refund system is unfair and arbitrary, while also creating potential opportunities for fraud.
(vii). Some.innovations.to.address.economic.management.problems.elsewhere.have.adversely.affected.the.implementation.of.the.VAT.system..This.is.the.case.for.the.practice.of.deeming.VAT,35
with.the.original.objective.being.to.overcome.cashflow.problems.in.donor.funded.projects.and.oil.related.activities,.but.which.may.now.be.eroding.the.revenue.base.and.negatively.impacting.compliance. Provisions for deemed VAT are primarily intended for donor funded projects and for petroleum operations that have not yet begun exporting. However, the manner in which the system for calculating deemed VAT is implemented in Uganda has eroded the revenue base and negatively impacted the compliance culture, with large numbers of taxpayers other than the intended groups demanding to benefit from the practice. Elsewhere in the region, some countries have specific procedures for aid funded projects that do not involve deemed VAT (i.e. zero rate or exempt supplies for
33.Thesegoodsandservicesaredefinedasconsideredsomeritorious that their satisfaction is provided for through the public budget, over and above what is provided for through the market and paid for by private buyers.
34. Analysis based on data from Uganda Revenue Authority for the years 2013, 2014 and 2015.
35. Deemed VAT refers to the practice of assuming that VAT has been paid whereas not. It is therefore VAT charged by a supplier on a VAT invoice, the supplier does not receive VAT value in cash from the buyer and consequently will not remit to the tax authorities. On the other hand, the taxpayers are allowed to claim full credit for VAT paid on inputs. Deemed VAT is available to multiplelevelsintheVATchainforaidfundedprojectsand petroleum operations contractors.
The.revenue.foregone.due.to.the.application.of.VAT.zero-rates on non-exports amounts to
1.5%
Uganda’s currency notes and coins (World.Bank./.Morgan.Mbabazi,.2016)
35

direct or exclusive use in aid funded projects).36 By contrast, Ugandan law deems VAT to be paid on aid funded projects at multiple levels of the VAT value chain.37 This creates opportunities for abuse and difficulties for tax administration. Since the inception of Uganda’s deemed VAT system in July 2015, no data has been gathered to calculate the value of cash revenue foregone as a result of VAT being deemed to have been paid. However, for the period from July 2016 to December 2016 alone, revenue to a value of about 0.008 percent of GDP (i.e. UGX 6.9 billion) was not remitted to the URA as a result of this practice. The sectors which benefit to the greatest extent from this practice are the administrative and support service subsectors, with these subsectors accounting for 29.2 percent of the total value of deemed VAT; wholesale and retail trade (13.6 percent); repair of motor vehicles and motorcycles (12.5 percent); professional, scientific and technical activities (12.5 percent); manufacturing (12 percent); and mining and quarrying (7.9 percent).
Overall, VAT exemptions lead to significant foregone revenues. Notwithstanding the numerous leakages from the system, there is no rules-based governance framework that adequately captures, monitors and analyses the extent of these exemptions.
Reform Options
With the political will, most of the reforms required to improve the VAT administration and collection system could be effectively implemented in the short term. These reforms include the following:
a) Reforms to the VAT offset regime: The VAT offset regime should be reviewed by enforcing the value of how much VAT offset38 can be carried forward or setting a statutory time limit. After this time limit, offsets should be stopped or refund claims lodged which can be audited by URA for settlement. Second, the URA should eliminate the option to enter offsets manually in the e-Tax monthly returns. Third, URA should intensify audit compliance action on offsets
b) Establish.a.Tax.Expenditure.Governance.Framework.to.assess.tax exemptions: The authorities should establish a Tax Expenditure Governance Framework to assess the efficiency, impact and equity of tax
36. A comparative analysis of VAT treatment of government procurement in the region, indicates that Kenya and Tanzaniaexemptsuppliesmadeforaidfundedprojects.Rwandazeroratessuppliesmadeforaidfundedprojects,whileSouthAfricadeemsthemexported(hencezerorate)totheinternationalorganizationoraidagency.TheEU,NewZealandsubjectallgovernmentconsumptiontoVAT.
37. For example, if supplies by a Contractor X to an MDA (Level 1) are deemed VAT paid, then supplies to this Contractor X (Level 2) are also deemed VAT paid.
38.ThecurrentlimitofUGX5millionwassetin1996andcouldbenefitfromindexationtoreflectinflationandcurrent realities.
Since the inception of Uganda’s deemed VAT system, no data has been gathered to calculate the value of cash revenue foregone as a result of VAT being deemed to have been paid
36

39. Jensen, L.; T. Minh Le, and others, 2016 “Assessing Domestic Revenue Mobilization: Analytical Tools and Techniques”, October 2016 . World Bank Washington DC.
exemptions, with this framework being used as a basis to reduce or minimize exemptions. The framework39 should: (i) include a clause that refrains any authority from granting discretionary exemptions in whatever form; (ii) subject each new exemption or VAT zero rating to an extensive cost/benefit analysis; (iii) evaluate existing VAT exemptions to determine whether they remain relevant, with the public disclosure of the associated analysis to ensure greater transparency; and (iv) establish a ceiling on VAT exemptions, with the publication of reports on the degree to which compliance with this ceiling is achieved. The establishment of this framework and the promulgation of the associated fiscal rules could reduce the number of exemptions and thus increase the total value of collected VAT.
c) Review.the.domestic.zero.VAT.rating.system: A review of the exempt schedule should be conducted to rationalize to bring it closer to standard good VAT practice (i.e. only exports should be zero rated. As an example, specific consideration should be given to abolishing the zero rating for cereals, with the imposition of a threshold to protect small farmers, producers and millers, as discussed previously.
d). Eliminate.inefficient.exemptions.and.anomalies: The authorities should establish a system to evaluate exemptions to eliminate inefficiencies and anomalies and to rationalize the VAT base. Again, it is necessary to balance the value of social externalities against the cost of exemptions. For example, while there is clearly a high social cost to ensuring that all members of society have affordable access to materials to support primary and secondary education, consideration should be given to placing supplies needed by commercial educational service providers, such as coaching institutions, under the standard rated regime. Similarly, in the case of health services, while exemptions should continue to be granted to supplies to support the provision of basic and essential lifesaving services, consideration should be given to taxing non-specialized services (e.g., yoga, acupuncture, massage centers, medicines sold by pharmacies without doctors’ prescription). In certain instances, exemptions could become less relevant. In this context, the authorities should review the list of exempt items contained in Schedule 5 of the EACCMA to eliminate exemptions that can no longer be justified or those that cause imperfect competition with locally produced products.
e). Reform.the.system.for.using.deemed.VAT: Similar to the approaches adopted by regional peers and to mitigate government cash flow during the implementation of aid-funded projects, authorities should consider exempting supplies intended for the direct and exclusive use
The authorities should establish a system to evaluate exemptions to eliminate inefficiencies and anomalies and to rationalize the VAT base. It is necessary to balance the value of social externalities against the cost of exemptions.
37

of aid funded projects, instead of utilizing the deemed VAT approach. This would ease the administrative challenges associated with the deemed VAT approach and reduce leakages. A rolling list of active aid funded projects should be available to the URA as a basis for determining these exemptions.
f) Rationalize the VAT system for mobile communications services: The authorities should explore options that ensure that airtime is standard rated at the point of supply by the telecommunication company mobile service provider. All other players in the airtime value and distribution chain should be exempt to minimize leakages. This reform, aligns to the current trend, which is making scratch card technology obsolete, as airtime is purchased and loaded through electronic channels, including mobile money.
5.2 Personal Income Tax (PIT): Have everyone pay to make the system fairer while generating more revenues
Personal.Income.Tax.(PIT).is.the.third.largest.source.of.collected.domestic.revenues.in.Uganda,.contributing.to.roughly.18.percent.of.total.tax.revenues.and.amounting.to.a.value.of.around.2.3.percent.of.GDP,.one.of.the.lowest.proportions.in.the.East.African.region.40 Uganda’s rate of productivity for PIT is less than 10 percent. In developed countries, personal income taxes (excluding payroll taxes or social security contributions) contribute to around 25-40 percent of total tax revenues. In keeping with international good practice, Uganda has adopted a broad base to tax personal incomes, covering incomes from: (i) personal employment; (ii) business; and (c) property.41 Despite this, the contribution of PIT to tax revenues is lower than is the case for many regional comparators, mainly because of lower average per capita incomes; a relatively low share of working-age individuals in the formal sector; the granting of extensive exemptions; and a weak compliance culture.42
In.principle,.Uganda’s.PIT.regime.supports.core.policy.objectives.on.equity.and administrative simplicity.43 A minimum threshold has been established to ensure that extremely low-income earners are not taxed, after which there are three tax brackets, at 10, 20 and 30 percent, on increasing income thresholds, with those earning a figure in excess of UGX 120,000,000 per annum being required to pay an additional 10 percent on the value of this excess. The system
40. Rwanda’s collects about 3.5 percent of GDP in PIT revenue, Kenya about 6 percent of GDP and Tanzania about 3 percent of GDP. Burundi, with a lower collection of 2 percent of GDP, compares to Uganda’s 2.3 percent.
41.Underthepersonalemploymentincome,alltypeofwages,salary,fees,bonus,allowanceandfringebenefitsaresubjecttotaxation.Businessincludesanygainsofrevenueorcapitalnature.Propertyincomeincludesanydividends, interest, annuity, natural resource payments, rents, and royalties
42.TheTADAT2015ReportindicatedthatontimefilingratioforPAYEtaxpayersin2013/14was59percent.
Personal Income Tax (PIT) is the third largest source of collected domestic revenues in Uganda, contributing to roughly 18 percent of total tax revenues. Uganda’s rate of productivity for PIT is less than 10 percent. In developed countries, personal income taxes contribute to around 25-40 percent of total tax revenues.
38

comprehensively uses withholding practices. With higher income earners being subject to a relatively greater tax burden than low income earners, Uganda’s income tax system is progressive at the outset. However, the use of tax reliefs and tax avoidance practices by certain groups offsets the progressiveness of the system. The same bracket structure applies to non-residents as residents, but with higher rates for the non-residents. In accordance with the growing trend internationally, Uganda taxes her residents on a global basis, with non-residents taxed on the basis of income sourced in Uganda. While capital gains are deemed to be gross income and subject to normal taxation, interest, dividends and rental income are subject to scheduler taxation, which becomes the final tax.
In reality, however the objectives on equity and administrative simplicity are not being met, due to a number of gaps and issues in the Uganda’s PIT system. These are listed below:
(i). PIT.outcomes.are.mainly.constrained.by.exemptions.to.select.group of formal employees, and by informality in many sectors. Exemptions.apply.to.specific.groups.of.employees.in.the.formal.sector,.particularly.those.in.the.legislature,.security.and.judicial.services sectors. Tax on employment income is a major source of PIT, with most of the taxes derived from a small group of formal private and government sector employees, including public servants, of which there are about 415,000. In total, about 16 percent of the workforce is employed in the wage sector.44 However, the majority of those employed in the security and judicial services sectors are exempt, as are those employed under technical assistance agreements. Similarly, the allowances provided to members of parliament are exempt. These exemptions create perceptions of unfairness and reduce the value of collected taxes. For taxation to have a positive impact in terms of accountability and compliance culture, all taxpayers must feel that they are obliged to pay taxes in line with the tax code, with this applying especially to office bearers and those regarded as being in a privileged position. It is worth noting that in 2010, Kenya reformed its constitution to include a stipulation that no law may be enacted to exclude a State Officer from obligations to pay tax based on their office. This reform was clearly intended to foster a perception of fairness.
44. World Bank, 2013, Uganda Economic Update (2nd Edition); Jobs: Key to Prosperity.
The authorities should establish a system to evaluate exemptions to eliminate inefficiencies and anomalies and to rationalize the VAT base. It is necessary to balance the value of social externalities against the cost of exemptions.
39

(ii). The.level.of.taxes.collected.from.those.in.the.informal.sector.remains very low. Those employed in the informal sector, particularly in agriculture, are hard-to-tax, have a low compliance culture, and are currently marginally represented in terms of their contribution to collected taxes.
(iii).Tax.brackets.are.not.inflation-indexed.to.preserve.value..Uganda has recorded average annual inflation rates of around six percent over the past decade, with some years in which double-digit inflation rates have been recorded. These high rates cumulatively erode the value of any variables denominated in nominal terms. Despite this, there has not been any adjustment to the thresholds that define tax brackets. While this bolsters nominal revenues, it may undermine equity and create perceptions that taxpayers are being required to pay more than they can afford. Ideally, a system of indexation should be applied to the thresholds that define brackets, reducing pressures for tax exemption and increasing a culture of compliance. No such system is yet in place in Uganda.
Reform Options
To make Uganda’s PIT regime fairer and to increase the value of collected tax revenues, the authorities should consider implementing the following measures:
a). The.elimination.of.unfair,.inefficient.exemptions:.In the short term, the authorities should conduct a review of PIT exemptions to identify those that are inefficient, that are overly generous, or that create perceptions of unfairness.
The Government could improve transparency and accountability by establishing clearer linkages between taxation and public expenditure and by ensuring that tax administration and enforcement was implemented more equitably.
40

b). Intensified.enforcement: The authorities should conduct dedicated campaigns to ensure that all income earners declare their incomes and pay their taxes in compliance with the tax code.
c). Review.of.the.system.for.setting.income.tax.bracket.thresholds:.In the medium term, the authorities should consider indexing the thresholds for income taxes to preserve their value from inflation. This may result in perceptions of greater fairness and remove perceptions that the tax burden is excessive, thus fostering a culture of compliance.
5.3 Excise tax: remove exceptions and preserve value through indexation
The value of revenue from excise tax has declined steadily over the past several decades, from about 3.5 percent of GDP in the 1990s to about 2.5 percent over the past decade. The decline is primarily due to a range of excise duty exemptions, which collectively reduce revenues by about 0.43 percent of GDP. Excise duty is the fourth most significant contributor to collected tax revenues, contributing to an average of 9 to 10 percent of total revenues over the last ten years. In keeping with standard international practice, Uganda applies excise duties to manage negative externalities that could otherwise emerge through the uncontrolled use or production of particular products. While the value of Uganda’s collected excise taxes is relatively high compared to regional peers, the decline over the past several decades is largely attributable to the reduced production of one key product, tobacco, with British American Tobacco closing its production facility in the late 1990s, and selective implementation of excise policy, which does not address externalities. While a new Excise Act was promulgated in 2014, four years later, excise
system of indexation should be applied to the thresholds that define brackets, reducing pressures for tax exemption and increasing a culture of compliance
3.5% 2.5%
The.value.of.revenue.from.excise.tax.has.declined.steadily.over.the.past.several decades from
Processing.soft.drinks.at.Century.Bottling.Company.(u).Ltd,.Kampala.(World.Bank./.Morgan.Mbabazi,.2016)
41

tax regulations have not yet been developed to implement all aspects of the new law.
The.main.shortcomings.of.Uganda’s.excise.regime.include.the.following:.
(i). Leakages.related.to.excise.duty.expenditures: By 2016, the revenue forgone from excise duty exceptions to the regular excise duty system45 was estimated to reach a value of 0.43 percent of GDP. These exceptions include preferential excise rates applied on similar goods (beer, cigarettes, spirits and wines) and items exempted from excise tax (automobiles and aviation fuels).
(ii). At.the.product.level,.there.are.specific.issues.that.have.a.negative.impact on revenue outcomes. These include the following:
a. Tobacco: Considering the significant negative externalities associated with smoking, tobacco is taxed relatively lightly. In Uganda, the smoking prevalence rate is estimated to stand at around 16.4 percent of the adult population. The Centre for Tobacco Control in Africa estimates that the health costs associated with smoking in Uganda reach UGX 328.82 billion. In simple economic terms, this outweighs the economic benefits derived from taxation on tobacco use, the value of which amounts to around UGX 211.15 billion. In a recent diagnostic conducted by the World Bank,46 it was established that excise tax rates on cigarettes could be increased to UGX 165,000 per 1,000 cigarettes. Other issues relate to the imposition of preferential excise rates on locally produced cigarettes, despite provisions of the Tobacco Control Act 2015 and the WHO Protocol on Tobacco that deprecate this practice. Different excise duty rates are applied on cigarettes sold in packets with hinge lids and soft caps, which also does not conform to best practices. In short, there is room both to increase rates generally and to apply greater consistency in the imposition of excise duty.
b.. Alcohol:.The manner in which alcoholic products are classified and defined and the differential excise duty rates applied to different categories create opportunities for manipulation. For example, excise duty on beer or wines is determined based on source of raw material instead of alcohol content. While the optimal excise rate for beer in Uganda stands at around 60 percent, some types of beers attract lower excise duty rates. Consequently, collection of excise duty on beer has not responded well to increases in GDP, with buoyancy and elasticity rates of 0.69. By contrast, in the case of the collection of duty on spirits, the buoyancy rate stood at 2.13 and elasticity rate at 1.97, indicating a good response to increased GDP.
The Centre for Tobacco Control in Africa estimates that the health costs associated with smoking in Uganda reach UGX 328.82 billion. In simple economic terms, this outweighs the economic benefits derived from taxation on tobacco use, the value of which amounts to around UGX 211.15 billion.
45.“AhandbookofTaxSimplification”,publicationbyInvestmentClimateAdvisoryServices,2009.
46. World Bank, 2017, Excise Duty Diagnostic
42
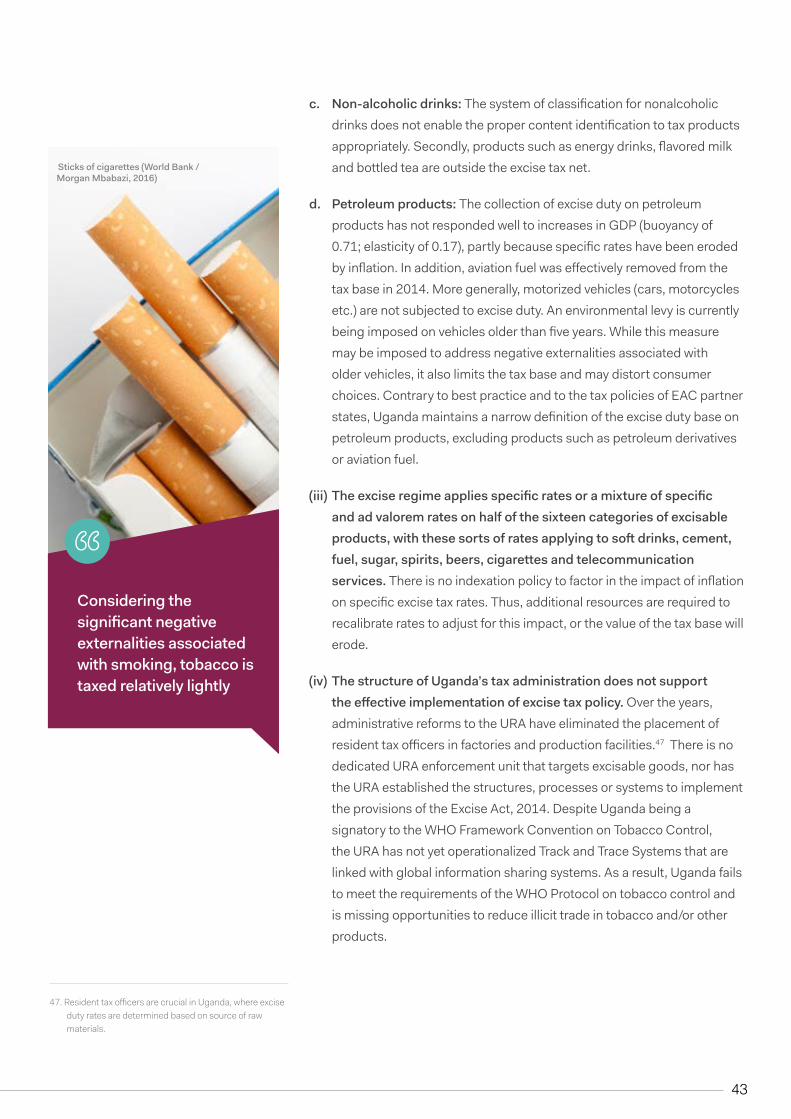
c.. Non-alcoholic.drinks: The system of classification for nonalcoholic drinks does not enable the proper content identification to tax products appropriately. Secondly, products such as energy drinks, flavored milk and bottled tea are outside the excise tax net.
d. Petroleum products: The collection of excise duty on petroleum products has not responded well to increases in GDP (buoyancy of 0.71; elasticity of 0.17), partly because specific rates have been eroded by inflation. In addition, aviation fuel was effectively removed from the tax base in 2014. More generally, motorized vehicles (cars, motorcycles etc.) are not subjected to excise duty. An environmental levy is currently being imposed on vehicles older than five years. While this measure may be imposed to address negative externalities associated with older vehicles, it also limits the tax base and may distort consumer choices. Contrary to best practice and to the tax policies of EAC partner states, Uganda maintains a narrow definition of the excise duty base on petroleum products, excluding products such as petroleum derivatives or aviation fuel.
(iii).The.excise.regime.applies.specific.rates.or.a.mixture.of.specific.and.ad.valorem.rates.on.half.of.the.sixteen.categories.of.excisable.products,.with.these.sorts.of.rates.applying.to.soft.drinks,.cement,.fuel, sugar, spirits, beers, cigarettes and telecommunication services. There is no indexation policy to factor in the impact of inflation on specific excise tax rates. Thus, additional resources are required to recalibrate rates to adjust for this impact, or the value of the tax base will erode.
(iv). The.structure.of.Uganda’s.tax.administration.does.not.support.the.effective.implementation.of.excise.tax.policy. Over the years, administrative reforms to the URA have eliminated the placement of resident tax officers in factories and production facilities.47 There is no dedicated URA enforcement unit that targets excisable goods, nor has the URA established the structures, processes or systems to implement the provisions of the Excise Act, 2014. Despite Uganda being a signatory to the WHO Framework Convention on Tobacco Control, the URA has not yet operationalized Track and Trace Systems that are linked with global information sharing systems. As a result, Uganda fails to meet the requirements of the WHO Protocol on tobacco control and is missing opportunities to reduce illicit trade in tobacco and/or other products.
47.ResidenttaxofficersarecrucialinUganda,whereexciseduty rates are determined based on source of raw materials.
Considering.the.significant.negative.externalities associated with.smoking,.tobacco.is.taxed.relatively.lightly
Sticks.of.cigarettes.(World.Bank./.Morgan.Mbabazi,.2016)
43

Reform Options
To.improve.the.efficiency.of.the.excise.duty.regime,.the.authority.should.consider.the.following.measures:.
To improve the excise duty policy framework, the authorities should consider the following will:
a) Indexing specific rates to preserve value in the context of inflation;
b) Streamlining policies related to the imposition of excise duty on tobacco by creating a single tier tax rate structure for all cigarettes, thus ensuring that all forms of cigarettes are covered in the excise regime and treated equally. The authorities should also implement Track and Trace Systems to comply with the WHO protocol on Tobacco control and to increase the ability to control illicit trade.
c) Rationalizing policies related to the imposition of excise duty on alcohol by using alcohol content as the point of reference for establishing the level of duty. They should also ensure that all forms of alcoholic beverages (e.g. non-malt beers, mead and powdered beer) are included in the excise regime.
d) Streamlining policies related to the imposition of excise duty on non-alcoholic drinks by broadening the classification of the tax base to include substitute non-alcoholic products. Standard nomenclature should be adopted to define taxable non-alcoholic items. Taxes on non-alcoholic beverages should not be earmarked.
e) Streamlining policies related to the imposition of excise duty on petroleum products by: (i) reviewing the list of aviation or jet fuel importers to confirm that they meet the requirements for exemption; (ii) revisiting tax policies with a view to imposing excise tax rates on the basis of the energy content in fuels; and (iii) including residual oils, medium oils and preparations in the excise tax base.
f) Reviewing the environmental tax on motor vehicle and possibly replacing it with a broad-based and progressive excise tax on motorized vehicles. The excise tax rates could be designed to signal the Government’s policy intent of lowering CO2 emissions and encouraging the use of fuel-efficient vehicles.
To.improve.the.administration.of.excise.duty.administration,.the.authorities.should.consider.the.following.measures:
a) In the short term, regulations pursuant to S 16 of the Excise Tax Act, 2014, should be developed and enacted to support the implementation of the Act.
b) The URA should implement the Excise Act, 2014, by licensing the excise goods/services players; stopping suspended excise duty, remissions and refunds; and aligning excise tax returns to the new law.
Vehicle excise tax rates could be designed to signal the Government’s policy intent of lowering CO2 emissions and encouraging the use of fuel-efficient vehicles
44

c) The authorities should implement the Track and Trace (T&T) systems, with particular attention to updating project plans and developing policies in consultation with key stakeholders.
d) In the medium term, the authorities should review the impact of the exemption on aviation fuels to determine if these result in reduced air-ticket prices as a result of the exemptions. If the exemptions do not result in lower ticket prices for passengers, consideration should be given to removing the exemption.
e) URA must establish the appropriate organizational structures to implement existing excise duty policies effectively. Amongst other measures, this may involve deploying tax officers in factories to control excisable materials and expanding the mandate of physical enforcement units to specifically focus on high value, high risk and/or exempted excisable items, such as aviation fuel.
5.4 Corporate Income Tax: Suppress the excessive use of tax reliefs to significantly enhance revenue yield
Corporate Income Tax (CIT) is the most significant tax to which businesses are subject, with this tax generating revenues to a value of up to 2 percent of GDP. Accounting for 7.5 percent of the total value of tax revenues, CIT is the fifth most significant contributor to tax revenues, with this proportion very low compared to the average for EAC and SSA countries. The corporate income tax base is the net profit derived by an individual company, with net profit defined as the gross revenue after subtracting all deductible expenses from total sales. All capital gains are treated as ordinary revenue for tax purposes. Deductions are allowed for all expenses incurred exclusively for the conduct of the business. Also, any losses incurred in the production of income are tax deductible. Uganda’s CIT rate of 30 percent is only slightly below the average rate for SSA (32.8 percent) and low-income countries (31.9 percent).
Uganda’s collection of CIT is low compared to that of Kenya, where the value of collected CIT amounts to 3.9 percent of GDP. At less than 10 percent, Uganda records a low rate of CIT productivity,48 considerably lower than Kenya (14 percent) or Ghana (25 percent).49 Amongst other reasons, this low productivity is due to the following causes:
48. Represents how well the corporate income tax does in terms of revenue collection, given the tax rate. CIT productivity is the portion of GDP in revenue that is mobilized for each point of CIT rate.
49. Data source: US Agency for International Development: collecting taxes series 2007-08 to 2012-13.
50. For instance, in addition to the exempt corporate incomes, investors located in industrial zones are entitled to duty exemption on raw materials, plant, machinery and other inputs,stampdutyexemption,dutydrawbackonimportsofgoodsfromdomestictariffareas,noexporttaxonexportsandexemptionofwithholdingtaxoninterestonexternal loans and dividends repatriated to get relief from double taxation. New agro-processing investment set up outside of a 30-kilometer radius of Kampala are exempt from income tax. While some exemptions have been rolled back from 2014, the incentives are still very generous, especially with the provision of initial depreciation of 50 percent for all business assets and 75 percent if the business is out of the select urban areas.
51. These are deductions which taxpayers claimed as evidenced by tax return data availed to URA beyond expenses incurred in deriving income included in gross income used for taxation.
Uganda’s collection of CIT is low compared to that of Kenya, where the value of collected CIT amounts to 3.9 percent of GDP. At less than 10 percent, Uganda records a low rate of CIT productivity, considerably lower than Kenya (14 percent) or Ghana (25 percent).
45

The.real.estate.sector claims the.highest.proportion of losses carried forward
76%
57%44%40%18%
Information and communication
Transport
Accomodation
Agriculture
(i). The.system.of.exemptions.and.investment.incentives.means.that.the.CIT system is non-neutral.50 It has been estimated that in the period from 2014 to 2016, the value of revenues foregone because of exemptions amounted to between 0.7 to 2.33 percentage points of GDP each year. If these revenues have been collected, the value of collected CIT would have almost doubled from the current figure of 2 percent of GDP. The bulk of the tax expenditure has gone to the service sectors, mainly the financial and insurance services, extra-territorial agencies, health and other services.
(ii). In.the.period.from.2014.to.2017,.the.annual.average.value.of.other.allowable deductions51..amounted.to.0.42.percent.of.GDP,.which.reduced.the.chargeable.income. In addition, the depreciation rules are quite generous compared to those in other countries in the region. It is estimated that tax depreciation and capital allowances are consistently 125 percent higher than financial accounting depreciation. The alignment of accounting to taxation depreciation rules may generate additional benefits to Uganda in terms of increased revenues, while at the same time simplifying the tax administration system and reducing tax compliance costs, as taxpayers would not have to recalculate their financial accounting depreciation to meet tax reporting requirements.
(iii).Uganda’s.policy.for.allowing.perpetual.carry.forward.of.tax.losses.creates.inefficiencies.and.opportunities.for.avoidance..The real estate sector claims the highest proportion of losses carried forward (76 percent), followed by information and communication (57 percent); transport (44 percent); accommodation (40 percent); and agriculture (18 percent). The magnitude of the tax losses claimed and carried forward suggests that the administration is unable to control possibly fictitious claims, which means that it is unable to guarantee integrity of the tax declarations.52 While other low capacity countries also apply loss carry forward mechanisms,53 Uganda’s methodology is particularly prone to risk because it is perpetual in nature, which means that some companies may be tempted to engineer fictitious perpetual losses to avoid taxation.
(iv).While.Uganda.applies.a.generous.‘thin.capitalization.rule’.to.foreign.companies,.it.does.not.extend.this.rule.to.domestic.companies..This creates inequalities and possibly results in the erosion of the CIT base. While there are no debt-to-equity restrictions on domestic resident companies, if a foreign-controlled resident company other than a financial institution has a foreign debt-to-equity ratio in excess of 2:1, interest deductions are disallowed on the debt to the extent that it exceeds this ratio. The Government could introduce thin capitalization rules for domestic companies and increase the ratio to a limit of 3:1 or 4:1 for both
52. Taxpayers are allowed to manually enter the brought forward loss in the income tax return.
53. In EAC Rwanda, Kenya limit loss carry forward to 5 and 9 years respectively. Tanzania ring-fences losses carried forward and imposes an alternative minimum tax of 0.3 percent on gross turnover for companies that make losses for three years in the third year. Among developed nations, Canada and Chile limit loss carry forward to 7 years.
54. The negative chargeable income arises when the allowable deductions are higher than the gross incomes generatedbyfirms
46
domestic and foreign companies. This is particularly necessary given that domestic companies have begun to use creative tax avoidance methods, as is often the case with foreign companies.
Overall, leakages from tax reliefs, estimated to be amounting to 1.0 to 2.0 percent of GDP, are about the same level estimated for Kenya, which implies other factors are responsible for the low performance.
While Uganda’s nominal tax rate is 30 percent, the effective tax rate on net chargeable income has consistently been negative, at an average rate of 14 percent over the last four years.54 However, the burden is not equally spread. According to 2016 data, manufacturing had an effective rate on gross chargeable income of 49 percent; water of five percent; wholesale/retail of 25 percent; ICT of 33 percent; and households of 16 percent. All these sectors return negative effective rates on net chargeable income when losses carried forward are deducted from the current year’s gross chargeable income.
Reform Options
To increase the revenue yield from the business sector, the Government could consider the following measures:
a) In the short term, the authorities should review provisions related to losses carried forward and consider limiting the period for which these losses may be carried forward to a minimum of 5 years (i.e. period allowed to tax payers to keep records)
b) The authorities should rationalize the list of exemptions to ensure that incentives that address specific market failures remain on the tax code.
c) The authorities should review provisions related to ‘other allowable expenditures’ to determine the extent to which these deductions can be justified and to examine why these deductions cannot fit into the class of deductions described by the Income Tax Act as ‘expenditures incurred in the production of income included in gross income.’ Following the review process, the Government could consider limiting the deductibility of these expenditures. In addition, to encourage compliance with withholding tax regimes, the Government should include new policy-oriented prohibition on deductible expenses. For example, expenses subject to withholding tax, such as wages or interest, should not be deductible if withholding taxes were not remitted on time to the URA.
d) In the medium term, the authorities should consider simplifying the tax regime by aligning accounting depreciation procedures with tax depreciation procedures.
e) The authorities should develop a Tax Expenditure Fiscal Governance Framework to guide the process of assessing new tax exemptions.
The authorities should rationalize the list of exemptions to ensure that incentives that address specific market failures remain on the tax code.
47

An assessment to establish.strengths.and.areas of improvement in.the.customs.administration.has.been.commissioned, spiraling offsets,.carried.forward.losses.or.tax.bases.that.are.not tapped into point to URA capacity
There.is.scope.to.increase.the.efficiency.of.Uganda’s.tax.administration.system..The.failure.to.control.spiraling.offsets.and.carried.forward.losses.and.to.effectively.tap.all.tax.bases.suggest.that.a.number.of.capacity.gaps.need.to.be.addressed..In.terms.of.cost.effectiveness,.the.recurrent.cost.of.administration.is.about.1.7.percent.of.the.total.value.of.revenues.collected..This.is.higher.than.the.rate.of.around.1.percent.or less recorded by most OECD countries.
In many countries, this rate declines as more efficient systems of revenue administration are implemented, including systems involving more advanced technologies. Kenya’s rate stood at about 1.2 percent in 2016, with this rate having steadily declined over the past decade. The rate recorded by Uganda is roughly similar to the rates of Tanzania and Rwanda, which range between 2 to 3 percent. In Uganda, despite an ambitious modernization program, not all revenue collection operations have been fully computerized. Even though Uganda has implemented e-taxation for a number of years,55 the process is not yet complete, with a range of processes still conducted manually. Some private sector actors have noted that it is not possible to link their accounting systems with the URA system to file returns and provide the necessary back information.
According to an IMF Tax Administration Performance Assessment (TADAT) for Uganda completed in August 2015, a key strength of URA was the good use of IT system (e-Tax) in the delivery of services. Although the e-Tax impact assessment has not yet been done, anecdotal evidence points to positive results.56 Despite the positive outcomes from e-Tax, several challenges have been noted. These include intermittent system availability, slow response times, unused modules or data and new laws which are not yet ably supported by the system.57 An assessment to establish strengths and areas of improvement in the customs administration has been commissioned. Spiraling offsets, carried forward losses or tax bases that are not tapped into point to URA capacity (skillsets, staff numbers etc.) constraints.58 Further value chain, competence or strategic architecture analysis of URA have not yet been conducted.
06
55.Onlineregistration,filingandpaymentcomplianceisavailableona24-hourbasisusingtheeTaxsystem.
56. Domestic tax revenues as a portion of total revenues increased from 47 percent in 2007 to 56 percent in 2016. As a percent of GDP domestic revenues rose from 6.6 percent to 7.8 percent in same period. Domestic tax expenditure to revenue ratio decreased from 2 percent in 2007 to 1.2 percent in 2014. A 24-hour service was introduced. By June 2014, taxpayer base stood at 245,067(37,621 corporate entitiesand207,446individuals)upfrom30,000in2009/2010
57. Examples include the Tax Procedure Code Act, 2014 the Excise Act, 2014 and the Petroleum tax regime.
58.Morethan36percentofstaffhavelessthansixyears’experienceintaxadministration.Another24percent have spent 6-10 years in URA. This speaks volumes to the need to invest in technical, general, inter-personalandleadershipskillsamongstURAstaff.
ENHANCE EFFICIENCY OF REVENUE ADMINISTRATION
Uganda.Revenue.Authority.–.Staff.at.work.in.head.office.in.Nakawa,.Kampala.(World.Bank./.Morgan.Mbabazi,.2016)
48

The.rate.recorded.by.Uganda.is.roughly.similar.to.the.rates.of.Tanzania and Rwanda, which.range.between
3%2%
Reform Options
• The Government should review the existing ICT systems and processes to identify options to strengthen capacity to deepen the computerization of URA’s operations. As part of this initiative, it should implement technological solutions that have been demonstrated elsewhere to facilitate the collection of increased revenue. For example, implementing the Tobacco Trace and Track systems could be a significant step towards improving URA’s capacity to combat illicit trade.
• The Government should devise mechanisms for sharing information across institutions.
• The Government should invest in cleaning and expanding the tax register to increase its level of accuracy and to generate confidence in the system. Registration should be encouraged both through the provision of rewards for compliance and the imposition of sanctions for non-compliance.
• The Government should design and implement a strategy to build capacities in the area of both tax policy and tax administration over the medium and long term. In particular, priority should be given to closing gaps in core functions such as data analysis and forecasting, auditing and investigative functions.
• The Government should review the functions of both the URA and local government tax administration units to identify the areas in which the respective entities have a competitive advantage so that the overall taxation system works effectively and includes as many taxpayers as possible.
An.untapped.potential.also.lies.within.the.non-tax.revenue.arena,.where.the.value.of.revenues.currently.amounts.to.a.mere.0.2.percent.of GDP. Uganda’s performance in terms of the collection of non-tax revenues is considerably worse than that of Kenya (0.4 percent of GDP); Tanzania (0.5 percent); and Rwanda (0.9 percent). Building the revenue administration capacities of local governments and streamlining the administration of property taxes and user charges would enhance the revenues of these governments. Moreover, while local governments currently significantly underutilize user fees, they have a number of benefits, including promoting economic efficiency (cost recovery). The further introduction of user fees would have the additional benefit of reducing the central government’s fiscal burden. Furthermore, with preparations for the commercial production of oil underway and with the
According to an IMF Tax Administration Performance Assessment (TADAT) for Uganda completed in August 2015, a key strength of URA was the good use of IT system (e-Tax) in the delivery of services. Although the e-Tax impact assessment has not yet been done, anecdotal evidence points to positive results.
49

There.are.significant.weaknesses.with.public.service delivery in Uganda. The.management.and.delivery of infrastructure projects.is.poor,.with.wide.spread perceptions of corruption
07 STRENGTHEN THE SOCIAL CONTRACT TO IMPROVE TAX COMPLIANCE
growth of the mineral sector, the development of an effective framework to collect revenues from these sources is crucial.
Going.forward,.the.most.critical.issue.remains.the.need.to.improve.accountability.and.enforcement,.Government.has.decided.that.all.NTR.should.be.collected.by.URA.and.utilized.through.the.Concolidated.Fund. Enforcement by the Ministries, Departments and agencies (MDAs) will be key in ensuring increased yields, while leveraging URA’s collection strengths.
Taxation can provide an incentive for citizens and Government to enter.into.a.mutually.beneficial.social.contract..This.calls.for.citizens.to.accept.and.comply.with.the.taxation.regime,.with.the.Government.being.obliged.to.ensure.the.rule.of.law.and.provide.public.services..As.a.result,.citizens.receive.improved.service.delivery.while.the.state.receives.more.predictable.tax.revenues..Citizens.should.be.able.to.determine.whether.funds.are.used.appropriately.and.responsibly,.as.reflected.by.effective.service.delivery.
Unfortunately, there are significant weaknesses with public service delivery in Uganda. According to World Bank Service Delivery Indicators (SDIs)59
, in 2013, close to half of all health workers (49 percent) in public facilities could not accurately diagnose five tracer conditions and follow clinical guidelines. Less than half (47.9 percent) of all public health facilities had adequate infrastructure, while more than half (52 percent) of public health providers were not present in the facility. In the education sector, less than one in five (19 percent) of public school teachers showed mastery of the curriculum and more than one out of four (27 percent) teachers in public schools were not present at work. The management and delivery of infrastructure projects is poor, with wide spread perceptions of corruption. Uganda continues to lag behind its regional neighbors in indicators related to Government effectiveness.60 These factors weaken the social contract between government and the citizens. These, combined with the lack of awareness and transparency regarding the collection of taxes and the use to which revenues are put, result in a low level of trust in the tax management system.
59.WorldBankServiceDeliveryIndicators,2013;http://data.worldbank.org/data-catalog/service-delivery-indicators
60. World Wide Governance Indicators (2016)
Girls.enjoying.a.key.social.services – education World Bank / Great Lakes Production,.2016)..
50

Reform Options
The revenue mobilization agenda could benefit from stronger governance and accountability, with equity as one of the governing principles. A taxation system that is seen to be fair and transparent would enhance compliance. To achieve this, the following measures should be considered:
(i) Improve transparency in overall administration and collection;
(ii) Strengthen the regularity and clarity of reporting of tax through the budget process;
(iii) Devise mechanisms to demonstrate the linkage between taxation, public expenditure and effective service delivery (for example, through the demonstration of enhanced service delivery by MDAs during the URA tax appreciation week);
(iv) Engage with CSOs to enhance dialogue on tax policy implementation and build alliances with key stakeholders including members of parliament, private sector representative organizations and NGOs;
(v) Develop the new DRM-S process as a vehicle to build coalitions and improve coordination, with clear linkages to economic transformation, increased jobs and the achievement of other government goals.
In the education sector, less than one in five (19 percent) of public school teachers showed mastery of the curriculum and more than one out of four (27 percent) teachers in public schools were not present at work. The management and delivery of infrastructure projects is poor, with wide spread perceptions of corruption.
A.busy.day.in.downtown.Kampala.(World.Bank./.Morgan.Mbabazi,.2016)
51

With.Uganda’s.current.level of performance, reforms.both.within.and.outside.the.tax.system.are.needed.to.increase.the.value of collected revenues to enable a country to effectively.manage.its.debt and to deliver public services.of.sufficient.quality
08 CONCLUDING REMARKS
Uganda.has.the.potential.to.significantly.increase.the.value.of.its.collected.domestic.revenues,.which.in.turn.would.provide.the.authorities.with.greater.fiscal.space.and.increased.resources.to.manage.fiscal.policies.and.to.provide.public.services..Despite.Uganda’s good macroeconomic performance, domestic tax revenue mobilization.still.ranges.at.the.relatively.low.level.of.13.to.14.percent.of.GDP.
If Uganda was to achieve the same level of performance with peers with similar characteristics, it could increase the value of collected revenues to fulfill their potential, estimated at between 18 and 23 percent of GDP. It could increase these revenues by between 4.0 to 5.0 percentage points of GDP by significantly reducing the revenue losses it currently incurs as a result of policy discretion on tax expenditures. With Uganda’s current level of performance, reforms both within and outside the tax system are needed to increase the value of collected revenues to enable a country to effectively manage its debt and to deliver public services of sufficient quality to meet the needs of its expanding population.
For Uganda to achieve its full potential in terms of tax revenue mobilization, it has to include a far greater proportion of businesses and individual income earners into the tax net; to use existing tax instruments more efficiently; and to increase the efficiency of tax administration. Firstly, the easiest and most cost-effective measure would involve increasing the productivity of tax instruments, which could be achieved by refraining from excessive provision of tax reliefs. To achieve this, streamlining the governance framework for tax expenditures is critical. Secondly, a deliberate effort to streamline the taxation of agriculture and to identify and incentivize informal firms to formalize is required. To achieve this, stronger linkages should be established between existing institutions involved in the registration and management of information on firms. These measures should be combined with the provision of incentives to other sectors (e.g. the financial sector) to support a more rapid process of formalization and financial inclusion. Thirdly, the authorities could collect additional revenues by improving the efficiency of revenue administration. This could be achieved by leveraging modern technological innovations; by cleaning and expanding the tax register; and by sustained measures to build capacities in both tax policy and tax administration. These measures must be followed by developing and utilizing synergies between URA and other
52

If Uganda was to achieve.a.certain.level of performance, it.could.increase.the.value of collected revenues between
23%18%
entities, especially local governments, to identify taxpayers. While some of these measures can be implemented effectively in the short term, optimal results will only be achieved through a consistent and deliberate effort to address the key constraints on revenue mobilization, even if the required measures are difficult and take time to implement and bear fruit.
To support the reforms, the authorities should formulate and implement strategies that promote a culture of compliance with the tax regime, including through high-level political messaging. All office bearers, including the president, cabinet members, legislators and key figures in civil society need to make deliberate efforts to address impressions that Uganda does not need tax revenues, or that the agriculture or select taxpayer groups are exempt from tax obligations. Removing exemptions for government institutions and select groups of public servants could address perceptions of unfairness through a ‘lead by example’ approach to building a stronger culture of compliance. Other reforms could focus on building a consensus on what incentives should be reasonably extended to attract both domestic and foreign investments in Uganda.
The Government could also strive to strengthen the social contract by improving transparency and accountability; creating clear links between taxation and public expenditure; and implementing measures to achieve higher levels of equity in the areas of enforcement and tax administration. In addition to the annual URA revenue report, the URA could prepare and publicize a report that links collections by geographical source to valuable expenditure outcomes. The URA has invested heavily in the establishment of a taxpayer services division, which offers tax payers a host of online self-services and other services, including assistance, information, education, and outreach services. The authority also runs a call center that receives and resolves complaints from taxpayers.
Local governments also have the capacity to improve their revenue mobilization efforts. Currently, local governments’ own source revenues (OSR) amount to 0.2 percent of GDP. This is lowest in the region (Kenya 0.5, Tanzania 0.4 and Rwanda 0.9 percent of GDP). This source of revenue has declined after the local governments disbanded graduated tax. This system was not implemented well, due to low capacity and political intervention. This lack of capacity also affects national taxes,
A deliberate effort to streamline the taxation of agriculture and to identify and incentivize informal firms to formalize is required, using stronger linkages established between existing institutions involved in the registration and management of information on firms.
53

since many initiatives (e.g. the single business permit, property tax and user fees administration, etc.) are aimed at reaching hard to reach areas. These areas could benefit from an effective and well-resourced local government. For example, it has been established that the involvement of local governments in the identification of informal businesses and in the assessment of their tax liability often leads to better results than if this is conducted from the center. Going forward, the Government must enhance local government tax administration capacity. This would enable increased collections from other potential sources of revenue, including property tax and user fee regimes.
With both technical and non-technical approaches, well-planned, appropriately implemented reforms could contribute to the formulation of the Domestic Revenue Mobilization Medium-Term Revenue Strategy (DRMTS), which is currently being prepared by the authorities. The core aim of the developing strategy is to expand the tax base to increase the tax-to-GDP ratio, while at the same time ensuring that the tax system is equitable, with individual tax liabilities being set at appropriate levels for the income profiles of the tax payers. The formulation of the DRMTS creates opportunities for the establishment of a new social contract that will provide the Government with a strong basis to fulfil its mandate to provide services that meet the needs of the population.
Local governments’ own source.revenues.(OSR).
0.5%
0.2%
0.4%0.9%
This.is.lowest.in.the.region
KENYA
TANZANIA
RWANDA
percent of GDP
54

ANNEXES

Tabl
e A
1: K
ey M
acro
econ
omic
Indi
cato
rs
Indi
cato
rU
nit m
easu
re20
09/1
020
10/1
120
11/1
220
12/1
320
13/1
420
14/1
520
15/1
6 20
16/1
720
17/1
8 Es
tPo
pula
tion
Mill
ions
31.0
31.9
35.1
37.6
38.7
39.9
41.1
42.3
43.6
GD
PU
SD m
illio
ns20
181.
620
262.
323
218.
924
663.
127
757.
427
573.
224
661.
126
282.
827
998.
0Pe
r cap
ita G
DP
USD
651
635
662
656
717
691
600
621
642
GD
P gr
owth
% 5
.6
9.4
3
.8
3.6
5
.1
5.2
4
.7
4.0
5
.5
Gro
ss D
omes
tic S
avin
gsas
% o
f GD
P19
.719
.517
..721
.718
.817
.118
.220
.121
.0G
ross
Inve
stm
ents
as %
of G
DP
12.5
12.3
28.2
29.5
26.7
24.6
24.9
25.3
25.2
Infla
tion
(per
iod
aver
age)
%4.
018
.714
.04.
95.
32.
96.
65.
74.
0Ex
chan
ge R
ate
(end
-yea
r)U
GX/
USD
2177
.625
22.7
2504
.625
91.1
2538
.028
27.7
3443
.035
28.3
3675
.0Ex
tern
al S
ecto
rEx
port
s, f.
o.b.
Mill
ion
USD
2317
.322
97.8
2667
.429
12.1
2706
.327
38.4
2687
.831
63.7
3320
.0Im
port
s - f
.o.b
.M
illio
n U
SD-4
,116
.8-4
,671
.1-5
,241
.5-5
,035
.1-5
,073
.5-4
,988
.0-4
574.
5-4
,718
-5,0
00C
urre
nt A
ccou
nt B
alan
ceM
illio
n U
SD-1
497.
2-1
732.
6-2
030.
9-1
517.
3-2
051.
7-1
876.
5-1
208.
8-1
047.
9-1
061.
9Ba
lanc
e of
Pay
men
ts
(ove
rall
bala
nce)
Mill
ion
USD
-229
.660
6.0
-746
.6-3
38.0
-378
.535
2.8
-101
.5-4
37.6
-104
.0
Gro
ss F
orei
gn R
eser
ves
Mill
ion
USD
2384
.720
44.0
2643
.829
12.3
3394
.028
95.0
2962
.034
29.0
3734
.0Ex
tern
al D
ebt
Mill
ion
USD
2343
.429
04.9
3254
.138
25.2
4300
.743
80.1
5309
.260
14.1
6914
.1Fo
reig
n D
irect
Inve
stm
ent
Mill
ion
USD
659.
770
6.4
1243
.993
9.9
1087
.488
4.6
629.
449
3.8
534.
1M
onet
ary
Sect
orAv
erag
e D
epos
it Ra
te%
2.0
2.1
3.2
3.0
3.1
3.3
3.2
3.3
2.7
Aver
age
Lend
ing
Rate
%20
.719
.824
.624
.822
.125
.223
.722
.620
.8G
row
th in
Mon
ey S
uppl
y (M
3)%
23.6
25.7
26.1
6.6
17.4
15.9
7.1
13.6
14.0
Gov
ernm
ent F
inan
ceTo
tal D
omes
tic R
even
ueas
% o
f GD
P10
.513
.611
.211
.311
.613
.213
.814
.313
.7Ta
x Re
venu
eas
% o
f GD
P10
.310
.910
.311
.011
.112
.413
.013
.513
.2N
on T
ax R
even
ueas
% o
f GD
P0.
30.
20.
20.
30.
50.
60.
70.
70.
4G
rant
sas
% o
f GD
P2.
11.
91.
91.
41.
01.
21.
41.
01.
5To
tal E
xpen
ditu
re a
nd n
et le
ndin
gas
% o
f GD
P16
.719
.115
.616
.216
.618
.720
.119
.219
.3Re
curr
ent E
xpen
ditu
reas
% o
f GD
P10
.512
.79.
19.
09.
510
.011
.011
.310
.8D
evel
opm
ent E
xpen
ditu
reas
% o
f GD
P6.
16.
16.
16.
57.
06.
87.
17.
98.
5Fiscal.Balance.(overall)
as %
of G
DP
-4.0
-3.6
-2.5
-3.5
-3.5
-4.4
-5.3
-3.5
-3.9
56
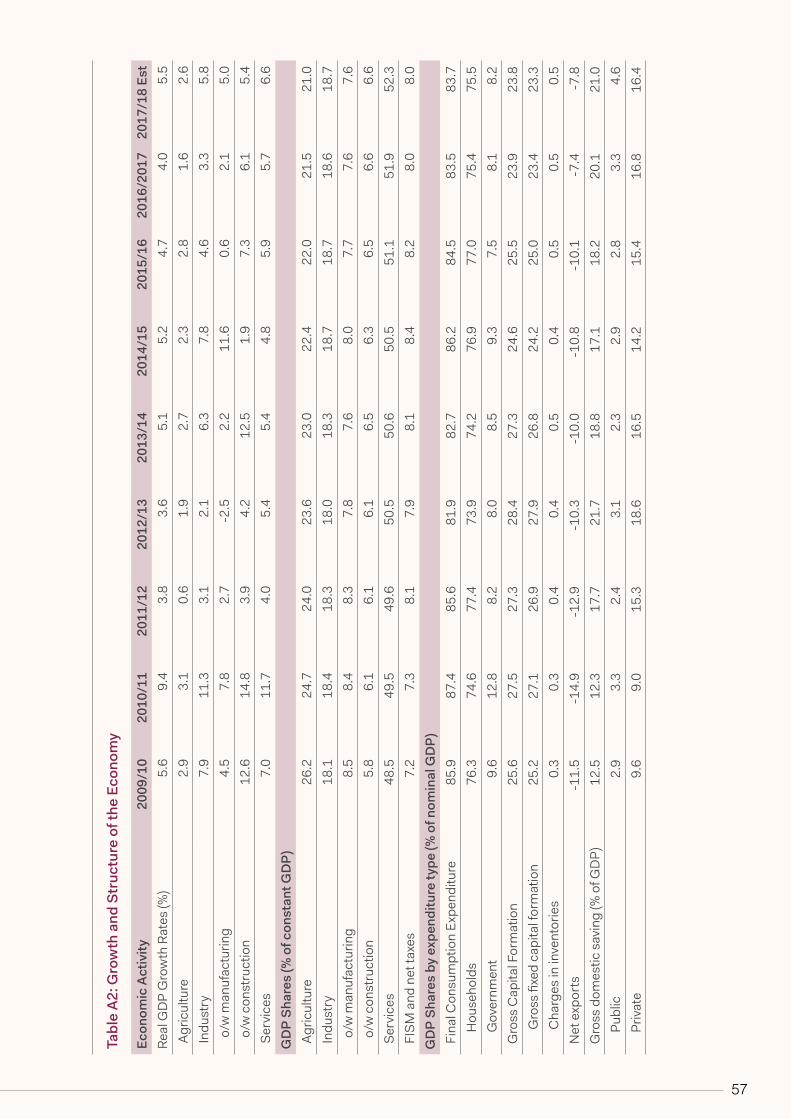
Table.A2:.Growth.and.Structure.of.the.Economy
Econ
omic
Act
ivity
2009
/10
2010
/11
2011
/12
2012
/13
2013
/14
2014
/15
2015
/16
2016
/201
720
17/1
8 Es
tRe
al G
DP
Gro
wth
Rat
es (%
)5.
69.
43.
83.
65.
15.
24.
74.
05.
5 A
gric
ultu
re2.
93.
10.
61.
92.
72.
32.
81.
62.
6 I
ndus
try
7.9
11.3
3.1
2.1
6.3
7.8
4.6
3.3
5.8
o/
w m
anuf
actu
ring
4.5
7.8
2.7
-2.5
2.2
11.6
0.6
2.1
5.0
o/
w c
onst
ruct
ion
12.6
14.8
3.9
4.2
12.5
1.9
7.3
6.1
5.4
Ser
vice
s7.
011
.74.
05.
45.
44.
85.
95.
76.
6GDP.Sh
ares.(%
.of.constant.G
DP)
Agr
icul
ture
26.2
24.7
24.0
23.6
23.0
22.4
22.0
21.5
21.0
Ind
ustr
y18
.118
.418
.318
.018
.318
.718
.718
.618
.7
o/w
man
ufac
turin
g8.
58.
48.
37.
87.
68.
07.
77.
67.
6
o/w
con
stru
ctio
n5.
86.
16.
16.
16.
56.
36.
56.
66.
6 S
ervi
ces
48.5
49.5
49.6
50.5
50.6
50.5
51.1
51.9
52.3
FIS
M a
nd n
et ta
xes
7.2
7.3
8.1
7.9
8.1
8.4
8.2
8.0
8.0
GDP.Sh
ares.by.expenditure.type.(%
.of.nom
inal.GDP)
Fin
al C
onsu
mpt
ion
Expe
nditu
re85
.987
.485
.681
.982
.786
.284
.583
.583
.7
Hou
seho
lds
76.3
74.6
77.4
73.9
74.2
76.9
77.0
75.4
75.5
G
over
nmen
t9.
612
.88.
28.
08.
59.
37.
58.
18.
2 G
ross
Cap
ital F
orm
atio
n25
.627
.527
.328
.427
.324
.625
.523
.923
.8
Gro
ss fi
xed
capi
tal f
orm
atio
n25
.227
.126
.927
.926
.824
.225
.023
.423
.3
Cha
rges
in in
vent
orie
s0.
30.
30.
40.
40.
50.
40.
50.
50.
5 N
et e
xpor
ts-1
1.5
-14.
9-1
2.9
-10.
3-1
0.0
-10.
8-1
0.1
-7.4
-7.8
Gro
ss d
omes
tic s
avin
g (%
of G
DP)
12.5
12.3
17.7
21.7
18.8
17.1
18.2
20.1
21.0
P
ublic
2.9
3.3
2.4
3.1
2.3
2.9
2.8
3.3
4.6
P
rivat
e9.
69.
015
.318
.616
.514
.215
.416
.816
.4
57

Table.A3:.Central.Governm
ent.Fiscal.Framew
ork.(%.of.G
DP).
Item
2008
/09
2009
/10
2010
/11
2011
/12
2012
/13
2013
/14
2014
/15
2015
/16
2016
/17
2017
/18
App
. B
udge
t20
17/1
8 Es
t
REV
ENU
ES A
ND
GR
AN
TS13
.512
.715
.513
.112
.812
.614
.415
.215
.416
.215
.2 R
even
ues
11.0
10.5
13.6
11.2
11.3
11.6
13.2
13.8
14.3
14.4
13.7
U
RA10
.610
.310
.910
.311
.011
.412
.413
.013
.513
.613
.2
Non
-URA
0.4
0.3
0.2
0.2
0.3
0.5
0.6
0.7
0.7
0.8
0.4
O
il Re
venu
es0.
00.
02.
50.
70.
00.
00.
20.
10.
10.
00.
1 G
rant
s2.
62.
11.
91.
91.
41.
01.
21.
41.
01.
81.
5
Bud
get S
uppo
rt1.
51.
11.
11.
00.
30.
30.
30.
40.
30.
30.
3
Pro
ject
Sup
port
1.0
1.0
0.8
0.9
1.1
0.7
0.9
1.0
0.8
1.5
1.2
EXPE
ND
ITU
RE
AN
D L
END
ING
15.0
16.7
19.1
15.6
16.2
16.6
18.7
20.1
19.3
22.5
19.3
Cur
rent
Exp
endi
ture
s9.
510
.512
.79.
19.
09.
510
.011
.011
.010
.410
.9
Wag
es a
nd S
alar
ies
3.4
3.2
3.5
3.1
3.3
3.4
3.6
3.6
3.7
3.7
4.0
In
tere
st P
aym
ents
1.0
0.9
0.9
1.0
1.4
1.4
1.6
2.0
2.6
2.7
2.7
O
ther
Rec
urr.
Expe
nditu
res
5.1
6.4
8.2
5.0
4.3
4.8
4.8
5.4
4.7
4.0
4.2
Dev
elop
men
t Exp
endi
ture
s4.
86.
16.
16.
16.
57.
06.
87.
17.
49.
88.
5N
et L
endi
ng/R
epay
men
ts-0
.2-0
.1-0
.1-0
.10.
60.
01.
61.
80.
61.
90.
7D
omes
tic A
rrea
rs R
epay
m.
0.8
0.2
0.4
0.5
0.1
0.0
0.3
0.1
0.2
0.4
0.5
OVE
RA
LL D
EFIC
ITO
vera
ll Fi
scal
Bal
. (ex
cl. G
rant
s)-4
.0-6
.1-5
.5-4
.4-4
.9-5
.0-5
.6-6
.7-4
.5-8
.0-5
.4O
vera
ll Fi
scal
Bal
. (in
cl. G
rant
s)-1
.5-4
.0-3
.6-2
.5-3
.5-4
.0-4
.4-5
.3-3
.5-6
.2-3
.9
Fina
ncin
g:1.
54.
03.
62.
53.
54.
04.
45.
33.
56.
23.
9 E
xter
nal F
inan
cing
(Net
)1.
61.
91.
51.
92.
21.
31.
23.
02.
95.
32.
7 D
omes
tic F
inan
cing
(Net
)0.
01.
72.
30.
01.
12.
33.
22.
30.
60.
91.
2
MEM
OR
AN
DA
ITEM
SN
omin
al G
DP
(Shs
bill
ions
)34
504
4094
647
078
5942
064
758
7045
876
517
8290
391
351
1005
5210
1708
58

Tabl
e A
4. M
onet
ary
indi
cato
rs20
08/9
2009
/10
2010
/11
2011
/12
2012
/13
2013
/14
2014
/15
2015
/16
2016
/17
2017
/18
Est
Mon
etar
y A
ggre
gate
s M
3 as
% o
f GD
P18
.320
.522
.419
.018
.620
.121
.321
.122
.022
.6 M
2 as
% o
f GD
P14
.315
.917
.113
.014
.014
.514
.414
.515
.516
.0 M
3 gr
owth
rate
(%)
25.0
33.2
25.7
7.2
6.6
17.4
15.9
7.1
13.6
14.0
M2
grow
th ra
te (%
)26
.332
.123
.9-4
.215
.714
.18.
88.
916
.014
.8D
omes
tic C
redi
t T
otal
dom
estic
cre
dit (
% o
f GD
P)9.
211
.916
.011
.812
.513
.816
.717
.216
.216
.5 P
rivat
e se
ctor
cre
dit (
% o
f GD
P)10
.411
.414
.312
.712
.412
.914
.313
.713
.313
.5 T
otal
dom
estic
cre
dit g
row
th (%
)64
.154
.754
.1-6
.513
.421
.932
.310
.82.
613
.4 P
rivat
e se
ctor
cre
dit g
row
th (%
)31
.329
.844
.111
.66.
014
.120
.34.
35.
712
.5In
tere
st R
ates
Str
uctu
re A
vera
ge T
B ra
te (p
erio
d av
erag
e, %
)8.
45.
37.
617
.210
.39.
912
.017
.813
.29.
0 A
vera
ge le
ndin
g ra
te (%
)20
.920
.719
.824
.624
.822
.221
.624
.022
.620
.8 A
vera
ge d
epos
it ra
te (%
)2.
12.
02.
13.
23.
03.
12.
83.
03.
52.
7
59

Table.A5.1:.Balance.of.Payments.(percent.of.G
DP.unless.otherwise.stated)
2009
/10
2010
/11
2011
/12
2012
/13
2013
/14
2014
/15
2015
/16
2016
/17
2017
/18
Est
Cur
rent
Acc
ount
(inc
l tra
nsfe
rs)
-8.1
-9.8
-9.5
-6.3
-7.6
-6.8
-4.9
-4.0
-3.8
Exp
orts
of g
oods
11.5
11.3
11.4
11.7
9.7
10.1
11.1
12.4
11.9
o
/w c
offee
1.3
1.8
1.9
1.7
1.5
1.5
1.4
1.9
2.0
Im
port
s of
goo
ds-2
0.4
-23.
1-2
2.6
-20.
1-1
8.3
-18.
3-1
8.9
-17.
8-1
7.9
o
/w o
il im
port
s-2
.5-3
.4-4
.1-4
.1-3
.9-3
.4-2
.6-2
.6-2
.6 S
ervi
ces
(net
)-2
.1-3
.4-1
.7-1
.6-1
.2-2
.5-2
.7-1
.9-1
.7 T
rade
bal
ance
-8.9
-11.
8-1
1.1
-8.5
-8.5
-8.3
-7.8
-5.4
-6.0
Inc
ome
(net
)-1
.7-1
.7-2
.0-2
.1-2
.2-1
.6-1
.7-2
.2-2
.5 C
urre
nt tr
ansf
ers
(net
)4.
67.
15.
35.
94.
35.
16.
35.
35.
5
Cap
ital a
nd F
inan
cial
Acc
ount
8.8
5.3
10.1
6.1
6.5
4.2
4.2
3.2
3.4
Cap
ital a
ccou
nt1.
00.
80.
80.
10.
30.
40.
50.
60.
6 F
inan
cial
acc
ount
7.9
4.5
9.3
5.9
6.1
3.9
3.7
2.6
2.8
o
/w d
irect
inve
stm
ent
3.4
3.5
5.4
3.8
3.9
3.2
2.1
1.9
1.9
o
/w p
ortfo
lio in
vest
men
t0.
2-0
.0-1
.1-0
.20.
0-0
.6-0
.7-0
.00.
2
Ove
rall
Bala
nce
1.2
-2.9
3.3
2.1
1.1
1.5
2.9
1.7
1.2
Gro
ss In
tern
atio
nal R
eser
ves
(mill
ion
USD
)23
84.7
2044
.026
43.8
2912
.333
94.0
2895
.029
62.0
3380
.034
75.0
Gro
ss in
tern
atio
nal r
eser
ves
in m
onth
s of
impo
rts
4.4
3.2
4.3
4.5
5.2
5.0
5.4
5.4
5.5
60

Table.A5.2:.Balance.of.Payments.(U
S$.millions)
Varia
ble
2009
/10
2010
/11
2011
/12
2012
/13
2013
/14
2014
/15
2015
/16
2016
/17
2017
/18
Est
.C
urre
nt A
ccou
nt (i
ncl t
rans
fers
)-1
,631
.0-1
,984
.0-2
,219
.0-1
,582
.0-2
,103
.0-1
,958
.0-1
531.
0-1
,058
-1,4
00 E
xpor
ts o
f goo
ds2,
317.
02,
298.
02,
660.
02,
912.
02,
706.
02,
738.
026
88.0
3169
3320
o/
w c
offee
262.
037
1.0
444.
042
3.0
404.
040
0.0
352.
049
054
8.0
Im
port
s of
goo
ds-4
,117
.0-4
,680
.0-5
,241
.0-5
,035
.0-5
,074
.0-4
,988
.0-4
574.
0-4
718.
430
-500
0
o/w
oil
impo
rts
-501
.0-6
79.0
-947
.0-1
,028
.0-1
,090
.0-9
33.0
-646
.0-6
94-7
39.0
Ser
vice
s (n
et)
-416
.0-6
91.0
-404
.0-4
05.0
-331
.0-5
61.0
-563
.0-4
38.5
-324
.1 T
rade
bal
ance
-1,8
00.0
-2,3
82.0
-2,5
81.0
-2,1
23.0
-2,3
67.0
-2,2
50.0
-187
0.0
-199
3.2
-200
4.1
Inc
ome
(net
)-3
35.0
-341
.0-4
71.0
-528
.0-6
10.0
-492
.0-4
92.0
-582
-687
.0 C
urre
nt tr
ansf
ers
(net
)92
0.0
1,43
0.0
1,23
8.0
1,47
3.0
1,20
4.0
1,34
5.0
1411
.014
031,
540.
0
Cap
ital a
nd F
inan
cial
Acc
ount
1,78
6.0
1,08
1.0
2,35
7.0
1,51
9.0
1,81
3.0
952.
014
14.9
833
964.
9 C
apita
l acc
ount
197.
016
0.0
194.
033
.091
.099
.012
015
117
3 F
inan
cial
acc
ount
1,58
9.0
921.
02,
163.
01,
486.
01,
722.
085
3.0
1295
683
792
o
/w d
irect
inve
stm
ent
693.
071
9.0
1,24
4.0
940.
01,
087.
078
5.0
537
494
539
o
/w p
ortfo
lio in
vest
men
t31
.3-2
.1-2
64.7
-47.
026
.0-1
91.0
-151
.0-2
12.3
-104
.0
Ove
rall
Bala
nce
235.
0-5
97.0
759.
053
4.0
378.
0-3
53.0
101.
042
710
4.0
Gro
ss In
tern
atio
nal R
eser
ves
(mill
ion
USD
)2,
384.
72,
044.
02,
643.
82,
912.
333
94.0
2895
.029
62.0
3380
.034
75.0
Gro
ss in
tern
atio
nal r
eser
ves
in m
onth
s of
impo
rts
4.4
3.2
4.3
4.5
5.2
5.0
5.4
5.4
5.5
Mem
oran
da it
ems
GD
P at
cur
rent
pric
es (U
SHS
billi
ons)
40,9
46.0
47,0
78.0
59,4
20.0
64,7
58.0
7045
876
517
8290
391
351
1017
08G
DP
at c
urre
nt p
rices
(US$
mill
ions
)20
,181
.420
,262
.523
,237
.324
,663
.127
,757
.527
,102
.724
,079
.026
282.
827
998.
0Ex
chan
ge ra
te (p
erio
d av
erag
e)2,
028.
92,
323.
42,
557.
12,
591.
025
38.3
3928
23.2
2034
42.9
5735
28.2
9736
32.7
61

Table.A6..Inflation.Ra
tes.(percentage.changes)
Item
2008
/920
09/1
020
10/1
120
11/1
220
12/1
320
13/1
420
14/1
520
15/1
620
16/1
720
17/1
8 E
st.
FYFY
FYFY
FYFY
FY
FY
FYC
PI (a
vera
ge)
14.2
9.4
6.5
23.7
5.8
6.7
2.9
6.6
5.7
4.0
CPI
(end
of p
erio
d)10
.94.
64.
015
.46.
43.
04.
95.
96.
43.
8Fo
od (e
nd o
f per
iod)
27.9
16.5
9.3
12.8
-1.4
7.2
7.2
-2.1
18.1
3.0
Cor
e In
flatio
n (e
nd o
f per
iod)
8.9
6.7
5.7
19.5
5.8
2.9
5.0
6.8
53.
5
62

63

64

65

For more information, please visit:
www.worldbank.org/en/uganda
Join the discussion on:
http://www.facebook.com/worldbankafrica
http://www.twitter.com/worldbankafrica
http://www.youtube.com/worldbank