financing fiscal deficits in uganda: options and strategy · financing fiscal deficits in uganda:...
TRANSCRIPT

Financing Fiscal Deficits in Uganda: Options and Strategy
Ben Langforda and Christine R. Asiimwe Namanyab
a International Growth Centre (contact: [email protected]) and b Bank of Uganda (contact: [email protected])
April 2014

1
Financing Fiscal Deficits in Uganda: Options and Strategy
Ben Langford (International Growth Centre)
and
Christine R. Asiimwe Namanya (Bank of Uganda)
April 2014
Abstract
Uganda is in a transitional period both in terms of financing needs and opportunities. Since Fiscal Year 2009/10, net financing requirements have consistently exceeded available net concessional lending – and this trend looks set to continue into the medium term. At the same time an increasing range of alternative, non-concessional financing options have begun to open up, both domestic and external. This expansion of Uganda’s deficit financing policy space brings both opportunities and risks – and presents the authorities with new challenges, namely, to determine the appropriate recourse to and mix between the various financing options. This paper aims to assist the authorities’ consideration of these issues.
The authors would like to thank officials and advisors at the Ministry of Finance, Planning and Economics Development (MoFPED) and the Bank of Uganda, and colleagues at the International Growth Centre, for valuable comments and discussions – and would in particular like to acknowledge the valuable contributions of Martin A. Nsubuga from MoFPED. The views expressed in this paper are solely those of the authors and do not necessarily reflect the official views of the Ugandan authorities. Any errors are those of the authors.

2
Contents
Abstract ...................................................................................................................................... 1
List of Acronyms and Abbreviations .......................................................................................... 3
Executive Summary .................................................................................................................... 4
1. Introduction ........................................................................................................................... 7
2. Fiscal Deficit Financing Options ........................................................................................... 10
2.1 Context ........................................................................................................................... 10
2.2 Domestic borrowing: Treasury Bill and Bond issuance ................................................. 13
2.3 Commercial external borrowing: Eurobond issuance ................................................... 25
2.4 Concessional external borrowing .................................................................................. 31
2.5 Semi-Concessional external borrowing ......................................................................... 32
2.6 GoU savings (Bank of Uganda Financing) ...................................................................... 33
3. Forming a Financing Strategy: Considerations .................................................................... 34
3.1 Context ........................................................................................................................... 34
3.2 Meeting GoU’s debt management objectives ............................................................... 35
3.3 Potential medium-term financing strategies ................................................................. 39
4. Conclusion ............................................................................................................................ 49
References ............................................................................................................................... 52
Annex 1: Financing scenarios for FY13/14 to FY19/20 – Selected MTDS model outputs ....... 56

3
List of Acronyms and Abbreviations
ATM Average Time to Maturity BoU Bank of Uganda DD Domestic Debt DMO Debt Management Office EAC East African Community EME Emerging-Market Economy FY Fiscal Year GDP Gross Domestic Product GoU Government of Uganda IMF International Monetary Fund LIC Low-Income Country MoFPED Ministry of Finance, Planning and Economic Development MTDS Medium-Term Debt Management Strategy NDP National Development Plan PDPF Public Debt Policy Framework PPP Public Private Partnership PSC Private Sector Credit PV Present Value SSA Sub-Saharan Africa VAT Value-Added Tax WB World Bank

4
Executive Summary
Until recently, Uganda’s budget deficits were predominantly financed by concessional borrowing. However, Uganda has now entered a transitional period in terms of both financing needs and opportunities. Net financing requirements have begun to exceed available concessional lending – and as the government continues to increase spending on infrastructure this trend looks set to continue into the medium term.
At the same time, an increasing range of alternative financing options have begun to open up. Domestically, the continued development of the financial sector has expanded the opportunities for Treasury securities issuance. Externally, semi-concessional lending (particularly from non-traditional lenders) is emerging as an increasingly important financing source, whilst international markets have displayed considerable appetite for commercial lending to ‘frontier’ sovereigns. This expansion of Uganda’s deficit financing policy space brings both opportunities and risks – and presents the authorities with new challenges, namely, to determine the appropriate recourse to and mix between the various financing options. Addressing these challenges requires identifying the different costs, risks and broader impacts of each potential financing option, and assessing the trade-offs between them.
Since Financial Year 2012/13 (FY12/13) Uganda has begun to issue Treasury securities for fiscal purposes. The authorities face a challenge in determining what space this avenue of financing may provide, and to what extent this space should be taken up. In particular, evidence suggests that domestic debt (DD) issuance can cause crowding out of private sector investment – but that this can be mitigated and, up to a certain level, offset by a variety of other factors. While precise, quantitative guidance in this area is limited, combining recent academic research with practical policy considerations can help provide some useful steers as the Government of Uganda (GoU) addresses this issue.
At 11.1 per cent of GDP at end-FY12/13, Uganda’s DD stock is below the sub-Saharan African (SSA) average of around 15 per cent of GDP, and comfortably within IMF and World Bank guidelines. Available evidence suggests: that a range for annual net DD issuance over the medium term of 1.2 per cent of GDP (consistent with maintaining the DD-to-GDP ratio at its current level) to 2.0 per cent of GDP (consistent with the DD stock rising to 15 per cent of GDP) is a useful guide for what levels GoU might consider; that the 1.6 per cent of GDP net issuance planned in the Budget for FY13/14 looks very reasonable for this year; and that levels of net issuance up to 2.0 per cent of GDP per year could be warranted over the medium term – but the higher the level of net issuance undertaken, the more pressing it will be to deliver reforms that increase financial depth, broaden the Treasury securities investor base, and that overall help to minimise the costs and maximise the benefits of DD issuance.
There are a range of policy actions the government can implement to help minimise the costs and maximise the benefits of DD, for any level and composition of issuance. These
5
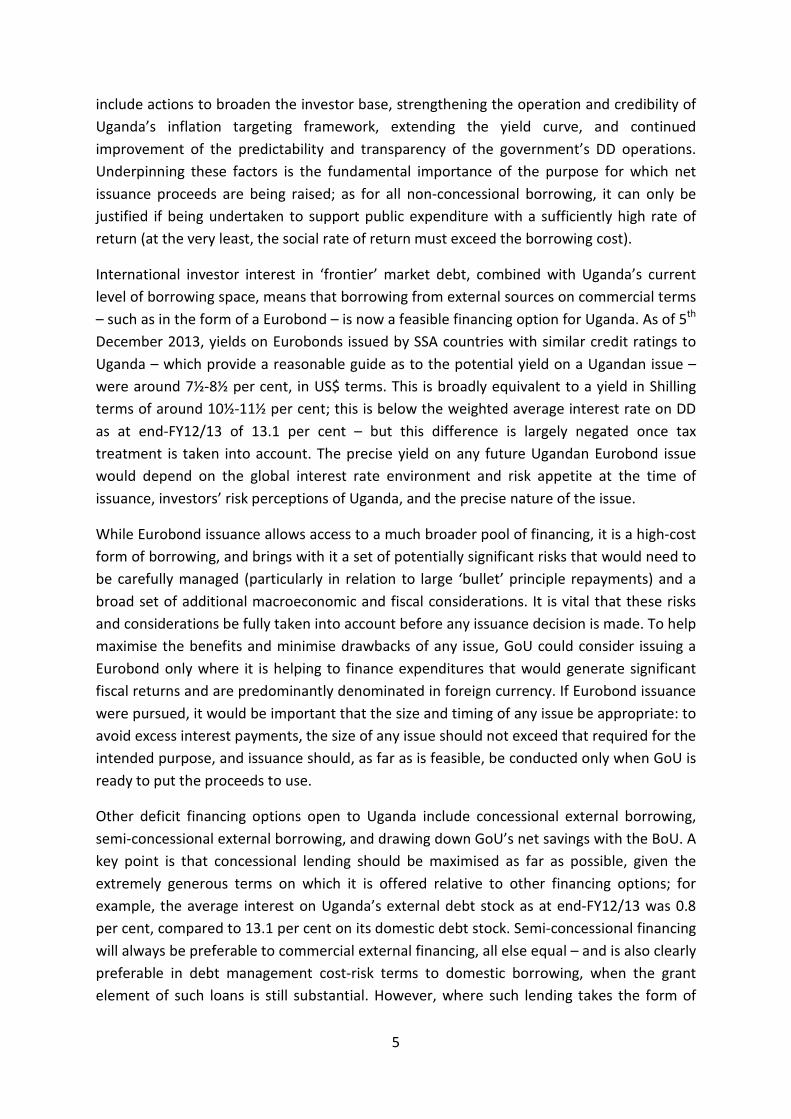
include actions to broaden the investor base, strengthening the operation and credibility of Uganda’s inflation targeting framework, extending the yield curve, and continued improvement of the predictability and transparency of the government’s DD operations. Underpinning these factors is the fundamental importance of the purpose for which net issuance proceeds are being raised; as for all non-concessional borrowing, it can only be justified if being undertaken to support public expenditure with a sufficiently high rate of return (at the very least, the social rate of return must exceed the borrowing cost).
International investor interest in ‘frontier’ market debt, combined with Uganda’s current level of borrowing space, means that borrowing from external sources on commercial terms – such as in the form of a Eurobond – is now a feasible financing option for Uganda. As of 5th December 2013, yields on Eurobonds issued by SSA countries with similar credit ratings to Uganda – which provide a reasonable guide as to the potential yield on a Ugandan issue – were around 7½-8½ per cent, in US$ terms. This is broadly equivalent to a yield in Shilling terms of around 10½-11½ per cent; this is below the weighted average interest rate on DD as at end-FY12/13 of 13.1 per cent – but this difference is largely negated once tax treatment is taken into account. The precise yield on any future Ugandan Eurobond issue would depend on the global interest rate environment and risk appetite at the time of issuance, investors’ risk perceptions of Uganda, and the precise nature of the issue.
While Eurobond issuance allows access to a much broader pool of financing, it is a high-cost form of borrowing, and brings with it a set of potentially significant risks that would need to be carefully managed (particularly in relation to large ‘bullet’ principle repayments) and a broad set of additional macroeconomic and fiscal considerations. It is vital that these risks and considerations be fully taken into account before any issuance decision is made. To help maximise the benefits and minimise drawbacks of any issue, GoU could consider issuing a Eurobond only where it is helping to finance expenditures that would generate significant fiscal returns and are predominantly denominated in foreign currency. If Eurobond issuance were pursued, it would be important that the size and timing of any issue be appropriate: to avoid excess interest payments, the size of any issue should not exceed that required for the intended purpose, and issuance should, as far as is feasible, be conducted only when GoU is ready to put the proceeds to use.
Other deficit financing options open to Uganda include concessional external borrowing, semi-concessional external borrowing, and drawing down GoU’s net savings with the BoU. A key point is that concessional lending should be maximised as far as possible, given the extremely generous terms on which it is offered relative to other financing options; for example, the average interest on Uganda’s external debt stock as at end-FY12/13 was 0.8 per cent, compared to 13.1 per cent on its domestic debt stock. Semi-concessional financing will always be preferable to commercial external financing, all else equal – and is also clearly preferable in debt management cost-risk terms to domestic borrowing, when the grant element of such loans is still substantial. However, where such lending takes the form of

6
tied aid – without competitive procurement or independent evaluation of associated projects – it is difficult to assess the true financing cost and degree of concessionality.
The illustrative fiscal scenario considered in this paper shows that meeting the full extent of GoU’s infrastructure financing goals over the medium term would require a series of elevated fiscal deficits, and drive an accompanying increase in the debt-to-GDP ratio (although to an extent that should remain comfortably within standard debt sustainability benchmarks), before oil revenues come on stream towards the end of this decade. In such a scenario, the availability of semi-concessional borrowing would be an important factor in influencing GoU’s freedom in determining its financing strategy. Some simple simulations suggest that if around $250 million (or 0.8 per cent of GDP) on average were raised from this source each year, then net DD issuance consistent with raising the DD-to-GDP ratio to 15 per cent would still not fully cover GoU’s net financing requirements, and it could be necessary to issue around $400 million of commercial external debt over the medium term. A higher degree of semi-concessional lending would permit greater freedom in choosing whether or not to issue a Eurobond versus higher recourse to domestic borrowing.
As projected levels of debt rise and financing choices become more complex, the continued development of debt management capacity becomes increasingly important; this should include accelerating the setting-up of a specialist Debt Management Office. Continued improvement in the predictability and transparency of GoU’s market-based debt operations – such as through the proposed annual publications of a medium-term debt management strategy document and Debt Management Report – should also help build market confidence, and ultimately help support market demand.
It is also important to consider the broader fiscal context. The choice between alternative financing strategies can have a substantive impact on the overall fiscal position and the risks to which it is exposed – but it should be noted that this can be considerably outweighed by the magnitudes involved with fiscal policy choices on revenues, expenditures and the size of the primary fiscal deficit. On the expenditure side, in order to best-support debt dynamics it is crucial that borrowing is being conducted to finance ‘productive’ public spending.
Furthermore, there are also a number of measures GoU should pursue which will reduce the overall need for recourse to borrowing – including encouraging greater private sector involvement (such as through public-private partnerships), re-balancing budgetary priorities and improving value for money across government expenditures, increasing tax and non-tax revenues, and maximising access to grants. Finally, as GoU moves towards greater use of market-based financing, it will be increasingly important that investor perceptions and confidence in GoU’s fiscal plans are managed. If GoU were to undertake a significant expansion in public investment, resulting in an extended period of sizeable fiscal deficits prior to oil revenues coming on stream, it would be vital for GoU to build, maintain and communicate a strong and credible story around the effective management of debt, the use of issuance proceeds, and the promise that deficits will be unwound over time.

7
1. Introduction
Until recently, Uganda’s budget deficits were financed predominantly by concessional borrowing. However, Uganda has now entered a transitional period both in terms of financing needs and opportunities. Since Fiscal Year 2009/10 (FY09/10) net financing requirements have consistently exceeded available concessional lending – and, as the government continues to increase spending on infrastructure, this trend looks set to continue into the medium term.1
At the same time, an increasing range of alternative, non-concessional financing options have begun to open up – both domestically, as the increasing development of the domestic financial sector has expanded the opportunities for Treasury securities issuance, and externally, reflecting the increased importance of non-traditional lenders and market appetite for commercial lending to ‘frontier’ sovereigns. Since 2010 the Government of Uganda (GoU) has secured increases in the non-concessional external borrowing limit under the country’s Policy Support Instrument with the IMF, from $500 million to $2.2 billion, in order to provide greater space to pursue non-concessional external borrowing options.2 In FY12/13, GoU began to issue domestic debt explicitly for fiscal purposes.
This expansion of Uganda’s deficit financing policy space brings both opportunities and risks – and presents the authorities with new challenges, in determining the appropriate recourse to and mix between the various financing options. Addressing these challenges requires identifying the different costs, risks and broader impacts of each potential financing option, and assessing the trade-offs between them. This paper aims to assist the authorities’ consideration of these issues. It seeks to complement the Ministry of Finance, Planning and Economic Development’s (MoFPED) (2013c) overview of Uganda’s medium- and long-term fiscal policy options and their macroeconomic implications, and Adam and Bevan’s (2013) analysis of the interaction between public investment, broader fiscal policy and the macroeconomy, by focusing on ‘below-the-line’ issues of financing fiscal deficits.
The specific period considered in this paper is from FY13/14 to FY19/20 – i.e. out to the end of the next five-year National Development Plan (NDP). The paper aims to set out considerations that can help guide financing decisions regardless of the precise path for the fiscal deficit over this period. However, MoFPED (2013c) is used as a practical frame of reference for some quantitative discussions; it shows that delivering the full extent of GoU’s public investment goals over the period to the end of the next NDP, even if ambitious domestic revenue goals are achieved, would imply a need to finance a series of elevated fiscal deficits before oil revenues come on stream around the end of the decade.3
1 See for example Ministry of Finance, Planning and Economic Development (MoFPED) (2013a), Table 26. 2 See IMF (2013a) and IMF (2013c). 3 Analysis and judgement on the appropriate path for the fiscal deficit – including the implications of a period of sustained larger fiscal deficits on macroeconomic outcomes – are beyond the scope of this paper; for some discussion, see MoFPED (2013c) and Adam and Bevan (2013).

8
Whilst this paper focuses on below-the-line issues, it is important to note the broader fiscal issues around infrastructure financing, the total size of the deficit and debt, and debt sustainability. There are a variety of options available to GoU to help finance an expansion of infrastructure investment before recourse to additional borrowing: for example, private sector involvement through Public-Private Partnerships (PPPs) will limit the volume of investment required of government; re-balancing budgetary priorities and improving value for money across government expenditures would free up more resources for GoU to spend on infrastructure, for any given level of total government expenditure; and increasing tax and non-tax revenues will allow total government expenditure to expand without widening the fiscal deficit. All these options should be pursued by government (in addition to maximising donor grants aid flows). However, the size of the government’s investment plans are such that it is likely that expenditure will need to increase beyond what can be met from these sources alone – necessitating a sustained fiscal deficit that will need to be financed by other means.
It is crucial to bear in mind the potential impact of a series of sustained fiscal deficits, and how they are financed, on the level of government debt and debt sustainability.4 However, with total nominal public debt at 29.3 per cent of GDP at the end of FY12/13 (21.7 per cent of GDP in present value terms),5 GoU has room to expand its debt stock if it so wishes; and recent debt sustainability analyses by both GoU and the IMF6 – although highlighting potential risks – judge Uganda to be at low risk of debt distress. The fiscal projections set out in MoFPED (2013c), consistent with GoU meeting the full extent of its public investment goals over the medium term, are consistent with the total public debt-to-GDP ratio remaining within standard debt sustainability benchmarks.7 Furthermore, whilst debt management will feed back into debt sustainability dynamics to some extent (for example, for a given primary deficit, a greater reliance on non-concessional financing will entail higher interest costs and thus lead to a higher total deficit and debt stock over time), simple analysis suggests that these concerns are only of second-order importance compared to fiscal policy decisions on the planned path for the fiscal deficit (see Section 3). Therefore, whilst it is vital to ensure debt sustainability is maintained, it is not deemed at risk within the time period and a scenario of considerably-higher public investment (see Section 3.3.1) considered in this paper.
Within this context, this paper therefore focuses on below-the-line issues of deficit financing. In particular, it seeks to address these questions: what are the key costs and risks, broader macroeconomic implications, and implementation issues associated with the
4 Such a fiscal policy stance will also have significant macroeconomic effects – though discussion of this important issue is outside the scope of this paper. 5 The fiscal year runs from 1st July to 30th June. 6 MoFPED (2012), and IMF (2013c). 7 For example, in the main fiscal scenario, total nominal debt peaks at around 40 per cent of GDP – well below the 75 per cent indicative sustainability benchmark estimated in IMF and World Bank (2012) applicable for Uganda.

9
different financing sources open to GoU? To what extent can domestic debt help finance the budget deficit over the medium term? And how should domestic borrowing be balanced with concessional and non-concessional external borrowing?
After this introduction, Section 2 sets out the main deficit financing options open to GoU and the key considerations for each – incorporating evidence from recent research findings, and with a particular focus on domestic debt and Eurobond issuance. Section 3 provides some initial considerations for determining the appropriate balance between the available financing options, within the context of a scenario where GoU aims to meet the full extent of its public investment goals. Section 4 concludes.

10
2. Fiscal Deficit Financing Options
2.1 Context
2.1.1 GoU deficit financing in the recent past
Over most of the 2000’s, GoU funded its fiscal deficits largely with concessional external financing alone; no non-concessional external loans were contracted, and domestic financing was predominantly limited to moderate changes in GoU’s net position with the Bank of Uganda (BoU).8 Figure 2.1 illustrates the breakdown of total net financing in to external and domestic sources since FY01/02.
Figure 2.1: External9 and domestic10 financing of the fiscal deficit since FY01/02
Notes: (1) Net external financing almost wholly reflects net concessional lending. (2) Net domestic financing up to FY11/12 predominantly reflects changes in GoU’s net position with the BoU; in contrast, in FY12/13 it is predominantly (over 90 per cent) accounted for by net issuance of Treasury securities to commercial banks and the broader non-bank public. (3) Differences between the fiscal deficit and the sum of net external and net domestic financing reflect errors and omissions. Source: MoFPED Central Government Budgetary Statistics.
8 Or more precisely: domestic financing was predominantly limited to moderate changes in GoU’s net positive position with the BoU excluding proceeds from net Treasury securities issuance. Up until the start of FY12/13 Treasury securities were issued ostensibly for monetary policy purposes only – with all issuance proceeds being deposited at the BoU. The impact of Treasury securities issuance during this period on net fiscal financing was zero: net issuance proceeds were offset fully by equivalent deposits in the BoU. 9 There is no available breakdown of historical net external financing by level of concessionality. Note however that in the time period here, semi-concessional loans have only been contracted – and sparingly so (see below) – since 2009, and that Uganda has yet to issue any external debt at a fully commercial rate of interest. 10 Note that ‘domestic’ debt is defined in this paper on a currency basis, rather than on the basis of the residency of the holder.
-4%
-3%
-2%
-1%
0%
1%
2%
3%
4%
5%
6%
FY 0
1/02
FY 0
2/03
FY 0
3/04
FY 0
4/05
FY 0
5/06
FY 0
6/07
FY 0
7/08
FY 0
8/09
FY 0
9/10
FY 1
0/11
FY 1
1/12
FY 1
2/13
Domestic financing (net) External financing (net)Fiscal deficit
Per cent of GDP

11
However, since FY09/10, some significant changes have begun to take place: as the fiscal deficit expanded, domestic financing has begun to play a much more important role, and new modes of deficit financing have begun to be used. Over FY09/10 and FY10/11 around half of GoU’s deficit financing requirements were met domestically, with GoU drawing down on its net position with the BoU; and in FY12/13, Uganda issued Treasury securities explicitly for fiscal purposes for the first time, with net issuance equivalent to 1.2 per cent of GDP.11 Furthermore, since 2009 Uganda has begun to contract some semi-concessional external debt (see below).
2.1.2 The current debt stock
Figure 2.2 plots the stock of total, external and domestic debt over recent years (as ratios to GDP). In addition to the direct effect of annual borrowing flows, the size of the total debt stock is also influenced by factors such as exchange rate movements, domestic debt issuance for monetary policy purposes, and (in years past) external debt relief. The figure shows the significant impact of debt relief: external debt decreased from a peak of 67.8 per cent of GDP at end-FY02/03 to a low of 11.0 per cent of GDP at end-FY06/07. GoU has already begun to utilise the borrowing space this created: total debt has increased from 20.0 per cent of GDP at end-FY06/07 to 29.3 per cent of GDP at end-FY12/13 (Shs.16.0 trillion, or US$6.2 billion). This rise has been driven in large part by a substantial increase in public investment,12 and primarily reflects an increase in external debt (almost wholly accounted for by concessional loans), which has increased by 7.1 percentage points over this period to 18.1 per cent of GDP (Shs.9.9 trillion, or US$3.8 billion). Domestic debt (Treasury Bills and Bonds) as a share of GDP has remained relatively flat over the past decade or so, though it has risen 3.7 percentage points over the past three years to 11.1 per cent of GDP (Shs.6.1 trillion, or US$2.3 billion).1314 Figure 2.3 provides some key indicators of the cost and risk characteristics of the gross debt stock as of end-FY12/13. The weighted average interest rate on the external debt stock was significantly lower than on the domestic debt stock (at 0.8 per cent, compared to 13.1 per cent), and the average time to maturity much higher (at 19.6 years, compared to 1.7 years) 11 Note that the figure of 1.2 per cent of GDP net issuance in FY12/13 excludes Shs.410 billion (0.7 per cent of GDP) of securities issued directly to BoU as part of a recapitalisation. 12 Net public investment (or more specifically: the net acquisition of nonfinancial assets) rose from a low of 2.2 per cent of GDP in FY06/07, to 4.7 per cent of GDP in FY12/13. Over this seven-year period, net public investment has averaged 3.2 per cent of GDP – just above the average fiscal deficit of 3.1 per cent of GDP. (Source: MoFPED Government Finance Statistics.) 13 The 0.1 percentage point difference between the total debt stock figure and the sum of the domestic and external stock figures is due to rounding. 14 Of the external debt stock as at end-FY12/13, 87 per cent was contracted from multilaterals, and 13 per cent from bilaterals (of which China accounted for 8 percentage points). Of domestic debt, commercial banks held 51.8 per cent, the BoU held 6.7 per cent, and the remaining 41.5 per cent was held by others including pension funds, insurance companies, and individuals. Overall, 7.2 per cent (Shs.488.8 billion) of Treasury securities were held by offshore investors.

12
– reflecting the very different nature of concessional external debt (which is contracted at tenors of up to 50 years, and at very low rates of interest) compared to domestic debt (which is issued at market rates of interest, and with the longest maturity at present being 15 years). Although the stock of domestic debt is lower than that of external debt, total interest payments on domestic debt are significantly higher – at 10.7 per cent as a share of budget revenues (excluding grants) in FY12/13, compared to only 1.4 per cent for external debt interest payments.
Figure 2.2: Uganda’s total, domestic and external debt stocks as a per cent of GDP, FY01/02-FY12/13
Notes: The chart shows gross debt stocks. The domestic debt stock is reported at cost value. Source: MoFPED, BoU.
Figure 2.3: Selected cost and risk indicators of Uganda’s debt portfolio, end-FY12/13
* Interest payments as per cent of budget revenues, excluding grants. ‘FX’ = ‘foreign currency’. Source: Estimates as in the draft Public Debt Policy Framework, MoFPED (2013), mimeo.
0%
10%
20%
30%
40%
50%
60%
70%
80%
FY01
/02
FY02
/03
FY03
/04
FY04
/05
FY05
/06
FY06
/07
FY07
/08
FY08
/09
FY09
/10
FY10
/11
FY11
/12
FY12
/13
Domestic Debt (% GDP)
External Debt (% GDP)
Total Debt (% GDP)
External debt Domestic debt Total debt18.1 11.1 29.110.6 11.1 21.7
Cost of debt Weighted av. interest rate (%) 0.8 13.1 5.5Interest payments as % revenues* 1.4 10.7 12.1Average time to maturity (years) 19.6 1.7 12.8Debt maturing in 1 year (% of total) 1.3 55.0 21.7
Interest rate risk Fixed rate debt (% of total) 100.0 100.0 100.0FX risk FX debt (% of total debt) 62.1
Cost and Risk IndicatorsNominal debt as % of GDPPresent Value of debt as % of GDP
Refinancing risk

13
2.1.3 Available financing options: summary
As noted above, Uganda is in a transitional period in terms of both financing needs and opportunities, and GoU has already begun to expand the range of options it utilises: some semi-concessional external debt has been contracted since FY08/09, and Treasury Bills and Bonds have been issued explicitly for fiscal policy purposes since FY12/13. In addition to these new modalities, opportunities for borrowing externally on fully commercial terms – such as in the form of dollar-denominated ‘Eurobonds’ – have also begun to emerge. Figure 2.4 below gives a simplified overview of the main financing options open to Uganda over the medium term, by level of concessionality and currency; these are discussed in turn in the rest of this Section.
Figure 2.4: Simplified overview of Uganda’s medium-term fiscal deficit financing options
Notes: The categorisations in terms of currency and level of concessionality are only approximate: for example, there are a variety of other possible forms of commercial external borrowing; it would be feasible for some Treasury securities to be issued in foreign currency; and GoU has both Shilling and US$ deposits with the BoU. Acronyms: IDA – International Development Association; AfDB – African Development Bank; EIB – European Investment Bank; IBRD – International Bank for Reconstruction and Development.
2.2 Domestic borrowing: Treasury Bill and Bond issuance15
2.2.1 Background
With GoU having begun to issue Treasury securities for fiscal purposes, the authorities face a challenge in determining both what space does this avenue of financing provide, and to what extent should this space be taken up. Uganda is not alone in facing such questions. Domestic debt (DD) has begun to demand increasing attention across low-income countries (LICs) in recent years: as external debt relief has significantly increased the proportion of DD within total LIC debt; as the mismatch between infrastructure financing needs and the availability of concessional external loans causes countries to seek additional means of financing; and as improved macroeconomic policy frameworks and greater financial depth make increasing DD issuance more feasible.16
15 In this paper, domestic debt is defined as Shilling-denominated Treasury securities. 16 See for example IMF (2009).
Domestic ExternalConcessional - GoU net savings at
BoU- Loans with grant element ≥ 35%. From: 'traditional' multilateral and bilateral lenders (e.g. IDA, AfDB, etc).
Semi-concessional-
- Loans with grant element < 35%. From: other bilateral lenders (e.g. China); less-concessional loans from 'traditional' lenders (e.g. EIB, AfDB). Also IBRD?
Commercial - Treasury securities - Eurobonds

14
Historically, research and policy advice on DD in LICs has been limited, with attention firmly focused on external debt.17 However, in the last few years this has begun to change, and a fledgling academic literature in this area is beginning to generate evidence that can help to guide policy decisions. This section seeks to incorporate this recent evidence into a consideration of the specific issues faced by Uganda. It aims to address the key costs, risks, and broader macroeconomic implications – including the potential impact on private investment and overall economic activity – and what steps Uganda can take to maximise the benefits and minimise costs and risks as GoU decides how and how much to turn to DD financing.
Domestic debt is an area of considerable and ongoing reform in Uganda – as summarised in Box 1. Until FY11/12, Treasury Bills and Bonds were issued ostensibly18 only for monetary policy purposes; but as of FY12/13, GoU began to conduct net securities issuance primarily for fiscal policy purposes – raising around Shs.650 billion (1.2 per cent of GDP) towards the financing of the fiscal deficit that year. As reported above, by the end of FY12/13 the total stock of outstanding Treasury securities stood at 11.1 per cent of GDP; this is below the sub-Saharan Africa (SSA) average of around 15 per cent of GDP.19 In FY13/14 GoU plans to raise Shs1,040 billion, or 1.6 per cent of GDP, through net Treasuries issuance;20 this is in line with net Treasury issuance over the past ten years, which has averaged 1.5 per cent of GDP per year.
2.2.2 Costs, risks and broader considerations
Interest costs
Figure 2.3 above presented data on the direct costs of DD issuance and on the foremost debt management risks for Uganda, as at end-FY12/13. Figure 2.5A shows the full Treasury yield curve21 as at end-FY12/13 and as at 5th December 2013 for comparison; the yield curves at both these points in time have a ‘standard’ upward-slope – with yields increasing with maturity, up to a maximum of around 15 per cent on a 15-year Treasury Bond. Figure 2.5B provides more historical context, illustrating the nominal yield on 364-day Treasury Bills going back around fifteen years; the average yield over the past three months of 17 For example, only since IMF and World Bank (2012) has standard debt sustainability analysis incorporated robust quantitative benchmarks for the sustainability of total debt (i.e. inclusive of domestic debt), as opposed to external debt alone. 18 Whilst proceeds from securities issuance were placed in a theoretically-blocked account at BoU, GoU was in effect able to indirectly draw down on these deposits by using its advances facility at the BoU. As part of the recently-adopted package of reforms however, it is now GoU policy to fully fund its borrowing requirements, with no advances from the BoU over each fiscal year as a whole (MoFPED 2013a, pg59). 19 Mu et al (2013) report that government securities market capitalisation across 36 SSA was 14.8 per cent of GDP, as of 2010 (excluding South Africa the average was 14.2 per cent. The average for low-income SSA countries was 15.3 per cent). 20 MoFPED (2013a), pg75. 21 The yield curve – which is based on daily quotations provided by the primary dealers – in effect shows what rate of interest GoU could expect to pay when issuing a Treasury security of any maturity (up to the current longest maturity – recently increased to 15 years).

15
Box 1: Domestic Debt Reform in Uganda Uganda has undertaken considerable reforms in the area of domestic debt (DD) in the recent past, and further reforms are planned. Up to June 2012 Treasury Bills and Bonds were issued only for monetary policy purposes – in particular, to help manage the structural liquidity surplus created by the excess of concessional inflows (grants and loans) over GoU’s foreign-currency expenditures. The BoU was responsible for both securities issuance operations, and making broader DD management decisions.
Over time, the gap between concessional inflows and GoU’s foreign currency expenditures has narrowed – reducing the size of the structural liquidity surplus. Furthermore, from July 2011 BoU adopted a new monetary policy framework – inflation targeting ‘lite’ – under which the focus of monetary policy switched away from managing the money supply through Treasury securities issuance, to a focus on targeting short-term (7-day) interbank money market rates through repo operations. As such, the need for and role of Treasury securities issuance in monetary policy operations has abated – while in FY12/13, GoU began issuing Treasury securities for fiscal policy purposes.
With this background, GoU has adopted a new policy framework for DD, encompassing monetary policy, fiscal policy, cash management and debt management aspects. Net issuance is now conducted primarily for fiscal policy purposes. GoU is committed to fully-funding its domestic borrowing requirements through such issuance. Monetary policy operations are now conducted mainly through repos and reverse repos, with the interest costs of any such operations met by BoU. GoU is also moving towards conducting cash management using the securities markets; these reforms are aimed at ensuring that GoU always has sufficient cash available to meet its expenditure needs as they arise and runs a positive cash balance with the BoU, with any temporary recourse to BoU advances being only in exceptional circumstances.
Underpinning these changes in the use of DD, institutional changes are planned in the management of DD – with MoFPED taking on increasing strategic responsibility, and ultimately a Debt Management Office or Unit being set up. GoU has already undertaken and plans a variety of additional reforms to the issuance and management of DD. For example: an annual Treasury Bond issuance calendar was published for the first time for FY13/14; the yield curve was extended in December 2013 with the first issuance of a 15-year Bond; coupons rates are now market-determined; a yield curve is now published daily on the BoU website; and a new electronic Central Securities Depository system has been operationalised. Other reforms are planned, including the annual publication of a medium-term debt strategy and of a debt management report, and other innovations are being considered, such as the implementation of a benchmark bond programme.
Sources: MoFPED, BoU, MoFPED (2013a) pg59.

16
around 12½ per cent is a little under the average for the whole 15-year period of around 13¼ per cent. The extent to which increased reliance on DD issuance may impact on yields is discussed below.
Figures 2.5A and B: Treasury securities yield curve (2.5A), and historical 364-day Treasury Bill yield (2.5B)
Source: BoU.
Debt management risks
Uganda has done much over the past few years to decrease the refinancing risk associated with its DD stock – although risk indicators signal a continued need for further improvement. For example the proportion of the DD stock due to mature within one year has fallen from 80 per cent at the end of FY06/0722 to 55 per cent as of end-FY12/13; this is a substantial reduction, although the proportion remains above the average for a sample of twelve LICs set out in IMF and World Bank (2012) of 45 per cent23 (and far above the 1.3 per cent for Uganda’s external debt stock). Under Uganda’s draft new Public Debt Policy Framework (PDPF) GoU plans to continue this trend, by structuring securities issuance so as to reduce the proportion of the debt stock maturing within a year and to lengthen the average time to maturity. This will be supported by extending the yield curve, initially through the recent introduction of a 15-year Treasury Bond. Interest rate risk has been minimised by issuing to date only fixed-coupon securities.24
22 MoFPED (2007). 23 This figure refers to 2010/11 data. 24 Variable rate borrowing is not considered in this paper. All else equal, variable coupon instruments will be more risky for government, but lower cost – and may well be worth considering in future as part of an optimal financing strategy. In particular, inflation-linked domestic debt would have broader benefits of bolstering the credibility of the inflation-targeting framework. Such instruments could be considered once the fundamental stages of domestic debt market reforms are completed and related debt management capacity fully put in place.
89
10111213141516
0 5 10 15
Yiel
d to
mat
urity
(%)
Time to maturity (years)
As at 5th Dec 2013As at 28th June 2013
0
5
10
15
20
25
30
Jul-9
8Ju
l-99
Jul-0
0Ju
l-01
Jul-0
2Ju
l-03
Jul-0
4Ju
l-05
Jul-0
6Ju
l-07
Jul-0
8Ju
l-09
Jul-1
0Ju
l-11
Jul-1
2Ju
l-13
Nominal 364-day Treasury Bill yield%

17
Broader considerations: crowding out, and economic growth
These cost and risk indicators just discussed are fundamental to help understand and manage the cost-risk implications of DD issuance. However, the implications of DD encompass a much broader set of issues which also need to be taken into consideration. Box 2 provides a brief overview of this broad set of pros and cons.25
Of the pros and cons, the risk of crowding out private investment and the potential impact on debt sustainability have in the past attracted the most attention from researchers and policymakers. Domestic borrowing by government has the potential to crowd out private investment by using a portion of domestic savings that would otherwise be available for private borrowers and driving up the cost of capital;26 however, these forces can be mitigated – and potentially even offset – by factors such as the reaction of domestic private saving, and the openness of the capital account, meaning that the extent of crowding out is an empirical question.27
This issue has been the subject of a substantial empirical literature – though it has almost wholly been focused on advanced economies, and has generated mixed results. In a recent summary of the literature on advanced economies, Jaramillo and Weber (2012) conclude that “a majority of papers [find] that a higher fiscal deficit and public debt raise interest rates”, and that the estimated impact on interest rates of a change of 1 per cent of GDP in the fiscal deficit ranges from 10 basis points to 60 basis points. Shining some light into this wide range of headline findings, recent research has begun to reveal the importance of non-linear effects, and suggests that the existence and size of crowding out can depend on a variety of factors – including initial deficit and debt levels, the size of the change in the fiscal deficit, financial openness and depth, and the strength of institutions.28
Investigation in to crowding out in developing countries has been far more limited. In a pioneering study, Christensen (2005) found significant support for crowding out in a sample of 27 SSA countries over the period 1980-2000, with an increase of 1 percentage point in the ratio of DD to broad money causing the ratio of private lending to broad money to decline by 0.15 percentage points. Emran and Farazi (2009) also find strong evidence of crowding out when developing country governments borrow from the banking sector. Adelegan and Radzewicz-Bak (2009), using a sample of 45 SSA countries over the period 1990-2008, find that a 1 percentage point expansion in DD as a share of broad money caused private sector lending as a share of broad money to decrease by around 0.1 percentage points over the time period as a whole, although finds evidence for the impact decreasing over the time 25 See Abbas and Christensen (2010) for a fuller exposition of potential costs and benefits of domestic debt issuance in LICs and emerging market economies. 26 Note that external borrowing can also potentially crowd out private investment, through its impact on the real exchange rate; see for example Gray and Woo (2000). 27 See for example Jaramillo and Weber (2012) for a fuller discussion. 28 See for example Aisen and Hauner (2008) and Baldacci and Kumar (2010) – both of which also incorporate emerging market countries in their datasets.

18
period. The focus of these three papers on DD relative to broad money reflects the particular importance that financial sector depth is likely to play in the context of government DD issuance in developing countries – with deeper financial systems providing greater scope for government securities issuance.29
So overall the crowding out literature provides mixed conclusions, and there are very few results from developing-country-specific studies. However, based on these few studies and the wider literature, a reasonable initial view may be that: developing countries should expect public domestic borrowing to crowd out private investment to some extent; the impact is likely to be non-linear; and the impact might be mitigated by a variety of factors. The policy implications of the potentially-mitigating factors are discussed in Section 2.2.4.
However, as set out in Box 2, in trying to determine an appropriate level of DD issuance there are a much broader set of costs and benefits to take into account; even if there is some crowding out, this could be offset by other benefits. In a thus-far unique attempt to take such breadth into account, Abbas and Christensen (2010) aim to identify the impact of DD on economic growth in developing countries – and the channels through which this impact is transmitted – using commercial bank holdings of government debt in a comprehensive sample of 93 LICs, and a comprehensive set of estimation techniques and robustness tests.30 Their key conclusion is that moderate levels of DD (as a share of GDP and of bank deposits) have a substantive positive impact on economic growth. They find a positive linear relationship between commercial bank holdings of DD as a proportion of GDP and GDP growth, with approximately a 10 percentage point rise in the DD-to-GDP ratio leading to a 0.6 percentage point rise in annual GDP growth.31 Reflecting the importance of financial depth, however, they find some evidence for a non-linear relationship when DD is measured as a proportion of bank deposits – and specifically, that the net benefit begins to reverse when commercial bank holdings of domestic debt rise above 35 per cent of bank deposits (with traditional crowding out concerns seeming to dominate beyond this point); this compares to the ratio in Uganda at end-FY12/13 of 33 per cent. The authors find evidence to suggest that the impact works through a number of channels, including: improved monetary policy effectiveness; broader financial market development; strengthened domestic institutions; and enhanced private savings and financial
29 See Mehl and Reynaud (2008) for a summary of nascent evidence on the broader determinants of domestic debt market development, and Mu et al (2013) for a recent extension to this literature with a specific focus on the development of African bond markets (both government and commercial). Findings suggest that key determinants of government bond market development include stable inflation, strong creditor rights, a wider investor base, lower interest rate volatility, a flexible exchange rate and capital account openness. 30 These robustness tests include using a variety of different estimation methods (including ordinary least squares, random effects, fixed effects, and system generalised method of moments estimators), different time horizons and country sub-groups, and removing outliers. However, the identification strategy is such that it is still possible that the coefficients of interest may well be upwardly biased to some extent, because of reverse causation from growth to the development of domestic debt markets. 31 The authors posit that the linear relationship most likely reflects the relatively low levels of DD-to-GDP in the sample – and that the net effect would likely be found to turn negative after a certain point.

19
intermediation. In a secondary set of regressions using a sample with broader measurement of DD, they also find that the growth-enhancing impact of DD is larger when a higher share of DD is held outside the banking system.
Overall, whilst there has been a substantial literature on crowding out of private investment, and indeed on the overall growth impact of total levels of debt,32 there has as yet been very little attention on crowding out and the broader growth impact of DD issuance in LICs – although this is beginning to be addressed. Whilst it is important not to give too much weight to a small number of initial studies – and much more research work
32 See for example Reinhart and Rogoff (2010), and the responses to it in the literature.
Box 2: Pros and Cons of Domestic Debt Issuance
Issuing domestic debt (DD) involves a broad range of potential costs and benefits. This box provides just a brief overview; Abbas and Christensen (2010) and Bua et al (2013) provide fuller discussions.
The cons of issuance have arguably attracted more policy and academic attention to date – particularly traditional crowding out concerns, and direct debt management cost and risk factors, as discussed in Section 2.2.2. DD issuance can also raise a range of fiscal concerns – such as the possibility that the availability of domestic financing will delay tax mobilisation efforts, and the potential for DD interest costs to impinge on pro-poor and growth-enhancing spending and raise debt sustainability concerns. High DD stocks can also raise inflation expectations, if monetary policy credibility is low, by raising the perceived risk of the government seeking to reduce the real debt burden through higher inflation.
However, there are also a range of potential benefits to DD issuance. For example, yields on government securities provide pricing benchmarks that underpin the development of private bond markets and other long-term lending. Treasury securities act as collateral for inter-bank lending – enabling commercial banks to better-manage their liquidity needs and thus the efficiency with which they can transform deposits in to credit, and giving central banks more scope to use market-based monetary policy tools. As a high-quality savings instrument, government securities can provide an attractive alternative to capital flight; and by increasing government’s reliability on its citizenry, it is argued that DD issuance can promote political accountability and thus pressure to improve policy and institutions. DD issuance will also help deepen and diversify governments’ financing sources – expanding potential resources available for infrastructure and other expenditure, and providing a means to manage shocks to other financing sources – as well as building a track record that can help to access international capital markets.
Sources: Abbas and Christensen (2010), Presbitero (2010), Bua et al (2013).
20
needs to be done – they can at least be used, combined with the broader literature, to help inform policy decisions in an area previously severely lacking in any quantitative guidance for decision-makers; this is considered further in the following section.
2.2.3 Determining the volume and composition of domestic debt issuance33
Volume of domestic debt issuance
To what extent can or should Uganda issue domestic debt to help finance the budget? This remains a difficult question to answer with precision, and will depend on the impact of and balance between the various potential pros and cons of issuance (which can be very difficult to determine), as well as GoU’s own preferences and alternative potential financing strategies. However, the research just discussed, combined with further policy and practical considerations, can be used to provide at least a sense of the magnitudes of issuance GoU might want to consider.
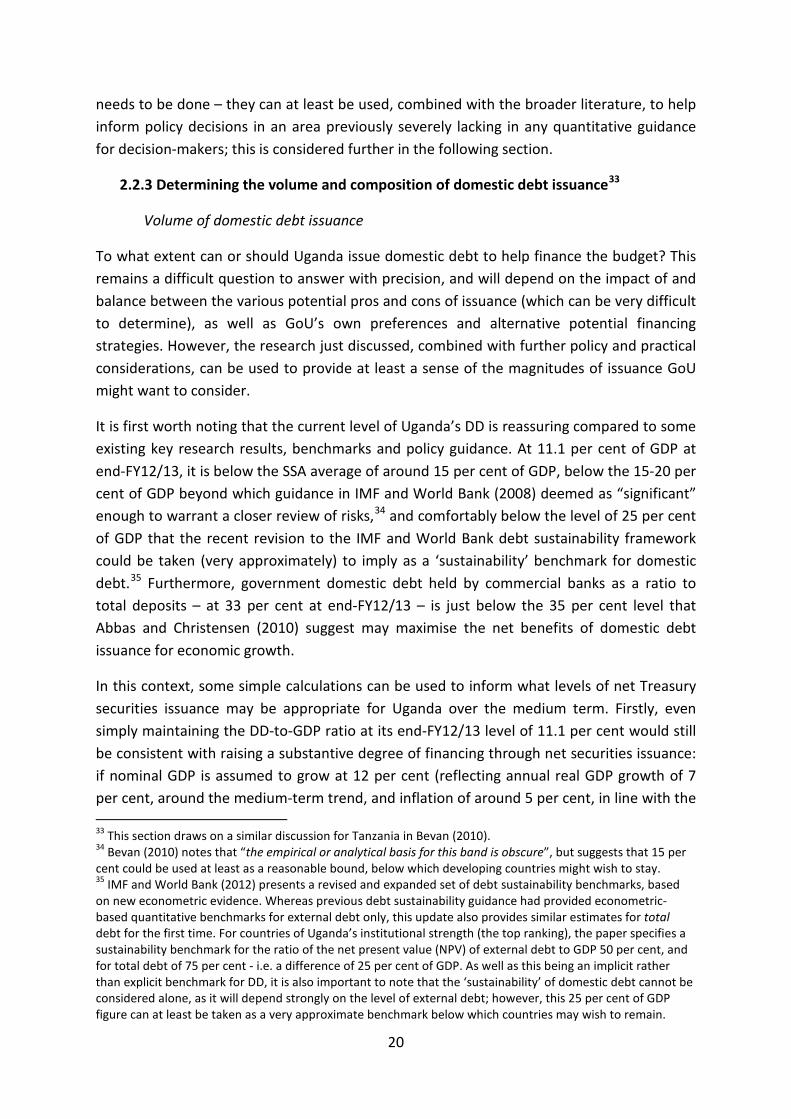
It is first worth noting that the current level of Uganda’s DD is reassuring compared to some existing key research results, benchmarks and policy guidance. At 11.1 per cent of GDP at end-FY12/13, it is below the SSA average of around 15 per cent of GDP, below the 15-20 per cent of GDP beyond which guidance in IMF and World Bank (2008) deemed as “significant” enough to warrant a closer review of risks,34 and comfortably below the level of 25 per cent of GDP that the recent revision to the IMF and World Bank debt sustainability framework could be taken (very approximately) to imply as a ‘sustainability’ benchmark for domestic debt.35 Furthermore, government domestic debt held by commercial banks as a ratio to total deposits – at 33 per cent at end-FY12/13 – is just below the 35 per cent level that Abbas and Christensen (2010) suggest may maximise the net benefits of domestic debt issuance for economic growth.
In this context, some simple calculations can be used to inform what levels of net Treasury securities issuance may be appropriate for Uganda over the medium term. Firstly, even simply maintaining the DD-to-GDP ratio at its end-FY12/13 level of 11.1 per cent would still be consistent with raising a substantive degree of financing through net securities issuance: if nominal GDP is assumed to grow at 12 per cent (reflecting annual real GDP growth of 7 per cent, around the medium-term trend, and inflation of around 5 per cent, in line with the 33 This section draws on a similar discussion for Tanzania in Bevan (2010). 34 Bevan (2010) notes that “the empirical or analytical basis for this band is obscure”, but suggests that 15 per cent could be used at least as a reasonable bound, below which developing countries might wish to stay. 35 IMF and World Bank (2012) presents a revised and expanded set of debt sustainability benchmarks, based on new econometric evidence. Whereas previous debt sustainability guidance had provided econometric-based quantitative benchmarks for external debt only, this update also provides similar estimates for total debt for the first time. For countries of Uganda’s institutional strength (the top ranking), the paper specifies a sustainability benchmark for the ratio of the net present value (NPV) of external debt to GDP 50 per cent, and for total debt of 75 per cent - i.e. a difference of 25 per cent of GDP. As well as this being an implicit rather than explicit benchmark for DD, it is also important to note that the ‘sustainability’ of domestic debt cannot be considered alone, as it will depend strongly on the level of external debt; however, this 25 per cent of GDP figure can at least be taken as a very approximate benchmark below which countries may wish to remain.

21
BoU’s inflation target), then an equivalent growth in the nominal stock of DD (to keep the DD-to-GDP ratio the same) would imply net issuance of around 1.2 per cent of GDP each year (or Shs.730 billion in FY13/14 terms).36
Next, reflecting concerns about the potential for increased DD issuance to exacerbate crowding out, it is instructive to consider the level of net issuance that would be consistent with maintaining the ratio of commercial bank holdings of DD to deposits at around its current level of 33 per cent. If it is assumed that commercial bank deposits grow at around 15 per cent per year,37 and that there is no change in banks’ share of total Treasury securities holdings, then a simple simulation shows this would imply net securities issuance averaging 1.6 per cent a year (or around Shs.1,000 billion in FY13/14 terms) out to FY19/20 (and DD-to-GDP rising to 13.4 per cent). There are two key points of note here. Firstly is that this is in line with GoU’s planned net issuance as set out in the Budget for FY13/14 – of 1.6 per cent of GDP, or just over Shs.1 trillion. Secondly, if GoU were successful in broadening the investor base (such that commercial banks accounted for a decreasing share of holdings), or in helping to deepen the financial sector (such that bank deposits grow at a faster rate), then maintaining the current DD-to-deposits ratio would be consistent with a higher level of net DD issuance accordingly.
Finally, it is worth considering the implications of the upper limit on the DD-to-GDP ratio of 15 per cent that GoU has proposed in the draft PDPF. A simple simulation shows that, assuming constant nominal GDP growth of 12 per cent each year, raising the DD-to-GDP ratio from its current level to 15 per cent by the end of the next NDP in FY19/20 would be consistent with average annual net Treasury securities issuance of around 2.0 per cent of GDP each year over this period (equivalent to just under Shs1,200 billion in FY13/14 terms). A limit on the DD-to-GDP ratio of 15 per cent certainly seems reasonable in the context of the SSA average and WB-IMF advice. However, broader considerations suggest that any increase in DD to this extent should be accompanied with a particularly vigorous pursuit of reforms that would help minimise costs and maximise benefits associated with DD issuance – including reforms that would support financial sector deepening and help to broaden the investor base in Treasury securities further beyond commercial banks, and thus mitigate the extent to which DD issuance can crowd out private borrowing; such reforms are discussed in Section 2.2.4 below.
These three scenarios imply a range of net Treasury securities issuance from 1.2 per cent of GDP to 2.0 per cent of GDP each year. Recent experience suggests that it would be feasible to raise any level of financing within this range without significant difficulty; average net issuance over the past ten years has been 1.5 per cent of GDP – in the middle of this range –
36 Where DDt is nominal stock of domestic debt at time t: Net issuance as % GDP = 100*(DDt – DDt-1) / GDPt = 11.1 – 100*(DDt-1 / 1.12*GDPt-1) = 11.1 – 11.1/1.12 ≈ 1.2. 37 Real deposit growth has averaged around 10 per cent per year over the past ten years; if inflation were around the BoU’s target of 5 per cent for core inflation, nominal deposit growth would be around 15 per cent each year.

22
and in four of the last ten years net issuance has been equal to or higher than 2.0 per cent of GDP.38
Overall, it is not possible to provide a robust precise prescription for the level of net issuance that GoU ‘should’ issue, particularly given the limited range of research findings and policy guidance that is available to date. However, what evidence is available suggests: that a range for net annual DD issuance of 1.2 to 2.0 per cent of GDP provides a useful guide for what levels might be considered; that the 1.6 per cent of GDP net issuance planned in the Budget for FY13/14 looks very reasonable for this year; and that higher levels of net issuance could be warranted over the medium term (up to a maximum of around 2.0 per cent of GDP per year, consistent with the level of DD rising to 15 per cent as a ratio to GDP) – but that the higher the level of net issuance undertaken, the more pressing it will be to deliver reforms that increase financial depth, broaden the Treasury securities investor base, and that overall help to minimise the costs and maximise the benefits of issuance.
Composition of domestic debt issuance
In addition to the size of domestic debt issuance, it is necessary to determine the composition of this issuance between securities of different maturities. This inherently involves a trade-off between cost and risk; issuing longer-dated securities reduces refinancing risks39 for the government, but generally necessitates paying investors a higher yield (this is reflected in the upward-slope of the yield curve, as illustrated in Fig 2.5B).
Measures of refinancing risk can vary substantially across countries,40 reflecting both differing market conditions and government preferences for risk, and there are no firm prescriptive benchmarks to use as a guide. However, it is instructive to note that compared to averages for 12 LICs analysed in IMF and World Bank (2012),41 the refinancing risk on Uganda’s domestic debt is greater than average: the average time to maturity (ATM) on Uganda’s domestic debt is 0.8 years less than the LIC average (1.7 years compared to 2.5 years), and the proportion of debt maturing within one year is around 10 percentage points higher (at 55.0 per cent compared to 45.1 per cent). On the basis of this comparison, the gradual lengthening of the ATM envisioned in Uganda’s draft PDPF to greater than 3 years,
38 One additional consideration around the possible size of DD financing is potential DD issuance for monetary policy purposes. BoU did not issue any Treasury securities for monetary policy purposes in FY12/13; however, depending on its forecasts for structural liquidity BoU may well do so again in future (either through primary issuance, or sales of its own holdings of Treasury securities in the secondary market). It will be important for BoU to inform MoFPED of the level of any such potential issuance in good time – and for these considerations to feed into MoFPED’s annual budget plans and medium-term debt management strategy formulation. 39 Refinancing risk (or rollover risk) refers to the risk that debt, when it falls due, will need to be refinanced at an unusually high cost, or that it cannot be rolled over at all. See IMF and World Bank (2003), Box 1, for a full exposition of risks encountered in sovereign debt management. 40 See for example Bua et al (2013). 41 Note that the figures for the average of these 12 LICs refer to 2010-11, whereas the Uganda figures reported are as at end-FY12/13.

23
and reduction in the proportion of debt maturing within one year to below 40 per cent, seem both sensible and (on the basis of other LICs’ achievements) feasible.
2.2.4 Additional considerations: actions to reduce costs and enhance benefits
Whatever the precise level and composition of Uganda’s DD issuance, theory and empirical evidence highlight a range of policy actions that GoU can implement to help minimise the costs and maximise the benefits.
A fundamental factor dictating the net benefit of issuance will be how issuance proceeds are used. The key underlying principle here is that domestic borrowing should only be used to finance ‘productive’ public expenditure. At the very least, ‘productive’ here should be interpreted to mean expenditure which has a social return greater than the cost of borrowing – although stricter definitions could be adopted (for example, a definition that mandates that the expenditure generates a minimum fiscal return for government).42 In reality, the fungibility of government resources can make it difficult to assess precisely how net DD issuance proceeds are spent, although some rules of thumb can be useful. For example, it could be ensured that the increase in net DD issuance from one year to the next does not exceed the planned increase in government-financed net public investment,43 or in aggregate, that total net DD issuance each year does not exceed the value of government-financed net public investment. In turn, GoU should ensure that the return (however defined) on the publicly-financed investment project with the lowest return exceeds the cost of domestic borrowing.
Actions to broaden the investor base can have a variety of benefits, including bringing downward pressure on interest rates (by expanding demand, making primary auctions more competitive, and stimulating greater secondary market activity and hence a reduction in liquidity premiums),44 reducing volatility in yields (by increasing the diversity of market participants),45 facilitating a reduction in refinancing risk (by introducing investors with longer time horizons),46 and limiting crowding out (by expanding the proportion of non-bank investors)47.48 Important areas in this regard will include accelerating reform of the
42 A new body of research has begun to model the links between public investment, growth and debt; see Buffie et al (2012), and ongoing IGC work by Chris Adam and David Bevan (e.g. http://www.theigc.org/sites/default/files/sessions/Chris%20Adam%20%26%20David%20Bevan_StateCapabilities_AGF2013.pdf). 43 Where government-financed public investment means total public investment minus the value of projects being financed by earmarked concessional loans. 44 For example, relative to domestic investors foreign investors are much less likely to hold securities until maturity, and thus greater foreign participation should help stimulate secondary market trading activity; see Peiris (2010). 45 World Bank (2007). 46 Mehl and Reynaud (2008). 47 Christensen (2005). 48 See also Bua et al (2013).

24
pension sector49 – particularly the transformation of the Public Sector Pension Scheme into a funded scheme, as well as liberalisation of the private pensions sector – and making access to the market easier for retail investors,50 and more attractive to foreign investors51 (such as by reforming the withholding tax system)52.53
Continued strengthening of the operation and credibility of Uganda’s inflation targeting framework will also have important benefits in the context of domestic debt issuance. By reducing inflation expectations, improved perceptions of the inflation targeting framework should act to bring down yields, and particularly at the longer end of the yield curve (thus facilitating greater longer-term issuance and a reduction in refinancing risk, as well as debt interest costs overall).54 Extending the yield curve – building on the recent introduction of a 15-year Treasury Bond –55 will support financial sector development by providing benchmarks for the pricing of longer-term private sector financial instruments, and help reduce refinancing risk. This could include the introduction of long-term infrastructure bonds; infrastructure bond issuance by the Government of Kenya provides an interesting regional example of what precise features such securities could incorporate.56
Further measures GoU can pursue that should help reduce issuance costs include building on recent improvements in the predictability and transparency5758 of GoU’s domestic debt
49 Adelegan and Radzewicz-Bak (2009) note that “non-bank financial institutions are widely regarded as being critical for bond market development”, and particularly pension funds. By demanding long-term assets to match long-term liabilities, pension funds are crucial in supporting an extension of the yield curve. 50 This could include both domestic and foreign-based retail investors. For example, whilst a recent study showed that a Diaspora Bond is not feasible for Uganda (Rutega et al 2012), the Diaspora could be encouraged to invest in standard Treasury Bills and Bonds. 51 This is a contentious area, and the gains from increased market participation do need to be considered alongside potential issues of volatility and ‘sudden stops’. However, it is interesting to note that two recent studies – Pradhan et al (2011) and Peiris (2010) – find that greater foreign participation in domestic government bond markets in EMEs significantly reduces long-term government yields. Peiris (2010) also finds that greater foreign participation “does not necessarily result in increased volatility in bond yields in emerging markets and, in fact, could even dampen volatility in some instances” – although this finding is based on a data period which runs only until 2009, and confidence in this result would be higher if it could also be shown to hold true in a period extending further beyond the onset of the global financial crises. 52 There is currently a withholding tax on interest income from Ugandan government securities of 20 per cent - which is greater than the 15 per cent rate charged on other interest income within Uganda, and greater for example than the 15 per cent charged by the Kenyan government on its Treasury securities (excluding infrastructure bonds, which are tax-exempt). This 20 per cent withholding tax is incurred by both resident and foreign holders of Ugandan Treasury securities – although this can be reduced for residents of countries with which Uganda has a double taxation agreement. 53 Hanson (2007) further notes that “non-residents have become more interested in developing countries’ domestic debt as...developing countries became characterized by greater macroeconomic stability, higher international reserves, and exchange rates with some appreciation potential”. 54 See Mehl and Reynaud (2005) and Mu et al (2013). 55 For example, Kenya issues Treasury securities of up to 30 years maturity. 56 Notable differences in Kenyan government infrastructure bonds relative to standard Treasury securities include preferential tax treatment, amortising principle repayment structures, and the citing of investment areas or specific projects that the proceeds are intended to help finance. 57 Adelegan and Radzewicz-Bak (2009) cite transparency as a “fundamental” determinant for bond market development.

25
operations – such as by providing more information on issuance plans as part of an annual published medium-term debt management strategy (MTDS) document, and improving the extent and regularity of data publication – which by reducing uncertainty should bolster demand.59 Developing the secondary market for Treasury securities should also help reduce yields, by reducing liquidity premiums demanded by investors.60 This can be supported by working to consolidate the current fractious nature of the DD portfolio (such as through initiating debt swap and buy-back programmes), as part of a programme to establish liquid benchmark issues, and by reforming Uganda’s primary dealership system.61
2.3 Commercial external borrowing: Eurobond issuance62
2.3.1 Background
A Eurobond is taken here to be a government bond, issued on the international markets, in a currency other than that of the issuer. The precise structure can vary, but most SSA Eurobonds issued to date have been of 5-year or 10-year maturity, pay fixed interest coupons, and provide a ‘bullet’ repayment of the principle (i.e. there is no amortisation, with the principle repayment simply being made in a single sum on the maturity date). Eurobonds can vary in size; the size of SSA Eurobonds issued to date has ranged from $200 million to $1 billion (see Figure 2.6 below).
Sy (2013) notes that more than a fifth of SSA countries have now issued Eurobonds. This has been driven, on the supply side, by factors including borrowing space created by debt relief, large borrowing needs (particularly for infrastructure investment), historically low borrowing costs, and the broader institutional and policy environment (including, for example, increased flexibility for non-concessional external borrowing under IMF programmes). On the demand side, international investors have been attracted to SSA issues by improved debt sustainability prospects, attractive yields and the opportunity for portfolio diversification.
Figure 2.6 provides details on eleven selected Eurobonds that have been issued by seven SSA countries since 2007 to date – including the amount issued, yield at issue, credit rating, advertised purpose of issuance, and current secondary-market yield. In total these issues have raised over US$6½ billion. Figure 2.6 highlights the variation in amounts raised (from
58 Uganda has taken significant steps to improve the transparency and predictability of its domestic debt operations in recent years, including by now clearly announcing in the annual Budget the intended volume of net issuance in the year ahead, and by publishing for the first time an issuance calendar for the year ahead. 59 See Leong (1999). 60 The total volume of GoU Treasury securities traded in the secondary market in FY12/13 was only 3.4 per cent of the total outstanding stock of securities (as at end-June 2013). 61 See World Bank (2007). 62 Other forms of non-concessional financing, such as syndicated loans or private placements, would also be open to Uganda. The paramount benefits of these two options compared to a Eurobond is speed of issuance, and additional flexibility in the potential form of the debt; in contrast, the more open, competitive and standardised nature of a ‘typical’ Eurobond is, in contrast, likely to minimise costs.

26
$200 million to $1 billion), and reasons for issuance (from specific infrastructure projects, to debt refinancing, unspecified infrastructure projects, and general budgetary purposes). The total volume of bids comfortably exceeded desired issuance for every issue. However, as would be expected, yields at auction varied substantially (from 5.375 per cent to 9.250 per cent) with global market conditions at the time, and with the credit rating and other characteristics of the specific issues and issuers. Similarly, current secondary market yields vary substantially, based on time remaining to maturity and country-specific factors.
All evidence suggests that demand amongst international investors would be sufficient to make issuing a Eurobond a feasible option for Uganda, and that sufficient investor interest will remain even as global interest rates begin to normalise. Independent credit assessments mean Uganda is adequately rated, at B by both Standard & Poor’s and Fitch – which compared to recent issuers (at the time of issuance) is similar to Rwanda (also rated B by both agencies), and just below that of Ghana (B / B+) and Zambia (B+ / B+).63 The extent of over-subscription experienced in some recent SSA Eurobond issues (e.g. Zambia’s September 2012 issue was 15 times over-subscribed, and Rwanda’s May 2013 issue was 8 times over-subscribed) is unlikely to be fully sustained as interest rates on developed market sovereign debt begin to rise – but SSA Eurobonds will continue to offer investors an unusual opportunity to diversify their investment portfolios, and should do so at yields that remain attractive relative to other sovereign debt.
Overall, investor interest combined with Uganda’s current level of borrowing space means GoU has the space and scope to issue a Eurobond if it so wished. However, it is vital to take into account the full range of benefits, costs and risks associated with this form of borrowing – as well as to carefully consider the required preparations, timing, and returns on the use of proceeds (and to weigh the net benefits relative to those of alternative financing options; see Section 3) – before any decision on whether and when to issue a Eurobond is made. Detailed discussions of general benefits, costs, risks and strategic considerations for first-time sovereign bond issuers are available to guide potential issuers (see for example Das et al 2008); the next two sections consider the foremost elements of these, for Uganda’s context.
2.3.2 Benefits, costs and risks
There would be a variety of potential benefits to Uganda from Eurobond issuance. For example, Eurobonds can: allow access to a much wider pool of capital than available from concessional financing and domestic savings, and thus help finance desired infrastructure projects more rapidly; provide a source of foreign exchange, to help finance import-intensive expenditure (such as major infrastructure projects) without the need to tap existing reserves or risk weakening of the Shilling; mitigate domestic debt issuance 63 Das et al (2008), pg 10, outlines a “number of preconditions considered necessary to attract investors to debut international issues”; arguably, Uganda’s credit rating can be taken as a summary, indicating that these preconditions are adequately met.

27
requirements, and thus potential pressures on domestic interest rates and private sector credit growth; diversify sources of financing; provide a benchmark for potential private sector dollar-denominated bond issuance; 64 and in principle can help strengthen incentives to maintain prudent macroeconomic policies and continue reform efforts.
However, Eurobond issuance would also entail a variety of costs and risks. The foremost cost is the interest rate that Uganda would have to pay. This can be thought of as consisting of two primary components: (1) a risk-free benchmark – generally taken to be the yield on the US Treasury Bond of the same maturity, and (2) a spread above this benchmark, predominantly reflecting a country-specific risk premium for Uganda.6566 Both these elements will vary over time. Yields on US Treasury Bonds rose over 2013, with 10-year yields up from just below 1.9 per cent at the start of January to just over 3.0 per cent at the end of December; whilst they can be expected to rise further over the medium term as global economic recovery strengthens, they still remain at present well below the levels prior to the global financial crisis and close to historic lows. The spread on a Ugandan Eurobond over the US Treasury Bond rate would depend on global investor risk appetite and market conditions at the time of issuance, as well as factors specific to Uganda67 and the precise nature of the issue itself.
To get a feel for what interest rate Uganda might pay on a Eurobond issued today, it is instructive to look at the latest secondary market yields on Eurobonds issued by similarly-rated SSA countries.68 As of 5th December 2013, Zambia’s Eurobond maturing in 2022 was trading at a yield of 7.3 per cent, Rwanda 2023 at 7.5 per cent, and Ghana 2023 at 8.3 per cent. Using these as an indicator, if Uganda had issued a 10-year Eurobond around this time, it might have been priced to yield in the region of 7½ to 8½ per cent per annum (this is in US$ terms; Section 3.2.2 discusses the Shilling equivalent, and comparison to yields on DD). This however must be taken as a very rough estimate, and the precise yield on any future Ugandan Eurobond issue will depend on global market conditions, market perceptions of Uganda’s fiscal outlook, and the precise nature of the issue. As part of considerations as to whether to issue a Ugandan Eurobond, it would be necessary to monitor closely the latest
64 However, Hostland (2009) notes that there are many examples of corporations in developing countries issuing foreign currency denominated bonds before such an issue by the government. 65 Note that for a country’s inaugural Eurobond issue the spread will also incorporate an additional “first time issuer premium” – which reflects additional costs and risks that can be associated with a first-time issue; there are steps that can be taken to minimise this premium. 66 There will also be a liquidity premium, which will vary according to the ease with which investors are able to trade their holdings. 67 These factors will include relations with donors. The level and expected stability of donors’ financial support, and the extent to which their presence is seen by private investors as supporting fiscal discipline, will be an important determinant of the country risk premium. Therefore any contraction in donor flows may have a double effect here: as well as increasing the pressure to undertake commercial external borrowing, it may also cause (via a higher risk premium) the cost of such borrowing to rise. 68 Gueye and Sy (2010) provide an econometric model that can be used to estimate the yield on a debut Eurobond issue.

28
secondary-market yields on such SSA Eurobonds, as a Ugandan Eurobond would be priced relative to its peers.
In addition to interest costs, a Eurobond would also require paying fees for the high-quality financial and legal advice and services that are vital for an issue to be successful. These fees would vary with the size of the issue, and are negotiable. As of November 2013, one major international investment bank advised the authors that the transactions expenses for a debut Eurobond (inclusive of all lead manager, legal counsel, roadshow and listing fees) could be a little under $1 million (i.e. around 20 basis points on a $500 million issue).
Key risks to consider in relation to a potential Eurobond issue include exchange rate risk and risks associated with principal repayments. Most SSA sovereign bonds issued to date have been structured with bullet repayment of principle – which entails a higher degree of refinancing risk for the issuer than under an amortising structure. However, there are a variety of different strategies that can be adopted to manage this risk, such as building up a sinking fund (i.e. a pool of advance savings with which to make the bullet repayment), executing debt buy-backs or swaps (i.e. buying some of the debt back from investors, or exchanging it for longer-dated debt, before the redemption data), or issuance of another Eurobond (at or before the redemption date), or a combination of these options. Alternatively, whilst Uganda’s default option would be to stick to recent market norms of a bullet repayment, GoU could (in consultation with experienced advisors and potential investors) consider an amortising structure.69
The maturity and associated timing of redemption payments for any Eurobond issuance is particularly pertinent for Uganda; if redemptions fall due at a time by which oil revenues have come on stream in significant volumes, then Uganda will have greater freedom in how it chooses to manage repayment (whereas a Eurobond that fell due before this time would more likely necessitate refinancing of the redemption by rolling over the debt). Given that oil revenues are not predicted to come on stream in significant volumes until FY18/19 at the earliest, this would argue for any Eurobond issuance by Uganda in the near term being of, say, a 10-year rather than a 5-year maturity – although this would need to be weighed against the higher yield associated with longer-term issuance.70
69 The tendency for Eurobond issuers to choose a bullet repayment structure most likely reflects a desire to maximise simplicity of the instrument being issued, and attract as broad a pool of investors as possible; for example, IMF (2003, pg 24) reports that a majority of investors questioned preferred a bullet over an amortising structure. Interestingly however, Das et al (2008) report “there is no evidence that issuers pay a yield or liquidity premium for issuing amortizing bonds”, and are much more sanguine on the choice of an amortising structure, particularly for issuers that plan to go to market relatively infrequently. 70 Recent issuance by Nigeria provides a useful example of the cost of a 5-year versus a 10-year issue: in July 2013 Nigeria issued both a 5-year and a 10-year Eurobond, of the same $500m size; the yield on the 10-year bond was 125 basis points above that on the 5-year. This compared similarly to the difference between 5-year and 10-year US Treasury yields at the time, of around 115 basis points.

29
Fig 2.6: Selected Eurobond Issuance by sub-Saharan African Sovereigns (excluding South Africa) to date
Note: All Eurobonds in this table have fixed coupons and bullet repayments (as such, it excludes the amortizing, dollar-denominated bonds that have been issued by Tanzania, Ivory Coast, Seychelles and DR Congo. Angola’s Loan Participation Note is also excluded).
* Credit ratings are ratings as at 5th December 2013; Ghana’s credit rating was revised down by Fitch from B+ to B in October 2013, and by S&P from B+ to B in August 2010. Zambia’s credit rating was revised down by Fitch from B+ to B in October 2013.
CountryIssue Date Maturity
Tenor at
issueCoupon
Yield at issue
Spread to US TBond at issue
Amount issued ($m)
Bids received
($m)
Bid-to-cover ratio
Yield as at 5-Dec-
13Advertised use of proceeds
Ghana (2) 08/2013 2023 10-yr 7.875% 8.000% 539bps 1,000 2,500 2.5x B(B+)*
B B1 8.25% Specific infrastructure projects and debt refinancing
Nigeria (2b)
07/2013 2018 5-yr 5.125% 5.375% 395bps 500 1,770 3.5x BB- BB- (na) 4.50% Unspecified infrastructure projects
Nigeria (2a)
07/2013 2023 10-yr 6.375% 6.625% 402bps 500 2,260 4.5x BB- BB- (na) 5.95% Unspecified infrastructure projects
Rwanda 05/2013 2023 10-yr 6.625% 6.875% 522bps 400 3,500 8x B B (na) 7.48% Specific infrastructure projects, and refinancing of parastatal debt
Zambia 09/2012 2022 10-yr 5.375% 5.625% 383bps 750 11,900 15x B(B+)*
B+ (na) 7.32% General budget deficit financing & unspecified infrastructure projects
Namibia 10/2011 2021 10-yr 5.500% 5.750% 366bps 500 2,700 5.5x BBB- (na) Baa3 5.08% General budget deficit financing
Senegal (2) 05/2011 2021 10-yr 8.750% 9.125% 595bps 500 2,400 5x (na) B+ B1 6.79% Refinance earlier Eurobond, unspecified infrastructure projects
Nigeria (1) 01/2011 2021 10-yr 6.750% 7.000% 364bps 500 1,250 2.25x BB- B+ (na) 5.38% General budget deficit financing
Senegal (1) 12/2009 2014 5-yr 8.750% 9.250% 676bps 200 (na) B+ (na) (Now retired)
Toll road
Gabon 12/2007 2017 10-yr 8.200% 8.300% 425bps 1,000 BB- BB- (na) 3.67% Restructing of existing Paris Club debt
Ghana (1) 10/2007 2017 10-yr 8.500% 8.500% 396bps 750 3,000 4xB
(B+)*B
(B+)* (na) 6.20% Unspecified infrastructure projects
Credit Rating (Fitch / S&P /
Moody's)

30
2.3.3 Additional considerations
In addition to the direct cost and risks considered above, there is an important range of broader macroeconomic and fiscal considerations that would need to be taken into account in order to maximise the benefits of any potential issue and minimise potential broader costs and risks, as well as a range of institutional and practical considerations.
The returns on the marginal expenditure being supported by the issuance proceeds would be a crucial issue in this regard. Ideally, a Eurobond would be used to support expenditures that will generate significant fiscal returns to government (either directly through user charges and/or GoU’s share of operating profits, or indirectly via driving faster growth in GDP and associated tax revenues), to ensure that the impact on the budget of the commercial rate of interest is being offset,71 and expenditures that involve a significant foreign currency-denominated component, to minimise the potential impacts on the real exchange rate that could arise if the significant dollar-denominated proceeds were used to finance Shilling-denominated expenditures. Matching these criteria, a Eurobond issue would be most appropriate in the context of financing a major infrastructure project such as GoU’s contribution to the oil refinery, the standard gauge railway, or a major power project.
Furthermore, it is vital that the size and timing of any issue be appropriate. The over-riding requirement is to ensure that a debt sustainability analysis confirms that the size of issuance is consistent with maintaining debt sustainability. Beyond this, it is necessary to ensure that the size of any issue does not exceed that required for the intended use of the proceeds, and that as far as feasible it be conducted only when government is ready to put the proceeds to use – in order to avoid excess interest payments.72 It is worth noting that whilst $500 million is the minimum level required for inclusion in global emerging market bond indices, which brings with it some liquidity (and thus pricing) benefits, this should not be viewed as a ‘mandatory’ minimum issuance size; if Uganda were not ready or able to use an amount of this size effectively then any liquidity benefit would likely be more than offset by the unnecessary additional interest payments. Furthermore, it is not necessary for an issue to be of this size to be successful – as illustrated, for example, by Rwanda’s $400 million Eurobond issue in May 2013.73
Whilst broader internal organisational and institutional issues for debt management are discussed further in Section 3, there are some factors which are particularly pertinent to the consideration of Eurobonds. Eurobond issuance would generate exposure to a variety of market and refinancing risks which would need to be carefully managed. To best manage 71 Buffie et al (2012) and Adam and Bevan (2013) explore these issues in depth. 72 If GoU identify one or more projects they wish to finance using Eurobond issuance, but which involve expenditures spread over a period of time, one way of minimising the potential for ‘negative carry’ is by at first issuing a Eurobond of a size sufficient to finance a first portion of these expenditures, and re-opening the bond (i.e. issuing more of the same security) at a later date. 73 Das et al (2008) note that “excessive issue size relative to the intended use of bond proceeds” is a “typical pitfall” of first-time issuers, that should be avoided.

31
these risks, it would be crucial to ensure that any issuance be conducted only as part of a clear fiscal strategy that credibly safeguards fiscal sustainability, a comprehensive debt management strategy, and sufficient institutional debt management capacity (including the relevant hiring and training of personnel within a dedicated Debt Management Office, to monitor and manage risks). The active communication to the market of such plans and associated actions would also take on elevated importance, as part of efforts to influence market sentiment.
On practical matters, a key step in the issuance process would be the early, competitive selection by government of its legal counsel and lead managers – who it would be vital to ensure have considerable prior experience in advising on debut SSA Eurobond issues.74
Overall, recent SSA Eurobond issues show that there is considerable global investor interest in SSA debt. There is good reason to believe that Uganda could successfully issue a Eurobond in the near future, if it so wished. Whilst global interest rates have risen in the past few months, they remain at levels which are below those prior to the 2007 financial crisis and are still close to historic lows. Issuing a Eurobond could bring a number of benefits, including creating access to a much wider pool of capital for financing much-needed infrastructure projects, and relieving pressure for debt issuance in the domestic market. However, it would be significantly more expensive than traditional concessional borrowing (and most semi-concessional financing options), and would introduce exposure to a range of new risks. The merits of recourse to Eurobond issuance, as compared to other financing options, is discussed in Section 3.
2.4 Concessional external borrowing
This paper defines concessional external loans as those with a grant element of greater than or equal to 35 per cent (in line with standard international practice)75 – as has been the case to date for the vast majority of Uganda’s bilateral and multilateral borrowing.
The relative contribution of concessional financing to Uganda’s budget looks set to decline – reflecting continued robust GDP growth in Uganda and fiscal conditions in donor countries. MoFPED (2013c) projects that net concessional financing will decline as a ratio to GDP from 2.4 per cent of GDP in FY12/13, to just 1.2 per cent of GDP by FY19/20. This projection is broadly in line with recent IMF-World Bank debt sustainability analyses – which assume that concessional loan flows remain broadly constant in nominal US dollar terms over the medium term –76 although it would represent an acceleration of the historical downward trend (on average, over the past ten years, net concessional financing has fallen less rapidly
74 See Das et al (2008), pg18 for further discussion. 75 The grant element of a loan is defined as the difference between the loan’s face value and the sum of the discounted future debt-service payments (i.e. the present value), expressed as a percentage of the loan’s face value. Typically a loan is considered to be concessional if the grant element is at least 35 per cent; see http://www.imf.org/external/np/pdr/conc/. 76 IMF (2013b), IMF (2013c).

32
– by 0.1 percentage points as a share of GDP per year; if this trend continued, net concessional financing as a share of GDP would fall more slowly than in MoFPED (2013c), to around 1.7 per cent of GDP by FY19/20).
Whilst the precise outlook for concessional external borrowing is uncertain, a key point that comes out starkly from both theory (see, for example, Beaugrand et al 2002)77 and practice (see, for example, the relative domestic and external interest burdens on Uganda’s current debt stock, in Figure 2.3 above) is that in purely financial terms – given the extremely generous terms on which such lending is offered78 – it is optimal for GoU to maximise use of this form of financing as far as is possible.79
2.5 Semi-Concessional external borrowing
This paper defines semi-concessional borrowing as loans which incorporate a grant element of less than 35 per cent but that are still contracted on more generous terms than fully-commercial lending. As of end-FY12/13, GoU had accumulated semi-concessional external debt of around $450m.80 The bulk of this category of loans has been contracted with China (although it also currently captures two loans from France and from the European Investment Bank, of €75m each. It could in future also include some loans from other organisations, such as the AfDB – and potentially even the IBRD). Reflecting discussions with the Ugandan authorities, IMF (2013c) estimates that further semi-concessional borrowing from China of close to $2 billion will be accumulated over the next five years, to help finance two large hydropower projects.81
Semi-concessional external borrowing is clearly preferable to commercial external borrowing, all else equal – although some conditions can potentially make the comparison less clear-cut. For example, a standard feature of semi-concessional borrowing looks to be that it is attached to specific projects, meaning it comes with less flexibility.82 More substantively, semi-concessional lending can also take the form of tied aid; where there is no competitive public procurement or independent evaluation, it is not possible to determine the true financing cost and degree of concessionality.
77 This holds true even if there were significant risk of a substantial devaluation of the currency. For example, Beaugrand et al (2002) show that concessional external debt is preferable to domestic debt issuance even under very large probabilities of very large currency devaluations (for example, in their model, concessional external borrowing is preferable even if there is a 100 per cent probability of a 100 per cent devaluation). 78 Typical IDA terms, for example, are an annual interest rate of 0.75 per cent, a grace period of 10 years, and maturity of 40 years. 79 Non-financial factors also play a role; in particular, the preference of concessional borrowing will be subject to the caveat that any terms and conditions on concessional financing do not outweigh the cost advantages. 80 IMF (2013c), pg 27. 81 Specifically, it is estimated that 85 per cent of a total $2.35 billion cost of the Karuma and Isimba dams will be financed by loans from China Exim Bank, with a grant element potentially of around 11½ per cent. 82 It should be noted that the lack of flexibility associated with project finance can be cited as a benefit in contexts where there are fears about broader public financial management – although this comes at the cost of reduced pressures to reform, and constraints on the ability to conduct cash management efficiently.
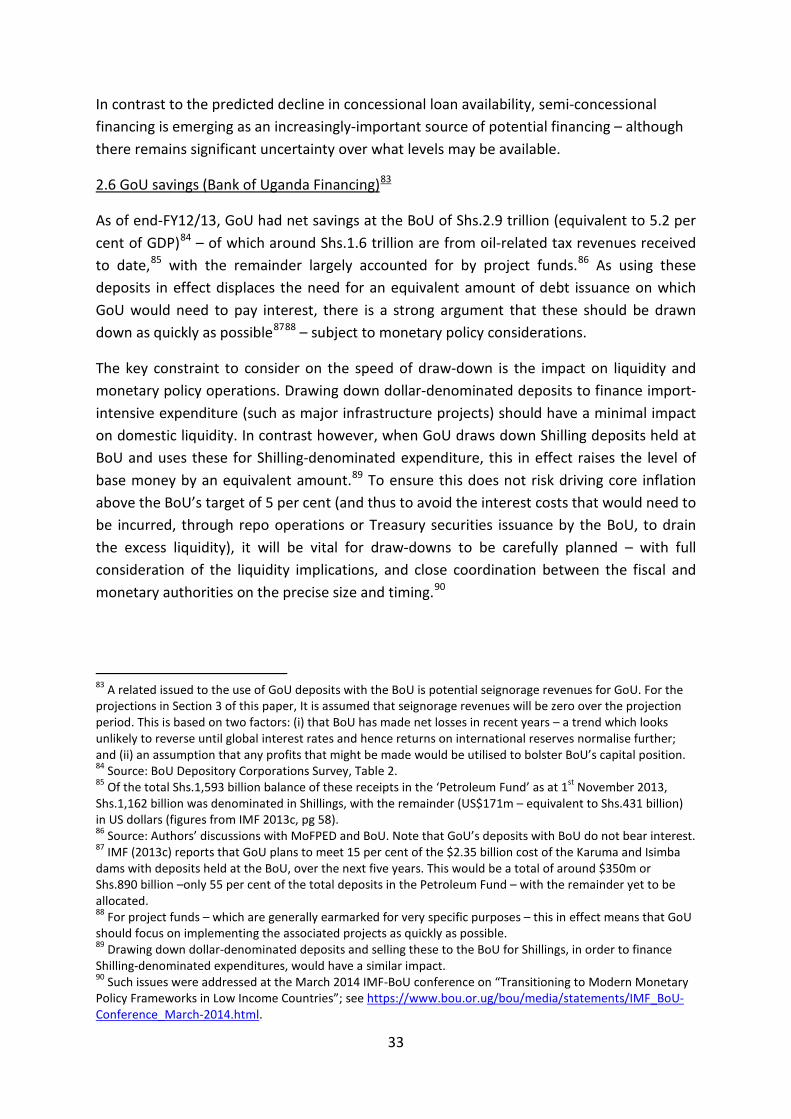
33
In contrast to the predicted decline in concessional loan availability, semi-concessional financing is emerging as an increasingly-important source of potential financing – although there remains significant uncertainty over what levels may be available.
2.6 GoU savings (Bank of Uganda Financing)83
As of end-FY12/13, GoU had net savings at the BoU of Shs.2.9 trillion (equivalent to 5.2 per cent of GDP)84 – of which around Shs.1.6 trillion are from oil-related tax revenues received to date,85 with the remainder largely accounted for by project funds.86 As using these deposits in effect displaces the need for an equivalent amount of debt issuance on which GoU would need to pay interest, there is a strong argument that these should be drawn down as quickly as possible8788 – subject to monetary policy considerations.
The key constraint to consider on the speed of draw-down is the impact on liquidity and monetary policy operations. Drawing down dollar-denominated deposits to finance import-intensive expenditure (such as major infrastructure projects) should have a minimal impact on domestic liquidity. In contrast however, when GoU draws down Shilling deposits held at BoU and uses these for Shilling-denominated expenditure, this in effect raises the level of base money by an equivalent amount.89 To ensure this does not risk driving core inflation above the BoU’s target of 5 per cent (and thus to avoid the interest costs that would need to be incurred, through repo operations or Treasury securities issuance by the BoU, to drain the excess liquidity), it will be vital for draw-downs to be carefully planned – with full consideration of the liquidity implications, and close coordination between the fiscal and monetary authorities on the precise size and timing.90
83 A related issued to the use of GoU deposits with the BoU is potential seignorage revenues for GoU. For the projections in Section 3 of this paper, It is assumed that seignorage revenues will be zero over the projection period. This is based on two factors: (i) that BoU has made net losses in recent years – a trend which looks unlikely to reverse until global interest rates and hence returns on international reserves normalise further; and (ii) an assumption that any profits that might be made would be utilised to bolster BoU’s capital position. 84 Source: BoU Depository Corporations Survey, Table 2. 85 Of the total Shs.1,593 billion balance of these receipts in the ‘Petroleum Fund’ as at 1st November 2013, Shs.1,162 billion was denominated in Shillings, with the remainder (US$171m – equivalent to Shs.431 billion) in US dollars (figures from IMF 2013c, pg 58). 86 Source: Authors’ discussions with MoFPED and BoU. Note that GoU’s deposits with BoU do not bear interest. 87 IMF (2013c) reports that GoU plans to meet 15 per cent of the $2.35 billion cost of the Karuma and Isimba dams with deposits held at the BoU, over the next five years. This would be a total of around $350m or Shs.890 billion –only 55 per cent of the total deposits in the Petroleum Fund – with the remainder yet to be allocated. 88 For project funds – which are generally earmarked for very specific purposes – this in effect means that GoU should focus on implementing the associated projects as quickly as possible. 89 Drawing down dollar-denominated deposits and selling these to the BoU for Shillings, in order to finance Shilling-denominated expenditures, would have a similar impact. 90 Such issues were addressed at the March 2014 IMF-BoU conference on “Transitioning to Modern Monetary Policy Frameworks in Low Income Countries”; see https://www.bou.or.ug/bou/media/statements/IMF_BoU-Conference_March-2014.html.
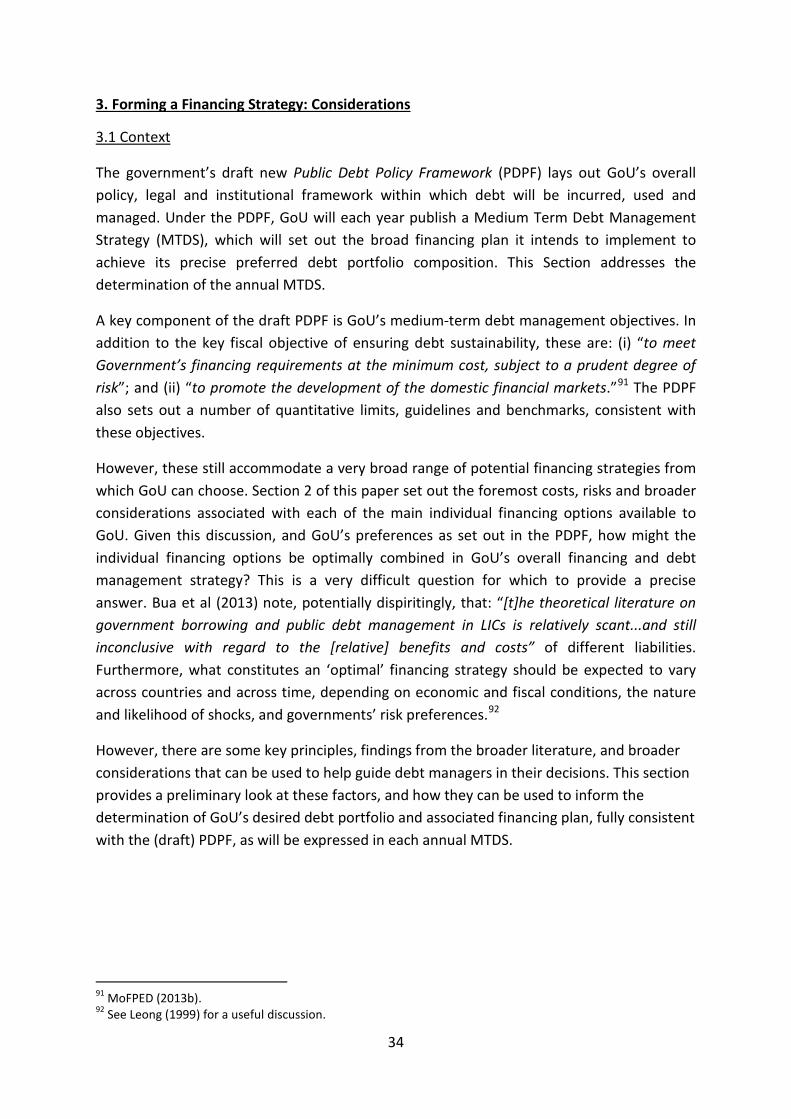
34
3. Forming a Financing Strategy: Considerations
3.1 Context
The government’s draft new Public Debt Policy Framework (PDPF) lays out GoU’s overall policy, legal and institutional framework within which debt will be incurred, used and managed. Under the PDPF, GoU will each year publish a Medium Term Debt Management Strategy (MTDS), which will set out the broad financing plan it intends to implement to achieve its precise preferred debt portfolio composition. This Section addresses the determination of the annual MTDS.
A key component of the draft PDPF is GoU’s medium-term debt management objectives. In addition to the key fiscal objective of ensuring debt sustainability, these are: (i) “to meet Government’s financing requirements at the minimum cost, subject to a prudent degree of risk”; and (ii) “to promote the development of the domestic financial markets.”91 The PDPF also sets out a number of quantitative limits, guidelines and benchmarks, consistent with these objectives.
However, these still accommodate a very broad range of potential financing strategies from which GoU can choose. Section 2 of this paper set out the foremost costs, risks and broader considerations associated with each of the main individual financing options available to GoU. Given this discussion, and GoU’s preferences as set out in the PDPF, how might the individual financing options be optimally combined in GoU’s overall financing and debt management strategy? This is a very difficult question for which to provide a precise answer. Bua et al (2013) note, potentially dispiritingly, that: “[t]he theoretical literature on government borrowing and public debt management in LICs is relatively scant...and still inconclusive with regard to the [relative] benefits and costs” of different liabilities. Furthermore, what constitutes an ‘optimal’ financing strategy should be expected to vary across countries and across time, depending on economic and fiscal conditions, the nature and likelihood of shocks, and governments’ risk preferences.92
However, there are some key principles, findings from the broader literature, and broader considerations that can be used to help guide debt managers in their decisions. This section provides a preliminary look at these factors, and how they can be used to inform the determination of GoU’s desired debt portfolio and associated financing plan, fully consistent with the (draft) PDPF, as will be expressed in each annual MTDS.
91 MoFPED (2013b). 92 See Leong (1999) for a useful discussion.

35
3.2 Meeting GoU’s debt management objectives
GoU’s debt management objectives can be broken down in to three key components: meeting financing requirements, doing so at minimum cost subject to risk, and developing the domestic financial markets. Some key practical considerations for meeting each are discussed in turn below.
3.2.1 Meeting government’s financing requirements
Mobilising sufficient financing to meet government’s requirements is a fundamental goal of debt management. Two particular issues to consider here are availability and diversification. The more GoU’s financing requirements expand beyond available concessional lending and past savings, the more pressing is the need to develop access to alternative financing sources; one potential benefit of Eurobond issuance in this regard, for example, is that it can supplement or ease pressures for domestic debt issuance, by tapping into a pool of capital to which GoU would otherwise not have access. Diversifying financing sources brings benefits in terms of broadening the policy space within which debt managers can plan – and can also be important in responding to unexpected events in-year. For example in FY12/13, having just introduced Treasury securities issuance for fiscal purposes, GoU was able to increase net issuance to help partially cushion the fiscal shock caused by a donor aid withdrawal (albeit at a cost of increased yields). However, whilst external and domestic market debt can provide such benefits, it is vital to ensure measures are put in place to help resist the potential for increased availability and diversification of financing sources to facilitate weaker fiscal discipline.
3.2.2 Minimising costs subject to risk
Some financing options open to Uganda are both lower cost and lower risk than others; for example, concessional external borrowing is clearly preferable to Eurobond issuance, with unambiguously and significantly lower interest costs and refinancing risk.93 However, in many other cases, GoU faces a direct trade-off between costs and risks. For example, for any given level of domestic debt financing, there will normally be a direct trade-off between lower interest costs (achieved by greater issuance at shorter maturities, at which yields are normally lower) and lower refinancing risk (achieved by greater issuance at longer maturities). GoU’s risk tolerance – as reflected in part in the PDPF – will be an important factor in determining the appropriate position within such trade-offs, as will be a consideration of the severity and probability of risks.
A cost-risk trade-off of particular note is in the choice between non-concessional external and domestic borrowing. In the absence of risk, the equivalent nominal interest rate in Shillings of a dollar-denominated loan can be calculated by adding the expected rate of
93 See Beaugrand et al (2002) for a discussion on this, and wider considerations for choosing between domestic and external financing.

36
depreciation to the nominal interest rate on the loan;94 so for example, if a Ugandan Eurobond could be issued at a yield of around 7½ to 8½ per cent (see Section 2.3.2), and it is assumed that the Shilling depreciates against the dollar by around 3 per cent per year,95 then the equivalent Shilling interest rate on a Eurobond would be around 10½ to 11½ per cent. This is lower than the weighted average interest rate on Treasury securities of just over 13 per cent (as of end-FY12/13). However, this ostensibly lower interest cost of a Eurobond is mitigated to a substantive degree once tax treatment is taken into account.9697 Furthermore, exchange rate risk that comes with borrowing in foreign currency, and differences in refinancing risk exposure, also need to be considered. For example, as measured by average time to maturity (ATM) alone, a Eurobond (of say either 5- or 10-years maturity) could be considered lower risk than domestic debt (the ATM on which is currently around 1.7 years). However, demand for domestic debt may be less volatile than for external debt – meaning the probability of market disruption for external borrowing at any given point in time might be greater –98 whilst the large size of redemption payments on a Eurobond compared to individual domestic Treasury securities99 means that the impact of any given market disruption at the time of redemption would be magnified for external borrowing.
Analytical aids such as the World Bank-IMF Medium-Term Debt Management Strategy tool – which Uganda has just adopted, and is discussed and used in Section 3.3 – can be used to provide a simple but informative quantification of cost-risk trade-offs.
94 See also Bevan (2012). 95 This would be implied by GoU maintaining inflation at around the core inflation target of 5 per cent, the US maintaining an inflation rate of around 2 per cent, and assuming that relative purchasing power parity holds over the period. Note also that the depreciation of the Shilling against the dollar has averaged 2.6 per cent per year over the last decade. 96 For example, as noted in Section 2.2.4, GoU currently charges a 20 per cent withholding tax on interest earned from Treasury securities. This applies to both resident and foreign investors – although it can be reduced for residents of countries with which Uganda has a double taxation agreement (for example, the withholding tax charged by GoU to residents of South Africa is 10 per cent). If all holders of Treasury securities paid the full 20 per cent withholding tax, the effective ‘net’ weighted average interest rate for GoU on Treasury securities (i.e. reflecting interest payments minus the withholding tax revenues) as at end-FY12/13 would be closer to 10½ per cent. In contrast, interest payments to foreign holders of a Eurobond would not be taxed by GoU; tax would be paid on income from this source by any domestic holders, which would reduce the ‘net’ interest costs for GoU on a Eurobond issue accordingly – although domestic holdings of a Eurobond would likely be small relative to foreign holdings, making this effect small. 97 Uganda’s country risk premium would also be endogenous to the amount of external exposure – i.e. the spread on a Ugandan Eurobond over a US Treasury benchmark, and hence the yield as a whole on any Ugandan Eurobonds, would likely increase with the stock of Eurobonds issued and outstanding. 98 One reason is that there are a range of institutions, such as commercial banks, pension funds and insurance companies, that will always need to match Shilling-denominated liabilities with Shilling-denominated liabilities. See Hanson (2007) for further discussion of sources of demands. 99 The average size of all outstanding Treasury bonds as at 5th December 2013 was just under Shs.95 billion (under $40m); the largest single outstanding bond was Shs.230 billion (just over $90m).

37
3.2.3 Promoting the development of domestic financial markets
The development of government debt markets – in addition to reducing the costs and risks of domestic financing – plays a fundamental role in supporting the development of the breadth, depth and resilience of the domestic financial sector more broadly.100 There is considerable policy guidance available on actions governments can take in this area – including on developing efficient primary markets, diversifying the investor base, stimulating active secondary markets, and ensuring settlement systems are sound and regulation robust.101 As set out in Box 1 and Section 2.2.4, Uganda has taken some significant steps already in this regard, scope for substantive further improvements remain, and the policy reform process is ongoing.
3.2.4 Additional considerations
In addition to the government’s debt management objectives, determining a financing strategy will also involve taking into account GoU’s wider macroeconomic and fiscal objectives – including supporting economic growth, and maintaining macroeconomic stability and debt sustainability –102 and the design and operation of the broader debt management institutional framework.
Section 2 addressed many of these additional considerations in the context of individual financing options, whilst MoFPED (2013c) (for Uganda specifically) and Adam and Bevan (2013) (for the general case)103 model in detail the overarching links between financing choices, fiscal policy decisions, macroeconomic impacts and debt sustainability. One particularly important message that emerges from these discussions is the importance of the link between the use to which debt proceeds will be put and the financing structure – and particularly the guiding principle that, to best support debt dynamics, any borrowing raised on non-concessional terms should be matched by increasing expenditure that generates a substantial fiscal return for government.
The rest of this sub-section considers two further specific considerations: the balance between domestic and external borrowing, and the institutional framework for debt management.
Domestic versus external borrowing
There are a variety of factors to consider in determining the appropriate balance between domestic and foreign currency borrowing, beyond the core cost and risk factors considered above.
100 See for example World Bank (2007). 101 See for example World Bank and IMF (2001) and World Bank (2007). 102 MoFPED (2013a). 103 See also Buffie et al (2012).

38
For example, if GoU plans to borrow to finance large foreign-currency denominated expenditures, it may wish to match this with external borrowing in order to mitigate the potential downward pressure on the real exchange rate; conversely, financing a significant increase in Shilling-denominated expenditure with increased external borrowing should be avoided, to prevent additional upward pressure on inflation and the real exchange rate.104 However, there are also potential currency-mismatches to be managed on the revenue and repayments side; if a public investment project requires primarily dollar-financed expenditures but generates revenues primarily in Shillings (either directly – such as through a toll road, for example – or through a general increase in taxes), then it may be optimal to partially finance the project with domestic borrowing to help mitigate the exposure to exchange rate risk (as well as to the depreciation pressures that could result from Shillings being converted into dollars to service the debt)105.106
Whilst it is valuable to consider such factors on a project-by--project basis, it is the overall fiscal picture which is of most importance.107 In particular, as government plans its financing strategy, it must consider not only the expenditure and revenue implications of the projects it plans to implement, but the currency composition of its existing debt redemption profile, expenditures and revenues – and alter the optimal financing mix that would be determined by a solely project-by-project approach accordingly. (Note that such considerations are also important, beyond currency mismatches, for refinancing risk and the overall debt portfolio redemption profile; whilst matching the maturity of debt instruments to the projected profile of returns on a project-by-project basis is useful, it is the overall redemption profile of government’s total debt stock and of projected expenditures and revenues that is of fundamental importance, with project-by-project implications needing to be altered accordingly.)
Finally, a number of recent papers highlight that whilst much attention has been given to recent Eurobond issuance by SSA sovereigns, emerging market economies (EMEs) place significantly greater weight on domestic as opposed to external government financing; as of 2011, local currency government debt was eight times the size of foreign-currency
104 Furthermore, if such an increase in Shilling-denominated expenditures financed by foreign currency borrowing leads to an increased liquidity surplus that needs to be sterilised (such as by issuing more domestic debt for monetary policy purposes), then the costs of this sterilisation should be added to the direct cost of the external borrowing when the government is determining its financing strategy. 105 Note that exposure to exchange rate risk in such cases would be mitigated where Shilling-denominated returns are generated from public investment that is serving export activities (i.e. where revenues are generated off a tradeable ‘base’; in this case, for example, a currency depreciation would increase Shilling revenues via the boost this would provide to export activity – so helping to meet the dollar-denominated expenditures that would have become more expensive in Shilling terms). 106 See Bevan (2012) for further discussion. 107 This is an implication of a key point that often gets lost in discussions around infrastructure financing: whilst repayment of borrowing by the private sector for infrastructure investment will often be linked to specific projects, government borrowing is normally serviced from general budgetary resources – and thus it is the government’s overall fiscal position, rather than solely the implications of the single project in question, that is ultimately paramount for debt managers.

39
government debt in EMEs.108 Mehl and Reynaud (2008) note that since the turn of the last decade many EMEs have retired external debt and replaced it with domestic debt, to reduce currency mismatches, and to help soften the impact of potential sharp reductions in capital inflows (‘sudden stops’). Of course this will in part reflect a greater capacity for domestic issuance in EMEs; but to the extent this reflects a revealed preference,109 it at least highlights the importance of considering to what extent Uganda should seek to rely on commercial external financing, and the need to help deepen capacity for domestic debt issuance.
Institutional framework for debt management
As Uganda’s level of debt continues to increase from the lows reached in the mid-2000’s after debt relief, and as availability of financing options expands in to areas with higher costs and risks, it becomes increasingly important for GoU to continue to develop its debt management capacity and improve the institutional framework within which debt management operations and decisions take place. Furthermore, whatever the precise financing strategy chosen, better planning and implementation capacity should lower costs (for example, by improving the predictability for and credibility with market participants) and reduce risks (for example, by being better able to plan for and manage refinancing risks) for any given level and composition of debt.
Accelerating the creation of a Debt Management Office (DMO), or Unit within MoFPED, should be an important priority in this regard. Currently, debt management responsibilities are fragmented across and within MoFPED and BoU, and in many cases lie with individuals who also have a variety of other responsibilities. By setting up a DMO, GoU would build a concentrated centre of expertise within government, with clear responsibility for debt management issues; this should assist in both the formulation and successful execution of financing strategies. Furthermore, continued improvement in the predictability and transparency of GoU’s market-based debt operations – such as through the proposed annual publications of a medium-term debt management strategy document and a debt management report – should also help build market confidence, and ultimately help support demand for GoU’s commercial debt issuance.
3.3 Potential medium-term financing strategies
This section moves on to consider what sort of financing strategy GoU could seek to adopt over the medium term – defined here as the period from FY14/15 to FY19/20 (the end of next National Development Plan period). An illustrative medium-term fiscal scenario is used for analysis, to highlight some general considerations and principles that can help guide the choice of an appropriate financing strategy, within the set of possibilities provided for by GoU’s draft PDPF. The section first provides a brief overview of the fiscal scenario adopted,
108 Dehn (2012). 109 Bevan (2012).

40
before analysing alternative strategies that could be adopted to meet the outlook for GoU’s financing requirements that this would imply.
3.3.1 Background: illustrative fiscal projection
The illustrative fiscal projections that are used as a basis for analysing potential financing strategies in this section are adopted from MoFPED (2013c); the key components are set out in Figure 3.1 below.
On expenditure, the key assumption underpinning the projection is that public investment increases over the medium term in order to deliver on the full extent of GoU’s infrastructure goals, as set out in the National Development Plan and GoU’s detailed sectoral infrastructure investment plans110 – with infrastructure investment spending averaging approximately $1½ billion per year out to FY19/20 (or averaging around 6 per cent as a ratio to GDP). It is assumed that other non-interest spending remains broadly constant as a share of GDP over the projection period, meaning that the increase in primary expenditure is driven by public investment.111
On the revenue side, the projections assume that GoU is successful in its efforts to significantly increase non-oil tax revenues over time, including through the reform of income tax and VAT exemptions – resulting in a substantive increase in the ratio of non-oil revenues to GDP in FY14/15, and a continued gradual rise thereafter. Grants are broadly assumed to continue their trend decline as a ratio to GDP. Oil production and associated GoU receipts are assumed to begin in FY18/19.
Reflecting these trends, the projections imply an average primary balance over the five years to FY17/18 of 4.1 per cent of GDP – compared to an average of 2.5 per cent of GDP over the past five years, and 1.4 per cent of GDP over the past ten years. The evolution of the total fiscal deficit – and thus GoU’s net financing requirements – will depend on the precise financing strategy chosen and accompanying debt interest costs; Figure 3.1 displays one potential, illustrative path for interest costs, to give a sense of the general trend and orders of magnitude involved.112
110 These include the Integrated Transport Investment Plan, the Regional Power System Master Plan, the Rural Electrification Strategy and Plan, the Water Sector Strategic Investment Plan, and the National Irrigation Master Plan. In addition, for the purposes of the projections it is assumed that total public investment in the oil sector will be just under $1 billion – reflecting assumed contributions towards the oil refinery, pipeline and petroleum reserve infrastructure – spread evenly between FY14/15 and FY19/20. The projections also assume that GoU will bear 20 per cent of the cost of the recently-announced standard gauge railway; any further public contribution would likely lead to a concomitant increase in the fiscal deficit and financing requirement. 111 The projections also incorporate an increase in expenditure on maintenance, linked to the increase in the stock of public infrastructure. 112 Taken from MoFPED (2013c), this is based on an illustrative financing strategy in which the domestic debt-to-GDP ratio is held broadly constant, concessional lending and GoU drawdowns of its balances with BoU evolve broadly as assumed in section 3.3.2 of this paper, and remaining financing requirements are met with commercial external borrowing.

41
Figure 3.1: Illustrative fiscal projections
Notes: FY13/14 figures are as per the Budget FY13/14 projections. All rows marked with a (*) will be directly altered by the interest payment implications of the precise deficit financing strategy chosen. Source: MoFPED (2013c).
These fiscal projections and their underlying assumptions should be viewed as simply one of a wide array of possible scenarios, and we acknowledge that many of the key assumptions and other details could be vigorously contested. However, for the purposes of this paper, what is of importance is the broad overall picture – of a sustained increase in public investment consistent with meeting the full scope of GoU’s infrastructure goals, which would drive an elevated series of fiscal deficits before oil revenues come on stream – and in particular, the feasible broad outlook for the net financing requirement that would result.113 The sustained increase in GoU’s net financing requirement provides an interesting scenario with which to underpin the focus of this section, which is: what strategy might GoU adopt to meet its financing requirements over the medium term?
3.3.2 Possible financing strategies
Overview
Figure 3.2 outlines the net financing requirements GoU would face over the medium term under the fiscal scenario set out in Figure 3.1. Line 1 sets out a series of net financing requirements over the projection period (as taken from Figure 3.1; as discussed in the previous section, this is only approximate, because the precise financing requirements will be endogenous to the chosen financing strategy through the impact on interest expenditure).
In considering how this series of requirements could be met, we take two sources as given. Firstly, it is assumed that net concessional financing is used to the maximum extent available, and that this availability follows a declining path as set out in line 2: falling from 2.4 per cent of GDP in FY13/14 to 1.2 per cent of GDP at the end of the projection period
113 Note that it is also assumed that there is no Treasury securities issuance required for monetary policy purposes over the projection period. It is also assumed that seignorage revenues will be zero over the projection period (for further discussion, see the footnote to Section 2.6).
(% of GDP) FY12/13 FY13/14 FY14/15 FY15/16 FY16/17 FY17/18 FY18/19 FY19/201 Revenues and Grants 15.2% 15.3% 17.6% 17.2% 17.0% 17.0% 18.4% 19.1%2 o/w non-oil revenues 13.5% 13.9% 15.8% 15.9% 16.0% 16.1% 16.2% 16.3%3 o/w oil revenues 0.0% 0.0% 0.0% 0.0% 0.0% 0.0% 1.4% 2.1%4 o/w grants 1.8% 1.4% 1.7% 1.3% 1.0% 0.9% 0.8% 0.7%5 Expenditure* 19.2% 20.4% 22.9% 23.7% 23.6% 23.1% 22.5% 20.7%6 o/w primary expenditure 17.5% 18.8% 21.4% 21.9% 21.5% 20.9% 20.2% 18.6%7 o/w interest payments* 1.6% 1.5% 1.6% 1.8% 2.0% 2.2% 2.2% 2.2%8 Primary balance (=1-6) -2.3% -3.5% -3.8% -4.7% -4.5% -3.9% -1.8% 0.5%9 Overall fiscal balance* (=8-7) -3.9% -5.1% -5.4% -6.5% -6.5% -6.1% -4.1% -1.6%
10 Financing requirement (net)* (= -9) 3.9% 5.1% 5.4% 6.5% 6.5% 6.1% 4.1% 1.6%

42
(broadly in line with MoFPED (2013c) and recent IMF-WB debt sustainability analyses).114 Secondly, it is assumed that GoU will draw down its net savings with the BoU gradually, so as to avoid placing undue pressure on monetary policy, as set out in line 3: GoU’s planned net draw down for FY13/14 is 1.0 per cent of GDP, and it is assumed this is maintained for the following three years, which would result in GoU’s net position being fully drawn-down by end-FY16/17.
The remaining net financing requirement – given in line 4 – needs to be met by a combination of domestic debt issuance, semi-concessional lending and/or Eurobond issuance.115 In line with the discussion in Section 2 of this paper, of these three we view the availability of semi-concessional lending as an area of particular uncertainty – and for the levels of financing implied by the projections in Figure 3.2, it is a significant driver for what freedom GoU would have in choosing its precise financing strategy. The quantities of semi-concessional lending assumed in the strategies with ‘moderate’ and ‘high’ levels of semi-concessional lending below represent our judgement, based on the discussion in Section 2.5; the terms assumed116 are equivalent to a grant element of around 17½ per cent - i.e. half the minimum grant element required for a loan to be classified as fully concessional.
Figure 3.2: Illustrative net financing projections
Notes: FY13/14 figures are as per the Budget FY13/14 projections. All rows marked with a (*) are illustrative, as they will alter depending on the precise financing strategy chosen and associated debt interest implications.
We consider four different financing strategies.117 Strategy 1 (S1) is a no semi-concessional lending scenario option; in this scenario, which provides a lower-bound benchmark, we assume that there is no non-concessional financing available throughout the seven-year period to FY19/20. In this instance, GoU would have little room for choice. After net savings and concessional financing are exhausted, the financing ‘gap’ that remains would need to be met via a combination of domestic debt (DD) issuance and Eurobond issuance alone. It is assumed that net DD issuance would average 2.1 per cent of GDP per year up to FY18/19, consistent with the stock of DD peaking in that year at the 15 per cent of GDP limit allowed under GoU’s draft PDPF (before both net issuance and the DD-to-GDP ratio fall in FY19/20,
114 See Section 2.4 for further discussion of this projection. 115 Note that the key macroeconomic assumptions underlying these projections are that nominal GDP grows at around 12 per cent per annum (broadly reflecting trend real GDP growth of 7 per cent, and inflation of 5 per cent in line with the BoU’s core inflation target), and that the Shilling depreciates against the US$ by 3 per cent each year (reflecting the difference in expected inflation levels). 116 These are: a 3 per cent fixed interest rate, 20 year maturity, and a 5 year grace period. 117 Note that we take the financing in FY13/14 as given – as per GoU’s Budget FY13/14 plans (MoFPED 2013a).
(% of GDP unless stated) FY12/13 FY13/14 FY14/15 FY15/16 FY16/17 FY17/18 FY18/19 FY19/201 Financing requirement (net)* 3.9% 5.1% 5.4% 6.5% 6.5% 6.1% 4.1% 1.6%2 o/w concessional external 2.4% 2.4% 2.2% 2.0% 1.8% 1.6% 1.4% 1.2%3 o/w drawdown of savings with BoU -0.3% 1.0% 1.0% 1.0% 1.0% 0.0% 0.0% 0.0%4 o/w remaining* 1.9% 1.7% 2.2% 3.5% 3.8% 4.5% 2.7% 0.4%5 Expressed in Shs.(bn, approx)* 1,040 1,500 2,750 3,350 4,500 3,000 5506 Expressed in US$ (mn, approx)* 400 550 1,000 1,150 1,500 1,000 180

43
as accelerating oil revenue eliminates the need for commercial external borrowing and reduces the need for DD issuance). The remainder of the net financing requirement would be met by Eurobond issuance;118 under this scenario, total Eurobond issuance over the projection period would need to reach almost $2 billion (spread over FY15/16 to FY18/19).
Strategy 2 (S2) incorporates a ‘moderate’ level of semi-concessional lending, averaging around $250 million (or 0.8 per cent of GDP) per year. It is assumed the remainder of GoU’s financing requirements would be met by expanding DD issuance close to the maximum extent allowed under the draft PDPF – with net DD issuance averaging around 2.1 per cent of GDP each year up to FY18/19, such that the DD-to-GDP ratio peaks at 14.9 per cent in that year (before net issuance and the DD-to-GDP ratio fall in FY19/20, for the same reason as in S1 – although both fall faster in FY19/20 than in S1, as the continuing availability of semi-concessional lending means the need for net DD issuance in that year is lower) – and a Eurobond issue of $400m.119
In Strategies 3 and 4 (S3 and S4), it is assumed that Uganda has access to a higher level of semi-concessional lending, averaging around $500 million (or 1.6 per cent of GDP) per year. In this case, GoU would have a much greater degree of freedom in determining its financing strategy. For example, either (S3) the remaining financing requirement could be met by domestic debt issuance alone – implying net DD issuance of around 1.5 per cent of GDP on average per year up to FY18/19 (and a peak in the DD-to-GDP ratio at 12.9 per cent in FY17/18) – or by (S4) a combination of a $500 million Eurobond issue120 and domestic debt issuance, with net DD issuance averaging around 1.2 per cent of GDP to FY18/19 (and a peak in the DD-to-GDP ratio at 12.2 per cent, in FY17/18).
Overall, these four possible financing strategies for the period to FY19/20 can be summarised as follows:
• S1: No semi-concessional borrowing, ‘maximum’ DD issuance, $2 billion of Eurobonds. • S2: Semi-concessional borrowing of around $250m/year, ‘maximum’ DD issuance, $400
million Eurobond. • S3: Semi-concessional borrowing of around $500m/year, ‘moderate’ DD issuance, no
Eurobond issuance. • S4: Semi-concessional borrowing of around $500m/year, ‘low’ DD issuance, $500 million
Eurobond.
118 For the purpose of the analysis in this section, it is assumed Uganda would issue Eurobonds of 10-year maturity. This is consistent with the majority of SSA issues to date, and implies redemption beyond the projection period. 119 In this scenario, it is assumed the Eurobond issue would be conducted in FY17/18 – reflecting the profile of the annual financing requirements set out in Figure 3.2, and our other financing assumptions set out above. 120 It is assumed this would be conducted in FY17/18, as in S2.

44
Analysis and discussion
In line with international best practice, Uganda has recently begun to use the IMF-WB Medium-Term Debt Management Strategy121 (MTDS) tool to formulate an annual medium-term debt management strategy. This tool is used in this section to produce a preliminary comparison of the different debt management cost and risk characteristics of the financing scenarios set out above.
The MTDS tool is very simple in its construction: it maintains identical projections for the primary deficit and key macroeconomic variables as entered by the user,122 providing instead a pure focus on the direct debt management cost and risk implications of alternative debt management strategies. As discussed above, in reality, alternative financing strategies will have different macroeconomic impacts (as considered in detail, for example, in Adam and Bevan 2013), and there are a variety of broader considerations that must also be taken into account when choosing between them. The MTDS tool therefore must be applied with such considerations in mind;123 however, it does provide a simple, effective means with which to make initial comparisons – on the basis of a set of fundamental debt management cost and risk indicators – of the relative merits of alternative financing strategies.
For the fiscal projections and strategies set out above, Figure 3.3 illustrates the projected values for various debt portfolio indicators as at end-FY19/20 under each strategy; Figure 3.4 plots, for two illustrative indicators, the central projected value for that indicator (termed ‘cost’) and a simple measure of risk. 124 125
121 See World Bank and IMF (2009). 122 Specifically, the user inputs data on the current debt portfolio and a set of macroeconomic, financial and fiscal forecasts (including the primary deficit, nominal GDP, exchange rate, domestic interest rates, US Treasury interest rates and sovereign spread). For the projections in this chapter, the primary deficit was as set out in Section 3.3.1, nominal GDP is assumed to grow at 12 per cent per year, the Shilling is assumed to depreciate against the US$ by 3 per cent per year, Ugandan government yields were assumed to remain unchanged throughout the projection period at levels around that of 5th December 2013, whilst US Treasury yields were assumed to rise as implied by the forward curve as at 5th December 2013. The spread on a Ugandan 10-year Eurobond is assumed to be 480 basis points (the average of the Zambian, Rwandan and Ghanaian spreads as at 5th December 2013). 123 A comprehensive assessment should include trying different sets of macroeconomic assumptions and severity of shocks. 124 The simple measure of ‘risk’ in the MTDS tool is calculated as the maximum deviation of the indicator in question from its central projected value, from four shock scenarios – here, these were: a 30 per cent currency devaluation in FY14/15; a domestic interest rate shock (in which Ugandan Treasury yields rise to similar levels as of early-2012) in FY14/15; a global interest rate shock (in which US 10-year Treasury yields rise by 300 basis points in FY16/17, and remain elevated for the next two years), and a combination of a 15 per cent depreciation in FY14/15 and the domestic interest rate shock. The output of the tool inherently assumes that each shock scenario is equally likely; as such, in determining an appropriate financing strategy in practice, it is important for the users of the tool to more fully assess the relative probabilities, and potentially also additional risk scenarios. 125 Further model outputs are provided in Annex 1.

45
Figure 3.3: Cost and risk indicators for alternative financing strategies (I)
Note: DD is comfortably below 15 per cent of GDP at end-FY19/20 in both S1 and S2, despite reaching around 15 per cent under both these strategies in FY18/19; DD falls in FY19/20 under all strategies – reflecting the acceleration of oil revenues, which facilitates a level of net DD issuance consistent with a falling DD-to-GDP ratio. ‘FX’ refers to foreign currency.
Figure 3.4: Cost and risk indicators for alternative financing strategies (II)
Note: ‘Cost’ is the central projected value for the indicator for each strategy. ‘Risk’ is defined as the difference between that central cost and the highest cost that results from the four shock scenarios outlined in the footnote below.
A key message that emerges is that strategies which incorporate higher semi-concessional external borrowing are preferable to those with a greater reliance on market-based issuance, whether domestic or external – with both cost and risk measures being lower when semi-concessional borrowing is greater.126 For example, the debt-to-GDP ratio and the interest burden indicators are greatest under S1 (no semi-concessional borrowing), and second-highest under S2 (moderate levels of semi-concessional borrowing).
Given that semi-concessional financing is inherently (all else equal) preferable to commercial external financing, the most noteworthy comparison in this regard is between 126 The one exception is that the share of foreign currency-denominated debt in total debt is larger where semi-concessional financing is higher, reflecting lower recourse to domestic borrowing; however, the modelling suggests this source of risk is in effect offset by the greater spread of repayments.
Cost and Risk Indicators End-FY12/13 As at end-FY19/20Current S1 S2 S3 S4
Nominal debt as % of GDP 29.2 37.3 36.6 36.0 36.0o/w Domestic debt 11.1 13.8 13.2 9.9 8.5o/w External debt 18.1 23.5 23.4 26.2 27.4
PV of total debt as % GDP 21.6 29.4 28.5 27.6 27.5Weighted average interest rate (%) 5.5 6.6 6.0 5.2 5.0Interest payments as % revenues (excl grants) 12.1 13.3 11.9 10.1 9.7
Refinancing risk ATM Total Portfolio (years) 12.9 11.9 12.2 14.1 14.3Debt maturing in 1yr (% of total) 21.6 13.3 13.1 10.0 8.9
Interest rate risk Fixed rate debt (% of total) 100.0 100.0 100.0 100.0 100.0
FX risk FX debt as % of total 62.1 63.1 63.9 72.6 76.3
S1
S2
S3
S4 27.0
27.5
28.0
28.5
29.0
29.5
30.0
2.26 2.27 2.28 2.29 2.30 2.31
Cost
(%)
Risk
PV of Debt to GDP
S1
S2
S3
S4
8
9
10
11
12
13
14
0.2 0.4 0.6 0.8
Cost
(%)
Risk
Interest payments as a ratio to revenues (excl. grants)

46
strategies S2 and S4: aside from a $100 million difference in Eurobond issuance, the primary difference between the two is higher domestic debt issuance and lower semi-concessional external financing in S2 compared to S4. In these simulations, the greater exposure to exchange rate risk in S4 is comfortably outweighed by the lower exposure to domestic market risks and the higher level of concessionality of financing – with a clear policy implication being that GoU should seek to expand its access to semi-concessional external financing. However, it is important to bear in mind the caveats set out in Section 2.5 (particularly the potential for semi-concessional financing to come with conditions attached that make it difficult to assess the true level of concessionality), and that the comparison with domestic financing will become less clear-cut the lower the grant element in the semi-concessional financing being contracted.
The two ‘high’ semi-concessional borrowing strategies S3 and S4 provide the basis for a comparison of the merits of Eurobond issuance with domestic debt – with S3 relying more heavily on domestic debt, and S4 incorporating the issuance of a $500m, 10-year Eurobond. It is interesting to note that, on the basis of the simulations here, the implied debt management costs and risks of these two strategies are very similar, with only negligible differences between debt stock and interest cost indicators. However, a crucial factor to note is that refinancing risks associated with the Eurobond are not captured here – as the redemption date lies beyond the end of the projection period. The comparison will also be sensitive to some extent to the assumptions used for domestic and international market conditions, and the precise shock scenarios used to generate the simple measure of risk.127
As discussed in Sections 2.2, 2.3 and 3.2.4, there are a variety of other factors to take into consideration in determining the appropriate balance between domestic and external commercial borrowing – most of which are beyond the scope of the model use here. However, some simple further assumptions do allow some quantitative consideration of one key aspect: the extent to which Eurobond issuance may be desired to relieve potential crowding out due to DD issuance. Figures 3.5A and B illustrate the path of two simple indicators that can be used to get a feel for the extent of potential crowding out: the ratio of the DD stock to the stock of private sector credit (PSC), and the ratio of commercial bank holdings of DD to deposits. The former measure is adopted by GoU in the draft PDPF – which proposes a limit of 75 per cent; the latter is the metric used in Abbas and Christensen
127 In one alternative scenario (not illustrated) in which the spread over US Treasury yields on Ugandan Eurobond issuance is 200 basis points higher in every year of the projection period, cost indicators under scenario S4 are marginally higher – but the measured difference between S3 and S4 remains minimal. For a second alternative scenario, the authors assumed that a 5-year rather than a 10-year Eurobond is issued – and that it is issued earlier in the period such that redemption and required refinancing falls due within the projection period. As would be expected, under this circumstance the cost of S4 becomes substantively lower than S3 (reflecting the lower interest rate payable on a shorter-term Eurobond), but measured risk become substantively higher – meaning the choice between the two, on pure debt management cost-risk grounds as captured in the model, remains unclear. In a third alternative scenario, in which the exchange rate is assumed to be flat against the US dollar over the projection period, there remains little difference in measured cost-risk terms between S3 and S4.

47
(2010) (as discussed in Section 2.2), who find some evidence to suggest that a reasonable limit for this indicator may be around 35 per cent.
Figures 3.5A and B: Indicators of crowding out
Note: In Figure 3.5A it is assumed that PSC grows at an average of 20 per cent per year in nominal terms – reflecting average annual real growth of around 15 per cent over the past decade, and assumed inflation of 5 per cent. in Figure 3.5B it is assumed that the proportion of commercial bank holdings of the total DD stock remains constant through the projection period at the same level as at end-FY12/13 (just over half), and that deposits with commercial banks grow at 15 per cent each year in nominal terms – reflecting average annual real growth of around 10 per cent over the past decade, and assumed inflation of 5 per cent.
The projections in Figure 3.5A suggest that DD issuance under each of the four strategies would maintain the DD-to-PSC ratio at levels around or below the level at end FY-12/13 (of 76.1 per cent), and the 75 per cent limit proposed in the draft PDPF. In contrast, the projections in Figure 3.5B for the ratio of commercial bank DD holdings to deposits provide a more complex story. In both of the ‘high’ semi-concessional financing strategies S3 and S4, the levels of DD issuance are consistent with maintaining this ratio around or below the end-FY12/13 level (of 33 per cent) and the 35 per cent figure of note that emerges from Abbas and Christensen (2010); this implies there would not be a strong argument on the grounds of crowding out in favour of a Eurobond issuance (S4) over fuller reliance on DD issuance (S3).
In S1 and S2 however, DD issuance would push the ratio of commercial bank DD holdings to deposits up towards 40 per cent. This would imply a heightened need to pursue reforms that would support the expansion of the DD investor base (thus decreasing commercial banks’ share of total DD holdings) and accelerating deposit growth – to help mitigate as far as possible such a rise. Beyond conducting such reforms, where the outlook for semi-concessional financing is ‘moderate’ GoU may wish to analyse the merits of variations on S2 that incorporate some additional Eurobond issuance. In S1, total Eurobond issuance is already very high compared to existing issuance by regional peers; in a situation where the
0%
10%
20%
30%
40%
50%
60%
70%
80%
FY12
/13
FY13
/14
FY14
/15
FY15
/16
FY16
/17
FY17
/18
FY18
/19
FY19
/20
Ratio of DD to private sector credit
Strategy 1 Strategy 2
Strategy 3 Strategy 4
0%5%
10%15%20%25%30%35%40%45%
FY12
/13
FY13
/14
FY14
/15
FY15
/16
FY16
/17
FY17
/18
FY18
/19
FY19
/20
Ratio of commercial bank DD holdings to deposits
Strategy 1 Strategy 2
Strategy 3 Strategy 4

48
outlook for semi-concessional financing were indeed at or close to zero, crowding out concerns may instead imply that GoU would need to moderate its public investment ambitions and deficit financing requirements.
Finally, it is interesting to note that the difference in the overall nominal debt-to-GDP ratio between the ‘most expensive’ and ‘least expensive’ strategies (S1 and S4) by the end of FY19/20 is just 1.3 percentage points. Whilst this is not negligible, it is not so large as to significantly alter the outlook for the sustainability of the public finances; this illustrates that – whilst effective debt management is crucial for minimising what can potentially be substantial costs and risks – it is fiscal policy and the chosen path for the fiscal deficit that is of first-order importance when it comes to safeguarding debt sustainability. The influence of the choice of financing strategy on the interest burden on the budget is more substantive: the difference between the highest and lowest projections for the ratio of interest payments to revenues (excluding grants) is 3.6 percentage points – indicating that strategies involving more commercial borrowing can put substantively greater pressure on non-interest expenditures.

49
4. Conclusion
This paper has provided an overview of the key considerations associated with the individual deficit financing options available to Uganda, and with determining the balance between them. There are many knowledge gaps in this area, and considerable further research is needed to help developing countries identify optimal financing strategies – including by integrating macroeconomic feedbacks in to assessments of borrowing decisions. However, insights from some simple cost-risk analysis, combined with some recent research findings and broader theoretical and practical considerations, can be used to provide some valuable practical guidance for the authorities’ decisions.
One clear guiding principle in forming an overall financing strategy is that GoU should continue to maximise the use of concessional external debt as far as is possible. GoU should also draw down on its net savings with the BoU as rapidly as the liquidity implications for monetary policy allow. However, since FY09/10, these sources have been insufficient to fully-meet GoU’s financing needs; this looks set to continue at least until oil revenues come on stream towards the end of this decade, meaning that in the interim GoU will require financing from additional sources, including semi-concessional external loans, domestic borrowing and potentially also the international markets.
In debt management cost-risk terms, all else equal, semi-concessional external financing will always be preferable to commercial external financing, and is clearly preferable to domestic borrowing when the grant element of such loans is still substantial – although the comparison will be less clear-cut as the level of concessionality diminishes. Where semi-concessional lending takes the form of tied aid with no competitive public procurement or independent evaluation, it is difficult to determine the true financing cost and degree of concessionality – complicating comparison with alternative financing options. This implies that for all proposed tied aid packages, at the very least GoU should seek an independent evaluation of the costs of the associated project. Overall however, just as GoU should seek to maximise access to concessional external financing, it should also seek to maximise the availability of genuinely semi-concessional financing as far as possible, in order to minimise the need for commercial borrowing.
The optimal trade-off between the use of domestic and external commercial borrowing is more uncertain. On the domestic side, there is reason to expect that large domestic debt (DD) issuance could cause crowding out of private sector investment – but that, up to a moderate level of issuance, this may be outweighed by broader benefits. Evidence available suggests that GoU’s approach adopted in the Budget for FY13/14 is a sensible one: the planned net DD issuance in FY13/14 of 1.6 per cent of GDP is broadly in line with average net issuance over the past ten years (and so should be perfectly feasible), and over the medium term would be consistent with maintaining the ratio of DD to bank deposits at around its current level (which is close to what one recent piece of research suggests may be an optimal level). If GoU did decide to expand net DD issuance beyond this, the upper

50
limit the authorities have considered setting for the DD-to-GDP ratio of 15 per cent (which would be consistent with net issuance of around 2.0 per cent of GDP each year to FY19/20) does not look unreasonable; however, the higher the level of issuance, the more pressing it will be to undertake complementary reforms that support increased financial depth, minimise the costs and maximise the benefits associated with DD issuance.
In terms of external commercial borrowing, international investor interest in ‘frontier’ sovereign debt, combined with Uganda’s current level of borrowing space, means that borrowing from external sources on commercial terms such as in the form of a Eurobond is now a feasible financing option for Uganda. Whilst issuing Eurobonds allows access to a much broader pool of financing, it also brings with it a set of potentially significant risks that would need to be carefully managed, and that it is vital be fully taken into account before any issuance decision is made.
The illustrative medium-term fiscal scenario considered in this paper shows that meeting the full ambition of GoU’s investment goals out to FY19/20 (the end of the next National Development Plan period) would require a series of elevated fiscal deficits before oil revenues come on stream towards the end of this decade. Simple simulations suggest that if around $250 million (or 0.8 per cent of GDP) were raised on average from semi-concessional sources each year, then net Treasury securities issuance consistent with raising the domestic debt stock to 15 per cent of GDP would still not fully cover GoU’s net financing requirements – and it could be necessary to issue around $400 million of commercial external debt over the medium term. If around $500 million (or around 1.6 per cent of GDP) of semi-concessional financing were obtained each year, GoU would have the freedom to choose whether or not to issue a Eurobond, and if so, how to balance the size of such an issue with domestic borrowing. Higher levels of semi-concessional borrowing therefore increase GoU’s freedom in determining the balance between domestic and external commercial borrowing, as well as simply decreasing the overall need for commercial borrowing. In deciding between alternative financing strategies, the standard IMF-WB medium-term debt management strategy tool provides a valuable means of producing an initial assessment of relative debt management costs and risks – although this must be supplemented with an assessment of the broader costs, benefits and other considerations that the tool is not designed to capture.
Whatever precise financing strategy is chosen, there are a variety of actions government can take to help maximise the net benefits of debt issuance and minimise the costs and risks. On the domestic side, these include action to help broaden the investor base for Treasury securities, continued strengthening of the operation and credibility of Uganda’s inflation targeting ‘lite’ framework, further extending the yield curve, and supporting the development of the secondary market. On the external side, it would be vital that any Eurobond issue would not exceed the amount required, and that it be conducted only when GoU is ready to put the proceeds to use. Improved predictability and transparency of GoU’s

51
market-based debt operations – such as through the proposed annual publications of a medium-term debt management strategy document and Debt Management Report – will also be valuable for supporting accountability and market demand. As projected levels of debt rise and financing choices become more complex, the continued development of debt management capacity becomes increasingly important; this should include accelerating the setting-up of a specialist Debt Management Office.
Whilst this paper has focused on below-the-line issues of deficit financing and debt management, it is important also to consider the broader fiscal context. The choice between alternative financing strategies can influence the overall fiscal position, and in particular will directly influence the extent to which interest costs impinge on other expenditure (and some risks to which the fiscal position is exposed); in terms of debt sustainability, however, the impact of financing choices is far outweighed by the balance between revenue and expenditure choices and the size of the primary fiscal deficit. The fiscal scenario adopted in this paper suggests that GoU can achieve its investment goals over the medium term whilst remaining comfortably within standard debt sustainability benchmarks – with the nominal debt to GDP ratio projected to peak below 40 per cent of GDP under all financing strategies considered. An important premise on which these projections are based is that increased borrowing would indeed be used to finance increased productive infrastructure investment – which is crucial, if the net benefits of debt issuance are to be maximised.
As GoU moves towards greater reliance on market-based financing, it will be increasingly important that investor perceptions and confidence in GoU’s fiscal plans are managed. In a world where GoU plans to run an extended period of sizeable deficits, it will be vital that it builds, maintains and communicates a strong and credible story around the effective management of debt, the use of issuance proceeds, and the promise that deficits will be unwound over time.
Finally, there are a range of broader fiscal measures GoU should pursue which can help expand the availability of resources to finance priority expenditures without recourse to borrowing – including encouraging greater private sector involvement (such as through PPPs), re-balancing budgetary priorities and improving value for money across government expenditures, and increasing tax and non-tax revenues. It will be important to ensure that the increasing depth and breadth of borrowing options does not displace the pursuit of such reforms.

52
References
Abbas, S.M. Ali and Jakob E. Christensen (2010) “The Role of Domestic Debt Markets in Economic Growth: An Empirical Investigation for Low-Income Countries and Emerging Markets”, IMF Staff Papers, 57(1).
Adam, Christopher and David Bevan (2013), Public Investment, Public Finance and Growth: “The impact of distortionary taxation, recurrent costs and incomplete appropriability”, mimeo.
Adelegan, O. Janet and Bozena Radzewicz-Bak (2009) “What Determines Bond Market Development in Sub-Saharan Africa?”, IMF Working Paper WP/09/213.
Aisen, Ari and David Hauner (2008) “Budget Deficits and Interest Rates: A Fresh Perspective”, IMF Working Paper WP/08/42.
Baldacci, Emanuele and Manmohan S. Kumar (2010) “Fiscal Deficits, Public Debt and Sovereign Bond Yields”, IMF Working Paper WP/10/184.
Beaugrand, Philippe, Boileau Loko and Montfort Mlachila (2002) “The Choice Between External and Domestic Debt in Financing Budget Deficits: The Case of Central and West Africa”, IMF Working Paper WP/02/79.
Bevan, David (2010) “Fiscal Policy Issues for Tanzania”, International Growth Centre Working Paper 10/0875.
Bua, Giovanna, Juan Pradelli and Andrea F Presbitero (2013) “Domestic Public Debt in Low Income Countries: Trends and Structure”, Money and Finance Research Group, Università Politecnica delle Marche, Working Paper No. 85.
Christensen, Jakob (2005) “Domestic Debt Markets in Sub-Saharan Africa”, IMF Staff Papers 52(3).
Das, Udaibir S., Michael G. Papaioannou and Magdalena Polan (2008) “Strategic Considerations for First-Time Sovereign Bond Issuers”, IMF Working Paper WP/08/261.
Dehn, Jan (2012) “The Emerging View: The Ugly Ducking Grows Up”, Ashmore Investment Management Ltd, February 2012.
Emran, M Shahe and Subika Farazi (2009) “Lazy Banks? Government Borrowing and Private Credit in Developing Countries”, Institute for International Economic Policy, George Washington University, Working Paper 2009-9.
Gray, Simon and David Woo (2000) “Reconsidering External Financing of Domestic Budget Deficits: Debunking Some Received Wisdom”, IMF Policy Discussion Paper PDP/00/08.

53
Gueye, Cheikh A. and Amadou N.R. Sy (2010) “Beyond Aid: How Much Should African Countries Pay to Borrow?”, IMF Working Paper WP/10/140.
Hanson, James A. (2007) “The Growth in Government Domestic Debt: Changing Burdens and Risks”, World Bank Policy Research Working Paper 4348.
Hostland, Doug (2009) “Low-Income Countries’ Access to Private Debt Markets”, World Bank Policy Research Working Paper 4829.
IMF (2003) “Access to International Capital Markets for First-Time Sovereign Issuers”.
IMF (2009) “Changing Patterns in Low-Income Country Financing and Implications for Fund Policies on External Financing and Debt”.
IMF (2013a) “Review of the Policy on Debt Limits in Fund-Supported Programmes”, March 2013.
IMF (2013b) “Uganda: Staff Report for the 2013 Article IV Consultation, Sixth Review Under the Policy Support Instrument, Request for a Three-Year Policy Support Instrument and Cancellation of Current Policy Support Instrument”, 17th June 2013.
IMF (2013c) “Uganda: First Review Under the Policy Support Instrument”, 3rd December 2013.
IMF and World Bank (2003) “Guidelines for Public Debt Management”.
IMF and World Bank (2008) “Staff Guidance Note on the Joint Fund-World Bank Debt Sustainability Framework for Low-Income Countries”.
IMF and World Bank (2012) “Revisiting the Debt Sustainability Framework for Low-Income Countries”.
Jaramillo, Laura and Anke Weber (2012) “Bond Yields in Emerging Economies: It Matters What State You Are In”, IMF Working Paper WP/12/198.
Leong, Donna (1999) “Debt Management – Theory and Practice”, HM Treasury Occasional Paper No.10.
Mehl, Arnaud and Julien Reynaud (2005) “The Determinants of ‘Domestic’ Original Sin in Emerging Market Economies”, European Central Bank Working Paper No. 560.
Mehl, Arnaud and Julien Reynaud (2008) “Domestic Debt Structures in Emerging Markets: New Empirical Evidence”, Centre d’Economie de la Sorbonne Working Paper.
Ministry of Finance, Planning and Economic Development (2007) “Uganda Debt Strategy 2007”, December 2007.

54
Ministry of Finance, Planning and Economic Development (2012) “Uganda Debt Sustainability Report”, October 2012.
Ministry of Finance, Planning and Economic Development (2013a) The Background to the Budget 2013/14 Fiscal Year, June 2013.
Ministry of Finance, Planning and Economic Development (2013b) “Uganda Public Debt Strategy 2013”, mimeo.
Ministry of Finance, Planning and Economic Development (2013c) “Uganda’s Medium and Long-Term Fiscal Strategy for Socio-Economic Transformation”, Economic Development Policy and Research Department, mimeo.
Mu, Yibin, Peter Phelps and Janet G Stotsky (2013) “Bond Markets in Africa”, IMF Working Paper WP/13/12.
Jaramillo, Laura and Anke Weber (2012) “Bond Yields in Emerging Economies: It Matters What State You Are In”, IMF Working Paper WP/12/198.
Peiris, Shanaka J. (2010) “Foreign Participation in Emerging Markets’ Local Currency Bond Markets”, IMF Working Paper WP/10/88.
Pradhan, Mahmood, Ravi Balakrishnan, Reza Baqir, Geoffrey Heenan, Sylwia Nowak, Ceyda Oner and Sanjaya Panth (2011) “Policy Responses to Capital Flows in Emerging Markets”, IMF Staff Discussion Note, SDN/11/10.
Presbitero, Andrea F. (2010) “External debt relief but increasing domestic debt”, VoxEU, 19 November 2010.
Reinhart, Carmen M. and Kenneth S. Rogoff (2010) “Growth in a Time of Debt”, NBER Working Paper No. 15639.
Rutega, Simon, Winifred Tarinyeba Kiryabwire and Patrick K. Muwanguzi (2012) “Feasibility Study for the Establishment of an International Diaspora Bond”.
Sy, Amadou N.R. (2013) “First Borrow: A growing number of countries in SSA are tapping international capital markets”, IMF Finance & Development, June 2013.
World Bank (2007) “Developing the Domestic Government Debt Market: From Diagnostics to Reform Implementation”.
World Bank and East African Community Secretariat (2014) “East African Common Market Scorecard 2014: Summary – Tracking EAC Compliance in the movement of Capital, Services and Goods”.
World Bank and IMF (2001) “Developing Government Bond Markets: A Handbook”.

55
World Bank and IMF (2009) “Developing a Medium-Term Debt Management Strategy (MTDS) — Guidance Note for Country Authorities”

56
Annex 1: Financing scenarios for FY13/14 to FY19/20 – Selected MTDS model outputs
Figure A1.1: Debt stocks by instrument as at end-FY19/20 under central scenario
Figure A1.2: Evolution of key ratios under central scenario
0%
5%
10%
15%
20%
25%
30%
35%
40%
S1 S2 S3 S4
Debt stock by instrument as at end-FY19/20 (% GDP)
Domestic debt
Eurobonds
Semi-concessionalexternal
Concessional external
26
28
30
32
34
36
38
40
FY13/14 FY15/16 FY17/18 FY19/20
Nominal Debt-to-GDP ratio
Strategy 1 Strategy 2Strategy 3 Strategy 4
%
0.0
0.5
1.0
1.5
2.0
2.5
3.0
FY13/14 FY15/16 FY17/18 FY19/20
Interest-to-GDP ratio
Strategy 1 Strategy 2
Strategy 3 Strategy 4
%
16
18
20
22
24
26
28
30
32
2014 2015 2016 2017 2018 2019 2020 2021
PV of debt-to-GDP ratio
Strategy 1 Strategy 2
Strategy 3 Strategy 4
%
0
2
4
6
8
10
12
14
FY13/14 FY15/16 FY17/18 FY19/20
Interest-to-revenues (excl grants) ratio
Strategy 1 Strategy 2
Strategy 3 Strategy 4
%

57
Figure A1.3i: Impact of shocks on PV of Debt to GDP ratio:
Note: The highlighted cells are those for which the difference is greatest between the value of the indicator under the baseline and under the shock; it is these differences that are defined to be the ‘risk’ associated with each strategy, and that are plotted on the charts in Section 3.3.
Figure A1.3ii: Impact of shocks on interest payments as a ratio to revenues (excl grants):
Note: The highlighted cells are those for which the difference is greatest between the value of the indicator under the baseline and under the shock; it is these differences that are defined to be the ‘risk’ associated with each strategy, and that are plotted on the charts in Section 3.3.
Recall that the four shocks modelled are as follows:
• a 30 per cent currency devaluation in FY14/15; • a domestic interest rate shock (in which Ugandan Treasury yields rise to similar levels
as of early-2012) in FY14/15; • a global interest rate shock (in which US 10-year Treasury yields are 300 basis points
higher from FY16/17 to FY18/19 compared to the end-FY12/13 forward curve); and • a combination of a 15 per cent depreciation in FY14/15 and the domestic interest
rate shock.
Note that, for the PV of Debt to GDP, the effect of the exchange rate shock is dominant; in comparison, the impact of the domestic interest rate shock and US Treasury interest rates shocks are minor. The picture is different for the interest payments as a ratio to revenues (excluding grants) indicator; here, the US Treasury interest rate shock has the greatest impact under S1 (which included total Eurobond issuance of around $2 billion); for the other three strategies, the combined 15 per cent currency depreciation and domestic interest rate shock has the greatest impact.
Scenarios S1 S2 S3 S4 S1 S2 S3 S4Baseline 29.44 28.47 27.55 27.48 0.00 0.00 0.00 0.00Exchange rate shock (30% depreciation) 31.75 30.76 29.82 29.74 2.30 2.29 2.27 2.27Domestic interest rate shock 29.73 28.73 27.76 27.68 0.29 0.25 0.21 0.21US Treasuries interest rate shock 29.67 28.53 27.55 27.54 0.23 0.06 0.00 0.06
Max Risk 2.30 2.29 2.27 2.27 2.30 2.29 2.27 2.27
Difference between value of indicator under shock and baseline
30.88 29.87 28.90 28.82
Value of indicator
Combined 15% depreciation & domestic interest rate shock
1.44 1.40 1.35 1.34
Scenarios S1 S2 S3 S4 S1 S2 S3 S4Baseline 13.30 11.91 10.07 9.73 0.00 0.00 0.00 0.00Exchange rate shock (30% depreciation) 13.63 12.23 10.35 10.00 0.33 0.31 0.28 0.27Domestic interest rate shock 13.56 12.14 10.25 9.90 0.26 0.23 0.18 0.17US Treasuries interest rate shock 14.02 12.10 10.07 9.95 0.72 0.18 0.00 0.22
Max Risk 0.72 0.38 0.32 0.31 0.72 0.38 0.32 0.31
0.43 0.38 0.32 0.31
Difference between value of indicator under shock and baseline
Combined 15% depreciation & domestic interest rate shock
13.73 12.30 10.39 10.04
Value of indicator