final report - national center for transit research · final report technology application among...
TRANSCRIPT
Final Report
Technology Application among
Florida Community Transportation Coordinators
October 2015
FDOT Research Report
BDV26-977-06
PREPARED FOR
Florida Department of Transportation and
Florida Commission for the Transportation Disadvantaged
ii
Disclaimer
The contents of this report reflect the views of the authors, who are responsible for the facts and the accuracy of the information presented herein. This document is disseminated under
the sponsorship of the Department of Transportation University Transportation Centers Program and the Florida Department of Transportation, in the interest of information exchange.
The U.S. Government and the Florida Department of Transportation assume no liability for the contents or use thereof.
The opinions, findings, and conclusions expressed in this publication are those of the authors and not necessarily those of the State of Florida Department of Transportation.
The authors do not endorse products from any vendors. Products illustrated in the report are used as examples of available technology.
iii
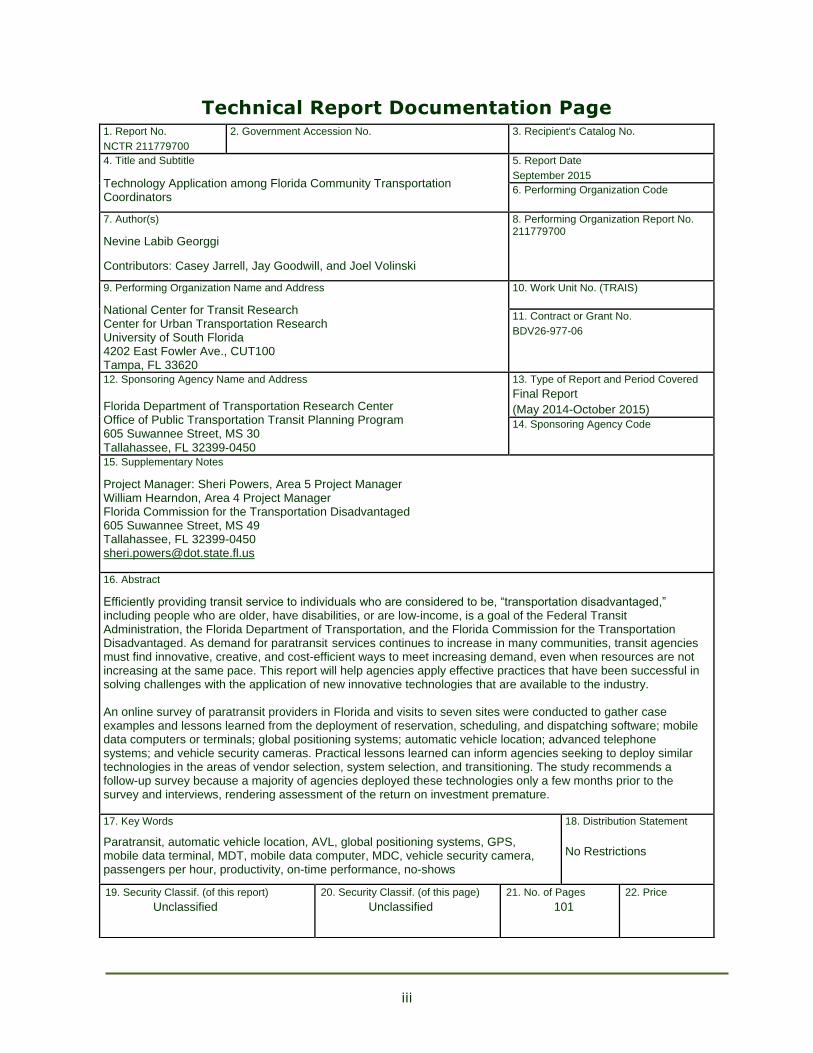
Technical Report Documentation Page 1. Report No.
NCTR 211779700
2. Government Accession No.
3. Recipient's Catalog No.
4. Title and Subtitle
Technology Application among Florida Community Transportation Coordinators
5. Report Date
September 2015
6. Performing Organization Code
7. Author(s)
Nevine Labib Georggi
Contributors: Casey Jarrell, Jay Goodwill, and Joel Volinski
8. Performing Organization Report No. 211779700
9. Performing Organization Name and Address
National Center for Transit Research Center for Urban Transportation Research University of South Florida 4202 East Fowler Ave., CUT100 Tampa, FL 33620
10. Work Unit No. (TRAIS)
11. Contract or Grant No.
BDV26-977-06
12. Sponsoring Agency Name and Address
Florida Department of Transportation Research Center Office of Public Transportation Transit Planning Program 605 Suwannee Street, MS 30 Tallahassee, FL 32399‐0450
13. Type of Report and Period Covered
Final Report
(May 2014-October 2015)
14. Sponsoring Agency Code
15. Supplementary Notes
Project Manager: Sheri Powers, Area 5 Project Manager William Hearndon, Area 4 Project Manager Florida Commission for the Transportation Disadvantaged 605 Suwannee Street, MS 49 Tallahassee, FL 32399-0450 [email protected]
16. Abstract
Efficiently providing transit service to individuals who are considered to be, “transportation disadvantaged,” including people who are older, have disabilities, or are low-income, is a goal of the Federal Transit Administration, the Florida Department of Transportation, and the Florida Commission for the Transportation Disadvantaged. As demand for paratransit services continues to increase in many communities, transit agencies must find innovative, creative, and cost-efficient ways to meet increasing demand, even when resources are not increasing at the same pace. This report will help agencies apply effective practices that have been successful in solving challenges with the application of new innovative technologies that are available to the industry. An online survey of paratransit providers in Florida and visits to seven sites were conducted to gather case examples and lessons learned from the deployment of reservation, scheduling, and dispatching software; mobile data computers or terminals; global positioning systems; automatic vehicle location; advanced telephone systems; and vehicle security cameras. Practical lessons learned can inform agencies seeking to deploy similar technologies in the areas of vendor selection, system selection, and transitioning. The study recommends a follow-up survey because a majority of agencies deployed these technologies only a few months prior to the survey and interviews, rendering assessment of the return on investment premature.
17. Key Words
Paratransit, automatic vehicle location, AVL, global positioning systems, GPS, mobile data terminal, MDT, mobile data computer, MDC, vehicle security camera, passengers per hour, productivity, on-time performance, no-shows
18. Distribution Statement
No Restrictions
19. Security Classif. (of this report)
Unclassified
20. Security Classif. (of this page)
Unclassified
21. No. of Pages
101
22. Price
iv
Acknowledgments
The research team recognizes and appreciates the contribution of Rosemary Gerty, General Manager, Regional Accessibility at the Regional Transportation Authority, Greater Chicago Area. Thanks are expressed to Boyd Thompson, Director of Operations at Ride Solution, Putnam
County, Florida, and Lisa C. Love, former Director of Transportation Services, St. Johns County Council on Aging, Inc.
The research team is appreciative of the responsiveness of the Florida Community Transportation Coordinators and the staffs of transit agencies that participated in the online
survey conducted as part of this project. The team also thanks the following staff members who discussed their agency’s experiences with deployed technologies during site visit
interviews and who provided the opportunity to take the photographs shared in this report.
Pasco County Public Transportation:
Mike Carroll, Public Transportation Director
Joseph L. DeGeorge, Operations Manager
Collier Area Transit: Yousi Cardeso, Operations Coordinator
Omar Deleon, Planning Manager/Revenue
Omar Lopez, Paratransit Manager
Liberty County Transit: Monica Welles, Program Coordinator
Levy County Transit: Connie Conley, Director
Lake County Public Transportation: Amy Bradford, Transportation Representative,
Community Services Department
Senior Resource Association: Karen B. Rose Deigl, CEO/President
Chris Stephenson, Operations Manager
Mary Pierce, Paratransit Supervisor
Jennifer Johnson, Chief Financial Officer
Ashley Bennete, Dispatcher
Council on Aging of St. Lucie, Inc.: Marianne Arbore, Transit Director, VP/CTO
Bruce Walker, Software System Analyst
The NCTR Research Team
Principal Investigator: Nevine Labib Georggi, Senior Research
Associate, CUTR
Co-Principal Investigator:
Reviewers:
Joel Volinski, Director, NCTR
Jay Goodwill, Senior Research Associate, CUTR
Phil Winters, Director, TDM Program, CUTR
Graduate Research Assistant:
Casey Jarrell, Engineer I, HNTB Corporation
v
Executive Summary
Research Overview
Individuals who are considered “transportation disadvantaged” may include people who are
older, have disabilities, or are low-income. A survey of transit agencies by the U. S.
Government Accountability Office (GAO) found that demand for paratransit trips increased 7% from 2007 to 2010. About 73% of agencies surveyed experienced an increase of
approximately 12% in the number of individuals registered to use Americans with Disabilities Act (ADA) paratransit service1.
The pressure to provide adequate transit service for people who are transportation disadvantaged while containing costs is and will continue to be a balancing act as long as
demand continues to increase. All aspects of the cost-effectiveness of operations are constantly being studied to find case examples that would help provide quality service even with funding
limitations. Providing efficient transit service to the transportation disadvantaged and to persons with disabilities is a goal of the Federal Transit Administration (FTA), the Florida
Department of Transportation (FDOT), and the Florida Commission for the Transportation
Disadvantaged (CTD).
This study defines paratransit services as complimentary ADA services and door-to-door services, including those provided by the CTD’s Community Transportation Coordinators
(CTCs). In Florida, the number of passenger trips provided in 2014 by Florida CTCs was 29,243,177, which is projected to grow annually as the general and older adult populations
continue the growth pattern currently observed.
This research study investigated the impacts of applying various technologies to paratransit systems. Based on a survey of Florida agencies and interviews with several of them during site visits, lessons learned are presented to help agencies apply effective practices that have been
successful in solving challenges with the application of new innovative technologies that are available to the industry. The report also provides data from survey responses that indicate
reasons that prompted the application of these technologies, the costs of the technologies
deployed, and the funding sources that were used for the purchases. In addition, the report sheds light on the ability of the studied technologies to increase system performance.
Survey Findings
The scarcity of information sources that address the impacts of new technologies on the
performance measures in the paratransit field became clear during the literature review phase of this study. Although some publications document the impacts on transit in general, the
nature of paratransit operations is different from fixed-route transit. Operators of paratransit
vehicles get a daily manifest that lists the stops they will make that day, including riders’ names, addresses, and drop-off locations, whereas transit operators have fixed schedules and
static stops. This research study addressed the gap by conducting an online survey of all Florida CTCs in February 2015 and in-person interviews with seven of the agencies that cited
significant impacts in the survey. The mailing list of all Florida CTCs was obtained from the Florida CTD and 78 percent responded to the survey. Survey questions are included in
Appendix A of this report.
1 “Demand has increased, but little is known about compliance,” GAO-13-17, Nov. 15, 2012. Accessed June 23,
2015, at http://gao.gov/assets/660/650079.pdf
vi
Based on the information found in the literature review, the following technologies were the
focus of this research. The survey indicated the following percentages of responding Florida CTCs using these technologies:
Reservation, scheduling, and dispatching software (100%)
Mobile data computer (MDC) or mobile data terminal (MDT) (74%)
Automatic vehicle location (AVL) (71%)
Global positioning system (GPS) (69%)
Vehicle security cameras (66%)
Advanced telephone systems (63%)
Also based on the literature review, the following performance measures were selected as the major elements for evaluating the technologies listed above:
System productivity (passengers served per revenue hour)
On-time performance
Reduction of no-shows
Driver performance and satisfaction
Customer satisfaction
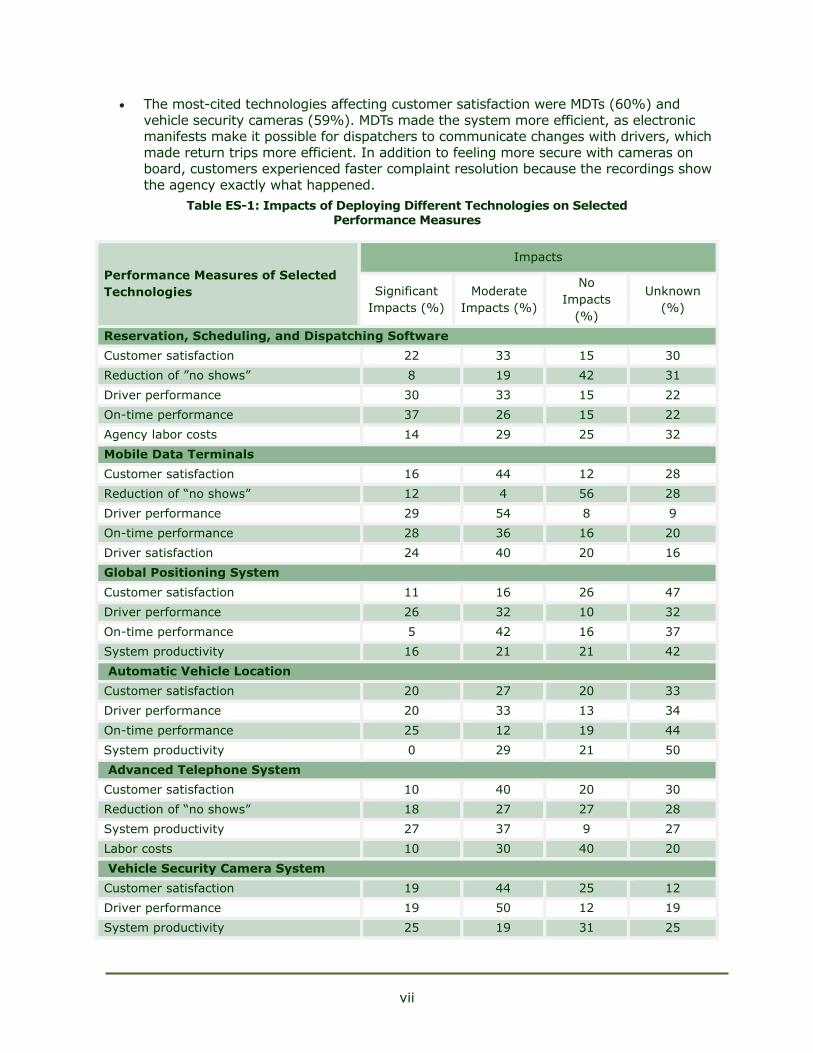
Table ES-1 presents an overview of the findings of the survey in which participants were asked how each technology affected the performance of their system.
To put some of the statistics of Table ES-1 in perspective, two items of interest must be kept in
mind. First, several of these technologies were implemented in late 2014 or early 2015, and the CTCs remarked that it was too early to assess any impacts. For example, the majority of
the respondents (83%) updated their reservation, scheduling, and dispatching software in late 2014 or early 2015. Second, several agencies had recently deployed the Samsung tablet as
their MDT/AVL/GPS all-in-one unit; separating the impacts of one unit that functions as three is not easily expressed. Six of the seven agencies interviewed during site visits were using a
tablet as their MDT unit.
Notable from Table ES-1 are the following:
On-time performance was most impacted by deploying MDTs (64%), and by use of reservation, scheduling, and dispatching software (63%). These two technologies work
in sync to track important times such as arrival and departure from the origin and drop-off at destination. Knowledge of these times is beneficial in generating reports and
pointing to the need for improvements or training.
Deploying MDTs scored the highest in moderate-to-significant improvements on driver
performance, with 83% percent of the agencies recognizing that improvement. The
improved driver performance was tied to the use of tablets, which were easier read than previous MDTs that had smaller screens. Also, an electronic manifest replacing a
paper manifest was an added time-saver for drivers as paperwork was reduced.
The second most cited improvement in driver performance was realized from deploying
vehicle security cameras (69%). Some agencies expressed that the drivers initially were uncomfortable with being video- and audio-recorded but soon realized that
cameras protected them in case of an incident or false complaint. Drivers generally forgot they were being recorded all the time.
vii
The most-cited technologies affecting customer satisfaction were MDTs (60%) and
vehicle security cameras (59%). MDTs made the system more efficient, as electronic manifests make it possible for dispatchers to communicate changes with drivers, which
made return trips more efficient. In addition to feeling more secure with cameras on board, customers experienced faster complaint resolution because the recordings show
the agency exactly what happened.
Table ES-1: Impacts of Deploying Different Technologies on Selected Performance Measures
Performance Measures of Selected
Technologies
Impacts
Significant
Impacts (%)
Moderate
Impacts (%)
No
Impacts
(%)
Unknown
(%)
Reservation, Scheduling, and Dispatching Software
Customer satisfaction 22 33 15 30
Reduction of ”no shows” 8 19 42 31
Driver performance 30 33 15 22
On-time performance 37 26 15 22
Agency labor costs 14 29 25 32
Mobile Data Terminals
Customer satisfaction 16 44 12 28
Reduction of “no shows” 12 4 56 28
Driver performance 29 54 8 9
On-time performance 28 36 16 20
Driver satisfaction 24 40 20 16
Global Positioning System
Customer satisfaction 11 16 26 47
Driver performance 26 32 10 32
On-time performance 5 42 16 37
System productivity 16 21 21 42
1049BAutomatic Vehicle Location
1050BCustomer satisfaction 1051B20 1052B27 1053B20 1054B33
1055BDriver performance 1056B20 1057B33 1058B13 1059B34
1060BOn-time performance 1061B25 1062B12 1063B19 1064B44
1065BSystem productivity 1066B0 1067B29 1068B21 1069B50
1070BAdvanced Telephone System
1071BCustomer satisfaction 1072B10 1073B40 1074B20 1075B30
1076BReduction of “no shows” 1077B18 1078B27 1079B27 1080B28
1081BSystem productivity 1082B27 1083B37 1084B9 1085B27
1086BLabor costs 1087B10 1088B30 1089B40 1090B20
1091BVehicle Security Camera System
1092BCustomer satisfaction 1093B19 1094B44 1095B25 1096B12
1097BDriver performance 1098B19 1099B50 1100B12 1101B19
1102BSystem productivity 1103B25 1104B19 1105B31 1106B25
viii
365BTo get a thorough understanding of how new technologies are helping Florida CTCs meet the
challenges of providing the necessary services as well as working within their means, the research team asked them to identify the impacts of new technologies. CTC staff knows the
challenges well, as trips have to be completed with no delays and customers have to be satisfied.
Lessons Learned
366BTo document case examples and lessons learned, seven Florida CTCs were selected for site
visits, during which in-person interviews were conducted. The methodology used to select
agencies was based on distilling the survey responses from all the agencies and identifying those that experienced moderate and/or significant impacts when deploying each technology.
The research team selected agencies with a minimum of three moderate-to-significant impacts on performance measures to justify the site visit. The systems visited are the following, listed
in the order of the site visits conducted:
569BPasco County Public Transportation
570BCollier Area Transit
571BLiberty County Transit
572BLevy County Transit
573BLake County Public Transportation
574BSenior Resource Association, Indian River County
575BCouncil on Aging of St. Lucie County, Inc.
Lessons Learned for Vendor Selection
576BVendors should be able to provide references, and agencies should take the time to interview these references. Building upon the research presented in this report, peer agencies should be asked about their experiences with vendor technical support,
training, and availability via phone or in person and their timely responsiveness to issues/challenges that come up during transition from old to new system, updates, and
customer service beyond the transition. A vendor’s timely response to peer agencies is
a good indication of its availability.
577BHands-on training provided by the vendor is key to the success of transitioning to new
systems. Agencies should make sure many opportunities are provided for training of staff and operators. In addition, agencies should set up train-the-trainer sessions so
staff are confident in training new operators on the system even after transitioning is completed. Agencies can make sure that the contract includes training and/or online
educational sessions for their staff.
Lessons Learned for System Selection
578BBefore specifications of a new system are decided upon, agencies should seek the input of all agency staff involved in the paratransit operation. Upper management may know in general what all staff jobs entail but may not be as familiar with the intricate data
needs required for performing day-to-day tasks, particularly report generation.
579BEach agency should recognize the unique features of its system, including their specific needs. Since software is usually standardized, it is recommended that agencies make
sure to convey their specific needs during the planning process before the procurement package is developed. Data fields that have been used for years in old software may
not correspond to the new software, so adjustments or customizations may be needed.
ix
Agencies are better off making this customization up front than trying to retrofit the
software during the transion or post deployment.
Lessons Learned for Transitioning to the New Technologies
580BNew and old systems should run in parallel for at least a month until all “glitches” are
worked out. Even if it means the agency will be paying two vendors simultaneously, it is well worth the cost so as not to fall behind in reporting and billing of trips.
581BSome resistance to new technology should be expected from staff and operators. With training, attitudes towards change will be more positive once benefits are realized and
trust is built.
Other Tips
582BInvesting in a vehicle security camera system was cited by several agencies as providing the “best bang for the buck.” The benefits of video cameras included protection of drivers and passengers, incident management, risk reduction, conflict
mitigation, and eliminating unfounded liability payouts.
583BSome agencies pull videos for random inspection to make sure operators properly
follow all procedures. This policy could reduce the tasks of field inspectors.
584BIn case of Internet or cellular communications failure, agencies must have a backup plan such as paper manifests, two-way radio communications, and cell phone access to
the software system, etc.
585BThe deployments have shown that the technologies are helping in increasing overall
system efficiency. The effectiveness of these technologies may take time to be realized in full, but money will be saved in the long run from efficiency and performance
improvements. Patience is key.
x
Tables of Contents 1685BDisclaimer ................................................................................................................................... ii 1686BTechnical Report Documentation Page ........................................................................................... iii 1687BAcknowledgments ........................................................................................................................... iv 1688BExecutive Summary ......................................................................................................................... v
1698BResearch Overview ...................................................................................................................... v 1699BSurvey Findings ........................................................................................................................... v 1700BLessons Learned ...................................................................................................................... viii
1732BLessons Learned for Vendor Selection ...................................................................................... viii 1733BLessons Learned for System Selection ..................................................................................... viii 1734BLessons Learned for Transitioning to the New Technologies .......................................................... ix 1735BOther Tips ............................................................................................................................. ix
1689BList of Figures ................................................................................................................................ xiii 1690BList of Tables .................................................................................................................................. xv 1691BChapter 1 - Introduction .............................................................................................................. 1
1701BResearch Overview ...................................................................................................................... 1 1702BResearch Study Objectives ............................................................................................................ 3 1703BResearch Methodology .................................................................................................................. 3 1704BReport Organization ..................................................................................................................... 3
1692BChapter 2 - Literature Review ...................................................................................................... 4 1705BReservation, Scheduling, and Dispatching Software.......................................................................... 4 1706BMobile Data Terminal (MDT) .......................................................................................................... 5 1707BGlobal Positioning System (GPS) .................................................................................................... 5 1708BAutomatic Vehicle Location (AVL) ................................................................................................... 6 1709BAdvanced Telephone Systems ....................................................................................................... 6 1710BVehicle Security Cameras .............................................................................................................. 7 1711BCustomer Information and Service ................................................................................................. 7 1712BCombining Technologies ............................................................................................................... 8 1713BNotes on Sources Reviewed .......................................................................................................... 8
1693BChapter 3 - Survey Results ......................................................................................................... 10 1714BGeneral Information on Participating Agencies ............................................................................... 10
1736BOverview of Technology Types Used by Agencies ....................................................................... 10 1737BFunding Sources of Paratransit Services Provided by Agencies Surveyed ...................................... 11
1715BReservation, Scheduling, and Dispatching Software........................................................................ 13 1738BImpacts of Using Reservation, Scheduling, and Dispatching Software on Decreasing “No-Shows” .... 13 1739BImpacts of Using Reservation, Scheduling, and Dispatching Software on Reducing Labor Costs ....... 15 1740BImpacts of Using Reservation, Scheduling, and Dispatching Software on Improving Customer
Satisfaction .......................................................................................................................... 16 1741BImpacts of Using Reservation, Scheduling, and Dispatching Software on On-Time Performance ...... 17 1742BImpacts of Using Reservation, Scheduling, and Dispatching Software on Driver Performance .......... 18
1716BMobile Data Terminals ................................................................................................................ 19 1743BImpacts of MDT Deployment on On-Time Performance ............................................................... 20 1744BImpacts of MDT Deployment on the Reduction of “No-Shows” .................................................... 21 1745BImpacts of MDT Deployment on Customer Satisfaction .............................................................. 22 1746BImpacts of MDT Deployment on Driver Performance .................................................................. 23 1747BImpacts of MDT Deployment on Driver Satisfaction ................................................................... 24
1717BGlobal Positioning System ........................................................................................................... 25 1748BImpacts of GPS Deployment on On-Time Performance ............................................................... 26 1749BImpacts of GPS Deployment on System Productivity .................................................................. 27 1750BImpacts of GPS Deployment on Driver Performance .................................................................. 28 1751BImpacts of GPS Deployment on Customer Satisfaction ............................................................... 29
1718BAutomatic Vehicle Location .......................................................................................................... 30 1752BImpacts of AVL Deployment on On-Time Performance ............................................................... 31
xi
1753BImpacts of AVL Deployment on System Productivity .................................................................. 32 1754BImpacts of AVL Deployment on Customer Satisfaction ............................................................... 33 1755BImpacts of AVL Deployment on Driver Performance ................................................................... 34
1719BAdvanced Telephone Systems ..................................................................................................... 35 1756BImpacts of Using Advanced Telephone System on Productivity .................................................... 36 1757BImpacts of Using Advanced Telephone System on the Reduction of “No-Shows” ............................ 37 1758BImpacts of Using Advanced Telephone System on Customer Satisfaction...................................... 38 1759BImpacts of Using Advanced Telephone System on Labor Costs .................................................... 39
1720BAdvanced Telephone Systems with IVR ........................................................................................ 40 1721BVehicle Security Camera Systems ................................................................................................ 41
1760BImpacts of Using Vehicle Security Camera Systems on Productivity or Performance ....................... 42 1761BImpacts of Using Vehicle Security Camera Systems on Customer Satisfaction ............................... 43 1762BImpacts of Using Vehicle Security Camera Systems on Driver Performance .................................. 44
1694BChapter 4 - Case Examples and Lessons Learned ...................................................................... 45 1722BAgencies Selected for Site Visits................................................................................................... 45 1723BPasco County Public Transportation .............................................................................................. 47
1763BSystem Information ............................................................................................................... 47 1764BDescription of Technology, Costs, and Funding Sources .............................................................. 47 1765BAgency-Specific Practices ....................................................................................................... 48 1766BTechnology Benefits as Experienced by the Agency .................................................................... 48 1767BLessons Learned and Tips for Other Agencies ........................................................................... 48
1724BCollier Area Transit ..................................................................................................................... 50 1768BSystem Information ............................................................................................................... 50 1769BDescription of Technology, Costs, and Funding Sources .............................................................. 50 1770BAgency-Specific Practices ....................................................................................................... 51 1771BTechnology Benefits as Experienced by the Agency .................................................................... 53 1772BLessons Learned and Tips for Other Agencies ........................................................................... 54
1725BLiberty County Transit ................................................................................................................ 55 1773BSystem Information ............................................................................................................... 55 1774BDescription of Technology, Costs, and Funding Sources .............................................................. 55 1775BAgency-Specific Practices ....................................................................................................... 56 1776BTechnology Benefits as Experienced by the Agency .................................................................... 57 1777BLessons Learned and Tips for Other Agencies ........................................................................... 58
1726BLevy County Transit ................................................................................................................... 59 1778BSystem Information ............................................................................................................... 59 1779BDescription of Technology, Costs, and Funding Sources .............................................................. 59 1780BAgency-Specific Practices ....................................................................................................... 60 1781BTechnology Benefits as Experienced by the Agency .................................................................... 61 1782BLessons Learned and Tips for Other Agencies ........................................................................... 61
1727BLake County Public Transportation ............................................................................................... 62 1783BSystem Information ............................................................................................................... 62 1784BDescription of Technology, Costs, and Funding Sources .............................................................. 62 1785BAgency-Specific Practices ....................................................................................................... 63 1786BTechnology Benefits Experienced by the Agency ........................................................................ 63 1787BLessons Learned and Tips for Other Agencies ........................................................................... 63
1728BSenior Resource Association, Indian River County .......................................................................... 64 1788BSystem Information ............................................................................................................... 64 1789BDescription of Technology, Costs, and Funding Sources .............................................................. 64 1790BAgency-Specific Practices ....................................................................................................... 65 1791BTechnology Benefits as Experienced by the Agency .................................................................... 65 1792BLessons Learned and Tips for Other Agencies ........................................................................... 65
1729BCouncil on Aging of St. Lucie, Inc. ................................................................................................ 67 1793BSystem Information ............................................................................................................... 67 1794BDescription of Technology, Costs, and Funding Sources .............................................................. 67 1795BAgency-Specific Practices ....................................................................................................... 68 1796BTechnology Benefits as Experienced by the Agency .................................................................... 71
xii
1797BLessons Learned and Tips for Other Agencies ........................................................................... 72
1695BChapter 5 - Conclusions and Recommendations ........................................................................ 73 1730BSurvey Findings ......................................................................................................................... 73 1731BLessons Learned ...................................................................................................................... 75
1798BLessons Learned for Vendor Selection ...................................................................................... 75 1799BLessons Learned for System Selection ..................................................................................... 75 1800BLessons Learned for Transitioning to New Technologies .............................................................. 75 1801BOther Tips ............................................................................................................................ 76
1696BReferences ................................................................................................................................. 77 1697BAppendix A – Survey Instrument .................................................................................................. 79
xiii
List of Figures 887BFigure 1-1: Overview of General Concept of Paratransit Process and Potential
Technologies Deployed ............................................................................................... 2 888BFigure 2-1: Tablet Serving as an MDT/AVL/GPS Unit Exchanges Real-Time Data with
Dispatcher using the Reservation, Scheduling, and Dispatching Software ......................... 8 889BFigure 3-1: Technologies Used by Florida CTCs ................................................................................ 10 890BFigure 3-2: Funding Sources of Services Provided by Agencies Surveyed ............................................ 11 891BFigure 3-3: Methods of Reservations Used by Responding Agencies ................................................... 12 892BFigure 3-4: Reservation, Scheduling, and Dispatching Software Package Selection
Considerations ........................................................................................................ 13 893BFigure 3-5: Impacts of Using Reservation, Scheduling, and Dispatching Software on “No-
Shows” .................................................................................................................. 14 894BFigure 3-6: Impacts of Using Reservation, Scheduling, and Dispatching Software on
Reducing Labor Costs .............................................................................................. 15 895BFigure 3-7: Impacts of Using Reservation, Scheduling, and Dispatching Software on
Customer Satisfaction .............................................................................................. 16 896BFigure 3-8: Impacts of Reservation, Scheduling, and Dispatching Software on On-Time
Performance ........................................................................................................... 17 897BFigure 3-9: Impacts of Using Reservation, Scheduling, and Dispatching Software on
Driver Performance ................................................................................................. 18 898BFigure 3-10: Impacts of MDT Deployment on On-Time Performance................................................... 20 899BFigure 3-11: Impacts of MDT Deployment on “No-Shows” ................................................................ 21 900BFigure 3-12: Impacts of MDT Deployment on Customer Satisfaction .................................................. 22 901BFigure 3-13: Impacts of MDT Deployment on Driver Performance ...................................................... 23 902BFigure 3-14: Impacts of MDT Deployment on Driver Satisfaction ....................................................... 24 903BFigure 3-15: GPS Package Selection Considerations ......................................................................... 25 904BFigure 3-16: Impacts of GPS Deployment on On-Time Performance ................................................... 26 905BFigure 3-17: Impacts of GPS Deployment on System Productivity ...................................................... 27 906BFigure 3-18: Impacts of GPS Deployment on Driver Performance ...................................................... 28 907BFigure 3-19: Impacts of GPS Deployment on Customer Satisfaction ................................................... 29 908BFigure 3-20: AVL Package Selection Considerations .......................................................................... 30 909BFigure 3-21: Impacts of AVL Deployment on On-Time Performance ................................................... 31 910BFigure 3-22: Impacts of AVL Deployment on System Productivity ...................................................... 32 911BFigure 3-23: Impacts of AVL Deployment on Customer Satisfaction ................................................... 33 912BFigure 3-24: Impacts of AVL Deployment on Driver Performance ....................................................... 34 913BFigure 3-25: Advanced Telephone System Package Selection Considerations ....................................... 35 914BFigure 3-26: Impacts of Using Advanced Telephone System on Productivity ........................................ 36 915BFigure 3-27: Impacts of Using Advanced Telephone System on Reduction of “No-Shows” ..................... 37 916BFigure 3-28: Impacts of Using Advanced Telephone System on Customer Satisfaction ......................... 38 917BFigure 3-29: Impacts of Using Advanced Telephone System on Labor Costs ........................................ 39 918BFigure 3-30: Vehicle Security Camera Package Selection Consideration .............................................. 41 919BFigure 3-31: Impacts of using Vehicle Security Camera Systems on Productivity or
Performance ........................................................................................................... 42 920BFigure 3-32: Impacts of Using Vehicle Security Camera Systems on Customer Satisfaction ................... 43 921BFigure 3-33: Impacts of Using Vehicle Security Camera Systems on Driver Performance ...................... 44 922BFigure 4-1: MDT (AVAIL Vector 9000) Mounted on Front of Dashboard on Collier Area
Transit Vehicles ....................................................................................................... 51 923BFigure 4-2: Electronic Vehicle Inspection System ............................................................................. 52 924BFigure 4-3: Vehicle Security Camera System on Collier Area Transit Fleet Vehicle ................................. 52 925BFigure 4-4: New M-Slate MDT from AVAIL on a Collier Area Transit Fleet Vehicle .................................. 53 926BFigure 4-5: Tablets in Liberty County Transit Assigned to Drivers, Not Vehicles .................................... 56 927BFigure 4-6: Scheduling and Dispatching Staff Can View Real-Time Locations and Speeds
of Their Fleet Vehicles .............................................................................................. 57
xiv
928BFigure 4-7: Big Screen Displaying Locations of Fleet Vehicles in Real-Time for At-a-Glance Tracking by Schedulers and Dispatchers in Same Office at Levy County Transit ................................................................................................................... 60
929BFigure 4-8: Fixed-Route and Demand Response Vehicle Locations and Speeds Monitored by Dispatcher ......................................................................................................... 68
930BFigure 4-9: Electronic Manifest Displayed on Tablet on Council on Aging of St. Lucie Fleet Vehicle ................................................................................................................... 68
931BFigure 4-10: New MDT Tablet Mounted on Stand Secured to Floor of Vehicle and Old MDT Ranger Unit Mounted on the Dashboard ..................................................................... 69
932BFigure 4-11: V-TRACK AVL System Unit and Screen Output Displaying Location of Vehicles in System .................................................................................................. 70
933BFigure 4-12: Council on Aging of St. Lucie, Inc., hosts RouteMatch and V-TRACK AVL on its SQL Server ........................................................................................................ 70
934BFigure 4-13: Vehicle Security Cameras Mounted Facing Wheelchair Lift .............................................. 71 935BFigure 4-14: Security Camera Mounted on Outside of Transit Vehicle at Council on Aging
of St. Lucie, Inc. ..................................................................................................... 71
xv
List of Tables
936BTable ES-1: Impacts of Deploying Different Technologies on Selected Performance Measures ............................................................................................................... vii
937BTable 4-1: Agencies Selected for Further Documentation of Impacts .................................................. 46 938BTable 4-2: 2014 Pasco County Public Transportation Information as Reported to Florida
CTD ....................................................................................................................... 47 939BTable 4-3: 2014 Collier Area Transit Information as Reported to Florida CTD ....................................... 50 940BTable 4-4: 2014 Liberty County Transit Information as Reported to Florida CTD ................................... 55 941BTable 4-5: 2014 Levy County Transit Information as Reported to Florida CTD ...................................... 59 942BTable 4-6: 2014 Lake County Public Transportation Information as Reported to Florida
CTD ....................................................................................................................... 62 943BTable 4-7: 2014 Senior Resource Association, Indian River County, Information as
Reported to Florida CTD ........................................................................................... 64 944BTable 4-8: 2014 Council on Aging of St. Lucie, Inc., Information as Reported to Florida
CTD ....................................................................................................................... 67 945BTable 5-1: Impacts of Deploying Different Technologies on Selected Performance
Measures ............................................................................................................... 74
1
Chapter 1 - Introduction
Research Overview
367BThe pressure on transit agencies to provide effective services, although challenging, provides
opportunities for creative and innovative solutions to meet growing demand even when
resources are not increasing at the same pace [1]. Providing efficient transit service to the transportation disadvantaged and to persons with disabilities is a goal of the Federal Transit
Administration (FTA), the Florida Department of Transportation (FDOT), and the Florida Commission for the Transportation Disadvantaged (CTD). This research study investigated the
impacts of applying various technologies to paratransit systems. Based on a survey of Florida agencies and interviews with several of them during site visits, lessons learned are presented
to help agencies apply effective practices that have been successful in solving challenges with
the application of new technologies that are available to the industry. The report also provides data from survey responses that indicate the reasons that prompted the application of these
technologies, the costs of the technologies deployed, and the funding sources that were used for the purchases. In addition, the report sheds light on the ability of the studied technologies
to increase system performance.
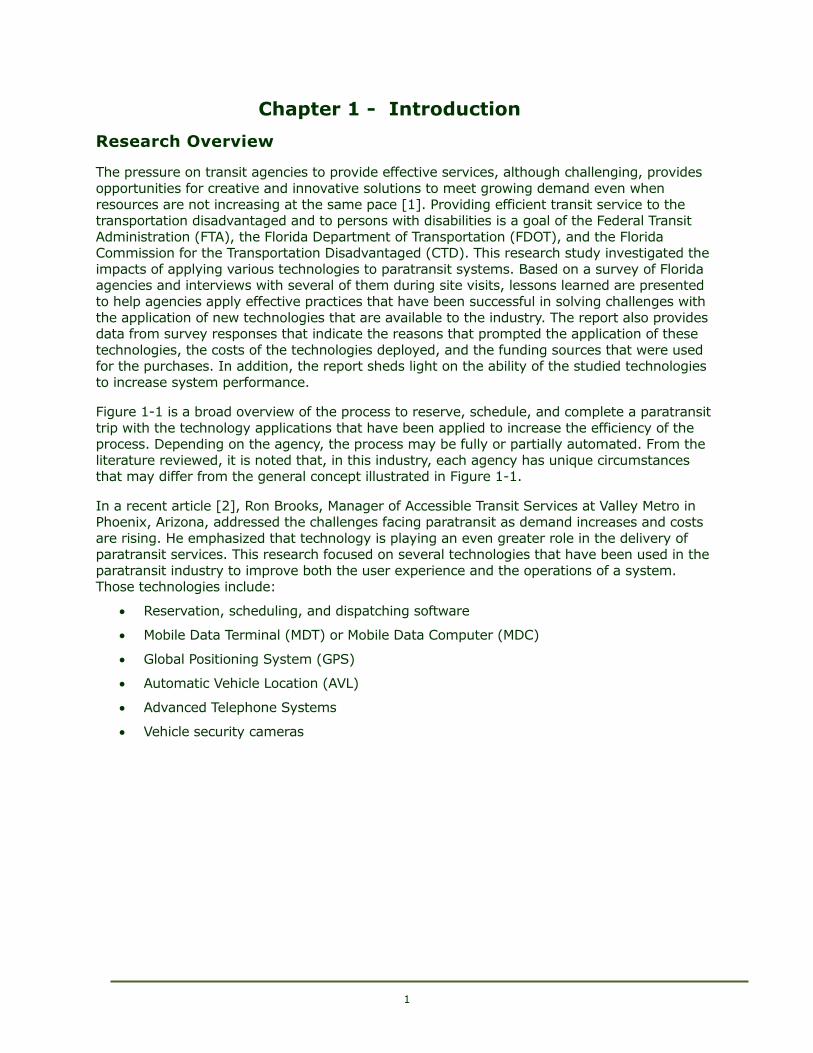
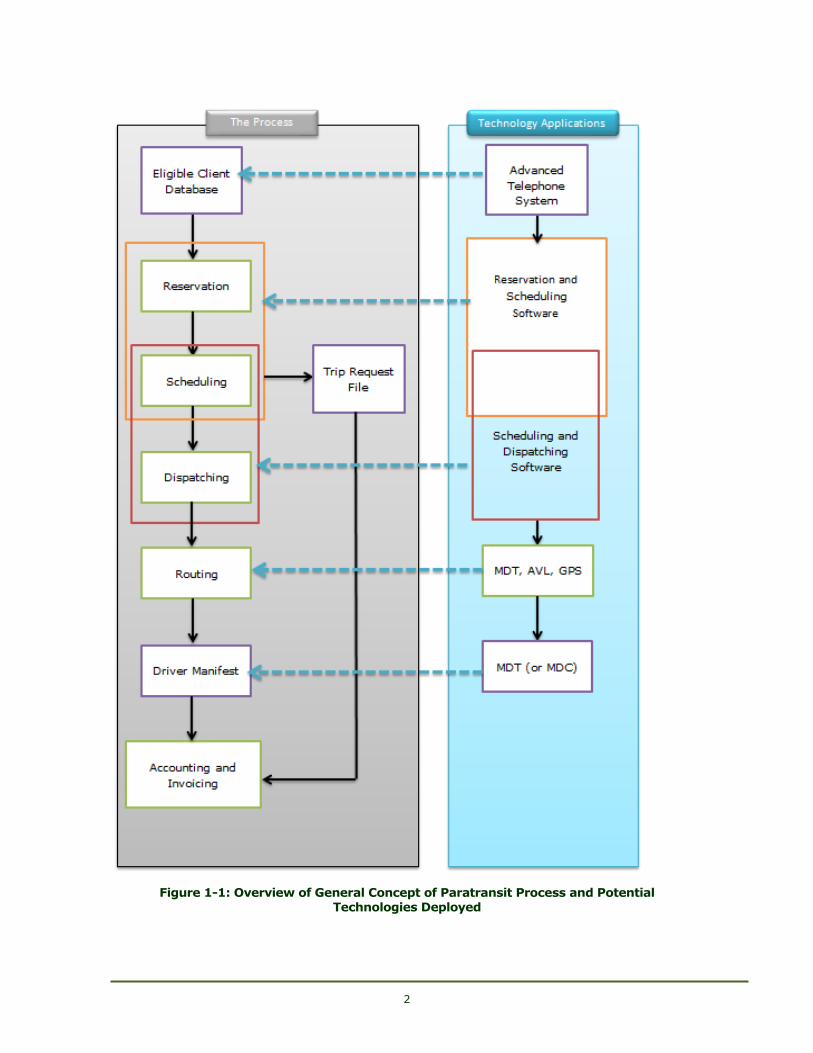
368BFigure 1-1 is a broad overview of the process to reserve, schedule, and complete a paratransit
trip with the technology applications that have been applied to increase the efficiency of the process. Depending on the agency, the process may be fully or partially automated. From the
literature reviewed, it is noted that, in this industry, each agency has unique circumstances that may differ from the general concept illustrated in Figure 1-1.
369BIn a recent article [2], Ron Brooks, Manager of Accessible Transit Services at Valley Metro in Phoenix, Arizona, addressed the challenges facing paratransit as demand increases and costs
are rising. He emphasized that technology is playing an even greater role in the delivery of paratransit services. This research focused on several technologies that have been used in the
paratransit industry to improve both the user experience and the operations of a system. Those technologies include:
586BReservation, scheduling, and dispatching software
587BMobile Data Terminal (MDT) or Mobile Data Computer (MDC)
588BGlobal Positioning System (GPS)
589BAutomatic Vehicle Location (AVL)
590BAdvanced Telephone Systems
591BVehicle security cameras
2
832B
685BFigure 1-1: Overview of General Concept of Paratransit Process and Potential Technologies Deployed
3
Research Study Objectives
370BThe objective of this study was to gather and disseminate information on case examples in the
application of technology in the paratransit field. The research purposes were to inform the
industry of the state of the practice and to initiate an exchange among providers in Florida on successful practices.
Research Methodology
371BAn online survey of all Florida Community Transportation Coordinators (CTCs) was conducted
in February 2015. Based on the survey responses, seven paratransit providers representing
rural, urban, and small- and medium-size agencies were selected for site visits, at which in-depth interviews were conducted. The selection of these agencies was based on the reporting
of significant impacts on performance measures due to deployment of the various technologies. Based on information from the selected agencies, lessons learned and tips for
future deployments are presented in this report.
372BThe following performance measures were the focus of the questions presented to Florida CTCs and staff of systems interviewed during site visits:
592BSystem productivity (passengers served per revenue hour)
593BOn-time performance
594BReduction of no-shows
595BDriver performance and satisfaction
596BCustomer satisfaction
Report Organization
373BChapter 2 presents a summary of the literature review conducted under Task 1 of the project.
374BChapter 3 includes the survey findings and documents the results of the in-depth interviews conducted during site visits to the seven Florida agencies. It also presents the justification and
methodology for selecting these agencies. The questionnaire used as the online survey instrument is included in Appendix A.
375BChapter 4 provides the findings of this study and offers practical recommendations based on lessons learned.
376BChapter 5 presents conclusions and recommendations.
4
Chapter 2 - Literature Review
377BThe following sections focus on several technologies that have been used in the paratransit industry to improve both the user experience and the operational efficiency of paratransit
systems. Based on sources reviewed, the technologies selected as the focus of the project are discussed separately in the next sections.
Reservation, Scheduling, and Dispatching Software
378BParatransit software packages are capable of managing databases of eligible passengers,
determining eligibility, scheduling trips, developing trip manifests, monitoring past trips, and
producing invoices. In 2008, 94% of Florida transit agencies used reservation, scheduling, and dispatching software for their paratransit system [3].
379BParatransit services can offer different types of reservations. Same-day service can accommodate requests made the same day, depending on availability. Immediate service has obvious advantages for paratransit users; however, these trips can be difficult operationally for
a variety of reasons. Advance service is prescheduled to arrive a day or more after the
reservation is originally made. Subscription reservations are a form of advance reservations for trips that occur on a regular basis, usually for work trips or recurring medicals trips such as
dialysis treatment. Most trip reservations are made the previous day or up to two weeks in advance, depending on system policies.
380BThere are four levels of Computer Aided Dispatch (CAD) software:
1. 381BGeneric software, which includes word processing, data management, and spreadsheets.
2. 382BCustomized generic software, which can meet specific needs of the agency.
3. 383BSemi-automated CAD software used for zone-to-zone transit operations.
4. 384BFully-automated CAD software, which has greater Advanced Public Transportation System (APTS) compatibilities and full Geographic Information System (GIS)
compatibility [4].
385BGeneric software generally costs $100–$500. Specialty software can be used for tasks that are more specific. Trip order-taking software, which is offered by many vendors, generally costs less than $1,000. However, if scheduling software is necessary for a paratransit service, order-
taking capability is included within that software.
386BCustomized database applications cost $1,000-$10,000 and are recommended for agencies
that have 10–30 vehicles in their fleet. Semi-automated CAD software is a commercial product that costs $1,000–$25,000. Fully-automated CAD software can cost $4,000–$1 million,
depending on the size of the fleet plus any training and maintenance expenses and customization [4].
387BAccording to a 2013 annual survey conducted by Metro Magazine concerning productivity, agencies that bill per hour averaged 2.34 passengers, and those that bill per trip averaged
2.15 passengers [5]. Although contracting issues are factors in this context, these figures are presented here as reported averages of productivity.
388BVarious software providers have stated that agencies that effectively use computerized routing and scheduling software have shown 10–20% productivity improvements as a result of
5
reduced mileage per trip and more efficient allocation of service hours [6]. For example, the
Toledo Area Regional Transit Authority in Ohio saw significant changes after the installation of routing/scheduling software in its paratransit system. The agency reported that the number of
passengers per hour increased by 25%, which enabled the paratransit service to grow by nearly 25% without an increase in its budget [7, p. 52].
Mobile Data Terminal (MDT)
389BMDCs or MDTs and the more recent Mobile Data Tablets act as a form of communication
between the operator of a paratransit vehicle and the paratransit provider’s central dispatch
location; usually, they are paired with AVL technology. MDTs are capable of sending vehicle location, passenger count, engine performance, and mileage to these central dispatch
locations. MDTs allow operators to send and receive messages, prompt alarms, and monitor their adherence to schedules [8]. With MDTs, operators are able to record pick-up and drop-off
times and locations, store time and mileage logs, and allow for automated record keeping with minimal effort. The dispatcher (located at the central location) is better able to create, delete,
and reassign trips when MDT technology is available alongside AVL technology. The editing of
these trips can be in response to traffic, cancellations, or other incidents [3]. MDTs are capable of having “no-shows” entered into them. In case of an Americans with Disabilities (ADA) trip,
after contact is established with a rider, the dispatcher can cancel the return trip if it is not needed, allowing for better use of vehicle hours [9].
390BThe cost of an MDT that would be appropriate for a paratransit vehicle typically runs between $1,000 and $4,000 per unit, including hardware and software. Cost savings due to MDT
installation comes from the elimination of manually re-writing and re-entering trip data since MDTs remove the need for paperwork related to the trip manifest process. With an electronic
manifest on their MDT, vehicle operators can save up to 30 minutes per day by not having to manually enter information into paper manifests, thus allowing the provision of more trips per
day. Also, the electronic transfer of data from the MDT unit to the central database results in a significant decrease in the need for a data entry clerk. The implementation of MDTs alone
would save Miami-Dade Transit $125,000 annually [10]. Accessible Services in Seattle (Washington) experienced a 7% increase in productivity after the installation of MDTs, which
resulted in a cost savings that paid for the entire cost of the system within three years [9].
391BVIA, the public transportation agency in San Antonio (Texas) installed MDTs in its paratransit vehicles and estimated that, after installation, two-way radio communication was reduced by up to 80%; allowing dispatchers to be more productive. VIA showed a productivity increase
from 1.1 to 2.3 passengers per hour after installation. Because the frequency of radio use was significantly reduced, the number of VIA radio dispatchers could be reduced or reassigned to
different positions, and the number of vehicles that one dispatcher could monitor increased to
35 vehicles, which was not feasible before the new MDTs were deployed. Similar productivity increases were reported in Philadelphia by WHEELS, a paratransit provider, which saw
dispatchers increase the number of vehicles they were able to monitor from 25 to 45 vehicles [9].
Global Positioning System (GPS)
392BGPS is often used for the purpose of getting route directions and finding the shortest path to a
destination. GPS devices navigate using satellites while devices broadcast signals that provide
their location, status, and time based on onboard vehicle clocks. A GPS device will receive radio signals that travel through space, noting the time that the signal arrives. The time it
takes for the signal to arrive can be used to calculate the distance from the satellite to the GPS device. Once the device has calculated its distance from at least four satellites, it can then use
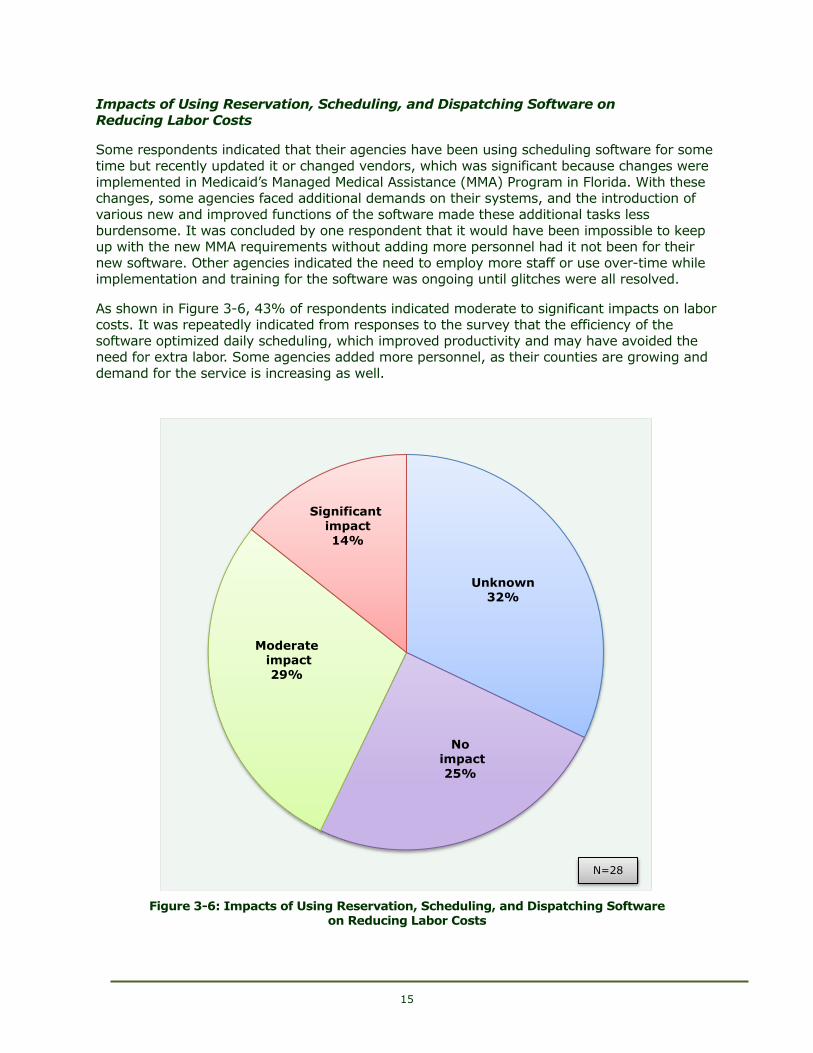
geometry to determine its location in three dimensions [11].
6
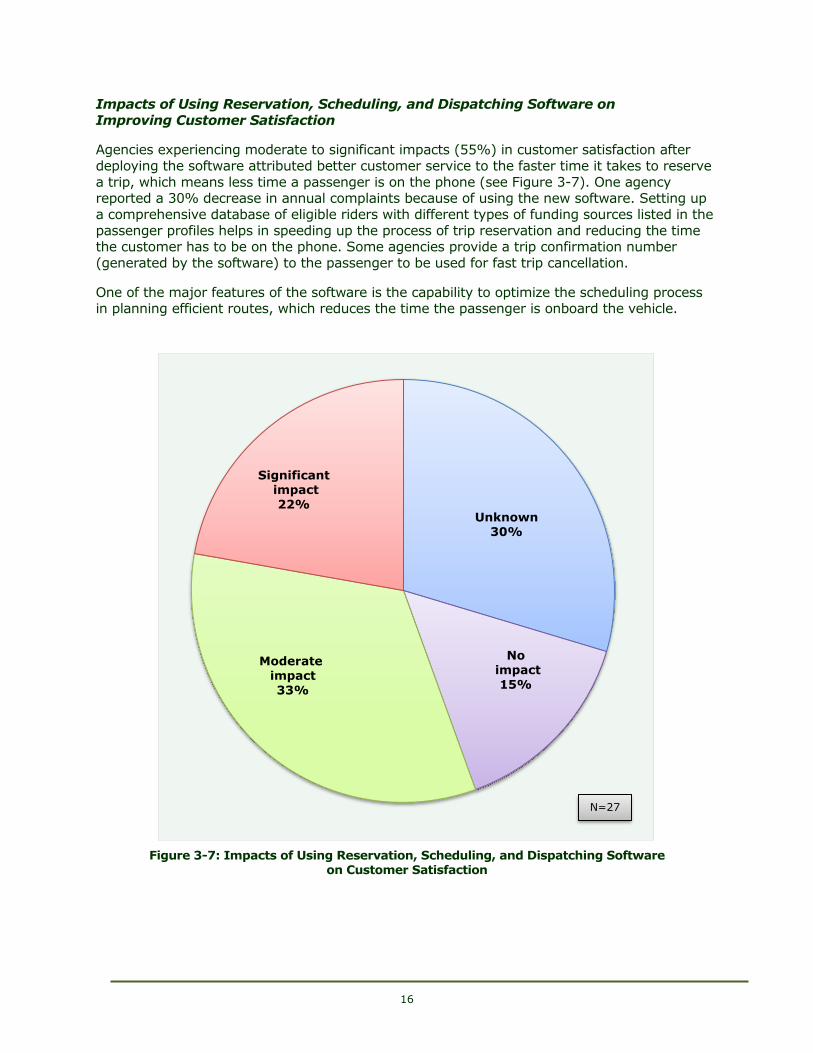
393BIn paratransit, GPS can be used to avoid missed pick-ups due to operational errors or difficult-
to-locate riders [12]. The 2009 FTA report “Feasibility Study on the Use of Personal GPS Devices in Paratransit” found that GPS technologies can lead to an improved level of service
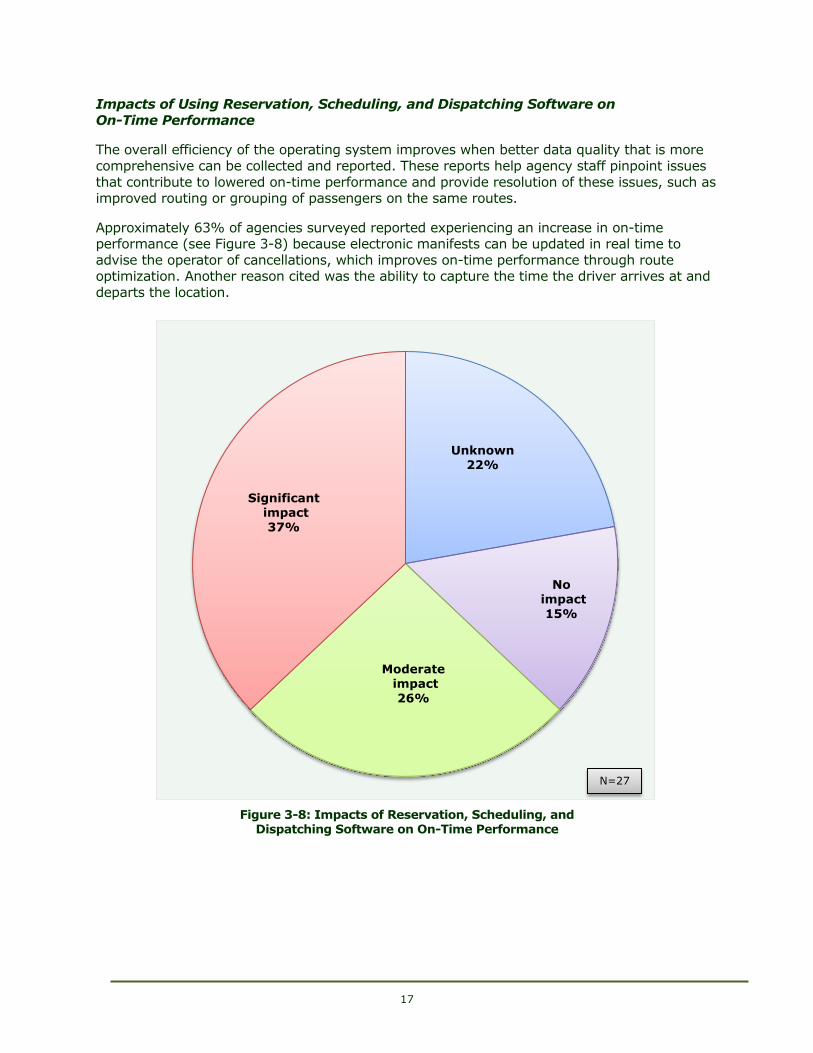
and can reduce an agency’s operating costs. Onboard GPS equipment cost may range from $200 to $2,000 per vehicle. Capital costs for a GPS system, including control center hardware,
installation, and training averaged $2,800 per vehicle in 2009 [12].
394BParatransit systems of the Central Florida Regional Transportation Authority (LYNX) and
Jacksonville Transportation Authority (JTA) use Mentor Rangers for their GPS. Mentor, now owned by Trapeze, does not list prices; however, JTA indicated that in FY 2013–2014, the
Mentor Ranger GPS systems were purchased for $4,872 per unit. Ranger is a mix of several technologies, including GPS, AVL, MDT, fare collection, and driver behavior monitoring (i.e.,
speed) [13]. These additional features result in a higher cost per unit.
Automatic Vehicle Location (AVL)
395BAVL technology is a computer-based system that allows vehicles to be tracked through
measuring the real-time location of the vehicle by way of GPS and relaying that information back to a central database. AVL systems are either passive or active. Passive AVL systems are
capable of storing GPS data, speed, and direction of the vehicle. Passive AVL system data can be uploaded when the vehicle returns to the property garage and the device is removed,
connected, and then downloaded to a computer. Active AVL systems are capable of the same functions; however, they also are capable of transmitting data in real-time by cellular data
communications [14].
396BAVL systems can benefit paratransit services through higher productivity. With the help of AVL, when a new trip is requested, the dispatcher can assign trips in real time, creating more efficient schedules, improving on-time performance, and increasing productivity.
397BA 12-vehicle deployment of AVL linked to traveler information for a small agency cost $60,000 while it cost a large urban agency $70 million to equip 5,700 buses [15].
398BThe fixed-route transit systems in Portland (Oregon), Baltimore (Maryland), and Milwaukee (Wisconsin) all reported an improvement in on-time bus performance, ranging from 9% to 23%, after the installation of AVL paired with a Computer Aided Dispatch (CAD) system. After
AVL technology was added to the Tri-Met bus dispatch system in Portland, there was a
decrease in both passenger wait time and in-vehicle travel time, which resulted in an annual savings of $3.5 million [16]. After the installation of AVL, San Jose (California) was able to
reduce its paratransit expenditures from $4.88 to $3.72 per passenger trip [17].
399BAlthough research into paratransit documentation did not offer substantial insights on how AVL and other technologies impact paratransit, these technologies have been proven effective in
transit systems.
Advanced Telephone Systems
400BAn automatic call-handling telephone system is capable of routing phone calls, storing voice
messages, notifying recipients of new messages, and providing callers with information by integrated voice capabilities, including schedules, fares, and current service status [18].
Advanced telephone systems monitor and improve the task of handling incoming calls, including average waiting time (on the phone); average phone call length once the caller is
connected, and dropped calls. Monitoring these performance measures can allow an agency to
seek improvement where necessary. There is also the growing use of interactive voice response (IVR) systems to notify riders of scheduled pick-up times and vehicle locations. When
the phone system is automated and paired with reservation software, it can send reminder or
7
verification calls to the trip-requester within one day of his/her trip or a real-time alert that the
vehicle is within 30–60 minutes (depending on agency policy) from the pick-up location. Use of this service resulted in a reduction in many no-shows for many agencies [3]. The cost of an
IVR system is generally $3,000 per phone line [19].
401BA transit agency in Canada reported that implementation of technology that calls a rider automatically when a vehicle is 10 minutes away resulted in a drop in wait times of 46
seconds, on average, at pick-ups, representing an average 40% reduction in wait times. This
saved time can result in additional trips being made during the course of a day.
402BThe Toledo Area Regional Transit Authority installed automatic callback software to work as its IVR system. The software called passengers when the vehicle was in the vicinity of their pick-
up addresses, allowing them time to prepare for the arrival of the vehicle. This reduced the amount of no-shows and wait times for their paratransit service [7, p. 52].
Vehicle Security Cameras
403BOnboard security cameras (interior and exterior) can be used to improve paratransit services
by monitoring vehicle operation, operator performance, and passenger behavior. These
surveillance systems are capable of both audio and video recordings that can capture evidence of altercations or injuries or causes of traffic incidents [20]. The cameras also can create a
sense of safety for riders and the drivers and can provide evidence against any possible cases
of unwarranted litigation.
404BAuditors recommended that Transit Plus in Milwaukee install security cameras on its fleet of paratransit vehicles after a complaint in 2012 by a passenger who slipped from his wheelchair
on a Transit Plus van; he was left hanging by his neck from the seat belt on the van, and passed away three days after the incident [21]. The van’s service officials claimed that the seat
belt had not been in contact with the passenger’s neck. The auditors’ report suggested
installing cameras on all 160 Transit Plus vans at a cost of more than $800,000 [22]. The money saved from avoiding unwarranted litigation could vary dramatically. Security cameras
also can be used for random monitoring of drivers and reporting compliance.
405BAlthough security camera systems are available from several vendors, the following is provided as an example of the application by one specific vendor. DriveCam is a type of security camera
that is placed inside a vehicle, with one camera facing the driver and another facing the
windshield and showing the surrounding environment. When unsafe driving behavior occurs, such as hard braking, the event is recorded in both video and data format (including speed,
location, and forces on the vehicle), and the information is uploaded via a cellular connection. The video and data can be privately reviewed by operations staff who can determine whether
coaching of the driver is necessary to avoid future events. Easton Coach Company’s paratransit system installed DriveCam technologies on its fleet in 2006 to evaluate driver behavior. Within
the first two years, the company’s accident claim numbers decreased by 40%, and, since the start of the DriveCam installation, cell phone use among drivers decreased 73%, following-
distance events improved 70%, and traffic violations decreased 69% [23].
Customer Information and Service
406BCustomer service and customer information technologies are another way to improve
paratransit services and include telephone or computer surveys post-trip to gather feedback from customers about the paratransit trip that was just taken. These surveys can provide
information about a paratransit trip from a user’s perspective, allowing an agency to recognize where improvements need to be made, which, in turn, could save the agency money.
Paratransit, Inc., which serves the Consolidated Transportation Services Agency (CTSA) for the
8
Sacramento area in California, provides its paratransit passengers with the opportunity to
contact the company with ideas, complaints, or comments in relation to its services through a contact form on its website, through email, or by postal mail. The agency guarantees a reply
within 30 days of receiving the feedback from the paratransit user [24].
Combining Technologies
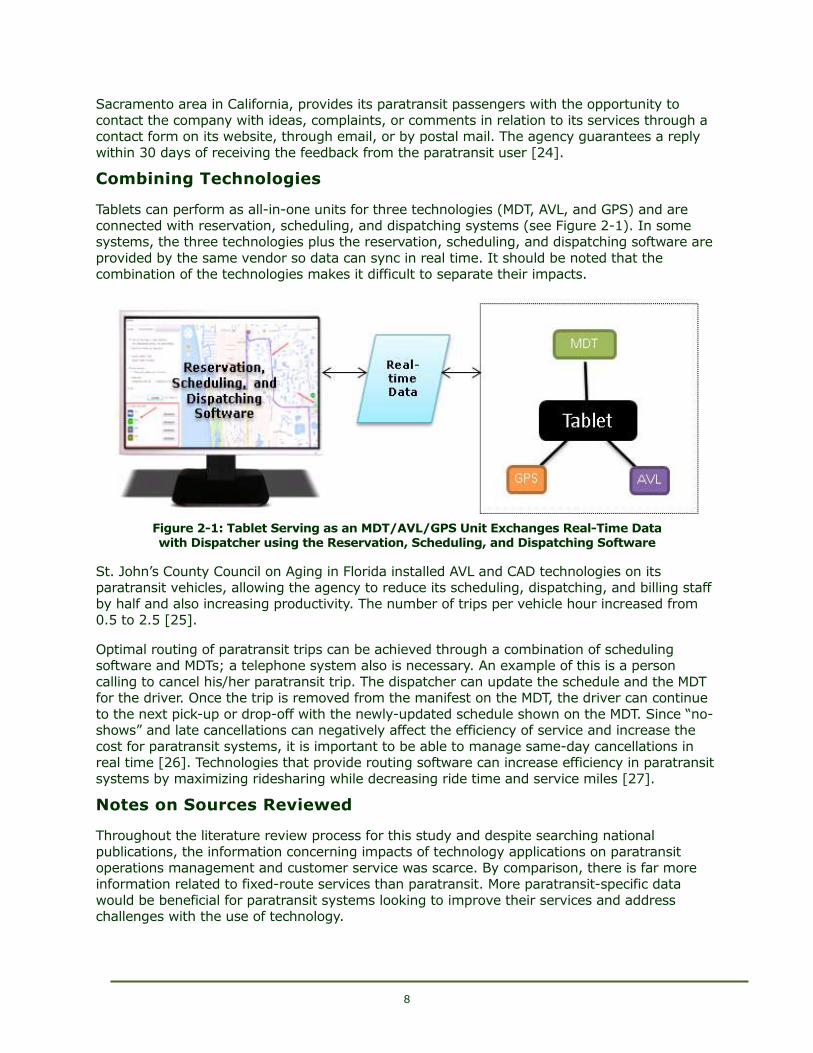
407BTablets can perform as all-in-one units for three technologies (MDT, AVL, and GPS) and are
connected with reservation, scheduling, and dispatching systems (see Figure 2-1). In some systems, the three technologies plus the reservation, scheduling, and dispatching software are
provided by the same vendor so data can sync in real time. It should be noted that the combination of the technologies makes it difficult to separate their impacts.
833B
686BFigure 2-1: Tablet Serving as an MDT/AVL/GPS Unit Exchanges Real-Time Data with Dispatcher using the Reservation, Scheduling, and Dispatching Software
408BSt. John’s County Council on Aging in Florida installed AVL and CAD technologies on its paratransit vehicles, allowing the agency to reduce its scheduling, dispatching, and billing staff
by half and also increasing productivity. The number of trips per vehicle hour increased from 0.5 to 2.5 [25].
409BOptimal routing of paratransit trips can be achieved through a combination of scheduling software and MDTs; a telephone system also is necessary. An example of this is a person
calling to cancel his/her paratransit trip. The dispatcher can update the schedule and the MDT for the driver. Once the trip is removed from the manifest on the MDT, the driver can continue
to the next pick-up or drop-off with the newly-updated schedule shown on the MDT. Since “no-shows” and late cancellations can negatively affect the efficiency of service and increase the
cost for paratransit systems, it is important to be able to manage same-day cancellations in real time [26]. Technologies that provide routing software can increase efficiency in paratransit
systems by maximizing ridesharing while decreasing ride time and service miles [27].
Notes on Sources Reviewed
410BThroughout the literature review process for this study and despite searching national
publications, the information concerning impacts of technology applications on paratransit operations management and customer service was scarce. By comparison, there is far more
information related to fixed-route services than paratransit. More paratransit-specific data
would be beneficial for paratransit systems looking to improve their services and address challenges with the use of technology.

9
411BThis research study contributes to the body of knowledge by focusing on paratransit agencies
in Florida and providing in-depth discussions on how technologies can affect operations management and customer service. Although deployment of these technologies in Florida is
recent, these discussions shed light on how effective the technologies were only a few months after deployment, increasing the productivity of the systems as self-reported by the agencies.
It is recommended that a follow-up survey be conducted in one or two years to conduct a quantitative assessment of the impacts these technologies will have on the performance
measures selected for this research study.
10
Chapter 3 - Survey Results
412BAn online survey of paratransit providers in Florida was conducted in February 2015. A mailing list of all 49 Florida CTCs was obtained from the CTD. The response rate was 78% with 38
agencies participating. The number of observations (N) for each survey question is included in each chart in this chapter as some respondents skipped some of the questions if they were not
applicable. Survey questions are included in Appendix A of this report.
General Information on Participating Agencies
Overview of Technology Types Used by Agencies
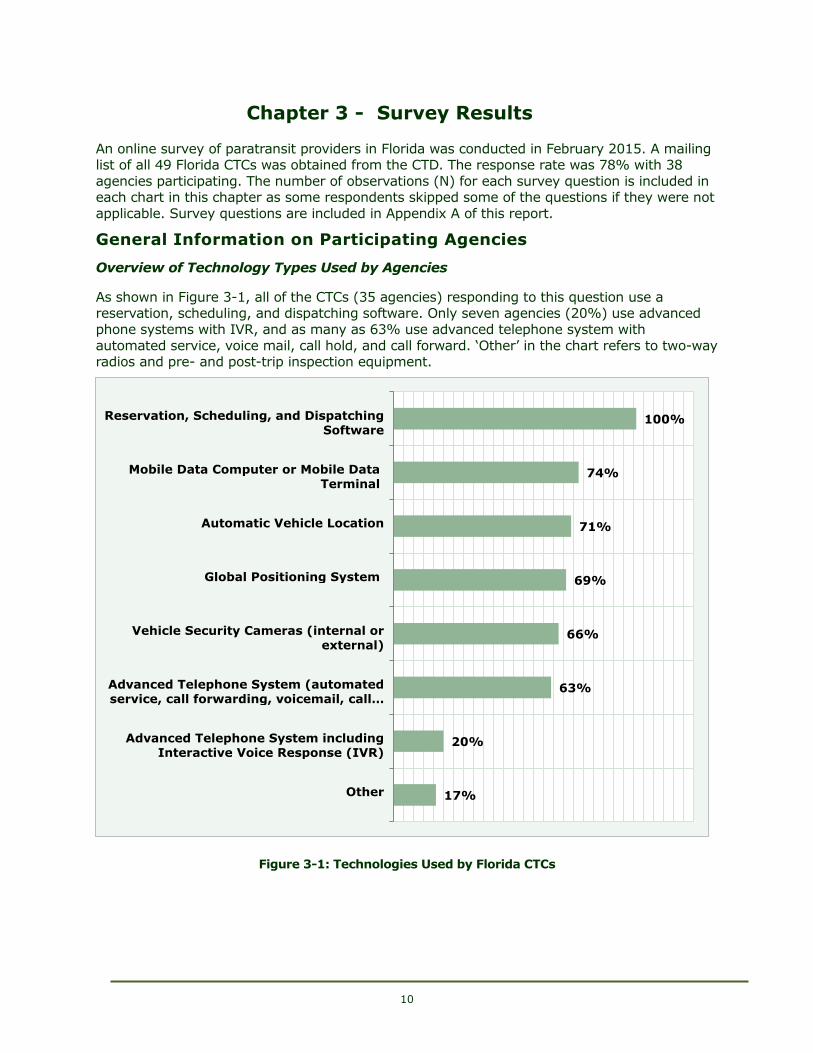
413BAs shown in Figure 3-1, all of the CTCs (35 agencies) responding to this question use a reservation, scheduling, and dispatching software. Only seven agencies (20%) use advanced
phone systems with IVR, and as many as 63% use advanced telephone system with
automated service, voice mail, call hold, and call forward. ‘Other’ in the chart refers to two-way radios and pre- and post-trip inspection equipment.
834B
687BFigure 3-1: Technologies Used by Florida CTCs
17%
20%
63%
66%
69%
71%
74%
100%
Other
Advanced Telephone System including Interactive Voice Response (IVR)
Advanced Telephone System (automated service, call forwarding, voicemail, call …
Vehicle Security Cameras (internal or external)
Global Positioning System
Automatic Vehicle Location
Mobile Data Computer or Mobile Data Terminal
Reservation, Scheduling, and Dispatching Software
11
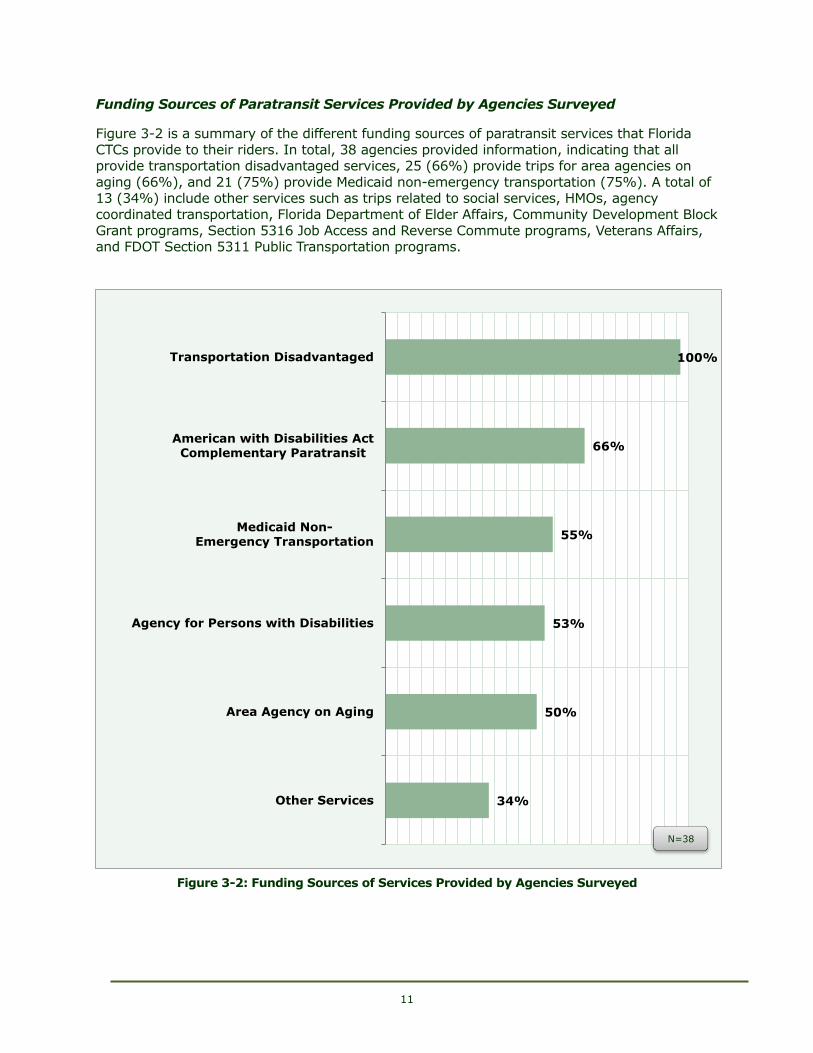
Funding Sources of Paratransit Services Provided by Agencies Surveyed
414BFigure 3-2 is a summary of the different funding sources of paratransit services that Florida
CTCs provide to their riders. In total, 38 agencies provided information, indicating that all provide transportation disadvantaged services, 25 (66%) provide trips for area agencies on
aging (66%), and 21 (75%) provide Medicaid non-emergency transportation (75%). A total of 13 (34%) include other services such as trips related to social services, HMOs, agency
coordinated transportation, Florida Department of Elder Affairs, Community Development Block
Grant programs, Section 5316 Job Access and Reverse Commute programs, Veterans Affairs, and FDOT Section 5311 Public Transportation programs.
835B
688BFigure 3-2: Funding Sources of Services Provided by Agencies Surveyed
34%
50%
53%
55%
66%
100%
Other Services
Area Agency on Aging
Agency for Persons with Disabilities
Medicaid Non-Emergency Transportation
American with Disabilities Act Complementary Paratransit
Transportation Disadvantaged
N=38
12
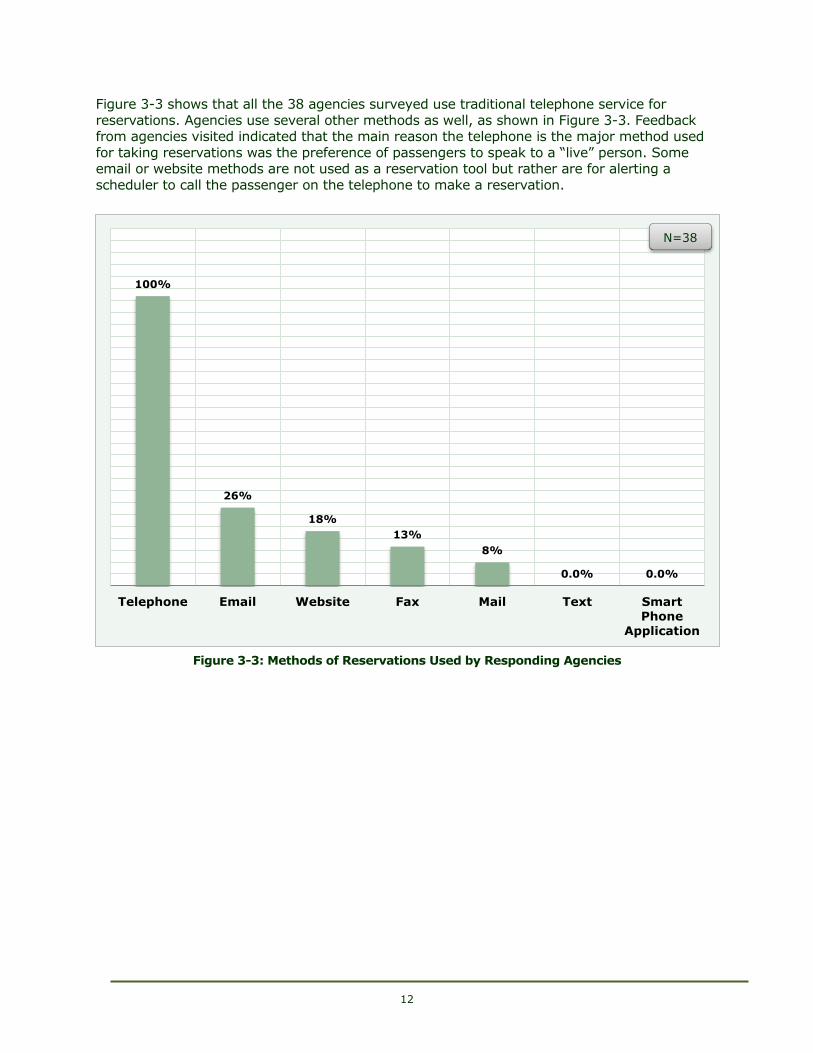
415BFigure 3-3 shows that all the 38 agencies surveyed use traditional telephone service for
reservations. Agencies use several other methods as well, as shown in Figure 3-3. Feedback from agencies visited indicated that the main reason the telephone is the major method used
for taking reservations was the preference of passengers to speak to a “live” person. Some email or website methods are not used as a reservation tool but rather are for alerting a
scheduler to call the passenger on the telephone to make a reservation.
836B
689BFigure 3-3: Methods of Reservations Used by Responding Agencies
100%
26%
18%
13%
8%
0.0% 0.0%
Telephone Email Website Fax Mail Text SmartPhone
Application
N=38
13
Reservation, Scheduling, and Dispatching Software
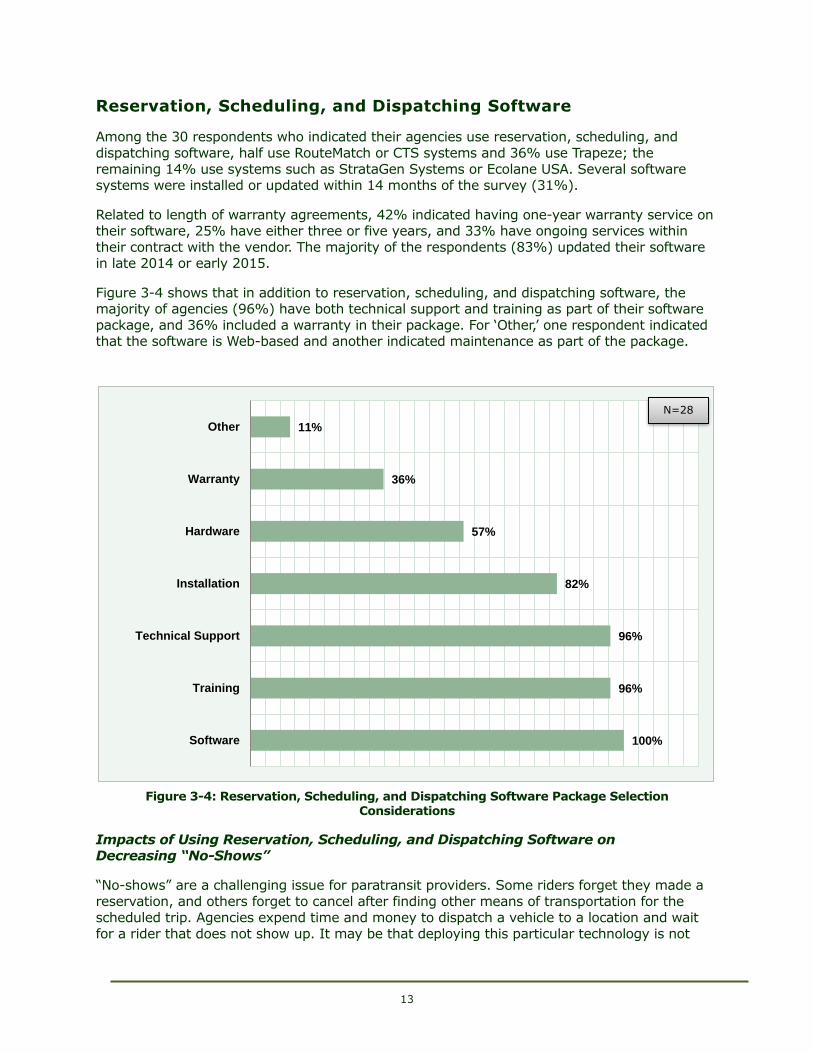
416BAmong the 30 respondents who indicated their agencies use reservation, scheduling, and
dispatching software, half use RouteMatch or CTS systems and 36% use Trapeze; the
remaining 14% use systems such as StrataGen Systems or Ecolane USA. Several software systems were installed or updated within 14 months of the survey (31%).
417BRelated to length of warranty agreements, 42% indicated having one-year warranty service on their software, 25% have either three or five years, and 33% have ongoing services within
their contract with the vendor. The majority of the respondents (83%) updated their software in late 2014 or early 2015.
418BFigure 3-4 shows that in addition to reservation, scheduling, and dispatching software, the majority of agencies (96%) have both technical support and training as part of their software
package, and 36% included a warranty in their package. For ‘Other,’ one respondent indicated that the software is Web-based and another indicated maintenance as part of the package.
837B
690BFigure 3-4: Reservation, Scheduling, and Dispatching Software Package Selection Considerations
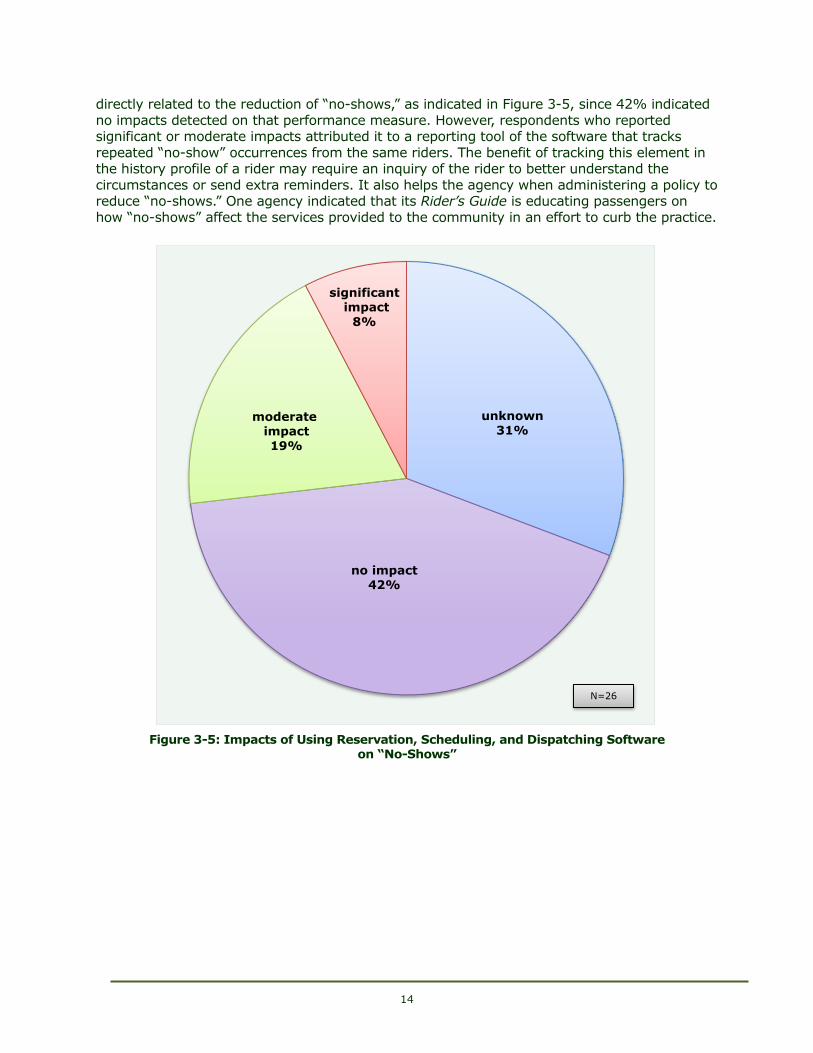
Impacts of Using Reservation, Scheduling, and Dispatching Software on Decreasing “No-Shows”
419B“No-shows” are a challenging issue for paratransit providers. Some riders forget they made a
reservation, and others forget to cancel after finding other means of transportation for the
scheduled trip. Agencies expend time and money to dispatch a vehicle to a location and wait for a rider that does not show up. It may be that deploying this particular technology is not
100%
96%
96%
82%
57%
36%
11%
Software
Training
Technical Support
Installation
Hardware
Warranty
Other
N=28
14
directly related to the reduction of “no-shows,” as indicated in Figure 3-5, since 42% indicated
no impacts detected on that performance measure. However, respondents who reported significant or moderate impacts attributed it to a reporting tool of the software that tracks
repeated “no-show” occurrences from the same riders. The benefit of tracking this element in the history profile of a rider may require an inquiry of the rider to better understand the
circumstances or send extra reminders. It also helps the agency when administering a policy to reduce “no-shows.” One agency indicated that its Rider’s Guide is educating passengers on
how “no-shows” affect the services provided to the community in an effort to curb the practice.
838B
691BFigure 3-5: Impacts of Using Reservation, Scheduling, and Dispatching Software on “No-Shows”
unknown 31%
no impact 42%
moderate impact
19%
significant impact
8%
N=26
15
Impacts of Using Reservation, Scheduling, and Dispatching Software on
Reducing Labor Costs
420BSome respondents indicated that their agencies have been using scheduling software for some
time but recently updated it or changed vendors, which was significant because changes were
implemented in Medicaid’s Managed Medical Assistance (MMA) Program in Florida. With these changes, some agencies faced additional demands on their systems, and the introduction of
various new and improved functions of the software made these additional tasks less
burdensome. It was concluded by one respondent that it would have been impossible to keep up with the new MMA requirements without adding more personnel had it not been for their
new software. Other agencies indicated the need to employ more staff or use over-time while implementation and training for the software was ongoing until glitches were all resolved.
421BAs shown in Figure 3-6, 43% of respondents indicated moderate to significant impacts on labor costs. It was repeatedly indicated from responses to the survey that the efficiency of the
software optimized daily scheduling, which improved productivity and may have avoided the need for extra labor. Some agencies added more personnel, as their counties are growing and
demand for the service is increasing as well.
839B
692BFigure 3-6: Impacts of Using Reservation, Scheduling, and Dispatching Software on Reducing Labor Costs
Unknown 32%
No impact
25%
Moderate impact
29%
Significant impact
14%
N=28
16
Impacts of Using Reservation, Scheduling, and Dispatching Software on
Improving Customer Satisfaction
422BAgencies experiencing moderate to significant impacts (55%) in customer satisfaction after
deploying the software attributed better customer service to the faster time it takes to reserve
a trip, which means less time a passenger is on the phone (see Figure 3-7). One agency reported a 30% decrease in annual complaints because of using the new software. Setting up
a comprehensive database of eligible riders with different types of funding sources listed in the
passenger profiles helps in speeding up the process of trip reservation and reducing the time the customer has to be on the phone. Some agencies provide a trip confirmation number
(generated by the software) to the passenger to be used for fast trip cancellation.
423BOne of the major features of the software is the capability to optimize the scheduling process in planning efficient routes, which reduces the time the passenger is onboard the vehicle.
840B
693BFigure 3-7: Impacts of Using Reservation, Scheduling, and Dispatching Software on Customer Satisfaction
Unknown 30%
No impact
15%
Moderate impact
33%
Significant impact
22%
N=27
17
Impacts of Using Reservation, Scheduling, and Dispatching Software on
On-Time Performance
424BThe overall efficiency of the operating system improves when better data quality that is more
comprehensive can be collected and reported. These reports help agency staff pinpoint issues
that contribute to lowered on-time performance and provide resolution of these issues, such as improved routing or grouping of passengers on the same routes.
425BApproximately 63% of agencies surveyed reported experiencing an increase in on-time performance (see Figure 3-8) because electronic manifests can be updated in real time to
advise the operator of cancellations, which improves on-time performance through route optimization. Another reason cited was the ability to capture the time the driver arrives at and
departs the location.
841B
694BFigure 3-8: Impacts of Reservation, Scheduling, and Dispatching Software on On-Time Performance
Unknown 22%
No impact
15%
Moderate impact
26%
Significant impact
37%
N=27
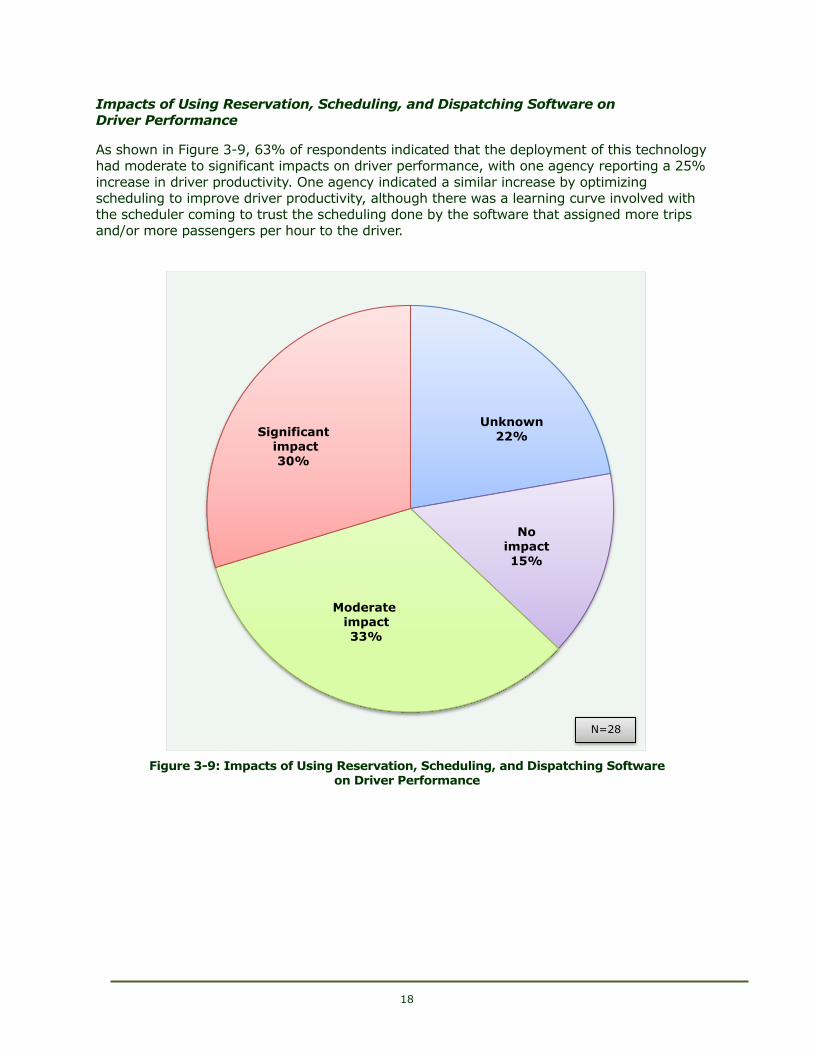
18
Impacts of Using Reservation, Scheduling, and Dispatching Software on
Driver Performance
426BAs shown in Figure 3-9, 63% of respondents indicated that the deployment of this technology
had moderate to significant impacts on driver performance, with one agency reporting a 25%
increase in driver productivity. One agency indicated a similar increase by optimizing scheduling to improve driver productivity, although there was a learning curve involved with
the scheduler coming to trust the scheduling done by the software that assigned more trips
and/or more passengers per hour to the driver.
842B
695BFigure 3-9: Impacts of Using Reservation, Scheduling, and Dispatching Software on Driver Performance
Unknown 22%
No impact
15%
Moderate impact
33%
Significant impact
30%
N=28
19
Mobile Data Terminals
427BAmong the 38 agencies responding to questions related to MDT usage, 28 (74%) confirmed
the use of MDT systems; 56% of these agencies installed their systems as recently as late
2014 or early 2015, 15% installed their systems between 2012 and 2013, and the remaining 29% varied between 2002 and 2011. The following manufacturers were noted among
responses received:
597BCTS
598BRadio Satellite Integrators, Inc.
599BTrapeze
600BGreyHawk Technologies
601BDigital Dispatch Systems
602BMentor Ranger (acquired by Trapeze)
603BSamsung Galaxy Tablet
604BRouteMatch
605BVerizon
606BAVAIL
428BBecause 15 of the 27 agencies (55.5%) reported having had their systems installed within just a few months of the survey, answering questions about the benefits/costs of the technology
may have been premature, which was the main cause for citing “unknown impacts.” However, it may be considered a baseline for future questionnaires that address specific impacts.
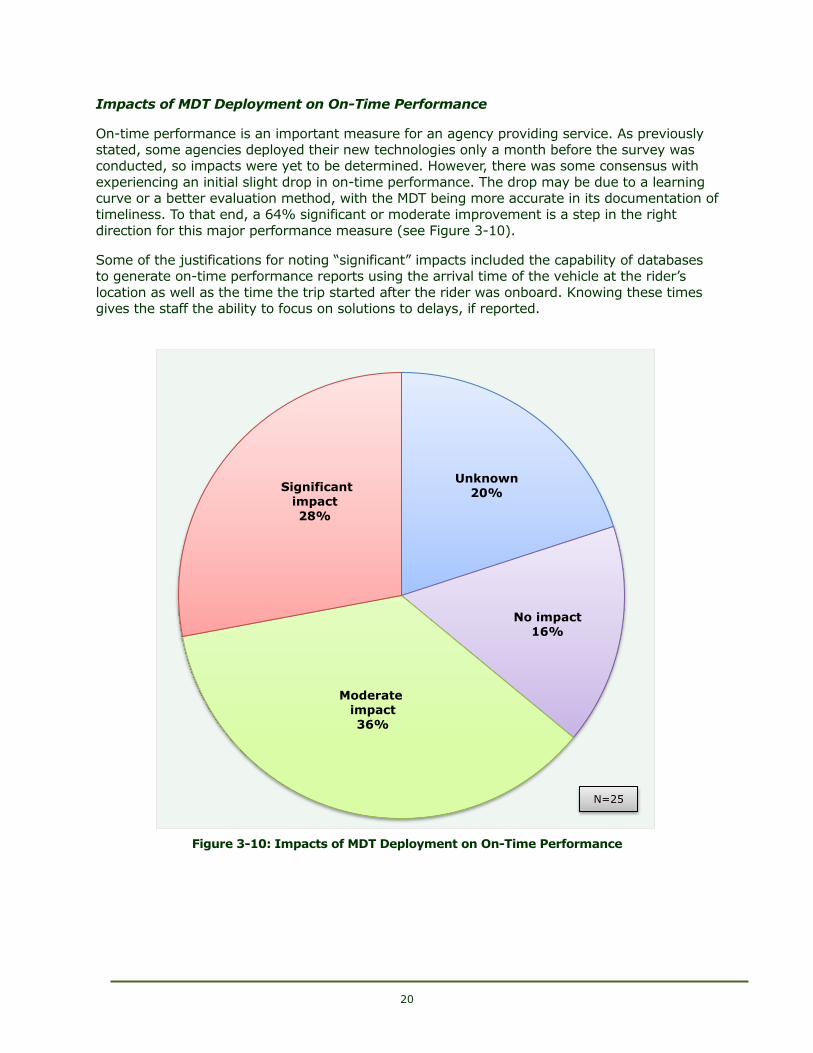
20
Impacts of MDT Deployment on On-Time Performance
429BOn-time performance is an important measure for an agency providing service. As previously stated, some agencies deployed their new technologies only a month before the survey was conducted, so impacts were yet to be determined. However, there was some consensus with
experiencing an initial slight drop in on-time performance. The drop may be due to a learning curve or a better evaluation method, with the MDT being more accurate in its documentation of
timeliness. To that end, a 64% significant or moderate improvement is a step in the right
direction for this major performance measure (see Figure 3-10).
430BSome of the justifications for noting “significant” impacts included the capability of databases to generate on-time performance reports using the arrival time of the vehicle at the rider’s
location as well as the time the trip started after the rider was onboard. Knowing these times gives the staff the ability to focus on solutions to delays, if reported.
843B
696BFigure 3-10: Impacts of MDT Deployment on On-Time Performance
Unknown 20%
No impact 16%
Moderate impact
36%
Significant impact
28%
N=25
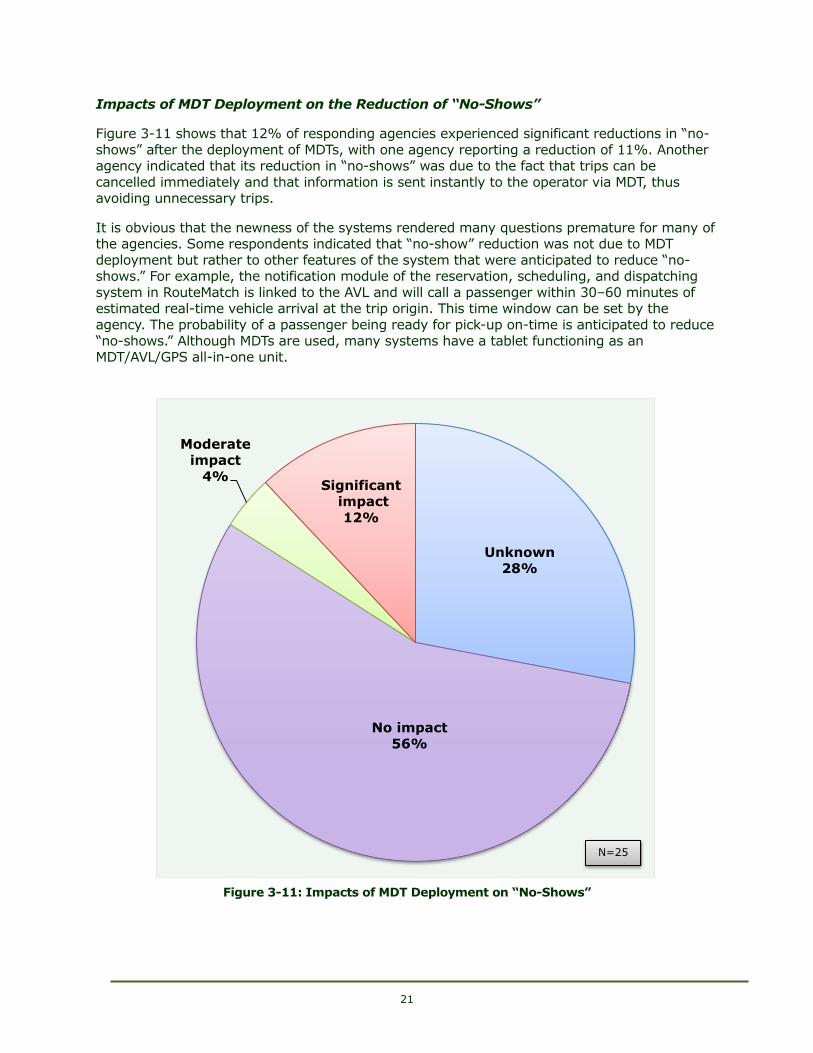
21
Impacts of MDT Deployment on the Reduction of “No-Shows”
431BFigure 3-11 shows that 12% of responding agencies experienced significant reductions in “no-
shows” after the deployment of MDTs, with one agency reporting a reduction of 11%. Another agency indicated that its reduction in “no-shows” was due to the fact that trips can be
cancelled immediately and that information is sent instantly to the operator via MDT, thus avoiding unnecessary trips.
432BIt is obvious that the newness of the systems rendered many questions premature for many of the agencies. Some respondents indicated that “no-show” reduction was not due to MDT
deployment but rather to other features of the system that were anticipated to reduce “no-shows.” For example, the notification module of the reservation, scheduling, and dispatching
system in RouteMatch is linked to the AVL and will call a passenger within 30–60 minutes of estimated real-time vehicle arrival at the trip origin. This time window can be set by the
agency. The probability of a passenger being ready for pick-up on-time is anticipated to reduce
“no-shows.” Although MDTs are used, many systems have a tablet functioning as an MDT/AVL/GPS all-in-one unit.
844B
697BFigure 3-11: Impacts of MDT Deployment on “No-Shows”
Unknown 28%
No impact 56%
Moderate impact
4% Significant
impact
12%
N=25
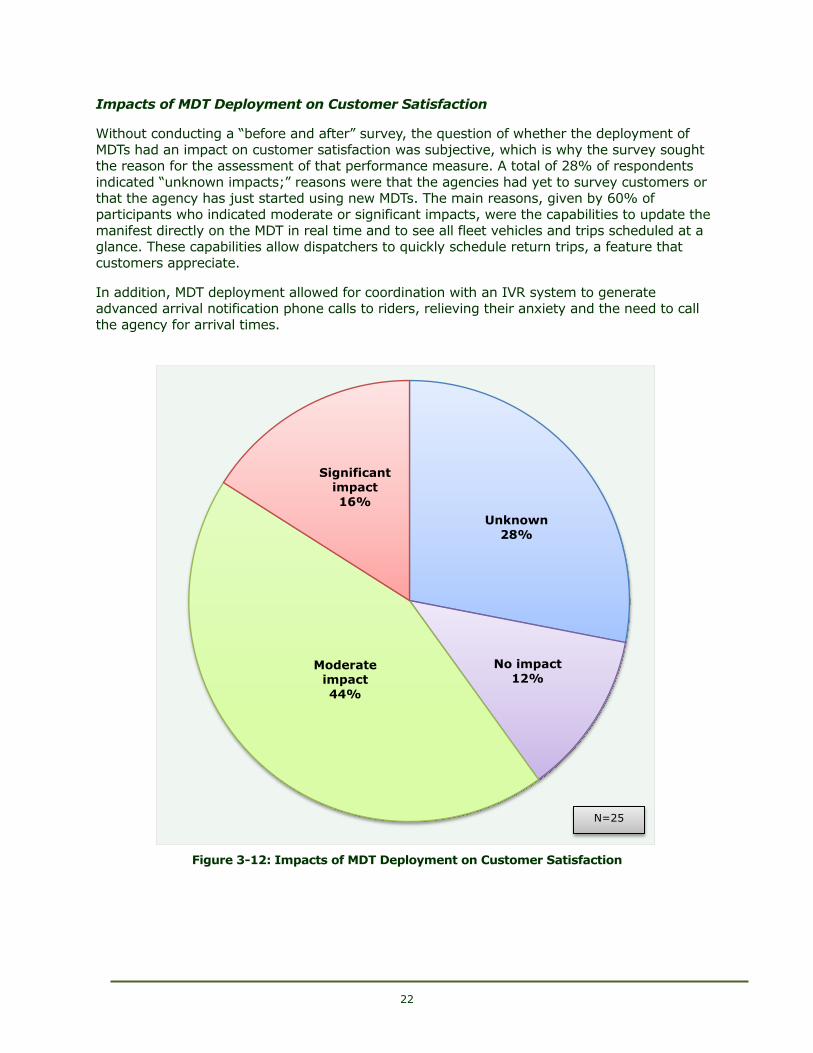
22
Impacts of MDT Deployment on Customer Satisfaction
433BWithout conducting a “before and after” survey, the question of whether the deployment of
MDTs had an impact on customer satisfaction was subjective, which is why the survey sought the reason for the assessment of that performance measure. A total of 28% of respondents
indicated “unknown impacts;” reasons were that the agencies had yet to survey customers or that the agency has just started using new MDTs. The main reasons, given by 60% of
participants who indicated moderate or significant impacts, were the capabilities to update the
manifest directly on the MDT in real time and to see all fleet vehicles and trips scheduled at a glance. These capabilities allow dispatchers to quickly schedule return trips, a feature that
customers appreciate.
434BIn addition, MDT deployment allowed for coordination with an IVR system to generate advanced arrival notification phone calls to riders, relieving their anxiety and the need to call
the agency for arrival times.
845B
698BFigure 3-12: Impacts of MDT Deployment on Customer Satisfaction
Unknown 28%
No impact 12%
Moderate impact
44%
Significant impact
16%
N=25
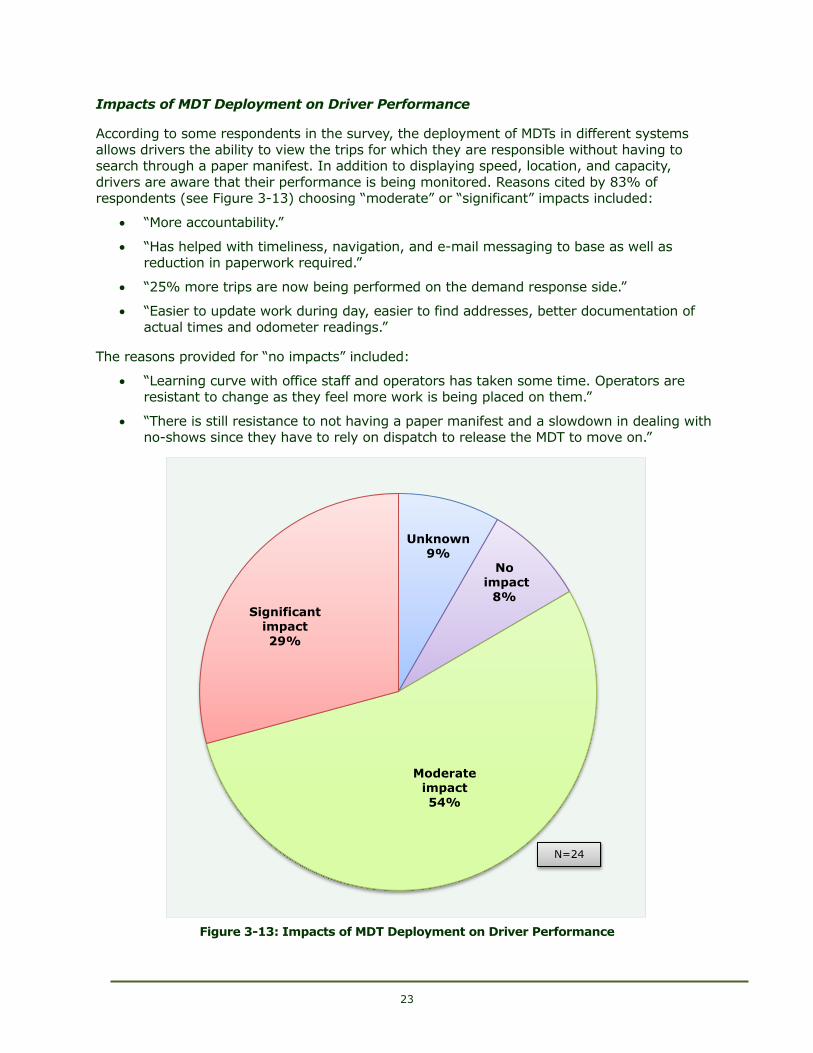
23
Impacts of MDT Deployment on Driver Performance
435BAccording to some respondents in the survey, the deployment of MDTs in different systems
allows drivers the ability to view the trips for which they are responsible without having to search through a paper manifest. In addition to displaying speed, location, and capacity,
drivers are aware that their performance is being monitored. Reasons cited by 83% of respondents (see Figure 3-13) choosing “moderate” or “significant” impacts included:
607B“More accountability.”
608B“Has helped with timeliness, navigation, and e-mail messaging to base as well as reduction in paperwork required.”
609B“25% more trips are now being performed on the demand response side.”
610B“Easier to update work during day, easier to find addresses, better documentation of
actual times and odometer readings.”
436BThe reasons provided for “no impacts” included:
611B“Learning curve with office staff and operators has taken some time. Operators are resistant to change as they feel more work is being placed on them.”
612B“There is still resistance to not having a paper manifest and a slowdown in dealing with no-shows since they have to rely on dispatch to release the MDT to move on.”
846B
699BFigure 3-13: Impacts of MDT Deployment on Driver Performance
Unknown 9%
No impact
8%
Moderate impact
54%
Significant impact
29%
N=24
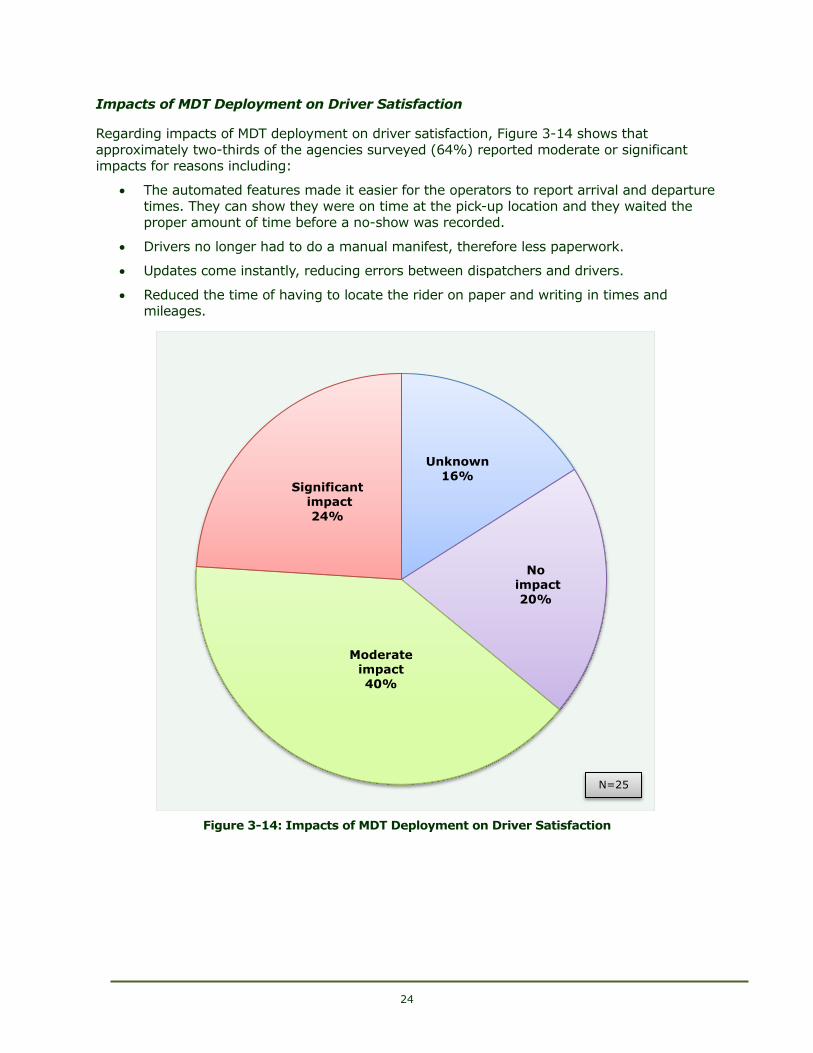
24
Impacts of MDT Deployment on Driver Satisfaction
437BRegarding impacts of MDT deployment on driver satisfaction, Figure 3-14 shows that
approximately two-thirds of the agencies surveyed (64%) reported moderate or significant impacts for reasons including:
613BThe automated features made it easier for the operators to report arrival and departure times. They can show they were on time at the pick-up location and they waited the
proper amount of time before a no-show was recorded.
614BDrivers no longer had to do a manual manifest, therefore less paperwork.
615BUpdates come instantly, reducing errors between dispatchers and drivers.
616BReduced the time of having to locate the rider on paper and writing in times and mileages.
847B
700BFigure 3-14: Impacts of MDT Deployment on Driver Satisfaction
Unknown 16%
No impact
20%
Moderate
impact
40%
Significant impact
24%
N=25
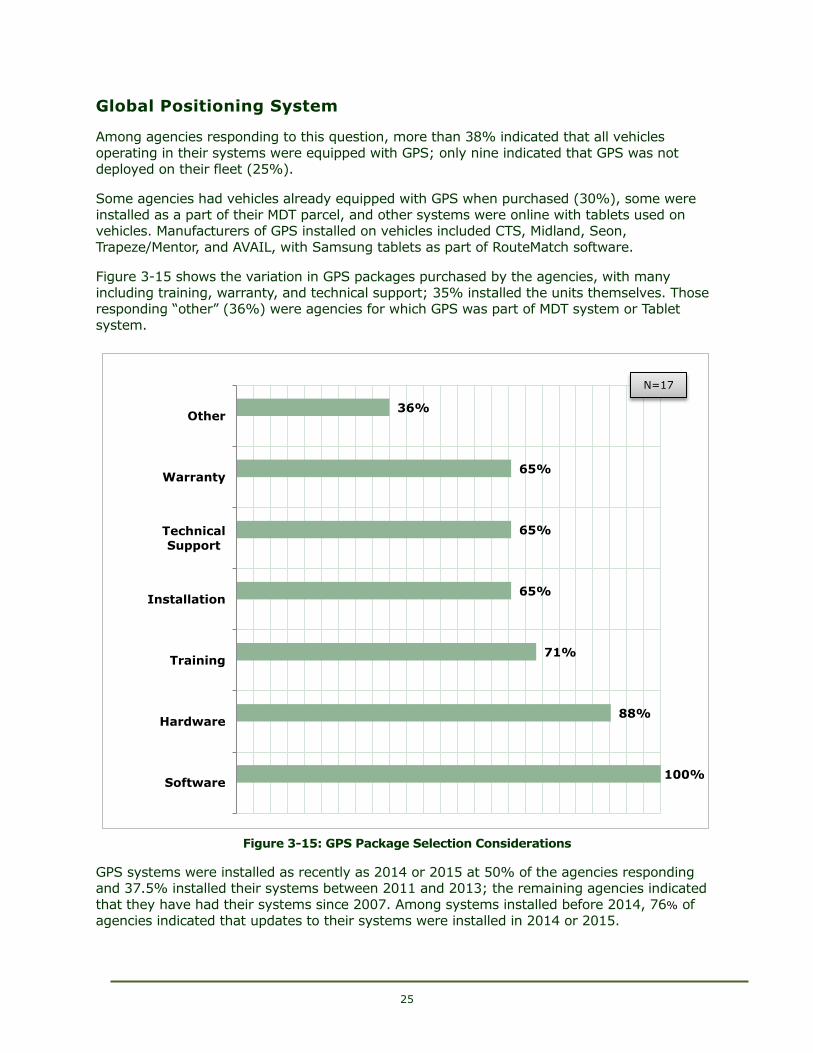
25
Global Positioning System
438BAmong agencies responding to this question, more than 38% indicated that all vehicles
operating in their systems were equipped with GPS; only nine indicated that GPS was not
deployed on their fleet (25%).
439BSome agencies had vehicles already equipped with GPS when purchased (30%), some were
installed as a part of their MDT parcel, and other systems were online with tablets used on vehicles. Manufacturers of GPS installed on vehicles included CTS, Midland, Seon,
Trapeze/Mentor, and AVAIL, with Samsung tablets as part of RouteMatch software.
440BFigure 3-15 shows the variation in GPS packages purchased by the agencies, with many
including training, warranty, and technical support; 35% installed the units themselves. Those responding “other” (36%) were agencies for which GPS was part of MDT system or Tablet
system.
848B
701BFigure 3-15: GPS Package Selection Considerations
441BGPS systems were installed as recently as 2014 or 2015 at 50% of the agencies responding and 37.5% installed their systems between 2011 and 2013; the remaining agencies indicated
that they have had their systems since 2007. Among systems installed before 2014, 76% of
agencies indicated that updates to their systems were installed in 2014 or 2015.
100%
88%
71%
65%
65%
65%
36%
Software
Hardware
Training
Installation
TechnicalSupport
Warranty
Other
N=17
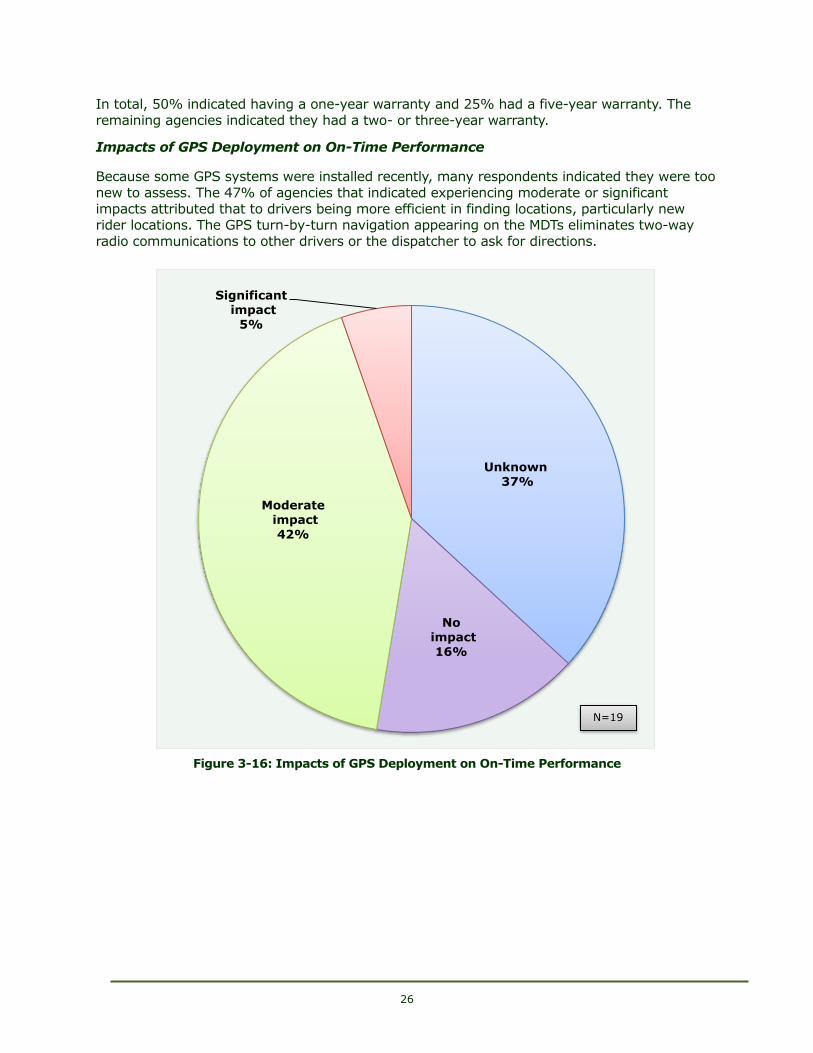
26
442BIn total, 50% indicated having a one-year warranty and 25% had a five-year warranty. The
remaining agencies indicated they had a two- or three-year warranty.
Impacts of GPS Deployment on On-Time Performance
443BBecause some GPS systems were installed recently, many respondents indicated they were too
new to assess. The 47% of agencies that indicated experiencing moderate or significant
impacts attributed that to drivers being more efficient in finding locations, particularly new rider locations. The GPS turn-by-turn navigation appearing on the MDTs eliminates two-way
radio communications to other drivers or the dispatcher to ask for directions.
849B
702BFigure 3-16: Impacts of GPS Deployment on On-Time Performance
Unknown 37%
No impact
16%
Moderate impact
42%
Significant impact
5%
N=19
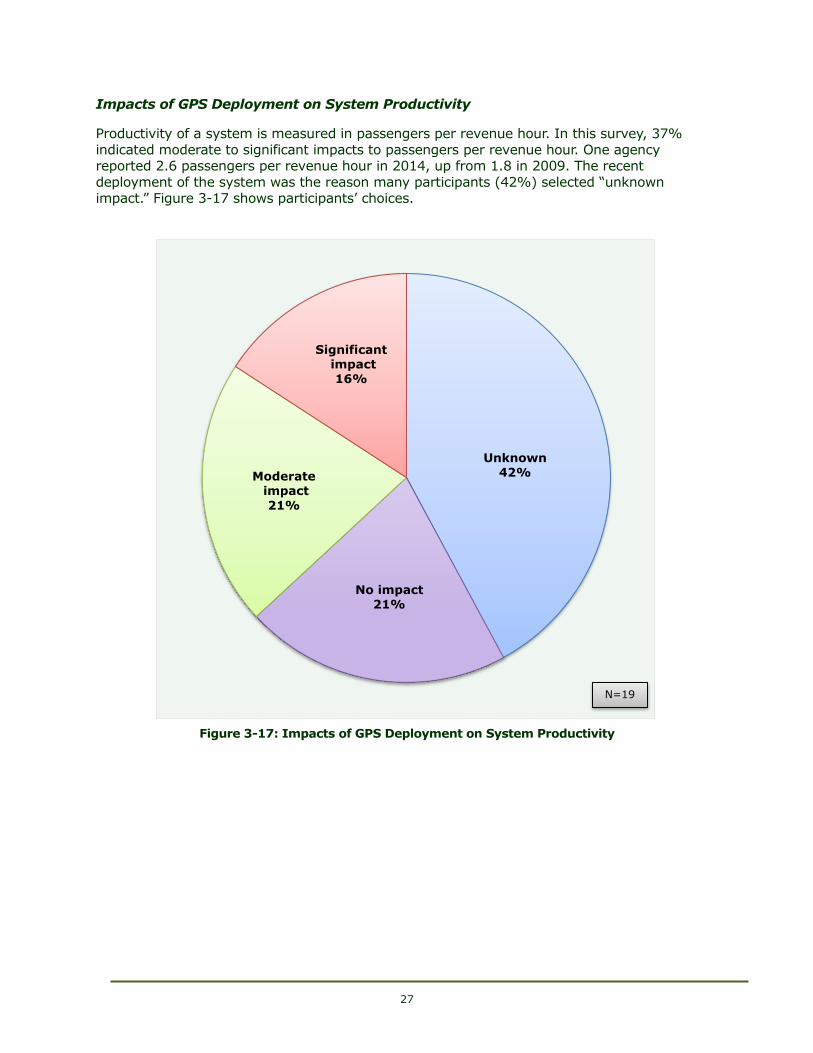
27
Impacts of GPS Deployment on System Productivity
444BProductivity of a system is measured in passengers per revenue hour. In this survey, 37%
indicated moderate to significant impacts to passengers per revenue hour. One agency reported 2.6 passengers per revenue hour in 2014, up from 1.8 in 2009. The recent
deployment of the system was the reason many participants (42%) selected “unknown impact.” Figure 3-17 shows participants’ choices.
850B
703BFigure 3-17: Impacts of GPS Deployment on System Productivity
Unknown 42%
No impact 21%
Moderate impact
21%
Significant impact
16%
N=19
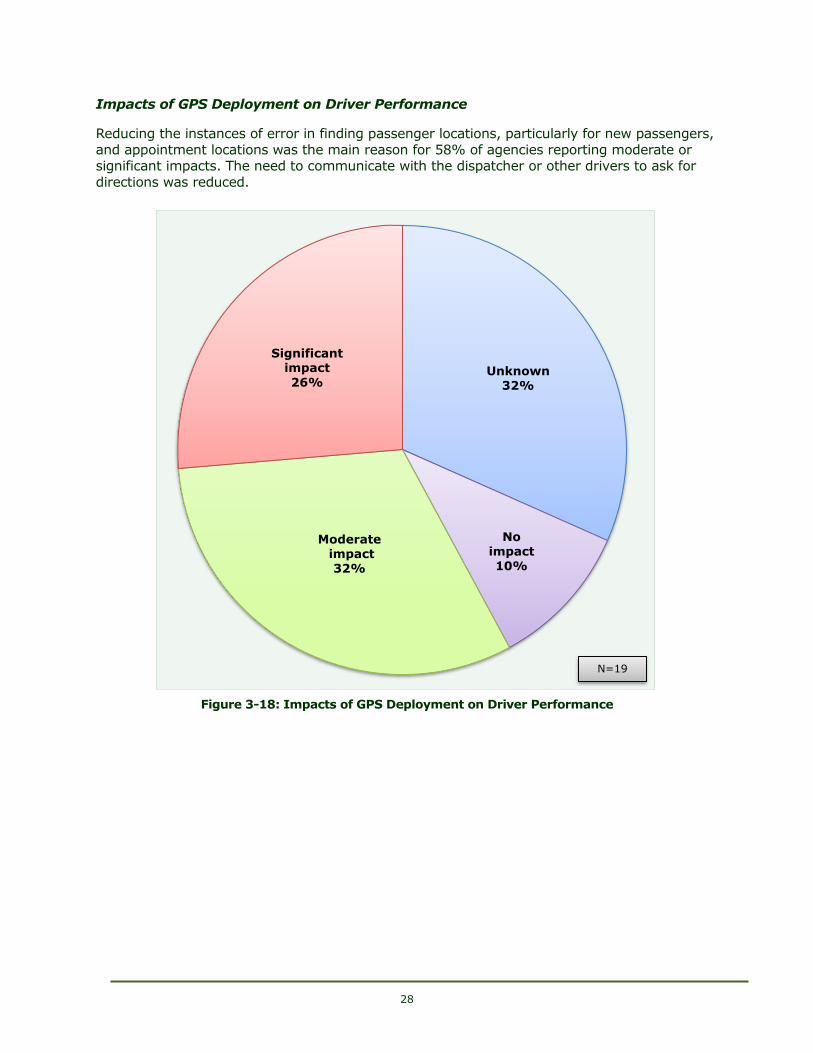
28
Impacts of GPS Deployment on Driver Performance
445BReducing the instances of error in finding passenger locations, particularly for new passengers,
and appointment locations was the main reason for 58% of agencies reporting moderate or significant impacts. The need to communicate with the dispatcher or other drivers to ask for
directions was reduced.
851B
704BFigure 3-18: Impacts of GPS Deployment on Driver Performance
Unknown 32%
No impact
10%
Moderate impact
32%
Significant impact
26%
N=19
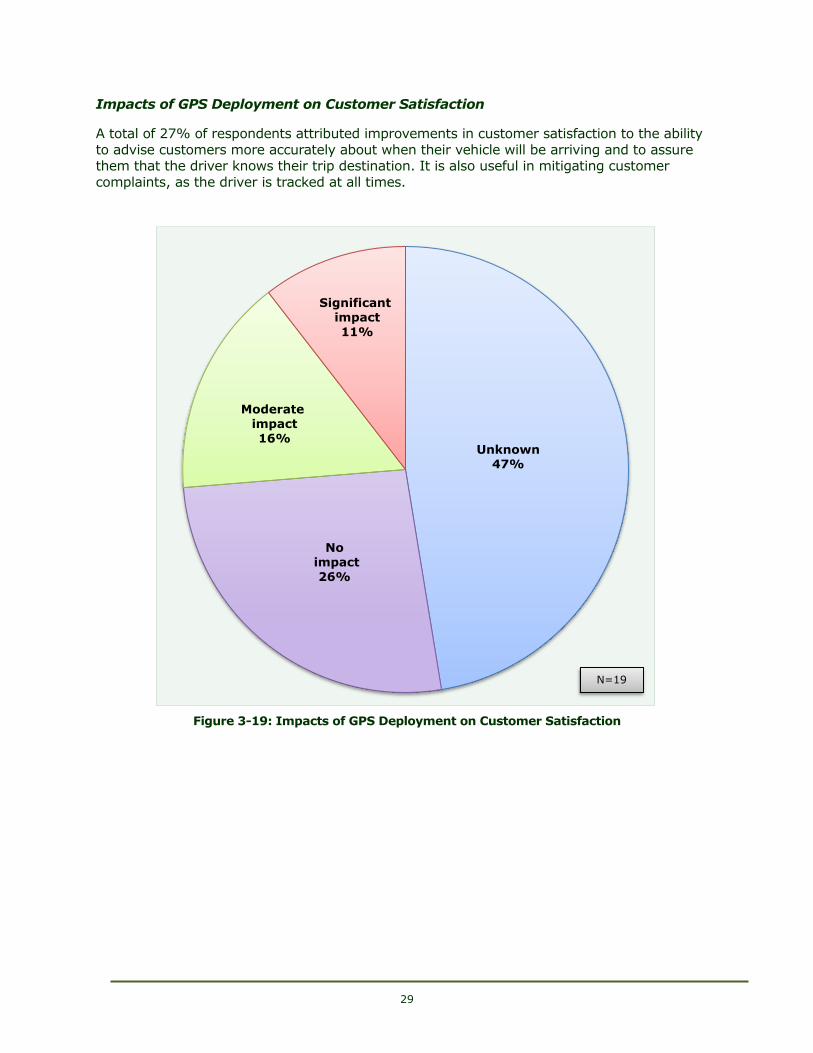
29
Impacts of GPS Deployment on Customer Satisfaction
446BA total of 27% of respondents attributed improvements in customer satisfaction to the ability
to advise customers more accurately about when their vehicle will be arriving and to assure them that the driver knows their trip destination. It is also useful in mitigating customer
complaints, as the driver is tracked at all times.
852B
705BFigure 3-19: Impacts of GPS Deployment on Customer Satisfaction
Unknown 47%
No impact
26%
Moderate impact
16%
Significant impact
11%
N=19
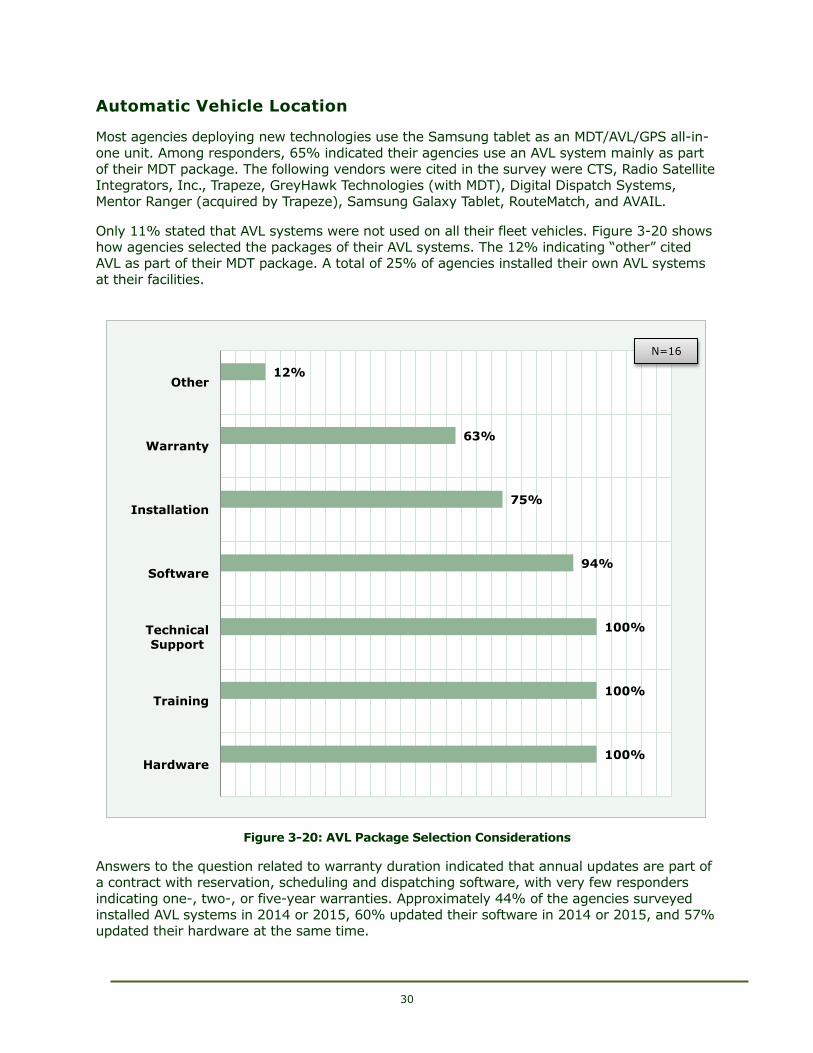
30
Automatic Vehicle Location
447BMost agencies deploying new technologies use the Samsung tablet as an MDT/AVL/GPS all-in-
one unit. Among responders, 65% indicated their agencies use an AVL system mainly as part
of their MDT package. The following vendors were cited in the survey were CTS, Radio Satellite Integrators, Inc., Trapeze, GreyHawk Technologies (with MDT), Digital Dispatch Systems,
Mentor Ranger (acquired by Trapeze), Samsung Galaxy Tablet, RouteMatch, and AVAIL.
448BOnly 11% stated that AVL systems were not used on all their fleet vehicles. Figure 3-20 shows how agencies selected the packages of their AVL systems. The 12% indicating “other” cited AVL as part of their MDT package. A total of 25% of agencies installed their own AVL systems
at their facilities.
853B
706BFigure 3-20: AVL Package Selection Considerations
449BAnswers to the question related to warranty duration indicated that annual updates are part of a contract with reservation, scheduling and dispatching software, with very few responders
indicating one-, two-, or five-year warranties. Approximately 44% of the agencies surveyed
installed AVL systems in 2014 or 2015, 60% updated their software in 2014 or 2015, and 57% updated their hardware at the same time.
100%
100%
100%
94%
75%
63%
12%
Hardware
Training
TechnicalSupport
Software
Installation
Warranty
Other
N=16
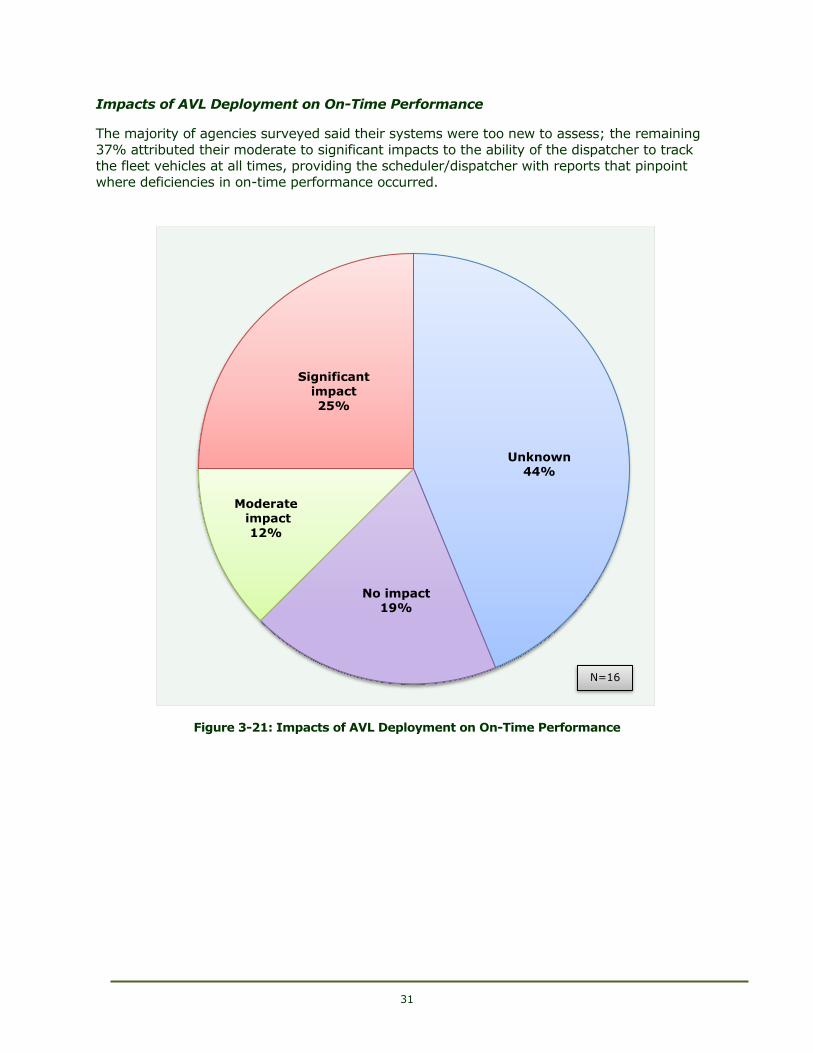
31
Impacts of AVL Deployment on On-Time Performance
450BThe majority of agencies surveyed said their systems were too new to assess; the remaining
37% attributed their moderate to significant impacts to the ability of the dispatcher to track the fleet vehicles at all times, providing the scheduler/dispatcher with reports that pinpoint
where deficiencies in on-time performance occurred.
854B
707BFigure 3-21: Impacts of AVL Deployment on On-Time Performance
Unknown 44%
No impact 19%
Moderate impact
12%
Significant impact
25%
N=16
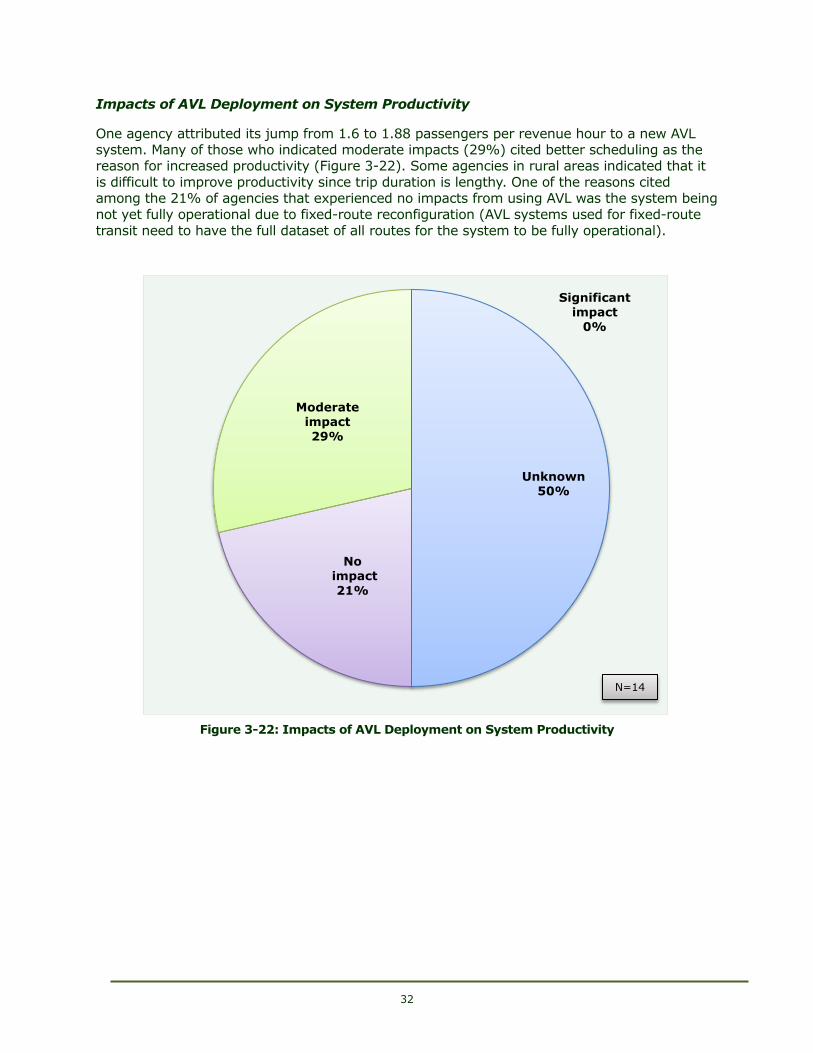
32
Impacts of AVL Deployment on System Productivity
451BOne agency attributed its jump from 1.6 to 1.88 passengers per revenue hour to a new AVL system. Many of those who indicated moderate impacts (29%) cited better scheduling as the reason for increased productivity (Figure 3-22). Some agencies in rural areas indicated that it
is difficult to improve productivity since trip duration is lengthy. One of the reasons cited among the 21% of agencies that experienced no impacts from using AVL was the system being
not yet fully operational due to fixed-route reconfiguration (AVL systems used for fixed-route
transit need to have the full dataset of all routes for the system to be fully operational).
855B
708BFigure 3-22: Impacts of AVL Deployment on System Productivity
Unknown 50%
No impact
21%
Moderate impact
29%
Significant impact
0%
N=14
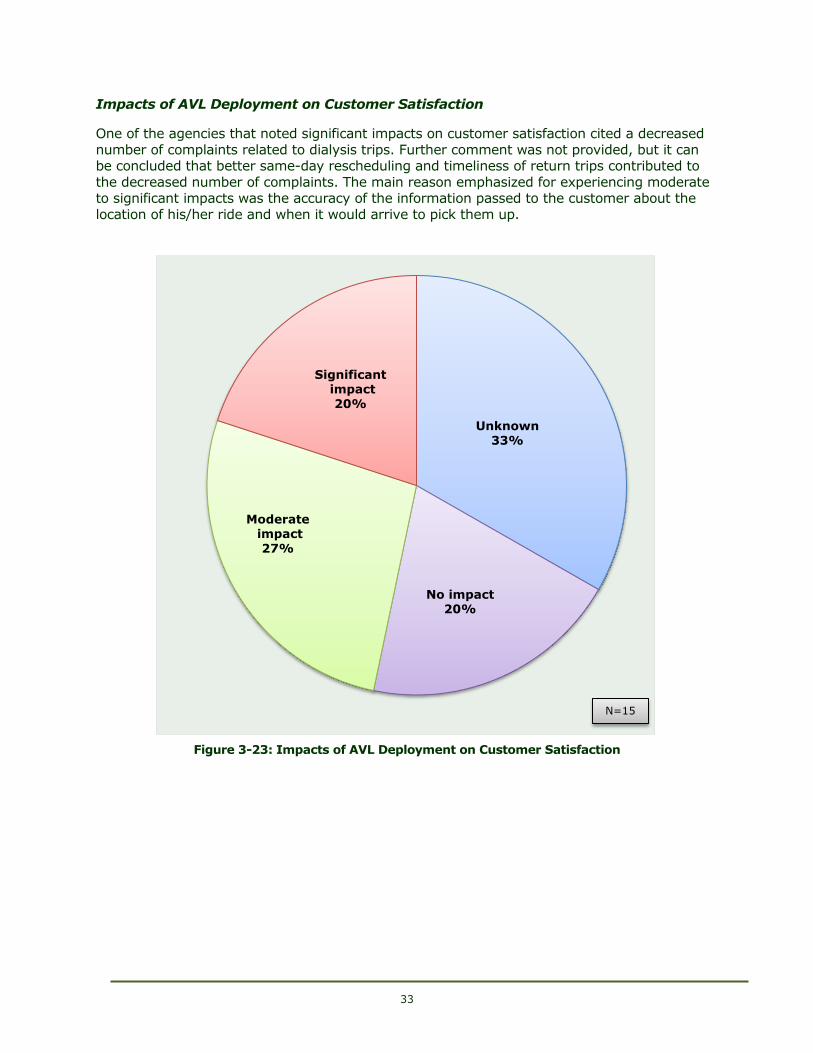
33
Impacts of AVL Deployment on Customer Satisfaction
452BOne of the agencies that noted significant impacts on customer satisfaction cited a decreased
number of complaints related to dialysis trips. Further comment was not provided, but it can be concluded that better same-day rescheduling and timeliness of return trips contributed to
the decreased number of complaints. The main reason emphasized for experiencing moderate to significant impacts was the accuracy of the information passed to the customer about the
location of his/her ride and when it would arrive to pick them up.
856B
709BFigure 3-23: Impacts of AVL Deployment on Customer Satisfaction
Unknown 33%
No impact 20%
Moderate impact
27%
Significant impact
20%
N=15
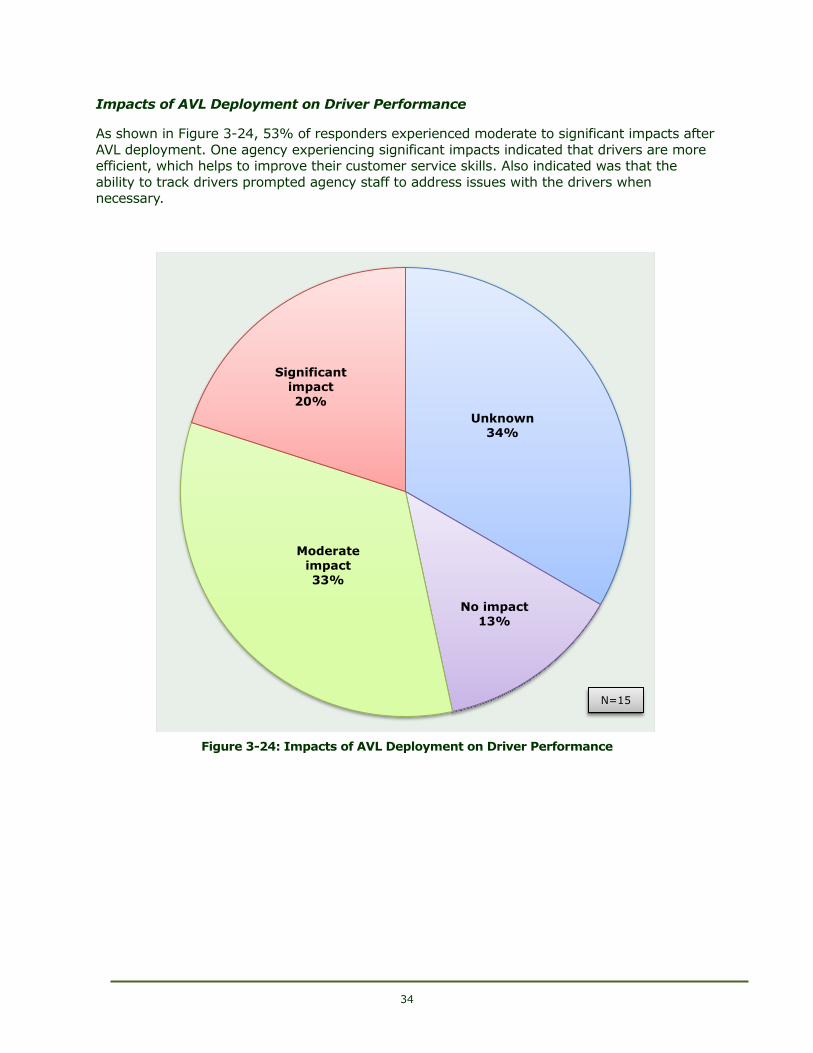
34
Impacts of AVL Deployment on Driver Performance
453BAs shown in Figure 3-24, 53% of responders experienced moderate to significant impacts after
AVL deployment. One agency experiencing significant impacts indicated that drivers are more efficient, which helps to improve their customer service skills. Also indicated was that the
ability to track drivers prompted agency staff to address issues with the drivers when necessary.
857B
710BFigure 3-24: Impacts of AVL Deployment on Driver Performance
Unknown 34%
No impact 13%
Moderate impact
33%
Significant impact
20%
N=15
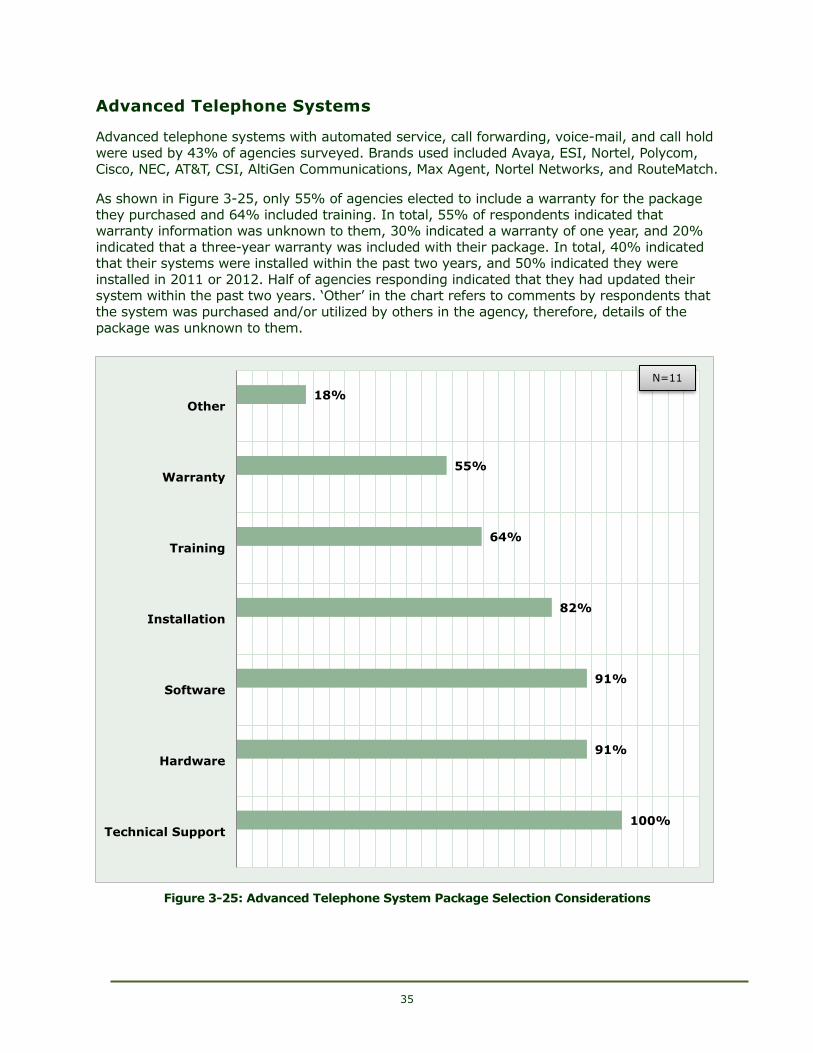
35
Advanced Telephone Systems
454BAdvanced telephone systems with automated service, call forwarding, voice-mail, and call hold
were used by 43% of agencies surveyed. Brands used included Avaya, ESI, Nortel, Polycom,
Cisco, NEC, AT&T, CSI, AltiGen Communications, Max Agent, Nortel Networks, and RouteMatch.
455BAs shown in Figure 3-25, only 55% of agencies elected to include a warranty for the package
they purchased and 64% included training. In total, 55% of respondents indicated that warranty information was unknown to them, 30% indicated a warranty of one year, and 20%
indicated that a three-year warranty was included with their package. In total, 40% indicated that their systems were installed within the past two years, and 50% indicated they were
installed in 2011 or 2012. Half of agencies responding indicated that they had updated their system within the past two years. ‘Other’ in the chart refers to comments by respondents that
the system was purchased and/or utilized by others in the agency, therefore, details of the
package was unknown to them.
858B
711BFigure 3-25: Advanced Telephone System Package Selection Considerations
100%
91%
91%
82%
64%
55%
18%
Technical Support
Hardware
Software
Installation
Training
Warranty
Other
N=11
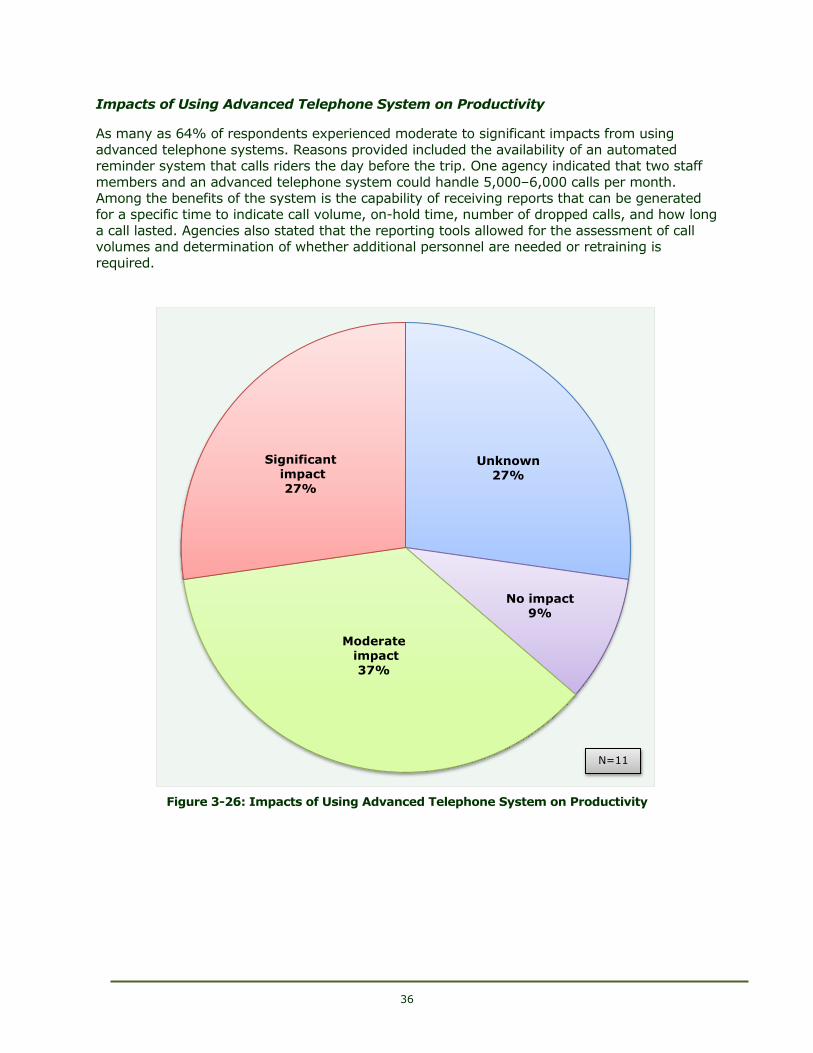
36
Impacts of Using Advanced Telephone System on Productivity
456BAs many as 64% of respondents experienced moderate to significant impacts from using
advanced telephone systems. Reasons provided included the availability of an automated reminder system that calls riders the day before the trip. One agency indicated that two staff
members and an advanced telephone system could handle 5,000–6,000 calls per month. Among the benefits of the system is the capability of receiving reports that can be generated
for a specific time to indicate call volume, on-hold time, number of dropped calls, and how long
a call lasted. Agencies also stated that the reporting tools allowed for the assessment of call volumes and determination of whether additional personnel are needed or retraining is
required.
859B
712BFigure 3-26: Impacts of Using Advanced Telephone System on Productivity
Unknown 27%
No impact 9%
Moderate impact
37%
Significant impact
27%
N=11
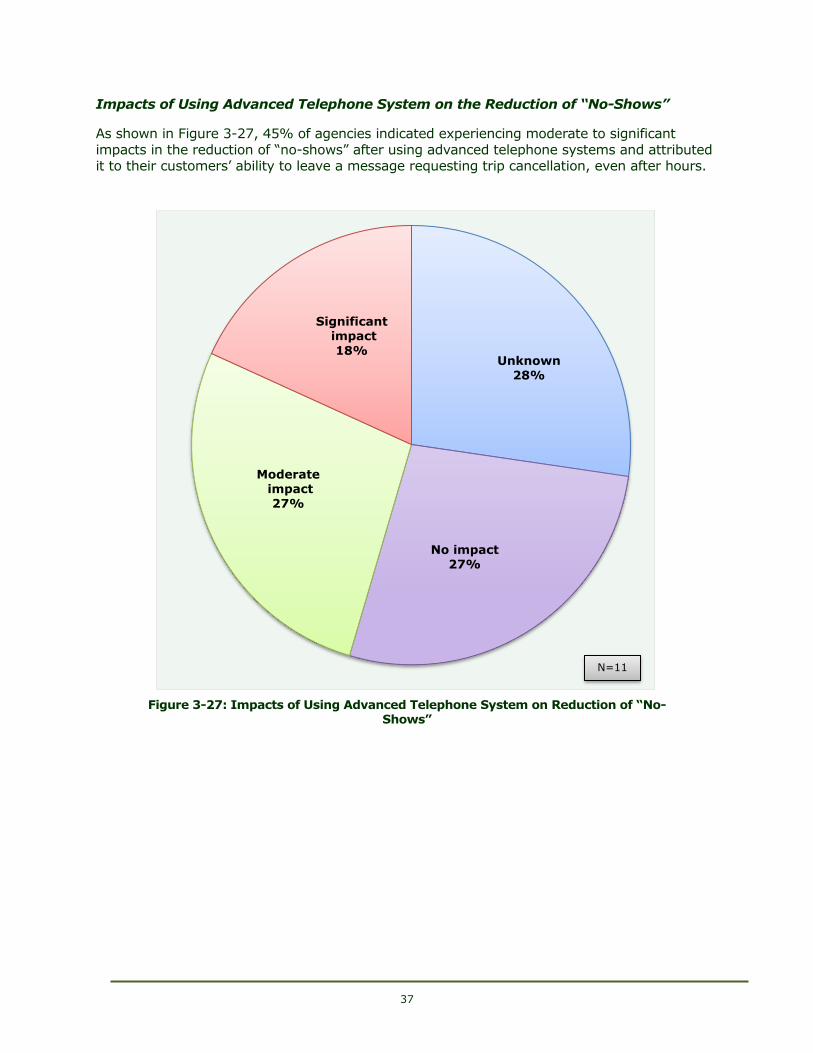
37
Impacts of Using Advanced Telephone System on the Reduction of “No-Shows”
457BAs shown in Figure 3-27, 45% of agencies indicated experiencing moderate to significant
impacts in the reduction of “no-shows” after using advanced telephone systems and attributed it to their customers’ ability to leave a message requesting trip cancellation, even after hours.
860B
713BFigure 3-27: Impacts of Using Advanced Telephone System on Reduction of “No-Shows”
Unknown 28%
No impact 27%
Moderate impact
27%
Significant impact
18%
N=11
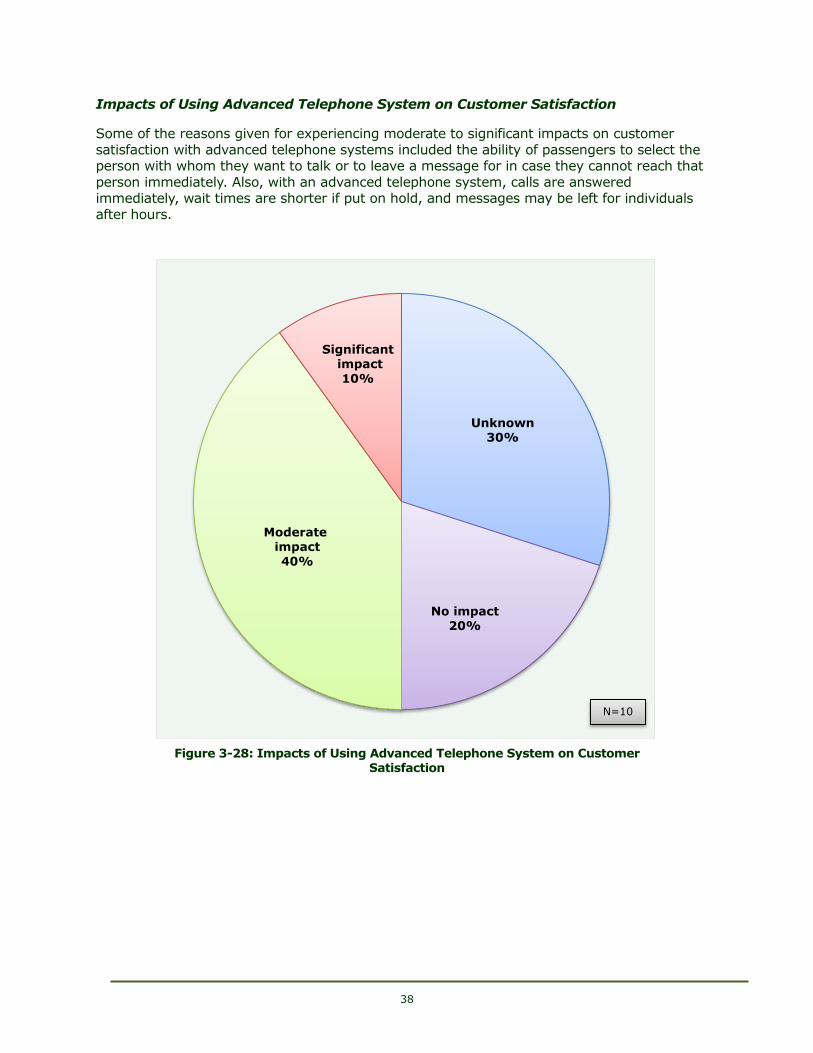
38
Impacts of Using Advanced Telephone System on Customer Satisfaction
458BSome of the reasons given for experiencing moderate to significant impacts on customer
satisfaction with advanced telephone systems included the ability of passengers to select the person with whom they want to talk or to leave a message for in case they cannot reach that
person immediately. Also, with an advanced telephone system, calls are answered immediately, wait times are shorter if put on hold, and messages may be left for individuals
after hours.
861B
714BFigure 3-28: Impacts of Using Advanced Telephone System on Customer Satisfaction
Unknown 30%
No impact 20%
Moderate impact
40%
Significant impact
10%
N=10
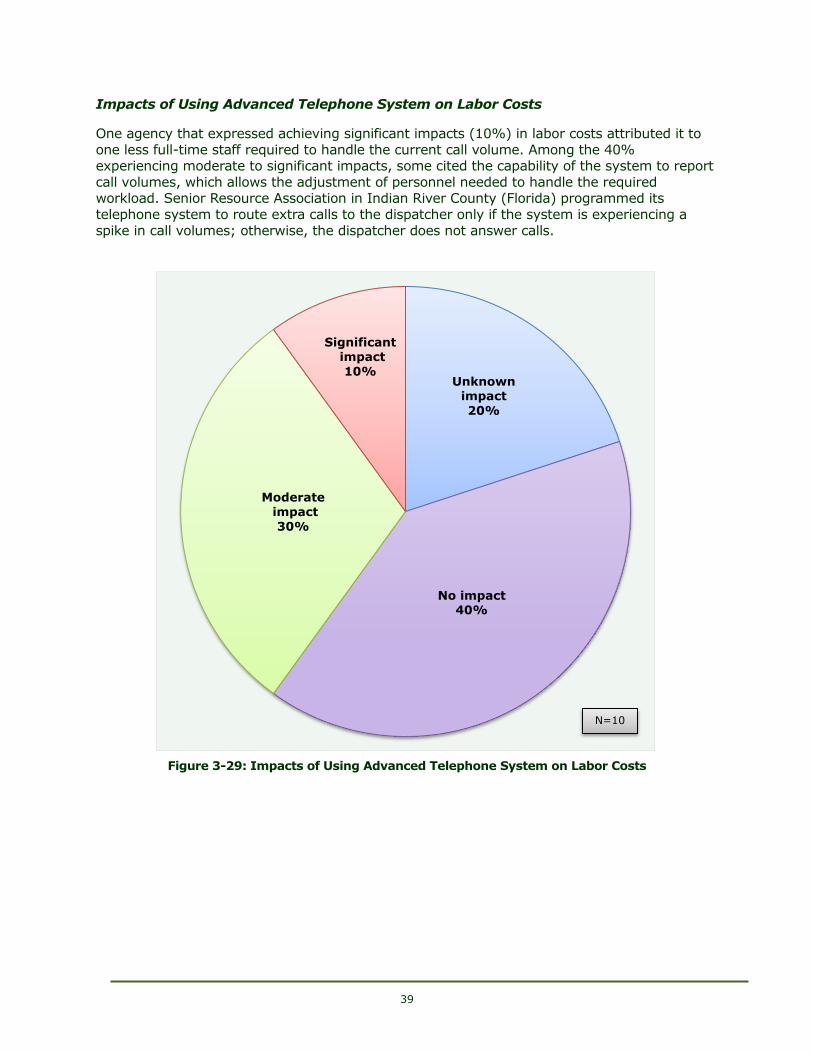
39
Impacts of Using Advanced Telephone System on Labor Costs
459BOne agency that expressed achieving significant impacts (10%) in labor costs attributed it to
one less full-time staff required to handle the current call volume. Among the 40% experiencing moderate to significant impacts, some cited the capability of the system to report
call volumes, which allows the adjustment of personnel needed to handle the required workload. Senior Resource Association in Indian River County (Florida) programmed its
telephone system to route extra calls to the dispatcher only if the system is experiencing a
spike in call volumes; otherwise, the dispatcher does not answer calls.
862B
715BFigure 3-29: Impacts of Using Advanced Telephone System on Labor Costs
Unknown impact
20%
No impact 40%
Moderate impact
30%
Significant impact
10%
N=10
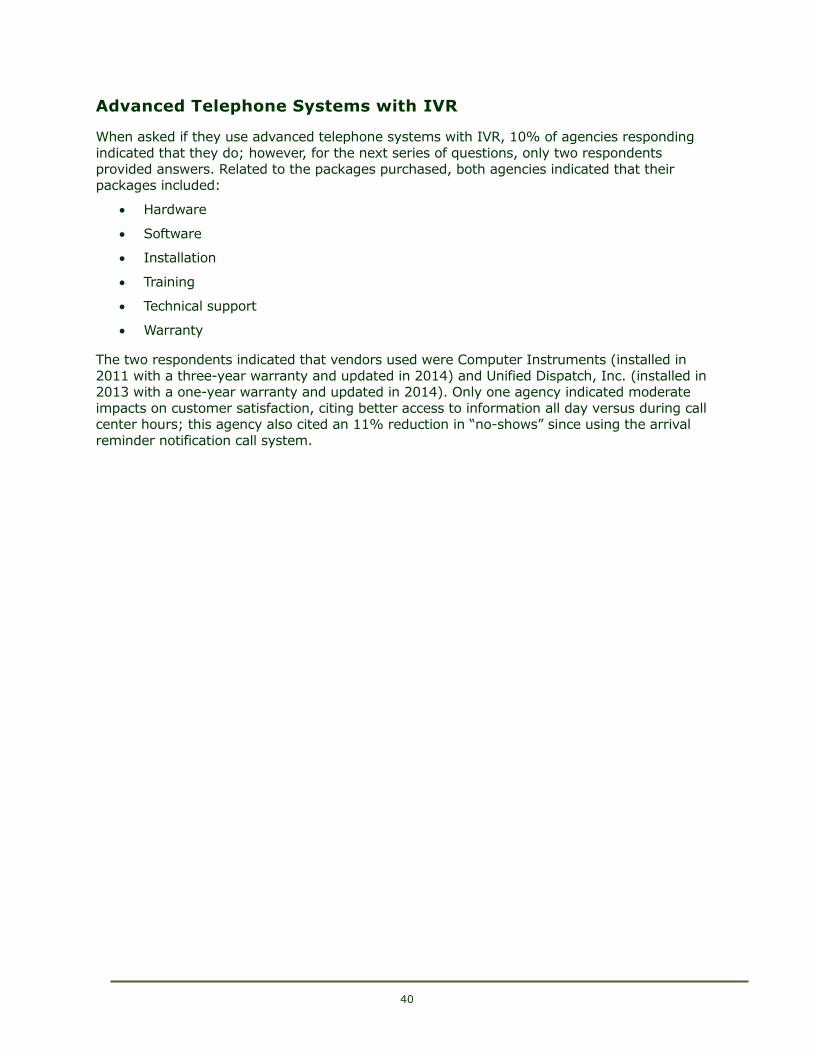
40
Advanced Telephone Systems with IVR
460BWhen asked if they use advanced telephone systems with IVR, 10% of agencies responding
indicated that they do; however, for the next series of questions, only two respondents
provided answers. Related to the packages purchased, both agencies indicated that their packages included:
617BHardware
618BSoftware
619BInstallation
620BTraining
621BTechnical support
622BWarranty
461BThe two respondents indicated that vendors used were Computer Instruments (installed in
2011 with a three-year warranty and updated in 2014) and Unified Dispatch, Inc. (installed in 2013 with a one-year warranty and updated in 2014). Only one agency indicated moderate
impacts on customer satisfaction, citing better access to information all day versus during call center hours; this agency also cited an 11% reduction in “no-shows” since using the arrival
reminder notification call system.
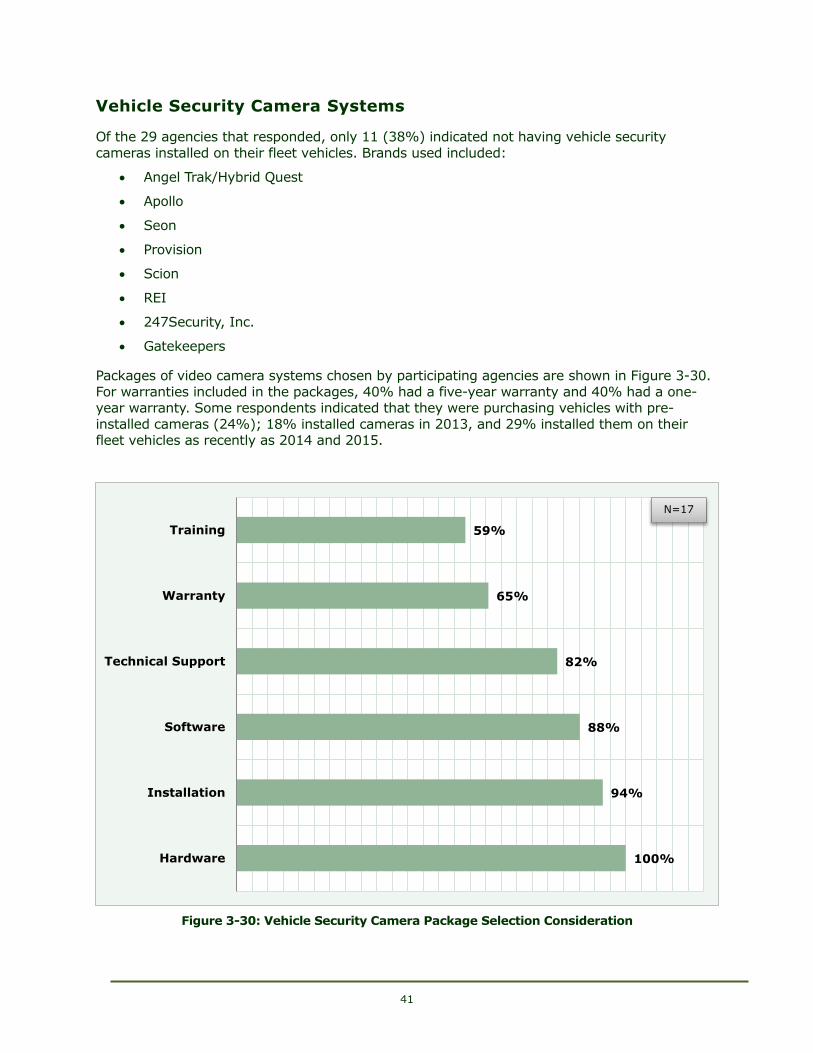
41
Vehicle Security Camera Systems
462BOf the 29 agencies that responded, only 11 (38%) indicated not having vehicle security
cameras installed on their fleet vehicles. Brands used included:
623BAngel Trak/Hybrid Quest
624BApollo
625BSeon
626BProvision
627BScion
628BREI
629B247Security, Inc.
630BGatekeepers
463BPackages of video camera systems chosen by participating agencies are shown in Figure 3-30.
For warranties included in the packages, 40% had a five-year warranty and 40% had a one-year warranty. Some respondents indicated that they were purchasing vehicles with pre-
installed cameras (24%); 18% installed cameras in 2013, and 29% installed them on their fleet vehicles as recently as 2014 and 2015.
863B
716BFigure 3-30: Vehicle Security Camera Package Selection Consideration
100%
94%
88%
82%
65%
59%
Hardware
Installation
Software
Technical Support
Warranty
Training
N=17
42
Impacts of Using Vehicle Security Camera Systems on Productivity or Performance
464BOne of the reasons indicated by respondents experiencing moderate to significant impacts
from using vehicle security cameras (44%) was the ability of the agency to resolve complaints in an efficient and timely manner. Security cameras also help make both passengers and
drivers feel safe and protect them from any false accusations in case of incidents inside or outside the vehicle.
864B
717BFigure 3-31: Impacts of using Vehicle Security Camera Systems on Productivity or Performance
Unknown 25%
No impact 31%
Moderate impact
19%
Significant impact
25%
N=16
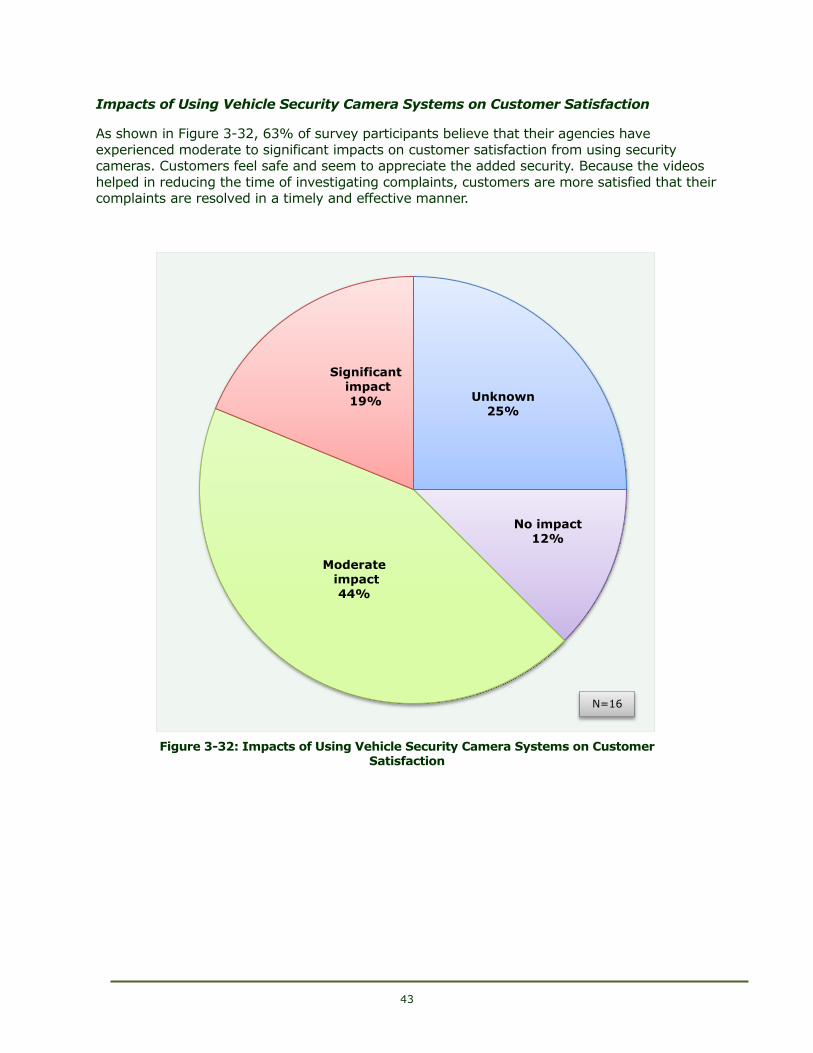
43
Impacts of Using Vehicle Security Camera Systems on Customer Satisfaction
465BAs shown in Figure 3-32, 63% of survey participants believe that their agencies have
experienced moderate to significant impacts on customer satisfaction from using security cameras. Customers feel safe and seem to appreciate the added security. Because the videos
helped in reducing the time of investigating complaints, customers are more satisfied that their complaints are resolved in a timely and effective manner.
865B
718BFigure 3-32: Impacts of Using Vehicle Security Camera Systems on Customer Satisfaction
Unknown 25%
No impact 12%
Moderate impact
44%
Significant impact
19%
N=16
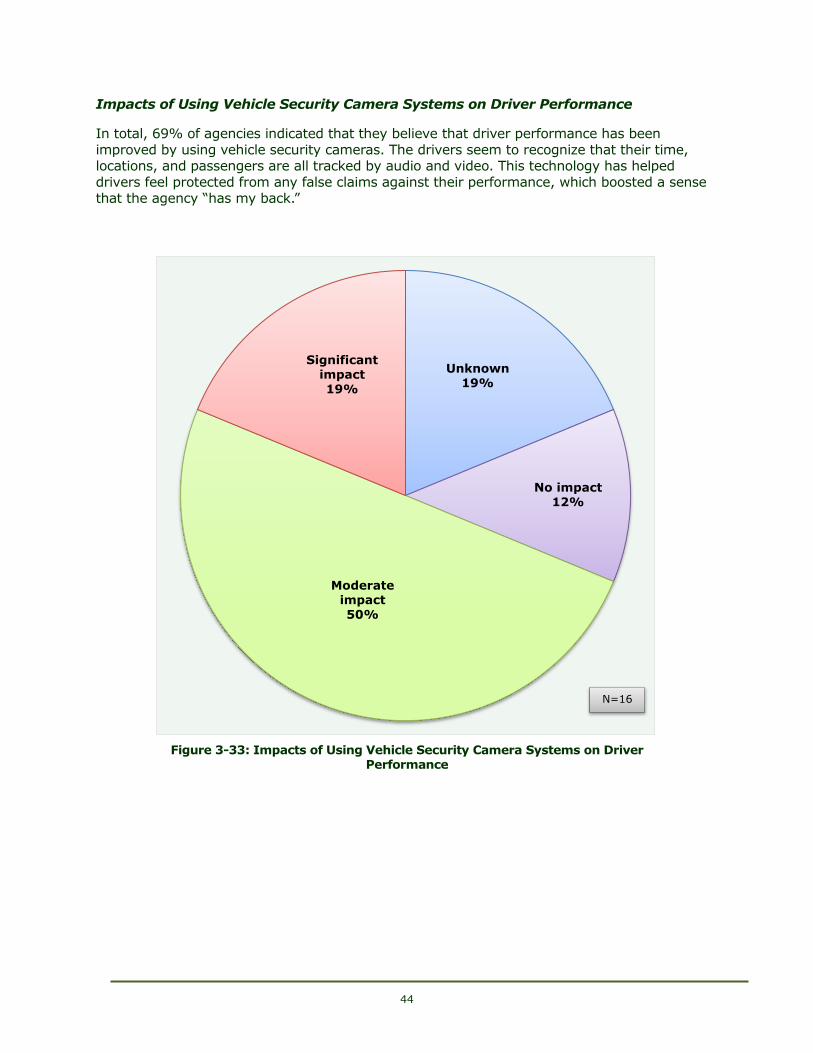
44
Impacts of Using Vehicle Security Camera Systems on Driver Performance
466BIn total, 69% of agencies indicated that they believe that driver performance has been
improved by using vehicle security cameras. The drivers seem to recognize that their time, locations, and passengers are all tracked by audio and video. This technology has helped
drivers feel protected from any false claims against their performance, which boosted a sense that the agency “has my back.”
866B
719BFigure 3-33: Impacts of Using Vehicle Security Camera Systems on Driver Performance
Unknown 19%
No impact
12%
Moderate impact
50%
Significant impact
19%
N=16
45
Chapter 4 - Case Examples and Lessons Learned
467BTo document helpful practices and lessons learned, seven Florida CTCs were selected for site visits at which in-person interviews were conducted.
Agencies Selected for Site Visits
468BThe methodology used to select agencies was based on distilling the survey responses from all
responding agencies and tabulating those that experienced moderate and/or significant
impacts from deploying each technology. Information for each of the technologies was developed that included the impacts on agency performance measures, as shown in Table 4-1.
469BSome technologies marked as “unknown” in the table were deployed after the survey was completed in February 2015. Site visits were conducted May 12-27, 2015; therefore,
comments from the site visits may reflect changes in the impacts noted in the survey. For example, Levy County Transit indicated the impact of vehicle security cameras as “unknown” in
the survey; however, the agency deployed vehicle security cameras after the survey was completed, and the discussion from the site visit reflects the positive impacts gained from that
technology deployment.
470BPerformance measures included productivity of the system, on-time performance, driver
performance, labor costs, and customer service. The research team selected agencies that indicated a minimum of three moderate to significant impacts on performance measures to
justify the site visit. Some agencies had more than three relevant performance measures, making the justification for a visit more compelling. The following systems were visited and are
listed in the order of visits conducted:
631BPasco County Public Transportation
632BCollier Area Transit
633BLiberty County Transit
634BLevy County Transit
635BLake County Public Transportation
636BSenior Resource Association, Indian River County
637BCouncil on Aging of St. Lucie County, Inc.
471BThe remainder of this chapter provides a summary of each of the seven transit agencies that
were visited. Each section reports on the following topics:
638BSystem information to facilitate peer comparison: agency information as reported to
the Florida CTD and excerpted from the 2014 Annual Performance Report of the Florida Commission for the Transportation Disadvantaged [28].
639BDescription of technology, costs, and funding sources
640BAgency-specific practices
641BTechnology benefits as experienced by the agency
642BLessons learned and tips for other agencies as recommended by responding agencies
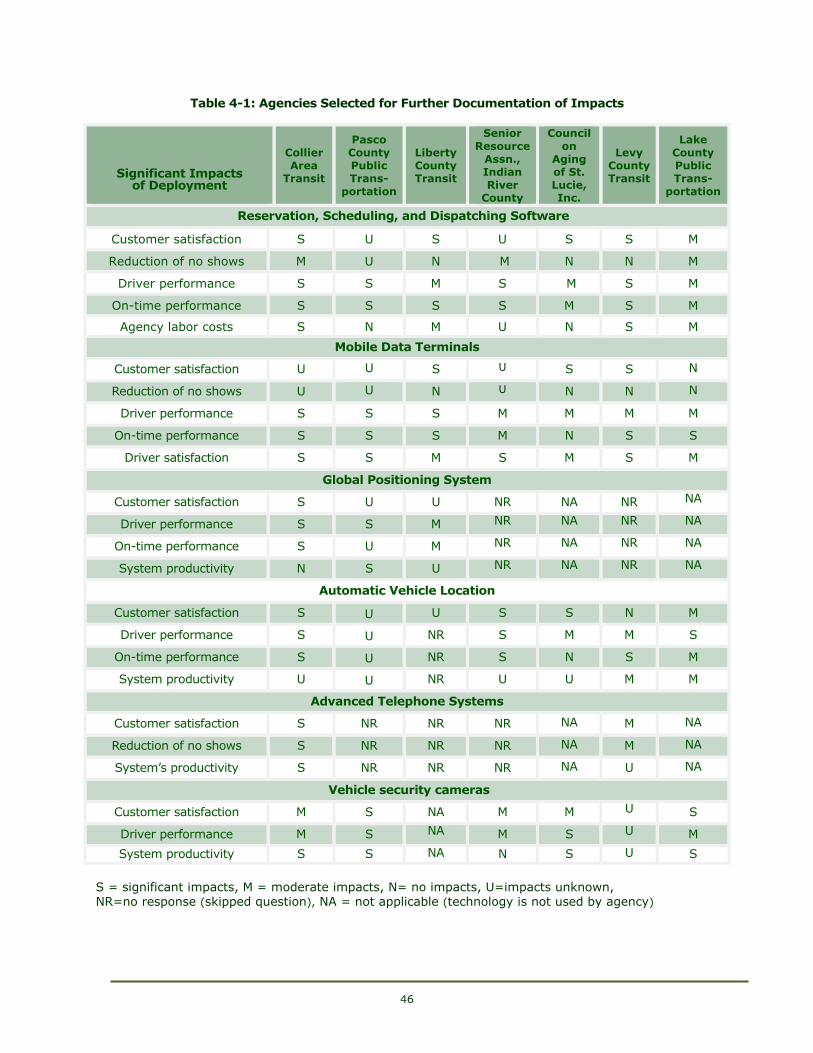
46
720BTable 4-1: Agencies Selected for Further Documentation of Impacts
Significant Impacts of Deployment
Collier
Area
Transit
Pasco
County
Public
Trans-
portation
Liberty
County
Transit
Senior
Resource
Assn.,
Indian
River
County
Council
on
Aging
of St.
Lucie,
Inc.
Levy
County
Transit
Lake
County
Public
Trans-
portation
Reservation, Scheduling, and Dispatching Software
Customer satisfaction S U S U S S M
Reduction of no shows M U N M N N M
Driver performance S S M S M S M
On-time performance S S S S M S M
Agency labor costs S N M U N S M
Mobile Data Terminals
Customer satisfaction U U S U S S N
Reduction of no shows U U N U N N N
Driver performance S S S M M M M
On-time performance S S S M N S S
Driver satisfaction S S M S M S M
Global Positioning System
Customer satisfaction S U U NR NA NR NA
Driver performance S S M NR NA NR NA
On-time performance S U M NR NA NR NA
System productivity N S U NR NA NR NA
Automatic Vehicle Location
Customer satisfaction S U U S S N M
Driver performance S U NR S M M S
On-time performance S U NR S N S M
System productivity U U NR U U M M
Advanced Telephone Systems
Customer satisfaction S NR NR NR NA M NA
Reduction of no shows S NR NR NR NA M NA
System’s productivity S NR NR NR NA U NA
Vehicle security cameras
Customer satisfaction M S NA M M U S
Driver performance M S NA M S U M
System productivity S S NA N S U S
867BS = significant impacts, M = moderate impacts, N= no impacts, U=impacts unknown, 868BNR=no response (skipped question), NA = not applicable (technology is not used by agency)
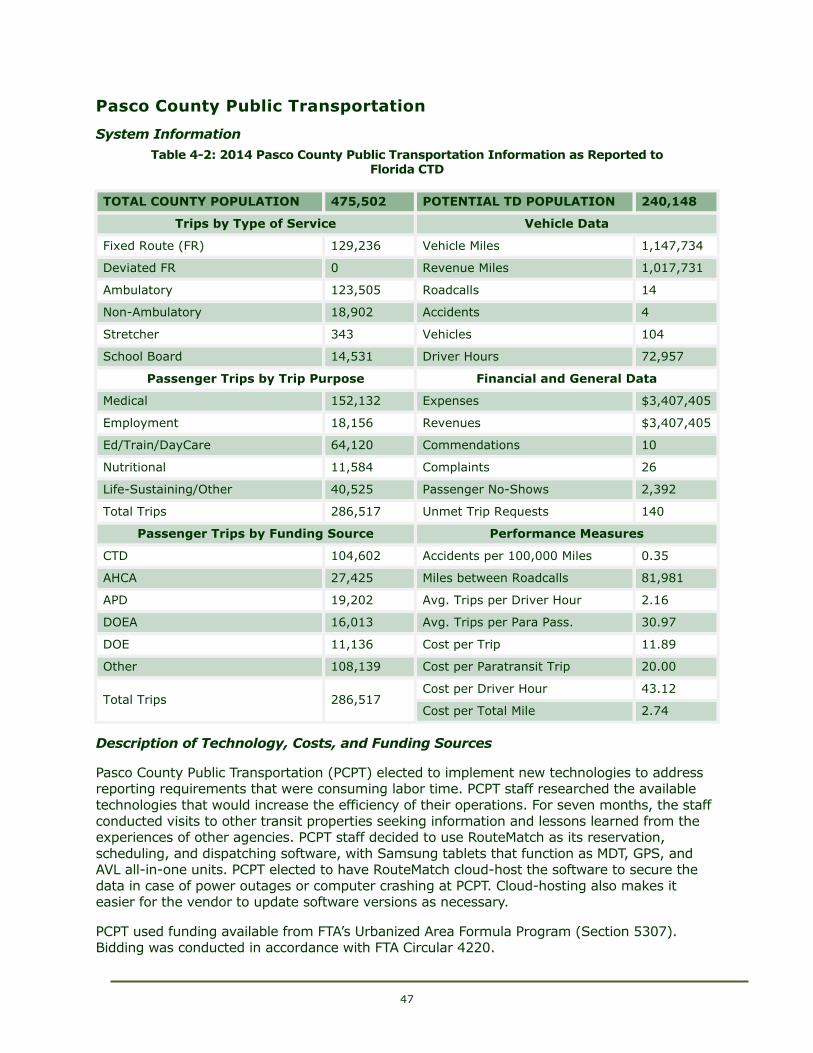
47
Pasco County Public Transportation
System Information
721BTable 4-2: 2014 Pasco County Public Transportation Information as Reported to Florida CTD
1107BTOTAL COUNTY POPULATION 1108B475,502 1109BPOTENTIAL TD POPULATION 1110B240,148
1111BTrips by Type of Service 1112BVehicle Data
1113BFixed Route (FR) 1114B129,236 1115BVehicle Miles 1116B1,147,734
1117BDeviated FR 1118B0 1119BRevenue Miles 1120B1,017,731
1121BAmbulatory 1122B123,505 1123BRoadcalls 1124B14
1125BNon-Ambulatory 1126B18,902 1127BAccidents 1128B4
1129BStretcher 1130B343 1131BVehicles 1132B104
1133BSchool Board 1134B14,531 1135BDriver Hours 1136B72,957
1137BPassenger Trips by Trip Purpose 1138BFinancial and General Data
1139BMedical 1140B152,132 1141BExpenses 1142B$3,407,405
1143BEmployment 1144B18,156 1145BRevenues 1146B$3,407,405
1147BEd/Train/DayCare 1148B64,120 1149BCommendations 1150B10
1151BNutritional 1152B11,584 1153BComplaints 1154B26
1155BLife-Sustaining/Other 1156B40,525 1157BPassenger No-Shows 1158B2,392
1159BTotal Trips 1160B286,517 1161BUnmet Trip Requests 1162B140
1163BPassenger Trips by Funding Source 1164BPerformance Measures
1165BCTD 1166B104,602 1167BAccidents per 100,000 Miles 1168B0.35
1169BAHCA 1170B27,425 1171BMiles between Roadcalls 1172B81,981
1173BAPD 1174B19,202 1175BAvg. Trips per Driver Hour 1176B2.16
1177BDOEA 1178B16,013 1179BAvg. Trips per Para Pass. 1180B30.97
1181BDOE 1182B11,136 1183BCost per Trip 1184B11.89
1185BOther 1186B108,139 1187BCost per Paratransit Trip 1188B20.00
1189BTotal Trips 1190B286,517 1191BCost per Driver Hour 1192B43.12
1193BCost per Total Mile 1194B2.74
Description of Technology, Costs, and Funding Sources
472BPasco County Public Transportation (PCPT) elected to implement new technologies to address reporting requirements that were consuming labor time. PCPT staff researched the available
technologies that would increase the efficiency of their operations. For seven months, the staff
conducted visits to other transit properties seeking information and lessons learned from the experiences of other agencies. PCPT staff decided to use RouteMatch as its reservation,
scheduling, and dispatching software, with Samsung tablets that function as MDT, GPS, and AVL all-in-one units. PCPT elected to have RouteMatch cloud-host the software to secure the
data in case of power outages or computer crashing at PCPT. Cloud-hosting also makes it easier for the vendor to update software versions as necessary.
473BPCPT used funding available from FTA’s Urbanized Area Formula Program (Section 5307). Bidding was conducted in accordance with FTA Circular 4220.
48
474BReservation, scheduling, and dispatching software costs $605,000 for the entire system of
software and tablets on 48 vehicles, procured in February 2015.
475BVehicle security camera systems from Apollo were installed on the fleet of both fixed-route and paratransit vehicles for $175,000 in 2011 in a package that included a one-year warranty in
addition to technical support and training.
Agency-Specific Practices
476BA vehicle odometer reading is a means of reporting and invoicing for an agency. If the
odometer reporting is incorrect, the dispatcher can correct that information with data provided from RouteMatch reports. Mileage is reset every time a driver logs into the MDT. The driver
completes the manifest log at each customer drop-off and at the property yard when the driver logs off at the end of a shift.
477BPCPT riders are familiar with drivers, so it is an agency practice to keep the same drivers on the same routes. There is a community feeling within this agency, and the particular needs of
the riders are considered when scheduling and taking their trips.
478BRouteMatch was deemed to be the appropriate vendor by PCPT because it is equipped to accommodate the future needs of the agency as the county experiences growth.
Technology Benefits as Experienced by the Agency
479BVehicle security cameras are beneficial in conflict mitigation to confirm a customer complaint,
correct driver behavior if needed, or substantiate that procedures were followed and a
complaint was unfounded. Videos are not a live feed, but they can be obtained from the computer hard drive upon request.
480BPCPT staff reported being pleasantly surprised that the presence of cameras prompted riders not to litter.
481BThe improved efficiency of scheduling and routing was realized in a relatively short time after
deployment of the RouteMatch reservation and scheduling services and MDT tablets. On the demand response side, PCPT reported 25% more trips being accommodated with the new
technology, indicating a 25% increase in driver productivity. PCPT staff reported a reduction in errors in finding customer locations with the use of the electronic manifest that includes turn-
by-turn GPS navigation.
482BPCPT noted the benefits of less paperwork, as updates are received instantly, thus reducing
errors between dispatchers and operators. Also, the agency experienced time reductions in creating required reports, as the process of manually retrieving the essential portions of a
report from different fields in the old system was labor-intensive.
483BRouteMatch included a safety feature in its programming of the tablet that locks the screen
while a vehicle is in motion; however, a message from the dispatcher can be viewed on the screen while the vehicle is moving. The driver can send messages or provide pick-up/drop-off
reporting only when the vehicle is parked.
Lessons Learned and Tips for Other Agencies
484BPCPT recommended the following:
643BTake time to involve all staff before selecting the specifications of a proposed system. In
many instances, although upper management is aware of the nature of tasks conducted by employees on a daily basis, the intricate details of these tasks are familiar mostly to
49
those who are performing them. Some reporting tasks are comprehensive and require
an exhaustive amount of data. Make sure these data needs and the fields needed to develop the reports are described in the specifications.
644BTake time to describe the agency’s data needs to the vendor before it develops the agency package rather than customize the needed requirements after the system is in
place, which also can incur additional costs for the agency.
645BTraining is vital to the success of the transition between old and new systems.
Transitioning to a new system can be challenging, so do not rush the system “going live” after deployment. Make sure the vendor is readily available as the transition
occurs to work out any glitches. Even if the system seems ready to go live as soon as
installation is complete, be sure that all staff members are comfortable with the new technology and that all glitches occurring in the pilot phase of the deployment are
worked out. PCPT piloted the new system with 10 vehicles to work out any problems before going live.
646BPCPT staff strongly recommend that the old and new systems work simultaneously for at least a month before disconnecting the old system to ensure that no reporting or
billing are missed during the transitioning phase.
647BEmphasize the long-term benefits that will be realized after the system is smoothly
running and all the bugs are worked out. Efficiency and on-time performance will be realized when route schedules are maximized; the productivity of operators may even
double when all are on-board with the new system in place.
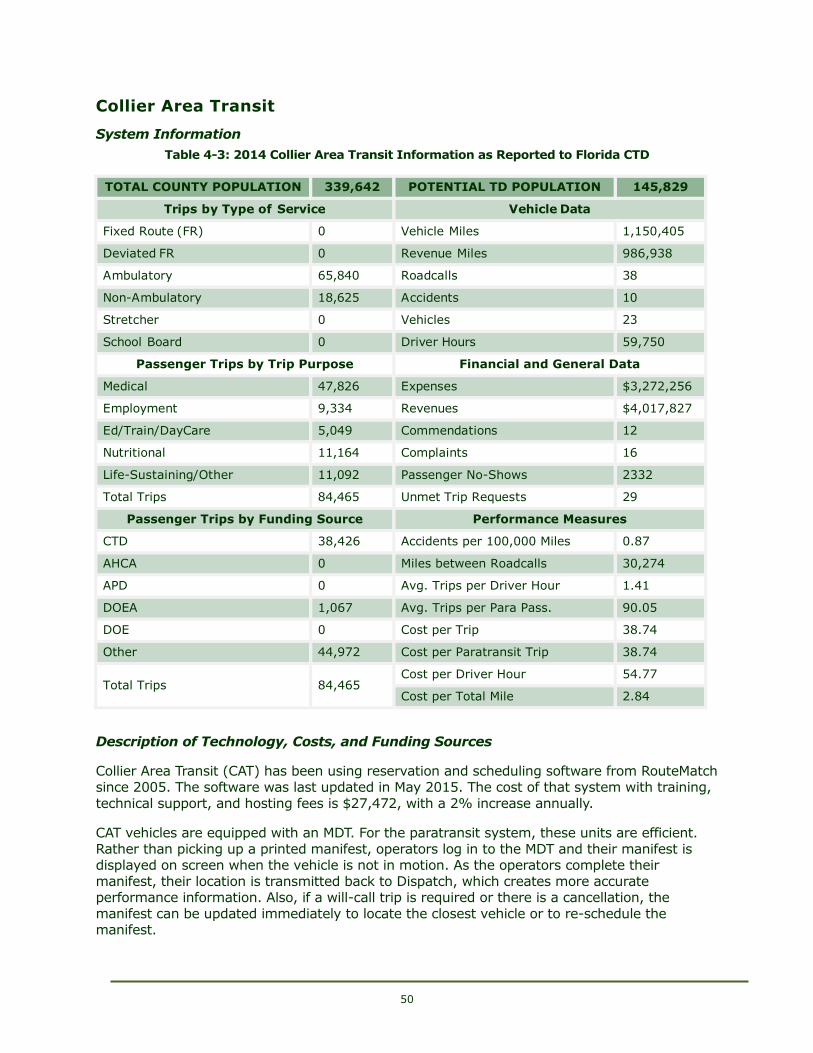
50
Collier Area Transit
System Information
722BTable 4-3: 2014 Collier Area Transit Information as Reported to Florida CTD
1195BTOTAL COUNTY POPULATION 1196B339,642 1197BPOTENTIAL TD POPULATION 1198B145,829
1199BTrips by Type of Service 1200BVehicle Data
1201BFixed Route (FR) 1202B0 1203BVehicle Miles 1204B1,150,405
1205BDeviated FR 1206B0 1207BRevenue Miles 1208B986,938
1209BAmbulatory 1210B65,840 1211BRoadcalls 1212B38
1213BNon-Ambulatory 1214B18,625 1215BAccidents 1216B10
1217BStretcher 1218B0 1219BVehicles 1220B23
1221BSchool Board 1222B0 1223BDriver Hours 1224B59,750
1225BPassenger Trips by Trip Purpose 1226BFinancial and General Data
1227BMedical 1228B47,826 1229BExpenses 1230B$3,272,256
1231BEmployment 1232B9,334 1233BRevenues 1234B$4,017,827
1235BEd/Train/DayCare 1236B5,049 1237BCommendations 1238B12
1239BNutritional 1240B11,164 1241BComplaints 1242B16
1243BLife-Sustaining/Other 1244B11,092 1245BPassenger No-Shows 1246B2332
1247BTotal Trips 1248B84,465 1249BUnmet Trip Requests 1250B29
1251BPassenger Trips by Funding Source 1252BPerformance Measures
1253BCTD 1254B38,426 1255BAccidents per 100,000 Miles 1256B0.87
1257BAHCA 1258B0 1259BMiles between Roadcalls 1260B30,274
1261BAPD 1262B0 1263BAvg. Trips per Driver Hour 1264B1.41
1265BDOEA 1266B1,067 1267BAvg. Trips per Para Pass. 1268B90.05
1269BDOE 1270B0 1271BCost per Trip 1272B38.74
1273BOther 1274B44,972 1275BCost per Paratransit Trip 1276B38.74
1277BTotal Trips 1278B84,465 1279BCost per Driver Hour 1280B54.77
1281BCost per Total Mile 1282B2.84
Description of Technology, Costs, and Funding Sources
485BCollier Area Transit (CAT) has been using reservation and scheduling software from RouteMatch
since 2005. The software was last updated in May 2015. The cost of that system with training,
technical support, and hosting fees is $27,472, with a 2% increase annually.
486BCAT vehicles are equipped with an MDT. For the paratransit system, these units are efficient.
Rather than picking up a printed manifest, operators log in to the MDT and their manifest is displayed on screen when the vehicle is not in motion. As the operators complete their
manifest, their location is transmitted back to Dispatch, which creates more accurate performance information. Also, if a will-call trip is required or there is a cancellation, the
manifest can be updated immediately to locate the closest vehicle or to re-schedule the manifest.
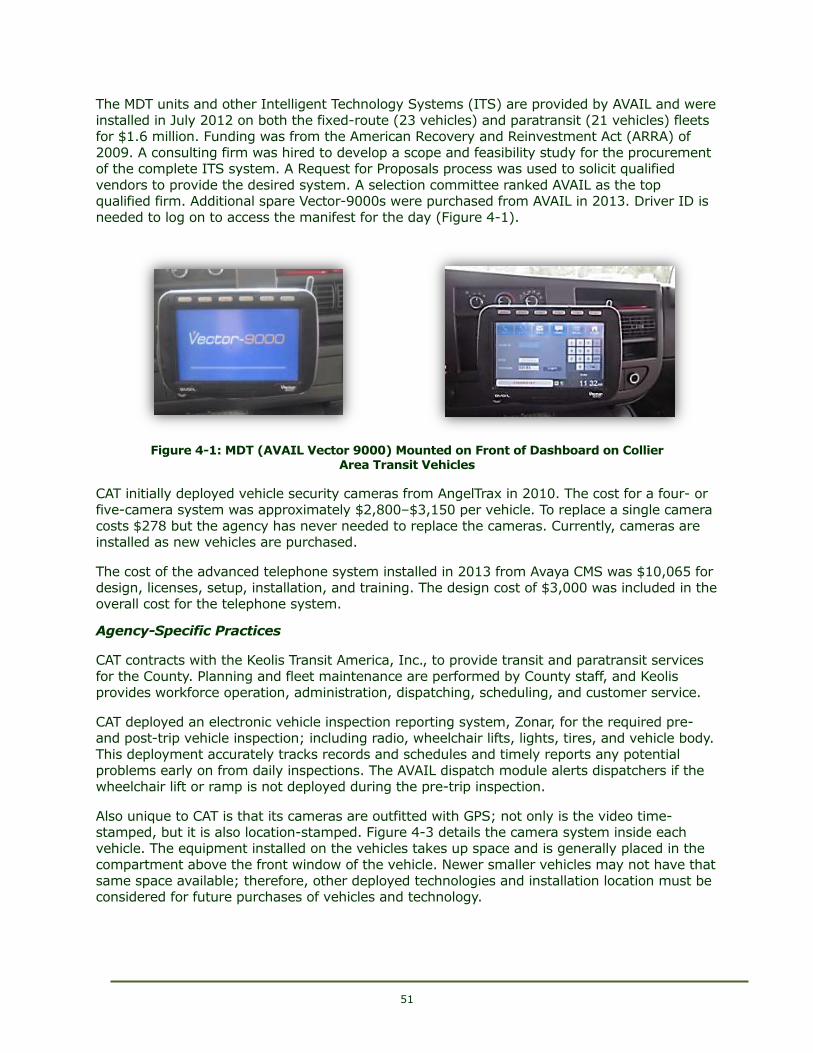
51
487BThe MDT units and other Intelligent Technology Systems (ITS) are provided by AVAIL and were
installed in July 2012 on both the fixed-route (23 vehicles) and paratransit (21 vehicles) fleets for $1.6 million. Funding was from the American Recovery and Reinvestment Act (ARRA) of
2009. A consulting firm was hired to develop a scope and feasibility study for the procurement of the complete ITS system. A Request for Proposals process was used to solicit qualified
vendors to provide the desired system. A selection committee ranked AVAIL as the top qualified firm. Additional spare Vector-9000s were purchased from AVAIL in 2013. Driver ID is
needed to log on to access the manifest for the day (Figure 4-1).
723BFigure 4-1: MDT (AVAIL Vector 9000) Mounted on Front of Dashboard on Collier Area Transit Vehicles
488BCAT initially deployed vehicle security cameras from AngelTrax in 2010. The cost for a four- or
five-camera system was approximately $2,800–$3,150 per vehicle. To replace a single camera
costs $278 but the agency has never needed to replace the cameras. Currently, cameras are installed as new vehicles are purchased.
489BThe cost of the advanced telephone system installed in 2013 from Avaya CMS was $10,065 for design, licenses, setup, installation, and training. The design cost of $3,000 was included in the overall cost for the telephone system.
Agency-Specific Practices
490BCAT contracts with the Keolis Transit America, Inc., to provide transit and paratransit services
for the County. Planning and fleet maintenance are performed by County staff, and Keolis
provides workforce operation, administration, dispatching, scheduling, and customer service.
491BCAT deployed an electronic vehicle inspection reporting system, Zonar, for the required pre- and post-trip vehicle inspection; including radio, wheelchair lifts, lights, tires, and vehicle body.
This deployment accurately tracks records and schedules and timely reports any potential
problems early on from daily inspections. The AVAIL dispatch module alerts dispatchers if the wheelchair lift or ramp is not deployed during the pre-trip inspection.
492BAlso unique to CAT is that its cameras are outfitted with GPS; not only is the video time-stamped, but it is also location-stamped. Figure 4-3 details the camera system inside each vehicle. The equipment installed on the vehicles takes up space and is generally placed in the
compartment above the front window of the vehicle. Newer smaller vehicles may not have that
same space available; therefore, other deployed technologies and installation location must be considered for future purchases of vehicles and technology.
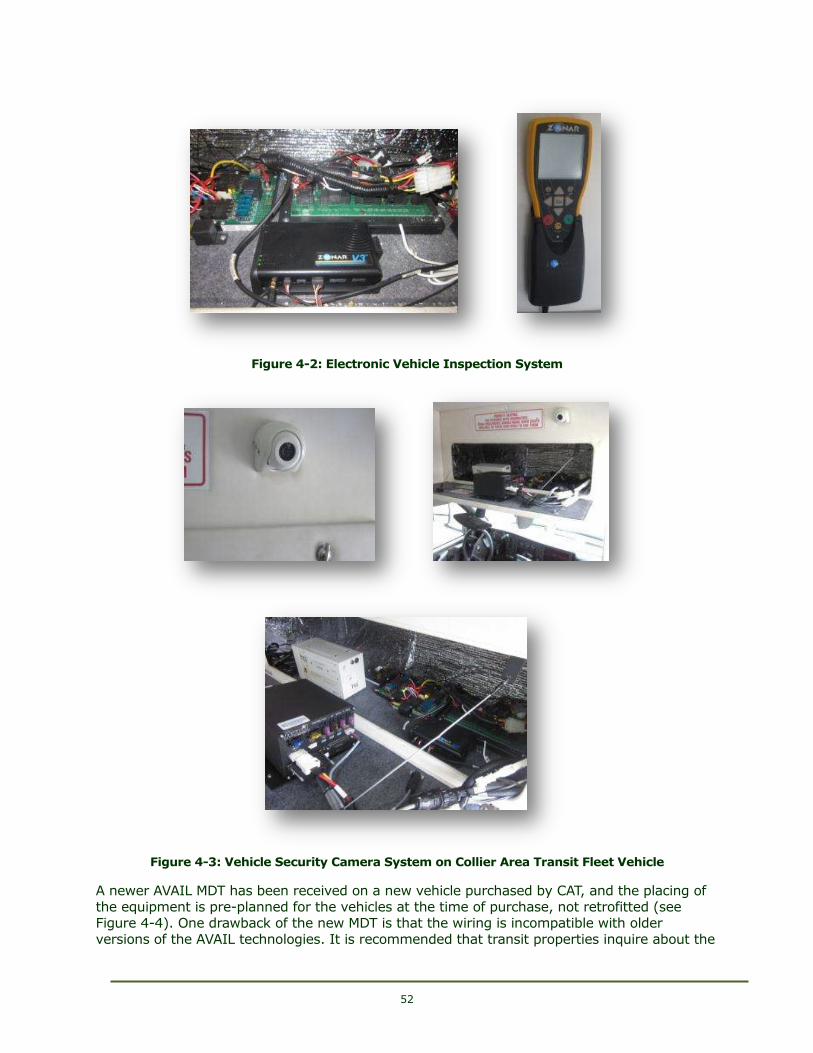
52
869B
724BFigure 4-2: Electronic Vehicle Inspection System
870B
725BFigure 4-3: Vehicle Security Camera System on Collier Area Transit Fleet Vehicle
493BA newer AVAIL MDT has been received on a new vehicle purchased by CAT, and the placing of
the equipment is pre-planned for the vehicles at the time of purchase, not retrofitted (see Figure 4-4). One drawback of the new MDT is that the wiring is incompatible with older
versions of the AVAIL technologies. It is recommended that transit properties inquire about the
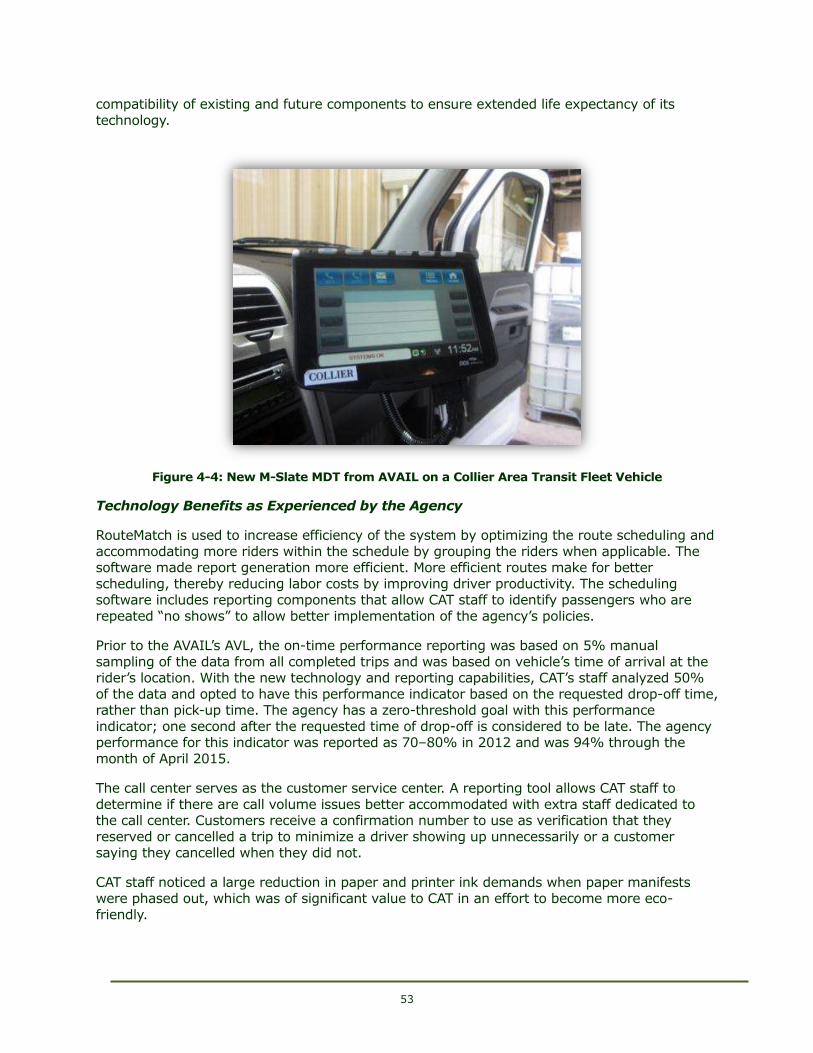
53
compatibility of existing and future components to ensure extended life expectancy of its
technology.
871B
726BFigure 4-4: New M-Slate MDT from AVAIL on a Collier Area Transit Fleet Vehicle
Technology Benefits as Experienced by the Agency
494BRouteMatch is used to increase efficiency of the system by optimizing the route scheduling and
accommodating more riders within the schedule by grouping the riders when applicable. The software made report generation more efficient. More efficient routes make for better
scheduling, thereby reducing labor costs by improving driver productivity. The scheduling software includes reporting components that allow CAT staff to identify passengers who are
repeated “no shows” to allow better implementation of the agency’s policies.
495BPrior to the AVAIL’s AVL, the on-time performance reporting was based on 5% manual
sampling of the data from all completed trips and was based on vehicle’s time of arrival at the rider’s location. With the new technology and reporting capabilities, CAT’s staff analyzed 50%
of the data and opted to have this performance indicator based on the requested drop-off time, rather than pick-up time. The agency has a zero-threshold goal with this performance
indicator; one second after the requested time of drop-off is considered to be late. The agency performance for this indicator was reported as 70–80% in 2012 and was 94% through the
month of April 2015.
496BThe call center serves as the customer service center. A reporting tool allows CAT staff to
determine if there are call volume issues better accommodated with extra staff dedicated to the call center. Customers receive a confirmation number to use as verification that they
reserved or cancelled a trip to minimize a driver showing up unnecessarily or a customer saying they cancelled when they did not.
497BCAT staff noticed a large reduction in paper and printer ink demands when paper manifests were phased out, which was of significant value to CAT in an effort to become more eco-
friendly.
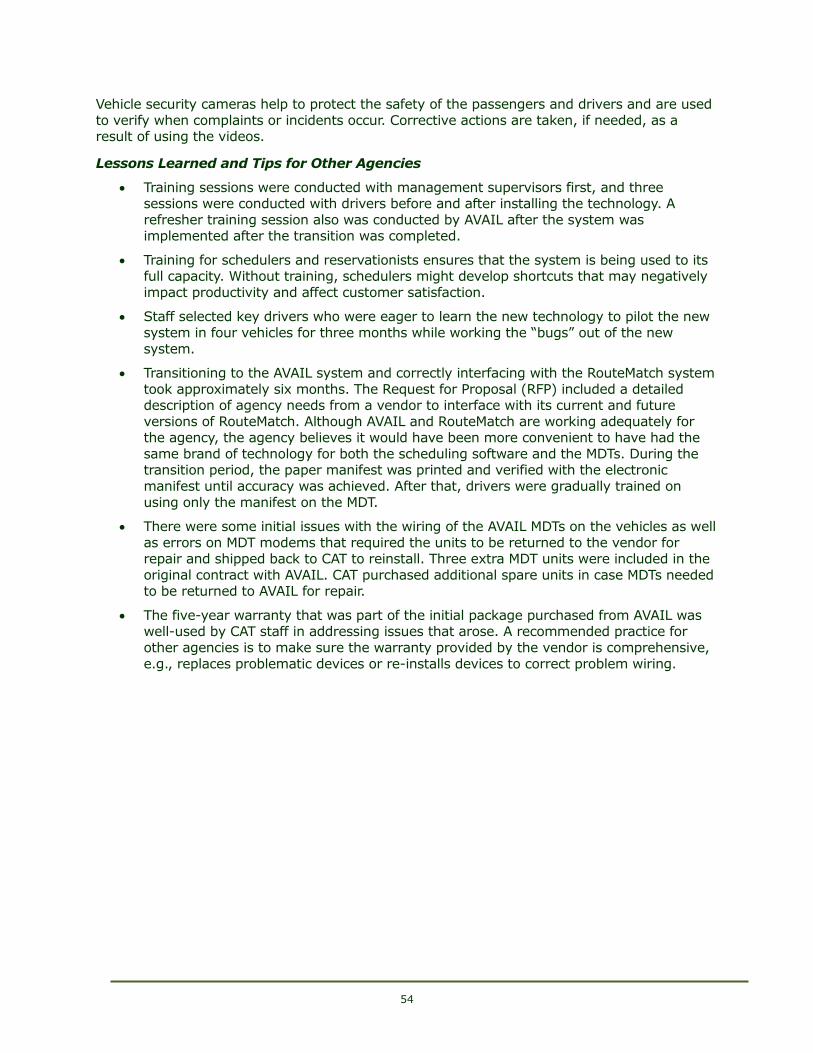
54
498BVehicle security cameras help to protect the safety of the passengers and drivers and are used
to verify when complaints or incidents occur. Corrective actions are taken, if needed, as a result of using the videos.
Lessons Learned and Tips for Other Agencies
648BTraining sessions were conducted with management supervisors first, and three sessions were conducted with drivers before and after installing the technology. A
refresher training session also was conducted by AVAIL after the system was implemented after the transition was completed.
649BTraining for schedulers and reservationists ensures that the system is being used to its full capacity. Without training, schedulers might develop shortcuts that may negatively
impact productivity and affect customer satisfaction.
650BStaff selected key drivers who were eager to learn the new technology to pilot the new
system in four vehicles for three months while working the “bugs” out of the new
system.
651BTransitioning to the AVAIL system and correctly interfacing with the RouteMatch system
took approximately six months. The Request for Proposal (RFP) included a detailed description of agency needs from a vendor to interface with its current and future
versions of RouteMatch. Although AVAIL and RouteMatch are working adequately for the agency, the agency believes it would have been more convenient to have had the
same brand of technology for both the scheduling software and the MDTs. During the transition period, the paper manifest was printed and verified with the electronic
manifest until accuracy was achieved. After that, drivers were gradually trained on
using only the manifest on the MDT.
652BThere were some initial issues with the wiring of the AVAIL MDTs on the vehicles as well
as errors on MDT modems that required the units to be returned to the vendor for repair and shipped back to CAT to reinstall. Three extra MDT units were included in the
original contract with AVAIL. CAT purchased additional spare units in case MDTs needed to be returned to AVAIL for repair.
653BThe five-year warranty that was part of the initial package purchased from AVAIL was well-used by CAT staff in addressing issues that arose. A recommended practice for
other agencies is to make sure the warranty provided by the vendor is comprehensive,
e.g., replaces problematic devices or re-installs devices to correct problem wiring.
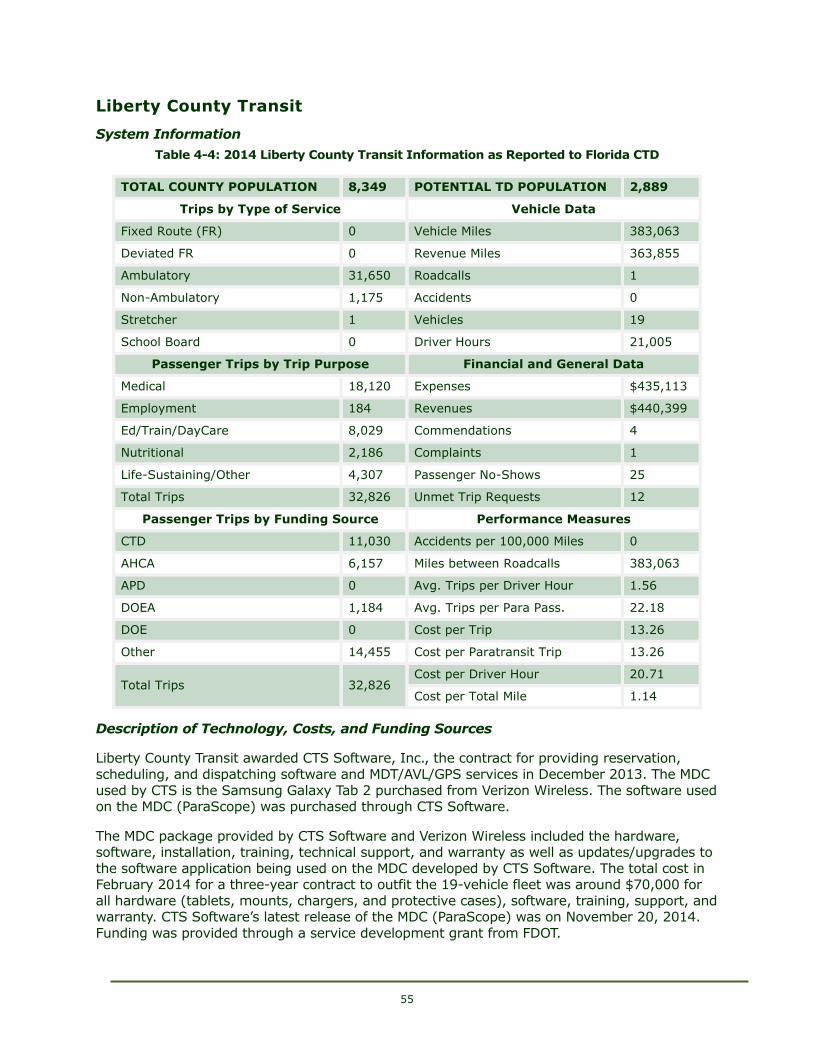
55
Liberty County Transit
System Information
727BTable 4-4: 2014 Liberty County Transit Information as Reported to Florida CTD
1283BTOTAL COUNTY POPULATION 1284B8,349 1285BPOTENTIAL TD POPULATION 1286B2,889
1287BTrips by Type of Service 1288BVehicle Data
1289BFixed Route (FR) 1290B0 1291BVehicle Miles 1292B383,063
1293BDeviated FR 1294B0 1295BRevenue Miles 1296B363,855
1297BAmbulatory 1298B31,650 1299BRoadcalls 1300B1
1301BNon-Ambulatory 1302B1,175 1303BAccidents 1304B0
1305BStretcher 1306B1 1307BVehicles 1308B19
1309BSchool Board 1310B0 1311BDriver Hours 1312B21,005
1313BPassenger Trips by Trip Purpose 1314BFinancial and General Data
1315BMedical 1316B18,120 1317BExpenses 1318B$435,113
1319BEmployment 1320B184 1321BRevenues 1322B$440,399
1323BEd/Train/DayCare 1324B8,029 1325BCommendations 1326B4
1327BNutritional 1328B2,186 1329BComplaints 1330B1
1331BLife-Sustaining/Other 1332B4,307 1333BPassenger No-Shows 1334B25
1335BTotal Trips 1336B32,826 1337BUnmet Trip Requests 1338B12
1339BPassenger Trips by Funding Source 1340BPerformance Measures
1341BCTD 1342B11,030 1343BAccidents per 100,000 Miles 1344B0
1345BAHCA 1346B6,157 1347BMiles between Roadcalls 1348B383,063
1349BAPD 1350B0 1351BAvg. Trips per Driver Hour 1352B1.56
1353BDOEA 1354B1,184 1355BAvg. Trips per Para Pass. 1356B22.18
1357BDOE 1358B0 1359BCost per Trip 1360B13.26
1361BOther 1362B14,455 1363BCost per Paratransit Trip 1364B13.26
1365BTotal Trips 1366B32,826 1367BCost per Driver Hour 1368B20.71
1369BCost per Total Mile 1370B1.14
Description of Technology, Costs, and Funding Sources
499BLiberty County Transit awarded CTS Software, Inc., the contract for providing reservation,
scheduling, and dispatching software and MDT/AVL/GPS services in December 2013. The MDC
used by CTS is the Samsung Galaxy Tab 2 purchased from Verizon Wireless. The software used on the MDC (ParaScope) was purchased through CTS Software.
500BThe MDC package provided by CTS Software and Verizon Wireless included the hardware, software, installation, training, technical support, and warranty as well as updates/upgrades to
the software application being used on the MDC developed by CTS Software. The total cost in February 2014 for a three-year contract to outfit the 19-vehicle fleet was around $70,000 for
all hardware (tablets, mounts, chargers, and protective cases), software, training, support, and warranty. CTS Software’s latest release of the MDC (ParaScope) was on November 20, 2014.
Funding was provided through a service development grant from FDOT.
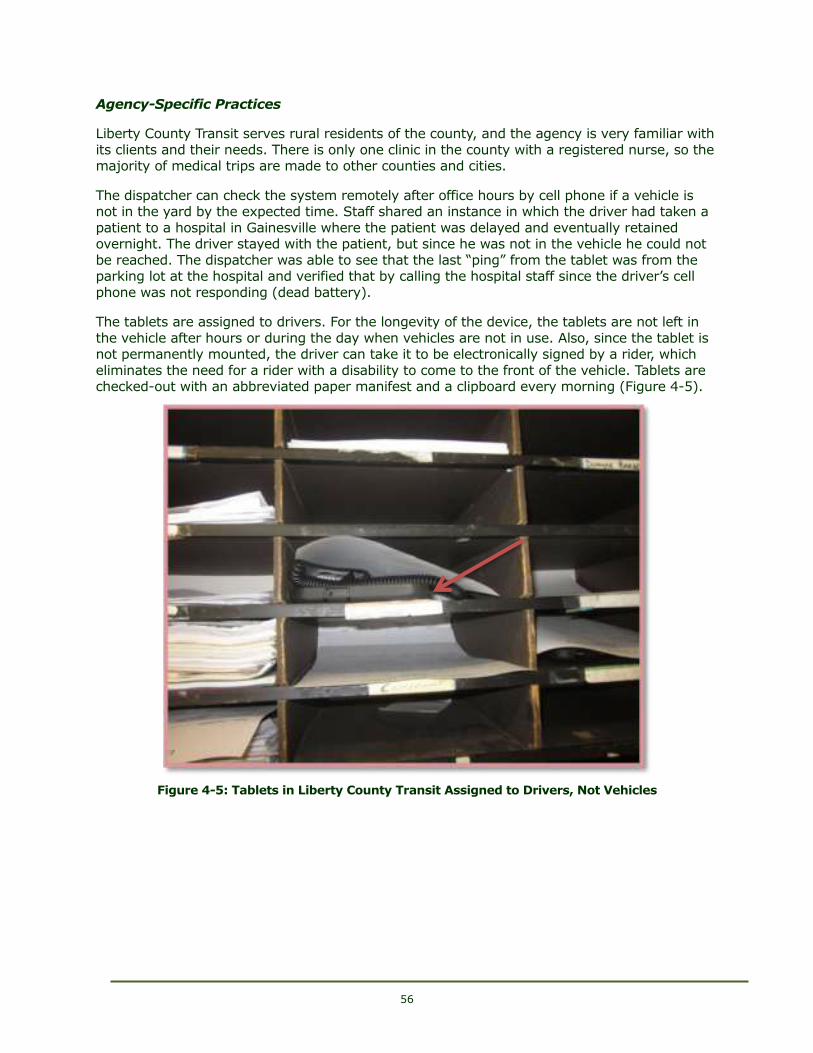
56
Agency-Specific Practices
501BLiberty County Transit serves rural residents of the county, and the agency is very familiar with
its clients and their needs. There is only one clinic in the county with a registered nurse, so the majority of medical trips are made to other counties and cities.
502BThe dispatcher can check the system remotely after office hours by cell phone if a vehicle is not in the yard by the expected time. Staff shared an instance in which the driver had taken a
patient to a hospital in Gainesville where the patient was delayed and eventually retained overnight. The driver stayed with the patient, but since he was not in the vehicle he could not
be reached. The dispatcher was able to see that the last “ping” from the tablet was from the parking lot at the hospital and verified that by calling the hospital staff since the driver’s cell
phone was not responding (dead battery).
503BThe tablets are assigned to drivers. For the longevity of the device, the tablets are not left in
the vehicle after hours or during the day when vehicles are not in use. Also, since the tablet is not permanently mounted, the driver can take it to be electronically signed by a rider, which
eliminates the need for a rider with a disability to come to the front of the vehicle. Tablets are checked-out with an abbreviated paper manifest and a clipboard every morning (Figure 4-5).
872B
728BFigure 4-5: Tablets in Liberty County Transit Assigned to Drivers, Not Vehicles
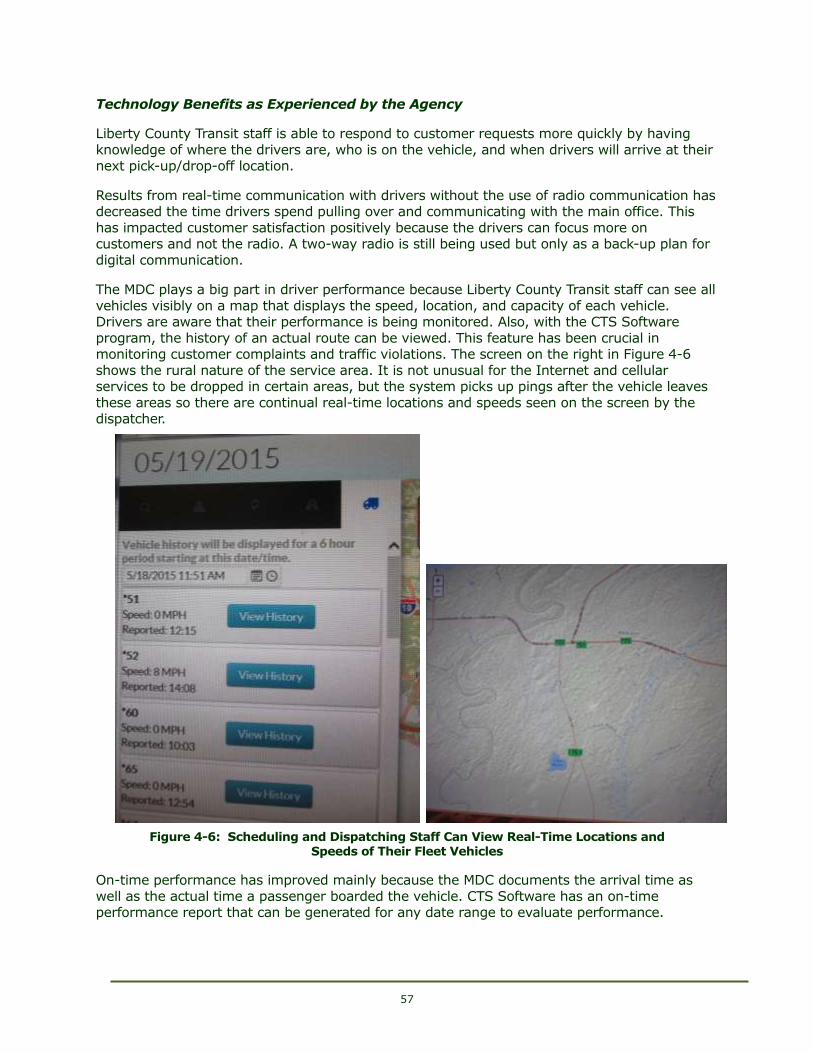
57
Technology Benefits as Experienced by the Agency
504BLiberty County Transit staff is able to respond to customer requests more quickly by having
knowledge of where the drivers are, who is on the vehicle, and when drivers will arrive at their next pick-up/drop-off location.
505BResults from real-time communication with drivers without the use of radio communication has decreased the time drivers spend pulling over and communicating with the main office. This
has impacted customer satisfaction positively because the drivers can focus more on customers and not the radio. A two-way radio is still being used but only as a back-up plan for
digital communication.
506BThe MDC plays a big part in driver performance because Liberty County Transit staff can see all
vehicles visibly on a map that displays the speed, location, and capacity of each vehicle. Drivers are aware that their performance is being monitored. Also, with the CTS Software
program, the history of an actual route can be viewed. This feature has been crucial in monitoring customer complaints and traffic violations. The screen on the right in Figure 4-6
shows the rural nature of the service area. It is not unusual for the Internet and cellular services to be dropped in certain areas, but the system picks up pings after the vehicle leaves
these areas so there are continual real-time locations and speeds seen on the screen by the dispatcher.
729BFigure 4-6: Scheduling and Dispatching Staff Can View Real-Time Locations and Speeds of Their Fleet Vehicles
507BOn-time performance has improved mainly because the MDC documents the arrival time as
well as the actual time a passenger boarded the vehicle. CTS Software has an on-time performance report that can be generated for any date range to evaluate performance.
58
508BDrivers understand that their activities are tracked, including their location, the speed they are
driving, and the status of passengers.
509BCustomers enjoy being able to call in to the office to get an approximate time of arrival. Dispatchers appreciate the efficiency of providing information directly and immediately to
drivers, particularly if rerouting is needed.
510BLiberty County Transit upgraded its software and MDCs just before the new funding source
requirements went into effect, and staff reported that, for accounting and billing purposes, the new software offered much-needed help in coping with new requirements.
Lessons Learned and Tips for Other Agencies
654BTraining by the vendor before and after deployment is critical to the success of transitioning to the new system. CTS provided adequate training sessions to all agency
staff.
655BThe availability of the vendor to communicate with the agency via phone and/or in
person when needed is an important vendor asset to Liberty County Transit. It also helps that all but one neighboring county use the same technology, so collaboration and
sharing of shortcuts and practical tips have been beneficial to all agencies involved.
Also, the agencies appreciate the initiative that CTS takes to bring them together during national conferences to provide updates on newer features and services. For example,
CTS informed these collaborating agencies of a session in the June 2015 Community Transportation Association of America’s Annual Expo in Tampa.
656BCTS made the software of the MDC very simple to use. At first, the drivers were hesitant about using sophisticated technology on the road, but they adapted to the
software program (ParaScope) very well.
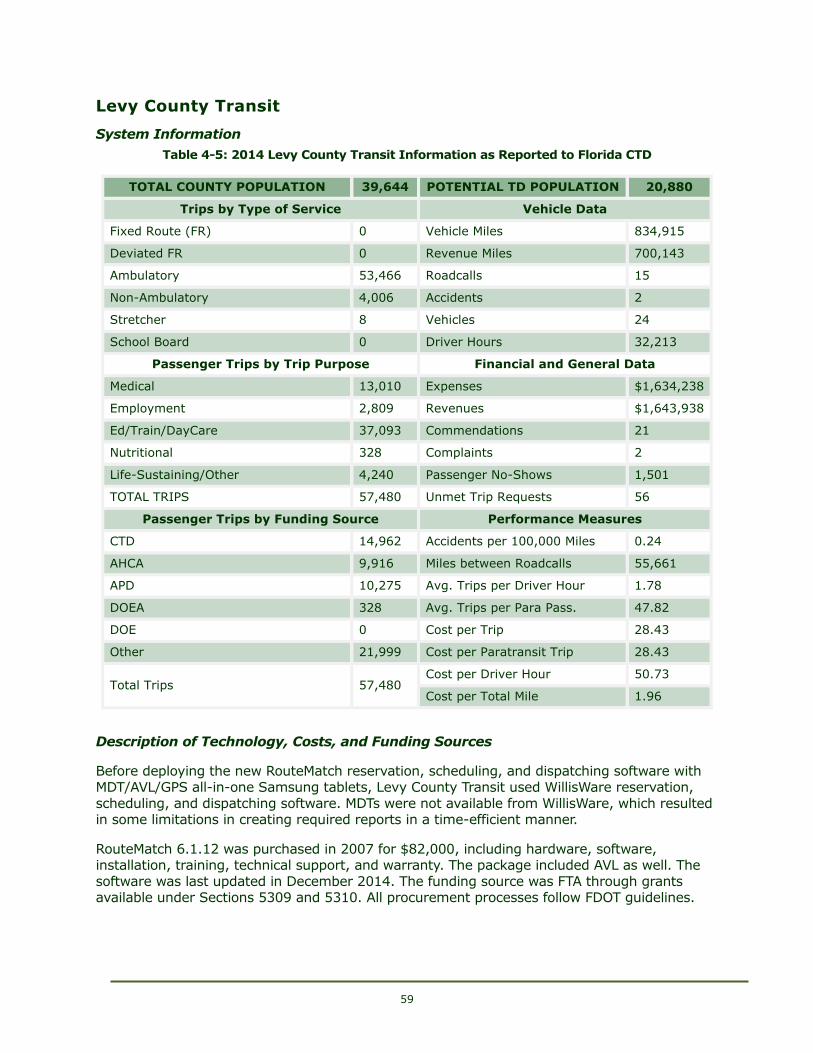
59
Levy County Transit
System Information
730BTable 4-5: 2014 Levy County Transit Information as Reported to Florida CTD
1371BTOTAL COUNTY POPULATION 1372B39,644 1373BPOTENTIAL TD POPULATION 1374B20,880
1375BTrips by Type of Service 1376BVehicle Data
1377BFixed Route (FR) 1378B0 1379BVehicle Miles 1380B834,915
1381BDeviated FR 1382B0 1383BRevenue Miles 1384B700,143
1385BAmbulatory 1386B53,466 1387BRoadcalls 1388B15
1389BNon-Ambulatory 1390B4,006 1391BAccidents 1392B2
1393BStretcher 1394B8 1395BVehicles 1396B24
1397BSchool Board 1398B0 1399BDriver Hours 1400B32,213
1401BPassenger Trips by Trip Purpose 1402BFinancial and General Data
1403BMedical 1404B13,010 1405BExpenses 1406B$1,634,238
1407BEmployment 1408B2,809 1409BRevenues 1410B$1,643,938
1411BEd/Train/DayCare 1412B37,093 1413BCommendations 1414B21
1415BNutritional 1416B328 1417BComplaints 1418B2
1419BLife-Sustaining/Other 1420B4,240 1421BPassenger No-Shows 1422B1,501
1423BTOTAL TRIPS 1424B57,480 1425BUnmet Trip Requests 1426B56
1427BPassenger Trips by Funding Source 1428BPerformance Measures
1429BCTD 1430B14,962 1431BAccidents per 100,000 Miles 1432B0.24
1433BAHCA 1434B9,916 1435BMiles between Roadcalls 1436B55,661
1437BAPD 1438B10,275 1439BAvg. Trips per Driver Hour 1440B1.78
1441BDOEA 1442B328 1443BAvg. Trips per Para Pass. 1444B47.82
1445BDOE 1446B0 1447BCost per Trip 1448B28.43
1449BOther 1450B21,999 1451BCost per Paratransit Trip 1452B28.43
1453BTotal Trips 1454B57,480 1455BCost per Driver Hour 1456B50.73
1457BCost per Total Mile 1458B1.96
Description of Technology, Costs, and Funding Sources
511BBefore deploying the new RouteMatch reservation, scheduling, and dispatching software with
MDT/AVL/GPS all-in-one Samsung tablets, Levy County Transit used WillisWare reservation,
scheduling, and dispatching software. MDTs were not available from WillisWare, which resulted in some limitations in creating required reports in a time-efficient manner.
512BRouteMatch 6.1.12 was purchased in 2007 for $82,000, including hardware, software, installation, training, technical support, and warranty. The package included AVL as well. The
software was last updated in December 2014. The funding source was FTA through grants available under Sections 5309 and 5310. All procurement processes follow FDOT guidelines.
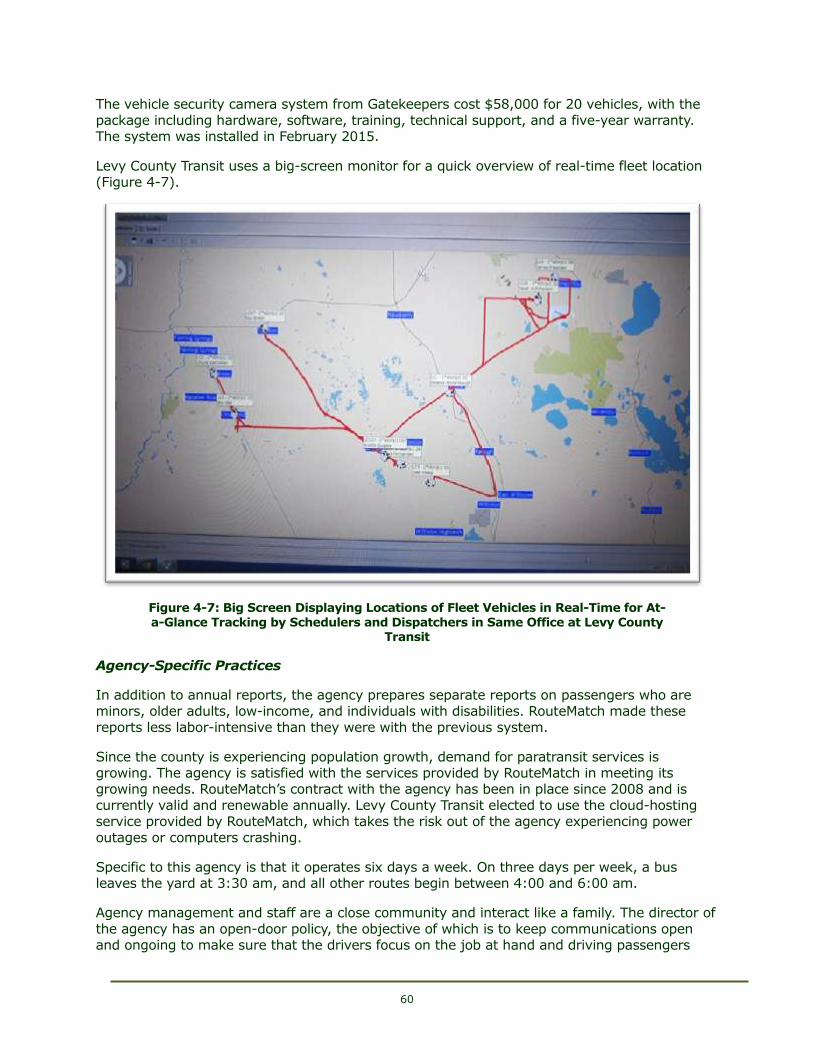
60
513BThe vehicle security camera system from Gatekeepers cost $58,000 for 20 vehicles, with the
package including hardware, software, training, technical support, and a five-year warranty. The system was installed in February 2015.
514BLevy County Transit uses a big-screen monitor for a quick overview of real-time fleet location (Figure 4-7).
873B
731BFigure 4-7: Big Screen Displaying Locations of Fleet Vehicles in Real-Time for At-
a-Glance Tracking by Schedulers and Dispatchers in Same Office at Levy County Transit
Agency-Specific Practices
515BIn addition to annual reports, the agency prepares separate reports on passengers who are minors, older adults, low-income, and individuals with disabilities. RouteMatch made these
reports less labor-intensive than they were with the previous system.
516BSince the county is experiencing population growth, demand for paratransit services is growing. The agency is satisfied with the services provided by RouteMatch in meeting its growing needs. RouteMatch’s contract with the agency has been in place since 2008 and is
currently valid and renewable annually. Levy County Transit elected to use the cloud-hosting service provided by RouteMatch, which takes the risk out of the agency experiencing power
outages or computers crashing.
517BSpecific to this agency is that it operates six days a week. On three days per week, a bus leaves the yard at 3:30 am, and all other routes begin between 4:00 and 6:00 am.
518BAgency management and staff are a close community and interact like a family. The director of
the agency has an open-door policy, the objective of which is to keep communications open and ongoing to make sure that the drivers focus on the job at hand and driving passengers
61
safely on their runs. Investing the time to make sure drivers are not experiencing unresolved
issues is well worth the time for the agency since it takes approximately two months to get a driver hired and trained.
519BTraining and refresher training sessions are conducted throughout the year for all agency staff.
Technology Benefits as Experienced by the Agency
520BThe reporting functionality of the RouteMatch system has been very effective in meeting the
required reporting demands of the agency. Scheduling is more efficient, including adding
same-day trips and moving trips to consolidate manifests as trips are cancelled by riders. MDTs help all drivers to become more efficient in locating riders and entering information needed for
mileage, times, and breaks. By giving drivers timelines for pick-up, drop-off, and travel, they are able to determine the most efficient routes to travel. Locating new riders and helping new
drivers locate riders has noticeably improved with the new technology and mapping/navigation systems.
521BCustomers are given reservation numbers to verify trips, if needed, and can call to get an approximate arrival time of their ride.
522BSafety features programmed in the RouteMatch system guarantees that the tablet cannot be used while the vehicle is in motion.
Lessons Learned and Tips for Other Agencies
657BRunning the old and new reservation, scheduling, and dispatching software in parallel for at least a month will ensure that accurate and timely billing of trips is not missed. The agency director emphasized that it was well worth the investment to pay both
vendors for a month to make sure there are no discrepancies between the two systems
and that the transition is smooth with no problems before being fully dependent on the new system.
658BThe use of tablets instead of MDT units was a worthwhile investment for the agency, since an MDT unit costs $4,000 and a tablet costs only $250.
659BThe tablets are assigned to drivers. The manifest is available on the tablet, but a hard copy of the manifest is given to the drivers as a back-up in case of a system failure
when on a run. Drivers accepted the use of tablets faster than MDTs because the screens are bigger and clearer to read than MDTs.
660BVehicle security cameras are for the protection of the agency and the operators, as well
as the clients. Even if the operators may not like being watched, they will eventually understand that the recording is for their protection from any false claims.
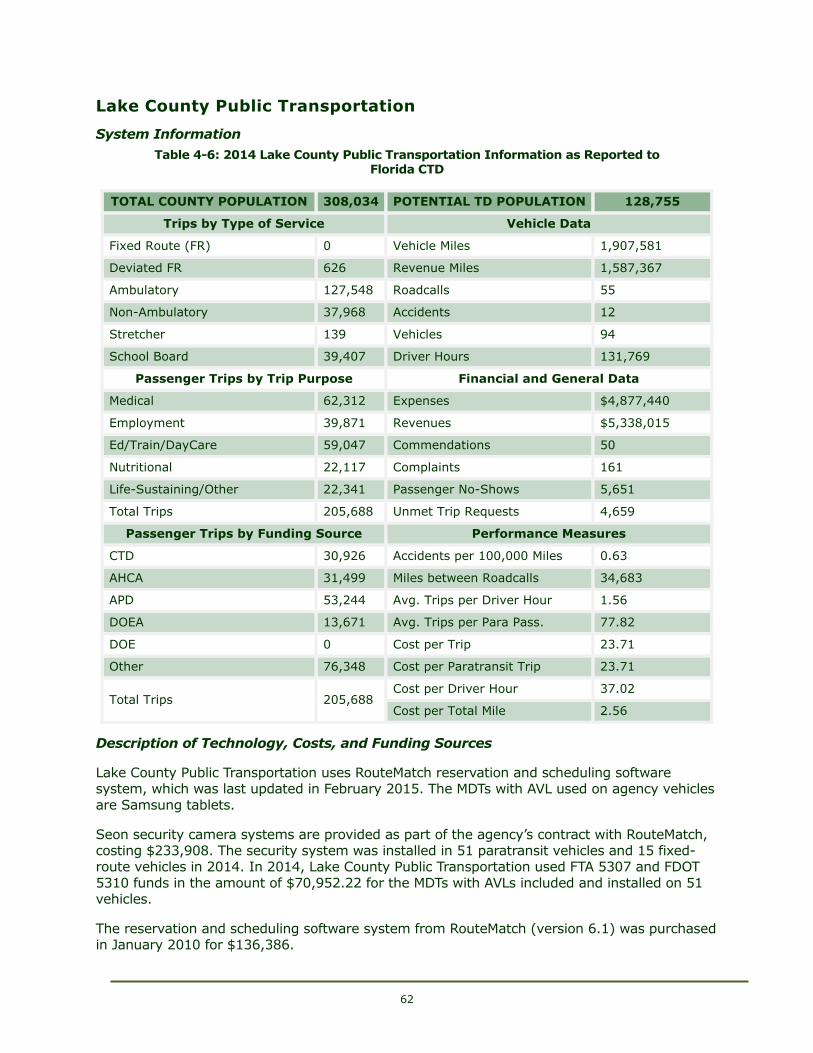
62
Lake County Public Transportation
System Information
732BTable 4-6: 2014 Lake County Public Transportation Information as Reported to Florida CTD
1459BTOTAL COUNTY POPULATION 1460B308,034 1461BPOTENTIAL TD POPULATION 1462B128,755
1463BTrips by Type of Service 1464BVehicle Data
1465BFixed Route (FR) 1466B0 1467BVehicle Miles 1468B1,907,581
1469BDeviated FR 1470B626 1471BRevenue Miles 1472B1,587,367
1473BAmbulatory 1474B127,548 1475BRoadcalls 1476B55
1477BNon-Ambulatory 1478B37,968 1479BAccidents 1480B12
1481BStretcher 1482B139 1483BVehicles 1484B94
1485BSchool Board 1486B39,407 1487BDriver Hours 1488B131,769
1489BPassenger Trips by Trip Purpose 1490BFinancial and General Data
1491BMedical 1492B62,312 1493BExpenses 1494B$4,877,440
1495BEmployment 1496B39,871 1497BRevenues 1498B$5,338,015
1499BEd/Train/DayCare 1500B59,047 1501BCommendations 1502B50
1503BNutritional 1504B22,117 1505BComplaints 1506B161
1507BLife-Sustaining/Other 1508B22,341 1509BPassenger No-Shows 1510B5,651
1511BTotal Trips 1512B205,688 1513BUnmet Trip Requests 1514B4,659
1515BPassenger Trips by Funding Source 1516BPerformance Measures
1517BCTD 1518B30,926 1519BAccidents per 100,000 Miles 1520B0.63
1521BAHCA 1522B31,499 1523BMiles between Roadcalls 1524B34,683
1525BAPD 1526B53,244 1527BAvg. Trips per Driver Hour 1528B1.56
1529BDOEA 1530B13,671 1531BAvg. Trips per Para Pass. 1532B77.82
1533BDOE 1534B0 1535BCost per Trip 1536B23.71
1537BOther 1538B76,348 1539BCost per Paratransit Trip 1540B23.71
1541BTotal Trips 1542B205,688 1543BCost per Driver Hour 1544B37.02
1545BCost per Total Mile 1546B2.56
Description of Technology, Costs, and Funding Sources
523BLake County Public Transportation uses RouteMatch reservation and scheduling software system, which was last updated in February 2015. The MDTs with AVL used on agency vehicles
are Samsung tablets.
524BSeon security camera systems are provided as part of the agency’s contract with RouteMatch, costing $233,908. The security system was installed in 51 paratransit vehicles and 15 fixed-route vehicles in 2014. In 2014, Lake County Public Transportation used FTA 5307 and FDOT
5310 funds in the amount of $70,952.22 for the MDTs with AVLs included and installed on 51 vehicles.
525BThe reservation and scheduling software system from RouteMatch (version 6.1) was purchased in January 2010 for $136,386.
63
526BA Lake County capital grant provided funding for new buses with MDTs pre-installed in FY
2013/2014.
Agency-Specific Practices
527BOn October 1, 2013, the Lake County Board of County Commissioners entered into an
agreement with Ride Right Transit, LLC, to be the County’s transit provider. Ride Right Transit,
LLC, provides the paratransit service as the ‘Lake County Connection’ and subcontracts the fixed-route services to Maruti Transit Group, with the service operating as ‘LakeXpress.’
Technology Benefits Experienced by the Agency
528BVehicle security cameras have provided great value in assisting law enforcement and conflict
resolution and helping to reduce fraudulent liability claims. Drivers and passengers know they
are being videotaped while on the vehicle, and the security system captures some visual and audio outside the vehicle, reducing the number of disputed complaints.
529BThe security system also makes drivers more conscientious about customer service, on time performance, and the safety of the passengers, the public, and the vehicle.
530BRouteMatch cloud-hosts the software, a good option because the Lake County ITS Department
operates from 8:00 am to 5:00 pm on weekdays and transit services extend beyond those hours and days. Thus, RouteMatch provides 24/7 technical services and eliminates the expense
of a local server and potential server crashes.
Lessons Learned and Tips for Other Agencies
661BThe agency has 70 tablets and contracts with Sprint for data for the tablets. In some areas of the county, Sprint coverage is not as reliable as desired and calls may be dropped; therefore, a paper manifest is used as back-up.
662BBecause the County contracts with three Medicaid transportation brokers, they requires passengers to sign a hard copy of the manifest; the County is working with those
brokers to allow acceptance of an electronic signature. Scheduling for Medicaid
passengers requires staff to sign into the Medicaid portal every day to retrieve trips; the County has contracted with RouteMatch to facilitate the County’s software system
to interface with the brokers systems to allow for the County to download the trips into Route Match electronically.
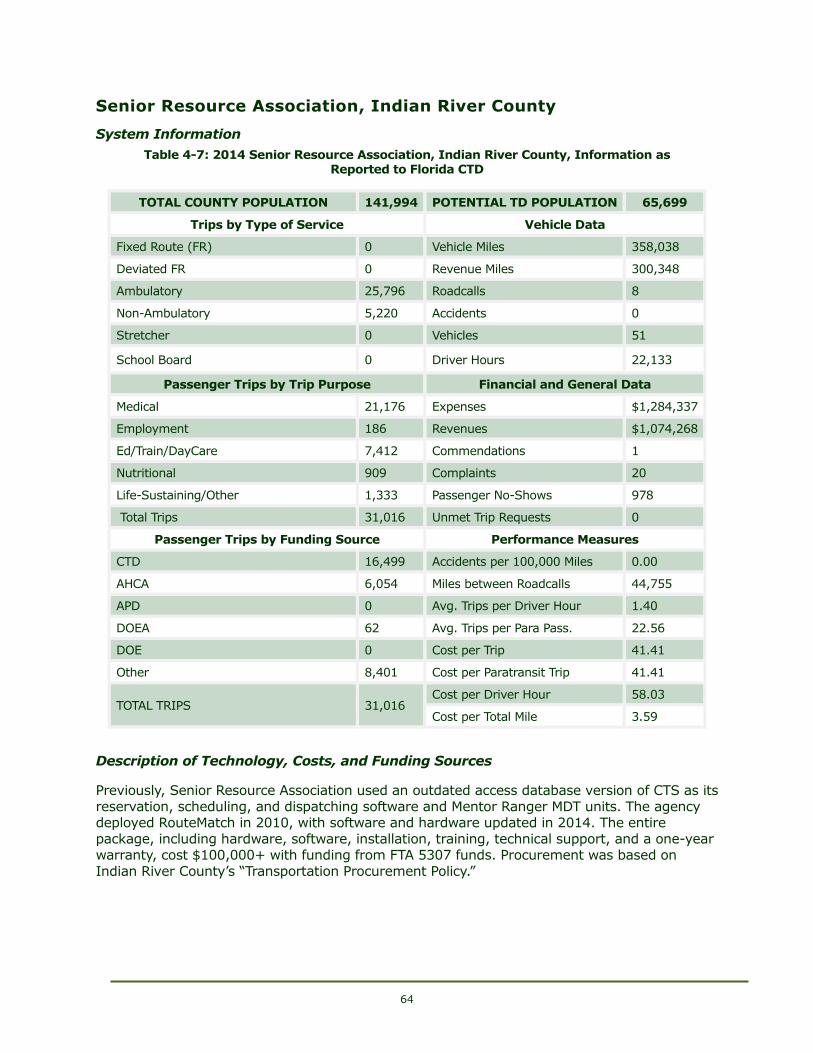
64
Senior Resource Association, Indian River County
System Information
733BTable 4-7: 2014 Senior Resource Association, Indian River County, Information as Reported to Florida CTD
TOTAL COUNTY POPULATION 141,994 POTENTIAL TD POPULATION 65,699
Trips by Type of Service Vehicle Data
Fixed Route (FR) 0 Vehicle Miles 358,038
Deviated FR 0 Revenue Miles 300,348
Ambulatory 25,796 Roadcalls 8
Non-Ambulatory 5,220 Accidents 0
Stretcher 0 Vehicles 51
School Board 0 Driver Hours 22,133
Passenger Trips by Trip Purpose Financial and General Data
Medical 21,176 Expenses $1,284,337
Employment 186 Revenues $1,074,268
Ed/Train/DayCare 7,412 Commendations 1
Nutritional 909 Complaints 20
Life-Sustaining/Other 1,333 Passenger No-Shows 978
Total Trips 31,016 Unmet Trip Requests 0
Passenger Trips by Funding Source Performance Measures
CTD 16,499 Accidents per 100,000 Miles 0.00
AHCA 6,054 Miles between Roadcalls 44,755
APD 0 Avg. Trips per Driver Hour 1.40
DOEA 62 Avg. Trips per Para Pass. 22.56
DOE 0 Cost per Trip 41.41
Other 8,401 Cost per Paratransit Trip 41.41
TOTAL TRIPS 31,016 Cost per Driver Hour 58.03
Cost per Total Mile 3.59
Description of Technology, Costs, and Funding Sources
531BPreviously, Senior Resource Association used an outdated access database version of CTS as its
reservation, scheduling, and dispatching software and Mentor Ranger MDT units. The agency deployed RouteMatch in 2010, with software and hardware updated in 2014. The entire
package, including hardware, software, installation, training, technical support, and a one-year warranty, cost $100,000+ with funding from FTA 5307 funds. Procurement was based on
Indian River County’s “Transportation Procurement Policy.”
65
532BA Seon GPS system was installed in 2013 for $75,000, and the hardware and software were
updated in 2015.
533BA Seon vehicle security camera system was purchased in 2013 for $150,000 for all 24 fleet vehicles. The hardware and software were updated in 2015.
534BAn advanced telephone system with automated service, call forwarding, voice-mail, and call hold, including hardware, software, installation, training, technical support, and a three-year
warranty, was purchased from NEC in 2015 for $10,000.
Agency-Specific Practices
535BHosted on the agency’s server, RouteMatch was deployed in phases; first for paratransit
services and then for fixed-route transit services. The agency transitioned from providing
service similar to personal taxi service to the multi-loading of passengers to serve more passengers more efficiently and increase driver productivity.
536BSenior Resource Association’s upper management reorganized to achieve total buy-in from employees New job descriptions were drafted and employees had to re-apply for positions.
According to the President and CEO of the Association, this was the best management decision to make efficient transit happen.
537BTablets are assigned to vehicles rather than drivers, so logging in and out is important for accurate reporting. If a driver overrides the planned trip on the manifest, then the entire data
set is inaccurate and office staff must reconcile the manifests. Agency staff organizes a monthly drawing of a $25 gift certificate to motivate drivers to follow log-in and log-out
procedures accurately.
Technology Benefits as Experienced by the Agency
538BThe advanced telephone system has been effective in reducing wait time for customers and getting them to a “live” person in a timely manner, which the customers appreciate. The
telephone system is used for reporting the number of calls, planning personnel support when
high volume occurs, and filtering calls.
539BThe paratransit system has grown substantially with the population growth of the county, but the new RouteMatch system is handling the increase in demand. The labor cost has not
decreased because the agency had to employ a scheduler and dispatcher to accommodate the influx of more passengers into the system.
540BCustomers are pleased that shopping trips are now offered more than twice a week, made possible by the increased efficiency of the schedules and increased productivity of the drivers.
In addition, customers appreciate that the dispatcher now provides reliable pick-up times.
Lessons Learned and Tips for Other Agencies
663BBefore starting the process of developing a package for the agency, the current procedures of how the agency and staff function should be described to the vendor. For example, the agency should note how different departments interact and which fields
they pull from to create requested reports.
664BVendors should be asked about plans for phasing out the current technology. The
agency was using Mentor Ranger MDTs and was the last agency to purchase those units
before the vendor discontinued selling and providing support for them.
66
665BDrivers must be trained to trust the new GPS-generated route and follow the electronic
manifest. If they override the planned manifest, completed trips will be unverified and inaccurate.
666BDispatchers can now negotiate trip times with passengers.
667BSenior Resource Association has offered to serve as a partner with other agencies
considering the deployment of technology, not only before but during transition.
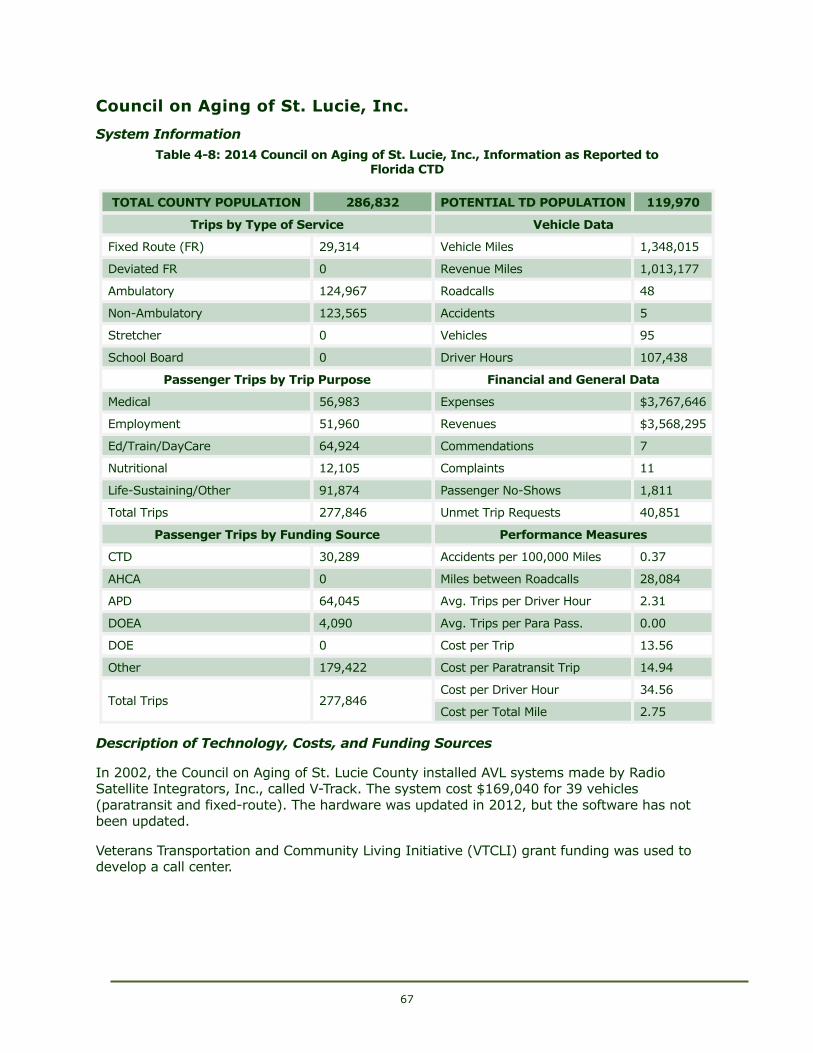
67
Council on Aging of St. Lucie, Inc.
System Information
734BTable 4-8: 2014 Council on Aging of St. Lucie, Inc., Information as Reported to Florida CTD
TOTAL COUNTY POPULATION 286,832 POTENTIAL TD POPULATION 119,970
Trips by Type of Service Vehicle Data
Fixed Route (FR) 29,314 Vehicle Miles 1,348,015
Deviated FR 0 Revenue Miles 1,013,177
Ambulatory 124,967 Roadcalls 48
Non-Ambulatory 123,565 Accidents 5
Stretcher 0 Vehicles 95
School Board 0 Driver Hours 107,438
Passenger Trips by Trip Purpose Financial and General Data
Medical 56,983 Expenses $3,767,646
Employment 51,960 Revenues $3,568,295
Ed/Train/DayCare 64,924 Commendations 7
Nutritional 12,105 Complaints 11
Life-Sustaining/Other 91,874 Passenger No-Shows 1,811
Total Trips 277,846 Unmet Trip Requests 40,851
Passenger Trips by Funding Source Performance Measures
CTD 30,289 Accidents per 100,000 Miles 0.37
AHCA 0 Miles between Roadcalls 28,084
APD 64,045 Avg. Trips per Driver Hour 2.31
DOEA 4,090 Avg. Trips per Para Pass. 0.00
DOE 0 Cost per Trip 13.56
Other 179,422 Cost per Paratransit Trip 14.94
Total Trips 277,846 Cost per Driver Hour 34.56
Cost per Total Mile 2.75
Description of Technology, Costs, and Funding Sources
541BIn 2002, the Council on Aging of St. Lucie County installed AVL systems made by Radio Satellite Integrators, Inc., called V-Track. The system cost $169,040 for 39 vehicles
(paratransit and fixed-route). The hardware was updated in 2012, but the software has not
been updated.
542BVeterans Transportation and Community Living Initiative (VTCLI) grant funding was used to develop a call center.
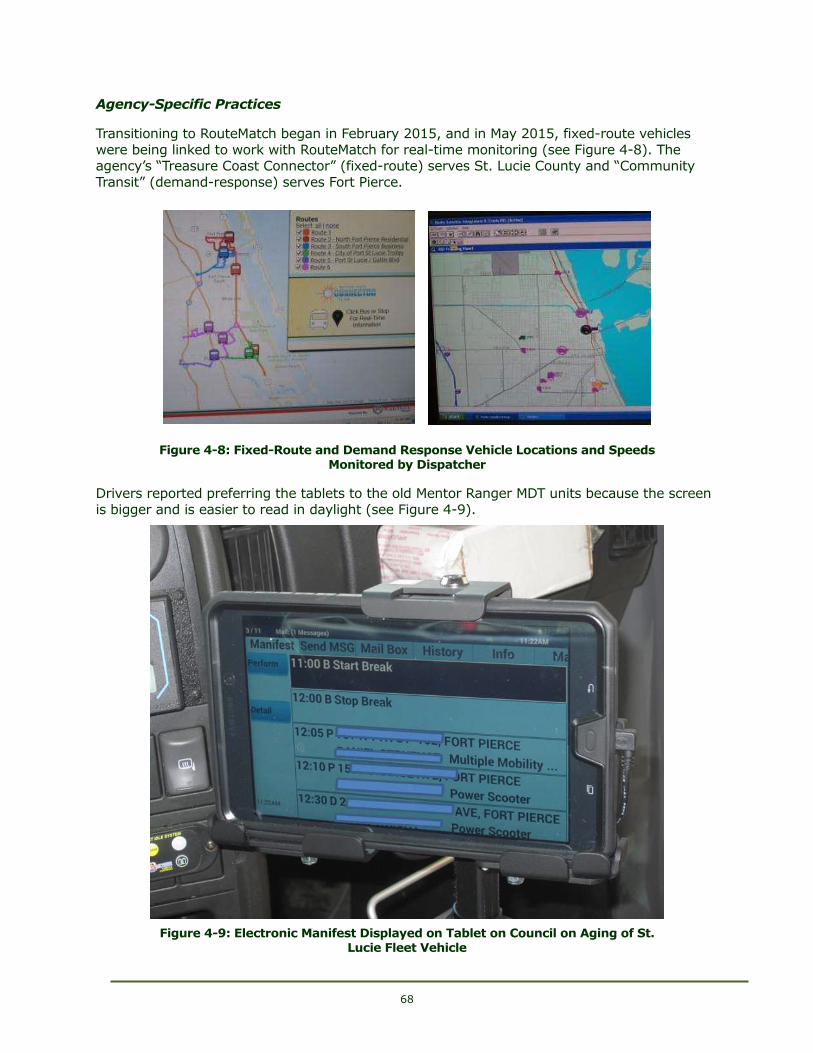
68
Agency-Specific Practices
543BTransitioning to RouteMatch began in February 2015, and in May 2015, fixed-route vehicles
were being linked to work with RouteMatch for real-time monitoring (see Figure 4-8). The agency’s “Treasure Coast Connector” (fixed-route) serves St. Lucie County and “Community
Transit” (demand-response) serves Fort Pierce.
735BFigure 4-8: Fixed-Route and Demand Response Vehicle Locations and Speeds Monitored by Dispatcher
544BDrivers reported preferring the tablets to the old Mentor Ranger MDT units because the screen
is bigger and is easier to read in daylight (see Figure 4-9).
874B
736BFigure 4-9: Electronic Manifest Displayed on Tablet on Council on Aging of St. Lucie Fleet Vehicle
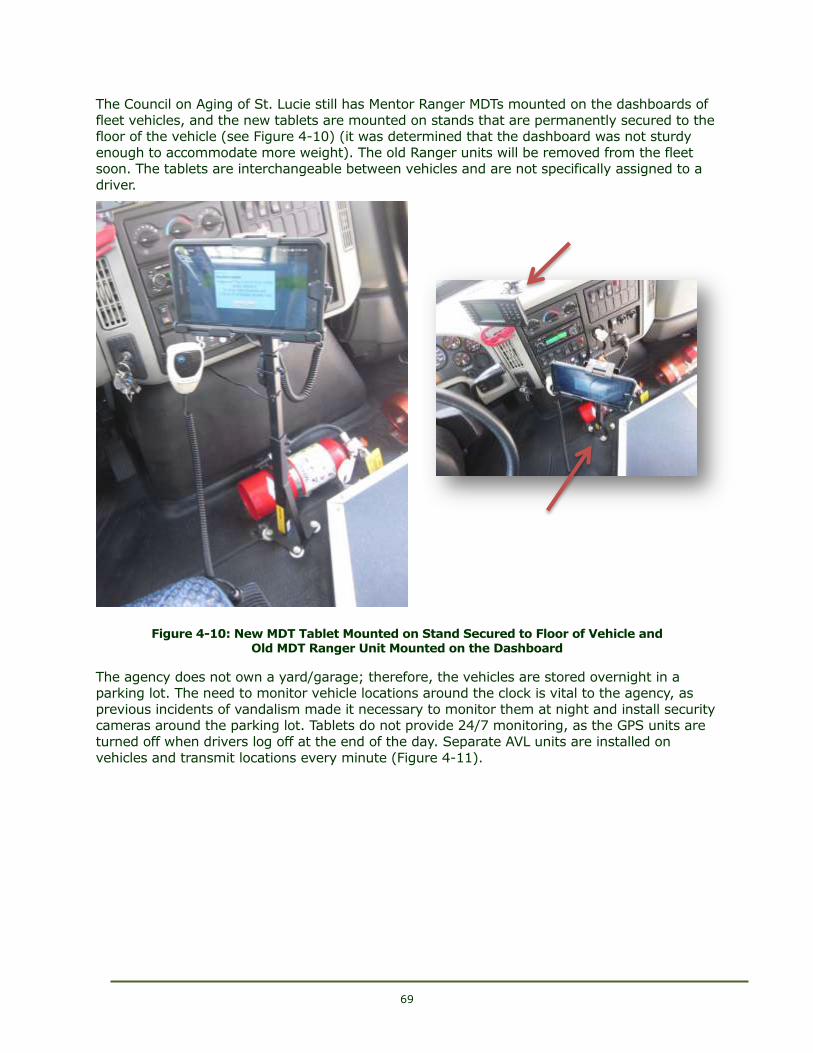
69
545BThe Council on Aging of St. Lucie still has Mentor Ranger MDTs mounted on the dashboards of
fleet vehicles, and the new tablets are mounted on stands that are permanently secured to the floor of the vehicle (see Figure 4-10) (it was determined that the dashboard was not sturdy
enough to accommodate more weight). The old Ranger units will be removed from the fleet soon. The tablets are interchangeable between vehicles and are not specifically assigned to a
driver.
875B
737BFigure 4-10: New MDT Tablet Mounted on Stand Secured to Floor of Vehicle and Old MDT Ranger Unit Mounted on the Dashboard
546BThe agency does not own a yard/garage; therefore, the vehicles are stored overnight in a parking lot. The need to monitor vehicle locations around the clock is vital to the agency, as
previous incidents of vandalism made it necessary to monitor them at night and install security cameras around the parking lot. Tablets do not provide 24/7 monitoring, as the GPS units are
turned off when drivers log off at the end of the day. Separate AVL units are installed on
vehicles and transmit locations every minute (Figure 4-11).
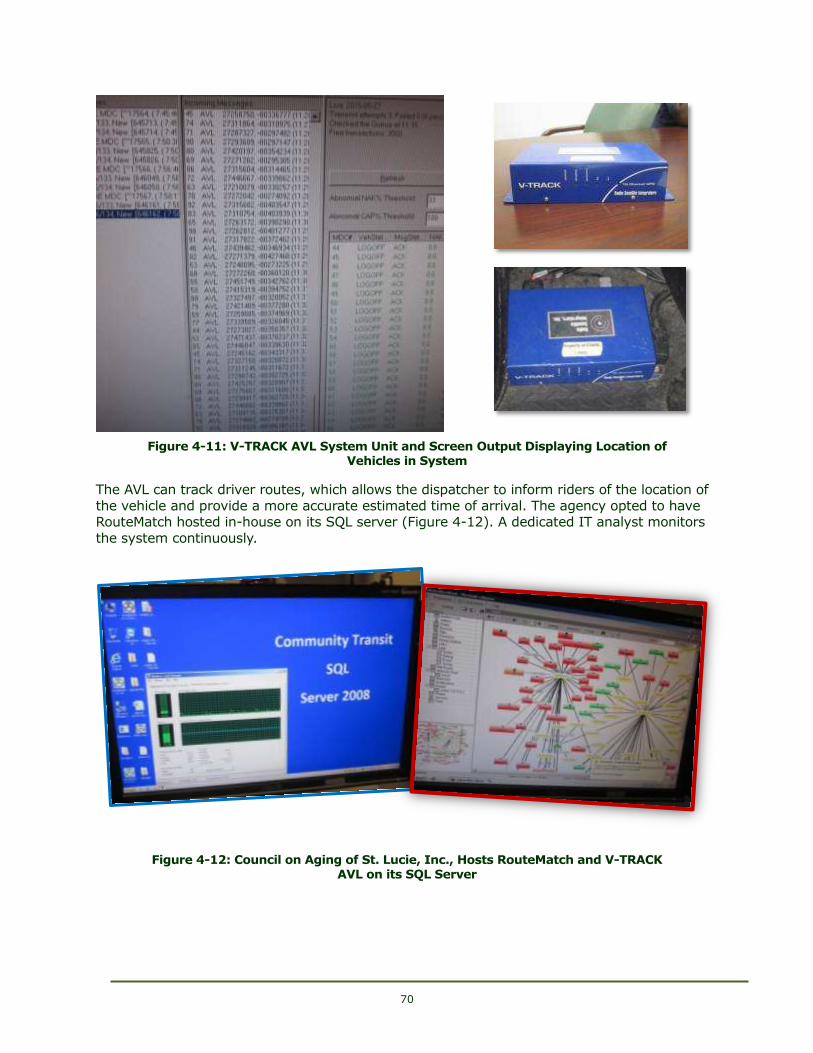
70
738BFigure 4-11: V-TRACK AVL System Unit and Screen Output Displaying Location of Vehicles in System
547BThe AVL can track driver routes, which allows the dispatcher to inform riders of the location of
the vehicle and provide a more accurate estimated time of arrival. The agency opted to have RouteMatch hosted in-house on its SQL server (Figure 4-12). A dedicated IT analyst monitors
the system continuously.
876B
739BFigure 4-12: Council on Aging of St. Lucie, Inc., Hosts RouteMatch and V-TRACK AVL on its SQL Server
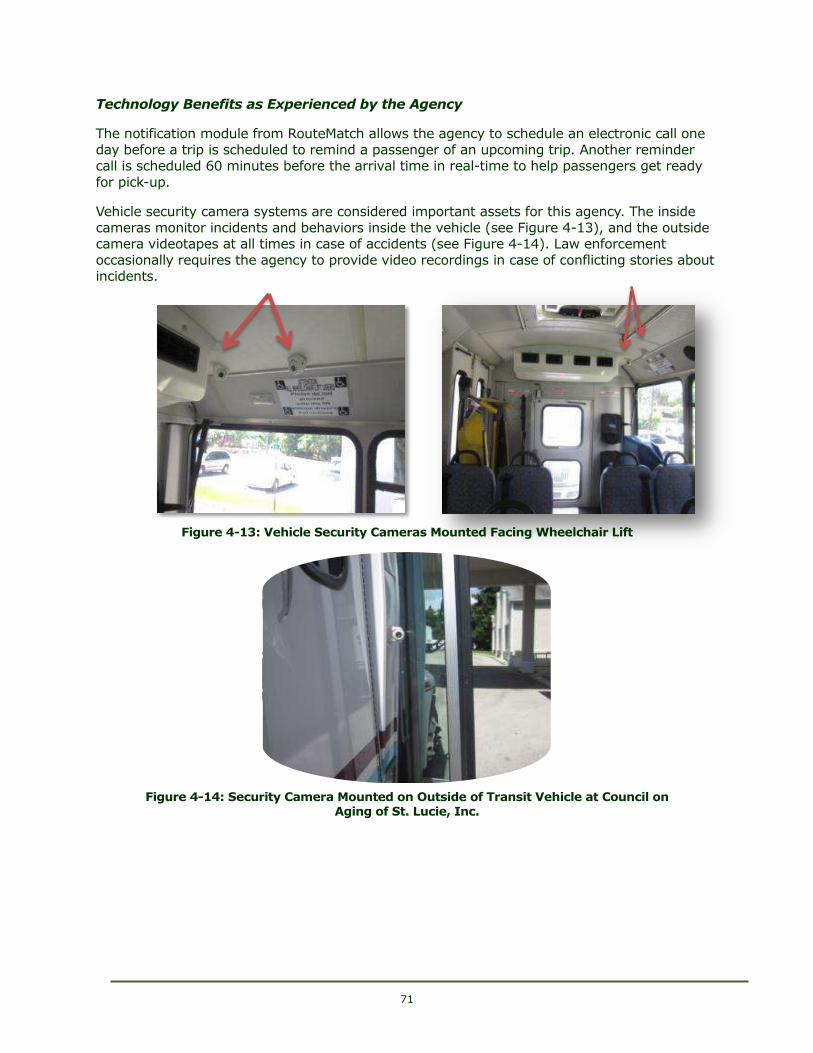
71
Technology Benefits as Experienced by the Agency
548BThe notification module from RouteMatch allows the agency to schedule an electronic call one
day before a trip is scheduled to remind a passenger of an upcoming trip. Another reminder call is scheduled 60 minutes before the arrival time in real-time to help passengers get ready
for pick-up.
549BVehicle security camera systems are considered important assets for this agency. The inside
cameras monitor incidents and behaviors inside the vehicle (see Figure 4-13), and the outside camera videotapes at all times in case of accidents (see Figure 4-14). Law enforcement
occasionally requires the agency to provide video recordings in case of conflicting stories about incidents.
740BFigure 4-13: Vehicle Security Cameras Mounted Facing Wheelchair Lift
877B
741BFigure 4-14: Security Camera Mounted on Outside of Transit Vehicle at Council on Aging of St. Lucie, Inc.
72
Lessons Learned and Tips for Other Agencies
668BThe cameras caused drivers to feel they were being watched, but they became more accepting when considering that the system protects them against incorrect claims by
passengers. After a time, the drivers seemed to have forgotten that the cameras were taping their activities. “The customer is always right” was the agency’s initial
philosophy, but that has evolved as the videos help mitigate conflicting eyewitness accounts.
669BTraining is very important for all agency staff but particularly for schedulers to optimize routes and the number of passengers transported on the same ride, thus improving
performance of the system and driver productivity. RouteMatch makes available online
training sessions as part of the package offered to the agency.
670BThere is less chatter on the two-way radios, and drivers depend more on GPS
navigation than asking each other about directions to locate a rider. The dispatcher and driver still communicate through two-way communications in case an alert needs to go
out, but they are not as dependent upon it as before the deployment of RouteMatch.
671BPrior to RouteMatch and Samsung tablet use, the agency was using Trapeze. Staff were
very careful about saying that Trapeze may work for other systems but did not work for their specific needs. Initially, the setup did not accommodate the agency’s data needs.
Despite many efforts to fix the initial setup, the agency was doing more manual
reporting since the software was not extracting data needed to complete the reports. The agency let the two systems (Trapeze and RouteMatch) run side by side for two
days before terminating the old system.
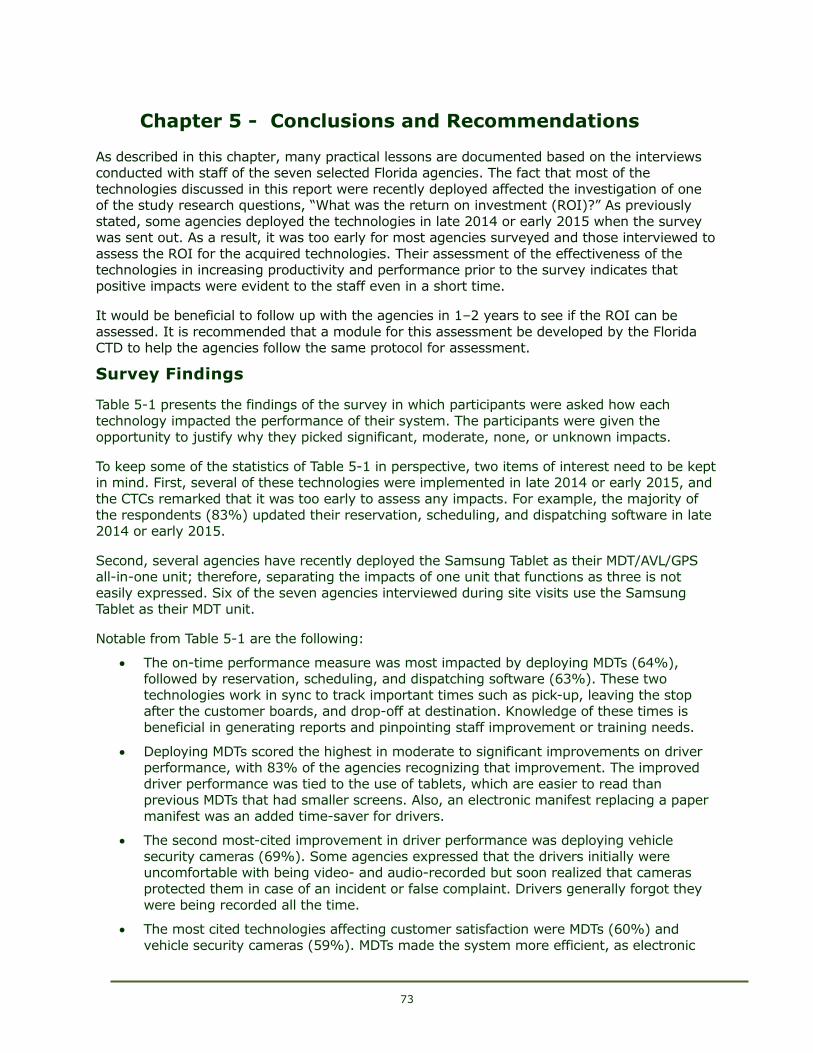
73
Chapter 5 - Conclusions and Recommendations
878BAs described in this chapter, many practical lessons are documented based on the interviews conducted with staff of the seven selected Florida agencies. The fact that most of the
technologies discussed in this report were recently deployed affected the investigation of one of the study research questions, “What was the return on investment (ROI)?” As previously
stated, some agencies deployed the technologies in late 2014 or early 2015 when the survey was sent out. As a result, it was too early for most agencies surveyed and those interviewed to
assess the ROI for the acquired technologies. Their assessment of the effectiveness of the technologies in increasing productivity and performance prior to the survey indicates that
positive impacts were evident to the staff even in a short time.
879BIt would be beneficial to follow up with the agencies in 1–2 years to see if the ROI can be
assessed. It is recommended that a module for this assessment be developed by the Florida CTD to help the agencies follow the same protocol for assessment.
Survey Findings
550BTable 5-1 presents the findings of the survey in which participants were asked how each
technology impacted the performance of their system. The participants were given the
opportunity to justify why they picked significant, moderate, none, or unknown impacts.
551BTo keep some of the statistics of Table 5-1 in perspective, two items of interest need to be kept in mind. First, several of these technologies were implemented in late 2014 or early 2015, and
the CTCs remarked that it was too early to assess any impacts. For example, the majority of
the respondents (83%) updated their reservation, scheduling, and dispatching software in late 2014 or early 2015.
552BSecond, several agencies have recently deployed the Samsung Tablet as their MDT/AVL/GPS all-in-one unit; therefore, separating the impacts of one unit that functions as three is not easily expressed. Six of the seven agencies interviewed during site visits use the Samsung
Tablet as their MDT unit.
553BNotable from Table 5-1 are the following:
672BThe on-time performance measure was most impacted by deploying MDTs (64%), followed by reservation, scheduling, and dispatching software (63%). These two
technologies work in sync to track important times such as pick-up, leaving the stop after the customer boards, and drop-off at destination. Knowledge of these times is
beneficial in generating reports and pinpointing staff improvement or training needs.
673BDeploying MDTs scored the highest in moderate to significant improvements on driver performance, with 83% of the agencies recognizing that improvement. The improved
driver performance was tied to the use of tablets, which are easier to read than previous MDTs that had smaller screens. Also, an electronic manifest replacing a paper
manifest was an added time-saver for drivers.
674BThe second most-cited improvement in driver performance was deploying vehicle
security cameras (69%). Some agencies expressed that the drivers initially were uncomfortable with being video- and audio-recorded but soon realized that cameras
protected them in case of an incident or false complaint. Drivers generally forgot they
were being recorded all the time.
675BThe most cited technologies affecting customer satisfaction were MDTs (60%) and
vehicle security cameras (59%). MDTs made the system more efficient, as electronic
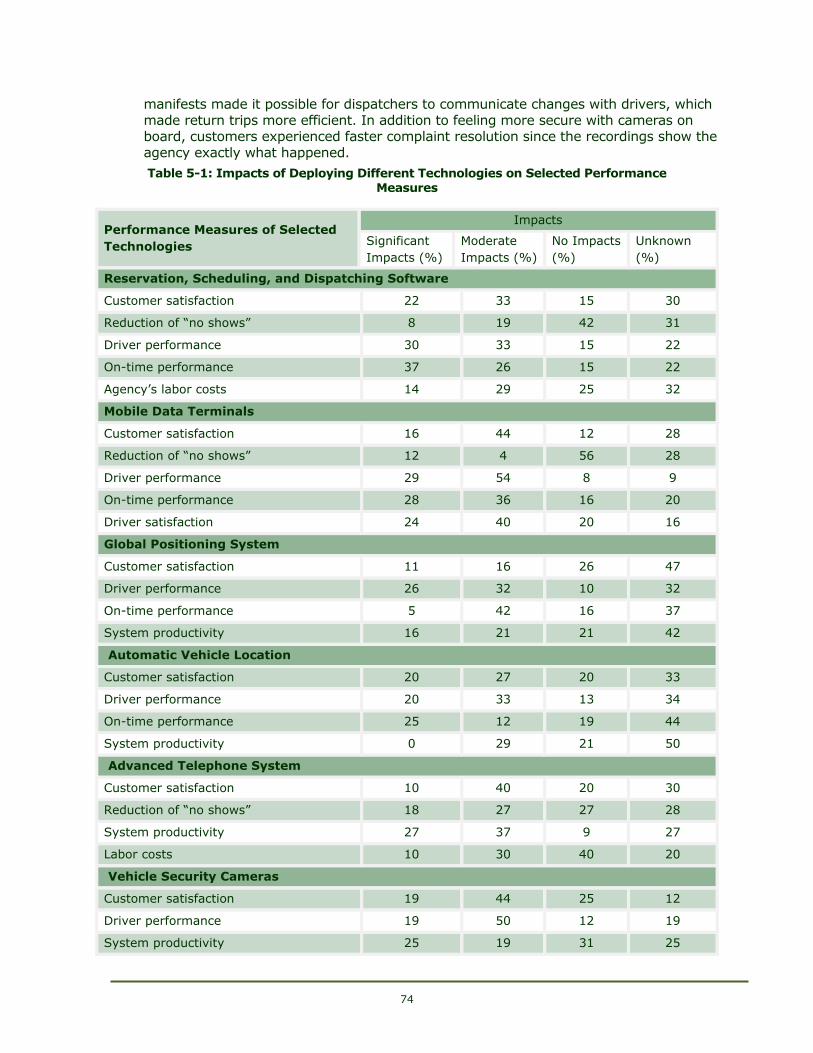
74
manifests made it possible for dispatchers to communicate changes with drivers, which
made return trips more efficient. In addition to feeling more secure with cameras on board, customers experienced faster complaint resolution since the recordings show the
agency exactly what happened.
742BTable 5-1: Impacts of Deploying Different Technologies on Selected Performance
Measures
1547BPerformance Measures of Selected
Technologies
1548BImpacts
1549BSignificant
Impacts (%)
1550BModerate
Impacts (%)
1551BNo Impacts
(%)
1552BUnknown
1553B(%)
1554BReservation, Scheduling, and Dispatching Software
1555BCustomer satisfaction 1556B22 1557B33 1558B15 1559B30
1560BReduction of “no shows” 1561B8 1562B19 1563B42 1564B31
1565BDriver performance 1566B30 1567B33 1568B15 1569B22
1570BOn-time performance 1571B37 1572B26 1573B15 1574B22
1575BAgency’s labor costs 1576B14 1577B29 1578B25 1579B32
1580BMobile Data Terminals
1581BCustomer satisfaction 1582B16 1583B44 1584B12 1585B28
1586BReduction of “no shows” 1587B12 1588B4 1589B56 1590B28
1591BDriver performance 1592B29 1593B54 1594B8 1595B9
1596BOn-time performance 1597B28 1598B36 1599B16 1600B20
1601BDriver satisfaction 1602B24 1603B40 1604B20 1605B16
1606BGlobal Positioning System
1607BCustomer satisfaction 1608B11 1609B16 1610B26 1611B47
1612BDriver performance 1613B26 1614B32 1615B10 1616B32
1617BOn-time performance 1618B5 1619B42 1620B16 1621B37
1622BSystem productivity 1623B16 1624B21 1625B21 1626B42
1627BAutomatic Vehicle Location
1628BCustomer satisfaction 1629B20 1630B27 1631B20 1632B33
1633BDriver performance 1634B20 1635B33 1636B13 1637B34
1638BOn-time performance 1639B25 1640B12 1641B19 1642B44
1643BSystem productivity 1644B0 1645B29 1646B21 1647B50
1648BAdvanced Telephone System
1649BCustomer satisfaction 1650B10 1651B40 1652B20 1653B30
1654BReduction of “no shows” 1655B18 1656B27 1657B27 1658B28
1659BSystem productivity 1660B27 1661B37 1662B9 1663B27
1664BLabor costs 1665B10 1666B30 1667B40 1668B20
1669BVehicle Security Cameras
1670BCustomer satisfaction 1671B19 1672B44 1673B25 1674B12
1675BDriver performance 1676B19 1677B50 1678B12 1679B19
1680BSystem productivity 1681B25 1682B19 1683B31 1684B25
75
Lessons Learned
880BThis section summarizes lessons learned by agencies as reported by staff interviewed during
site visits. The interviewees all agreed that the ‘best bang for the buck’ was attained by
deploying vehicle security cameras. The benefits of cameras, as shared by all agencies interviewed, was protection of drivers and passengers, incident management, risk reduction,
conflict mitigation, and eliminating unfounded liability payouts. Some agencies are pulling
video recordings for random inspection to make sure all processes are properly followed by operators. This procedure has the potential to reduce the tasks of field inspectors.
Lessons Learned for Vendor Selection
676BVendors should be able to provide references, and agencies should take the time to interview these references. Building upon the research presented in this report, peer
agencies should be asked about their experiences with vendor technical support, training, availability via phone or in person, timely responsiveness to issues/challenges
that come up during transition from old to new system, updates, and customer service beyond the transition. A vendor’s timely response to peer agencies is a good indication
of its availability.
677BHands-on training provided by a vendor is key in the success of transitioning to new
systems. Agencies should make sure ample opportunities are provided for training the
staff as well as the operators. In addition, agencies should set up train-the-trainer sessions so staffs are confident in training new operators on the system even after
transitioning is completed. Agencies should make sure that contracts include training sessions and/or online educational sessions for their staff.
Lessons Learned for System Selection
881BBefore specifications of a new system are decided upon, agencies should seek the input of all agency staff involved in the paratransit operation. Upper management may know
in general what all the staff jobs entail, but they may not be as familiar with the intricate data needs required for performing day-to-day tasks, particularly that of report
generation.
678BAgencies should understand the uniqueness of their system including their specific
needs. Since the software is usually standardized, it is recommended that an agency
makes sure to explain its specific needs in the planning process before the package for the agency is developed. Data fields that have been used for years in old software may
not correspond to the new, and adjustments or customizations may be needed. An agency is better off making this customization upfront than trying to retrofit changes in
the software. This task relates to the previous bullet in that all agency staff should describe how they use the current software and how it can be improved to increase the
efficiency of their day-to-day tasks.
Lessons Learned for Transitioning to New Technologies
882BNew and old systems should be run in parallel for at least a month until all glitches are worked out. Even if this means that the agency will be paying two vendors simultaneously, it is well worth it so as not to fall behind in reporting and billing of trips.
One interviewee recalled another agency falling weeks behind in invoicing and billing,
resulting in a labor-intensive catch-up process.
679BSome resistance to new technology should be expected from staff and operators, but
with training attitudes towards change will be more positive once benefits are realized and trust is built. This lesson can be mitigated using the following examples:
76
883BCollier Area Transit piloted its new technology with key selected vehicle
operators who were more technology-enthusiastic than others. 884BPasco County piloted its new technology with 10 operators and deployed the full
system after bugs were worked out so the transition was as smooth as possible.
Other Tips
680BInvesting in a vehicle security camera system was cited by several agencies as
providing the “best bang for the buck.” The benefits of video cameras included protection of drivers and passengers, incident management, risk reduction, conflict
mitigation, and eliminating unfounded liability payouts.
681BSome agencies pull videos for random inspection to make sure operators properly
follow all procedures. This policy could reduce the tasks of field inspectors.
682BAgencies must have a backup plan in case of Internet or cellular data communications
failure such as paper manifests, two-way radio communications, and cell phone access
to the software system, etc.
683BThe deployments have shown that the technologies are helping in increasing overall
system efficiency. The effectiveness of these technologies may take time to be realized in full, but money will be saved in the long run from efficiency and performance
improvements. Patience is key.
77
References [1] 743BU.S. Government Accountability Office (GAO). ADA paratransit services: demand
has increased, but little is known about compliance (GAO-13-17, Nov. 15,). Washington, D.C.: GAO. 2012.. Accessed June 23, 2015, at
http://gao.gov/assets/660/650079.pdf [2] 744BR. Brooks, "Emerging trends in paratransit pose new challenges – Five key points
ease the struggle with increasing demand, rising costs and declining revenues,"
Bus Ride, 2012. Accessed July 14, 2014, at http://www.transdevna.com/Veolia/media/VeoliaNews/busride-com-
Emerging_trends_in_paratransit_pose_new_challenges.pdf. [3] 745BJ. A. Goodwill and H. Carapella, Creative ways to manage paratransit costs
(Florida Department of Transportation Research Report BD549-28). Florida International University, Miami, Florida, 2008. Accessed June 5, 2014, at
http://www.nctr.usf.edu/pdf/77606.pdf. [4] 746BFlorida APTS Technologies, scheduling/operational software (demand-response),
2011. Accessed June 2, 2014, at
http://floridaapts.lctr.org/technology_fleet_dr.html. [5] 747BNicole Schlosser, "2013 Paratransit survey: Paratransit operators continue to
grapple with funding, demand, retention," Metro Magazine, August 2013. Accessed June 18, 2015, at http://www.metro-
magazine.com/resources/images/paratransit-1.pdf. [6] 748BCity of Petaluma, California, Paratransit scheduling software RFP & vendor
selection, 2010. Accessed September 11, 2014, at http://petaluma.granicus.com/MetaViewer.php?view_id=11&clip_id=1118&meta_
id=214561.
[7] 749BJ. Volinski, TCRP Synthesis 112: Maintaining transit effectiveness under major financial constraints, Transit Cooperative Research Program, Transportation
Research Board, Washington DC, 2014. Accessed August 14, 2014, at http://onlinepubs.trb.org/onlinepubs/tcrp/tcrp_syn_112.pdf.
[8] 750BFlorida APTS Technologies, Mobile data terminal, 2011. Accessed May 28, 2014, at http://floridaapts.lctr.org/technology_comm_mob.html.
[9] 751BJ. Volinski, A review of the cost benefit of mobile data terminals in paratransit operations, Center for Urban Transportation Research, 2003. White paper.
[10] 752BTransit Cooperative Research Program, TCRP Report 124: Guidebook for
measuring, assessing, and improving performance of demand-response transportation, 2008. Accessed September 11, 2014, at
http://onlinepubs.trb.org/onlinepubs/tcrp/tcrp_rpt_124.pdf. [11] 753B“How GPS works – Educational poster,” www.GPS.gov. National Coordination
Office for Space-Based Positioning, Navigation, and Timing, 2013. Accessed at http://www.gps.gov/multimedia/poster/.
[12] 754BF. Cevallos, Q. Yuan, S. Wang, J. Skinner, and A. Gan, Feasibility study on the use of personal GPS devices in paratransit, (Florida Department of Transportation
Research Report) May 2009. Accessed May 28, 2014, at
http://www.fta.dot.gov/documents/TRANSPO_Feasibility_GPS_Paratransit_Final.pdf.
[13] 755BMentor Engineering, Brochure: Mentor Ranger. Accessed July 5, 2014, at http://www.fieldtechnologiesonline.com/doc/mentor-ranger-0001.
[14] 756BFlorida APTS Technologies, Automatic vehicle location, 2011. Accessed May 23, 2014, at http://floridaapts.lctr.org/technology_fleet_avl.html.
[15] 757BFederal Transit Administration, Automatic vehicle location fact sheet: transit overview, 2014. Accessed June 23, 2015, at
https://www.pcb.its.dot.gov/factsheets/avl/avl_overview.aspx#page=tech.
78
[16] 758BUnited States Department of Transportation, undated, Transit management
systems, Accessed May 27, 2014, at http://ntl.bts.gov/lib/jpodocs/repts_te/14073_files/sec_2_3.htm.
[17] 759BFederal Transit Administration, Automatic vehicle location/human service transit," December 2007. Accessed September 26, 2014, at
http://www.pcb.its.dot.gov/factsheets/avl/avlHum.pdf. [18] 760BD. J. Parker, TranSystems Corporation, TCRP Synthesis 73: AVL systems for bus
transit: update, Transit Cooperative Research Program, Transportation Research Board, Washington DC, 2008. Accessed July 14, 2014, at
http://www.tcrponline.org/PDFDocuments/tsyn73.pdf.
[19] 761BD. Roos, How Interactive Voice Response (IVR) Works. Accessed September 11, 2014 at http://electronics.howstuffworks.com/interactive-voice-response5.htm.
[20] 762BRodell Notbohm, How transit video surveillance systems play an important role in security and efficiency, 2013. Accessed June 2, 2014, at
763Bhttp://security-today.com/articles/2013/04/01/how-transit-video-surveillance-systems-play-an-important-role-in-security-and-efficiency.aspS.
[21] 764B"Auditors recommend video surveillance for Milwaukee paratransit," Metro Magazine, January 3, 2014. Accessed June 2, 2014, at http://www.metro-
magazine.com/news/story/2014/01/auditors-recommend-video-surveillance-for-
milwaukee-paratransit.aspS. [22] 765BS. Schultze, "Some Milwaukee County riders reported timeliness problems,"
Milwakee.Wisconsin Journal Sentinel, January 2014. Accessed June 2, 2014, at http://www.jsonline.com/news/milwaukee/paratransit-riders-like-service-survey-
finds-but-video-cameras-urged-b99171277z1-238390011.html. [23] 766BDriveCam by Lytx, Case Study - Easton Coach Company, 2013. Accessed June
30, 2014, at http://www.lytx.com/uploads/Easton-Case-Study_0513_0038_2.pdf.
[24] 767BParatransit Inc., Customer Service.Online source. Accessed June 18, 2014, at
http://www.paratransit.org/php/customer_service.php. [25] 768BIntelligent Transportation Systems Joint Program Office, U.S.DOT, Benefits
Database. Implementation of paratransit software with Automatic Vehicle Location/Mobile Data Terminal (AVT/MDT) technologies leads to increase in trip
productivity; reduction in administrative staff; and greater overall confidence in the transportation system. March 2003. St. Johns County, Florida. Accessed
October 2, 2015 at http://www.itsbenefits.its.dot.gov/its/benecost.nsf/SummID/B2010-
00637?OpenDocument&Query=Home
[26] 769BR. G. Mathias, TCRP Synthesis 60: Practices in no-show and late cancellation policies for ADA paratransit, Transit Cooperative Research Program,
Transportation Research Board, Washington DC, 2005. Accessed July 11, 2014, at http://onlinepubs.trb.org/onlinepubs/tcrp/tcrp_syn_60.pdf.
[27] 770BADEPT for PACE. July 2013. Accessed July 14, 2014, at http://www.stratagen.com/assets/adeptforpace.pdf.
[28] 771B2014 Annual Performance Report of the Florida Commission for the Transportation Disadvantaged. Florida Commission for the Transportation
Disadvantaged. Accessed October 2, 2015, at
http://www.dot.state.fl.us/ctd/docs/AORAPRDocs/Final2014AOR.pdf.
79
Appendix A – Survey Instrument 885(The survey questions below were formatted from the online version to fit this document.)
216B1. Please provide us with agency information:
217BYour Agency _______________________________________________________________________
218BAgency Address ____________________________________________________________________
219BCity/Town _________________________________________________________________________
220BZIP/Postal Code ____________________________________________________________________
221B2. Which type of paratransit vehicles do you currently use?
(Please check all that apply)
222BNumber
of units
0BSedans 1BMini Vans 2BLightduty small bus, cutaways, and modified van (length: 16 to 28 ft.; seats: 10
to 22)
3BMediumduty and purpose built bus (length: 30 ft.; seats: 22 to 30) 4BHeavy-duty small bus (length: 30 ft.; seats: 26 to 35) 5BHeavy-duty large bus (length: 35 to 48 ft. and 60 ft.; seats: 27 to 40)
_______
_______
_______
_______
_______
_______
6BOther (please specify) _________________________________________________________
223B3. Which methods can customers use to reserve a trip? (Please check all that apply)
7BTelephone
8BEmail 9BWebsite 10BText 11BSmart Phone Application
12BMail 13BOther (please specify) ________________________________________________________
224B4. Which type of paratransit services does your agency provide? (Please select all that apply).
14BTransportation Disadvantaged 15BAmerican with Disabilities Act (ADA) complementary paratransit 16BMedicaid Non-Emergency Transportation
17BAgency for Persons with Disabilities 18BArea Agency on Aging 19BOther (please specify) ________________________________________________________
225B5. Which of the following technologies does your agency currently use on its system? (Please check all
that apply)
20BGlobal Positioning System (GPS) 21BAutomatic Vehicle Location (AVL)
22BMobile Data Computer (MDC) or Mobile Data Terminal (MDT) 23BReservation, Scheduling, and Dispatching Software 24BAdvanced Telephone System (automated service, call forwarding, voicemail, call hold)
25BAdvanced Telephone System including Interactive Voice Response (IVR) 26BVehicle Security Cameras (internal or external) 27BOther (please specify) ________________________________________________________
226B6. Does your agency use Mobile Data Computers (MDC) or Mobile Data Terminals (MDT)?
28BYes 29BNo
227B7. Which company manufactured your MDC or MDT? _______________________________________
228B8. When was your MDC or MDT system installed? _________________________________________
80
229B9. Which of the following did your MDC or MDT system (package) include?
30BHardware 31BSoftware 32BInstallation
33BTraining 34BTechnical Support
35BWarranty 36BOther (please specify) ________________________________________________________
230B10. How many years does your warranty last? ___________________________________________
231B11. How many fleet vehicles are the MDC or MDT systems installed on? _______________________
232B12. What was the total cost of your MDC or MDT systems to your agency? (Total costs includes all
hardware, software, installation, training, technical support, and warranty for all vehicles) ________
233B13. When was your MDC or MDT system’s software last updated? ____________________________
234B14. When was your MDC or MDT system’s hardware last updated? ___________________________
235B15. How did the use of MDC or MDT impact the reduction of “no shows”?
37BUnknown 38BNo impact
39BModerate impact 40BSignificant impact
236BPlease tell us why you selected this response ____________________________________________
237B16. How did the use of MDC or MDT impact driver performance?
41BUnknown 42BNo impact 43BModerate impact
44BSignificant impact
238BPlease tell us why you selected this response ___________________________________________
239B17. How did the use of MDC or MDT impact your system's ontime performance?
45BUnknown 46BNo impact
47BModerate impact 48BSignificant impact
240BPlease tell us why you selected this response ____________________________________________
241B18. Does your agency use Global Positioning System (GPS) technology?
49BYes 50BNo
242B19. Did any of your vehicles come equipped with GPS? If yes, how many? ______________________
243B20. If GPS units were added to your fleet vehicles, which company manufactured your GPS? _______
244B21. How many vehicles in your fleet are equipped with a GPS? _______________________________
245B22. Which of the following did your GPS (package) include?
51BHardware
52BSoftware 53BInstallation 54BTraining
55BTechnical Support 56BWarranty 57BOther (please specify) ________________________________________________________
246B23. How many years does your warranty last? ___________________________________________
247B24. What was the total cost of your GPS system on all vehicles? (Total costs includes all hardware, software, installation, training, technical support, and warranty) ______________________________
248B25. When was your GPS system installed? _______________________________________________
81
249B26. When was your GPS system’s hardware last updated? ___________________________________
250B27. When was your GPS system’s software last updated? ___________________________________
251B28. How did the use of GPS impact your system's ontime performance?
58BUnknown 59BNo impact
60BModerate impact 61BSignificant impact
252BPlease tell us why you selected this response ____________________________________________
253B29. How did the use of this technology impact your system’s productivity (passengers per revenue
hour)?
62BUnknown
63BNo impact 64BModerate impact 65BSignificant impact
254BPlease tell us why you selected this response ____________________________________________
255B30. How did the use of GPS impact your agency's customer satisfaction?
66BUnknown 67BNo impact 68BModerate impact
69BSignificant impact
256BPlease tell us why you selected this response ____________________________________________
257B31. How did the use of GPS impact the reduction of “no shows”?
70BUnknown
71BNo impact 72BModerate impact 73BSignificant impact
258BPlease tell us why you selected this response ____________________________________________
259B32. How did the use of GPS impact driver performance?
74BUnknown 75BNo impact 76BModerate impact
77BSignificant impact
260BPlease tell us why you selected this response ____________________________________________
261B33. Does your agency use Automated Vehicle Location (AVL)?
78BYes 79BNo
262B34. Which company manufactured your AVL system? ______________________________________
263B35. Is AVL installed on all your fleet vehicles?
80BYes 81BNo
264BHow many vehicles in your fleet do not have AVL? ________________________________________
265B36. Which of the following did your AVL system (package) include?
82BHardware 83BSoftware 84BInstallation
85BTraining 86BTechnical Support 87BWarranty
88BOther (please specify) _________________________________________________________
266B37. How many years does your warranty last? ____________________________________________
82
267B38. What was the total cost of your AVL system on all vehicles? (Total costs includes all hardware, software, installation, training, technical support, and warranty) ______________________________
268B39. When was your AVL system installed? ________________________________________________
269B40. When was your AVL system’s hardware last updated? ___________________________________
270B41. When was your AVL system’s software last updated? ____________________________________
271B42. How did the use of AVL impact your system's ontime performance?
89BUnknown 90BNo impact 91BModerate impact
92BSignificant impact
272BPlease tell us why you selected this response _____________________________________________
273B43. How did the use of AVL impact your system’s productivity (passengers per revenue hour)?
93BUnknown
94BNo impact 95BModerate impact 96BSignificant impact
274BPlease tell us why you selected this response _____________________________________________
275B44. How did the use of AVL impact your agency's customer satisfaction?
97BUnknown 98BNo impact 99BModerate impact
100BSignificant impact
276BPlease tell us why you selected this response _____________________________________________
277B45. How did the use of AVL impact driver performance?
101BUnknown 102BNo impact
103BModerate impact
104BSignificant impact
278BPlease tell us why you selected this response _____________________________________________
279B46. How did the use of AVL impact the reduction of “no shows”?
105BUnknown 106BNo impact 107BModerate impact
108BSignificant impact
280BPlease tell us why you selected this response _____________________________________________
281B47. Does your agency use reservation, scheduling, and dispatching software?
109BYes 110BNo
282B48. Which company manufactured your reservation, scheduling, and dispatching software system?
_______________________________________________________________________________
283B49. Your reservation, scheduling, and dispatching software system (package) included which of the
following:
111BHardware 112BSoftware 113BInstallation 114BTraining
115BTechnical Support 116BWarranty 117BOther (please specify) _________________________________________________________
284B50. How many years does your warranty last? ____________________________________________
83
285B51. What was the total cost of your reservation, scheduling, and dispatching software system? (Total
costs includes all hardware, software, installation, training, technical support, and warranty) ________
286B52. When was your reservation, scheduling, and dispatching software system installed? ___________
287B53. When was your reservation, scheduling, and dispatching software system last updated? ________
288B54. How did the use of the reservation, scheduling, and dispatching software system impact your
system's ontime performance?
118BUnknown 119BNo impact
120BModerate impact 121BSignificant impact
289BPlease tell us why you selected this response _____________________________________________
290B55. How did the use of reservation, scheduling, and dispatching software system impact driver performance?
122BUnknown 123BNo impact 124BModerate impact
125BSignificant impact
291BPlease tell us why you selected this response _____________________________________________
292B56. How did the use of reservation, scheduling, and dispatching software system impact your agency's
labor costs?
126BUnknown 127BNo impact 128BModerate impact
129BSignificant impact
293BPlease tell us why you selected this response _____________________________________________
294B57. How did the use of reservation, scheduling, and dispatching software system impact customer
satisfaction?
130BUnknown
131BNo impact 132BModerate impact 133BSignificant impact
295BPlease tell us why you selected this response _____________________________________________
296B58. How did the use of the reservation, scheduling, and dispatching software system impact your
system's ontime performance?
134BUnknown 135BNo impact
136BModerate impact 137BSignificant impact
886BPlease tell us why you selected this response _____________________________________
297B59. How did the use of reservation, scheduling, and dispatching software system impact the reduction
of “no-shows”?
138BUnknown 139BNo impact 140BModerate impact 141BSignificant impact
298BPlease tell us why you selected this response _____________________________________________
299B60. Does your agency use advanced telephone system with automated service, call forwarding,
voicemail, and call hold?
142BYes
143BNo
300B61. Which company manufactured your advanced telephone system with automated service, call
forwarding, voicemail, and call hold? _________________________________________________
84
301B62. The purchase of your advanced telephone system with automated service, call forwarding, voicemail, and call hold included which of the following:
144BHardware 145BSoftware
146BInstallation 147BTraining
148BTechnical Support 149BWarranty
150BOther (please specify) _________________________________________________________
302B63. How many years does your warranty last?
303B64. What was the total cost of your advanced telephone system with automated service, call
forwarding, voicemail, and call hold? (Total costs includes all hardware, software, installation, training, technical support, and warranty) ________________________________________________
304B65. When was your advanced telephone system with automated service, call forwarding, voicemail,
and call hold installed? _______________________________________________________________
305B66. When was your advanced telephone system with automated service, call forwarding, voicemail,
and call hold last updated? ____________________________________________________________
306B67. How did the use of this technology impact your agency's productivity?
151BUnknown
152BNo impact 153BModerate impact 154BSignificant impact
307BPlease tell us why you selected this response _____________________________________________
308B68. How did the use of this technology impact the reduction of “no shows”?
155BUnknown 156BNo impact 157BModerate impact
158BSignificant impact
309BPlease tell us why you selected this response _____________________________________________
310B69. How did the use of this technology impact your agency's customer satisfaction?
159BHardware
160BSoftware 161BInstallation 162BTraining
163BTechnical Support 164BWarranty 165BOther (please specify) _________________________________________________________
311B70. Does your agency use advanced telephone system including Interactive Voice Response (IVR)?
166BYes 167BNo
312B71. Which company manufactured your advanced telephone system including IVR)? ______________
313B72. The purchase of your advanced telephone system including IVR included which of the following:
168BHardware 169BSoftware 170BInstallation 171BTraining
172BTechnical Support 173BWarranty 174BOther (please specify) _________________________________________________________
314B73. How many years does your warranty last? ____________________________________________
315B74. What was the total cost of your advanced telephone system including IVR? (Total costs includes all
hardware, software, installation, training, technical support, and warranty) _____________________
85
316B75. When was your advanced telephone system including IVR installed? ________________________
317B76. When was your advanced telephone system including IVR last updated? _____________________
318B77. How did the use of this technology impact driver performance?
175BUnknown 176BNo impact
177BModerate impact 178BSignificant impact
319BPlease tell us why you selected this response _____________________________________________
320B78. How did the use of this technology impact customer satisfaction?
179BUnknown 180BNo impact
181BModerate impact 182BSignificant impact
321BPlease tell us why you selected this response _____________________________________________
322B79. How did the use of this technology impact your system's on-time performance?
183BUnknown
184BNo impact 185BModerate impact 186BSignificant impact
323BPlease tell us why you selected this response _____________________________________________
324B80. How did the use of this technology impact your system’s productivity?
187BUnknown 188BNo impact
189BModerate impact 190BSignificant impact
325BPlease tell us why you selected this response _____________________________________________
326B81. How did the use of this technology impact the reduction of “no shows”?
191BUnknown
192BNo impact 193BModerate impact 194BSignificant impact
327BPlease tell us why you selected this response _____________________________________________
328B82. Does your agency use vehicle security cameras (internal and external)?
195BYes 196BNo
329B83. Which company manufactured your vehicle security camera system? _______________________
330B84. How many years does your warranty last? ____________________________________________
331B85. The purchase of your vehicle security cameras system included which of the following:
197BHardware 198BSoftware 199BInstallation
200BTraining 201BTechnical Support 202BWarranty
203BOther (please specify) _________________________________________________________
332B86. How many years does your warranty last? ____________________________________________
333B87. What was the total cost of your vehicle security camera system? (Total costs includes all hardware,
software, installation, training, technical support, and warranty) ______________________________
334B88. How many paratransit vehicles were vehicle security cameras installed on? __________________
335B89. When were your vehicle security cameras installed? _____________________________________
86
336B90. When was the hardware for your vehicle security camera system last updated? _______________
337B91. When was the software for your vehicle security camera system last updated? ________________
338B92. How did the use of this technology impact your system’s productivity or performance?
204BUnknown 205BNo impact
206BModerate impact 207BSignificant impact
339BPlease tell us why you selected this response _____________________________________________
340B93. How did the use of vehicle security cameras impact customer satisfaction?
208BUnknown 209BNo impact
210BModerate impact 211BSignificant impact
341BPlease tell us why you selected this response _____________________________________________
342B94. How did the use of this technology impact driver performance?
212BUnknown
213BNo impact 214BModerate impact 215BSignificant impact
343BPlease tell us why you selected this response _____________________________________________
344B95. Please provide us with your contact information:
345BYour name ________________________________________________________________________
346BYour title __________________________________________________________________________
347BEmail ____________________________________________________________________________
348BPhone Number _____________________________________________________________________